Embed Size (px)
Citation preview
1
Centre County GovernmentDepartment of Transportation
David Lomison, Director of Transportation
2
Centre County Transportation The Centre County Office of Transportation services all of the Centre County. Based in Milesburg, PA, the Transportation staff consists of 23 Vehicle Operators and 5 Office support staff.
Our most recognized program that Transportation offers is The Shared Ride Transportation service, most often we are referred to as “The Van Service”. This service is provided to all Centre County residents. With the van service there are several different types of services offered:
Senior Citizens 60 – 64 this program is funded entirely by The Office of Aging. Senior Citizen 65+ this program is primarily funded by PA Lottery Transportation
Division and The Office of Aging.
Trips can consist of Medical Appointments, Shopping of any type and any place the client may desire to go in Centre County. There is no cost to the client.
Meals On Wheels - Our service also delivers Home Delivered Meals to residents outside the Centre Region to all areas of the County. Our annual delivery of meals is currently 45,000 – 50,000 each year. This is a great benefit to those individuals who are not able to prepare their own food. This program is funded by The Office of Aging.
3
Centre County Transportation MATP – Medical Assistance Transportation Program –
We are the Medical Assistance Transportation Program provider for Centre County, this service is funded by MATP and the Department of Welfare. This service is specific to medical needs and can only be used for such trips; these individuals must meet the qualifications set forth by MATP and the Department of Welfare. Our office also administers a Mileage Reimbursement program funded by the Department of Welfare, if the individual qualifies, under the agreement we also arrange trips for qualified individuals to destinations outside of Centre County as requested for medical necessities with the proper 4 business days advance notice.
MHMR Department and Skills – funded thru this program, we provide transportation to several workshops within the county that allows many people the opportunity to participate in such places that may not without our service, Skills of Central Pennsylvania would be the most recognized user of our service.
PwD – Persons with Disabilities – funded by PaDot, this service is for disable clients who have no other sources of funding for their transportation needs, there is a fee that the clients must pay towards the trips ranging from $3.00 to $5.50 each way depending upon the destination.
4
Centre County Transportation Cash Clients/Non-Funded - We also offer rides to individuals
without any funding sources as needed, clients would need to call our office for rates on such trips.
Clients who participate in the above programs are required to schedule at least 3 to 4 days in advance if possible. Same day service is not available.
The staff of Centre County Transportation is proud to provide door to door service to the residents of Centre County, with our annual trips in excess of 130,000 each year.
5
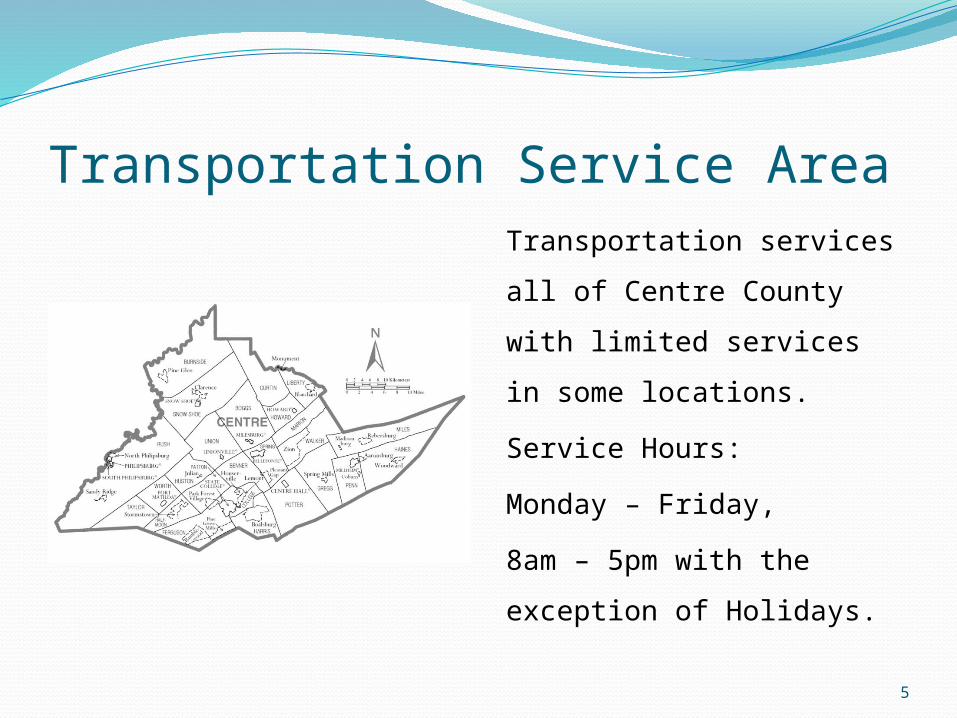
Transportation Service AreaTransportation services
all of Centre County with
limited services in some
locations.
Service Hours:
Monday – Friday,
8am – 5pm with the
exception of Holidays.
6
Transit Agency StatusFY 2011-12
Current Financial Position
Current Operations
Service Statistics/Trends
Funding Statistics/Trends
Other Information/Assumptions
Capital Status Review
7
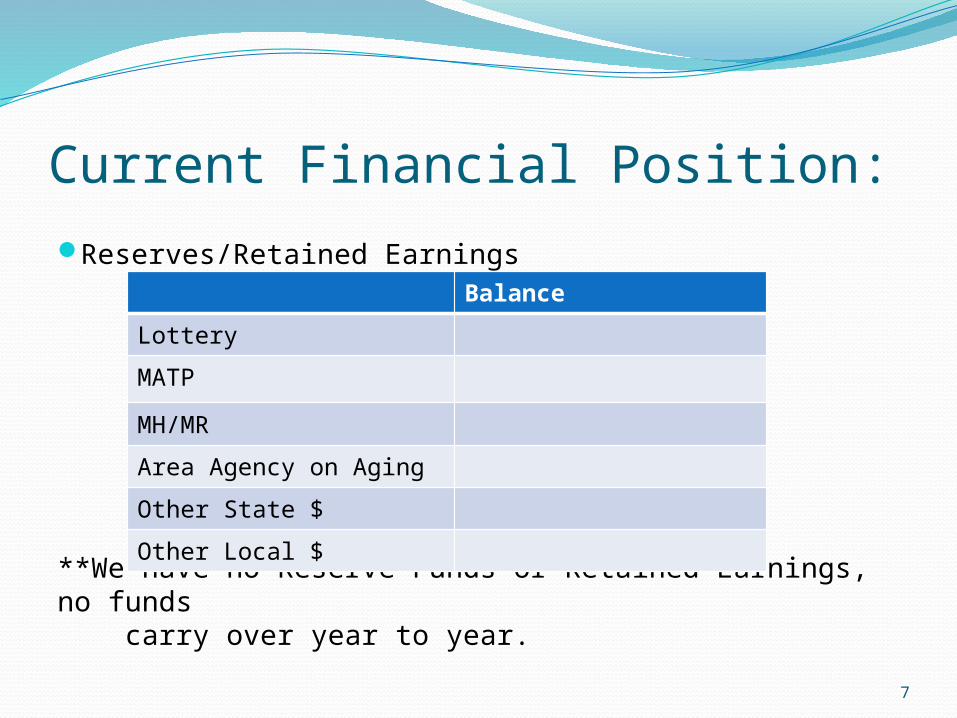
Current Financial Position:Reserves/Retained Earnings
**We have no Reserve Funds or Retained Earnings, no funds carry over year to year.
Balance
Lottery
MATP
MH/MR
Area Agency on Aging
Other State $
Other Local $
8
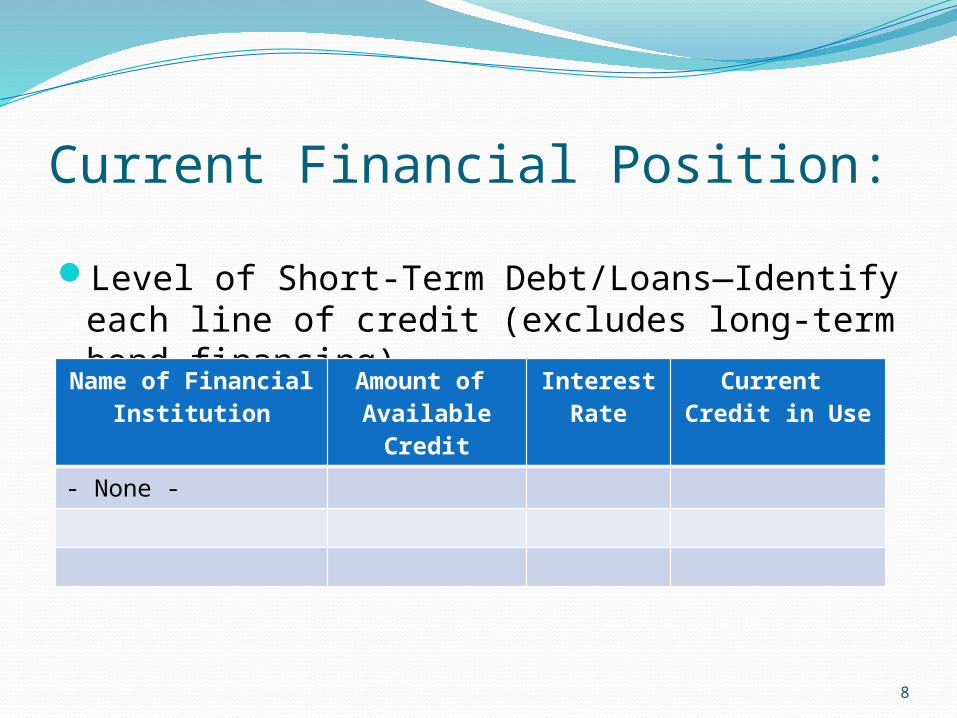
Current Financial Position:
Level of Short-Term Debt/Loans—Identify each line of credit (excludes long-term bond financing)Name of Financial
InstitutionAmount of Available
Credit
Interest Rate
Current Credit in Use
- None -
9
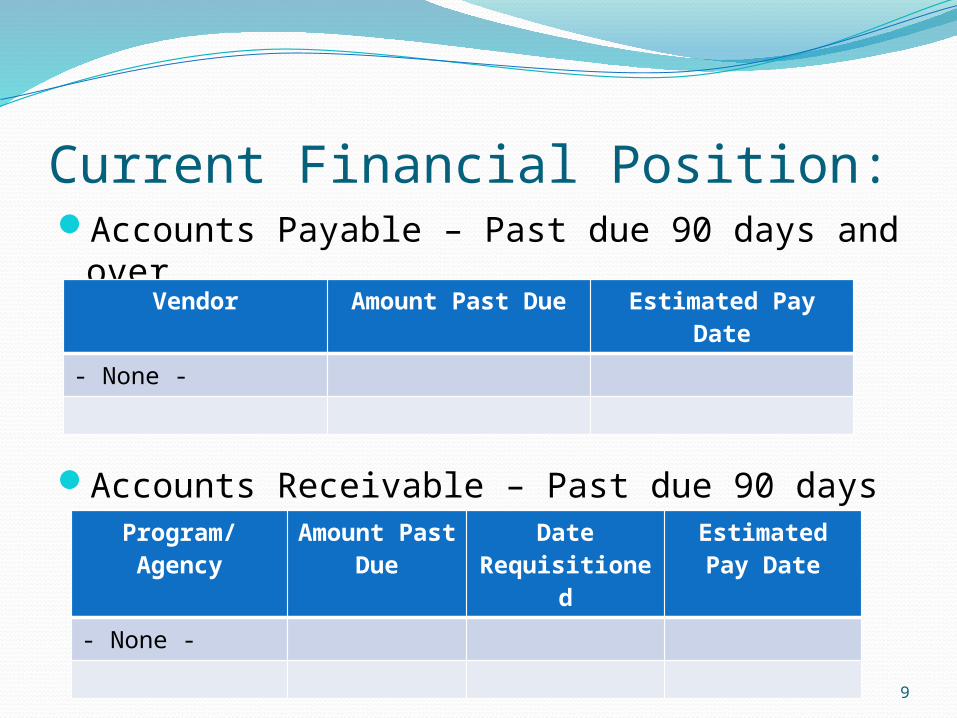
Current Financial Position:Accounts Payable – Past due 90 days and over
Accounts Receivable – Past due 90 days and over
Vendor Amount Past Due Estimated Pay Date
- None -
Program/Agency
Amount Past Due
Date Requisitione
d
Estimated Pay Date
- None -
10
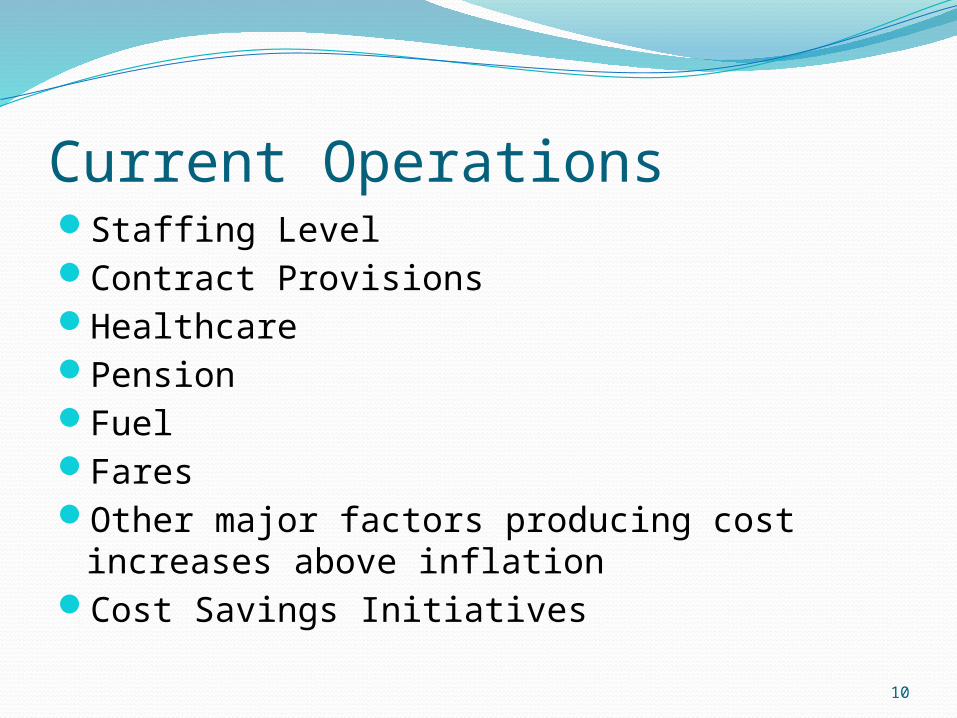
Current OperationsStaffing LevelContract ProvisionsHealthcarePensionFuelFaresOther major factors producing cost increases
above inflationCost Savings Initiatives
11
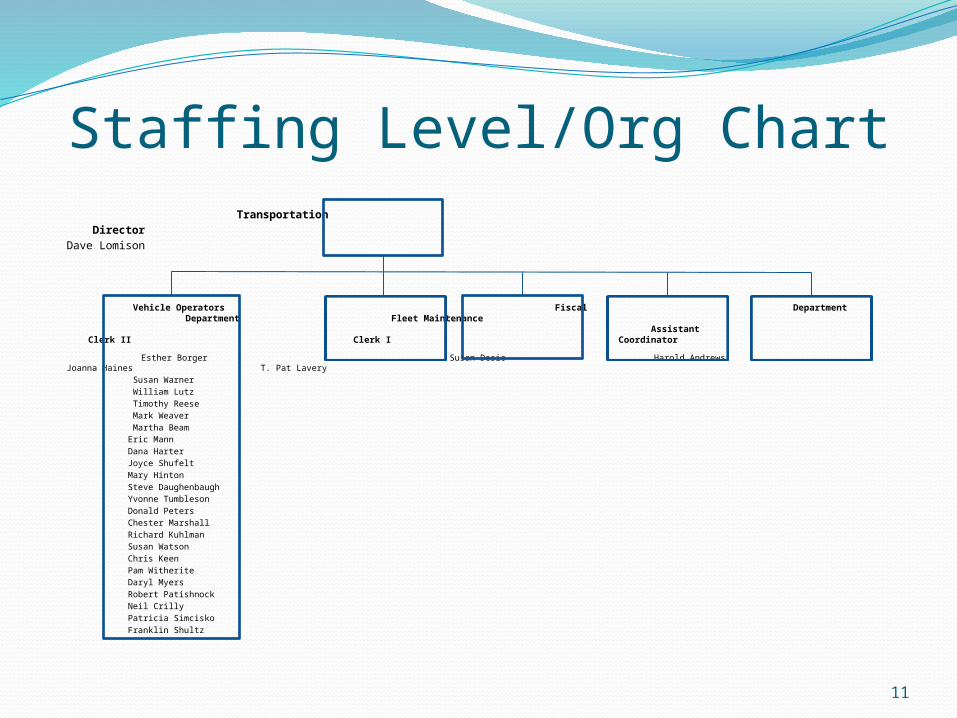
Staffing Level/Org Chart Transportation
DirectorDave Lomison
Vehicle Operators Fiscal Department Department Fleet Maintenance Assistant Clerk II Clerk I Coordinator
Esther Borger Susan Desio Harold Andrews Joanna Haines T. Pat Lavery Susan Warner William Lutz Timothy Reese Mark Weaver Martha Beam Eric Mann Dana Harter Joyce Shufelt Mary Hinton Steve Daughenbaugh Yvonne Tumbleson Donald Peters Chester Marshall Richard Kuhlman Susan Watson Chris Keen Pam Witherite Daryl Myers Robert Patishnock Neil Crilly Patricia Simcisko Franklin Shultz
12
Labor Provisions
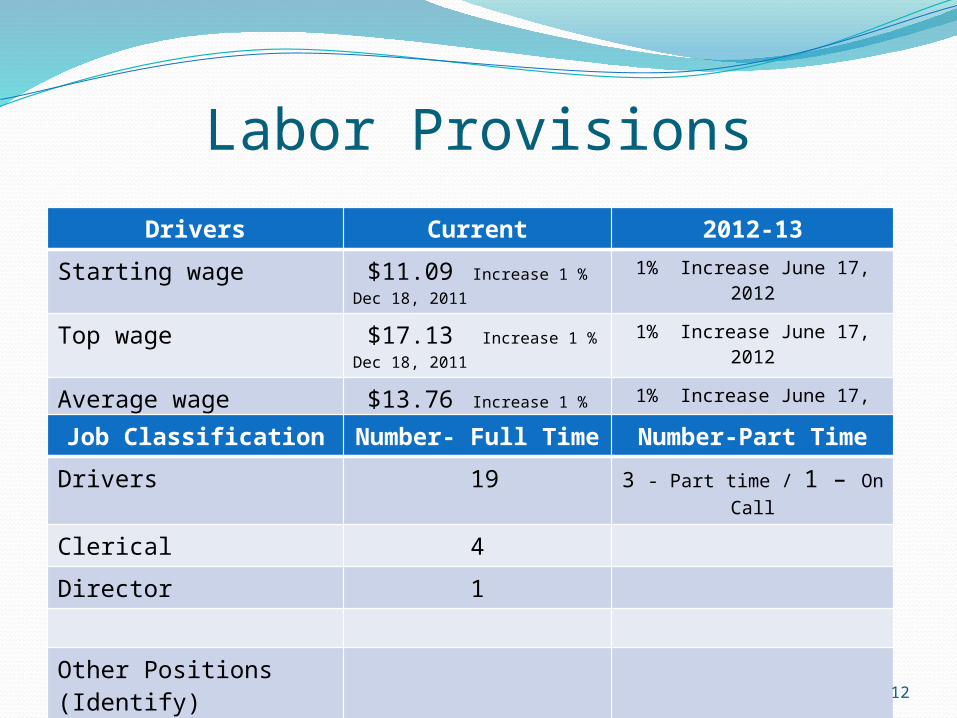
Drivers Current 2012-13
Starting wage $11.09 Increase 1 % Dec 18, 2011
1% Increase June 17, 2012
Top wage $17.13 Increase 1 % Dec 18, 2011
1% Increase June 17, 2012
Average wage $13.76 Increase 1 % Dec 18, 2011
1% Increase June 17, 2012
2013 - UnknownJob Classification Number- Full Time
Number-Part Time
Drivers 19 3 - Part time / 1 – On Call
Clerical 4
Director 1
Other Positions (Identify)
13
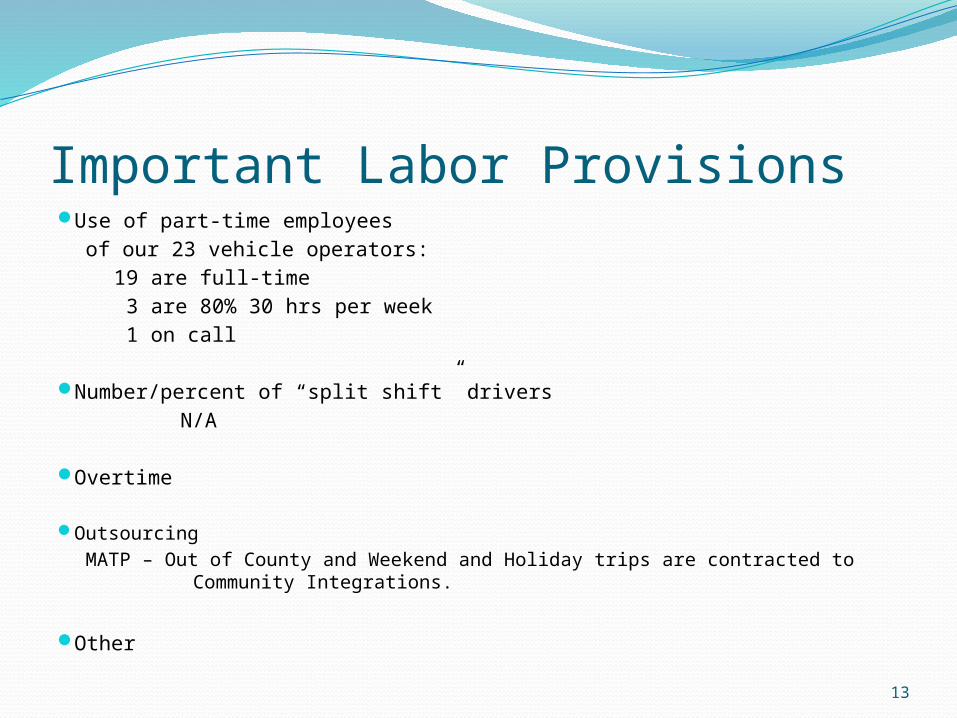
Important Labor Provisions Use of part-time employees
of our 23 vehicle operators: 19 are full-time 3 are 80% 30 hrs per week 1 on call
Number/percent of “split shift” drivers N/A
Overtime
Outsourcing MATP – Out of County and Weekend and Holiday trips are contracted to
Community Integrations.
Other
14
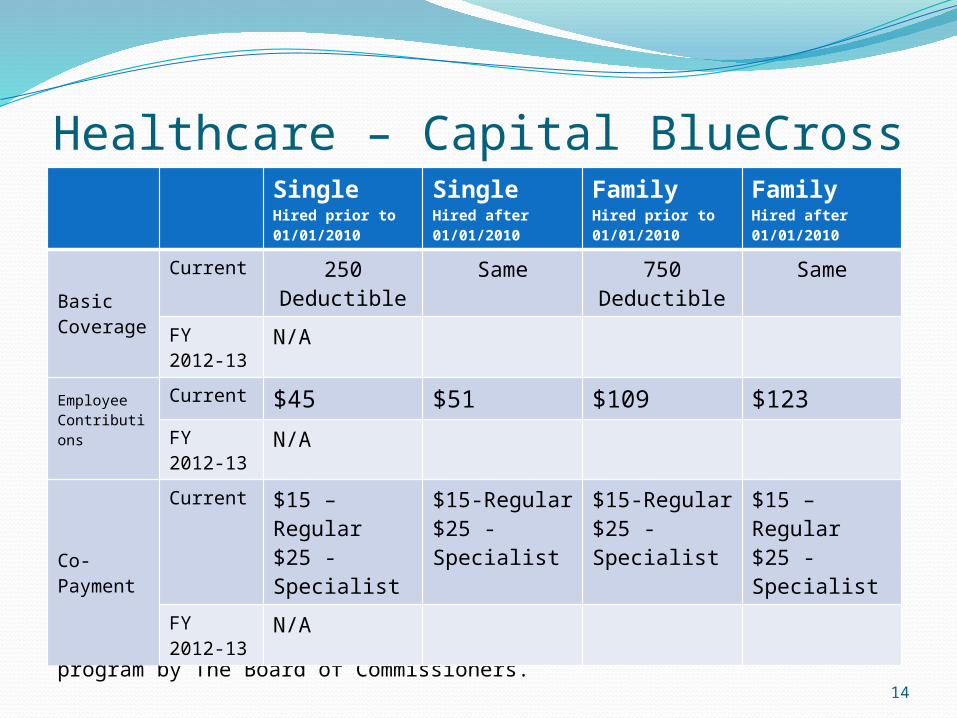
Healthcare – Capital BlueCross
Describe any proposed changes and the estimated financial impacts.
Our health care providers are negotiated each year for all Centre County Government Employees with final approval of the accepted program by The Board of Commissioners.
Single Hired prior to 01/01/2010
SingleHired after 01/01/2010
FamilyHired prior to 01/01/2010
FamilyHired after 01/01/2010
Basic Coverage
Current 250 Deductible
Same 750 Deductible
Same
FY 2012-13
N/A
Employee Contributions
Current $45 $51 $109 $123FY 2012-13
N/A
Co-Payment
Current $15 – Regular$25 - Specialist
$15-Regular$25 - Specialist
$15-Regular$25 - Specialist
$15 – Regular$25 - Specialist
FY 2012-13
N/A
15
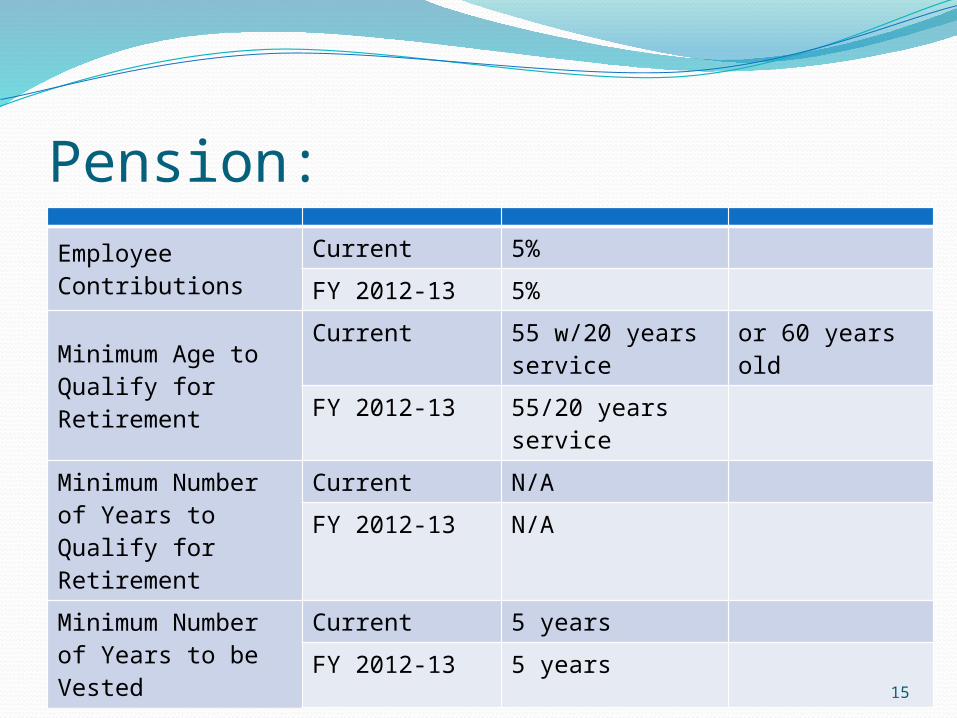
Pension:
Employee Contributions
Current 5%
FY 2012-13 5%
Minimum Age to Qualify for Retirement
Current 55 w/20 years service
or 60 years old
FY 2012-13 55/20 years service
Minimum Number of Years to Qualify for Retirement
Current N/A
FY 2012-13 N/A
Minimum Number of Years to be Vested
Current 5 years
FY 2012-13 5 years
16
Pension:Describe any proposed changes and the
estimated financial impacts.None that we are aware of at this time
Provide a status of the degree to which the pension funding is funded. If not fully funded please provide your strategy to fully fund pension.
Centre County policy is to fully fund the Annual Required Contribution each year
17
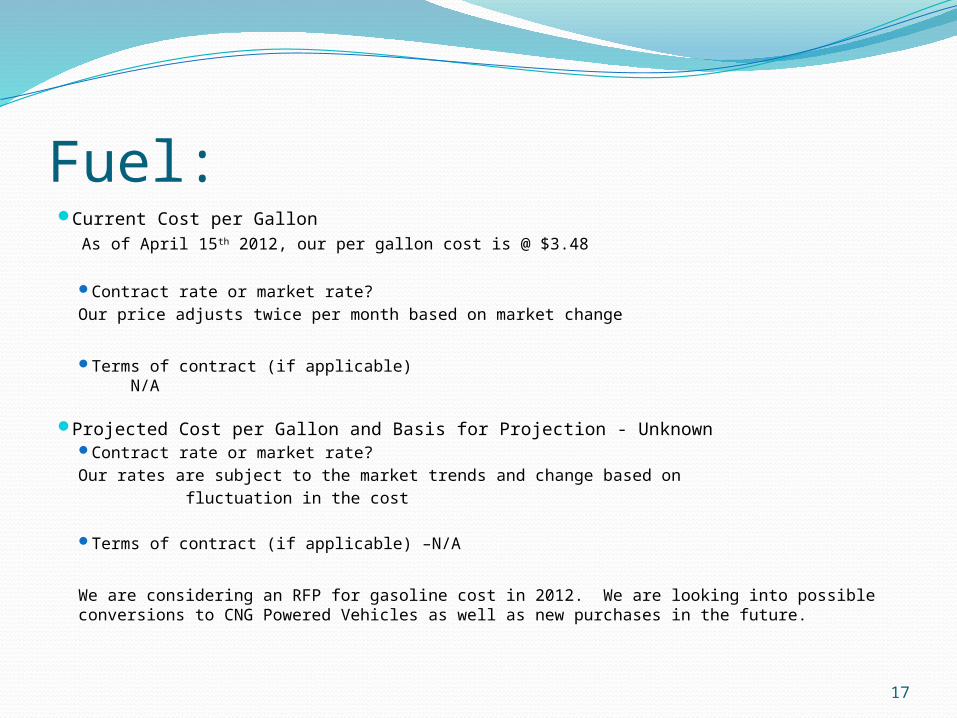
Fuel: Current Cost per Gallon As of April 15th 2012, our per gallon cost is @ $3.48
Contract rate or market rate?Our price adjusts twice per month based on market change
Terms of contract (if applicable) N/A
Projected Cost per Gallon and Basis for Projection - Unknown Contract rate or market rate?
Our rates are subject to the market trends and change based on fluctuation in the cost
Terms of contract (if applicable) –N/A
We are considering an RFP for gasoline cost in 2012. We are looking into possible conversions to CNG Powered Vehicles as well as new purchases in the future.
18
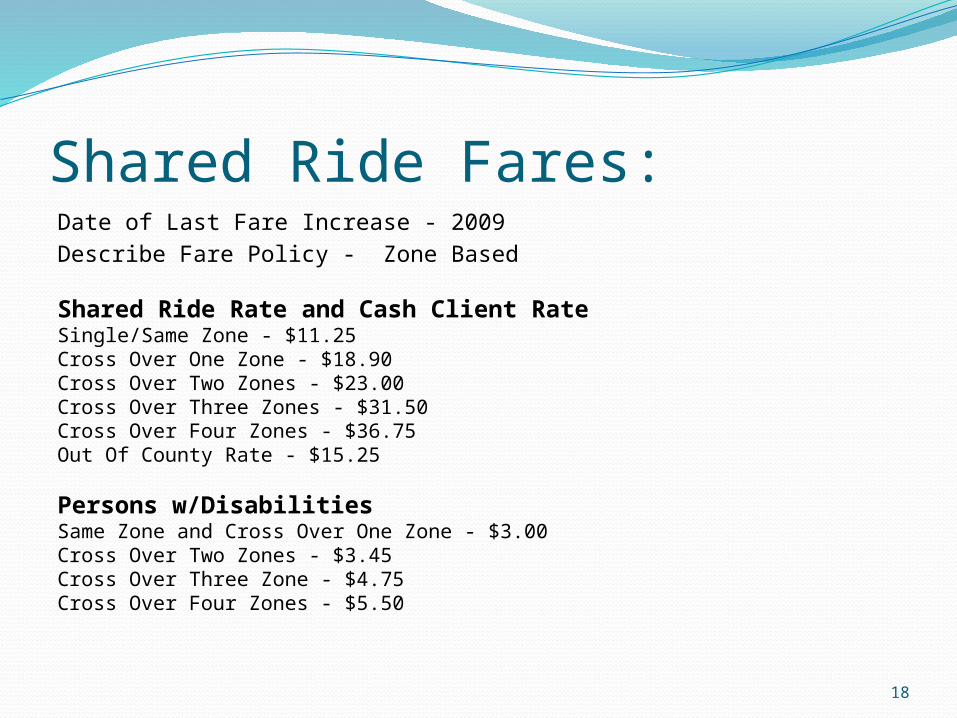
Shared Ride Fares:Date of Last Fare Increase - 2009Describe Fare Policy - Zone Based
Shared Ride Rate and Cash Client RateSingle/Same Zone - $11.25Cross Over One Zone - $18.90Cross Over Two Zones - $23.00Cross Over Three Zones - $31.50Cross Over Four Zones - $36.75Out Of County Rate - $15.25
Persons w/DisabilitiesSame Zone and Cross Over One Zone - $3.00Cross Over Two Zones - $3.45Cross Over Three Zone - $4.75Cross Over Four Zones - $5.50
19
Other Information/Assumptions:
Shared Ride Program:
We have seen a slight increase for the first 3 months of 2012 and expect the demand to increase as the year goes on, in all phases of the service we provide.Our plans include a possible software change that will allow us to work more efficiently and effectively in development of our routes.We are also very involved in the exploration of the use of Compressed Natural Gas to power our vehicles that would cut our fuel costs and provide funding to help subsidize programs that have been cut or may be cut in the future.
20
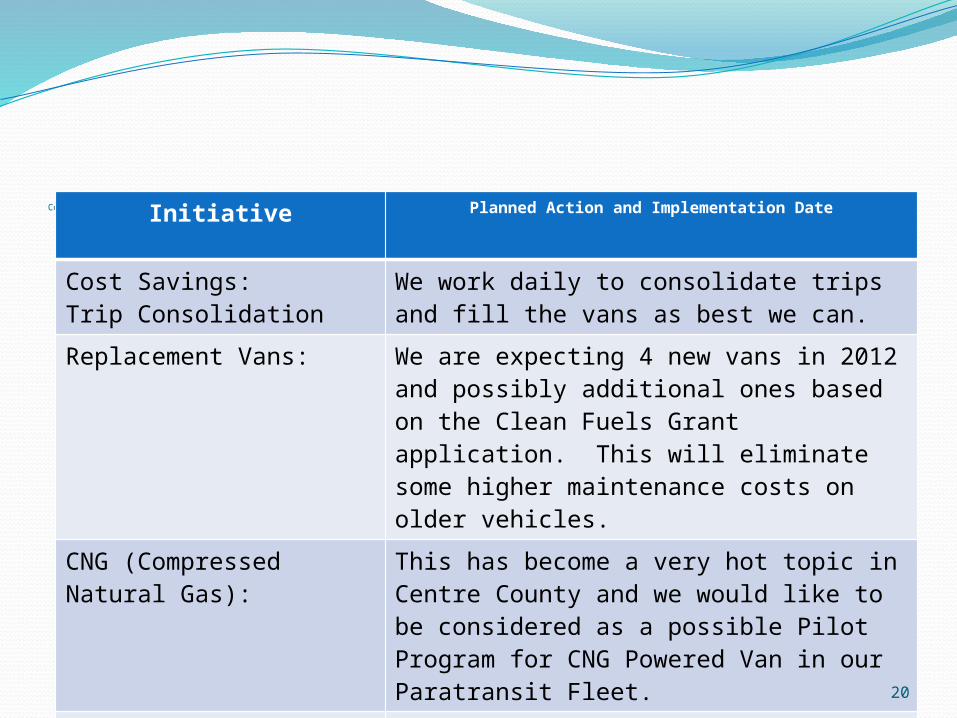
Cost Savings Initiatives: Initiative Planned Action and Implementation Date
Cost Savings: Trip Consolidation
We work daily to consolidate trips and fill the vans as best we can.
Replacement Vans: We are expecting 4 new vans in 2012 and possibly additional ones based on the Clean Fuels Grant application. This will eliminate some higher maintenance costs on older vehicles.
CNG (Compressed Natural Gas):
This has become a very hot topic in Centre County and we would like to be considered as a possible Pilot Program for CNG Powered Van in our Paratransit Fleet.
RFP for Gasoline Consideration is being given to issue an RFP for gasoline in our fleet.
21
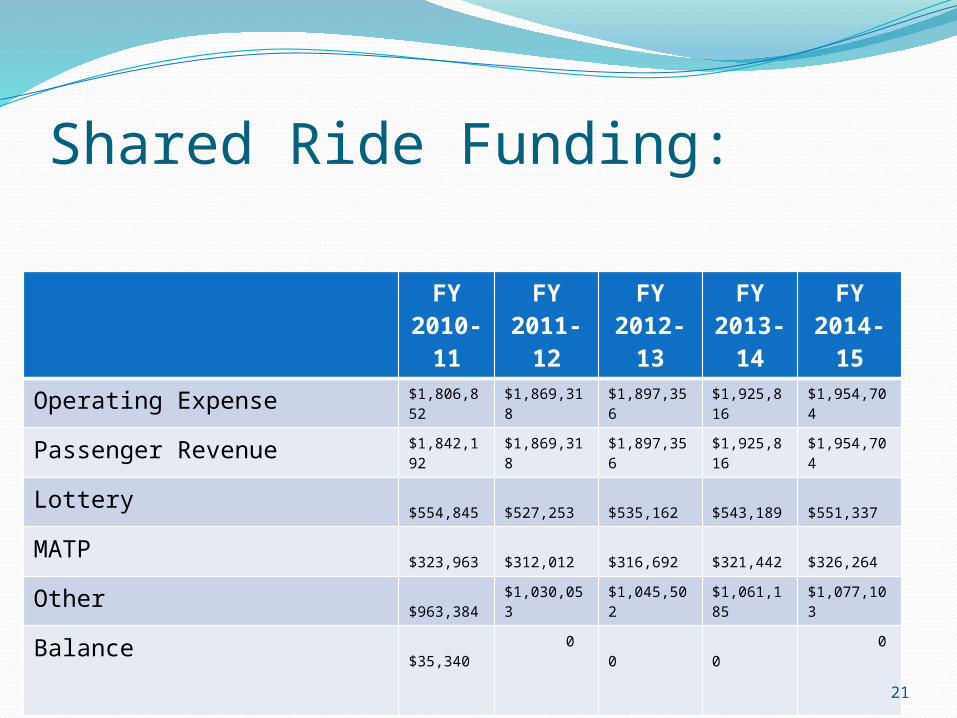
Shared Ride Funding:
FY 2010-
11
FY 2011-
12
FY 2012-
13
FY 2013-
14
FY 2014-
15
Operating Expense $1,806,852 $1,869,318 $1,897,356 $1,925,816 $1,954,704
Passenger Revenue $1,842,192 $1,869,318 $1,897,356 $1,925,816 $1,954,704
Lottery $554,845 $527,253 $535,162 $543,189 $551,337
MATP $323,963 $312,012 $316,692 $321,442 $326,264
Other $963,384 $1,030,053 $1,045,502 $1,061,185 $1,077,103
Balance $35,340 0
0 0 0
22
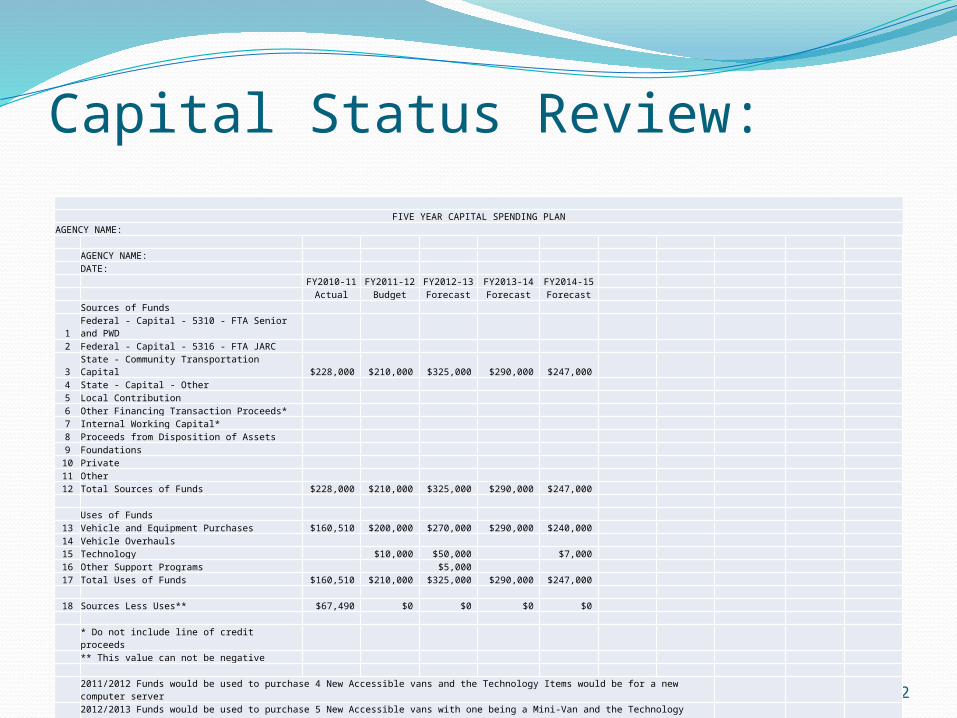
Capital Status Review:
FIVE YEAR CAPITAL SPENDING PLANAGENCY NAME:
AGENCY NAME:
DATE: FY2010-11 FY2011-12 FY2012-13 FY2013-14 FY2014-15 Actual Budget Forecast Forecast Forecast Sources of Funds 1 Federal - Capital - 5310 - FTA Senior and PWD 2 Federal - Capital - 5316 - FTA JARC 3 State - Community Transportation Capital $228,000 $210,000 $325,000 $290,000 $247,000 4 State - Capital - Other 5 Local Contribution 6 Other Financing Transaction Proceeds* 7 Internal Working Capital* 8 Proceeds from Disposition of Assets 9 Foundations 10 Private 11 Other 12 Total Sources of Funds $228,000 $210,000 $325,000 $290,000 $247,000 Uses of Funds
13 Vehicle and Equipment Purchases $160,510 $200,000 $270,000 $290,000 $240,000 14 Vehicle Overhauls 15 Technology $10,000 $50,000 $7,000 16 Other Support Programs $5,000 17 Total Uses of Funds $160,510 $210,000 $325,000 $290,000 $247,000
18 Sources Less Uses** $67,490 $0 $0 $0 $0 * Do not include line of credit proceeds ** This value can not be negative 2011/2012 Funds would be used to purchase 4 New Accessible vans and the Technology Items would be for a new computer server 2012/2013 Funds would be used to purchase 5 New Accessible vans with one being a Mini-Van and the Technology items would be used
to replace our two-way radios in our van fleet and purchase some office items. 2013/2014 Funds would be used to purchase 5 New Accessible vans with one being a Mini-Van 2014/2015 Funds would be used to purchase 4 New Accessible vans and the Technology Items would be replacement computers for the staff
23
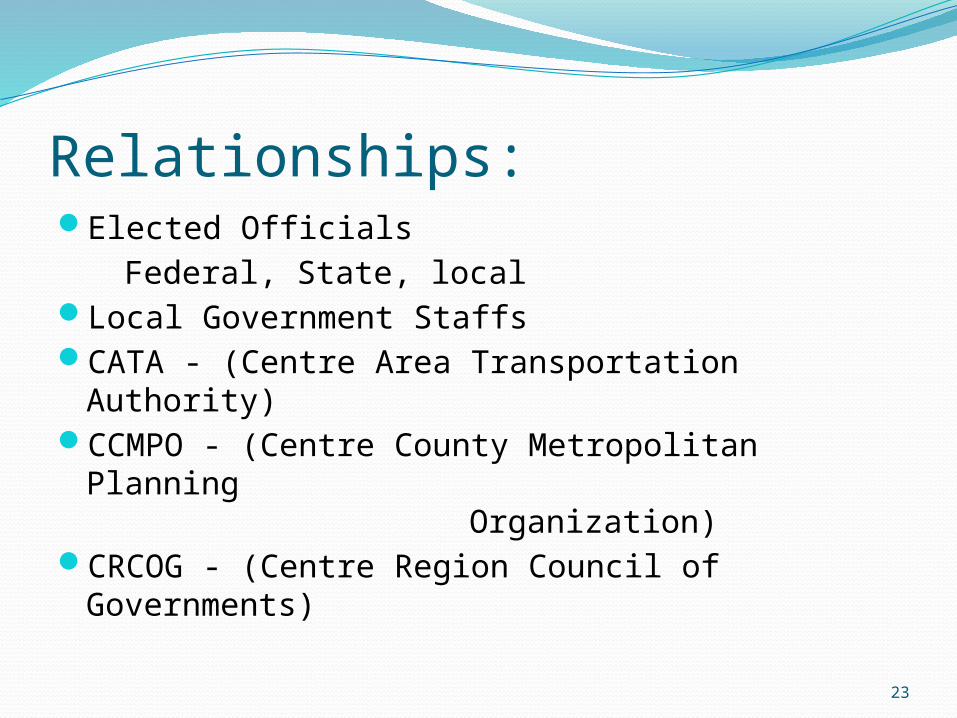
Relationships:Elected Officials Federal, State, localLocal Government StaffsCATA - (Centre Area Transportation Authority)CCMPO - (Centre County Metropolitan Planning
Organization)CRCOG - (Centre Region Council of
Governments)
24
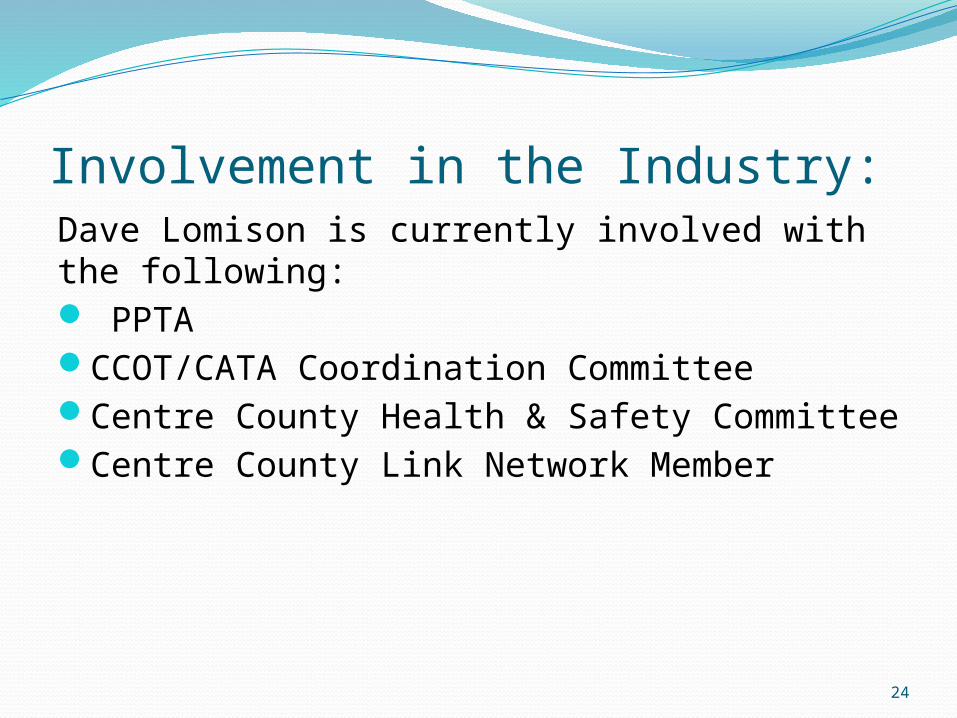
Involvement in the Industry:Dave Lomison is currently involved with the following: PPTACCOT/CATA Coordination CommitteeCentre County Health & Safety CommitteeCentre County Link Network Member
25
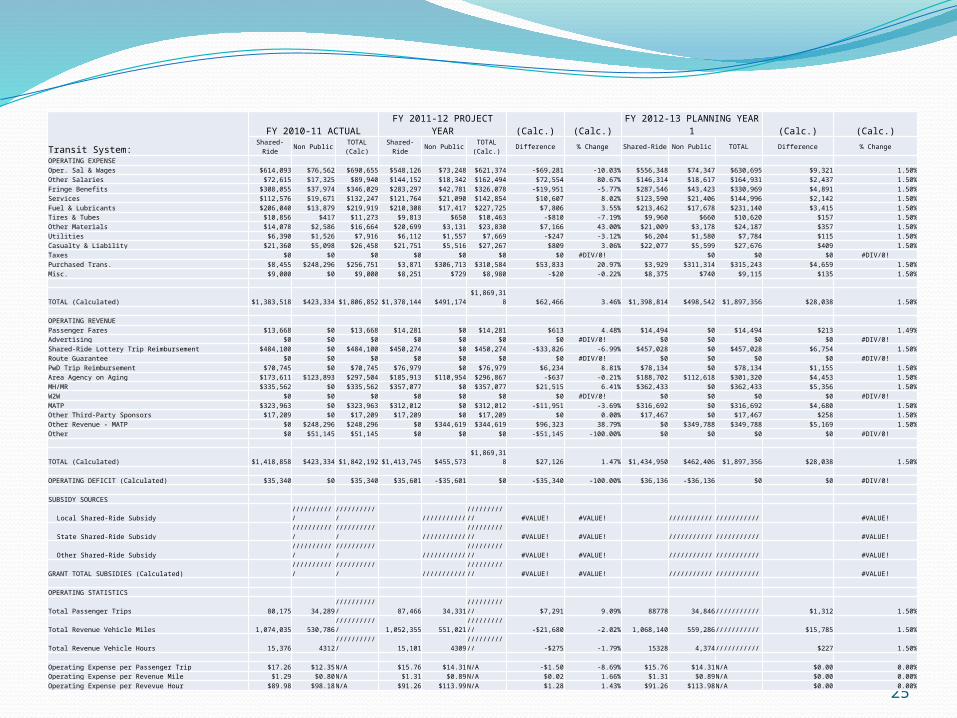
Transit System:
FY 2010-11 ACTUALFY 2011-12 PROJECT
YEAR (Calc.) (Calc.)FY 2012-13 PLANNING
YEAR 1 (Calc.) (Calc.)Shared-Ride Non Public
TOTAL (Calc)
Shared-Ride Non PublicTOTAL (Calc.)
Difference % Change Shared-Ride Non Public TOTAL Difference % Change
OPERATING EXPENSE Oper. Sal & Wages $614,093 $76,562 $690,655 $548,126 $73,248 $621,374 -$69,281 -10.03% $556,348 $74,347 $630,695 $9,321 1.50%Other Salaries $72,615 $17,325 $89,940 $144,152 $18,342 $162,494 $72,554 80.67% $146,314 $18,617 $164,931 $2,437 1.50%Fringe Benefits $308,055 $37,974 $346,029 $283,297 $42,781 $326,078 -$19,951 -5.77% $287,546 $43,423 $330,969 $4,891 1.50%Services $112,576 $19,671 $132,247 $121,764 $21,090 $142,854 $10,607 8.02% $123,590 $21,406 $144,996 $2,142 1.50%Fuel & Lubricants $206,040 $13,879 $219,919 $210,308 $17,417 $227,725 $7,806 3.55% $213,462 $17,678 $231,140 $3,415 1.50%Tires & Tubes $10,856 $417 $11,273 $9,813 $650 $10,463 -$810 -7.19% $9,960 $660 $10,620 $157 1.50%Other Materials $14,078 $2,586 $16,664 $20,699 $3,131 $23,830 $7,166 43.00% $21,009 $3,178 $24,187 $357 1.50%Utilities $6,390 $1,526 $7,916 $6,112 $1,557 $7,669 -$247 -3.12% $6,204 $1,580 $7,784 $115 1.50%Casualty & Liability $21,360 $5,098 $26,458 $21,751 $5,516 $27,267 $809 3.06% $22,077 $5,599 $27,676 $409 1.50%Taxes $0 $0 $0 $0 $0 $0 $0 #DIV/0! $0 $0 $0 #DIV/0!Purchased Trans. $8,455 $248,296 $256,751 $3,871 $306,713 $310,584 $53,833 20.97% $3,929 $311,314 $315,243 $4,659 1.50%Misc. $9,000 $0 $9,000 $8,251 $729 $8,980 -$20 -0.22% $8,375 $740 $9,115 $135 1.50%
TOTAL (Calculated) $1,383,518 $423,334 $1,806,852 $1,378,144 $491,174 $1,869,318 $62,466 3.46% $1,398,814 $498,542 $1,897,356 $28,038 1.50%
OPERATING REVENUE Passenger Fares $13,668 $0 $13,668 $14,281 $0 $14,281 $613 4.48% $14,494 $0 $14,494 $213 1.49%Advertising $0 $0 $0 $0 $0 $0 $0 #DIV/0! $0 $0 $0 $0 #DIV/0!Shared-Ride Lottery Trip Reimbursement $484,100 $0 $484,100 $450,274 $0 $450,274 -$33,826 -6.99% $457,028 $0 $457,028 $6,754 1.50%Route Guarantee $0 $0 $0 $0 $0 $0 $0 #DIV/0! $0 $0 $0 $0 #DIV/0!PwD Trip Reimbursement $70,745 $0 $70,745 $76,979 $0 $76,979 $6,234 8.81% $78,134 $0 $78,134 $1,155 1.50%Area Agency on Aging $173,611 $123,893 $297,504 $185,913 $110,954 $296,867 -$637 -0.21% $188,702 $112,618 $301,320 $4,453 1.50%MH/MR $335,562 $0 $335,562 $357,077 $0 $357,077 $21,515 6.41% $362,433 $0 $362,433 $5,356 1.50%W2W $0 $0 $0 $0 $0 $0 $0 #DIV/0! $0 $0 $0 $0 #DIV/0!MATP $323,963 $0 $323,963 $312,012 $0 $312,012 -$11,951 -3.69% $316,692 $0 $316,692 $4,680 1.50%Other Third-Party Sponsors $17,209 $0 $17,209 $17,209 $0 $17,209 $0 0.00% $17,467 $0 $17,467 $258 1.50%Other Revenue - MATP $0 $248,296 $248,296 $0 $344,619 $344,619 $96,323 38.79% $0 $349,788 $349,788 $5,169 1.50%Other $0 $51,145 $51,145 $0 $0 $0 -$51,145 -100.00% $0 $0 $0 $0 #DIV/0!
TOTAL (Calculated) $1,418,858 $423,334 $1,842,192 $1,413,745 $455,573 $1,869,318 $27,126 1.47% $1,434,950 $462,406 $1,897,356 $28,038 1.50%
OPERATING DEFICIT (Calculated) $35,340 $0 $35,340 $35,601 -$35,601 $0 -$35,340 -100.00% $36,136 -$36,136 $0 $0 #DIV/0!
SUBSIDY SOURCES
Local Shared-Ride Subsidy /////////// /////////// /////////// /////////// #VALUE! #VALUE! /////////// /////////// #VALUE!
State Shared-Ride Subsidy /////////// /////////// /////////// /////////// #VALUE! #VALUE! /////////// /////////// #VALUE!
Other Shared-Ride Subsidy /////////// /////////// /////////// /////////// #VALUE! #VALUE! /////////// /////////// #VALUE!
GRANT TOTAL SUBSIDIES (Calculated) /////////// /////////// /////////// /////////// #VALUE! #VALUE! /////////// /////////// #VALUE!
OPERATING STATISTICS
Total Passenger Trips 80,175 34,289/////////// 87,466 34,331/////////// $7,291 9.09% 88778 34,846/////////// $1,312 1.50%
Total Revenue Vehicle Miles 1,074,035 530,786/////////// 1,052,355 551,021/////////// -$21,680 -2.02% 1,068,140 559,286/////////// $15,785 1.50%
Total Revenue Vehicle Hours 15,376 4312/////////// 15,101 4309/////////// -$275 -1.79% 15328 4,374/////////// $227 1.50%
Operating Expense per Passenger Trip $17.26 $12.35N/A $15.76 $14.31N/A -$1.50 -8.69% $15.76 $14.31N/A $0.00 0.00%Operating Expense per Revenue Mile $1.29 $0.80N/A $1.31 $0.89N/A $0.02 1.66% $1.31 $0.89N/A $0.00 0.00%Operating Expense per Revevue Hour $89.98 $98.18N/A $91.26 $113.99N/A $1.28 1.43% $91.26 $113.98N/A $0.00 0.00%
26
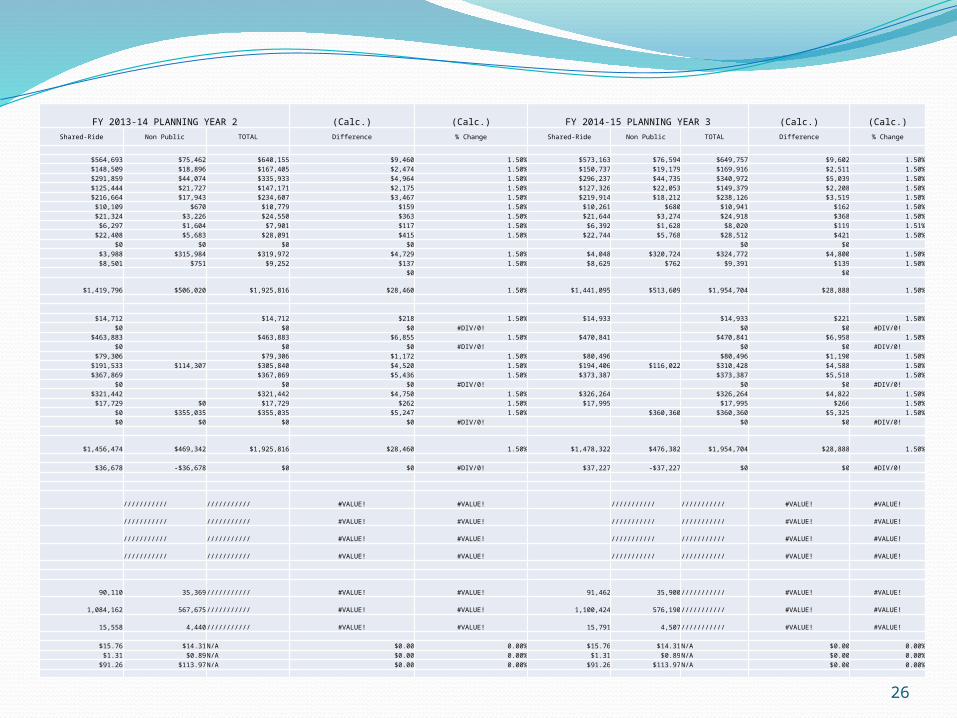
FY 2013-14 PLANNING YEAR 2 (Calc.) (Calc.) FY 2014-15 PLANNING YEAR 3 (Calc.) (Calc.)Shared-Ride Non Public TOTAL Difference % Change Shared-Ride Non Public TOTAL Difference % Change
$564,693 $75,462 $640,155 $9,460 1.50% $573,163 $76,594 $649,757 $9,602 1.50%$148,509 $18,896 $167,405 $2,474 1.50% $150,737 $19,179 $169,916 $2,511 1.50%$291,859 $44,074 $335,933 $4,964 1.50% $296,237 $44,735 $340,972 $5,039 1.50%$125,444 $21,727 $147,171 $2,175 1.50% $127,326 $22,053 $149,379 $2,208 1.50%$216,664 $17,943 $234,607 $3,467 1.50% $219,914 $18,212 $238,126 $3,519 1.50%
$10,109 $670 $10,779 $159 1.50% $10,261 $680 $10,941 $162 1.50%$21,324 $3,226 $24,550 $363 1.50% $21,644 $3,274 $24,918 $368 1.50%
$6,297 $1,604 $7,901 $117 1.50% $6,392 $1,628 $8,020 $119 1.51%$22,408 $5,683 $28,091 $415 1.50% $22,744 $5,768 $28,512 $421 1.50%
$0 $0 $0 $0 $0 $0 $3,988 $315,984 $319,972 $4,729 1.50% $4,048 $320,724 $324,772 $4,800 1.50%$8,501 $751 $9,252 $137 1.50% $8,629 $762 $9,391 $139 1.50%
$0 $0
$1,419,796 $506,020 $1,925,816 $28,460 1.50% $1,441,095 $513,609 $1,954,704 $28,888 1.50%
$14,712 $14,712 $218 1.50% $14,933 $14,933 $221 1.50%$0 $0 $0 #DIV/0! $0 $0 #DIV/0!
$463,883 $463,883 $6,855 1.50% $470,841 $470,841 $6,958 1.50%$0 $0 $0 #DIV/0! $0 $0 #DIV/0!
$79,306 $79,306 $1,172 1.50% $80,496 $80,496 $1,190 1.50%$191,533 $114,307 $305,840 $4,520 1.50% $194,406 $116,022 $310,428 $4,588 1.50%$367,869 $367,869 $5,436 1.50% $373,387 $373,387 $5,518 1.50%
$0 $0 $0 #DIV/0! $0 $0 #DIV/0!$321,442 $321,442 $4,750 1.50% $326,264 $326,264 $4,822 1.50%
$17,729 $0 $17,729 $262 1.50% $17,995 $17,995 $266 1.50%$0 $355,035 $355,035 $5,247 1.50% $360,360 $360,360 $5,325 1.50%$0 $0 $0 $0 #DIV/0! $0 $0 #DIV/0!
$1,456,474 $469,342 $1,925,816 $28,460 1.50% $1,478,322 $476,382 $1,954,704 $28,888 1.50%
$36,678 -$36,678 $0 $0 #DIV/0! $37,227 -$37,227 $0 $0 #DIV/0!
/////////// /////////// #VALUE! #VALUE! /////////// /////////// #VALUE! #VALUE!
/////////// /////////// #VALUE! #VALUE! /////////// /////////// #VALUE! #VALUE!
/////////// /////////// #VALUE! #VALUE! /////////// /////////// #VALUE! #VALUE!
/////////// /////////// #VALUE! #VALUE! /////////// /////////// #VALUE! #VALUE!
90,110 35,369/////////// #VALUE! #VALUE! 91,462 35,900/////////// #VALUE! #VALUE!
1,084,162 567,675/////////// #VALUE! #VALUE! 1,100,424 576,190/////////// #VALUE! #VALUE!
15,558 4,440/////////// #VALUE! #VALUE! 15,791 4,507/////////// #VALUE! #VALUE!
$15.76 $14.31N/A $0.00 0.00% $15.76 $14.31N/A $0.00 0.00%$1.31 $0.89N/A $0.00 0.00% $1.31 $0.89N/A $0.00 0.00%
$91.26 $113.97N/A $0.00 0.00% $91.26 $113.97N/A $0.00 0.00%