Embed Size (px)
Citation preview
32 Gisborne St, East Melbourne, Victoria 3002
Tel: 61 3 9929 8360 Fax: 61 3 9662 3859
Email: [email protected]
Website: www.cera.org.au
ABN: 72 076 481 984
Centrally Focussed
The Impact of Age-Related Macular Degeneration
A Dynamic Economic Model and Report by Access Economics Pty Limited
Cen
trally Focu
ssed The Im
pact of Age-R
elated Macular D
egeneration
CERA is a core partner of the
Vision CRC
CERA is a partner of Vision 2020 Australia
C
M
Y
CM
MY
CY
CMY
K
AEcoverAMDfinal.eps 12/1/06 12:35:42 PMAEcoverAMDfinal.eps 12/1/06 12:35:42 PM
This report was prepared by Access Economics Pty Limited for the Centre for Eye Research Australia. It was funded by an unrestricted grant from Novartis Ophthalmicswho had no part in the direction or fi ndings contained in this report.
Input into this report from members of the Australia eye care community is much appreciated.
Access Economics would like to acknowledge with appreciation the comments, prior research and expert input from:
Professor Hugh Taylor, AC and Associate Professors Robyn Guymer and Jill Keeffe
Centre for Eye Research Australia and the University of Melbourne
While every effort has been made to ensure the accuracy of this document, the uncertain nature of economic data, forecasting and analysis means that Access Economics Pty Limited is unable to make any warranties in relation to the information contained herein. Access Economics Pty Limited, its employees and agents disclaim liability for any loss or damage which may arise as a consequence of any person relying on the information contained in this document.
Centre for Eye Research Australia, University of Melbourne, Australia, February 2006
ISBN 0-9757695-6-1
Acknowledgments and Disclaimer
1Centrally Focussed
Contents Executive Summary1. Background 72. Literature Review 92.1 Risk and Protective Factors 92.1.1 Smoking 92.1.2 Cataract Surgery 102.1.3 Family History 112.1.4 Genotype 122.1.5 Antioxidants 132.1.6 Hypertension/Cardiovascular Disease 142.1.7 Dietary Fat Intake 142.1.8 Alcohol 142.1.9 Oestrogen 142.1.10 Light 152.2 Epidemiology 152.2.1 Prevalence 152.2.2 Progression and Natural History 192.2.3 Remission 222.2.4 Mortality 222.2.5 Population 232.3 Treatment Options 232.3.1 Diet 232.3.2 Laser Photocoagulation (LPC) 242.3.3 Photodynamic Therapy (PDT) 262.4 Disease Costs 292.4.1 Loss of Wellbeing 292.4.2 Health System Costs 302.4.3 Indirect Costs 352.4.4 Deadweight Losses 362.4.5 Discount Rates 36
3. The Model 394. Scenario Analysis 434.1 Comparison of Interventions 434.2 Quit Smoking Programs and Campaigns 444.2.1 Quit Smoking Programs 454.2.2 Community Awareness Campaign 464.2.3 Results 464.3 Research to Delay Progression 494.3.1 Results 494.4 New Therapy to Enhance Treatment Effi cacy 514.4.1 Anti-Angiogenesis 514.4.2 Results 52
5. Glossary 54 Appendix: Model Formulae 57 References 65
Contents

2 Centrally Focussed
Figure 2-1 Early Disease Stage AMD Prevalence and Incidence, Better Eye (% of age group) 18
Figure 2-2 Early Disease Stage AMD Prevalence and Incidence, Worse Eye (% of age group) 18
Figure 2-3 AMD Prevalence by Clinical Grading 20
Figure 3-1 Main Menu 39
Figure 3-2 Options Sheet 40
Figure 3-3 Model Diagram 41
Figure 4-1 Base Case Prevalence for AMD 43
Figure 4-2 Prevalence of Visual Impairment due to AMD 43
Figure 4-3 Base Case Loss of Wellbeing to AMD ($m) 44
Figure 4-4 Prevalence of Visual Impairment due to AMD - Quit Smoking Campaign (40-60 year olds) 48
Figure 4-5 Prevalence of Visual Impairment due to AMD - Quit Smoking Program (40-60 year olds) 48
Figure 4-6 Total Cost of AMD (Quit Smoking Interventions) 48
Figure 4-7 Prevalence of Visual Impairment due to AMD with an Intervention giving a 50% decrease in Progression Rates 50Figure 4-8 Prevalence of Visual Impairment due to AMD with an Intervention giving a 10% decrease in Progression Rates 50Figure 4-9 Prevalence of Visual Impairment due to AMD with use of Pegaptanib 53
Figure 4-10 Total Cost of AMD Versus Other Interventions ($) 53
Figures
3Centrally Focussed
Table 2-1 Smoking, Odds Ratios 9
Table 2-2 Smoking, Prevalence, Incidence and Rate of Quitting 10
Table 2-3 Cataract Surgery (%) 11
Table 2-4 Prevalence of AMD by Stage (% of age group) 16
Table 2-5 Prevalence of Early Disease Stage AMD, Better Eye (% of age group) 17
Table 2-6 Prevalence of Early Disease Stage AMD, Worse Eye (% of age group) 17
Table 2-7 Prevalence Studies, Subtypes of Neovascular (wet) AMD 19
Table 2-8 Extrafoveal CNV Natural History 21
Table 2-9 Juxtafoveal CNV Natural History 21
Table 2-10 Subfoveal CNV Natural History 22
Table 2-11 Mild to Moderate and Moderate to Severe Progression Rates 22
Table 2-12 Eyes that Undergo PDT treatment, May 2004-April 2005 27
Table 2-13 When PDT Treatments Occur 27
Table 2-14 PDT Effi cacy, Visual Acuity 28
Table 2-15 PDT Effi cacy, Modelled AMD Progression 29
Table 2-16 AIHW Disability Weightings 29
Table 2-17 Health Costs by Who Bears the Cost, 2003-04 30
Table 2-18 Probability of Residing in an Aged Care Facility, 2004-05 31
Table 2-19 Falls and Hip Fractures due to Vision Loss, Odds Ratios 32
Table 2-20 Risk of Accidental Fall (% of Population), 2001 33
Table 2-21 Health System Cost of an Accidental Fall ($ per Person), 2005 33
Table 2-22 Depression due to Vision Loss, Prevalence 33
Table 2-23 Depression due to Vision Loss, an Outlier Study 34
Table 2-24 Risk of Depression (% of Population), 2001 34
Table 2-25 Health System Cost of Depression ($ per Person), 2005 35
Table 2-26 Indirect Costs, ($ per annum), 2005 36
Table 4-1 Smoking interventions, comparison of odds ratios 45
Table 4-2 Model Results: Targeting Smokers Aged 15-40 Years 47
Table 4-3 Model Results: Targeting Smokers Aged 40-60 Years 47
Table 4-4 Model Results: R&D That Reduces Progression 49
Table 4-5 Macugen Effi cacy, Visual Acuity 51
Table 4-6 Macugen Effi cacy, Modelled AMD Progression 51
Table 4-7 Model Results: Anti-VGEF Treatment 52
Table 5-1 Acronyms 54
Table 5-2 Subscript Defi nitions 54
Table 5-3 Variable Defi nitions 54
Tables

4 Centrally Focussed

5Centrally Focussed
Access Economics has constructed a dynamic model of age-related macular degeneration (AMD) in Australia, to inform policy development in relation to this serious source of visual impairment and blindness.
The model is based on data from a wide variety of sources, and a broad literature search informed the estimation of parameters, such as odds ratios linking AMD with risk factors, mortality, comorbid conditions, disease progression and treatment effi cacies.
In the base case, the model incorporates smoking as the only modifi able risk factor for AMD on the basis of the range of evidence, with the relative risk of developing AMD for current smokers of 3.12 and for ex-smokers of 1.36.
Family history and genotype (Apolipoprotein E and Complement Factor H) are included as currently non-modifi able risk factors, with odds ratios depending on whether the AMD is geographic or neovascular.
Antioxidants, hypertension, dietary fat intake, alcohol, oestrogen and light were modelled with odds ratios of unity, refl ecting lack of adequate evidence regarding their role in the aetiology of AMD.
The incidence, prevalence and mortality associated with AMD was based on data from the Melbourne Visual Impairment Project (MVIP) and use of the DISMOD II model, for better and worse eye and based on severity of visual impairment – early disease stage, mild, moderate and severe visual impairment, defi ned as: a visual acuity level
better or equal to 6/12
worse than 6/12 and better or equal to 6/18
worse than 6/24 but better or equal to 6/60
worse than 6/60
The relative prevalence of various sub-types of AMD was drawn from epidemiological studies, concluding that 33% of AMD is geographic and 67% neovascular and, of neovascular AMD, 73% is sub-foveal, 18.5% is juxtafoveal and 8.5% is extrafoveal. Demographic groups within the population are projected on the basis of Australian Bureau of Statistics mid-case assumptions to 2025.
The natural history of AMD progression was based on data from the Age Related Eye Disease Study (AREDS), Macular Photocoagulation Study (MPS), Treatment of age-related macular degeneration with Photodynamic therapy (TAP) study and Verteporfi n In Photodynamic therapy (VIP) study, triangulated against data from the Rotterdam Eye Study and Blue Mountains Eye Study. Remission was modelled as nil in the base case with odds ratios for mortality of 1.67 for mild AMD, 2.34 for moderate AMD and 3.01 for severe AMD.
The effi cacy of various treatments on progression were based on various trial data.
Insuffi cient evidence was found for the effi cacy of dietary supplementation as a treatment mechanism in the base case.
Laser photocoagulation (LPC) was found to reduce the progression of AMD by 19% and incorporated in the base case for the eligible treatment population, a sub-set of those with extrafoveal and, rarely, sub-foveal AMD. Thus 3.2% of active lesions are treated with LPC, with 0.74% requiring re-lasering.
Photodynamic therapy (PDT) was found to reduce the progression of AMD by
•
•
•
•
•
•
•
•
•
•
Executive Summary
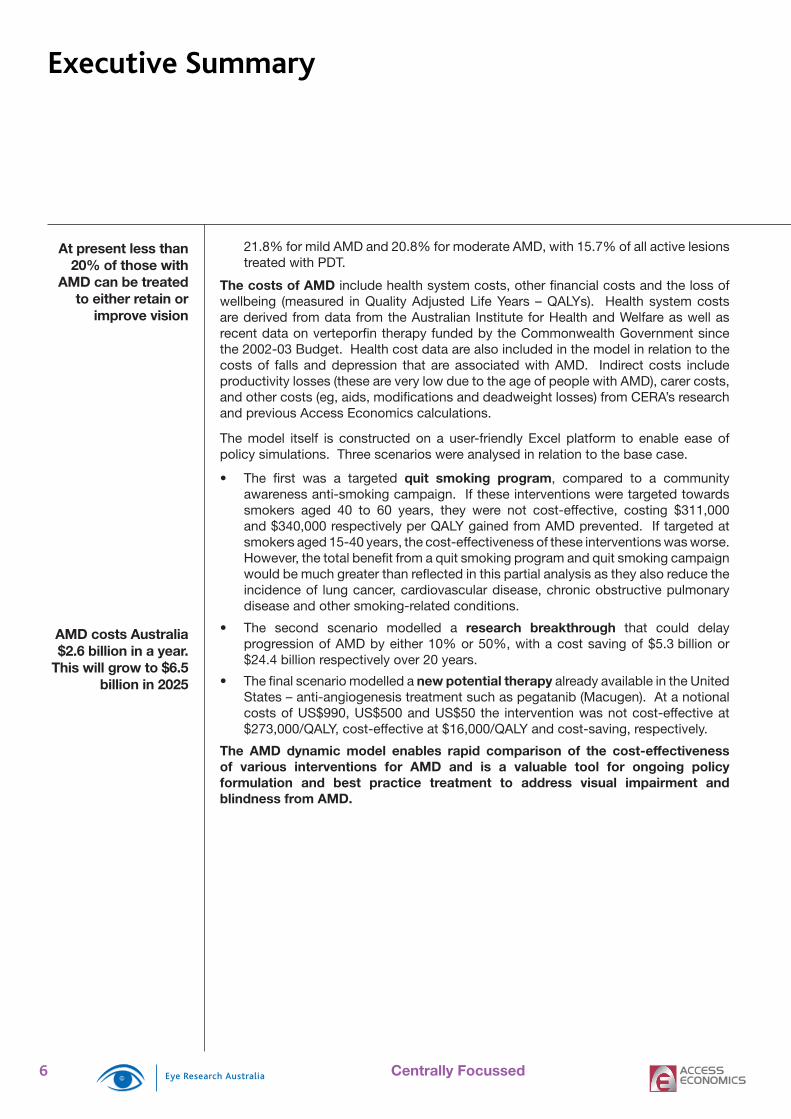
Nearly two out of three people will eventually develop AMD and one in four will lose vision
A dynamic economic model of AMD was developed to inform policy development on an ongoing basis
6 Centrally Focussed
21.8% for mild AMD and 20.8% for moderate AMD, with 15.7% of all active lesions treated with PDT.
The costs of AMD include health system costs, other fi nancial costs and the loss of wellbeing (measured in Quality Adjusted Life Years – QALYs). Health system costs are derived from data from the Australian Institute for Health and Welfare as well as recent data on verteporfi n therapy funded by the Commonwealth Government since the 2002-03 Budget. Health cost data are also included in the model in relation to the costs of falls and depression that are associated with AMD. Indirect costs include productivity losses (these are very low due to the age of people with AMD), carer costs, and other costs (eg, aids, modifi cations and deadweight losses) from CERA’s research and previous Access Economics calculations.
The model itself is constructed on a user-friendly Excel platform to enable ease of policy simulations. Three scenarios were analysed in relation to the base case.
The fi rst was a targeted quit smoking program, compared to a community awareness anti-smoking campaign. If these interventions were targeted towards smokers aged 40 to 60 years, they were not cost-effective, costing $311,000 and $340,000 respectively per QALY gained from AMD prevented. If targeted at smokers aged 15-40 years, the cost-effectiveness of these interventions was worse. However, the total benefi t from a quit smoking program and quit smoking campaign would be much greater than refl ected in this partial analysis as they also reduce the incidence of lung cancer, cardiovascular disease, chronic obstructive pulmonary disease and other smoking-related conditions.
The second scenario modelled a research breakthrough that could delayprogression of AMD by either 10% or 50%, with a cost saving of $5.3 billion or $24.4 billion respectively over 20 years.
The fi nal scenario modelled a new potential therapy already available in the United States – anti-angiogenesis treatment such as pegatanib (Macugen). At a notional costs of US$990, US$500 and US$50 the intervention was not cost-effective at $273,000/QALY, cost-effective at $16,000/QALY and cost-saving, respectively.
The AMD dynamic model enables rapid comparison of the cost-effectivenessof various interventions for AMD and is a valuable tool for ongoing policy formulation and best practice treatment to address visual impairment and blindness from AMD.
•
•
•
Executive Summary
At present less than 20% of those with
AMD can be treated to either retain or
improve vision
AMD costs Australia $2.6 billion in a year.
This will grow to $6.5 billion in 2025
7Centrally Focussed
Access Economics Pty Limited was commissioned by the Centre for Eye Research Australia to:
construct a dynamic model of age-related macular degeneration (AMD) in Australia,that encompassed prevalence, incidence, risk factors, health and indirect fi nancial costs, treatment options and measures of wellbeing; and
document the model and report on the impacts over the period 2005-2025 of a quit smoking program, new research that delays progression, and a new therapy that enhances treatment effi cacy.
The model developed also has the capacity to be upgraded to incorporate other sourcesof visual impairment in the future, such as diabetic retinopathy, glaucoma, cataract, refractive error and other causes.
This project follows on from our two earlier reports Clear Insight: The Economic Impact and Cost of Vision Loss in Australia (CERA, August 2004) and Investing in Sight: Strategic Interventions to Prevent Vision Loss in Australia (CERA, June 2005).
Due to the technical nature of the modelling, this report assumes familiarity with the terminology used in these previous reports. A glossary of key terms is in Section 5.
The project consists of three parts, the outcomes of which are detailed in the following sections:
Literature Review – identifi es the effi cacy of various treatment options and the values of the parameters to be used as inputs into the model.
Development of the Model – develops the model’s structure, workings and user interface.
Scenario Analysis – conducts and reports on the impacts of three scenarios over the period 2005-2025.
1)
2)
•
•
•
1. Background

8 Centrally Focussed

9Centrally Focussed
The literature review identifi ed ten risk and protective factors that are important determinants of the risk of suffering AMD. Strong evidence was established for Odds Ratios (ORs) signifi cantly different from unity in four cases: smoking, cataract surgery, family history and genotype. It is important to model these risk factors so to estimate the benefi t of interventions that either: reduce the prevalence of a risk factor (i.e. smoking); or increase the screening rate in populations susceptible to AMD so as to intervene in the early stages of AMD (i.e. cataract surgery, family history and genotype).
2.1.1 Smoking
Smoking is an established modifi able risk factor for AMD. It may increase risk of AMD via the direct effects on choroidal circulation, or via decreased blood plasma levels of antioxidant micronutrients.
Thornton (2005) reviewed the relevant literature and identifi ed most studies as having found a statistically signifi cant association between smoking and AMD. For all AMD, a pooled analysis of cross-sectional studies found an OR of 3.12 (with a confi dence interval of 2.10-4.64) for current versus never smokers, and an OR of 1.36 (0.97-1.90) for ex versus never smokers (see Table 2-1).
For current smokers the risk of neovascular AMD is likely to be higher than for geographic AMD, but for ex smokers the risk is fairly similar.
All eight studies, except for the 10 year follow-up BDES, that investigated the impact of dose (measured in terms of pack-years) on the risk of AMD found a positive relationship. The relative amount smoked per day may also play a role. In the Physicians Health Study (Christen et al, 1996), men who smoked more than 20 cigarettes a day were at increased risk compared to those who smoked less than 20 cigarettes a day (OR of 2.46 versus OR 1.26).
Table 2-1 Smoking, Odds Ratios (OR)
Ex-smoker v. never Current v. neverGeographic AMD 1.58 (0.90-2.79) 2.54 (1.25-5.17)Neovascular AMD 1.54 (0.97-2.44) 4.55 (2.74-7.54)All AMD 1.36 (2.10-4.64) 3.12 (2.10-4.64)
Confi dence intervals in brackets
Access Economics’ model distinguishes between those who are current smokers, ex-smokers1 and those who have never smoked2.
For the model base case, the RR of AMD for ex-smokers is 1.36, and for current smokers is 3.12. Prevalence of smokers and ex-smokers is from AIHW (2005) and the relative risk of mortality of smokers and ex-smokers is 1.9 and 1.2, respectively (Friedman et al, 1996). The incidence of smoking is obtained using DISMOD II (Table 2-2).
1 Smoked at least 100 cigarettes (manufactured and/or roll-your-own) or the equivalent amount of tobacco in their life, and no longer smoke.2 Never smoked 100 cigarettes (manufactured and/or roll-your-own) or the equivalent amount of tobacco in their life.
•
•
2. Literature Review2.1 Risk and Protective Factors
AMD is the leading cause of blindness in Australia and is responsible for 48% of severe vision loss
The only modifi able risk factor for AMD modelled is smoking

10 Centrally Focussed
Table 2-2 Smoking, Prevalence, Incidence and Rate of Quitting
Smokers Prevalence(% of Population)
Ex-Smokers Prevalence
(% of Population)
Rate of Quitting(% of Smokers)
Smokers Incidence(% of Population)
Age M F M F M F M F0-14 0 0 0 0 0 0 0 015-19 12.7 14.2 3.6 3.0 6.3 6.1 2.4 2.420-24 31.2 27.9 12.7 14.5 3.2 4.6 2.2 1.925-29 31.2 27.9 12.7 14.5 3.6 4.8 2.0 1.930-34 29.2 25.7 23.0 26.6 3.5 4.3 0.8 0.835-39 29.2 25.7 23.0 26.6 3.1 2.6 0.6 0.440-44 26.4 22.7 30.9 30.8 3.3 1.6 0.7 0.345-49 26.4 22.7 30.9 30.8 3.7 0.9 0.6 0.050-54 21.3 15.8 41.0 27.8 4.8 0.2 0.5 0.055-59 21.3 15.8 41.0 27.8 3.6 0.3 0.3 0.060-64 14.3 11.9 44.6 31.3 5.0 1.6 0.3 0.065-69 14.3 11.9 44.6 31.3 9.5 0.9 0.3 0.070-74 10.8 6.7 55.6 27.9 17.5 0.7 0.3 0.075-79 10.8 6.7 55.6 27.9 21.7 2.9 0.3 0.080-84 7.4 1.5 66.6 24.6 39.2 54.5 0.3 0.085-89 7.4 1.5 66.6 24.6 45.8 100.0 0.3 0.090+ 4.0 0.0 77.6 21.2 96.4 100.0 0.3 0.0
Methodology: The prevalence of smokers and ex-smokers in the 60+ age groups was linearly extrapolated based on the growth rate between the 40-49 and the 50-59 age group (adjusted so that the total prevalence equalled the reported prevalence in the 60+ age group). The incidence of ex-smokers was then modelled using DISMOD II using the prevalence data (linearly interpolated), a RR of mortality of 1.2, and a remission rate of 0. This incidence of ex-smokers was then used as the remission rate of smokers, with the prevalence data (linearly interpolated) and a RR of mortality of 1.9 to estimate the incidence of smokers in DISMOD II. Incidence rates were not allowed to increase after the 60+ age group.
2.1.2 Cataract Surgery
The clinical experience of many ophthalmologists has led to the theory that cataract surgery could increase either the development of late stage AMD lesions or speed progression to late stage AMD.
Using the BDES, Wang et al (2003) found a relationship between late stage AMD and pseudo-phakic (post-cataract surgery) eyes. The relationship was found to be more strongly linked to development of neovascular AMD than geographic atrophy.
Cataract surgery is included in the model for completeness to identify subgroups who may be at higher risk of developing AMD, potentially with regard to policy implications. It is also relevant in relation to potential R&D focus.
For the model base case, for people with pseudo-phakic eyes, the OR for neovascular AMD is 4.0 and the OR for geographic atrophy is 2.5 (or 3.1 for all AMD), the incidence ofpeople who have had cataract surgery is from The Australian Hospital Morbidity database (assuming that one third of these patients have already received surgery in the other eye3),and the prevalence of people who have had cataract surgery is estimated using DISMOD II.
3 Expert opinion
Risk and Protective Factors
Quit smoking ad campaign

11Centrally Focussed
Table 2-3 Cataract Surgery (%)
Incidence - Original
Incidence – DISMOD II
Prevalence– DISMOD II
Age M F M F0-4 0.0 0.0 0.0 0.0 0.0 0.15-9 0.0 0.0 0.0 0.0 0.1 0.1
10-14 0.0 0.0 0.0 0.0 0.1 0.215-19 0.0 0.0 0.0 0.0 0.1 0.220-24 0.0 0.0 0.0 0.0 0.2 0.225-29 0.0 0.0 0.0 0.0 0.2 0.230-34 0.0 0.0 0.0 0.0 0.3 0.335-39 0.0 0.0 0.0 0.0 0.4 0.440-44 0.1 0.1 0.1 0.1 0.7 0.645-49 0.2 0.1 0.2 0.1 1.3 1.050-54 0.3 0.3 0.3 0.3 2.5 2.055-59 0.6 0.7 0.6 0.6 4.7 3.960-64 1.2 1.5 1.1 1.2 8.6 8.265-69 2.3 3.1 1.9 2.4 15.4 16.770-74 4.5 6.1 3.3 3.9 26.8 31.575-79 7.6 9.5 4.4 4.5 41.7 50.480-84 9.1 9.8 4.1 3.4 54.8 65.485-89 7.2* 6.2* 2.9 2.1 59.4 70.890+ 3.1 1.7 57.3 69.0
* 85+ year olds
Methodology: The prevalence of cataract surgery was modelled using DISMOD II using the incidence data (interpolated using a cubic spline), a RR of mortality of 1, and a remission rate of 0.
Source: The Australian Hospital Morbidity Database (H25-28 Disorders of the lens), 2003-04.
2.1.3 Family History
The link between a family history of AMD and incidence of the disease is a diffi cult one to establish due to the nature of AMD as a disease of older people. Establishing parental history of the disease is diffi cult as parents of current sufferers are often deceased, with the sufferer not aware of whether their parent(s) were also sufferers; looking to the offspring of those with AMD today also yields few results as the children are typically too young to have acquired the disease. Hence, most studies look at family history in terms of prevalence among siblings to determine a link.
Several studies have shown that people reporting a family history of AMD are at increased risk of the disease, though the risk factor varies widely from study to study. Most studies assume family history to refer to an individual with a fi rst degree relative with the disease (parent, sibling or offspring).
Some studies have estimated that siblings of those with AMD have nearly a 20 times higher risk of developing the disease compared to the general population (Silvestri et al, 1994). A population based study of the familial link (Klaver et al, 1998b) found the increase risk of early AMD in fi rst degree relatives of those with the disease as OR 4.8 (95% CI 1.8 -12.2) and late AMD, OR 19.8 (CI 3.1 – 126.0). The very large confi dence intervals, especially for late stage AMD, cast doubt over the precision of these estimates. The MVIP found an OR for AMD of 2.16 (1.06 – 4.41) for those with a family history of AMD (McCarty et al 2001).
AMD runs in families and some genes have been identifi ed
Risk and Protective Factors

12 Centrally Focussed
A clinic-based study (Seddon et al, 1997) found a signifi cantly higher prevalence of early AMD among those with a sibling diagnosed with AMD than among those with a sibling free of AMD (OR 2.4). The relationship was also strong for those with advanced (moderate or severe) stage disease – OR 2.1 for case versus control. The relationship was also more strongly linked with the neovascular form of the disease (OR 3.1, p=0.03) compared with the geographic atrophy form (OR 1.5, p=0.36).
Family history is a non-modifi able risk factor incorporated in the model, like cataract surgery, for completeness to identify subgroups that may be at higher risk of developing AMD, potentially with regard to policy implications. It is also relevant in relation to potential R&D focus.
For the model base case, for those with a family history the OR for AMD is 2.4, with an OR for neovascular AMD of 3.1 and for geographic atrophy of 1.5. Prevalence of family history of AMD across the whole population is 4.7%4, and incidence is assumed to occur at birth.
2.1.4 Genotype
Another approach to examining the genetics of age related maculopathy is to study individual genes linked to hereditary retinal dystrophies. A number of studies have examined a range of specifi c genes. Genotype, like family history and cataract surgery, is incorporated in the model for completeness to identify subgroups that may be at higher risk of developing AMD, potentially with regard to policy implications. It is also relevant in relation to potential R&D focus.
2.1.4.1 Apolipoprotein E (APOE)
APOE is a major protein in the central nervous system and a regulator of lipid transport and cholesterol. In some studies it has been shown to be associated with neuro-degeneration.
Baird et al (2004) completed a similar study using only subjects for whom all four grandparents were Irish or English in origin. It found that subjects with the e3e4 genotype had a signifi cantly reduced risk of AMD (OR 0.58, 95% CI 0.34 – 0.98), and the protective effect was greater for the atrophic disease (OR 0.35) compared to neovascular (OR 0.65) – latter not signifi cant. These results are very similar to those found in a separate case-based study (Schmidt et al, 2002) as well as in earlier studies (Klaver et al, 1998a; Souied et al, 1998).
Baird et al (2004) found that the e2e3 genotype signifi cantly brought forward the mean age of diagnosis of disease by 3.4 years and increased the risk of end stage disease (OR 1.69, p=0.18) though this was not signifi cant. The result was signifi cant, however, specifi c to end stage atrophic disease (OR 2.3, p=0.09).
However, since most of the results regarding the e2e3 genotype were not signifi cant, the model base case does not assume this as a risk factor.
The results from the Baird study are used in the model as they accord well with similar studies for the e3e4 allele.
For the model base case, for those with the e3e4 genotype the OR for AMD is 0.58,
4 The prevalence of family history is calculated using the formula: Pr(AMDfamhist) = 2*Pr(AMD) – Pr(AMD)^2 ie, the probability of each parent having it minus the probability of both having it), where Pr(AMD) = 2.37% is the total popula tion prevalence of AMD (in the Worse eye).
Risk and Protective Factors
13Centrally Focussed
with an OR for geographic atrophy of 0.35, and the prevalence of e3e4 is 30.1%, based on Baird et al (2004). Incidence is assumed to occur at birth.
2.1.4.2 Complement Factor H
A second gene, known as complement factor H has been implicated in AMD. Several studies have identifi ed a link (Edwards et al, 2005; Haines et al, 2005; Klein et al, 2005).
Haines et al (2005) notes:
DNA resequencing of the complement factor H gene (CFH) within the haplotype revealed a common coding variant, Y402H, that signifi cantly increases the risk for AMD with ORs between 2.45 and 5.57. This common variant likely explains approximately 43% of AMD in older adults.
In summary, the study found that the OR for AMD for carriers of one C allele was 2.45 and for carriers of two C alleles were 3.33. When examining neovascular disease only, the ORs increased to 3.45 and 5.57 for one and two C alleles respectively.
For the model base case, for those with one C allele the OR for AMD is 2.45 and for neovascular AMD 3.45, while for two C alleles the OR for AMD is 3.33 and for neovascular AMD 5.57.
The prevalence of the C allele is estimated from two studies. The fi rst study (Zareparsi et al, 2005) suggested prevalence of one C allele of 49.5% and of two, 9%. An as yet unpublished Eye Research Australia study, methodologically tighter, suggests prevalence of one C allele of 54% and of two, 9.7%. The average is used in the model.
For the model base case, prevalence of one C allele is 51.75% and of two is 9.35%. Incidence is assumed to occur at birth.
2.1.5 Antioxidants
Evans (2001) summarises the fi ndings of fi ve published studies examining the role of antioxidants in AMD. Four studies examined the effect of supplements on the progression of the disease while only one examined the effects on the development of AMD. It is this latter effect that is relevant here to the risk factor and prevention aspects of the model. Section 2.3.1 reviews a later meta-analysis by the same author of seven studies, as well as other work, designed to test the ability of antioxidants as treatments, rather than prevention.
In general, the trials reviewed in Evans (2001) were small (<200) so lacked power to measure impacts. The smaller trials found very little evidence that antioxidant supplements slow down the progression of or prevent the development of AMD, a fi nding backed up in the larger Age-Related Eye Disease Study (AREDS, 2005; AREDS, 2001).
Observational studies do not provide good evidence and in analysing such studies, many inconsistencies have been noted. Implicated in some studies have been serum carotenoids, lycopene, Vitamin E, Vitamin A, fresh fruit and vegetables and dark green leafy vegetables. Overall there is no conclusive evidence supporting dietary supplements to reduce risk of AMD.
Several large trials are currently underway, the results of which may provide more conclusive evidence.
Risk and Protective Factors
14 Centrally Focussed
For the model base case, for those who take preventive antioxidant dietary supplements the OR of AMD is unity.
2.1.6 Hypertension/Cardiovascular Disease
The link between blood pressure and AMD has been examined to see if preventative therapies for cardiovascular risk factors might be applied to prevent AMD.5 Evans (2001) notes the confl icting evidence produced by studies. Essentially:
Goldberg et al (1988), Chaine et al (1998), and Kahn et al (1977, Framingham Eye Study) found that people with hypertension were more likely to have AMD and that those who had experienced hypertension for longer had an increased risk of AMD; while
Maltzman (1979), Eye Disease Case Control Study Group (1992), Klein (1993a), Hirvela (1996), Smith (1998) and McCarty (2001) did not support this fi nding.
For the model base case, for those with cardiovascular disease or hypertension the OR of AMD is unity.
2.1.7 Dietary Fat Intake
It has been theorised that dietary fat intake may increase the risk of AMD by either of two mechanisms:
raised levels of cholesterol in the blood may increase the risk of atherosclerosis, or
there may be increased deposits of fat in Brush’s membrane that would adversely affect fl ow supply of nutrients and removal of waste products from the retinal pigment epithelium.
In a summary of studies to date, Evans (2001) notes that only the Beaver Dam Study addressed dietary intake specifi cally; it found that those whose fat and cholesterol intake was in the highest quintile also had the highest risk of early AMD. However, the fi ndings for biochemical markers of dietary fat have been inconsistent – Goldberg et al (1988); Klein and Klein (1982).
For the model base case, for those with high dietary fat intake the OR of AMD is unity.
2.1.8 Alcohol
There are relatively few studies have examined the link between alcohol consumption and AMD and results in studies that do examine it are inconclusive (Evans, 2001). Though there has been limited evidence of the existence of a J-curve in alcohol consumption with small amounts (mainly of wine) being benefi cial (Obisesan et al, 1998), not all studies show this conclusion (Vinding et al, 1992, McCarty et al 2001), and results vary widely.
For the model base case, for those with high alcohol consumption, the OR of AMD is unity.
2.1.9 Oestrogen
The evidence for a link between oestrogen (taken by women) and AMD is inconclusive (Evans, 2001). Some studies have found a reduced risk of neovascular AMD for
5 In theory, defi ciencies in the choroidal vasculature or increased haemodynamic resistance may lead to deterioration in the retinal pigment epithelium, either due to ischaemia or build up of waste products.
•
•
•
1)
2)
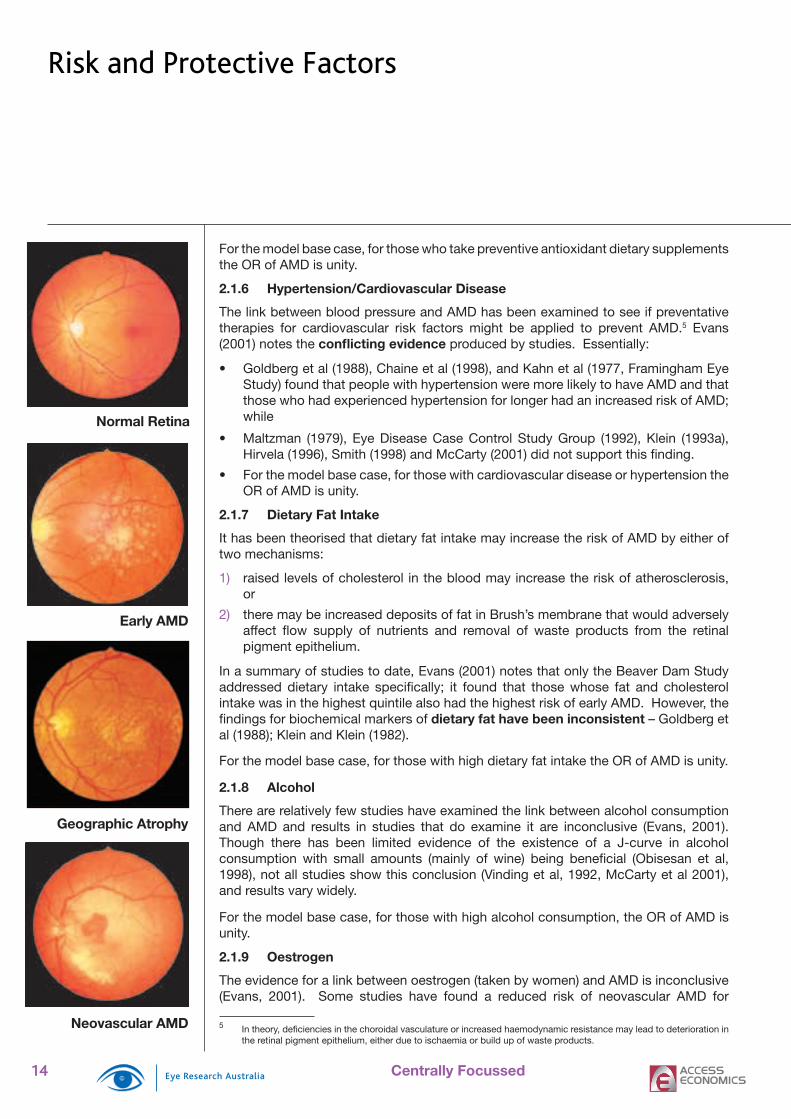
Risk and Protective Factors
Normal Retina
Early AMD
Geographic Atrophy
Neovascular AMD
15Centrally Focussed
women on oestrogen replacement therapy (Eye Disease Cast-Control Study Group, 1992; Vingerling et al, 1005) while other studies found no link (Klein et al, 1994; Smith et al, 1997, McCarty et al 2001).
For the model base case, for those with oestrogen supplements the OR of AMD is unity.
2.1.10 Light
This theory suggests that excessive exposure to bright light may damage the retina and cause deterioration or damage similar to that seen in AMD. Two studies in particular have examined this link and have drawn confl icting conclusions.
The Chesapeake Bay study on the long term effects of visible light on the eyes of a group of watermen (Taylor et al, 1992), found that signifi cant ocular exposure to blue light over a period of 20 years increased the risk of AMD. More recently, McCarty et al (2001) found no signifi cant difference in mean sunlight exposure between those with and those without AMD, a fi nding supported by older work by West et al (1989).
For the model base case, for those with high exposure to light the OR of AMD is unity.
2.2 EpidemiologyWhile many diseases affect the person directly, eye diseases can affect either one eye or both eyes at differing levels of severity, progression and remission rates. However the costs of the disease are incurred at the person level rather than the eye level (for example, premature mortality, disability, additional health costs, productivity costs and indirect costs are costs per person). There can be complex interactions over time, with originally better eyes becoming worse eyes – however, the comprehensive data to model such a risk matrix are not available. Thus, cost ranges are calculated on the basis of following the person’s better eye or their worse eye, in terms of visual acuity. The model is based on visual acuity, rather than clinical grading, because it is more closely related to disease burden and cost impacts. Following the person’s worse eye is likely to result in a higher cost estimate than following the person’s better eye as the person is more likely to: be treated in the health system; to experience falls and depression, with their associated costs; to die; and to experience greater levels of productivity losses and other indirect costs.
2.2.1 Prevalence
The model uses prevalence data from the MVIP, split up into levels of visual acuity:
Early Disease Stage with a visual acuity level better or equal to 6/126,
Mild Disease Stage with a visual acuity level worse than 6/12 and better or equal to 6/18,
Moderate Disease Stage with a visual acuity level worse than 6/18 but better or equal to 6/60, and
Severe Disease Stage with a visual acuity level worse than 6/60.
6 The modelling acknowledges that in this Early Disease Stage, people may have had well-treated AMD that has not affected vision.
•
•
•
•
Australia has better data on the prevalence of eye disease than any other country
2.2 Epidemiology

16 Centrally Focussed
Table 2-4 Prevalence of AMD by Stage (% of age group)
Mild Moderate SevereAge Better Worse Better Worse Better Worse0-4 0.0 0.0 0.0 0.0 0.0 0.05-9 0.0 0.0 0.0 0.0 0.0 0.010-14 0.0 0.0 0.0 0.0 0.0 0.015-19 0.0 0.0 0.0 0.0 0.0 0.020-24 0.0 0.0 0.0 0.0 0.0 0.025-29 0.0 0.0 0.0 0.0 0.0 0.030-34 0.0 0.0 0.0 0.0 0.0 0.035-39 0.0 0.0 0.0 0.0 0.0 0.040-44 0.0 0.0 0.0 0.0 0.0 0.045-49 0.0 0.0 0.0 0.0 0.0 0.050-54 0.0 0.0 0.0 0.0 0.0 0.055-59 0.0 0.1 0.0 0.0 0.0 0.060-64 0.0 0.0 0.0 0.0 0.0 0.165-69 0.0 0.0 0.0 0.3 0.0 0.070-74 0.2 0.2 0.0 0.3 0.2 0.275-79 0.0 0.6 0.9 0.6 0.0 1.280-84 1.0 1.5 1.0 1.0 1.0 2.085-89 2.1 2.1 4.3 2.1 3.2 6.490+ 3.1 3.1 6.3 3.1 4.7 9.440+ 0.1 0.2 0.3 0.2 0.2 0.4
Methodology: Prevalence rates were applied to both sexes. The prevalence in the 85+ year olds was split between the 85-89 and 90+ year olds based on the ratio of prevalence in the 85-89 year olds compared to the 85+ year olds (0.854) and the 90+ year olds compared to the 85+ year olds (0.1264), respectively, contained in Clear Insight. Prevalence in 0-39 year olds was assumed to be 0%. The rates were adjusted so that total persons experiencing visual impairment due to AMD was the same as in Clear Insight (indexed to 2005), since the standard errors in the disaggregated data were higher than in the aggregated data used in the Clear Insight prevalence estimate.
Source: MVIP database
DISMOD II was used to estimate the incidence of AMD (and consistent prevalence rates) based on the prevalence of Early Disease Stage from MVIP (by age but not by sex), and assuming a relative risk of mortality of unity (since it is likely to be the visual impairment associated with AMD that causes the higher risk of death, not the disease itself) and a progression rate from Early Disease Stage to mild visual impairment (“remission” variable in the software) of 4% (see Section 2.2.2).
Table 2-5 and Table 2-6 show the original prevalence estimates from MVIP that were used as an input into DISMOD II, and the output from the model (incidence and prevalence). As the model is ‘closed’ (i.e. prevalence in any age group must equal prevalence in the previous age group, plus incidence minus deaths) the model adjusts all of the assumptions to ensure they are consistent.
The prevalence of vision loss trebles with each decade over the age of 40
Epidemiology

17Centrally Focussed
Table 2-5 Prevalence of Early Disease Stage AMD, Better Eye (%of age group)
Prevalence– Original
Incidence – DISMOD II
Prevalence– DISMOD II
Age M F M F M F0-4 0.0 0.0 0.0 0.0 0.0 0.05-9 0.0 0.0 0.0 0.0 0.0 0.010-14 0.0 0.0 0.0 0.0 0.0 0.015-19 0.0 0.0 0.0 0.0 0.0 0.020-24 0.0 0.0 0.0 0.0 0.0 0.025-29 0.0 0.0 0.0 0.0 0.0 0.030-34 0.0 0.0 0.0 0.0 0.0 0.035-39 0.0 0.0 0.0 0.0 0.0 0.040-44 0.3 0.3 0.0 0.0 0.3 0.345-49 0.4 0.4 0.0 0.0 0.4 0.450-54 0.1 0.1 0.0 0.0 0.4 0.455-59 0.3 0.3 0.1 0.0 0.4 0.460-64 0.7 0.7 0.2 0.2 0.9 0.965-69 2.1 2.1 0.6 0.5 2.3 2.370-74 5.5 5.5 1.0 0.9 5.0 5.075-79 8.5 8.5 1.3 1.1 8.2 8.280-84 11.0 11.0 1.8 1.5 11.1 11.185-89 13.8 13.8 5.4 5.0 17.6 17.690+ 20.5 20.5 10.8 10.3 28.1 28.040+ 0.4 0.6 2.2 2.9
Methodology: The incidence of AMD was modelled using DISMOD II using the prevalence data (linearly interpolated), a RR of mortality of 1, and a remission rate of 4%.Source: MVIP database
Table 2-6 Prevalence of Early Disease Stage AMD, Worse Eye (% of age group)
Prevalence – Original
Incidence – DISMOD II
Prevalence – DISMOD II
Age M F M F M F0-4 0.0 0.0 0.0 0.0 0.0 0.05-9 0.0 0.0 0.0 0.0 0.0 0.010-14 0.0 0.0 0.0 0.0 0.0 0.015-19 0.0 0.0 0.0 0.0 0.0 0.020-24 0.0 0.0 0.0 0.0 0.0 0.025-29 0.0 0.0 0.0 0.0 0.0 0.030-34 0.0 0.0 0.0 0.0 0.0 0.035-39 0.0 0.0 0.0 0.0 0.0 0.040-44 1.1 1.1 0.1 0.1 1.1 1.145-49 1.4 1.4 0.1 0.1 1.3 1.350-54 0.9 0.9 0.1 0.1 1.3 1.355-59 1.6 1.6 0.2 0.2 1.6 1.660-64 2.3 2.3 0.4 0.4 2.5 2.665-69 4.4 4.4 0.8 0.7 4.6 4.570-74 8.5 8.5 1.1 1.1 7.6 7.775-79 9.9 9.9 1.5 0.9 10.5 10.380-84 14.5 14.5 2.5 3.4 14.5 14.185-89 19.1 19.1 7.0 9.4 24.0 32.990+ 28.3 28.3 13.3 10.9 37.8 46.840+ 0.6 0.9 3.7 5.0
Methodology: The incidence of AMD was modelled using DISMOD II using the prevalence data (linearly interpolated), a RR of mortality of 1, and a remission rate of 4%.Source: MVIP database
The incidence of AMD increasesdramatically in the last decades of life
Epidemiology

18 Centrally Focussed
Figure 2-1 Early Disease Stage AMD Prevalence and Incidence, Better Eye (% of age group)
30
25
20
15
10
5
0 40-44 45-49 50-54 55-59 60-64 65-69 70-74 75-79 80-84 85-89 90+
Prevalence, Males Prevalence, Females
Incidence, Males Incidence, Females
Age
Percent
Figure 2-2 Early Disease Stage AMD Prevalence and Incidence, Worse Eye (% of age group)
40
45
50
35
30
25
20
15
10
5
0
40-44 45-49 50-54 55-59 60-64 65-69 70-74 75-79 80-84 85-89 90+
Prevalence, Males Prevalence, Females
Incidence, Males Incidence, Females
Age
Percent
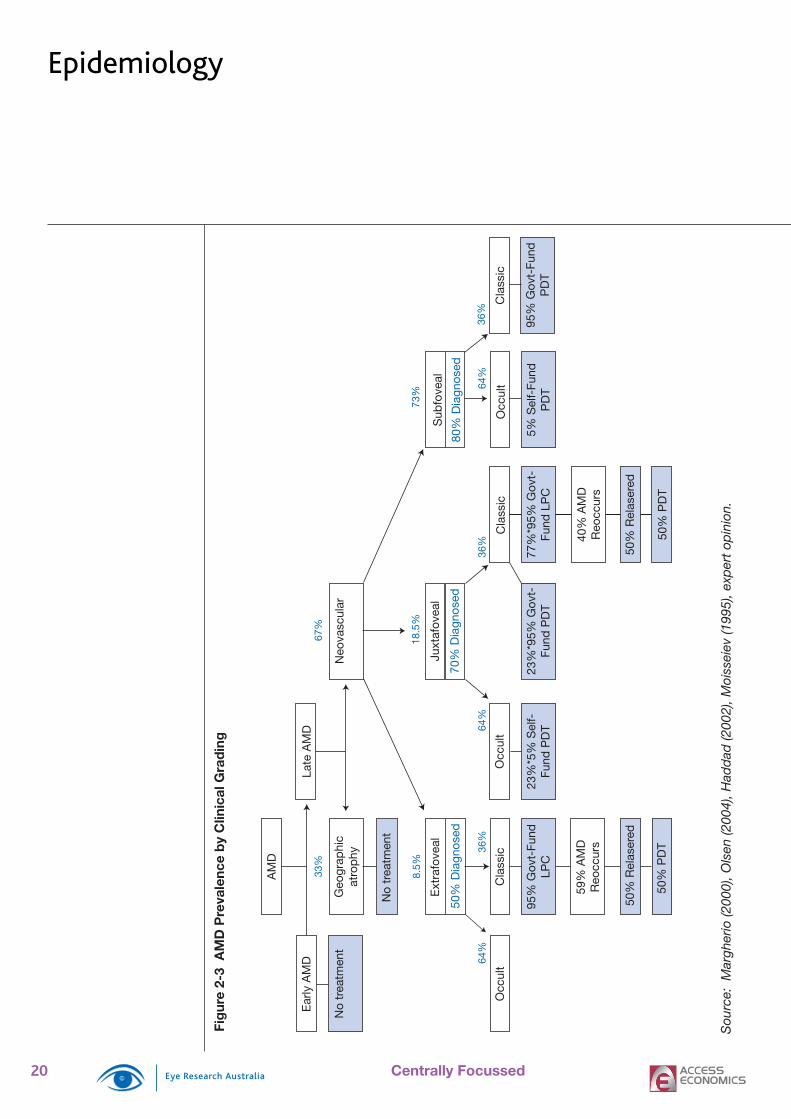
It is also important to determine the proportions of AMD that are neovascular or geographic since only neovascular types are currently treatable and the treatment option varies with the sub-type of neovascular AMD – subfoveal, juxtafoveal or extrafoveal. Neovascular AMD comprises an estimated 67% of all AMD. Assumptions about the proportion of the population with neovascular AMD who have occult or classic and sub-types are derived from literature analysis (Table 2-7). The studies show that, of all neovascular AMD, an estimated 73% are subfoveal, 18.5% are juxtafoveal, and 8.5% are extrafoveal.
The prevalence of visual impairment
from AMD will almost double in the
next 20 years
Epidemiology

19Centrally Focussed
Table 2-7 Prevalence Studies, Subtypes of Neovascular (wet) AMD
Study Wet Subfoveal Not Subfoveal
Juxtafoveal Extrafoveal
n % n % n % n %Margherio (2000)1 474 392 82.7 82 17.3 55 11.5 27 5.8Olsen (2004) 200 157 78.5 43 21.5 33 16.5 10 5.0Haddad (2002) 254 89 35.0 165 65.0 108 42.5 57 22.4Moisseiev (1995) 63 44 69.8 19 30.2 10 15.9 9 14.3Zawinka (2005) 168 128 76.3 40 23.7 25 14.9 15 8.9Total published 1159 810 69.9 349 30.1 231 19.9 118 10.2
UnpublishedBeaumont (Australia)
3550 2627 74.0 923 26.0 639 18.0 284 8.0
Total all 4709 3437 73.0 1272 27.0 870 18.5 402 8.51 The split between juxtafoveal and extrafoveal for this study has been attributed on the basis of the splits from the other published studies, as Margherio et al only subcategorised subfoveal.
Figure 2-3 highlights relative prevalence of lesion-type in the base case of the model as well as base case treatment protocols. These prevalence rates are applied across all levels of visual acuity.
Not all active CNV lesions present to a retina specialist. Of those who reach a retina specialist, the management strategy will likely be dependent upon lesion location, lesions size, lesion composition, then visual acuity. Expert opinion suggests that of those with extrafoveal, juxtafoveal and subfoveal lesions, 50%, 70% and 80% respectively are referred for treatment with LPC or PDT. Of those who present with classic features, it is assumed that 95% comply with the suggested treatment, and 5% of those with occult features where PDT treatment will be benefi cial will self-fund PDT (they are not eligible for government funded treatment for PDT). Greater explanation of the treatment protocols is presented in Sections 2.3.2 and 2.3.3.
2.2.2 Progression and Natural History
For this dynamic study, a key parameter is the rate of progression between visual impairment stages due to AMD. Ultimately slowing progression rates reduces the number of patients that become blind over time.
Early Disease Stage to Mild Visual Impairment
The progression rate for Early Disease Stage7 to mild visual impairment was based on AREDS (2001), due to its large scale, and longitudinal aspects. After fi ve years, the AREDS study found that 20.2% of all people with Early Disease Stage progressed to advanced AMD – or 4.0% per annum8. In other words, 4.0% of Early Disease Stage progress to AT LEAST mild AMD per annum. This rate of progression is similar to a rate of between 2.5% and 4.8% in the Rotterdam Study9 (Klaver 2000) and approximately 4.3% in the BMES Study10 (Mitchell 2002).
7 AREDS defi nition of Early Disease Stage (6/10) is slightly different from the one used in this report (6/12).8 Progression to advanced AMD (defi ned as AMD with visual impairment) over time in AMD category 2 (1.4% of 1063), 3 and 4 (28% of 1621+956) (placebo group). AREDS (2001 p. 1420 and 1423)9 Klaver (2000 found a 5-year risk of developing AMD from Stages 2 and 3 (early stages) of 12.5% and24%, respectively.
10 Mitchell (2002) found 25 subjects who newly developed visual impairment from (i.e. late) AMD over the course of the study (5 years). Assuming that these subjects had early AMD initially, approximately 115 (2313-2198), the progression rate from early to late AMD is approximately 4.3% = (25/115)/5.
Epidemiology
20 Centrally Focussed
Fig
ure
2-3
AM
D P
reva
lenc
e b
y C
linic
al G
rad
ing
AM
D
No
trea
tmen
t
Ext
rafo
veal
50%
Dia
gnos
ed70
% D
iagn
osed
Juxt
afov
eal
Sub
fove
al
80%
Dia
gnos
ed
Cla
ssic
Occ
ult
Cla
ssic
Occ
ult
Cla
ssic
50%
Rel
aser
ed
50%
PD
T
Occ
ult
50%
Rel
aser
ed
50%
PD
T
95%
Gov
t-Fu
ndLP
C23
%*5
% S
elf-
Fund
PD
T23
%*9
5% G
ovt-
Fund
PD
T77
%*9
5% G
ovt-
Fund
LP
C
40%
AM
DR
eocc
urs
5% S
elf-
Fund
PD
T95
% G
ovt-
Fund
PD
T
59%
AM
DR
eocc
urs
Geo
grap
hic
atro
phy
No
trea
tmen
t
Ear
ly A
MD
Late
AM
D
Neo
vasc
ular
33%
67%
8.5%
64%
36%
64%
36%
18.5
%73
%
64%
36%
Sou
rce:
Mar
gher
io (2
000)
, Ols
en (2
004)
, Had
dad
(200
2), M
oiss
eiev
(199
5), e
xper
t op
inio
n.
Epidemiology

21Centrally Focussed
Amsler Charts showing changes caused by AMD
Mild to Moderate Visual Impairment and Moderate to Severe Visual Impairment
The progression rates for mild to moderate visual impairment and moderate to severe visual impairment were based on the progression in the placebo groups in the MPS, TAP and VIP studies (see Table 2-8, Table 2-9 and Table 2-10). As each study focused on a particular sub-type of CNV, the average annual progression rates were weighted depending on the proportion of the sub-type of all CNV. The data show that AMD progression is initially rapid and then slows over time, so that annual progression rates derived after fi ve years are much lower than those derived over one, two or three years. In this study, we have used the two to three year progression rates as an estimate of average annual progression in the aggressive disease stage.
The overall progression rate assumed for mild to moderate visual impairment is 32% and for moderate to severe visual impairment is 46%. The AREDS data focused on early stage disease so derived progression rates from mild to moderate (20%11) and then to severe (12%12) were not considered suffi ciently reliable to include.
These progression rates are slightly higher than those in the MVIP study which were 16%13 and 17% for mild to moderate visual impairment and for moderate to severe visual impairment, respectively. While MVIP included both CNV and geographic AMD, the results were based on a low sample size of 30 eyes and were over fi ve years and consequently the study was not included in this analysis.
Table 2-8 Extrafoveal CNV Natural History
Baseline 3 years 5 yearsEarly Disease Stage 57% 22% 17%Mild 42% 8% 10%Moderate 1% 18% 14%Severe 0% 52% 60%
Based on 117 eyes in the placebo group.
Sources: MPS (1986, Table 2/3) and MPS (1991a, Table 2)
Table 2-9 Juxtafoveal CNV Natural History
Baseline 3 yearsEarly Disease Stage 32% 7%Mild 52% 18%Moderate 12% 14%Severe 4% 62%
Based on 249 eyes in the placebo group.
Sources: MPS (1990, Table 2/3)
11 Of people in Categories 3 and 4 (placebo groups), 29% experienced a decrease in visual acuity to worse than 6/20 (moderate to severe) in at least 1 eye. Assuming none of those in Category 2 experienced a similar decrease in visual acuity, 20.5% of all people with Early Disease Stage progressed to AT LEAST moderate AMD after 5 years – in other words 100% (at least 20% per annum) of peoplewho experienced mild AMD then progressed to moderate AMD after 5 years. AREDS (2001 p. 1424)12 Of people in Categories 3 and 4 (placebo groups), 17% experienced a decrease in visual acuity to worse than 6/30 (moderate to severe) in at least 1 eye. Assuming none of those in Category 2 experienced a similar decrease in visual acuity, less than 12.0% of people with Early Disease Stage progressed to severe after 5 years (or 59% of those who had progressed to moderate, or 12% per annum). AREDS (2001 p. 1425)13 After 5 years, of 30 eyes who had AMD, 4 had reached mild, 3 had reached moderate, and 15 had reached severe visual impairment. Consequently over that period 22 eyes had mild visual impairment at some stage, 18 had moderate and 15 had severe. Therefore progression from mild to moderate was 81% (18/22) over the 5 years or 16% per annum, and progression from moderate to severe was 83% (15/18) over the 5 years or 17% per annum.
Epidemiology

22 Centrally Focussed
Table 2-10 Subfoveal CNV Natural History
Baseline 2 years 4 yearsMPSEarly Disease Stage 0% 0% 0%Mild 15% 5% 1%Moderate 49% 8% 10%Severe 36% 88% 89%TAP/VIPEarly Disease Stage 5% 4%Mild 58% 16%Moderate 37% 28%Severe 0% 52%
Based on 117 eyes in the placebo group.
Sources: MPS (1991b, Table 3/4), TAP reports and VIP reports.
Table 2-11 Mild to Moderate and Moderate to Severe Progression Rates
Mild to Moderate Moderate to SevereExtrafoveal (8.5% weighting) Over 3 years 27% 33% Over 5 years 15% 20% Extrafoveal Overall 21% 27%
Juxtafoveal (18.5% weighting) Over 3 years 22% 33% Juxtafoveal Overall 22% 33%
Subfoveal (73% weighting) Over 2 years, MPS 35% 50% Over 4 years 23% 25% Over 2 years, TAP/VIP 36% 50% Subfoveal Overall 31% 42%Progression Rates (all) 29% 39%Progression rates (2-3 year results) 32% 46%
Comparison to Incidence Rates
Given current rates of prevalence and the progression rates listed above, in 2005 incidence14 of late AMD (mild visual impairment) in 40+ year olds is 0.10% per annum. This rate is similar to 0.10% in MVIP, 0.18% in BDES and 0.22% in BMES (Mukesh 2004, 1179). The 2005 incidence of moderate visual impairment in 40+ year olds is 0.04% per annum and severe visual impairment in 40+ year olds is 0.11% per annum.
2.2.3 Remission
Currently there is no natural remission in AMD (to either no disease or an earlier stage of the disease), nor any current treatments that improve visual acuity. Consequently the remission rate for every stage of the disease is nil.
2.2.4 Mortality
General population mortality rate forecasts are from the Access Economics Demographic Model (AE-DEM) of the Australian population (see Section 2.2.5 for more information).
The mortality rate of AMD is assumed to be determined by the person’s level of visual acuity because the person does not die from AMD itself but by the higher risk of other complications such as higher rates of accidental falls, isolation and depression (which
14 The denominator is the whole population.
Epidemiology

23Centrally Focussed
are implicit in the calculation of the relative risk of mortality). The relative risk of mortality for each stage is based on a linear adjustment of that contained in CERA (2004, 25) which was based on MVIP data, with moderate visual impairment as the mid point:
Unity for Early Disease Stage;
1.67 for mild15,
2.34 for moderate and
3.01 for severe VI16.
The aetiological fraction of mortality due to AMD (as opposed to the number of people who died) was 0.83% based on CERA (2004, 37).
2.2.5 Population
General population forecasts are from the Access Economics Demographic Model (AE-DEM) of the Australian population.
AE-DEM uses a combination of fertility, mortality and migration rates forecasts to project the future Australian population. Base fertility and mortality profi les for each age and gender (for mortality) are sourced from Productivity Commission (2005), and adjust over time to match the projection for the total value. Migration rates are forecast in line with the assumptions in the ABS (forthcoming), with adjustments for changes to Australia’s migration program (that is, an additional 20,000 migrants each year). There are also some initial adjustments to refl ect the latest actual migration (international and interstate) results.
2.3 Treatment Options2.3.1 Diet
Several studies have examined a link between dietary supplements and progression of AMD in people who have a disease. The model distinguishes this from antioxidant supplements as a preventive intervention (see Section 2.1.5).
Evans (2002) summarises, in a Cochrane review, the fi ndings of seven randomised controlled trials (RCTs) which randomised 4119 people with signs of AMD, and compared an antioxidant vitamin and/or mineral supplement to control. The majority of people (88%) were randomised in one trial (the AREDS study) that found a modest benefi cial effect of antioxidant and zinc supplementation (but not antioxidants alone) on progression of AMD (OR 0.72, 99% CI 0.52-0.98). For this group, 28% of controls progressed to moderate or severe AMD compared to 20% in the treatment group over fi ve years.17 This translates to a slowing in the rate of progression of AMD by 25% over fi ve years. The effect was seen more strongly in people with moderate disease than mild disease. There were few events in people with early stage disease.
Two studies (Hopley et al, 2004b; Trevithink et al, 2004) found that treatment with antioxidants plus zinc according to the AREDS recommendations was cost effective.18
More recent studies include Bartlett and Eperjesi (2003) which reviewed seven RCTsinvestigating the role of nutritional supplementation in AMD. Only three of the trials reported a positive effect of supplementation – AREDS, the Lutein Antioxidant 15 Halfway between 1 and 2.3416 2.34 plus 0.67 (the difference between 1 and 1.67 or between 1.67 and 2.34).17 People were less likely to lose 15 or more letters of visual acuity (akin to moving at least 1 category of vision impairment i.e. from mild to moderate or moderate to severe AMD) with an OR of 0.79 (signifi cant at 95% but not at 99%).18 Sourced from Bylsma and Guymer (2005), with no defi nition of cost-effectiveness.
•
•
•
•
Costs of eye care will continue to increase faster than population growth because of the increasing proportion of older people
2.3 Treatment Options

24 Centrally Focussed
Supplementation Trial (LAST) which had only 90 people with AMD, Richer et al, 2004) and the oral zinc trial by Newsome et al (1988). The latter trial found no differences except in large treatments (and other study results of zinc alone are mixed) while the AREDS study was on a subgroup of the population.
Hogg and Chakravarthy (2004) reviewed all published case control, population-based, and interventional studies on AMD and concluded that:
“Although initial support appeared to be moderate and somewhat contradictory, the evidence that lifetime oxidative stress plays an important role in the development of ARM is now compelling. The positive outcomes in the Age-Related Eye Diseases Study, a major controlled clinical trial, have given hope that modulation of the antioxidant balance through supplementation can help prevent progression to AMD.”
This conclusion appears largely based on the AREDS fi nding and, while the hope is undeniable, the evidence is certainly still “moderate and somewhat contradictory”.
In contrast, Bartlett and Eperjesi (2004) conclude that:
“Statistical analysis was restricted to a subgroup of categories 3 and 4, which goes against standard clinical trial practice. AREDS investigators state that subgroup analysis was appropriate in this case as only 15 of the expected 50 category 2 participants developed AMD… The statistical analysis method used by the AREDS Group does not allow the calculation of R, so that a measure of the degree of precision of this experiment cannot be determined… The result of this trial may support the oxidative stress hypothesis for development of AMD. Unfortunately, it is not known whether this effect was initiated by one or all of the nutrients, and to what degree. There was no statistically signifi cant evidence to show that the intervention slowed the progression of ARM.”
Any long term benefi ts of the carotenoids lutein and zeaxanthin have not been proven, although the small LAST study supported a possible therapeutic role of lutein. Other studies show no benefi cial effects from a multivitamin supplement, a high dose of vitamin E alone, or vitamin E with beta carotene.
For the model base case, for those with AMD the OR of diet supplements as a treatment is unity.
Were a scenario to be modelled, a suggestion would be that for those with moderate AMD the OR of treatment with zinc plus antioxidant supplements in AREDS dosages may reduce progression to severe AMD from 28% to 20% over 5 years.
2.3.2 Laser Photocoagulation (LPC)
The Macular Photocoagulation Study (MPS) guidelines state that LPC treatment is only for eyes with classic extrafoveal or juxtafoveal neovascular AMD, or in some cases, classic subfoveal neovascular AMD (Haddad, 2002).
As classic subfoveal neovascular AMD is now better treated with PDT, it is highly unlikely this latter group will undergo LPC surgery. Furthermore, patients with classic juxtafoveal neovascular AMD with a relatively small distance between the foveal edge and the centre of the lesion are now better treated with PDT (approximately 22.8% of juxtafoveal cases).
At present less than 20% of those with
AMD can be treated to either retain or
improve vision
Treatment Options

25Centrally Focussed
Recurrent or persistent neovascular AMD involving the centre of the fovea occurs in:
59% of extra-foveal lesions (MPS study group), and
an estimated 40% of juxtafoveal lesions (expert opinion).
Of these patients, it is assumed that 50% are re-lasered, and 50% of re-lasered patients then receive PDT – thus the average number of LPC treatments per patient (across both extrafoveal and juxtafoveal neovascular AMD) is 1.23.
In the base case it is also assumed that:
95% compliance rate for patients eligible for Medicare or DVA funding,
No individuals with occult extrafoveal or juxtafoveal neovascular AMD receive LPC treatment because the lesions are not well defi ned enough to laser confi dently (thus 34.2% of diagnosed patients with extrafoveal neovascular AMD are lasered19, and 26.4% of diagnosed patients with juxtafoveal neovascular AMD are lasered20),
50% of patients with extra-foveal neovascular AMD are diagnosed and are referred to a specialist, and
70% of patients with juxtafoveal neovascular AMD are diagnosed and are referred to a specialist.
Thus in the base case, 3.2% of all active lesions are estimated to be treated with LPC21.
Re-lasering occurs in an estimated 50% of cases where AMD reoccurs, which in turn is estimated as 59% of extrafoveal lasered cases and 40% of juxtafoveal lasered cases (based on expert opinion).
Thus, in the base case, 0.74% of all active lesions are re-lasered, a total of 4.0% for both treatments .
Current Medicare treatment costs for LPC per treatment are estimated as $621, consisting of $129 for an angiogram, $73 for an initial specialist consultation, $36 for a review specialist consultation, and $383 for the laser surgery.
Effi cacy
For well-defi ned extrafoveal neovascular AMD, 46% of treated versus 64% of untreated eyes had severe vision loss (of at least six lines) at fi ve years (Bylsma and Guymer, 2005, review of MPS studies).
In juxtafoveal cases, 52% of treated versus 61% of untreated eyes suffered severe vision loss at fi ve years.
Twice as many treated patients retained 6/12 or better vision, despite only a small difference in mean visual acuity at fi ve years.
The model base case allows for treatment of classic extrafoveal and juxtafoveal AMD lesions with LPC, lessening the rate of visual acuity loss to severe over fi ve years (modelled linearly) from:
19 95% of classic extra-foveal (36% of cases are classic) receive LPC i.e., 95%*36% = 34.2%.20 Of the people with juxtafoveal AMD, 95% of those with classic juxtafoveal that is not better treated with PDT (36% of cases are classic and 77.2% are not eligible for PDT), receive LPC i.e. 95%*77.2%*36% = 26.4%.21 Of all incidence AMD, 67% is neovascular, of which 8.5% is extra-foveal (50% is diagnosed and then 34.2% is treated with LPC) and 18.5% is juxtafoveal (70% is diagnosed and then 26.4% is treated with LPC).
•
•
•
•
•
•
Treatment Options

26 Centrally Focussed
Patient undergoing PDT
64% to 46% for extrafoveal cases; and
61% to 52% for juxtafoveal cases.
With 8.5% of eyes being extrafoveal and 18.5% of eyes being juxtafoveal, this results in an approximate 19% reduction of progression of visual acuity loss over time.
2.3.3 Photodynamic Therapy (PDT)
PDT in Australia
In 2002, the Australian government announced funding for PDT treatment with verteporfi n (Visudyne) for those with subfoveal predominantly classic choroidal neovascularisation where visual acuity was at least 6/60 (i.e. not severe). All patients referred by an ophthalmologist for treatment are entitled to a full refund for the fi rst treatment. Then, if they meet the aforementioned criteria, treatments 2 to 4 will also be reimbursed. All patients undergoing a fi fth treatment will again have this fully reimbursed and a new round of medical checks is required to access reimbursements for treatments 6 to 10. There are currently no funds available to reimburse treatments beyond the tenth.
A study (Bylsma et al, in press) of the fi rst three years of the government program to fund PDT revealed that:
Cost per treatment is A$2,506.73 in 2002 dollars (or A$2,892.25 in 2005 dollars), which includes the cost of the drug, its administration and associated angiography and medical consultancy fees.
Overall 86.6% of claims for treatments 2-4 were accepted for funding, and 99.8% of claims for treatments 6-10 were accepted for funding.
Although the fi rst treatment is reimbursed regardless of eligibility, 13.4% of fi rst treatments were deemed ineligible (the TAP study has a rejection rate of 10%). There is some evidence for the benefi t of PDT in occult neovascular AMD for smaller lesions. Government funding for these types is not currently available.
In the period June 2002-April 2005, the total number of treatments that received funding was for 19,684 eyes; approximately 6,663 occurred in the period May 2004-April 2005 (see Table 2-12).
On average, each patient received 3.3 treatments – lower than an average of 5.6 and 4.9 over the fi rst two years of treatment in TAP Study Group and MVIP, respectively.
Based on the number of claims for the fi rst treatment, the incidence of subfoveal predominantly classical choroidal neovascularisation secondary to macular disease in Australia is around 2,000 eyes per annum. Of these patients about 90% are specifi c to AMD with 10% arising from other causes.
In the period June 2002-April 2005, there were 1,172 patients who started self-funded therapy compared with 6812 patients who received Medicare or DVA funding for the fi rst treatment in the same period. Thus around 15% of patients who receive PDT treatment, self-funded their therapy. These patients do not meet the criteria for Medicare or DVA funding but PDT treatment might have some benefi t, and for whom LPC treatment is not an option – consequently these individuals are most likely to have subfoveal, occult neovascular AMD.
•
•
•
•
•
•
•
•
•
Treatment Options

27Centrally Focussed
Table 2-12 Eyes that Undergo PDT treatment, May 2004-April 2005
Received Medicare or DVA funding
Rejection Rate
For treatment 1 2,052 0%For treatment 2-4 3,179 13.4%For treatment 5 510 0%For treatment 6-10 922 0.2%Total Treatments 6,663 7%
Treatment with PDT is typically spread out over a number of years, with a majority of the treatment occurring in the fi rst two years. Due to government funding becoming available only in 2002, there is not enough data for a distribution beyond three years to be replicated based on Medicare/DVA data. Consequently, the distribution of when PDT treatment occurs is based on the distribution experienced in the TAP Study Group scaled so that the average number of treatments received in the fi rst 2 years matches that experienced by patients who receive funding under Medicare/DVA (see Table 2-13) and it is assumed that the number of treatments in years 4 and 5 is nil.
Table 2-13 When PDT Treatments Occur
TAP VIP This StudyYear 1 3.4 3.1 2.0Year 2 2.2 1.8 1.3Year 3 1.3 0.8Year 4 0.4 0Year 5 0.1 0Average in fi rst 2 years
5.6 4.9 3.3
Source: TAP Study Group (2002) and VIP Study Group (2001)
In the base case it is also assumed that:
95% compliance rate for patients eligible for Medicare or DVA funding,
5% of individuals with subfoveal, occult neovascular AMD self-fund PDT treatment (thus 37.4% of diagnosed patients with subfoveal neovascular AMD receive PDT treatment22), and
80% of patients with subfoveal neovascular AMD are diagnosed and are referred to a specialist.
5% of individuals with occult juxtafoveal neovascular AMD self-fund PDT treatment (thus 8.5% of diagnosed patients with juxtafoveal neovascular AMD receive PDT treatment23),
Thus in the base case, 15.3% of all active lesions are estimated to be treated with PDT24.
Secondary PDT therapy occurs in an estimated 50% of re-lasered cases of extrafoveal and juxtafoveal AMD (based on expert opinion), or an additional 0.40% of active lesions.
22 95% of classic subfoveal (36% of cases are classic) plus 5% of occult subfoveal (64% of cases are occult) receive PDT treatment i.e., 95%*36% + 5%*64% = 37.4%.23 5% of occult juxtafoveal that is better treated with PDT (64% of cases are occult and 22.8% are eligible for PDT) plus 95% of those with classic juxtafoveal that is better treated with PDT (36% of cases are classic and 22.8% are eligible for PDT), receive PDT i.e., 5%*64%*22.8%+ 95%*36%*22.8% = 8.5%.24 73% of patient have subfoveal AMD * 80% diagnosed * 37.4% receive PDT treatment + 18.5% of patients have juxtafoveal AMD * 70% diagnosed * 8.5% receive PDT treatment.
•
•
•
•
Treatment Options
Laser treatment as part of PDT

28 Centrally Focussed
Thus, in the base case, a total of 15.7% of all active lesions are treated with PDT. 25
Treatment Effi cacy
The impact of PDT with verteporfi n on progression rates is based on the fi ndings from the TAP and VIP trials, which is summarised in Table 2-14 (TAP Study Group, 2002; VIP Study Group, 2001). It should be noted that vision loss of at least 15 letters is broadly equivalent to a worsening of one severity category, eg from early stage disease to mild vision impairment, from mild to moderate, or from moderate to severe. Vision loss of at least 30 letters is broadly equivalent to a worsening of two severity categories.
Overall, in the TAP studies, at two years, 59% of those treated with PDT lost fewer than 15 letters compared with 31% who lost this amount and were on placebo.
There was also a difference in the mean visual acuity loss between the two groups with the treated eyes losing 2.2 lines less at both 12 and 24 months26.
Table 2-14 PDT Effi cacy, Visual Acuity
Type Vision Loss End point visual acuity>= 15 letters >= 30 letters >+ 6/60 VA
TAPPredominantly Classic12 months 33% / 61%24 months 41% / 69% 15% / 36% 56% / 32%VIPOccult and min classic24 months 54% / 67% 30% / 47%Occult
24 months 55% / 68% 29% / 47%
% of treated group / % of untreated group
Assuming only those in the mild or moderate stages receive treatment27, and 91% of those who are treated have classic AMD while 9% have occult AMD28, then we assume in the base case PDT lessens the progression of visual acuity loss according to the matrix in Table 2-15.
25 Of all incidence AMD, 67% is neovascular, of which 8.5% is extrafoveal (50% is diagnosed, 34.2% is treated with LPC, 59% reoccur, 50% are re-lasered, 50% are treated for PDT), 18.5% is juxtafoveal (70% is diagnosed, of which 26.4% is treated with LPC, 40% reoccur, 50% are re-lasered, 50% are treated for PDT and 8.5% are treated with PDT outright), and 73% are subfoveal (80% is diagnosed, 37.4% is treated with PDT).26 In addition, Bylsma and Guymer (2005) note that 16% of treated / 10% of untreated showed an increased in visual acuity in the TAP study. This is further supported by Schachat et al (2005) who found that PDT treatment doubled the chance of stabilisation with around 1 in 6 showing an improvement.27 Even though it is desirable to treat early, the evidence suggests that almost all people who receive treatment have mild and moderate visual impairment, as those in the severe stage do not currently receive government funding.28 Based on 36% of eyes are classic (with 95% complying with treatment) and 67% are occult (with 5% self funding treatment).
Treatment Options
Intravitreal injection for AMD

29Centrally Focussed
Table 2-15 PDT Effi cacy, Modelled AMD Progression
Stage Starting prevalence (%)
Treated at 2yrs (%)
Untreated at 2yrs (%)
Reduction in Progression
(% per annum)Early Disease Stage
0.0 0.0 0.0 0
Mild 50.0 28.9 15.5 -21.8Moderate 50.0 41.9 31.5 -20.8Severe 0.0 29.2 52.9
Sources: TAP Study Group (2002) and VIP Study Group (2001).
2.4 Disease Costs2.4.1 Loss of Wellbeing
Loss of wellbeing is estimated using Disability Adjusted Life Years (DALYs) and applying the lower bound value of a statistical life (VSL) of $3.7 million to yield the estimated value of a life year of $162,561 (CERA, 2004). Years of healthy life lost due to disability (YLD) are estimated on the basis of two weighting systems: AIHW weights and CERA weights.
AIHW Weights
Basic AIHW weights are only for the disease and do not take into account comorbidity, such as that between AMD, accidental falls and depression. The weights are not additive so, for example, adding the weights for a person with severe AMD and severe depression results in a weight greater than 1. Consequently, the following formulas were used:
DEPVAVADEPVA WWWW ⋅−+= )1(,
FALLVAVAFALLVA WWWW ⋅−+= )1(,
FALLDEPVADEPVAFALLDEPVA WWWW ⋅−+= )1( ,,,,
where W is the disability weight, VA denotes the severity of visual acuity (Early Disease Stage, Mild, Moderate or Severe), DEP denotes depression and FALL denotes a fall.
Using the AIHW weighting for accidental falls of 0.141 and a weighting of 0.223 for depression, based on 20% of AMD suffers experiencing mild depression with a weighting of 0.140 and 5% of AMD sufferers experiencing moderate to severe depression with a weighting of 0.555 (see Section 2.4.2.5 for the evidence basis for comorbid depression and Mathers et al, 1999, for the derivation of the respective disability weights).
Table 2-16 AIHW Disability Weightings
Early Disease Stage
Mild Moderate Severe
AMD only 0.000 0.020 0.170 0.430AMD and depression 0.223 0.239 0.355 0.557AMD and accidental falls 0.141 0.158 0.287 0.510AMD, depression and accidental falls
0.333 0.346 0.446 0.620
Visual impairment decreases the quality and length of life. It increases morbidity and mortality
2.4 Disease Costs

30 Centrally Focussed
CERA weights
The model also has the option of applying the CERA weight for visual impairment of 0.83 for all levels of visual acuity. No additional adjustment for falls and depression are made if CERA weights are used. It should be noted that using the same disability weight for all levels of severity of AMD would substantially reduce the benefi ts of slowing progression of AMD.
2.4.2 Health System Costs
Data on health system costs are from AIHW (special request). The AIHW include only 86% of total recurrent health expenditure in their estimates of expenditure by disease and injury, referred to as ‘allocated’ health expenditure. The ‘unallocated’ remainder includes capital expenditures, expenditure on community health (excluding mental health), public health programs (except cancer screening), health administration and health aids and appliances. Allowance has been made for the unallocated components in the following sections on health costs. To avoid double counting, it is required to net out any costs counted elsewhere, such as aids and modifi cations, which would be already included in this ‘unallocated’ remainder. However, in this case, a majority of these costs are provided by community programs (rather than governmental programs), thus netting out these costs is not required.
Health cost infl ation from 2005 onwards was assumed to be 3.2%, based on the average health cost infl ation over the period to 1992-93 to 2002-03 (AIHW 2005, p10). The assumed proportion of health costs borne by the government (67.9%) and the individual (20.3%) is based on AIHW (2005, p25).
Table 2-17 Health Costs by Who Bears the Cost, 2003-04
Federal Government
State/Territory Government
Private Health Insurance
Individuals Other Total
% 45.6% 22.3% 7.1% 20.3% 4.6% 100.0%
Source: AIHW (2005), p25.
2.4.2.1 General Health Cost of AMD
General health system costs are assumed to be $397 per person per annum (based on the Better eye) or $271 per person for annum (based on the Worse eye) – estimated by dividing the total health costs for AMD ($19.4m), adjusted for the unallocated health expenditure and to remove aged care, indexed to 2005 based on health infl ation minus the total expected LPC costs by the prevalence of visual impairment in that eye in 2005. Thus this represents the estimated cost of all health care for people with AMD in the absence of LPC, PDT or other therapy and could be regarded as a basic monitoring cost of the AMD itself.
2.4.2.2 Additional Base Treatment Costs
The model is forward looking in terms of treatments – if a patient starts on a treatment pathway in 2005 or any other year going forward then the model estimates all health system costs for that person. However, some patients may have started PDT treatment in a year prior to 2005 and may still be receiving treatment in 2005 or 2006 (as PDT treatments are incurred in the base case for three years). Thus the model must also add additional health system costs for these two years.
For these years it is assumed that the number of people who started treatment in
Cost of vision impairment and
blindness in Australia was $9.85bn in 2004
Patient using a vision aid device
Disease Costs

31Centrally Focussed
2005 was similar to the number of people who started treatment in 2003 and 2004. In 2005 the number of people who started treatment in 2003 (adjusted for mortality) will receive their third year treatment round (0.8 treatments per person), while those who started in 2004 (adjusted for mortality) will receive their second year treatment round (1.3 treatments per person) and then in 2006 these people will receive their third year treatment round (0.8 treatments per person).
This amounts to additional health expenditure costs of $19.5 million in 2005 and $7.2 million in 2006 based on the worse eye, or $12.1 million in 2005 and $4.3 million in 2006 based on the better eye. These costs are hard-entered into the model so that any changes in assumptions made by the user do not impact these health system cost adjustments.
2.4.2.3 Aged Care
Visual impairment compounds the presence of other disabling conditions, leading to an increased likelihood of utilising institutionalised aged care. The Blue Mountains Eye Study found a relative risk of nursing home admission for a person with visual impairment of 1.8 (Wang 2002, 3). In this model for people with Early Disease Stage the OR of being in an aged care facility is assumed to be unity, while for Mild, Moderate and Severe visual impairment the OR of being employed is based on a linear adjustment, with moderate visual impairment as the mid point:
1.4 for mild,
1.8 for moderate, and
2.2 for severe VI.
The OR is applied to the general probability of being in an aged care facility, and the average cost per year of $52,800, from the Access Economics Aged Care Dynamic Cohort Model.
Table 2-18 Probability of Residing in an Aged Care Facility 2004-05
Age % of Population0-54 0.000255-59 0.0260–64 0.1465-69 0.2970–74 0.6075-79 1.4080-84 3.4085-89 8.5190+ 25.4
Access Economics Aged Care Dynamic Cohort Model
2.4.2.4 Falls and Hip Fractures
It is well established that older people are more at risk of falls, and that these falls in turn often cause injuries and additional health expenditures. Many studies have examined the factors underlying increased propensity to fall in the elderly and several have found a signifi cant link between falls and vision loss.
A summary of 12 key fi ndings regarding vision loss and falls or fractures is presented in Table 2-19.
•
•
•
Data show a higher use of social services and admission to nursing homes for people with visual impairment
The number of Australians with blindness or visual impairment will nearly double over the next 20 years
Disease Costs

32 Centrally Focussed
Table 2-19 Falls and Hip Fractures due to Vision Loss, Odds Ratios
Visual acuity OR Source1 loss of ≥ 2 lines cf <2 lines OR of multiple falls = 1.43 Coleman, 20042 <6/12 OR of multiple falls = 1.75 Koski, 19983 poor distance vision OR of multiple falls = 2.3 Koski, 19984 <6/9 in either eye OR of hip fractures = 1.73 Felson et al, 19895 ≤ 6/30 in both eyes OR of hip fractures = 2.17 Felson et al, 19896 ≤ 6/15 Approx OR of hip fracture 2 cf
those with VA >6/9Dargent-Molina, 1996
7 no association found between VA and fractures Cumming et al, 19958 ≤ 6/18 OR of hip fracture = 8.4 Ivers et al, 19989 ≤ 6/12 OR of hip fracture = 1.75 Klein et al, 199810 ≤ 60/60 (face
recognition)OR of hip fracture = 3.1 de Boer et al, 2004
11 ≤ 60/60 (face recognition)
OR of hip fracture = 4.8 Grisso et al, 1991
12 ≤ 6/18 OR of hip fracture = 1.5 Ivers et al, 200013 <6/12 better eye OR of fall at home = 0.98 Vu et al, 2005
OR hip fracture = 1.50<6/12 worse eye OR fall at home = 2.86
OR hip fracture = 1.80
Note: While study 13 is included in the table, results were not able to be included in the analysis due to timing.
The studies distinguish between accidental falls occurring and the expensive and morbid complications of a hip fracture resulting from some falls. Since AIHW data are available that identify both types of costs, these are separated and the ORs from the relevant studies are averaged as follows:
For accidental falls, the average of results from studies 1 and 2 is used; study 3 is excluded as it relates to myopia rather than AMD.
For hip fractures, there is a distinction between:
mild and moderate AMD where the average of fi ve studies is used (4,5,6,9,12) excluding the outliers (7,8); and
severe AMD where the average of two studies is used (10,11).
For those with mild or moderate AMD, the OR of hip fracture is 1.83 and for those with severe AMD the OR of hip fracture is 3.95.
These results are consistent with Black and Wood (2005) who concluded that the OR of falls and fractures from reduced vision lay between 1.5 and 2.0.
The risk of having an accidental fall for a person without AMD is assumed to be equal to the prevalence of accidental falls in the general population.
•
•
-
-
Disease Costs

33Centrally Focussed
Table 2-20 Risk of Accidental Fall (% of Population), 2001
Age Males Females Persons0-4 0.64 0.50 0.575–14 0.83 0.51 0.6815–24 0.74 0.27 0.5125–34 0.55 0.24 0.4035–44 0.44 0.28 0.3645–54 0.42 0.34 0.3855–64 0.47 0.56 0.5165–74 0.75 1.16 0.9675-84 1.78 3.21 2.6185+ 5.07 7.80 6.95All Ages 0.68 0.70 0.69
Source: AIHW, special request.
The cost of an accidental fall per person is based on AIHW, indexed to 2005 dollars.
Table 2-21 Health System Cost of an Accidental Fall ($ per Person), 2005
Age Males Females Persons0-4 8,786 8,032 8,4645–14 7,681 12,108 9,31815–24 8,267 7,929 8,17925–34 7,289 8,354 7,61835–44 7,485 9,857 8,41545–54 8,819 12,552 10,51055–64 11,237 10,958 11,08765–74 13,595 14,156 13,94475-84 14,588 11,409 12,31585+ 15,173 12,321 12,963All Ages 9,691 11,445 10,592
Source: AIHW, special request.
2.4.2.5 Depression
Loss of sight can often cause depression. Most studies to analyse this link fi nd prevalence rates of depression in elderly visually impaired populations of 25%–45% (Burmedi et al, 2002). Within the general elderly population, less than 20% have mild dysphoria with less than 5% suffering from severe depression. Comparing risk from these studies, the relative risk of depression is likely to be in the order of 35%/10%=3.5 times higher risk. Summary results from studies linking vision impairment (including that resulting from AMD) are presented in Table 2-22 below.
Table 2-22 Depression due to Vision Loss, Prevalence
Source FindingBrody et al, 2003 33% depressedKarisson, 1998 Less than 10% depressedKleinschmidt, 1995 22% mildly; 4% moderately to severely depressedRovner et al, 1997 39%-70% depression depending on measurement scale usedWahl, 1994 43% of blind, 29% of visually impaired depressedRobbins et al, 1988 Mean score of 10.3, 10+ indicates depressionVu et al, 2005 OR 6.28 for health and emotional problems; OR 4.7 for ‘not full of life’
Source: Burmedi et al (2002).
Vision disorders represent nearly 3% of the total disability burden of disease
Disease Costs
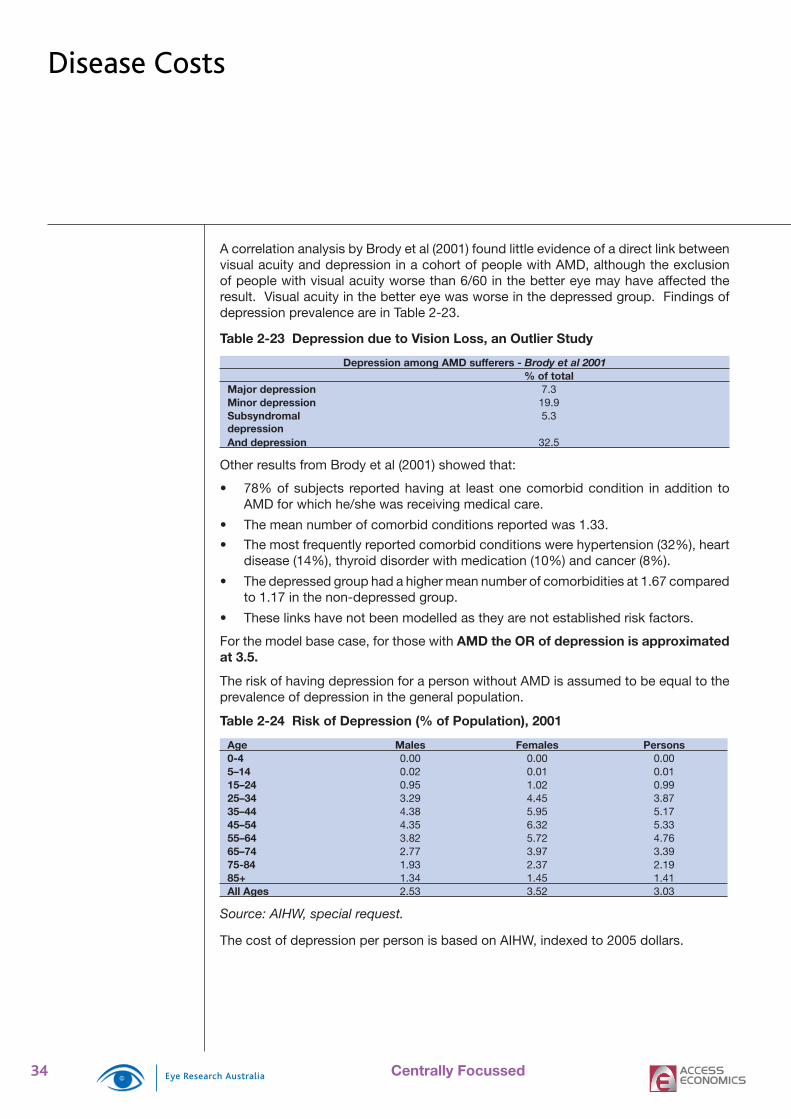
34 Centrally Focussed
A correlation analysis by Brody et al (2001) found little evidence of a direct link between visual acuity and depression in a cohort of people with AMD, although the exclusion of people with visual acuity worse than 6/60 in the better eye may have affected the result. Visual acuity in the better eye was worse in the depressed group. Findings of depression prevalence are in Table 2-23.
Table 2-23 Depression due to Vision Loss, an Outlier Study
Depression among AMD sufferers - Brody et al 2001% of total
Major depression 7.3Minor depression 19.9Subsyndromal depression
5.3
And depression 32.5
Other results from Brody et al (2001) showed that:
78% of subjects reported having at least one comorbid condition in addition to AMD for which he/she was receiving medical care.
The mean number of comorbid conditions reported was 1.33.
The most frequently reported comorbid conditions were hypertension (32%), heart disease (14%), thyroid disorder with medication (10%) and cancer (8%).
The depressed group had a higher mean number of comorbidities at 1.67 compared to 1.17 in the non-depressed group.
These links have not been modelled as they are not established risk factors.
For the model base case, for those with AMD the OR of depression is approximated at 3.5.
The risk of having depression for a person without AMD is assumed to be equal to the prevalence of depression in the general population.
Table 2-24 Risk of Depression (% of Population), 2001
Age Males Females Persons0-4 0.00 0.00 0.005–14 0.02 0.01 0.0115–24 0.95 1.02 0.9925–34 3.29 4.45 3.8735–44 4.38 5.95 5.1745–54 4.35 6.32 5.3355–64 3.82 5.72 4.7665–74 2.77 3.97 3.3975-84 1.93 2.37 2.1985+ 1.34 1.45 1.41All Ages 2.53 3.52 3.03
Source: AIHW, special request.
The cost of depression per person is based on AIHW, indexed to 2005 dollars.
•
•
•
•
•
Disease Costs

35Centrally Focussed
Table 2-25 Health System Cost of Depression ($ per Person), 2005
Age Males Females Persons0-4 0 0 05–14 18,544 75,852 36,83115–24 2,793 5,659 4,25025–34 1,555 2,296 1,98335–44 1,346 1,831 1,62745–54 1,634 1,870 1,77455–64 1,799 2,167 2,01765–74 2,657 3,610 3,23375-84 5,872 9,304 8,03385+ 17,672 12,551 14,052All Ages 1,915 2,632 2,334
Source: AIHW, special request.
2.4.3 Indirect Costs
Many indirect costs such as productivity impacts, carers and the use of aids and modifi cations are dependent on the level of visual acuity not the reason for the loss of vision (such as AMD versus cataracts).
Employment
Since AMD overwhelmingly affects the elderly, very few people with any severity of visual impairment from the disease are employed. In this model for people with Early Disease Stage the OR of being employed is assumed to be unity, while for Mild, Moderate and Severe visual impairment the OR of being employed is based on a linear adjustment of that contained in CERA (2004, p66), with moderate visual impairment as the mid point:
0.75 for mild,
0.5 for moderate, and
0.25 for severe VI.
The ORs are applied to the general employment rates by age from ABS (July 2005) and the Average Weekly Earnings (AWE) rates from ABS (2004), indexed to $2005. Forecasts of AWE were based on Access Economics (2005).
Other Indirect Costs
Other indirect costs per person (such as carer productivity costs, formal care, aids and modifi cations, and other indirect costs) were extracted from the MVIP database for those people with visual acuity loss (indirect costs for individuals without visual impairment are assumed to be nil). Due to high standard deviations in the data, the mean indirect costs across all levels of visual impairment were used, instead of indirect costs by mild, moderate and severe visual impairment.
“Informal care and support” is split between direct costs and lost productivity of the carer based on the ratio contained in CERA (2004, p75). The proportion of “Medicines, products and equipment” that are aids and modifi cations is based on the split used in CERA (2004, p70-72). Carer productivity costs were indexed to 2005 according to AWE over time, while the remaining indirect costs were indexed with health infl ation.
•
•
•
The annual cost of suffering and premature death due to visual impairment is $4.8 billion
Disease Costs

36 Centrally Focussed
Table 2-26 Indirect Costs, ($ per annum), 2005
CostFormal Care 439Lost Productivity of Carer 1544Aids and Modifi cations 337Other Expenses 630
Sources: MVIP, CERA (2004)
2.4.4 Deadweight Losses
The following parameters were used to estimate lost taxes and additional welfare payments from AMD, which in turn underlie the estimation of deadweight losses to the economy.
The average personal income tax rate is stable at 21.20% and the average indirect tax rate is stable at 15.51%, based on the Access Economics Macroeconomic model (AEM).
The current level of disability support per annum of $10,340.20 ($397.70*26 – from www.centrelink.gov.au) is indexed to the AWE and is received by all individuals with visual acuity worse than 6/60 and are aged 15 to 65 (after this age it is likely they would receive the aged pension regardless of their visual acuity)29.
The rate of deadweight loss is 0.275 per $1 of tax revenue raised, based on Productivity Commission (2003), plus 0.0125 per $1 of tax revenue raised for Australian Taxation Offi ce (ATO) administration, and is applied to health system costs incurred by the government, lost taxes, and welfare payments.
2.4.5 Discount Rates
Choosing an appropriate discount rate for present valuations in cost analysis is a subject of some debate, and can vary depending on which future income or cost stream is being considered. There is a substantial body of literature, which often provides confl icting advice, on the appropriate mechanism by which costs should be discounted over time, properly taking into account risks, infl ation, positive time preference and expected productivity gains.
The absolute minimum option that one can adopt in discounting future income and costs is to set future values in current day dollar terms on the basis of a risk free assessment about the future (that is, assume the future fl ows are similar to the certain fl ows attaching to a long term Government bond).
Wages should be assumed to grow in dollar terms according to best estimates for infl ation and productivity growth. In selecting discount rates for this project, we have thus settled upon the following as the preferred approach.
Positive time preference: We use the long term nominal bond rate of 5.8% pa (from recent history) as the parameter for this aspect of the discount rate. (If there were no positive time preference, people would be indifferent between having something now or a long way off in the future, so this applies to all fl ows of goods and services.)
29 If a person on the disability pension is employed, then (depending on the level of income and hours of employment) the amount received may be adjusted slightly downwards. However, given AMD mainly affects older people, and those that receive the pension are permanently blind, the number of people employed would be low and any slight adjust ments downwards would make negligible impact on the results (especially since we only include the deadweight loss of the government expenditure rather than the expenditure itself).
•
•
•
•
•
Disease Costs

37Centrally Focussed
General Infl ation: The Reserve Bank has a clear mandate to pursue a monetary policy that delivers 2 to 3% infl ation over the course of the economic cycle. This is a realistic longer run goal and we therefore endorse the assumption of 2.5% pa for this variable. (It is important to allow for infl ation in order to derive a real (rather than nominal) rate.)
Productivity growth: The Commonwealth Government’s Intergenerational report assumed productivity growth of 1.7% in the decade to 2010 and 1.75% thereafter. We suggest 1.75% for the purposes of this analysis.
Health Infl ation: Health cost infl ation from 2005 onwards is assumed to be 3.2%, based on the average health cost infl ation over the period to 1992-93 to 2002-03 (AIHW 2005, p10). This rate is partially general price infl ation and partially productivity growth. To be on the conservative side, productivity growth in the health sector is assumed to be equal to general productivity growth.
There are then two different discount rates that should be applied:
To discount income streams of future earnings, the discount rate is:5.8 - 2.5 - 1.75 = 1.55%.
To discount health costs, the discount rate is:5.8 - (3.2 - 1.75) - 1.75 = 2.6%.
To discount other future streams (healthy life) the discount rate is:5.8 – 2.5 = 3.3%
While there may be sensible debate about whether health services (or other costs with a high labour component in their costs) should also deduct productivity growth from their discount rate, we argue that these costs grow in real terms over time signifi cantly as a result of other factors such as new technologies and improved quality, and we could reasonably expect this to continue in the future.
•
•
•
•
•
•
Disease Costs

38 Centrally Focussed

39Centrally Focussed
The model is set up so that it can be easily modifi ed to simulate different interventions and to be applied to other eye diseases.
The model is detailed enough to capture the dynamics of the progression and characteristics of a disease, but at the same time broad enough so as to be applicable to other diseases (such as modelling visual impairment in the categories Early Disease Stage, Mild, Moderate and Severe rather than Early/Late AMD, geographic/ neovascular, classic/occult, extrafoveal/juxtafoveal/subfoveal).
Additional functions have been added despite their lack of applicability to AMD, such as fi ve year age groups down to zero years old, and remission rates.
Additional “blank” interventions and risk factors are included and can be easily overwritten.
The model is based in Excel which ensures portability. The model can be easily navigated by clicking on the relevant button on the Main Menu or by clicking on the sheet tabs at the bottom of the window. In order to access and view the sheets with the parameters and the model’s workings, click the Show/Hide Parameter Sheets button.
Figure 3-1 Main Menu
Scenarios can be easily run through the Options sheet, with the output viewed using the PopCharts sheet or the CostCharts sheet.
•
•
•
The model incorporates data on the costs of AMD and known risk factors, the incidence, prevalence and associated mortality, progression rates and the response to treatment
3. The Model

40 Centrally Focussed
Figure 3-2 Options Sheet
Cost effectiveness analysis can also be conducted by running various scenarios and comparing to the base case. Output can be viewed in spreadsheet form using the CEA sheet or in graphic form using the CEACharts sheet.
Prevalence rates are assumed to be the number of people with the disease at the start of the year. During the year people are treated, progress, remiss or die, with the impacts of these pathways on prevalence rates felt at the start of the following year (see Figure 3-3 for a diagram of the model’s logical structure).
Two treatment groups are modelled:
The Base Treatment group – includes those who receive treatment under the current system, and
The New Treatment group – includes those who receive the new treatment under consideration.
The new treatment group can either include those not treated under the current system, or all people regardless of whether they are currently being treated.
•
•
Population data were projected forward by
Access Economics using Australian
Bureau of Statistics data
The Model

41Centrally Focussed
The ModelFi
gur
e 3-
3 M
od
el D
iag
ram
Form
ulae
tha
t d
rive
the
mod
el a
re d
etai
led
in t
he A
pp
end
ix.
Pre
vent
ativ
e Tr
eatm
ent
(Die
t)In
cid
ence
Unt
reat
ed p
reva
lenc
eb
y se
verit
yTr
eatm
ent
optio
nsan
d E
ffica
cyTr
eate
d P
reva
lenc
eb
y se
verit
yTr
eatm
ent
cost
sb
y se
verit
y
Ris
k Fa
ctor
sC
ard
iova
scul
ard
isea
se
Die
tary
fat
inta
ke
Sm
okin
g
Alc
ohol
Oes
trog
en
Ligh
t/C
atar
act
Sur
gery
Mor
talit
y
Ant
ioxi
dan
ts
Fam
ily h
isto
ry
Gen
es
ED
S (N
o V
I)
Mild
VI
Rat
es o
fp
rogr
essi
onan
dre
mis
sion
Mod
erat
e V
I
Sev
ere
VI
Vasc
ular
Oxi
dat
ive
pro
cess
es
Gen
etic
ED
S (N
o V
I)
Mild
VI
Rat
es o
fp
rogr
essi
onan
dre
mis
sion
Mod
erat
e V
I
Sev
ere
VI
Loss
of
wel
lbei
ng
Hea
lth c
osts
avoi
ded
Pro
duc
tivity
&In
dire
ct c
osts
CE
A
Lase
r
PD
T
Ant
i-A
ngio
geni
sis
Oth
er m
edic
alth
erap
ies

42 Centrally Focussed
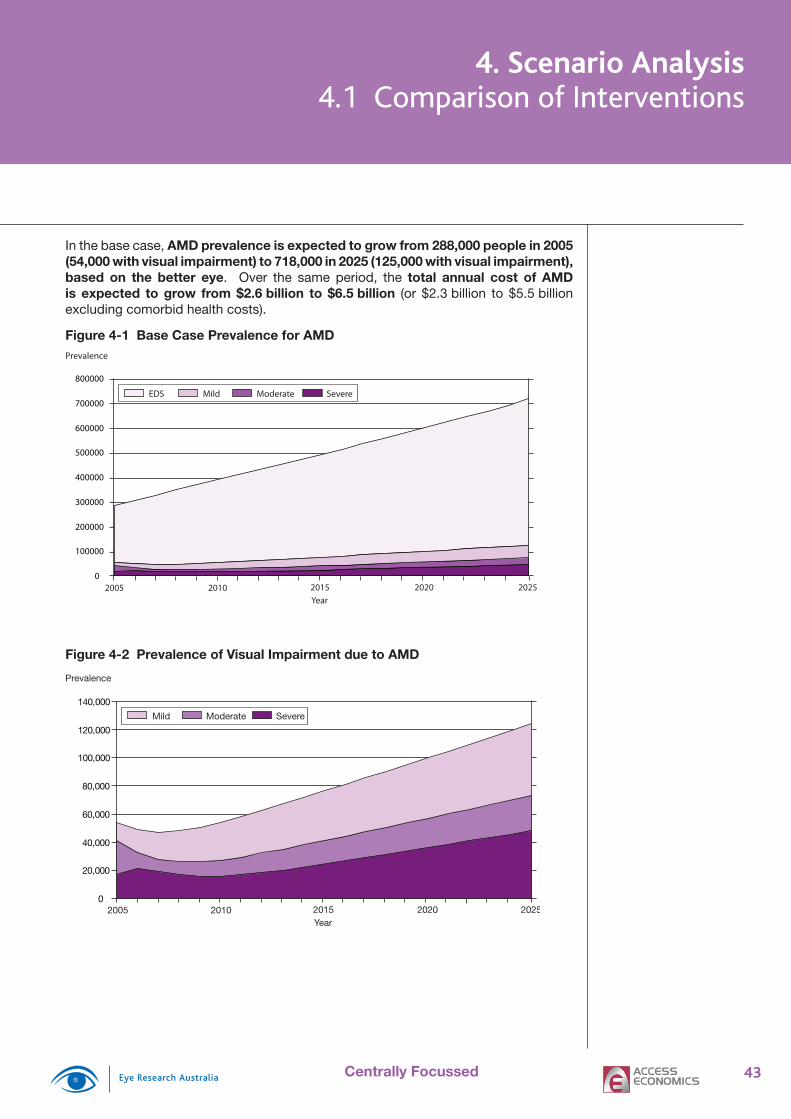
43Centrally Focussed
In the base case, AMD prevalence is expected to grow from 288,000 people in 2005 (54,000 with visual impairment) to 718,000 in 2025 (125,000 with visual impairment), based on the better eye. Over the same period, the total annual cost of AMD is expected to grow from $2.6 billion to $6.5 billion (or $2.3 billion to $5.5 billion excluding comorbid health costs).
Figure 4-1 Base Case Prevalence for AMD
Mild Moderate SevereEDS
2005 2010 2015 2020 2025Year
Prevalence
0
100000
200000
300000
400000
500000
600000
700000
800000
Figure 4-2 Prevalence of Visual Impairment due to AMD
Mild Moderate Severe
2005 2010 2015 2020 2025Year
Prevalence
0
20,000
40,000
60,000
80,000
100,000
120,000
140,000
4. Scenario Analysis4.1 Comparison of Interventions
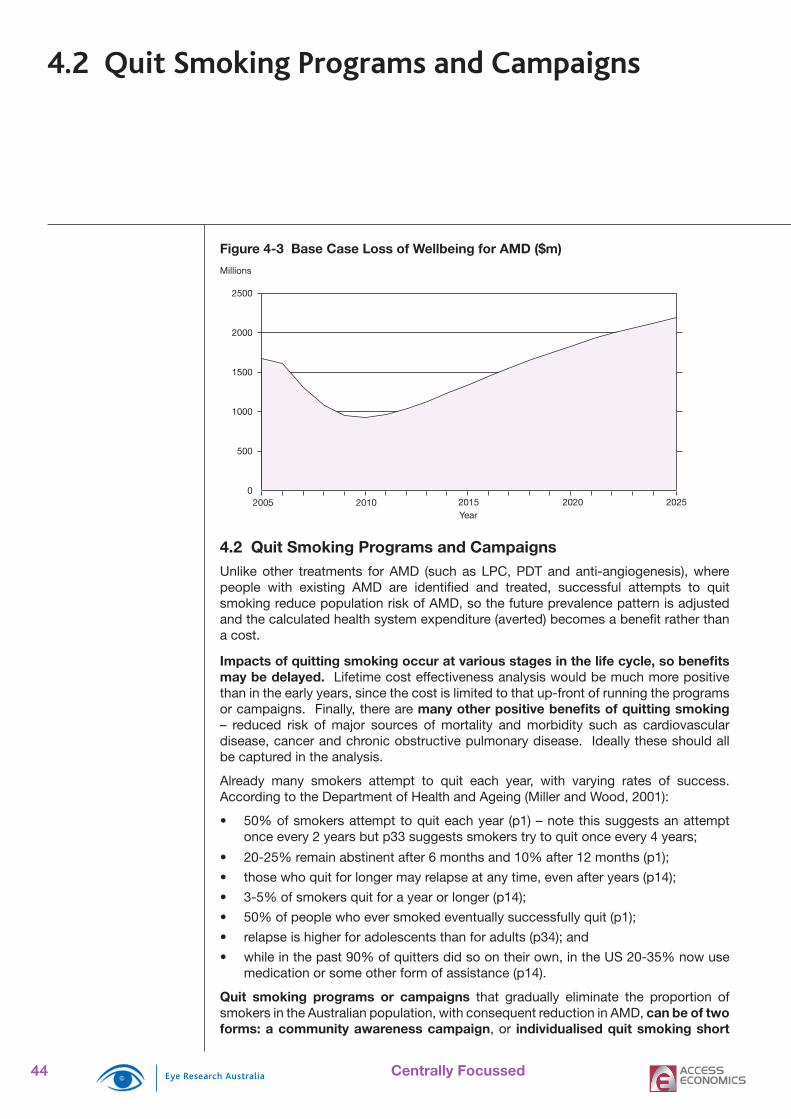
44 Centrally Focussed
Figure 4-3 Base Case Loss of Wellbeing for AMD ($m)
2005 2010 2015 2020 2025Year
Millions
0
500
1000
1500
2000
2500
4.2 Quit Smoking Programs and CampaignsUnlike other treatments for AMD (such as LPC, PDT and anti-angiogenesis), where people with existing AMD are identifi ed and treated, successful attempts to quit smoking reduce population risk of AMD, so the future prevalence pattern is adjusted and the calculated health system expenditure (averted) becomes a benefi t rather than a cost.
Impacts of quitting smoking occur at various stages in the life cycle, so benefi ts may be delayed. Lifetime cost effectiveness analysis would be much more positive than in the early years, since the cost is limited to that up-front of running the programs or campaigns. Finally, there are many other positive benefi ts of quitting smoking – reduced risk of major sources of mortality and morbidity such as cardiovascular disease, cancer and chronic obstructive pulmonary disease. Ideally these should all be captured in the analysis.
Already many smokers attempt to quit each year, with varying rates of success. According to the Department of Health and Ageing (Miller and Wood, 2001):
50% of smokers attempt to quit each year (p1) – note this suggests an attempt once every 2 years but p33 suggests smokers try to quit once every 4 years;
20-25% remain abstinent after 6 months and 10% after 12 months (p1);
those who quit for longer may relapse at any time, even after years (p14);
3-5% of smokers quit for a year or longer (p14);
50% of people who ever smoked eventually successfully quit (p1);
relapse is higher for adolescents than for adults (p34); and
while in the past 90% of quitters did so on their own, in the US 20-35% now use medication or some other form of assistance (p14).
Quit smoking programs or campaigns that gradually eliminate the proportion of smokers in the Australian population, with consequent reduction in AMD, can be of two forms: a community awareness campaign, or individualised quit smoking short
•
•
•
•
•
•
•
4.2 Quit Smoking Programs and Campaigns
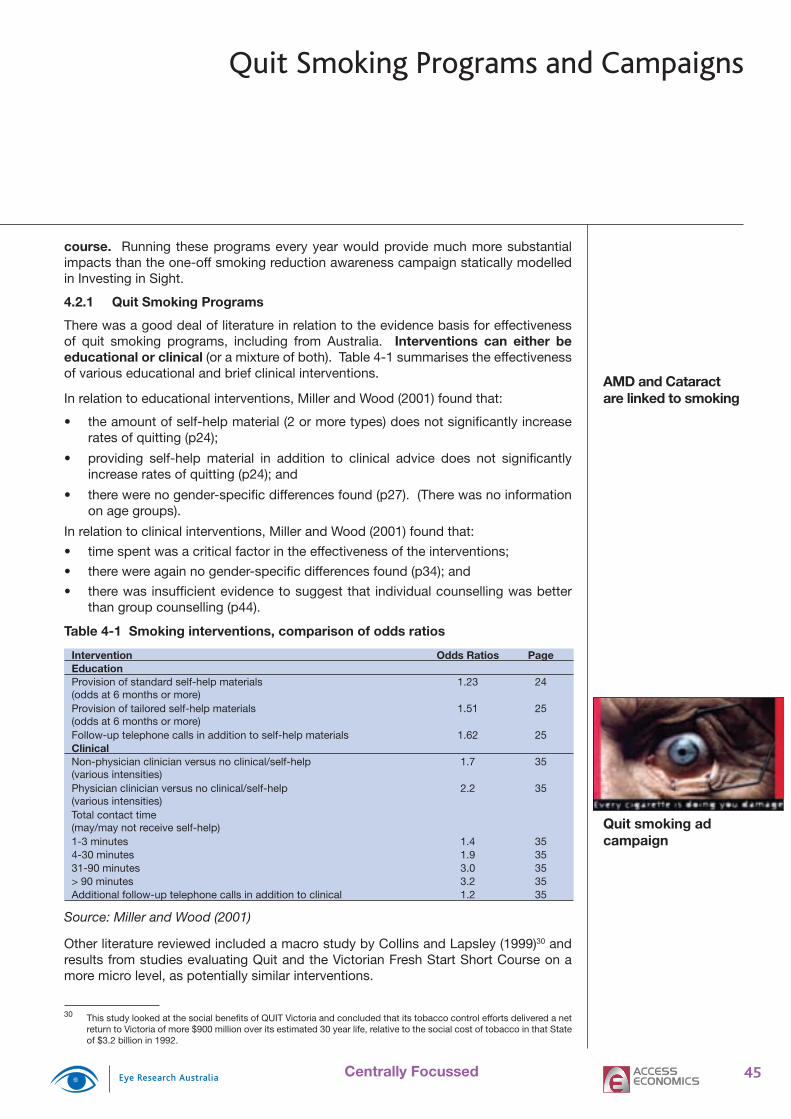
45Centrally Focussed
course. Running these programs every year would provide much more substantial impacts than the one-off smoking reduction awareness campaign statically modelled in Investing in Sight.
4.2.1 Quit Smoking Programs
There was a good deal of literature in relation to the evidence basis for effectiveness of quit smoking programs, including from Australia. Interventions can either be educational or clinical (or a mixture of both). Table 4-1 summarises the effectiveness of various educational and brief clinical interventions.
In relation to educational interventions, Miller and Wood (2001) found that:
the amount of self-help material (2 or more types) does not signifi cantly increase rates of quitting (p24);
providing self-help material in addition to clinical advice does not signifi cantly increase rates of quitting (p24); and
there were no gender-specifi c differences found (p27). (There was no information on age groups).
In relation to clinical interventions, Miller and Wood (2001) found that:
time spent was a critical factor in the effectiveness of the interventions;
there were again no gender-specifi c differences found (p34); and
there was insuffi cient evidence to suggest that individual counselling was better than group counselling (p44).
Table 4-1 Smoking interventions, comparison of odds ratios
Intervention Odds Ratios PageEducationProvision of standard self-help materials (odds at 6 months or more)
1.23 24
Provision of tailored self-help materials (odds at 6 months or more)
1.51 25
Follow-up telephone calls in addition to self-help materials 1.62 25ClinicalNon-physician clinician versus no clinical/self-help (various intensities)
1.7 35
Physician clinician versus no clinical/self-help (various intensities)
2.2 35
Total contact time (may/may not receive self-help)1-3 minutes 1.4 354-30 minutes 1.9 3531-90 minutes 3.0 35> 90 minutes 3.2 35Additional follow-up telephone calls in addition to clinical 1.2 35
Source: Miller and Wood (2001)
Other literature reviewed included a macro study by Collins and Lapsley (1999)30 and results from studies evaluating Quit and the Victorian Fresh Start Short Course on a more micro level, as potentially similar interventions.
30 This study looked at the social benefi ts of QUIT Victoria and concluded that its tobacco control efforts delivered a net return to Victoria of more $900 million over its estimated 30 year life, relative to the social cost of tobacco in that State of $3.2 billion in 1992.
•
•
•
•
•
•
AMD and Cataract are linked to smoking
Quit smoking ad campaign
Quit Smoking Programs and Campaigns
46 Centrally Focussed
The latter report, produced by the Cancer Council Victoria (Germain et al, 2004) features face-to-face contact and group support (also found in the standard Fresh Start courses) through two three-hour sessions, held approximately two to three weeks apart, and Quitline telephone support between the sessions and after course completion. Assuming that all of those who did not complete each profi le were still smoking, the abstinence rate was 4% prior to the course, 23% at the end of the second session, 17% at the 3-month follow-up, and 16% at the 12-month follow-up (taken as a percentage of the original sample). Daily consumption was 21 cigarettes per day prior to the course, 14 per day at the end of the second session, 16 per day at the 3-month follow-up and 18 per day at the 12-month follow-up. All consumption rates were signifi cantly lower.
In comparison, Fresh Start standard courses typically consist of eight 90-minute sessions, run twice a week, over a period of four weeks. Previous research has shown that successful quit rates 12 months after the completion of a Fresh Start course have ranged from 16% for participants attending workplace courses, to just over 21% for participants in community-based courses.
We used these Fresh Start results (16%) as the intervention effectiveness for the Quit Smoking Program intervention.
Typical costs of this type of course are $800 for 12 people, or $67 per person (expert opinion). For ease of comparison with the Community Awareness Campaign, the target populations is aged 15 to 40 years. In the scenario, all smokers in the target population attend the course every year the program is run.
4.2.2 Community Awareness Campaign
This intervention was modelled on the successful National Tobacco Campaign (NTC). During a six month campaign in 1997, the NTC campaign promoted the Quit program through TV ads, print media, a campaign website, and a national Quit line. The NTC campaign was extensive, with Federal contributions of $7.1 million and further contributions from the State governments of $1.85 million. A conservative estimate of the costs of running a similar campaign would put the cost at around $3.7 million (DHA, 2000, p 221).
The Department of Health and Ageing released a research report into the effectiveness of the NTC in April 2004. The report presented results from a questionnaire of randomly selected individuals. It found that, following a key eye-related advertising campaign, the level of awareness about smoking leading to loss of sight was 5% of the survey group, up from less than 1% prior to the awareness campaign (DHA, 2004, p9).
Thus 0.8% (5% of 16%) is used as the modelled effectiveness of this intervention in raising awareness.
The NTC targeted Australian smokers aged 18 to 40 years. A similar target population (15 to 40 years) is used to cost this intervention.
4.2.3 Results
To run these scenarios in the model31:
On the Options sheet, choose “1. Risk Factor Programs” in the Intervention Focus box, and “1.1 Quit Smoking Program” or “1.2 Quit Smoking Campaign” in the Intervention Detail box. Tick the Base Case Treatment box, ensure that none of
31 On the Prm Sheet ensure that in the Treatment Options box, “PDT” is selected.
•
•
•
Quit Smoking Programs and Campaigns

47Centrally Focussed
the years under “Frequency” are ticked. Click Set as Base Case.
On the Options page, tick Every Year under “Frequency”. Under “Participation Rate” type 100% in the relevant age groups. Click Set as Scenario 1.
Click Compare Scenarios (CEA).
The quit smoking program and quit smoking campaign targeted towards smokers aged 18 to 40 years is not cost effective in terms of reducing the impact of AMD in the next 20 years (though reducing AMD is not the only benefi t of quitting smoking). This is unsurprising since many of these people would not have reached the age when they are at high risk of getting AMD.
Table 4-2 Model Results: Targeting Smokers Aged 15-40 Years
Net Present Values Base Case Program CampaignDALYs 214,695 214,512 214,682Loss of Wellbeing Costs ($m) 20,111 20,112 20,111Health System Costs ($m) 7,743 8,940 7,804Comorbid Health Costs ($m) 6,283 6,283 6,283Treatment Costs ($m) 1,460 2,657 1,520Productivity Costs ($m) 5,297 5,231 5,292Other Indirect Costs ($m) 15,559 15,766 15,568Total Costs ($m) 48,710 50,048 48,776CE ratio: Return on $1 spent -$0.12 -$0.08$/DALY avoided (QALY gained) $7,304,776 $5,008,083
Based on the better eye.
On the other hand, if the quit smoking program and quit smoking campaign were targeted towards smokers aged 40 to 60 years, the programs become somewhat more cost effective (between $311,000 and $340,000 per QALY gained) in terms of reducing the impact of AMD in the next 20 years. Most importantly, the total benefi t from a quit smoking program and quit smoking campaign would be signifi cantly higher as they also reduce the incidence of lung cancer, cardiovascular disease, COPD and other smoking-related conditions.
Table 4-3 Model Results: Targeting Smokers Aged 40-60 Years
Net Present Values Base Case Program CampaignDALYs 214,695 212,512 214,568Loss of Wellbeing Costs ($m) 20,111 20,009 20,107Health System Costs ($m) 7,743 8,499 7,802Comorbid Health Costs ($m) 6,283 6,273 6,283Treatment Costs ($m) 1,460 2,226 1,519Productivity Costs ($m) 5,297 5,147 5,286Other Indirect Costs ($m) 15,559 15,505 15,554Total Costs ($m) 48,710 49,160 48,750CE ratio: Return on $1 spent $0.41 $0.34$/DALY avoided (QALY gained) $310,648 $339,827
Based on the better eye.
•
•
Anti-smoking campaigns to prevent AMD become highly cost effective when the other health benefi ts are also considered
Quit Smoking Programs and Campaigns

48 Centrally Focussed
Figure 4-4 Prevalence of Visual Impairment due to AMD - Quit Smoking Campaign (40-60 year olds)
Mild Moderate Severe
2005 2010 2015 2020 2025Year
Prevalence
0
20,000
40,000
60,000
80,000
100,000
120,000
140,000
Figure 4-5 Prevalence of Visual Impairment due to AMD - Quit Smoking Program (40-60 year olds)
Mild Moderate Severe
2005 2010 2015 2020 2025
Prevalence
0
20,000
40,000
60,000
80,000
100,000
120,000
140,000
Figure 4-6 Total Cost of AMD (Quit Smoking Interventions)
2005 2010 2015 2020 2025Year
Billions
2.0
2.5
3.0
3.5
4.0
4.5
5.0
5.5
Base Case
Quit Smoking Program (40-60 Year Olds)Quit Smoking Campaign (40-60 Year Olds)
The Quit Smoking Campaign utilises advertising media
to build community awareness of
the problem and promote the ‘Quit
Smoking’ message.
The Quit Smoking Program provides
education and support, in the form
of classes, to aid people in quitting
smoking.
Quit Smoking Programs and Campaigns
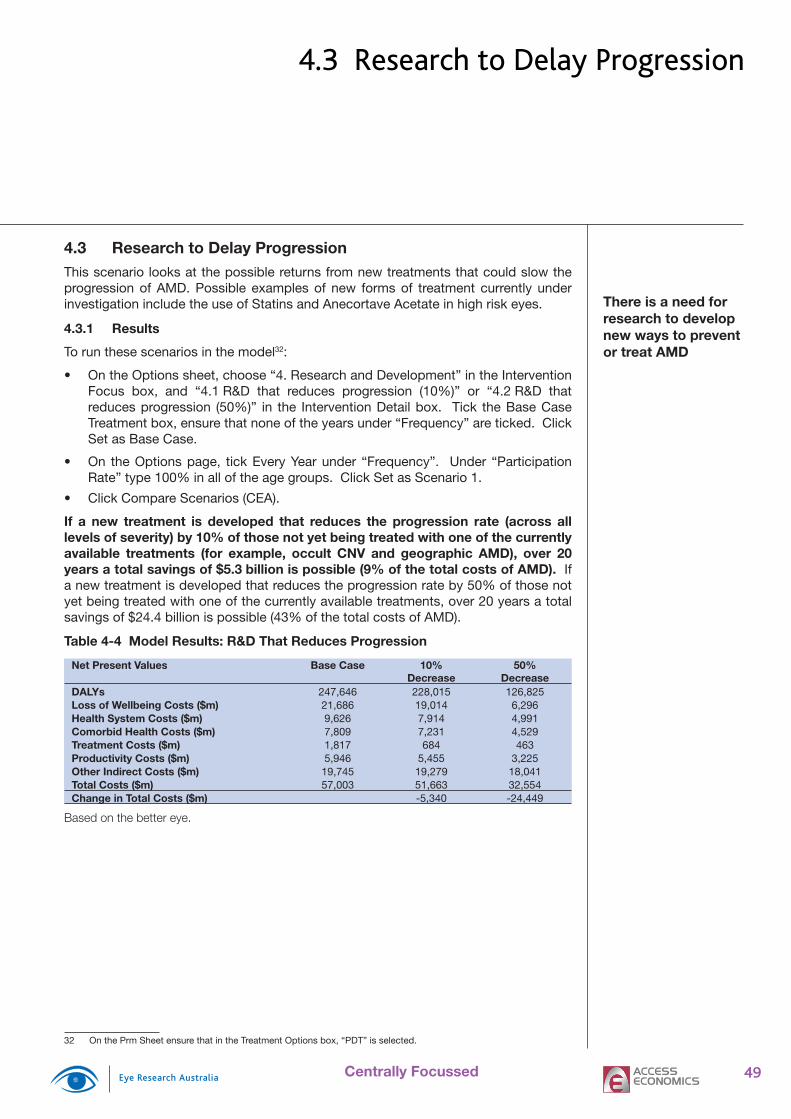
49Centrally Focussed
4.3 Research to Delay ProgressionThis scenario looks at the possible returns from new treatments that could slow the progression of AMD. Possible examples of new forms of treatment currently under investigation include the use of Statins and Anecortave Acetate in high risk eyes.
4.3.1 Results
To run these scenarios in the model32:
On the Options sheet, choose “4. Research and Development” in the Intervention Focus box, and “4.1 R&D that reduces progression (10%)” or “4.2 R&D that reduces progression (50%)” in the Intervention Detail box. Tick the Base Case Treatment box, ensure that none of the years under “Frequency” are ticked. Click Set as Base Case.
On the Options page, tick Every Year under “Frequency”. Under “Participation Rate” type 100% in all of the age groups. Click Set as Scenario 1.
Click Compare Scenarios (CEA).
If a new treatment is developed that reduces the progression rate (across all levels of severity) by 10% of those not yet being treated with one of the currently available treatments (for example, occult CNV and geographic AMD), over 20 years a total savings of $5.3 billion is possible (9% of the total costs of AMD). If a new treatment is developed that reduces the progression rate by 50% of those not yet being treated with one of the currently available treatments, over 20 years a total savings of $24.4 billion is possible (43% of the total costs of AMD).
Table 4-4 Model Results: R&D That Reduces Progression
Net Present Values Base Case 10% Decrease
50% Decrease
DALYs 247,646 228,015 126,825Loss of Wellbeing Costs ($m) 21,686 19,014 6,296Health System Costs ($m) 9,626 7,914 4,991Comorbid Health Costs ($m) 7,809 7,231 4,529Treatment Costs ($m) 1,817 684 463Productivity Costs ($m) 5,946 5,455 3,225Other Indirect Costs ($m) 19,745 19,279 18,041Total Costs ($m) 57,003 51,663 32,554Change in Total Costs ($m) -5,340 -24,449
Based on the better eye.
32 On the Prm Sheet ensure that in the Treatment Options box, “PDT” is selected.
•
•
•
There is a need for research to develop new ways to prevent or treat AMD
4.3 Research to Delay Progression
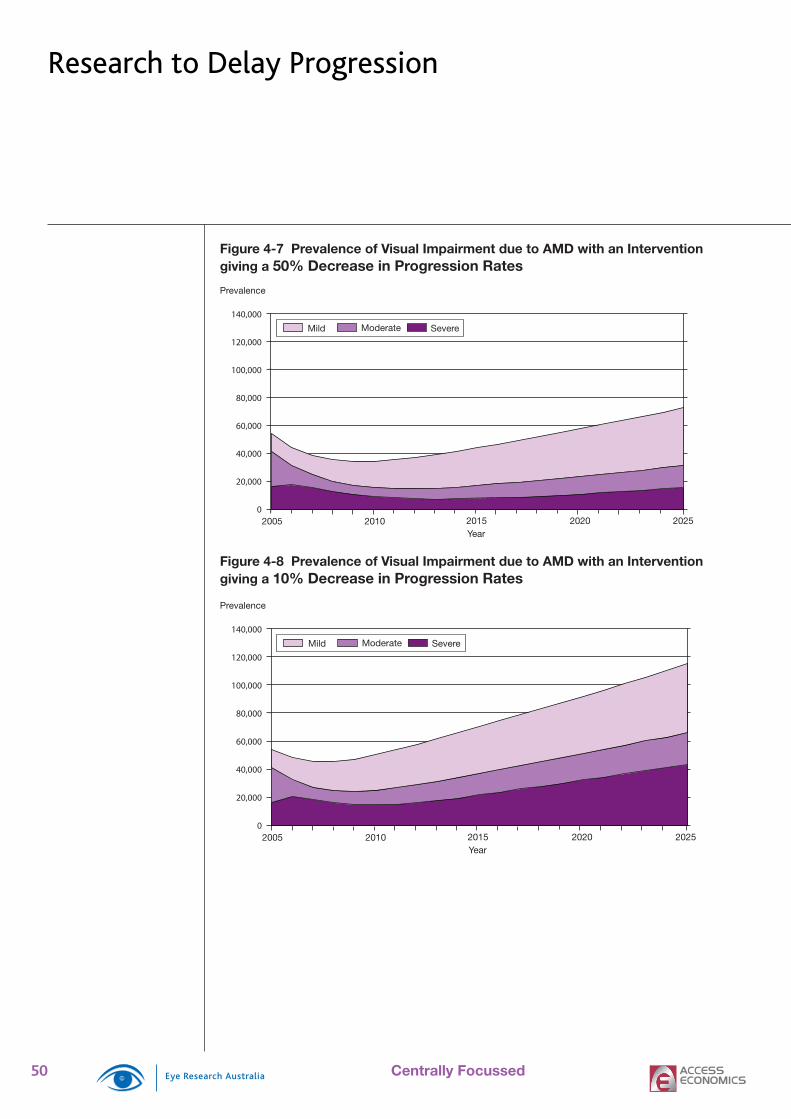
50 Centrally Focussed
Figure 4-7 Prevalence of Visual Impairment due to AMD with an Intervention giving a 50% Decrease in Progression Rates
Mild Moderate Severe
2005 2010 2015 2020 2025Year
Prevalence
0
20,000
40,000
60,000
80,000
100,000
120,000
140,000
Figure 4-8 Prevalence of Visual Impairment due to AMD with an Interventiongiving a 10% Decrease in Progression Rates
Mild Moderate Severe
2005 2010 2015 2020 2025Year
Prevalence
0
20,000
40,000
60,000
80,000
100,000
120,000
140,000
Research to Delay Progression
51Centrally Focussed
4.4 New Therapy to Enhance Treatment Effi cacyCurrent treatments for AMD are limited both in terms of their ability to retard progressionof disease and thus loss of vision, as well as only being effective for a proportion of people with neovascular AMD. Emerging therapies have the potential to enhance the effi cacy and coverage of treatment options for people with AMD.
4.4.1 Anti-Angiogenesis
This treatment aims to block the process of angiogenesis in neovascular AMD. Theoretically this will retard progression of neovascular AMD and reduce its recurrence. Currently pegaptanib (Macugen) has been approved by the US Food and Drug Administration for use in treatment of AMD, but it has only had limited trial use here in Australia.
The treatment requires six weekly injections in the affected eye over a period of at least two years. It targets the same group as PDT plus those with minimally classic or occult subfoveal neovascular AMD.
One year results from trials are shown in Table 4-5 below.
Table 4-5 Macugen Effi cacy, Visual Acuity
Type Vision Loss of: Maintain or gain VA<15 letters >= 30 letters
54 weeks 70% / 55% 10% / 22% 33% / 23%p values <0.001 0.003
% of treated group / % of untreated group
Source: Bylsma and Guymer (2005)
Positive two year data have not yet been published.
Similar to PDT, assuming only those in the mild or moderate stages receive treatment and 91% of those who are treated have classic AMD while 9% have occult AMD, then we assume pegaptanib lessens the progression of visual acuity loss according to the matrix in Table 4-6.
Table 4-6 Macugen Effi cacy, Modelled AMD Progression
Stage Starting prevalence
(%)
Treated at 1yr (%)
Untreated at 1yrs (%)
Reduction in Progression
(% per annum)Early Disease Stage
0.0 0.0 0.0 0.0
Mild 50.0 35.0 27.5 -33.3Moderate 50.0 45.0 39.0 -40.3Severe 0.0 20.0 33.5
Vision loss of <15 letters is treated as remaining in the same disease stage.
Sources: Gragoudas at al (2004) and Bylsma and Guymer (2005)
The cost of Macugen therapy is estimated from US data as US$990 per treatment (or A$1,359.70 in 2005 dollars), with a course of 18 treatments over two years.
Two other newer treatments are under review – Anecortave Acetate and ranibizumab (Lucentis). Since these are in the preliminary stages of testing, the trial results are
4.4 New Therapy to Enhance Treatment Efficacy
A new treatment that could reduce the progression rate by only 10% would save $5.7 billion over the next 20 years, a 50% reduction would save $25 billion

52 Centrally Focussed
not yet published. Furthermore, Avastin is used off-label in the US and increasingly in Australia, often with reports of similar effi cacy to Macugen.
Consequently, another two scenarios are also modelled for hypothetical anti-VGEF agents where effi cacy is the same as Macugen but treatment costs are US$500 per treatment (or $687.70 in 2005 dollars) and US$50 per treatment (or $68.70 in 2005 dollars).
4.4.2 Results
It is assumed that there is a one-off cost in 2005 of $182.5 million to treat with pegaptanib the 7,500 individuals with mild or moderate visual impairment who have received PDT treatment in the past (based on the better eye). From 2006 onwards, only active lesions (incidence cases) are treated thereafter with pegaptanib (instead of PDT). In the second scenario (at US$500 per treatment) and the third scenario (at US$50 per treatment) a one-off cost in 2005 of $92.1 million and $9.2 million, respectively, is assumed.
To run this scenario in the model:
On the Options sheet, choose “3. Anti-Angiogenesis” in the Intervention Focus box, and “3.1 Anti-Angiogenesis US$990 (Mild&Mod)” or “3.2 Anti-Angiogenesis US$500 (Mild&Mod)” or “3.3 Anti-Angiogenesis US$50 (Mild&Mod)” in the Intervention Detail box. Tick the Base Case Treatment box, ensure that none of the years under frequency are ticked. On the Prm sheet ensure that in the Treatment Options box, “PDT” is selected. Click Set as Base Case.
On the Options page, click 2005. On the Prm Sheet ensure that in the Treatment Options box, “Anti-Angiogenesis US$990” or “Anti-Angiogenesis US$500” or “Anti-Angiogenesis US$50” is selected. Under “Participation Rate” leave all of the age groups blank. Click Set as Scenario 1.
Click Compare Scenarios (CEA).
Overall pegaptanib at US$990 per treatment is just less than cost effective with a return to society of $0.68 per $1 spent on treatment. The treatment cost per QALY gained is $273,000. However the hypothetical new treatment is cost effective at US$500 per treatment (the return to society is $5.45 per $1 spent on treatment and the treatment cost per QALY gained is $16,000), and cost-saving at US$50 per treatment.
Table 4-7 Model Results: Anti-VGEF Treatment
Net Present Values ($m) Base Case Pegaptanib (US$990)
New Drug (US$500)
New Drug (US$50)
DALYs 247,646 241,939 241,939 241,939Loss of Wellbeing Costs 21,686 20,580 20,787 20,977Health System Costs 9,626 10,968 9,744 8,620Comorbid Health Costs 7,809 7,746 7,746 7,746Treatment Costs 1,817 3,222 1,998 874Productivity Costs 5,946 5,919 5,919 5,919Other Indirect Costs 19,745 19,986 19,747 19,528Total Costs 57,003 57,453 56,167 55,044CE ratio: Return on $1 spent $0.68 $5.45 -$1.08$/DALY avoided (QALY gained) $272,711 $16,355 Cost saving
Based on the better eye.
•
•
•
New Therapy to Enhance Treatment Efficacy
The cost effectiveness of new
drug therapies is highly dependent on
their delivery costs

53Centrally Focussed
Figure 4-9 Prevalence of Visual Impairment due to AMD with use of Pegaptanib
Mild Moderate Severe
2005 2010 2015 2020 2025Year
Prevalence
0
20,000
40,000
60,000
80,000
100,000
120,000
140,000
Figure 4-10 Total Cost of AMD Versus Other Interventions ($)
Base Case
R&D (20% Decrease in Progression)R&D (50% Decrease in Progression)
Pegaptanib (US$990)New Drug (US$500)New Drug (US$50)
2005 2010 2015 2020 2025
Year
Billions
1.0
2.0
3.0
4.0
5.0
6.0
7.0
New Therapy to Enhance Treatment Efficacy

54 Centrally Focussed
Table 5-1 Acronyms
AMD Age-related macular degenerationAPOE Apolipoprotein EAREDS Age Related Eye Disease StudyARM Age Related MaculopathyBDES Beaver Dam Eye StudyBMES Blue Mountains Eye StudyDALY Disability Adjusted Life YearLPC laser photo-coagulationMVIP Melbourne Visual Impairment ProjectOR odds ratioPDT photodynamic therapyRR relative riskTAP Treatment of Age-related macular degeneration with Photodynamic therapy (Study
Group)VIP Verteporfi n In Photodynamic therapy (Study Group)YLL Years of Life Lost due to Premature MortalityYLD Years of Life Lost due to Disability
Note: AMD with choroidal neovascularisation (CNV) is referred to throughout as simply as “neovascular AMD”.
Table 5-2 Subscript Defi nitions
VA Visual acuity (EDS, MILD, MOD, SEV)s Sexa Age group t Time period
Table 5-3 Variable Defi nitions
%NS Proportion of the population who had the risk factor (i.e. % who are ex-smokers)
%S Proportion of the population who currently have the risk factor (i.e. % who are current smokers)
%Treat Proportion of the people with the risk factor/disease being treated%TreatedbyBT1 Proportion of people in the base treatment group treated with base treatment
option 1%TreatedbyBT2 Proportion of people in the base treatment group treated with base treatment
option 2%TreatedbyBT3
Proportion of people in the base treatment group treated with base treatment option 3
AMperPerson Aids and modifi cations costs per person with AMDAWE Average weekly earnings if employedBoD Total cost of the loss of wellbeing (loss of wellbeing)BTPrev Prevalence of the base treatment groupBTreat Number of people treated with the base treatment in that time periodBTreatmentCost Base treatment cost totalBTreatmentCostYearX
Base treatment cost for those patients undergoing Xth year of treatment
CarerEmpCost Total productivity cost of carers timeCarerEmpCostperPerson
Productivity cost of carers time per person with AMD
CompBT1 Compliance/diagnosis rate for those who could be treated with base treatment option 1
CompBT2 Compliance/diagnosis rate for those who could be treated with base treatment option 2
CompBT3 Compliance/diagnosis rate for those who could be treated with base treatment option 3
5. Glossary

55Centrally Focussed
CompNewTreatment
Compliance/diagnosis rate for those who could be treated with the new treatment
CostBT1 Cost per treatment for base treatment option 1CostBT2 Cost per treatment for base treatment option 2CostBT3 Cost per treatment for base treatment option 3DisabilityPension Current rate of the disability pensionDWLRate Deadweight loss of raising an extra dollar of government revenueEmpCost Total cost of the lower employment ratesEmpRate Employment rate in the general populationFCperPerson Formal care costs per person with AMDFixedCost Fixed cost of new treatment (not dependent on the number of patients)GeneralCost General health costs per person with AMDGovtHealthCost Total health costs borne by the governmentHealthCost Total health costsHealthCostDep Additional health system cost due to AMD persons experiencing depressionHealthCostFalls Additional health system cost due to AMD persons experiencing accidental
fallsHealthInf Average rate of health infl ationIndHealthCost Total health costs borne by the individualIndirectTax Average indirect tax rateMortality Number of Deaths of people with AMDMortalityDueToAMD
Number of Deaths of people with AMD due to AMD
NTPrev Prevalence of the new treatment groupNTreat Number of people treated with the new treatment in that time periodNTreatmentCost New treatment cost totalNTreatmentCostYearX
New treatment cost for those patients undergoing Xth year of treatment
NumberBT1YearX Number of treatments received in Xth year for base treatment option 1NumberBT1YearX Number of times each person treated with base treatment option 1 in Xth
yearNumberBT2YearX Number of treatments received in Xth year for base treatment option 2NumberBT2YearX Number of times each person treated with base treatment option 1 in Xth
yearNumberBT3YearX Number of treatments received in Xth year for base treatment option 3NumberBT3YearX Number of times each person treated with base treatment option 1 in Xth
yearNumberNT1YearX Number of times each person treated with new treatment 1 in Xth yearOtherCost Total carers, aids and modifi cations and other costsOtherperPerson Other costs per person with AMDPerIncTax Average personal income tax ratePMEmpCost Total productivity cost of premature mortalityPopulation Total populationProgramCost Cost of the new treatment per personProgramCostBT1 Cost of base treatment option 1 per personProgramCostBT2 Cost of base treatment option 2 per personProgramCostBT3 Cost of base treatment option 3 per personProgRate Progression rate – between EDS and Mild (EDStoMILD), Mild and Moderate
(MILDtoMOD), or Moderate and Severe (MODtoSEV)PropBT1 Proportion of the remaining untreated population that could potentially be
treated with base treatment option 1PropBT2 Proportion of the remaining untreated population that could potentially be
treated with base treatment option 2PropBT3 Proportion of the remaining untreated population that could potentially be
treated with base treatment option 3PropGovtHealthCost Proportion of health costs borne by the governmentPropNTreat Proportion of the remaining untreated population that could potentially be
treated with the new treatment
Glossary
56 Centrally Focussed
RemRate Remission rate – between EDS and None (EDStoNONE), Mild and None (MILDtoNONE), Moderate and None (MODtoNONE), Severe and None (SEVtoNONE), Mild and EDS (MILDtoEDS), Moderate and Mild (MODtoMILD), or Severe and Moderate (SEVtoMOD)
RiskDep Risk of a person with AMD experiencing depressionRiskFall Risk of a person with AMD experiencing accidental fallsRiskFall&Dep Risk of experiencing an accidental fall AND depressionRREBT Relative risk of employment for the base treatment groupRRENT Relative risk of employment for the new treatment groupRRES Relative risk of acquiring AMD for a person who had the risk factor (i.e. ex-
smokers)RREU Relative risk of employment for the untreated groupRRM Relative risk of mortalityRRMS Relative risk of mortality for a person currently with the risk factor (i.e. current
smokers)RRS Relative risk of acquiring AMD for a person currently with the risk factor (i.e.
current smokers)StandardYLLs YLLs corresponding to age and sex at death from Standard Life Expectancy
Table (West Level 26) at a discount rate of 3.3% and no age weightingTaxRev Total tax revenue lostTotalPrev Total prevalence of AMD in the populationTotalPropBT1 Proportion of all the AMD population that could potentially be treated with
base treatment option 1TotalPropBT2 Proportion of all the AMD population that could potentially be treated with
base treatment option 2TotalPropBT3 Proportion of all the AMD population that could potentially be treated with
base treatment option 3TotalPropNTreat Proportion of all the AMD population that could potentially be treated with
new treatmentUPrev Prevalence of the untreated groupVLY Value of a life yearW Disability weight – for the level of visual acuity only, for the level of visual acuity
and falls, for the level of visual acuity and depression, or for the level of visual acuity and falls and depression
Welfare Welfare payments made to persons with AMDYLLs Years of life lost due to premature mortality
Glossary
57Centrally Focussed
Appendix: Model Formulae
The following section describes how each part of the model is calculated.
Risk Factors and Incidence
By default, all of the risk factors of AMD are assumed not to change from their current prevalence levels. Consequently the risk of acquiring AMD for the entire population is equal to the current incidence rate.However, if the risk factors are assumed to change from their current prevalence levels (i.e. the rate of smoking prevalence declines due to a quit smoking program) then the risk of acquiring AMD for the population without the risk factor is:
Risk s,a =IncidenceRates,a
1+ RRS −1( ) ⋅%Ss,a + RRES −1( ) ⋅%ES s,a( )
And AMD incidence over time is:
Incidences,a,t = Risk s,a ⋅ Populations,a ,t ⋅ 1+ RRS −1( ) ⋅%Ss,a ,t + RRES −1( ) ⋅%ES s,a,t( )All people who newly acquire AMD are assumed to acquire Early Disease Stage before moving onto mild, moderate and severe versions of the disease. Firstly they enter the untreated group before moving to the treated group, if they are treated, in later years.
Treatment
It is assumed that for base treatments, the programs have been in place long enough that only incidence cases (active lesions) of AMD receive treatment (taking into account compliance rates). Active lesions are assumed to be eyes progressing from one level of visual impairment to another. Three base treatment options are available to model (BT1, BT2 and BT3) and one new treatment. In this case BT1 is LPC, BT2 is PDT, and BT3 is a blank treatment to allow for future extensions of the model.For new treatments, either only a set proportion of incidence cases of AMD receive treatment (for example, a specifi c eye type) or a set proportion of all people are treated each year (when they reach a certain age group) until there are no more people to treat (for example, quit smoking programs or screening programs).
Base Treatment Group A (same for Groups B and C):
Of the untreated population, the total proportion that could be treated using each of the base treatment options is dependent on the remaining patients that could be treated but have not yet been diagnosed or complied with the treatment, and the incidence/progression into the disease stage where they can be treated (this example is for BT1 but similar equations are applied to BT2 and BT3):PropBT1VA ,t =
UPrev VA ,t−1 ⋅ PropBT1VA ,t−1 ⋅ 1−CompBT1( ) + ProgressedVA ,t−1 ⋅ TotalPropBT1( )UPrev VA ,t
If the new treatment group includes all people regardless of whether they are currently being treated with a base treatment, then the total number of patients treated is:
BTreat VA ,s,a,t = UPrev VA ,s,a ,t − NTreatVA ,s,a,t( ) ⋅PropBT1VA ,t ⋅CompBT1+
PropBT2VA ,t ⋅CompBT2 +
PropBT3VA ,t ⋅CompBT3
⎛
⎝
⎜ ⎜ ⎜
⎞
⎠
⎟ ⎟ ⎟
If the new treatment group includes those not receiving a base treatment, then the total number of patients treated is:
BTreat VA ,s,a,t = UPrev VA ,s,a,t ⋅
PropBT1VA ,t ⋅CompBT1+
PropBT2VA ,t ⋅CompBT2 +
PropBT3VA ,t ⋅CompBT3
⎛
⎝
⎜ ⎜ ⎜
⎞
⎠
⎟ ⎟ ⎟
The proportion of those treated by base treatment option (BT1, BT2 and BT3) is:
%TreatedbyBT1VA ,t =UPrev VA ,t ⋅ PropBT1VA ,t ⋅CompBT1
BTreat VA ,t
New Treatment Group:
For incidence cases (active lesions only):
Of the untreated population, the total proportion that could be treated is dependent on the remaining patients that could be treated but have not yet been diagnosed or complied with the treatment, and the incidence/progression into the disease stage where they can be treated:
PropNTreatVA ,t =
UPrev VA ,t−1 ⋅ PropNTreatVA ,t−1 ⋅ 1−CompNewTreatment( ) + ProgressedVA−1,t ⋅ TotalPropNTreat( )UPrev VA ,t
If the new treatment group includes all people regardless of whether they are currently being treated with a base treatment, then the total number of patients treated is:
•
•

58 Centrally Focussed
NTreatVA ,s,a ,t = UPrev VA ,s,a ,t ⋅ PropNTreatVA ,t ⋅CompNewTreatment( )
If the new treatment group includes those not receiving a base treatment, then the total number of patients treated is:
NTreatVA ,s,a ,t = UPrev VA ,s,a,t − BTreat VA ,s,a,t( ) ⋅ PropNTreatVA ,t ⋅CompNewTreatment( )For all people:
If the new treatment group includes all people regardless of whether they are currently being treated:
NTreatVA ,s,a ,t = UPrev VA ,s,a ,t ⋅CompNewTreatment⋅%Treats,a
If the new treatment group includes those not treated under the current system:
NTreatVA ,s,a ,t = UPrev VA ,s,a,t − BTreat VA ,s,a,t( ) ⋅CompNewTreatment⋅%Treats,a
Progression and Remission
The progression and remission rates of AMD are determined by whether the person is in the treatment group or the non-treatment group.The number who progressed from one stage to the next stage for the non-treatment group:
ProgressedVA ,s,a,t = ProgRateVA ⋅ UPrev VA ,s,a ,t − BTreat VA ,s,a,t − NTreatVA ,s,a ,t( )The number who progressed from one stage to the next stage for the base treatment group:
ProgressedVA ,s,a,t = ProgRateVA ⋅ BTPrev VA ,s,a,t + BTreat VA ,s,a ,t( )The number who progressed from one stage to the next stage for the new treatment group:
ProgressedVA ,s,a,t = ProgRateVA ⋅ NTPrev VA ,s,a ,t + NTreatVA ,s,a ,t( )Despite there currently being no remission in AMD (to either no disease or an earlier stage of the disease) it is important to include these calculations to allow for modelling of the impact of research providing a new treatment that increases remission rates and to ensure that the model is applicable to other eye diseases with remission rates (such as cataracts).The number of people who remissed from one stage to no disease, or from one stage to the previous stage, is similarly calculated to the number who progressed (but is included in the prevalence calculations but not estimated directly). For example:
The number who remissed for the non-treatment group:
RemVA ,s,a,t = RemRateVAtoNONE + RemRateVAtoVA−1( ) ⋅ UPrev VA ,s,a ,t − BTreat VA ,s,a ,t − NTreatVA ,s,a ,t( )The number who progressed from one stage to the next stage for the base treatment group:
RemVA ,s,a,t = RemRateVAtoNONE + RemRateVAtoVA−1( ) ⋅ BTPrev VA ,s,a,t + BTreat VA ,s,a,t( )The number who progressed from one stage to the next stage for the new treatment group:
RemVA ,s,a,t = RemRateVAtoNONE + RemRateVAtoVA−1( ) ⋅ NTPrev VA ,s,a ,t + NTreatVA ,s,a,t( )Mortality
The mortality rate of AMD is solely determined by the person’s level of visual acuity because the person does not die from AMD itself but by the higher risk of other complications such as higher rates of accidental falls and depression (which are implicit in the calculation of the relative risk of mortality). Thus mortality for each stage is equal to: MortalityVA ,s,a,t = MortalityRates,a ,t ⋅ RRM VA ⋅ UPrev VA ,s,a,t + BTPrev VA ,s,a ,t + NTPrev VA ,s,a ,t( )And the mortality due to AMD is equal to:
MortalityDueToAMDVA ,s,a ,t =
MortalityRates,a,t ⋅ RRM VA −1( ) ⋅ UPrev VA ,s,a ,t + BTPrev VA ,s,a,t + NTPrev VA ,s,a,t( )Prevalence
Untreated and treated prevalence is estimated separately before being combined to form the total prevalence of AMD because each group has different progression and remission rates. Furthermore prevalence is estimated on the basis of single year age groups because of the ageing processes before being combined into the fi ve year age groups.In the fi rst year, the estimated current levels of prevalence by visual impairment, sex and age is split up into single year age groups.For Early Disease Stage:
Untreated:
UPrev EDS ,s,a ,t =
UPrev EDS ,s,a−1,t−1 − BTreat EDS ,s,a−a,t−1 − NTreatEDS ,s,a−a ,t−1( ) ⋅1− RemRateEDStoNONE
−ProgRateEDStoMILD
⎛
⎝ ⎜
⎞
⎠ ⎟
+ UPrev MILD ,s,a−1,t−1 − BTreat MILD ,s,a−1,t−1 − NTreatMILD ,s,a−1,t−1( ) ⋅ RemRateMILDtoEDS
−MortalityEDS ,s,a ,t−1 ⋅UPrev EDS ,s,a−1,t−1 − BTreat EDS ,s,a−1,t−1 − NTreatEDS ,s,a−1,t−1( )
UPrev EDS ,s,a−1,t−1 + BTPrev EDS ,s,a−1,t−1 + NTPrev EDS ,s,a−1,t−1
+Incidences,a−1,t−1
•
•
•
Appendix: Model Formulae

59Centrally Focussed
Appendix: Model Formulae
Base Treatment:
BTPrev EDS ,s,a,t = BTPrev EDS ,s,a−1,t−1 + BTreat EDS ,s,a−a ,t−1( ) ⋅
1− RemRateEDStoNONE
−ProgRateEDStoMILD
⎛
⎝ ⎜
⎞
⎠ ⎟
+ BTPrev MILD ,s,a−1,t−1 + BTreat MILD ,s,a−1,t−1( ) ⋅ RemRateMILDtoEDS
−MortalityEDS ,s,a ,t−1 ⋅BTPrev EDS ,s,a−1,t−1 + BTreat EDS ,s,a−1,t−1( )
UPrev EDS ,s,a−1,t−1 + BTPrev EDS ,s,a−1,t−1 + NTPrev EDS ,s,a−1,t−1
New Treatment:
NTPrev EDS ,s,a ,t = NTPrev EDS ,s,a−1,t−1 + NTreatEDS ,s,a−a,t−1( ) ⋅1− RemRateEDStoNONE
−ProgRateEDStoMILD
⎛
⎝ ⎜
⎞
⎠ ⎟
+ NTPrev MILD ,s,a−1,t−1 + NTreatMILD ,s,a−1,t−1( ) ⋅ RemRateMILDtoEDS
−MortalityEDS ,s,a ,t−1 ⋅NTPrev EDS ,s,a−1,t−1 + NTreatEDS ,s,a−1,t−1( )
UPrev EDS ,s,a−1,t−1 + BTPrev EDS ,s,a−1,t−1 + NTPrev EDS ,s,a−1,t−1
For mild visual impairment:
Untreated:
UPrev MILD ,s,a ,t =
UPrev MILD ,s,a−1,t−1 − BTreat MILD ,s,a−a ,t−1 − NTreatMILD ,s,a−a,t−1( ) ⋅1− RemRateMILDtoNONE
−RemRateMILDtoEDS
−ProgRateMILD toMOD
⎛
⎝
⎜ ⎜ ⎜
⎞
⎠
⎟ ⎟ ⎟
+ UPrev MOD ,s,a−1,t−1 − BTreat MOD ,s,a−1,t−1 − NTreatMOD ,s,a−1,t−1( ) ⋅ RemRateMODtoMILD
−MortalityMILD ,s,a ,t−1 ⋅UPrev MILD ,s,a−1,t−1 − BTreat MILD ,s,a−1,t−1 − NTreatMILD ,s,a−1,t−1( )
UPrev MILD ,s,a−1,t−1 + BTPrev MILD ,s,a−1,t−1 + NTPrev MILD ,s,a−1,t−1
+ UPrev EDS ,s,a−1,t−1 − BTreat EDS ,s,a−1,t−1 − NTreatEDS ,s,a−1,t−1( ) ⋅ ProgRateEDStoMILD
Base Treatment:
BTPrev MILD ,s,a,t = BTPrev MILD ,s,a−1,t−1 + BTreat MILD ,s,a−a ,t−1( ) ⋅1− RemRateMILDtoNONE
−RemRateMILDtoEDS
−ProgRateMILD toMOD
⎛
⎝
⎜ ⎜ ⎜
⎞
⎠
⎟ ⎟ ⎟
+ BTPrev MOD ,s,a−1,t−1 + BTreat MOD ,s,a−1,t−1( ) ⋅ RemRateMODtoMILD
−MortalityMILD ,s,a ,t−1 ⋅BTPrev MILD ,s,a−1,t−1 + BTreat MILD ,s,a−1,t−1( )
UPrev MILD ,s,a−1,t−1 + BTPrev MILD ,s,a−1,t−1 + NTPrev MILD ,s,a−1,t−1
+ BTPrev EDS ,s,a−1,t−1 + BTreat EDS ,s,a−1,t−1( ) ⋅ ProgRateEDStoMILD
New Treatment:
NTPrev MILD ,s,a ,t = NTPrev MILD ,s,a−1,t−1 + NTreatMILD ,s,a−a,t−1( ) ⋅1− RemRateMILDtoNONE
−RemRateMILDtoEDS
−ProgRateMILD toMOD
⎛
⎝
⎜ ⎜ ⎜
⎞
⎠
⎟ ⎟ ⎟
+ NTPrev MOD ,s,a−1,t−1 + NTreatMOD ,s,a−1,t−1( ) ⋅ RemRateMODtoMILD
−MortalityMILD ,s,a ,t−1 ⋅NTPrev MILD ,s,a−1,t−1 + NTreatMILD ,s,a−1,t−1( )
UPrev MILD ,s,a−1,t−1 + BTPrev MILD ,s,a−1,t−1 + NTPrev MILD ,s,a−1,t−1
+ NTPrev EDS ,s,a−1,t−1 + NTreatEDS ,s,a−1,t−1( ) ⋅ ProgRateEDStoMILD
For moderate visual impairment:
Untreated:
UPrev MOD ,s,a,t =
UPrev MOD ,s,a−1,t−1 − BTreat MOD ,s,a−a,t−1 − NTreatMOD ,s,a−a,t−1( ) ⋅1− RemRateMODtoNONE
−RemRateMODtoMILD
−ProgessionRateMOD toSEV
⎛
⎝
⎜ ⎜ ⎜
⎞
⎠
⎟ ⎟ ⎟
+ UPrev SEV ,s,a−1,t−1 − BTreat SEV ,s,a−1,t−1 − NTreatSEV ,s,a−1,t−1( ) ⋅ RemRateSEVtoMOD
−MortalityMOD ,s,a,t−1 ⋅UPrev MOD ,s,a−1,t−1 − BTreat MOD ,s,a−1,t−1 − NTreatMOD ,s,a−1,t−1( )
UPrev MOD ,s,a−1,t−1 + BTPrev MOD ,s,a−1,t−1 + NTPrev MOD ,s,a−1,t−1
+ UPrev MILD ,s,a−1,t−1 − BTreat MILD ,s,a−1,t−1 − NTreatMILD ,s,a−1,t−1( ) ⋅ ProgressionRateMILDtoMOD
Base Treatment:
BTPrev MOD ,s,a ,t = BTPrev MOD ,s,a−1,t−1 + BTreat MOD ,s,a−a,t−1( ) ⋅1− RemRateMODtoNONE
−RemRateMODtoMILD
−ProgRateMOD toSEV
⎛
⎝
⎜ ⎜ ⎜
⎞
⎠
⎟ ⎟ ⎟
+ BTPrev SEV ,s,a−1,t−1 + BTreat SEV ,s,a−1,t−1( ) ⋅ RemRateSEVtoMOD
−MortalityMOD ,s,a,t−1 ⋅BTPrev MOD ,s,a−1,t−1 + BTreat MOD ,s,a−1,t−1( )
UPrev MOD ,s,a−1,t−1 + BTPrev MOD ,s,a−1,t−1 + NTPrev MOD ,s,a−1,t−1
+ BTPrev MILD ,s,a−1,t−1 + BTreat MILD ,s,a−1,t−1( ) ⋅ ProgRateMILDtoMOD

60 Centrally Focussed
New Treatment:
NTPrev MOD ,s,a,t = NTPrev MOD ,s,a−1,t−1 + NTreatMOD ,s,a−a ,t−1( ) ⋅
1− RemRateMODtoNONE
−RemRateMODtoMILD
−ProgRateMOD toSEV
⎛
⎝
⎜ ⎜ ⎜
⎞
⎠
⎟ ⎟ ⎟
+ NTPrev SEV ,s,a−1,t−1 + NTreatSEV ,s,a−1,t−1( ) ⋅ RemRateSEVtoMOD
−MortalityMOD ,s,a,t−1 ⋅NTPrev MOD ,s,a−1,t−1 + NTreatMOD ,s,a−1,t−1( )
UPrev MOD ,s,a−1,t−1 + BTPrev MOD ,s,a−1,t−1 + NTPrev MOD ,s,a−1,t−1
+ NTPrev MILD ,s,a−1,t−1 + NTreatMILD ,s,a−1,t−1( ) ⋅ ProgRateMILDtoMOD
For severe visual impairment:
Untreated:
UPrev SEV ,s,a ,t =
UPrev SEV ,s,a−1,t−1 − BTreat SEV ,s,a−a ,t−1 − NTreatSEV ,s,a−a,t−1( ) ⋅1− RemRateSEVtoNONE
−RemRateSEVtoMOD
⎛
⎝ ⎜
⎞
⎠ ⎟
−MortalitySEV ,s,a ,t−1 ⋅UPrev SEV ,s,a−1,t−1 − BTreat SEV ,s,a−1,t−1 − NTreatSEV ,s,a−1,t−1( )
UPrev SEV ,s,a−1,t−1 + BTPrev SEV ,s,a−1,t−1 + NTPrev SEV ,s,a−1,t−1
+ UPrev MOD ,s,a−1,t−1 − BTreat MOD ,s,a−1,t−1 − NTreatMOD ,s,a−1,t−1( ) ⋅ ProgRateMODtoSEV
Base Treatment:
BTPrev SEV ,s,a,t = BTPrev SEV ,s,a−1,t−1 + BTreat SEV ,s,a−a ,t−1( ) ⋅
1− RemRateSEVtoNONE
−RemRateSEVtoMOD
⎛
⎝ ⎜
⎞
⎠ ⎟
−MortalitySEV ,s,a ,t−1 ⋅BTPrev SEV ,s,a−1,t−1 + BTreat SEV ,s,a−1,t−1( )
UPrev SEV ,s,a−1,t−1 + BTPrev SEV ,s,a−1,t−1 + NTPrev SEV ,s,a−1,t−1
+ BTPrev MOD ,s,a−1,t−1 + BTreat MOD ,s,a−1,t−1( ) ⋅ ProgRateMODtoSEV
New Treatment:
NTPrev SEV ,s,a ,t = NTPrev SEV ,s,a−1,t−1 + NTreatSEV ,s,a−a,t−1( ) ⋅
1− RemRateSEVtoNONE
−RemRateSEVtoMOD
⎛
⎝ ⎜
⎞
⎠ ⎟
−MortalitySEV ,s,a ,t−1 ⋅NTPrev SEV ,s,a−1,t−1 + NTreatSEV ,s,a−1,t−1( )
UPrev SEV ,s,a−1,t−1 + BTPrev SEV ,s,a−1,t−1 + NTPrev SEV ,s,a−1,t−1
+ NTPrev MOD ,s,a−1,t−1 + NTreatMOD ,s,a−1,t−1( ) ⋅ ProgRateMODtoSEV
Total prevalence (TotalPrev):
TotalPrevVA ,s,a ,t = UPrev VA ,s,a ,t + BTPrev VA ,s,a,t + NTPrev VA ,s,a,t
Loss of Wellbeing
Prevalence DALYs are used (instead of incidence DALYs) to estimate the costs in each year.
YLDs for the untreated group and treated group are estimated separately as some programs increase the quality of life experienced by a person with AMD, such as rehabilitation and occupational therapy. In addition to the quality of life impact of reduced visual acuity, persons with AMD also experience higher rates of accidental falls and depression, which further reduce wellbeing.Thus for the untreated and treated groups:
YLD s,a,t = UPrev VA ,s,a ,t
WVAonly ⋅ 1− RiskFall VA ,s,a − RiskDepVA ,s,a( ) +
WVAfalls ⋅ RiskFall VA ,s,a − RiskFall & DepVA ,s,a( ) +
WVAdep ⋅ RiskDepVA ,s,a − RiskFall & DepVA ,s,a( ) +
WVAfalls& dep ⋅ RiskFall & DepVA ,s,a( )
⎛
⎝
⎜ ⎜ ⎜ ⎜ ⎜
⎞
⎠
⎟ ⎟ ⎟ ⎟ ⎟
VA = EDS ,MILD ,MOD ,SEV
∑
YLLs are not separated between the untreated group and treated group as mortality is dependent on visual acuity rather than whether the person is treated. YLLs are estimated based on the age of death and the corresponding YLLs in the Standard Life Expectancy Table33 at a discount rate of 3.3% and no age weighting. YLLs are allocated to the year that the person died.
YLLs s,a,t = MortalityDueToAMDVA ,s,a ,tVA = EDS ,MILD ,MOD ,SEV
∑⎛
⎝ ⎜
⎞
⎠ ⎟ ⋅ StandardYLLss,a
Therefore:
DALYs s,a ,t = YLD s,a,t + YLLs s,a,t
Because the source studies from which the VSL is drawn implicitly include the individual’s net estimation of other personal costs – notably lost earnings (after tax) and out-of-pocket expenses. Thus the net cost of suffering and premature death from visual acuity loss should exclude these to avoid double counting.
BoDs,a,t = DALYs s,a,t ⋅VLY
−HealthCosts,a ,t ⋅ IndHealthCost
− EmpCosts,a,t + PMEmpCosts,a,t( ) ⋅ 1− PerIncTax − IndirectTax( )−OtherCosts,a ,t
33 Based on the highest life expectancy possible, used in the Global Burden of Disease study by the World Health Organi sation and applied to Australia (Mathers et al 1999).
Appendix: Model Formulae

61Centrally Focussed
Health Costs
Base Treatment Costs
Base treatment costs include both the general cost of treating a person with AMD (regardless of whether they receive treatment) and the cost of treating under the current system. Three potential base treatment options are available – BT1, BT2, and BT3. In this case BT1 is LPC, BT2 is PDT, and BT3 is a blank treatment. Each patient can receive a number of treatments over a 5-year period. BTreatmentCosts,a ,t =
TotalPrevVA ,s,a,t ⋅GeneralCostVA( )VA = EDS ,MILD ,MOD ,SEV
∑⎛
⎝ ⎜
⎞
⎠ ⎟ ⋅ 1+ HealthInf( )t−1
+
BTreatmentCostYear1s,a ,t + BTreatmentCostYear2s,a ,t + BTreatmentCostYear3s,a ,t +
BTreatmentCostYear4s,a ,t + BTreatmentCostYear5s,a ,t
Where:
BTreatmentCostYear3s,a ,t = 1+ HealthInf( )t−1⋅
BTreat VA ,s,a,tVA = EDS ,MILD ,MOD ,SEV
∑ ⋅%TreatedbyBT1VA ⋅1− RemRateVAtoNone
−MortalityRates,a ,t ⋅ RRM VA
⎛
⎝ ⎜
⎞
⎠ ⎟
2⎛
⎝ ⎜ ⎜
⎞
⎠ ⎟ ⎟
⋅NumberBT1Year3⋅ ProgramCostBT1 +
BTreat VA ,s,a,tVA = EDS ,MILD ,MOD ,SEV
∑ ⋅%TreatedbyBT2VA ⋅1− RemRateVAtoNone
−MortalityRates,a ,t ⋅ RRM VA
⎛
⎝ ⎜
⎞
⎠ ⎟
2⎛
⎝ ⎜ ⎜
⎞
⎠ ⎟ ⎟
⋅NumberBT2Year3⋅ ProgramCostBT2 +
BTreat VA ,s,a,tVA = EDS ,MILD ,MOD ,SEV
∑ ⋅%TreatedbyBT3VA ⋅1− RemRateVAtoNone
−MortalityRates,a ,t ⋅ RRM VA
⎛
⎝ ⎜
⎞
⎠ ⎟
2⎛
⎝ ⎜ ⎜
⎞
⎠ ⎟ ⎟
⋅NumberBT3Year3⋅ ProgramCostBT3
⎛
⎝
⎜ ⎜ ⎜ ⎜ ⎜ ⎜ ⎜ ⎜ ⎜ ⎜ ⎜ ⎜ ⎜ ⎜
⎞
⎠
⎟ ⎟ ⎟ ⎟ ⎟ ⎟ ⎟ ⎟ ⎟ ⎟ ⎟ ⎟ ⎟ ⎟
BTreatmentCostYear4 s,a ,t = 1+ HealthInf( )t−1
⋅
BTreat VA ,s,a,tVA = EDS ,MILD ,MOD ,SEV
∑ ⋅%TreatedbyBT1VA ⋅1− RemRateVAtoNone
−MortalityRates,a ,t ⋅ RRM VA
⎛
⎝ ⎜
⎞
⎠ ⎟
3⎛
⎝ ⎜ ⎜
⎞
⎠ ⎟ ⎟
⋅NumberBT1Year4⋅ ProgramCostBT1 +
BTreat VA ,s,a,tVA = EDS ,MILD ,MOD ,SEV
∑ ⋅%TreatedbyBT2VA ⋅1− RemRateVAtoNone
−MortalityRates,a ,t ⋅ RRM VA
⎛
⎝ ⎜
⎞
⎠ ⎟
3⎛
⎝ ⎜ ⎜
⎞
⎠ ⎟ ⎟
⋅NumberBT2Year4⋅ ProgramCostBT2 +
BTreat VA ,s,a,tVA = EDS ,MILD ,MOD ,SEV
∑ ⋅%TreatedbyBT3VA ⋅1− RemRateVAtoNone
−MortalityRates,a ,t ⋅ RRM VA
⎛
⎝ ⎜
⎞
⎠ ⎟
3⎛
⎝ ⎜ ⎜
⎞
⎠ ⎟ ⎟
⋅NumberBT3Year4⋅ ProgramCostBT3
⎛
⎝
⎜ ⎜ ⎜ ⎜ ⎜ ⎜ ⎜ ⎜ ⎜ ⎜ ⎜ ⎜ ⎜ ⎜
⎞
⎠
⎟ ⎟ ⎟ ⎟ ⎟ ⎟ ⎟ ⎟ ⎟ ⎟ ⎟ ⎟ ⎟ ⎟
BTreatmentCostYear5s,a ,t = 1+ HealthInf( )t−1
⋅
BTreat VA ,s,a,tVA = EDS ,MILD ,MOD ,SEV
∑ ⋅%TreatedbyBT1VA ⋅1− RemRateVAtoNone
−MortalityRates,a ,t ⋅ RRM VA
⎛
⎝ ⎜
⎞
⎠ ⎟
4⎛
⎝ ⎜ ⎜
⎞
⎠ ⎟ ⎟
⋅NumberBT1Year5⋅ ProgramCostBT1 +
BTreat VA ,s,a,tVA = EDS ,MILD ,MOD ,SEV
∑ ⋅%TreatedbyBT2VA ⋅1− RemRateVAtoNone
−MortalityRates,a ,t ⋅ RRM VA
⎛
⎝ ⎜
⎞
⎠ ⎟
4⎛
⎝ ⎜ ⎜
⎞
⎠ ⎟ ⎟
⋅NumberBT2Year5⋅ ProgramCostBT2 +
BTreat VA ,s,a,tVA = EDS ,MILD ,MOD ,SEV
∑ ⋅%TreatedbyBT3VA ⋅1− RemRateVAtoNone
−MortalityRates,a ,t ⋅ RRM VA
⎛
⎝ ⎜
⎞
⎠ ⎟
4⎛
⎝ ⎜ ⎜
⎞
⎠ ⎟ ⎟
⋅NumberBT3Year5⋅ ProgramCostBT3
⎛
⎝
⎜ ⎜ ⎜ ⎜ ⎜ ⎜ ⎜ ⎜ ⎜ ⎜ ⎜ ⎜ ⎜ ⎜
⎞
⎠
⎟ ⎟ ⎟ ⎟ ⎟ ⎟ ⎟ ⎟ ⎟ ⎟ ⎟ ⎟ ⎟ ⎟
BTreatmentCostYear1s,a ,t = 1+ HealthInf( )t−1⋅
BTreat VA ,s,a,tVA = EDS ,MILD ,MOD ,SEV
∑ ⋅%TreatedbyBT1VA
⎛
⎝ ⎜
⎞
⎠ ⎟
⋅NumberBT1Year1⋅ ProgramCostBT1 +
BTreat VA ,s,a,tVA = EDS ,MILD ,MOD ,SEV
∑ ⋅%TreatedbyBT2VA
⎛
⎝ ⎜
⎞
⎠ ⎟
⋅NumberBT2Year1⋅ ProgramCostBT2 +
BTreat VA ,s,a,tVA = EDS ,MILD ,MOD ,SEV
∑ ⋅%TreatedbyBT3VA
⎛
⎝ ⎜
⎞
⎠ ⎟
⋅NumberBT3Year1⋅ ProgramCostBT3
⎛
⎝
⎜ ⎜ ⎜ ⎜ ⎜ ⎜ ⎜ ⎜ ⎜ ⎜ ⎜ ⎜ ⎜
⎞
⎠
⎟ ⎟ ⎟ ⎟ ⎟ ⎟ ⎟ ⎟ ⎟ ⎟ ⎟ ⎟ ⎟
BTreatmentCostYear2s,a ,t = 1+ HealthInf( )t−1⋅
BTreat VA ,s,a,tVA = EDS ,MILD ,MOD ,SEV
∑ ⋅%TreatedbyBT1VA ⋅1− RemRateVAtoNone
−MortalityRates,a ,t ⋅ RRM VA
⎛
⎝ ⎜
⎞
⎠ ⎟
⎛
⎝ ⎜
⎞
⎠ ⎟
⋅NumberBT1Year2⋅ ProgramCostBT1 +
BTreat VA ,s,a,tVA = EDS ,MILD ,MOD ,SEV
∑ ⋅%TreatedbyBT2VA ⋅1− RemRateVAtoNone
−MortalityRates,a ,t ⋅ RRM VA
⎛
⎝ ⎜
⎞
⎠ ⎟
⎛
⎝ ⎜
⎞
⎠ ⎟
⋅NumberBT2Year2⋅ ProgramCostBT2 +
BTreat VA ,s,a,tVA = EDS ,MILD ,MOD ,SEV
∑ ⋅%TreatedbyBT3VA ⋅1− RemRateVAtoNone
−MortalityRates,a ,t ⋅ RRM VA
⎛
⎝ ⎜
⎞
⎠ ⎟
⎛
⎝ ⎜
⎞
⎠ ⎟
⋅NumberBT3Year2⋅ ProgramCostBT3
⎛
⎝
⎜ ⎜ ⎜ ⎜ ⎜ ⎜ ⎜ ⎜ ⎜ ⎜ ⎜ ⎜ ⎜
⎞
⎠
⎟ ⎟ ⎟ ⎟ ⎟ ⎟ ⎟ ⎟ ⎟ ⎟ ⎟ ⎟ ⎟
Appendix: Model Formulae
62 Centrally Focussed
are being targeted. Total new treatment costs are:
NTreatmentCostt =
NTreatmentCostYear1s,a,t + NTreatmentCostYear2s,a ,t
+NTreatmentCostYear3s,a ,t + NTreatmentCostYear4s,a,t
+NTreatmentCostYear5s,a ,t
⎛
⎝
⎜ ⎜ ⎜
⎞
⎠
⎟ ⎟ ⎟
+ FixedCostts,a
∑
Where, if a risk factor is being targeted:NTreatmentCostYear1s,a,t =
%Treat ⋅%Ss,a ,t ⋅ Populations,a ,t ⋅ ProgramCost ⋅ NumberNTYear1⋅ 1+ HealthInf( )t−1
NTreatmentCostYear2s,a,t =
%Treat ⋅%Ss,a ,t ⋅ Populations,a ,t ⋅ 1− MortalityRates,a ,t ⋅ RRMS( ) ⋅ProgramCost ⋅ NumberNTYear2⋅ 1+ HealthInf( )t−1
NTreatmentCostYear3s,a,t =
%Treat ⋅%Ss,a ,t ⋅ Populations,a ,t ⋅ 1− MortalityRates,a ,t ⋅ RRMS( )2⋅
ProgramCost ⋅ NumberNTYear3⋅ 1+ HealthInf( )t−1
NTreatmentCostYear4s,a,t =
%Treat ⋅%Ss,a ,t ⋅ Populations,a ,t ⋅ 1− MortalityRates,a ,t ⋅ RRMS( )3⋅
ProgramCost ⋅ NumberNTYear4⋅ 1+ HealthInf( )t−1
NTreatmentCostYear5s,a,t =
%Treat ⋅%Ss,a ,t ⋅ Populations,a ,t ⋅ 1− MortalityRates,a ,t ⋅ RRMS( )4⋅
ProgramCost ⋅ NumberNTYear5⋅ 1+ HealthInf( )t−1
Or where, if persons with AMD are being targeted, each patient can receive a number of treatments over a 5-year period:NTreatmentCostYear1s,a,t = NTreats,a ,t ⋅ ProgramCost ⋅ NumberNTYear1⋅ 1+ HealthInf( )t−1
NTreatmentCostYear2s,a,t =
NTreatVA ,s,a,tVA
∑ ⋅ 1− RemRateVAtoNone − MortalityRates,a,t ⋅ RRM VA( )⎛
⎝ ⎜
⎞
⎠ ⎟ ⋅
ProgramCost ⋅ NumberNTYear2⋅ 1+ HealthInf( )t−1
NTreatmentCostYear4s,a,t =
NTreatVA ,s,a,tVA
∑ ⋅ 1− RemRateVAtoNone − MortalityRates,a,t ⋅ RRM VA( )3⎛
⎝ ⎜
⎞
⎠ ⎟ ⋅
ProgramCost ⋅ NumberNTYear4⋅ 1+ HealthInf( )t−1
Additional Other Health Costs
Persons with AMD also experience higher rates of accidental falls and depression which also lead to additional health costs.For accidental falls:
HealthCostFalls s,a ,t =
TotalPrevVA ,s,a ,t ⋅ RiskFall VA ,s,a ,t( )VA = EDS ,MILD ,MOD ,SEV
∑ ⋅CostperFall ⋅ 1+ HealthInf( )t−1
For depression:
HealthCostDeps,a ,t =
TotalPrevVA ,s,a ,t ⋅ RiskDepVA ,s,a ,t( )VA = EDS ,MILD ,MOD ,SEV
∑ ⋅CostperDep⋅ 1+ HealthInf( )t−1
Thus total health costs (HealthCost) is:
HealthCosts,a,t = BTreatmentCosts,a ,t + NTreatmentCosts,a,t
+HealthCostFalls s,a,t + HealthCostDeps,a,t
Productivity and Indirect Costs
Lower Employment Rate
While people with AMD do not experience a lower employment rate compared to the average for the population, the model allows for this assumption to change, which is important for allowing fl exibility to model other disease types in the future. Productivity costs for the untreated group and treated group are estimated separately as some programs increase the ability to be employed, such as rehabilitation and occupational therapy.
EmpCosts,a,t =
1− RREU VA( ) ⋅UPrev VA ,s,a,tVA = EDS ,MILD ,MOD ,SEV
∑
+ 1− RREBT VA( ) ⋅ BTPrev VA ,s,a ,tVA = EDS ,MILD ,MOD ,SEV
∑
+ 1− RRENT VA( ) ⋅ NTPrev VA ,s,a ,tVA = EDS ,MILD ,MOD ,SEV
∑
⎛
⎝
⎜ ⎜ ⎜ ⎜ ⎜ ⎜ ⎜
⎞
⎠
⎟ ⎟ ⎟ ⎟ ⎟ ⎟ ⎟
⋅
EmpRates,a ⋅ AWE s,a,0 ⋅ 52 ⋅ 1+AWE t − AWE 0
AWE 0
⎛
⎝ ⎜
⎞
⎠ ⎟
NTreatmentCostYear3s,a,t =
NTreatVA ,s,a,tVA
∑ ⋅ 1− RemRateVAtoNone − MortalityRates,a,t ⋅ RRM VA( )2⎛
⎝ ⎜
⎞
⎠ ⎟ ⋅
ProgramCost ⋅ NumberNTYear3⋅ 1+ HealthInf( )t−1
NTreatmentCostYear5s,a,t =
NTreatVA ,s,a,tVA
∑ ⋅ 1− RemRateVAtoNone − MortalityRates,a,t ⋅ RRM VA( )4⎛
⎝ ⎜
⎞
⎠ ⎟ ⋅
ProgramCost ⋅ NumberNTYear5⋅ 1+ HealthInf( )t−1
Appendix: Model Formulae

63Centrally Focussed
Productivity Costs of Premature Mortality
The higher rate of death for people with visual impairment means that some people may die before the average retirement age. Again, while this is less relevant for people with AMD, to allow fl exibility for other applications it is included. The cost of premature mortality is not separated between the untreated group and treated group as mortality is dependent on visual acuity rather than whether the person is treated. The productivity costs of premature mortality are allocated to the year that the person died.The expected lifetime earnings of a person at age a and of sex s is:
ExpectedLifetimeEarningss,a = EmpRates,A ⋅ AWE s,A ,t=1 ⋅ 52 ⋅ 1.0425( )A= a to 95
∑t−1
Thus the expected productivity cost from premature mortality is:
PMEmpCosts,a ,t = MortalityDueToAMDVA ,s,a,t
VA = EDS ,MILD ,MOD ,SEV
∑⎛
⎝ ⎜
⎞
⎠ ⎟ ⋅
ExpectedLifetimeEarningss,a ⋅ 1+AWE t − AWE 0
AWE 0
⎛
⎝ ⎜
⎞
⎠ ⎟
Carer Productivity Costs
Carers’ time spent caring for people with AMD is potentially time that could have been spent in the workplace or doing other constructive activities, such as housework or yard work. CarerEmpCost s,a,t = CarerEmpCostperPersonVA ⋅ TotalPrevVA
VA = EDS ,MILD ,MOD ,SEVERE
∑
×52 ⋅ 1+AWE t − AWE 0
AWE 0
⎛
⎝ ⎜
⎞
⎠ ⎟
Carers, Aids and Modifi cations & Other Costs
Other costs incurred include formal care costs, aids and modifi cations, and other costs. They are largely dependent on visual acuity.
OtherCosts,a,t =
FCperPerson VA +
AMperPersonVA +
OtherperPersonVA
⎛
⎝
⎜ ⎜ ⎜
⎞
⎠
⎟ ⎟ ⎟ ⋅ TotalPrevVA
VA = EDS ,MILD ,MOD ,SEV
∑⎛
⎝
⎜ ⎜ ⎜
⎞
⎠
⎟ ⎟ ⎟ ⋅ 1+ HealthInf( )t−1
Deadweight Losses
To calculate total deadweight losses, the total revenue required to pay for services and welfare payments to persons with AMD (or, in future potential applications, another form of visual impairment), and the total tax lost from persons with AMD (or another form of visual impairment) must be calculated. The average personal income tax and indirect tax rates are applied to the productivity cost estimates, assuming all persons experiencing severe AMD aged between 15 and 64 receive the disability pension, and the government always bears a set proportion of the health costs:
TaxRevt = PerIncTax + IndirectTax( ) ⋅ EmpCosts,a,t + PMEmpCosts,a,t + CarerEmpCost s,a ,ts,a
∑
Welfaret = DisabilityPension ⋅ 26 ⋅ 1+AWE t − AWE 0
AWE 0
⎛
⎝ ⎜
⎞
⎠ ⎟ ⋅ TotalPrev SEV ,s,a ,t
s,a=15 to 65
∑
GovtHealthCostt = HealthCostt ⋅ PropGovtHealthCost
Thus the total deadweight loss (DWL) is:
DWL t = TaxRev t + Welfaret + GovtHealthCostt( ) ⋅ DWLRate
Cost Effectiveness
The formulas used to estimate the cost effectiveness of an intervention in terms of total costs saved:
CEratio =
NPVTotalCost Base −
NPVTreatmentCostBase
⎛
⎝ ⎜
⎞
⎠ ⎟ −
NPVTotalCost Scenario −
NPVTreatmentCostScenario
⎛
⎝ ⎜
⎞
⎠ ⎟
NPVTreatmentCostScenario − NPVTreatmentCostBase( )
If the CE ratio is greater than $1 then there is a positive return to the intervention.The formula used to estimate the cost effectiveness of an intervention in terms of DALYs avoided:
$ perDALY =
NPVTotalCost Base −
NPVValueBoD Base
⎛
⎝ ⎜
⎞
⎠ ⎟ −
NPVTotalCost Scenario −
NPVValueBoD Scenario
⎛
⎝ ⎜
⎞
⎠ ⎟
NPVDALYs Scenario − NPVDALYs Base( )
If the $ per DALY is negative then the intervention is cost saving. Even if positive, if the $ per DALY is below the VSLY of $162,561 then the intervention is cost effective.
Appendix: Model Formulae

64 Centrally Focussed
65Centrally Focussed
Access Economics (2005) Business Outlook, June.
AREDS Research Group (2001), A randomised, placebo-controlled, clinical trial of high-dose supplementation with vitamins C and E, beta carotene and zinc for age-related macular degeneration and vision loss, Archives of Ophthalmology, Oct 2001, 119:1417-1436.
AREDS Research Group (2005), Risk Factors for the Incidence of Advanced Age-Related Macular Degeneration in the Age-Related Eye Disease Study (AREDS): AREDS Report No. 19, Ophthalmology, April 2005, 112(4):533-539.
Assink, J. J. M., Klaver, C. C. W., Houwing-Duistermaat, J. J., et al (2005), Heterogeneity of the genetic risk in Age-related Macular Disease, Ophthalmology, 2005, 112:482-487.
Australian Bureau of Statistics (2004) Employee Earnings, Benefi ts and Trade Union Membership, ABS Cat No 6310.0, August.
Australian Bureau of Statistics (2005) Australian Labour Market Statistics, ABS Cat No 6105.0, July.
Australian Bureau of Statistics (forthcoming) Population Projections, Australia, ABS Cat No 3222.0
Australian Institute of Health and Welfare (2004) Health Expenditure, Australia, Health and Welfare Series No 20, AIHW Cat. No. HWE-27, September.
Australian Institute of Health and Welfare (2005) Statistics on Drug Use in Australia, 2004, Drug Statistics Series No. 15, AIHW Cat. No. PHE-62, June.
Baird PN Guida E Chu DT et al (2004) The e2 and e4 Alleles of the Apolipoprotein Gene are associated with Age-Related Macular Degeneration, Investigative Ophthalmology and Visual Science, May 2004, 45(5):1311-1315.
Bartlett H and Eperjesi F (2004) Age related macular degeneration and nutritional supplementation: a review of randomized controlled trials, Ophthalmic Physiology, 23(5):383-399.
Black A and Wood J (2005) Vision and Falls: Review, Clinical experimental Optometry, 2005, 88(4):212-222.
Bressler NM and Bressler SB (2000) Photodynamic Therapy with Verteporfi n (Visudyne): Impact on Ophthalmology and Visual Sciences, Investigative Ophthalmology and Visual Science, March 2000, 41(3):624-628.
Bressler SB, Pieramici DJ, Koester JM et al (2004) Natural history of minimally classic subfoveal choroidal neovascular lesions in the treatment of age-related macular degeneration with PDT investigation, Archives of Ophthalmology, 2004, 122:325-329.
Brody BL, Gamst AC, Williams RA et al (2001) Depression, Visual Acuity, Comorbidity and disability associated with age-related macular degeneration, Ophthalmology, October 2001, 108(10):1893-1901.
Burmedi D, Becker S, Heyl S et al (2002) Emotional and social consequences of age-related low vision, Visual Impairment Research, 2002, 4(I):47-71.
Bylsma GW and Guymer RH (2005) Treatment of age-related macular degeneration: Invited Review, Clinical and Experimental Ophthalmology, 5 Sep 2005, 88(5):1-13.
Bylsma GW, Harper CA, Dutton F, Johnson NC, Beaumont P, Guymer RH (in press) The Australian Angiogram Review Panel - monitoring the use of photodynamic therapy with verteporfi n, Clinical and Experimental Ophthalmology.
Centre for Eye Research Australia (2004) Clear Insight: The Economic Impact and Cost of Vision Loss in Australia, prepared by Access Economics, published by Centre for Eye Research Australia, Melbourne 2004.
Centre for Eye Research Australia (2005) Investing in Sight: Strategic Interventions to Prevent Vision Loss in Australia prepared by Access Economics, published by Centre for Eye Research Australia, Melbourne 2004.
Chaine G, Hullo A, Sahel J et al (1998) Case control study of the risk factors for age related macular degeneration, British Journal of Ophthalmology; 82:996-1002.
References

66 Centrally Focussed
References
Christen WG, Glynn RJ, Manson JE et al (1996) A prospective study of cigarette smoking and are-related macular degeneration in men, Journal of the American Medical Association, 276:1147-1151.
Coleman AL, Stone K, Ewing S et al (2004) Higher risk of multiple falls among elderly women who lose visual acuity, Ophthalmology 2004;111: 857-862.
Collins D and Lapsley H (1999) The Social Costs of Tobacco in Victoria and the Social Benefi ts of QUIT, Victoria, Victorian Smoking and Health Program, Melbourne.
Cummings SR, Nevitt MC, Browner WS et al (1995) Risk factors for hip facture in white women. Study of Osteoporotic Fractures Research Group. New England Journal of Medicine, 332:767-773.
Dargent-Molina P, Favier F, Grandjean H et al (1996) Fall-related factors and risk of hip facture: the EPIDOS prospective study, Lancet, 348:145-149.
de Boer, MR, Pluijm, SM, Lips P et al (2004) Different aspects of visual impairment as risk factors for falls and fractures in older men and women, Journal of Bone and Mineral Research; 19:1539-1547.
Department of Health and Ageing (2000) Australia’s National Tobacco Campaign: Evaluation Report, Volume 2, Canberra, May.
Department of Health and Ageing (2004) 1997-2003 National Tobacco Campaign: Evaluation Reponse and Recall Measures Among Smokers and Recent Quitters, Canberra, April.
Edwards AO, Ritter R, Abel KJ et al (2005) Complement Factor H Polymorphism and Age-related Macular Degeneration, 10th March 2005.
Evans JR (2001) Risk Factors for Age-Related Macular Degeneration, Progress in Retinal and Eye Research, 2001, 20(2):227-253.
Evans JR (2002) Antioxidant vitamin and mineral supplements for AMD, The Cochrane Database of Systematic Reviews, 2002, Issue 2, Art No. CD000254 DOI: 10.1002/14651858. CD000254.
Eye Disease Case Control Study Group (1992) Risk factors for neovascular age-related macular degeneration, Archives of Ophthalmology; 110:1701-1708.
Felson, DT, Anderson JJ, Hannan MT et al (1989) Impaired vision and hip fracture. The Framingham Study, Journal of the American Geriatric Society, 37:495-500.
Friedman G, Tekawa I, Sadler M and Sidney S (1996) Smoking and Mortality: The Kaiser Permanente Experience, Monograph 8: Changes in Cigarette-Related Disease Risks and Their Implications for Prevention and Control, National Cancer Institute.
Germain D, Letcher T, Fuller T (2004) “Evaluation of the Victorian Fresh Start Short Course: January 2000 to February 2003” CBRC Research Paper Series No. 7. Melbourne, Australia: Centre for Behavioural Research in Cancer, The Cancer Council Victoria, June.
Goldberg J, Flowerdew G, Smith E et al (1998) Factors associated with age-related macular degeneration. An analysis of data from the fi rst National Health and Nutrition Examination Survey, American Journal of Epidemiology, 128:700-710.
Gragoudas ES, Adamis AP, Cunningham ET et al (2004) Pegaptanib for neovascular age-related macular degeneration, New England Medical Journal, 27 Dec 2004, 351:2805-2816.
Grisso JA, Kelsey JL, Strom BL et al (1991) Risk factors for falls as a cause of hip fracture in women. The Northeast Hip Fracture Study Group. New England Journal of Medicine, 324:1326-1331.
Haddad S, Chen CA, Santangelo SL et al (forthcoming) The genetics of AMD: A review of progress to date, paper under review.
Haddad WM, Coscas G, Soubrane G (2002) Eligibility for treatment and angiographic features at the early stage of exudative AMD, British Journal of Ophthalmology; 2002, 86:663-669.
Haines JL, Hauser MA, Schmidt S et al (2005) Complement Factor H variant increases the risk of Age-related Macular Degeneration, 10th March 2005.
Hammond CJ, Webster AR, Snieder H et al (2002) Genetic infl uence on early age-related
67Centrally Focussed
References
maculopathy. A Twin Study, Ophthalmology, April 2002, 109(4):730-736.
Hawkins BS, Bird A, Klein R et al (1999) Epidemiology of age-related macular degeneration, Molecular Vision, 1999, 5:5-26.
Hirvels H, Luukinen H, Laara E et al (1996) Risk factors of age-related maculopathy in a population 70 years of age or older, Ophthalmology; 103:871-877.
Hogg R, Chakravarthy U (2004) AMD and micronutrient antioxidants, Current Eye Research, 29(6):387-40.
Hopley C, Salkeld G, Mitchell P (2004a) Cost utility of PDT for predominantly classic neovascular AMD, British Journal of Ophthalmology, 2004, 88:982-987.
Hopley C, Salked G, Wang JJ et al (2004b) Cost utility of screening and treatment for early AMD with zinc and antioxidants, British Journal of Ophthalmology, 2004, 88:450-454.
Ivers RQ, Cumming RG, Mitchell P et al (1998) Visual impairment and falls in older adults: the Blue Mountains Eye Study, Journal of the American Geriatric Society, 46:58-64.
Ivers RQ, Norton R, Cumming RG et al (2000) Visual impairment and risk of hip fracture, American Journal of Epidemiology, 152:633-639.
Kahn HA, Leibowitz HM, Ganley JP et al (1977) The Framingham Eye Study II. Association of ophthalmic pathology with the single variables previously measured in the Framingham Heart Study, American Journal of Epidemiology; 106:33-41.
Keeffe JE, Misajon RA, Peacock S et al (2005) Estimation of vision-related disutility values using VisQol, ARVO conference proceedings, 2005.
Klaver CC, Assink JJ, van Leeuwen RV et al (2000) Incidence and progression rate of age-related maculopathy: the Rotterdam Study, Investigative Ophthalmology and Visual Science; 42:2237-41.
Klaver CC, Wolfs RC, Assink JJ et al (1998a) Genetic risk of age-related maculopathy: population-based familial aggregation study, Archives of Ophthalmology; 116:1646-1651.
Klaver CC, Kliffen M, van Duijn CM et al (1998b) Genetic association of apolipoprotein E with age-related macular degeneration, American Journal of Human Genetics, 63:200-206.
Klein BE, Klein R, Lee KE et al (1998) Performance-based and self-assessed measures of visual function as related to history of falls, hip fractures, and measured gait time. The Beaver Dam Eye Study, Ophthalmology, 1998, 105:160-164.
Klein BE, Klein R, Jensen SC et al (1994) Are sex hormones associated with age-related maculopathy in women? The Beaver Dam Eye Study, Trans American Ophthalmology Society; 92: 289-295.
Klein BE and Klein R (1982) Cataracts and macular degeneration in older Americans, Archives of Ophthalmology, 100:571-573.
Klein RJ, Zeiss C, Chew EY et al (2005) Complement Factor H Polymorphism in Age-related Macular Degeneration, Science Express: 10th March 2005.
Klein R, Klein BEK, Tomany SC et al (2003) The association of cardiovascular disease with the long-term incidence of age-related maculopathy, Ophthalmology, Jun 2003, 110(6):1273-1280.
Klein R, Klein BEK, Tomany SC et al (2002) Ten-year incidence and progression of age-related maculopathy. The Beaver Dam Eye Study, Ophthalmology, 2002, 109:1767-1779.
Klein R, Klein BEK, Jensen SC et al (1997) The 5-year incidence and progression of age-related maculopathy, The Beaver Dam Eye Study, Ophthalmology, 1997, 104:7-21.
Klein R, Klein BE, Franke T (1993a) The relationship of cardiovascular disease and its risk factors to age related maculopathy. The Beaver Dam Eye Study, Ophthalmology, 100:406-414.
Klein R, Klein BEK, Linton KLP et al (1993b) The Beaver Dam Eye Study: the relation of age-related maculopathy to smoking, The American Journal of Epidemiology; 137:190-200.
Koski K, Luukinen H, Laippala P et al (1998) Risk factors for major injurious falls among the home-dwelling elderly by functional abilities. A prospective population-based study, Gerontology; 44:232-238.
Lees M, Price N, Mitchell P, Beaumont P, Aldridge G, Shulz M and Stokes J (forthcoming), Economic

68 Centrally Focussed
References
evaluation of photodynamic therapy (PDT) with verteporfi n in patients with small subfoveal choroidal neovascular lesions in Australia, Ophthalmology.
Macular Photocoagulation Study Group (1991a) Argon Laser Photocoagulation for Neovascular Maculopathy – Five-year results from randomized clinical trials, Archives of Ophthalmology,109:1109-1114 (Table 2)
Macular Photocoagulation Study Group (1991b) Laser Photocoagulation of Subfoveal Neovascular Lesions in Age-Related Macular Degeneration, Archives of Ophthalmology, 109:1220-1231 (Table 3/4)
Macular Photocoagulation Study Group (1990) Krypton Laser Photocoagulation for Neovascular Lesions of Age-Related Macular Degeneration, Archives of Ophthalmology, 108:816-824 (Table 2/3)
Macular Photocoagulation Study Group (1986) Argon Laser Photocoagulation for Neovascular Maculopathy – Three year results from randomized clinical trials, Archives of Ophthalmology;104:694-701 (Table 2/3)
Maltzman BA, Mulvihill MN and Greenbaum A (1979) Senile macular degeneration and risk factors: a case control study, Annals of Ophthalmology, 11:1197-1201.
Margherio RR, Margherio AR and DeSantis ME (2000) Laser treatments with verteporfi n therapy and its potential impact on retinal practices, Retina: the Journal of Retinal & Vitreous Diseases, 20: 325-330.
Mathers C, Vos T, Stevenson C (1999) The burden of disease and injury in Australia. Australian Institute of Health and Welfare, Canberra: AIHW.
McCarty CA, Mukesh BN, Fu CL et al (2001) Risk factors for age-related maculopathy, The Visual Impairment Project, Archives of Ophthalmology, Oct 2001, 119:1455-1462.
Miller M and Wood L (2001) Smoking cessation interventions: review of evidence and implications for best practice in health care settings, Commonwealth Department of Health and Ageing (Coordinated by the National Heart Foundation as part of the National Tobacco Strategy 1999 to 2002-03), Canberra, August.
Mitchell P, Smith W, Attebo K et al (1995) Prevalence of age-related maculopathy in Australia, The Blue Mountains Eye Study, Ophthalmology, 1995;102:1450-1460.
Mitchell P, Wang J, Foran S and Smith W (2002) Five-year incidence of Age-related Maculopathy Lesions: The Blue Mountains Eye Study, Ophthalmology; 109:1092-1097.
Moeller SM and Mares JA (unknown) Ethnic differences in diet and age-related maculopathies, Ethnic Differences in Maculopathies; Lippincott, Williams and Wilkins.
Moisseiev J, Alhalel A, Masuri R et al (1995), The impact of the macular photocoagulation study results on the treatment of exudative macular degeneration, Archives of Ophthalmology; 113: 185-189.
Mukesh BN, Dimitrov PN, Leikin S et al (2004) 5-yr incidence of age-related maculopathy, The Visual Impairment Project, Ophthalmology, 2004, 111:1176-1182.
Newsome DA, Swartz M, Leone NC, Elston RC and Miller E (1988) Oral zinc in macular degeneration, Archives of Ophthalmology, 106:192-198.
Smith W, Mitchell P and Wang JJ (1997), Gender, oestrogen, hormone replacement and age-related macular degeneration: results from the Blue Mountains Eye Study, Australia and New Zealand Journal of Ophthalmology; 25:S13-S15.
Smith W, Mitchell P and Leeder SR (1996) Smoking and age-related maculopathy. The Blue Mountains Eye Study, Archives of Ophthalmology, 114:1518-1523.
Souied EH, Benlian P, Amouyel P et al (1998) The e4 allele of the apolipoprotein E gene as a potential protective factor for exudative AMD, American Journal of Ophthalmology, 1998; 125:353-359.
TAP Study Group (2002) Verteporfi n Therapy of Subfoveal Choroidal Neovascularisation in Patients with Age-related Macular Degeneration, Archives of Ophthalmology, 2002,120:1143-1454.
Taylor HR, West S, Munoz B et al (1992) The long term effects of visible light on the eye, Archives
69Centrally Focussed
References
of Ophthalmology, Jan 1992, 110:99-104.
Thornton J, Edwards R, Mitchell P, Harrison RA, Buchan I, Kelly, SP (2005) Smoking and age-related macular degeneration: a review of association, Eye, 19: 935-944/
Tikellis G, Robman LD, Guymer RH et al (forthcoming) Characteristics of progression of early AMD: The cardiovascular health and age-related maculopathy study, unpublished.
Tomany SC, Cruickshanks KJ, Klein R et al (2004) Sunlight and the 10-yr incidence of age-related maculopathy, Archives of Ophthalmology, May 2004, 122:750-757.
Tomany SC, Wang JJ, van Leeuwen R et al (2004) Risk Factors for Incident age-related macular degeneration, Ophthalmology; 111:1280-1287.
Trevithink J, Massel D, Robertson J et al (2004) Model study of AREDS antioxidant supplementation of AMD compared to visudyne: A dominant strategy?, Ophthalmic Epidemiology, 2004; 11:337-346.
VanNewkirk MR, Nanjan MB, Wang JJ et al (2000) The Prevalence of ARM, The Visual Impairment Project, Ophthalmology, 2000, 107:1593-1600.
Verteporfi n in Photodynamic Therapy Study Group (2001) Verteporfi n Therapy of Subfoveal Choroidal Neovascularization in Age-related Macular Degeneration: 2 year results of a randomised clinical trial including lesions with occult with no classic choroidal neovascularisation - VIP Therapy Report 2, American Journal of Ophthalmology, May 2001, 131(5):541-560.
Vinding T, Appleyard M, Nyboe J et al (1992) Risk factor analysis for atrophic and exudative age-related macular degeneration. An epidemiological study of 1000 aged individuals, Acta Ophthalmology; 70: 66-72.
Vingerling JR, Dielemans I, Witterman JCM et al (1995) Macular degeneration and early menopause: a case-control study, British Medical Journal; 310: 1570-1571.
Vingerling JR, Hofman A, Grobbee DE et al (1996) Age-related macular degeneration and smoking: The Rotterdam Study, Archives of Ophthalmology, 114:1193-1196.
Vu HTV, Keeffe JE, McCarty CA, Taylor HR (2005) Impact of Unilateral and Bilateral Vision Loss on Quality of Life, British Journal of Ophthalmology, 89: 360-363.
Wang JJ, Klein R, Smith W et al (2003) Cataract surgery and the 5-yr incidence of late-stage age-related maculopathy, Ophthalmology, October 2003, 110(10):1960-1967.
Wang JJ, Mitchell P, Cumming R and Smith W (2002) Visual impairment and nursing home placement in older Australians: the Blue Mountains Eye Study, Opthalmic Epidemiology, 10(1):3-13.
West SK, Rosenthal FS, Bressler NM et al (1989) Exposure to Sunlight and Other Risk Factors for AMD, Archives of Ophthalmology, June 1989, 107:875-879.
Zareparsi S, Branham KEH, Li M, Shah S, Klein RJ, Ott J, Hoh J , Abecasis GR, Swaroop A (2005) Strong Association of the Y402H Variant in Complement Factor H at 1q32 with Susceptibility to Age-Related Macular Degeneration, American Journal of Human Genetics, 77:149-153.
Zawinka C, Ergun E and Stur M (2005) Prevalence of Patients Presenting with Neovascular Age-Related Macular Degeneration in an Urban Population, Retina, 25:324–331.

32 Gisborne St, East Melbourne, Victoria 3002
Tel: 61 3 9929 8360 Fax: 61 3 9662 3859
Email: [email protected]
Website: www.cera.org.au
ABN: 72 076 481 984
Centrally Focussed
The Impact of Age-Related Macular Degeneration
A Dynamic Economic Model and Report by Access Economics Pty Limited
Cen
trally Focu
ssed The Im
pact of Age-R
elated Macular D
egeneration
CERA is a core partner of the
Vision CRC
CERA is a partner of Vision 2020 Australia
C
M
Y
CM
MY
CY
CMY
K
AEcoverAMDfinal.eps 12/1/06 12:35:42 PMAEcoverAMDfinal.eps 12/1/06 12:35:42 PM

![Uveitic macular edema: a stepladder treatment paradigm€¦ · of macular edema [1,3–4], this review will focus on uveitic macular edema specifically. Uveitic macular edema Macular](https://img.pdfslide.us/doc/110x75/5ed770e44d676a3f4a7efe51/uveitic-macular-edema-a-stepladder-treatment-paradigm-of-macular-edema-13a4.jpg)