Embed Size (px)
Citation preview
©OS Financial Trading System
Centralized versus Decentralized Business
Strategy: Which is better for growth?
McDonalds Corporation (MCD) is the world’s largest fast food chain. MCD’s business strategy is
“centralized,” resulting in tight controls over both suppliers and franchisees. An immediate competitor
to McDonalds is Yum Brands (YUM). Although the business model is similar to MCD, YUM’s business
strategy is “decentralized” which carries along very different implications for growth as well as stock
price behavior.
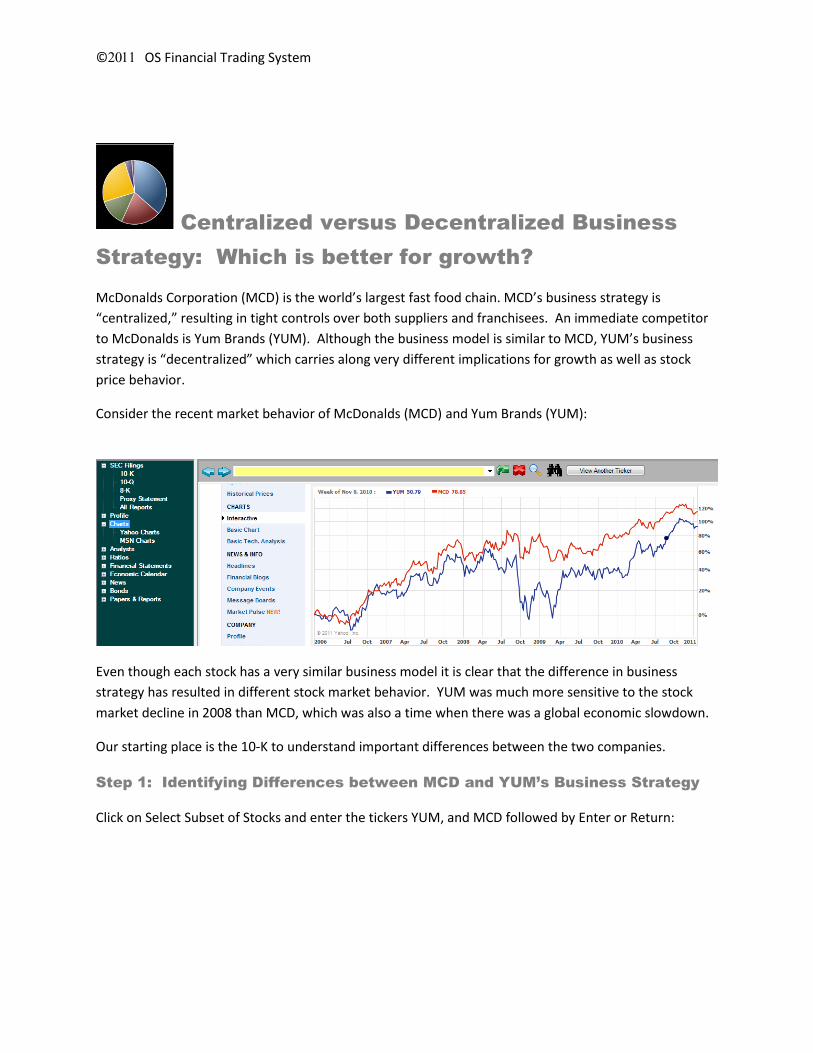
Consider the recent market behavior of McDonalds (MCD) and Yum Brands (YUM):
Even though each stock has a very similar business model it is clear that the difference in business
strategy has resulted in different stock market behavior. YUM was much more sensitive to the stock
market decline in 2008 than MCD, which was also a time when there was a global economic slowdown.
Our starting place is the 10-K to understand important differences between the two companies.
Step 1: Identifying Differences between MCD and YUM’s Business Strategy
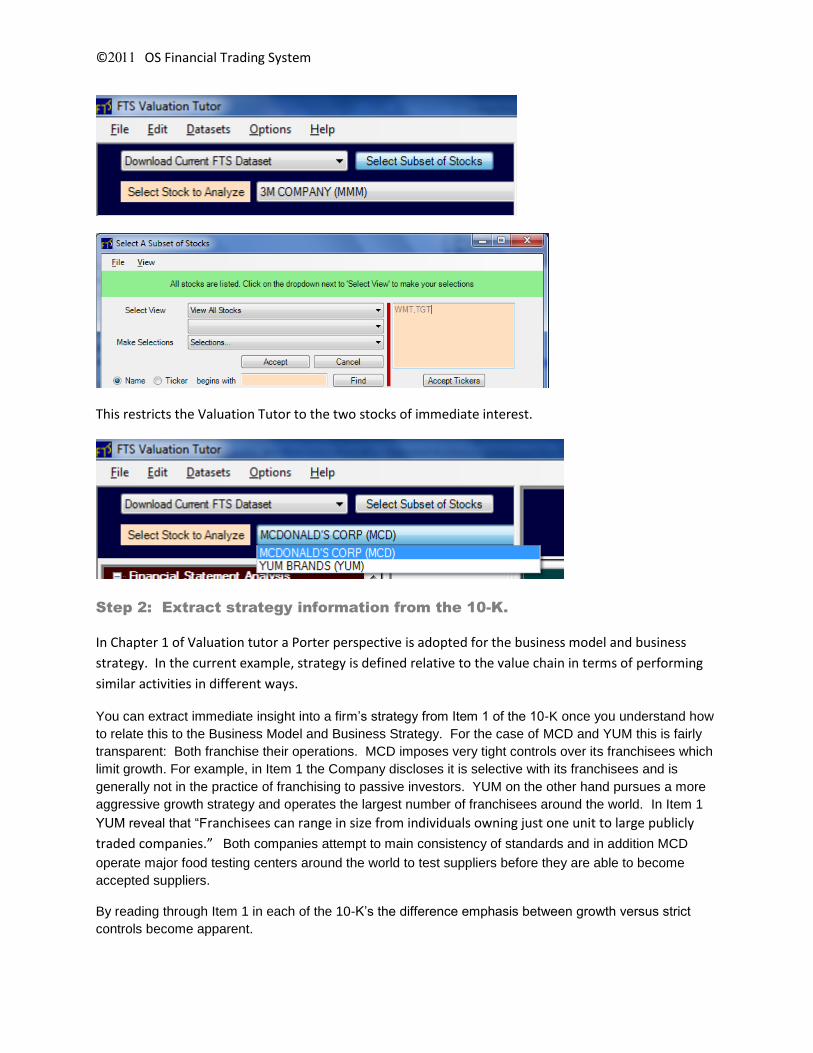
Click on Select Subset of Stocks and enter the tickers YUM, and MCD followed by Enter or Return:
©OS Financial Trading System
This restricts the Valuation Tutor to the two stocks of immediate interest.
Step 2: Extract strategy information from the 10-K.
In Chapter 1 of Valuation tutor a Porter perspective is adopted for the business model and business
strategy. In the current example, strategy is defined relative to the value chain in terms of performing
similar activities in different ways.
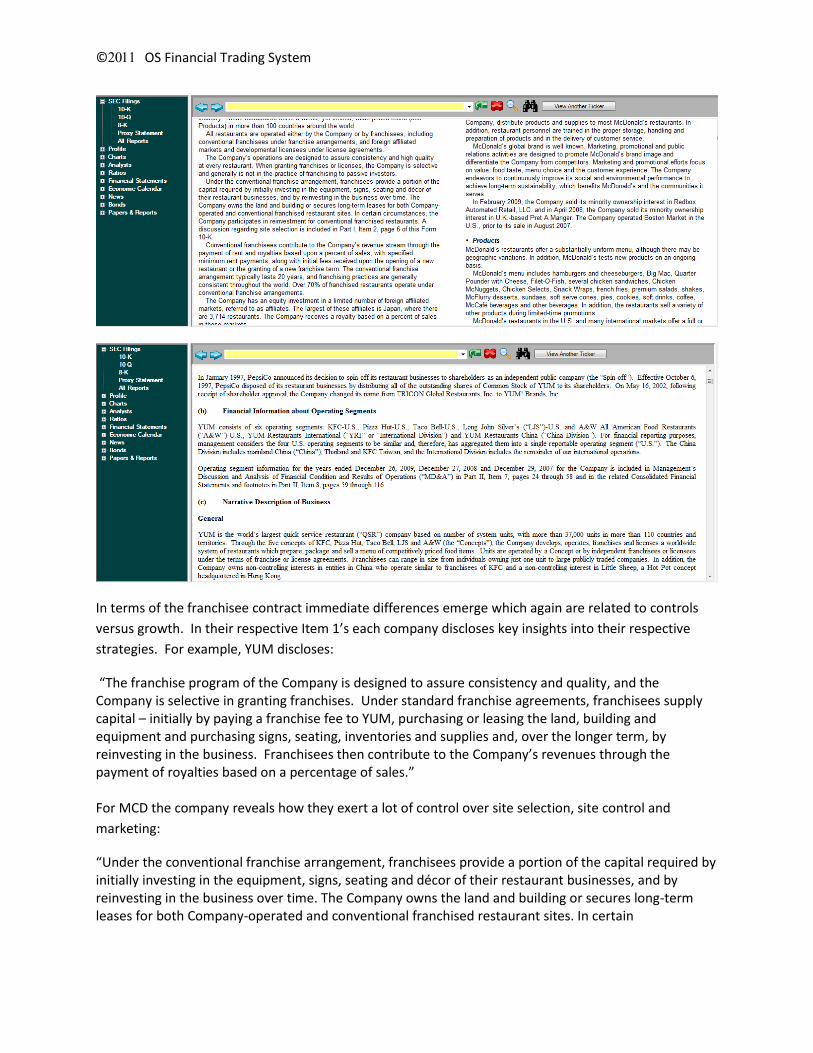
You can extract immediate insight into a firm’s strategy from Item 1 of the 10-K once you understand how
to relate this to the Business Model and Business Strategy. For the case of MCD and YUM this is fairly
transparent: Both franchise their operations. MCD imposes very tight controls over its franchisees which
limit growth. For example, in Item 1 the Company discloses it is selective with its franchisees and is
generally not in the practice of franchising to passive investors. YUM on the other hand pursues a more
aggressive growth strategy and operates the largest number of franchisees around the world. In Item 1
YUM reveal that “Franchisees can range in size from individuals owning just one unit to large publicly
traded companies.” Both companies attempt to main consistency of standards and in addition MCD
operate major food testing centers around the world to test suppliers before they are able to become
accepted suppliers.
By reading through Item 1 in each of the 10-K’s the difference emphasis between growth versus strict
controls become apparent.
©OS Financial Trading System
In terms of the franchisee contract immediate differences emerge which again are related to controls
versus growth. In their respective Item 1’s each company discloses key insights into their respective
strategies. For example, YUM discloses:
“The franchise program of the Company is designed to assure consistency and quality, and the Company is selective in granting franchises. Under standard franchise agreements, franchisees supply capital – initially by paying a franchise fee to YUM, purchasing or leasing the land, building and equipment and purchasing signs, seating, inventories and supplies and, over the longer term, by reinvesting in the business. Franchisees then contribute to the Company’s revenues through the payment of royalties based on a percentage of sales.” For MCD the company reveals how they exert a lot of control over site selection, site control and
marketing:
“Under the conventional franchise arrangement, franchisees provide a portion of the capital required by initially investing in the equipment, signs, seating and décor of their restaurant businesses, and by reinvesting in the business over time. The Company owns the land and building or secures long-term leases for both Company-operated and conventional franchised restaurant sites. In certain
©OS Financial Trading System
circumstances, the Company participates in reinvestment for conventional franchised restaurants. A discussion regarding site selection is included in Part I, Item 2, page 6 of this Form 10-K. “
A close reading of Item 1 reveals the subtle differences between the two strategies in terms of MCD’s
greater emphasis upon centralized control over the investment decision making versus YUM’s more
decentralized strategy that places more investment decision making in the hands of the franchisees.
Step 3: If the business strategy for each company is working what would we
expect to see in terms of some of the business ratios?
Stepping back we can make some immediate conjectures. First, we should expect to see YUM as very
sales driven relative to capital invested and growth orientated. MCD on the other hand we would
expect to see higher margins due to economies from scale arising from centralized components of the
investment decision, less sales driven per capital invested and higher levels of efficiency reflecting their
relatively more stable operating environments given the consistency imposed from centralized control.
Second, we should also expect to see a difference between the two companies in terms of risk even
though they have very similar business models. Again, the decentralized growth oriented strategy
should imply greater variance across franchisees along with greater risk. Offsetting this, however, is the
more diversified set of food offerings from YUM which may serve to absorb some of this risk.
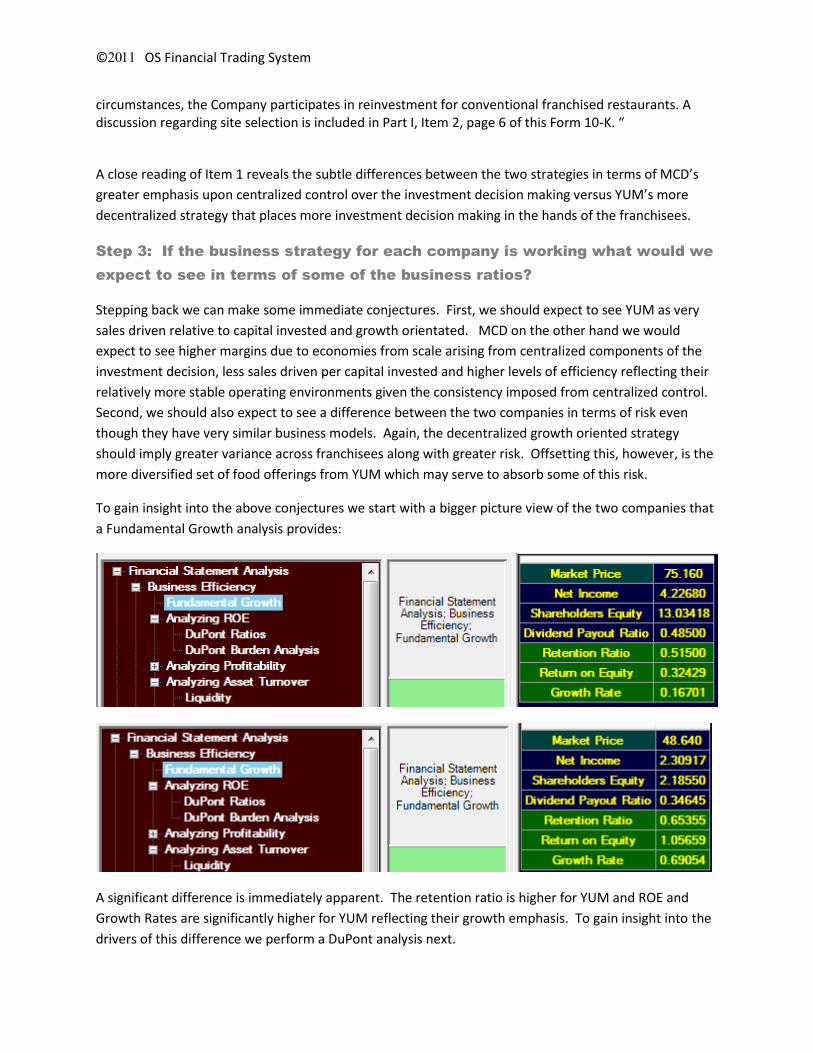
To gain insight into the above conjectures we start with a bigger picture view of the two companies that
a Fundamental Growth analysis provides:
A significant difference is immediately apparent. The retention ratio is higher for YUM and ROE and
Growth Rates are significantly higher for YUM reflecting their growth emphasis. To gain insight into the
drivers of this difference we perform a DuPont analysis next.
©OS Financial Trading System
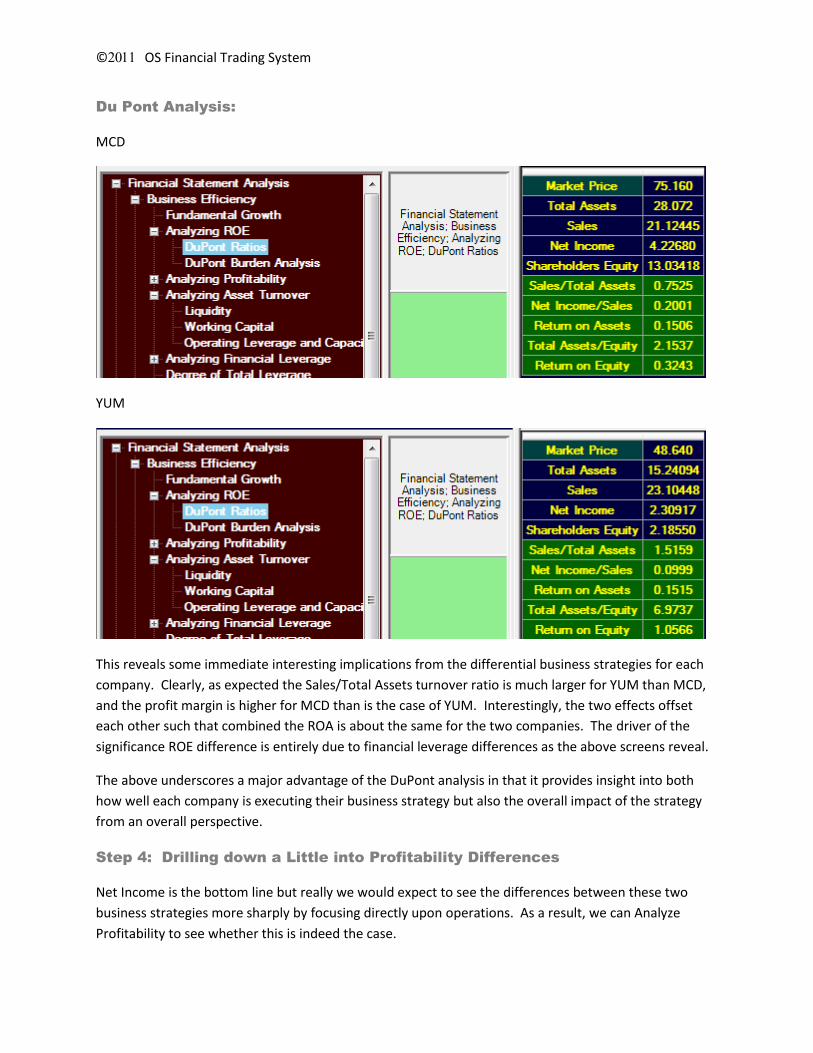
Du Pont Analysis:
MCD
YUM
This reveals some immediate interesting implications from the differential business strategies for each
company. Clearly, as expected the Sales/Total Assets turnover ratio is much larger for YUM than MCD,
and the profit margin is higher for MCD than is the case of YUM. Interestingly, the two effects offset
each other such that combined the ROA is about the same for the two companies. The driver of the
significance ROE difference is entirely due to financial leverage differences as the above screens reveal.
The above underscores a major advantage of the DuPont analysis in that it provides insight into both
how well each company is executing their business strategy but also the overall impact of the strategy
from an overall perspective.
Step 4: Drilling down a Little into Profitability Differences
Net Income is the bottom line but really we would expect to see the differences between these two
business strategies more sharply by focusing directly upon operations. As a result, we can Analyze
Profitability to see whether this is indeed the case.
©OS Financial Trading System
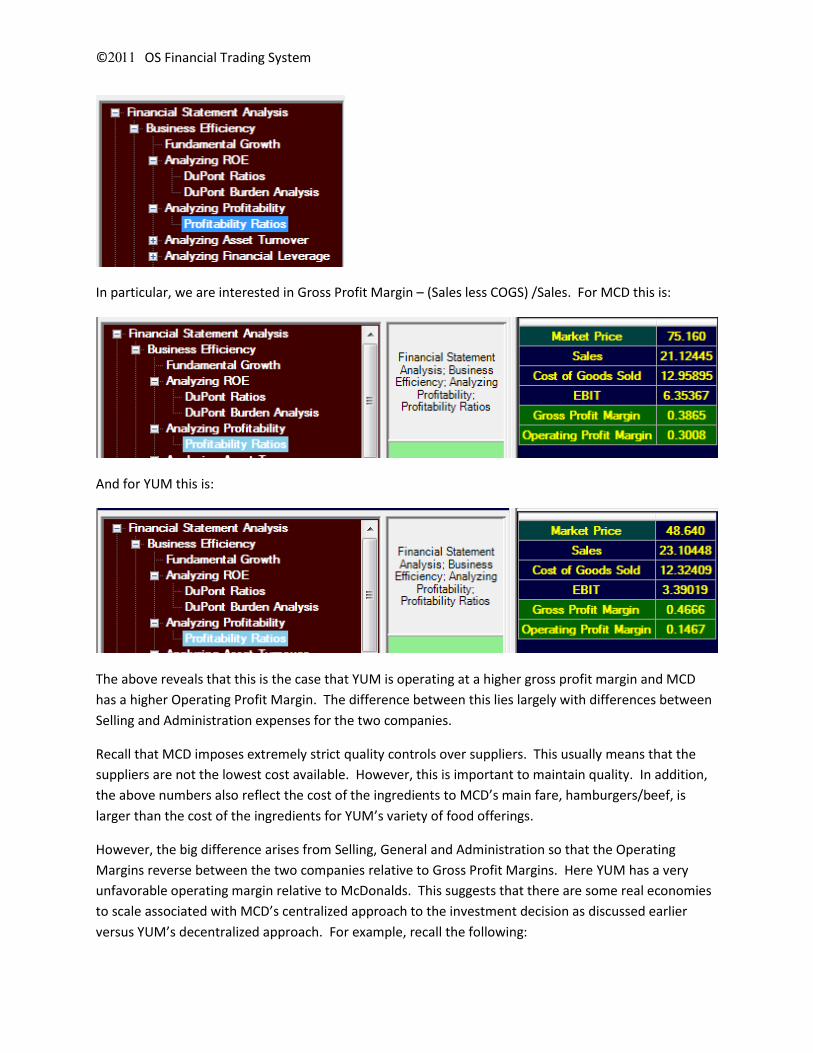
In particular, we are interested in Gross Profit Margin – (Sales less COGS) /Sales. For MCD this is:
And for YUM this is:
The above reveals that this is the case that YUM is operating at a higher gross profit margin and MCD
has a higher Operating Profit Margin. The difference between this lies largely with differences between
Selling and Administration expenses for the two companies.
Recall that MCD imposes extremely strict quality controls over suppliers. This usually means that the
suppliers are not the lowest cost available. However, this is important to maintain quality. In addition,
the above numbers also reflect the cost of the ingredients to MCD’s main fare, hamburgers/beef, is
larger than the cost of the ingredients for YUM’s variety of food offerings.
However, the big difference arises from Selling, General and Administration so that the Operating
Margins reverse between the two companies relative to Gross Profit Margins. Here YUM has a very
unfavorable operating margin relative to McDonalds. This suggests that there are some real economies
to scale associated with MCD’s centralized approach to the investment decision as discussed earlier
versus YUM’s decentralized approach. For example, recall the following:
©OS Financial Trading System
Recall Item 1 (italics added): “The franchise program of the Company is designed to assure consistency and quality, and the Company is selective in granting franchises. Under standard franchise agreements, franchisees supply capital – initially by paying a franchise fee to YUM, purchasing or leasing the land, building and equipment and purchasing signs, seating, inventories and supplies and, over the longer term, by reinvesting in the business. Franchisees then contribute to the Company’s revenues through the payment of royalties based on a percentage of sales.”
MCD’s franchisee agreement recall differs significantly by centralizing the purchasing/leasing decision
and actively reinvesting in the business to maintain consistency of standards across franchisees. From a
Selling, General and Administrative expense perspective MCD clearly maintains greater centralized
control over selling and marketing related expenses. This aspect of the MCD business strategy appears
to be a major driver of their operating profitability advantage.
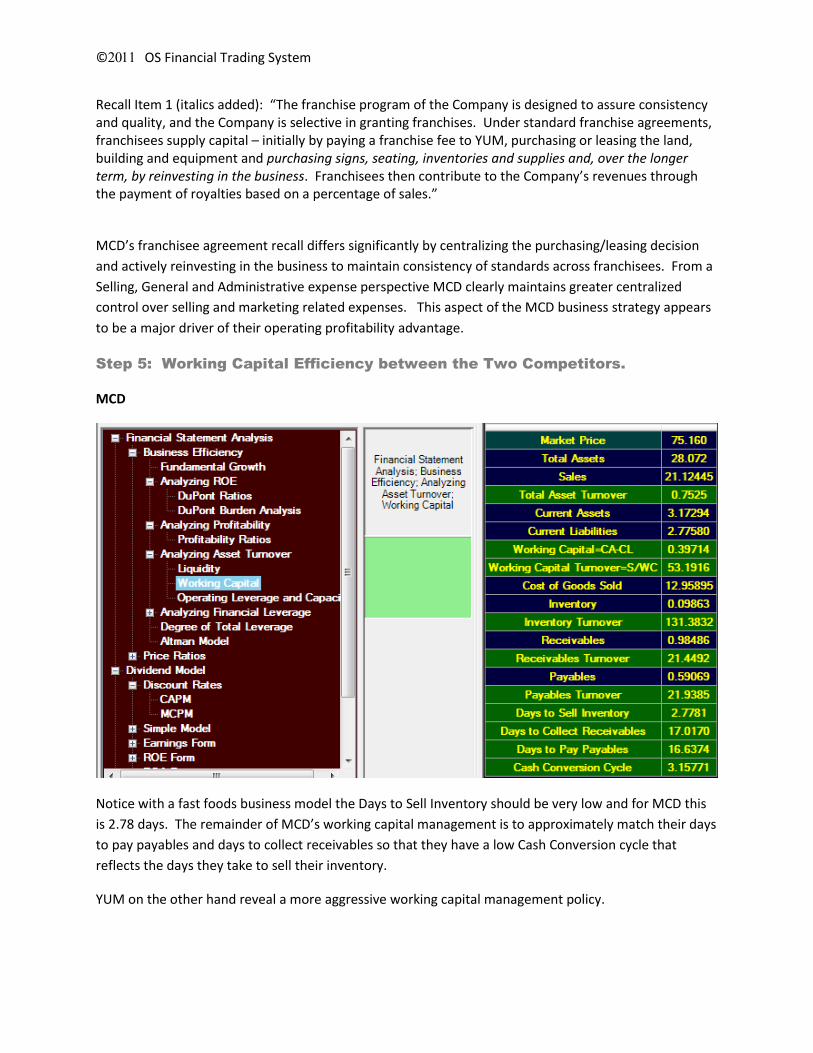
Step 5: Working Capital Efficiency between the Two Competitors.
MCD
Notice with a fast foods business model the Days to Sell Inventory should be very low and for MCD this
is 2.78 days. The remainder of MCD’s working capital management is to approximately match their days
to pay payables and days to collect receivables so that they have a low Cash Conversion cycle that
reflects the days they take to sell their inventory.
YUM on the other hand reveal a more aggressive working capital management policy.
©OS Financial Trading System
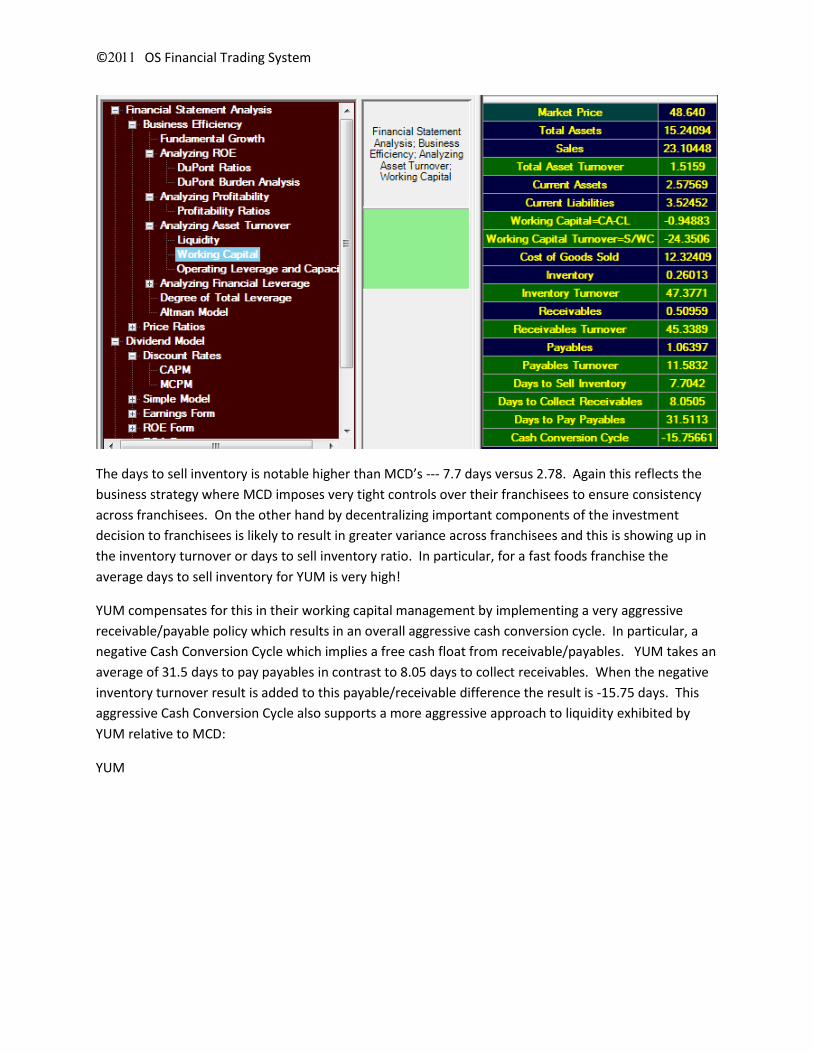
The days to sell inventory is notable higher than MCD’s --- 7.7 days versus 2.78. Again this reflects the
business strategy where MCD imposes very tight controls over their franchisees to ensure consistency
across franchisees. On the other hand by decentralizing important components of the investment
decision to franchisees is likely to result in greater variance across franchisees and this is showing up in
the inventory turnover or days to sell inventory ratio. In particular, for a fast foods franchise the
average days to sell inventory for YUM is very high!
YUM compensates for this in their working capital management by implementing a very aggressive
receivable/payable policy which results in an overall aggressive cash conversion cycle. In particular, a
negative Cash Conversion Cycle which implies a free cash float from receivable/payables. YUM takes an
average of 31.5 days to pay payables in contrast to 8.05 days to collect receivables. When the negative
inventory turnover result is added to this payable/receivable difference the result is -15.75 days. This
aggressive Cash Conversion Cycle also supports a more aggressive approach to liquidity exhibited by
YUM relative to MCD:
YUM
©OS Financial Trading System
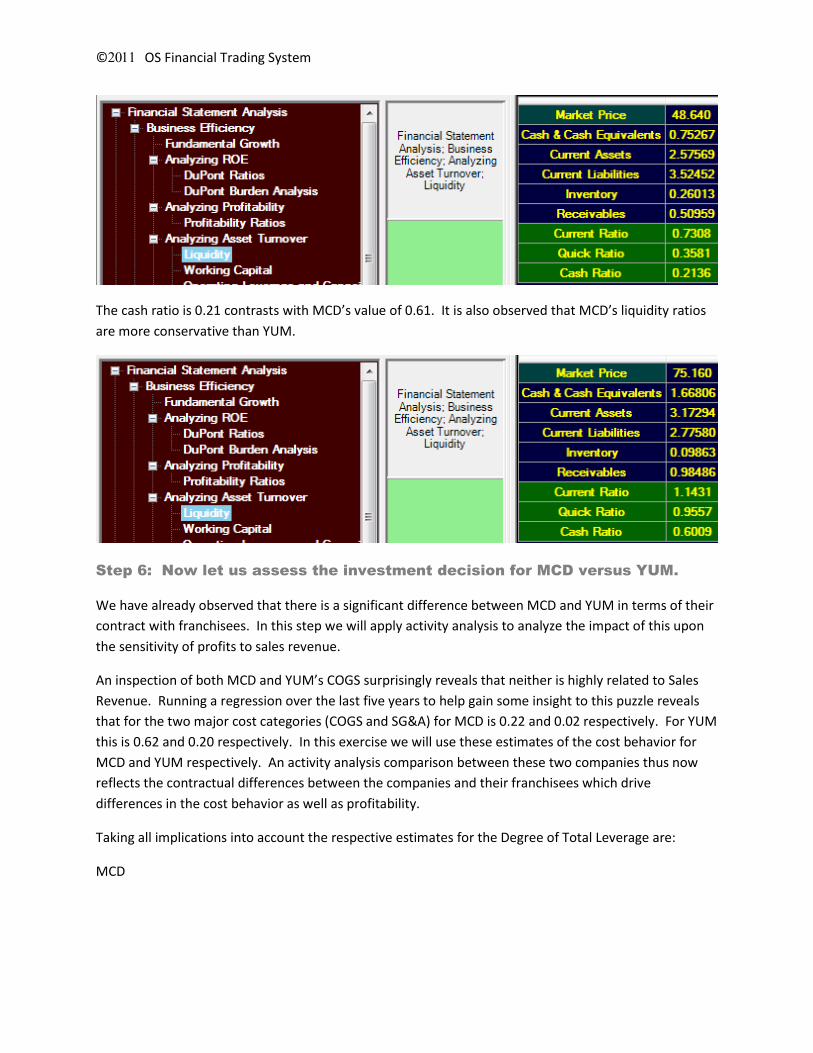
The cash ratio is 0.21 contrasts with MCD’s value of 0.61. It is also observed that MCD’s liquidity ratios
are more conservative than YUM.
Step 6: Now let us assess the investment decision for MCD versus YUM.
We have already observed that there is a significant difference between MCD and YUM in terms of their
contract with franchisees. In this step we will apply activity analysis to analyze the impact of this upon
the sensitivity of profits to sales revenue.
An inspection of both MCD and YUM’s COGS surprisingly reveals that neither is highly related to Sales
Revenue. Running a regression over the last five years to help gain some insight to this puzzle reveals
that for the two major cost categories (COGS and SG&A) for MCD is 0.22 and 0.02 respectively. For YUM
this is 0.62 and 0.20 respectively. In this exercise we will use these estimates of the cost behavior for
MCD and YUM respectively. An activity analysis comparison between these two companies thus now
reflects the contractual differences between the companies and their franchisees which drive
differences in the cost behavior as well as profitability.
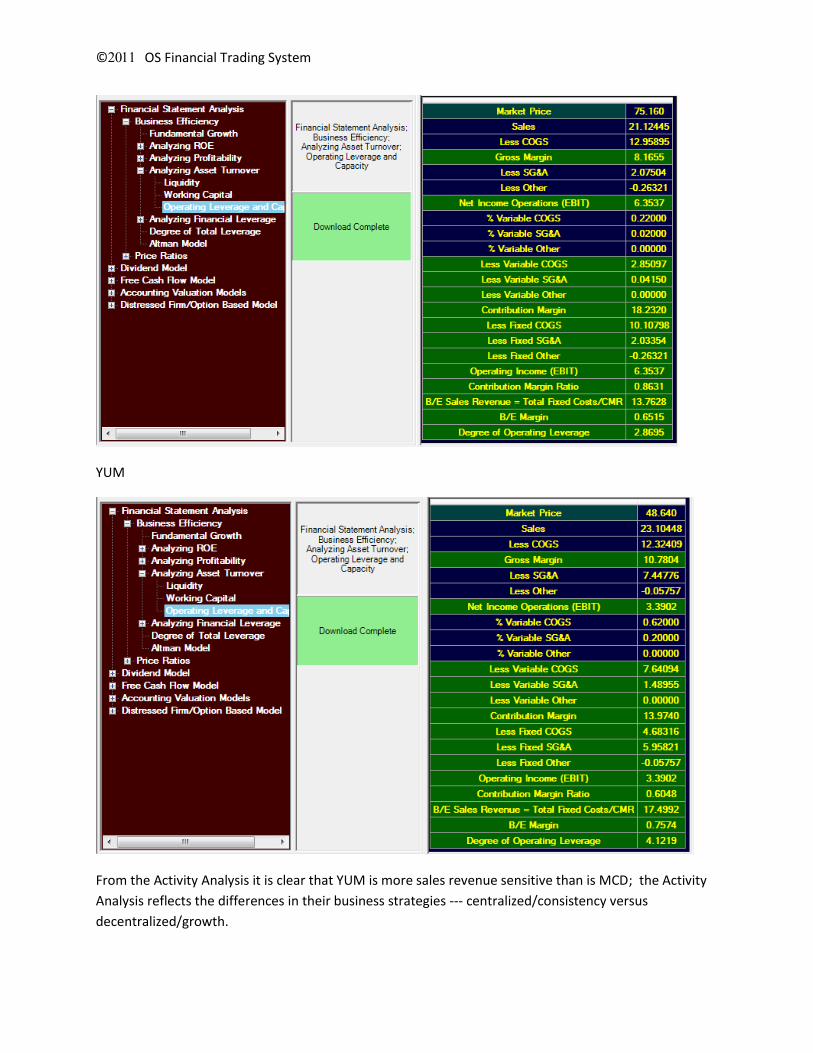
Taking all implications into account the respective estimates for the Degree of Total Leverage are:
MCD
©OS Financial Trading System
YUM
From the Activity Analysis it is clear that YUM is more sales revenue sensitive than is MCD; the Activity
Analysis reflects the differences in their business strategies --- centralized/consistency versus
decentralized/growth.
©OS Financial Trading System
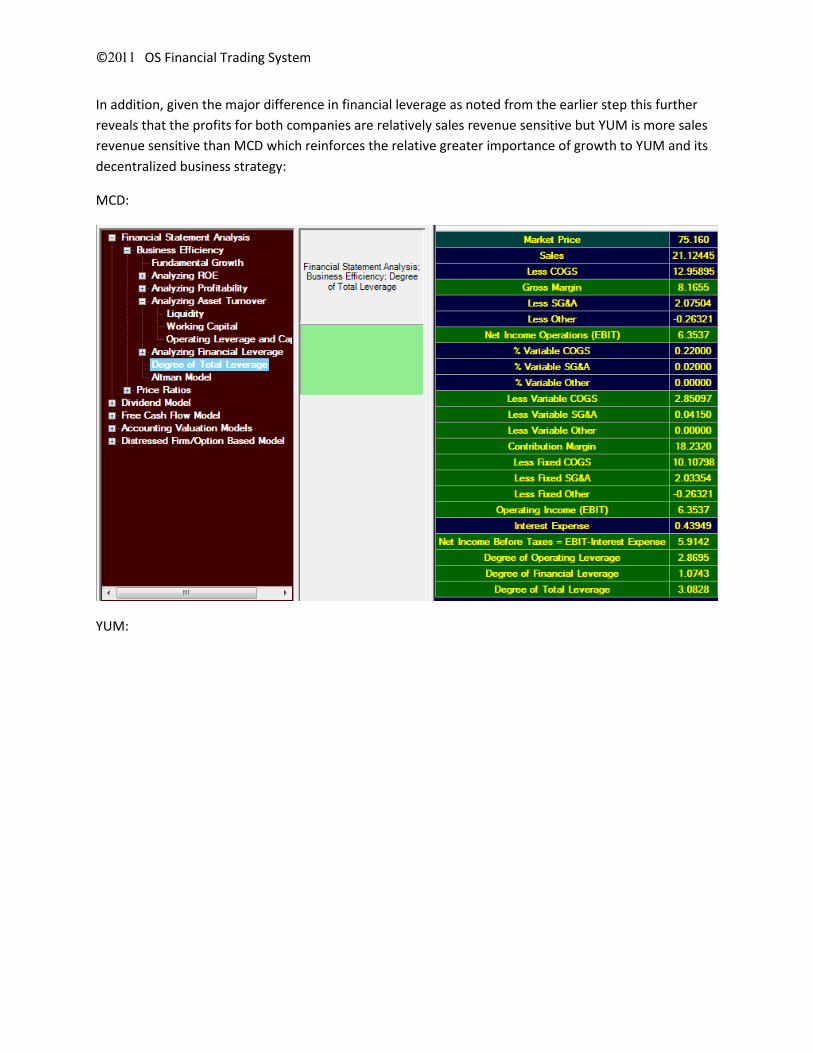
In addition, given the major difference in financial leverage as noted from the earlier step this further
reveals that the profits for both companies are relatively sales revenue sensitive but YUM is more sales
revenue sensitive than MCD which reinforces the relative greater importance of growth to YUM and its
decentralized business strategy:
MCD:
YUM:
©OS Financial Trading System
Step 7: Relating Activity Analysis to Recent Stock Price Behavior for YUM
and MCD
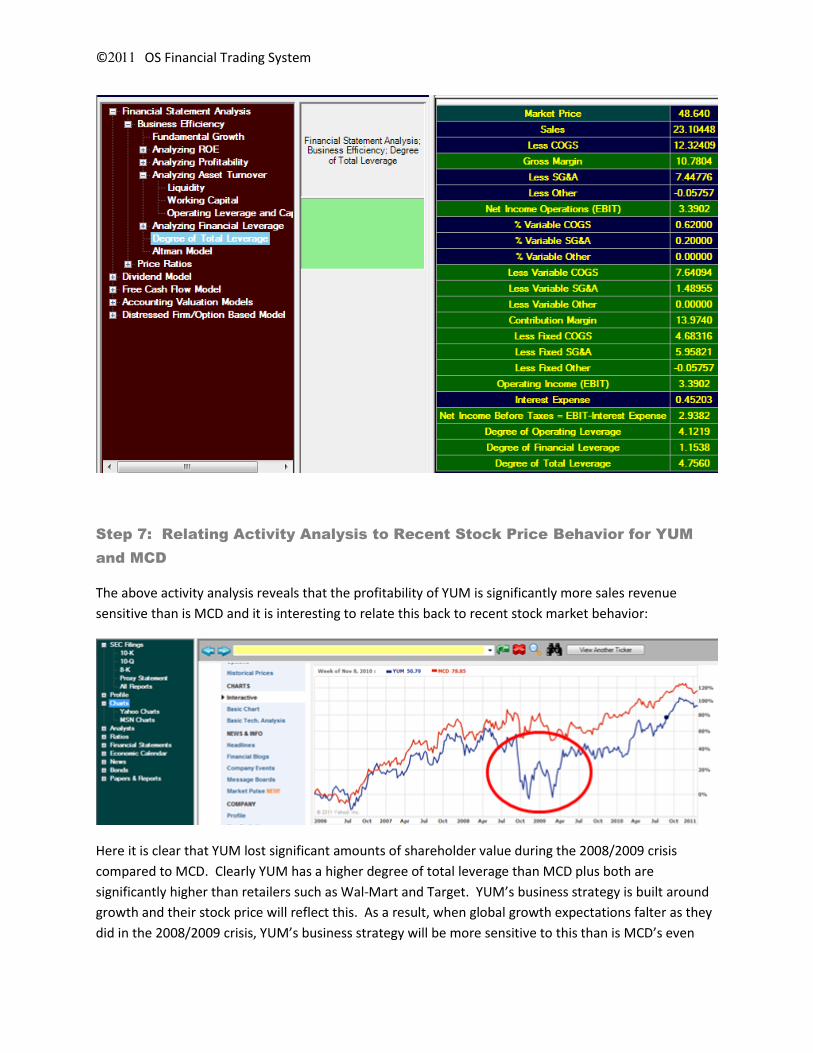
The above activity analysis reveals that the profitability of YUM is significantly more sales revenue
sensitive than is MCD and it is interesting to relate this back to recent stock market behavior:
Here it is clear that YUM lost significant amounts of shareholder value during the 2008/2009 crisis
compared to MCD. Clearly YUM has a higher degree of total leverage than MCD plus both are
significantly higher than retailers such as Wal-Mart and Target. YUM’s business strategy is built around
growth and their stock price will reflect this. As a result, when global growth expectations falter as they
did in the 2008/2009 crisis, YUM’s business strategy will be more sensitive to this than is MCD’s even
©OS Financial Trading System
though the fast food industry in general should be more resistant to downturns. The magnitude of
YUM’s downturn, however, does appear to be excessive given the relative small decline in total sales.
Looking back through past 10-K’s for YUM and MCD reveals the following:
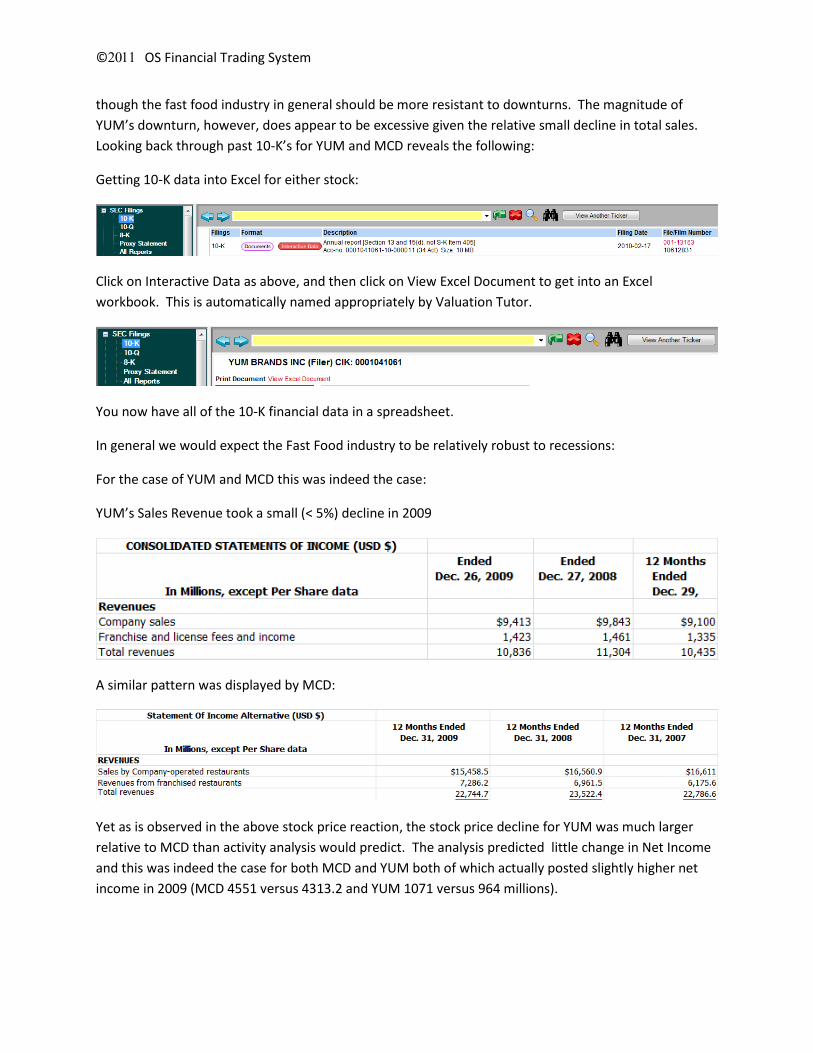
Getting 10-K data into Excel for either stock:
Click on Interactive Data as above, and then click on View Excel Document to get into an Excel
workbook. This is automatically named appropriately by Valuation Tutor.
You now have all of the 10-K financial data in a spreadsheet.
In general we would expect the Fast Food industry to be relatively robust to recessions:
For the case of YUM and MCD this was indeed the case:
YUM’s Sales Revenue took a small (< 5%) decline in 2009
A similar pattern was displayed by MCD:
Yet as is observed in the above stock price reaction, the stock price decline for YUM was much larger
relative to MCD than activity analysis would predict. The analysis predicted little change in Net Income
and this was indeed the case for both MCD and YUM both of which actually posted slightly higher net
income in 2009 (MCD 4551 versus 4313.2 and YUM 1071 versus 964 millions).
©OS Financial Trading System
These results are a little surprising for YUM given its relatively high degree of total leverage and raises
immediate questions regarding the extent to which accounting accruals are used to support this profit
increase. We will return to this point in a later step when we examine earnings quality.
From the above price graphs it appears the market evaluated the two companies very differently during
the 2008/2009 financial crisis and we will explore this question next by comparing the two companies
from the market’s perspective.
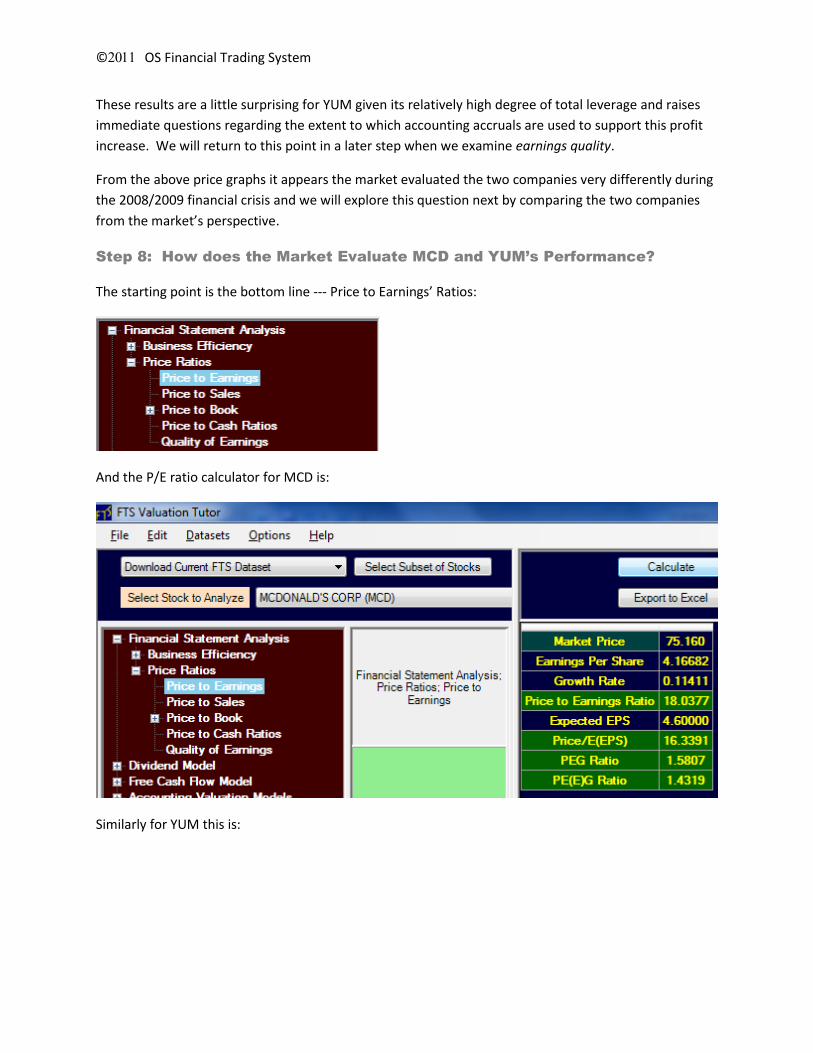
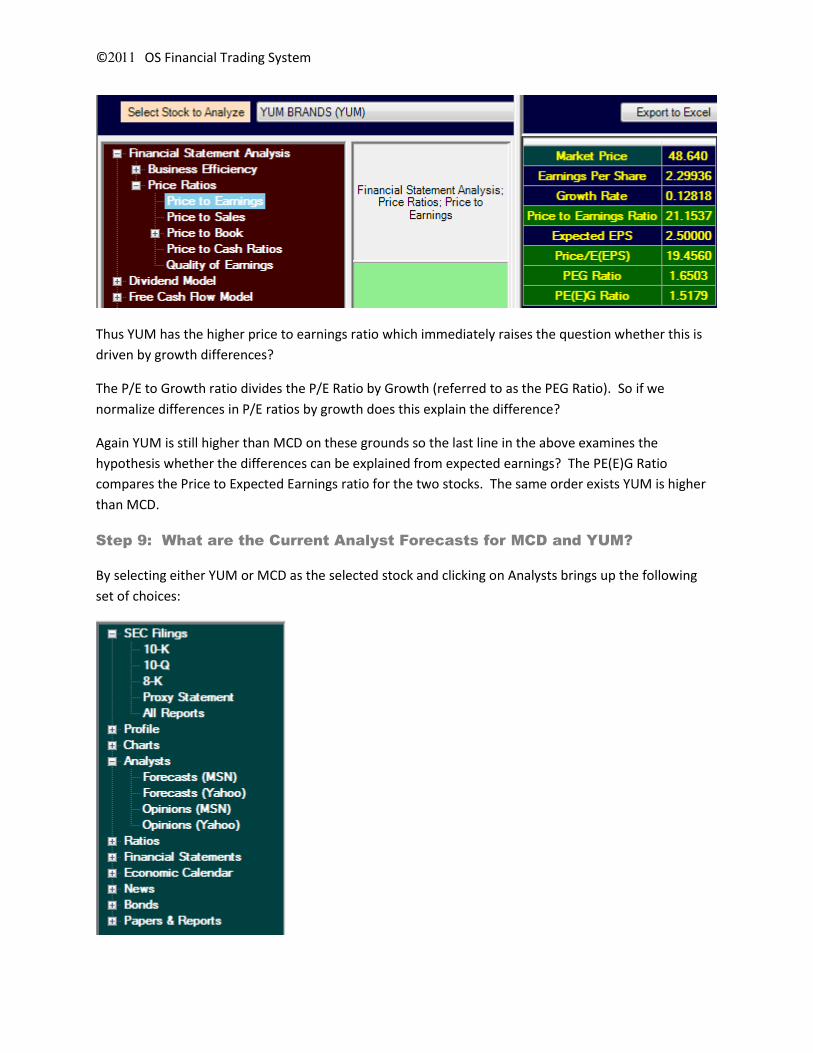
Step 8: How does the Market Evaluate MCD and YUM’s Performance?
The starting point is the bottom line --- Price to Earnings’ Ratios:
And the P/E ratio calculator for MCD is:
Similarly for YUM this is:
©OS Financial Trading System
Thus YUM has the higher price to earnings ratio which immediately raises the question whether this is
driven by growth differences?
The P/E to Growth ratio divides the P/E Ratio by Growth (referred to as the PEG Ratio). So if we
normalize differences in P/E ratios by growth does this explain the difference?
Again YUM is still higher than MCD on these grounds so the last line in the above examines the
hypothesis whether the differences can be explained from expected earnings? The PE(E)G Ratio
compares the Price to Expected Earnings ratio for the two stocks. The same order exists YUM is higher
than MCD.
Step 9: What are the Current Analyst Forecasts for MCD and YUM?
By selecting either YUM or MCD as the selected stock and clicking on Analysts brings up the following
set of choices:
©OS Financial Trading System
Not only does this set contain earnings forecasts but it also includes Sales revenue forecasts for the
Current Quarter, Next Quarter, Current Year and Next Year. This latter information can again be be
combined with the previous Activity Analysis to extract additional information. Chapter 3 of the
Valuation Tutor text provides the details of how to make your own predictions from Sales forecasts and
Activity Analysis.
A current review of analyst 5-year forecasts report consensus ranges from 9.3 to 10.14% for MCD and
11.1 to 12.37% for YUM. Again this is consistent with YUM’s strategy of pursuing growth although the
consensus for sales growth for YUM is lower (4.1%) than the current consensus for MCD’s sales growth
(5.90%). As a result, in the next step we will explore how the market is valuing sales.
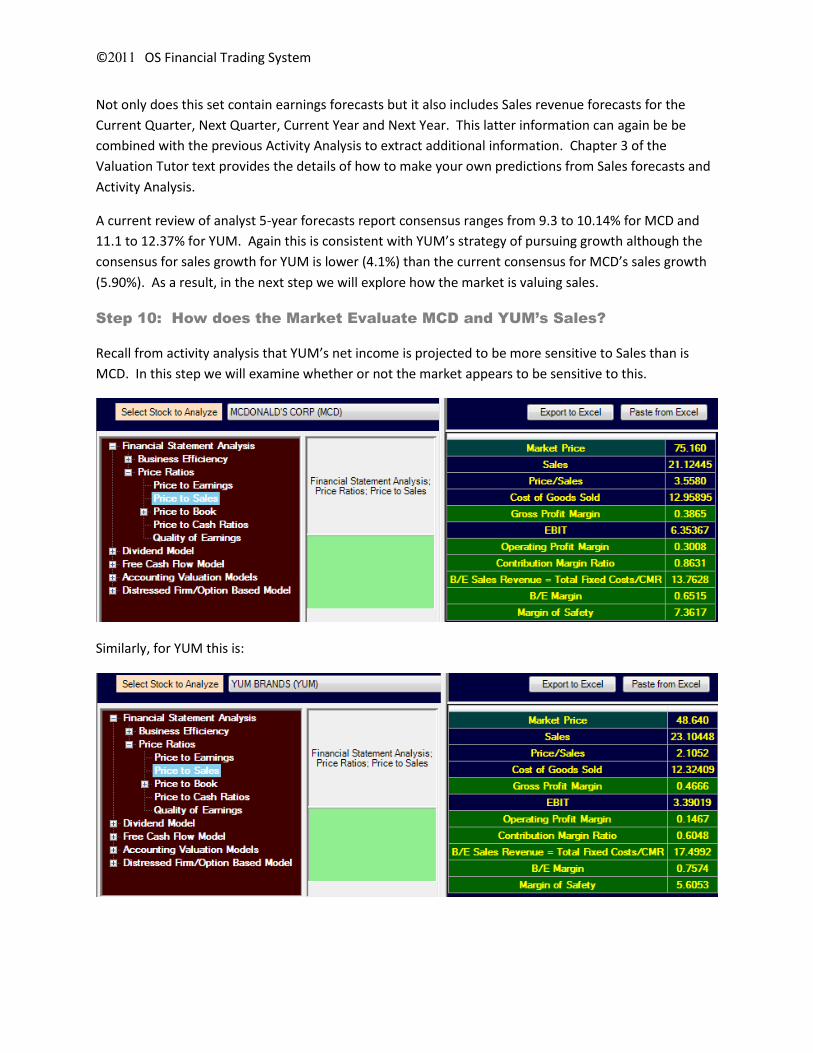
Step 10: How does the Market Evaluate MCD and YUM’s Sales?
Recall from activity analysis that YUM’s net income is projected to be more sensitive to Sales than is
MCD. In this step we will examine whether or not the market appears to be sensitive to this.
Similarly, for YUM this is:

©OS Financial Trading System
The market is pricing Sales for MCD higher than YUM. This appears to be consistent with the market not
assessing much growth in sales for YUM combined with the fact that MCD is expected to be more
efficient at converting existing levels of sales into profits.
Step 11: How does the Market Evaluate MCD and YUM’s Book Value?
One of the Fama and French factors is Book to Price Ratio. They use the reverse of the usual Price to
Book ratio for statistical reasons so that the divisor is always a positive number. Book to Price is the
inverse of the Price to Book Ratio and preserves relative rankings regardless of whether the Book value
is positive or negative. For MCD and YUM this is:
Niether MCD or YUM have a high loading on the Fama and French factor (1/(Price/Book)) and on a
relative basis YUM has a much lower value. For this example, the Fama and French factor has little to
say about risk but merely reflects the fact that MCD’s business strategy is different to YUM whereby
MCD assumes ownership of land and long term leases whereas YUM passes this onto the franchisees. In
©OS Financial Trading System
fact, MCD’s assets per share are higher than YUM which in this case implies less risk not more risk for
MCD versus YUM for this factor.
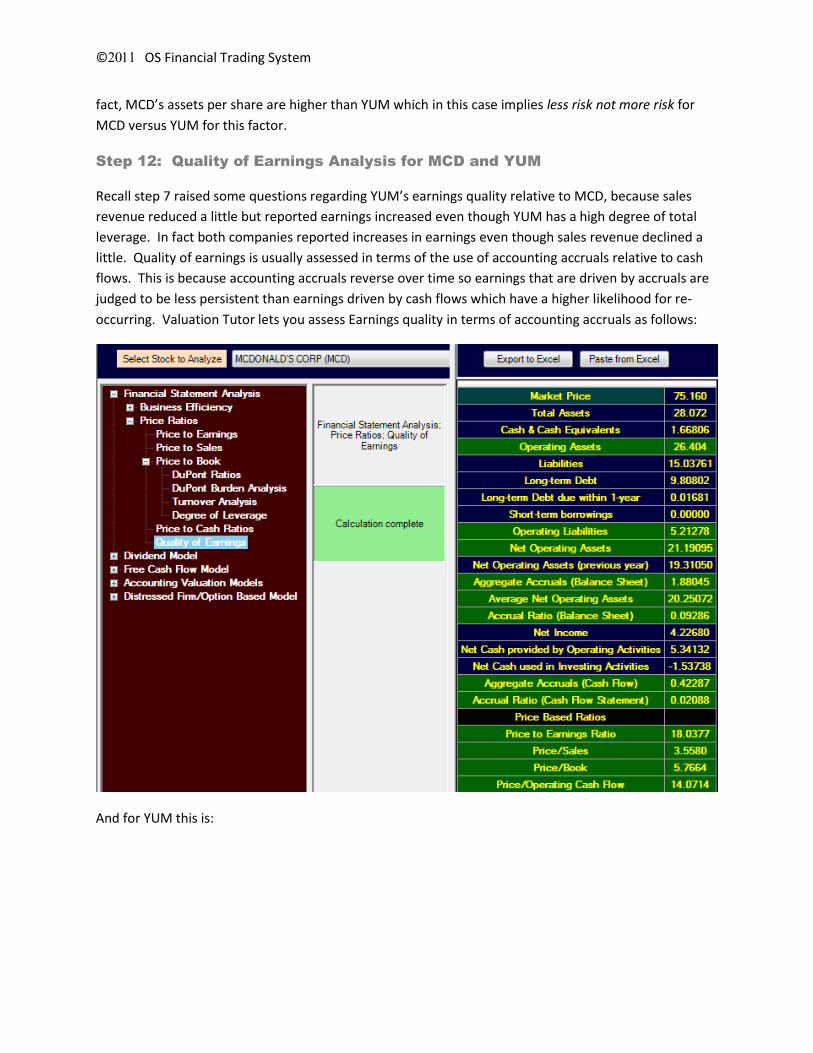
Step 12: Quality of Earnings Analysis for MCD and YUM
Recall step 7 raised some questions regarding YUM’s earnings quality relative to MCD, because sales
revenue reduced a little but reported earnings increased even though YUM has a high degree of total
leverage. In fact both companies reported increases in earnings even though sales revenue declined a
little. Quality of earnings is usually assessed in terms of the use of accounting accruals relative to cash
flows. This is because accounting accruals reverse over time so earnings that are driven by accruals are
judged to be less persistent than earnings driven by cash flows which have a higher likelihood for re-
occurring. Valuation Tutor lets you assess Earnings quality in terms of accounting accruals as follows:
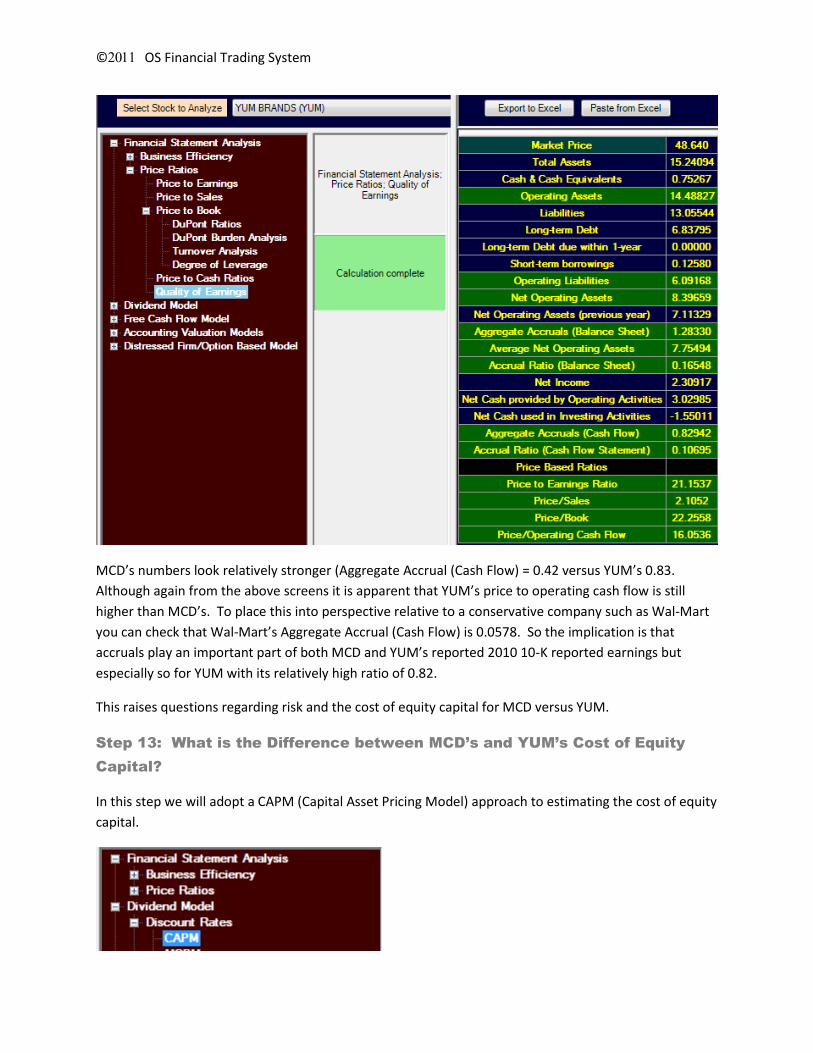
And for YUM this is:
©OS Financial Trading System
MCD’s numbers look relatively stronger (Aggregate Accrual (Cash Flow) = 0.42 versus YUM’s 0.83.
Although again from the above screens it is apparent that YUM’s price to operating cash flow is still
higher than MCD’s. To place this into perspective relative to a conservative company such as Wal-Mart
you can check that Wal-Mart’s Aggregate Accrual (Cash Flow) is 0.0578. So the implication is that
accruals play an important part of both MCD and YUM’s reported 2010 10-K reported earnings but
especially so for YUM with its relatively high ratio of 0.82.
This raises questions regarding risk and the cost of equity capital for MCD versus YUM.
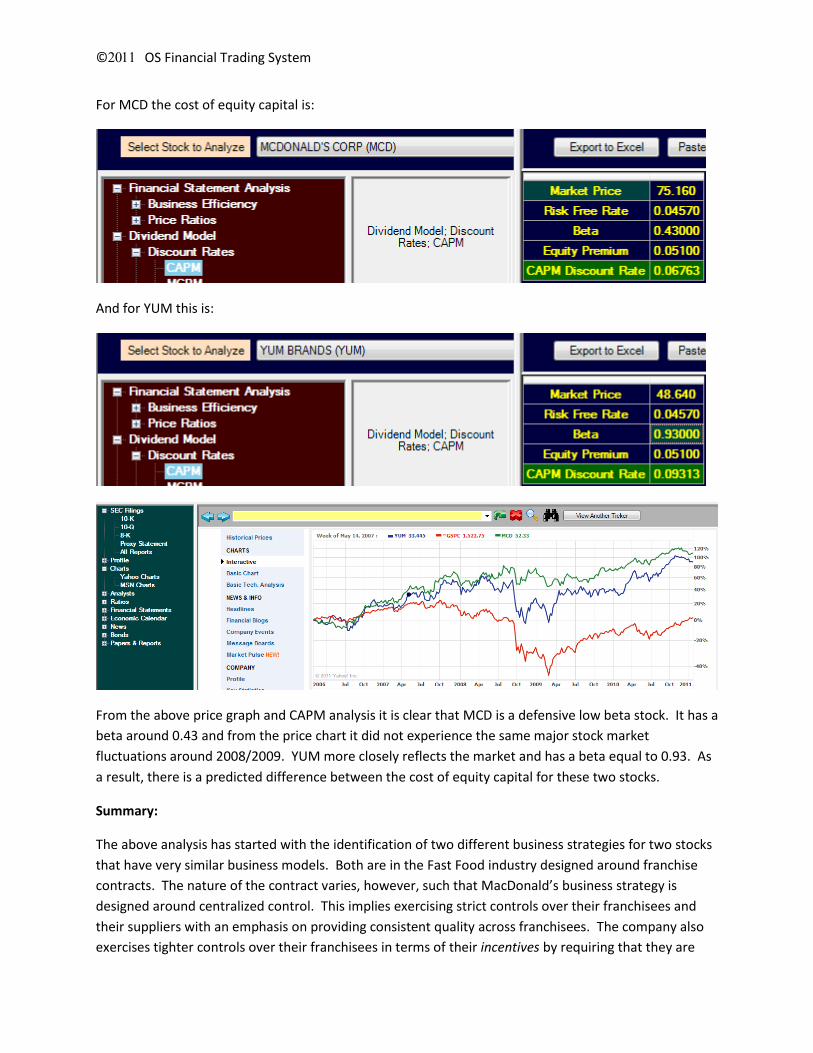
Step 13: What is the Difference between MCD’s and YUM’s Cost of Equity
Capital?
In this step we will adopt a CAPM (Capital Asset Pricing Model) approach to estimating the cost of equity
capital.
©OS Financial Trading System
For MCD the cost of equity capital is:
And for YUM this is:
From the above price graph and CAPM analysis it is clear that MCD is a defensive low beta stock. It has a
beta around 0.43 and from the price chart it did not experience the same major stock market
fluctuations around 2008/2009. YUM more closely reflects the market and has a beta equal to 0.93. As
a result, there is a predicted difference between the cost of equity capital for these two stocks.
Summary:
The above analysis has started with the identification of two different business strategies for two stocks
that have very similar business models. Both are in the Fast Food industry designed around franchise
contracts. The nature of the contract varies, however, such that MacDonald’s business strategy is
designed around centralized control. This implies exercising strict controls over their franchisees and
their suppliers with an emphasis on providing consistent quality across franchisees. The company also
exercises tighter controls over their franchisees in terms of their incentives by requiring that they are
©OS Financial Trading System
active not passive investors. This centralized control strategy is reflected in financial statements by
tighter cost controls over selling and general costs, significantly lower days to turn over inventory and
higher profit margins from sales. YUM’s business strategy is built around contracts that are designed
around a decentralized business strategy designed for growth. The company invests less capital in their
franchisees – for example, they do not assume ownership of property or long terms leases. As a result,
asset turnover ratios and price to book ratios are significantly higher than MCD. They also decentralize
much of the sales and general costs thereby giving up some economies of scale. On the growth front
their Kentucky Fried Chicken component has proved to be a big winner in Asia and worldwide YUM has
more franchisees, but overall lower sales and lower profitability margins.
However, their different strategies also reveal themselves primarily in risk. The financial statement
analysis identifies this along several dimensions. First, with their greater number of franchisees along
with less direct control over franchisees both in terms of their investment decisions and incentives,
variance among franchisees is a significant potential risk. Indirect evidence of this is the major
difference in days to turnover inventory – less than three days for MCD to just less than eight days for
YUM. For a fast food chain this latter number appears to be high. Second, when growth stalls YUM has
a higher degree of operating and total leverage than does MCD and so net income is affected more.
This creates incentives for smoothing earnings via the use of accruals and which was reflected in YUM’s
earnings quality measure relative to MCD’s during the recession. Third, with greater business risk and
sensitivity to economic growth YUM’s cost of equity capital is significantly higher than MCD.