Embed Size (px)
Citation preview
CENTRAL WISCONSIN JOINT AIRPORT BOARD MEETING Conference Room B – East Terminal Upper Level, Mosinee, Wisconsin
April 16, 2021, 8:00 a.m.
2020-2022 Board Members: Sara Guild, Chair- Marathon County, Dave Ladick, Vice-Chair - Portage County, Brent Jacobson - Marathon County, Ray Reser - Portage County, Chris Dickinson - Marathon County, Lon Krogwold - Portage County, Kurt Kluck - Marathon County.
Mission Statement: The mission of the Central Wisconsin Airport is to be the airport of choice by providing a safe, efficient, and competitive operating environment.
Due to the COVID-19 pandemic, the monthly meeting of the Central Wisconsin Joint Airport Board will have the option for members and the public to call-in via telephone conference. Airport Board members and the public may join the meeting by calling 715-693-2147 and dialing extension 3000 when the voice menu system begins. The conference line will be open to calls five (5) minutes prior to the meeting start time listed above. If board members or members of the public attend the meeting in person, appropriate safety measures, including facial coverings and adequate social distancing, must be utilized by all in-person attendees.
1) Call to Order by Chair Guild at 8:00 a.m.a) Pledge of Allegiance
2) Approval of Minutes of the February 19, 2021 Board Meeting
3) Public Comment Period: 15-minute time limit
4) Staff Reportsa) Director Report
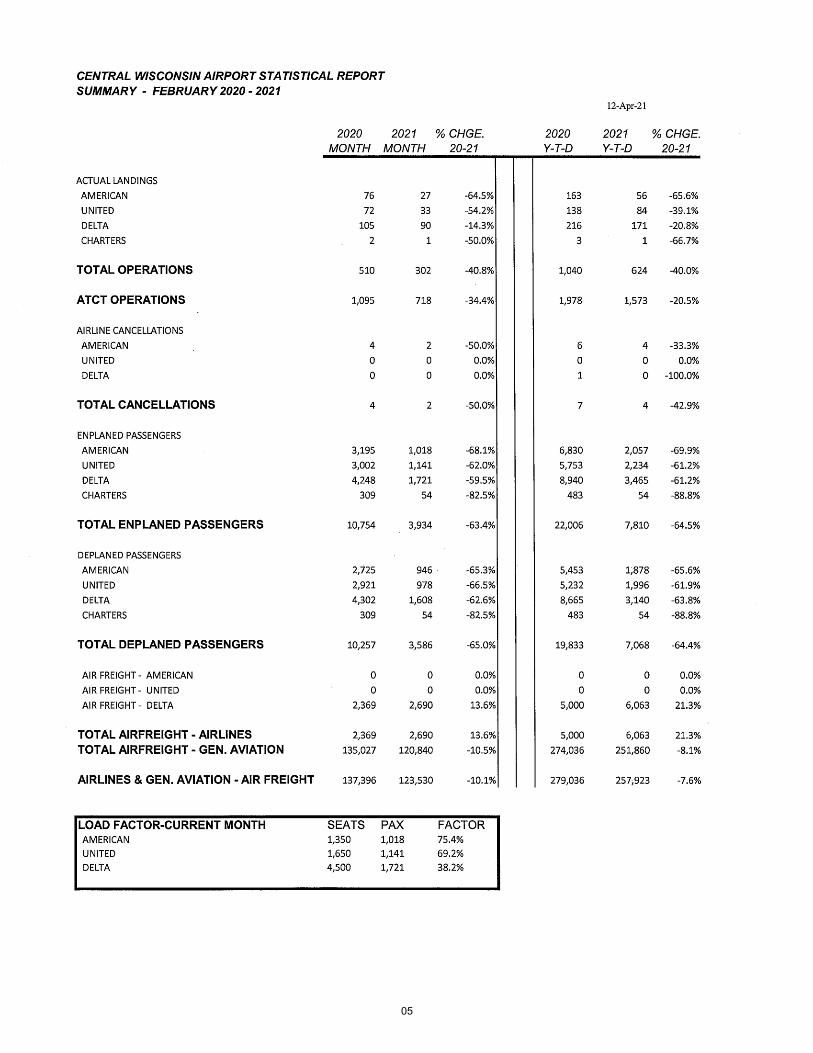
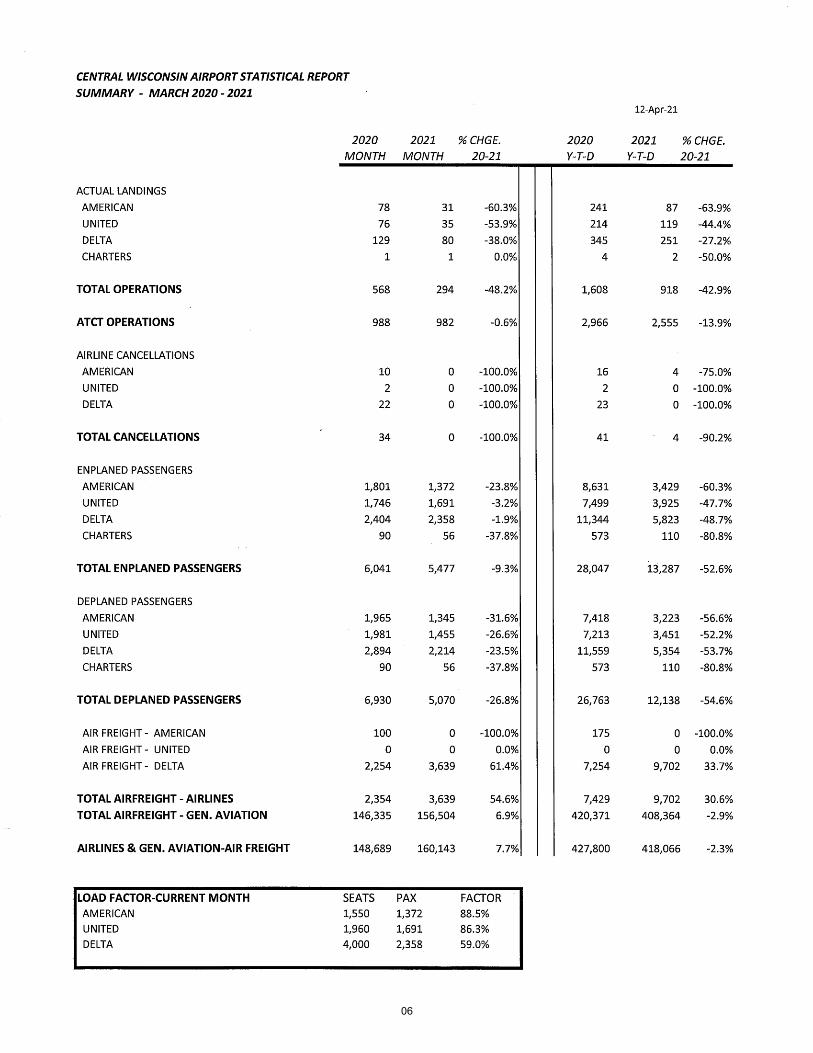
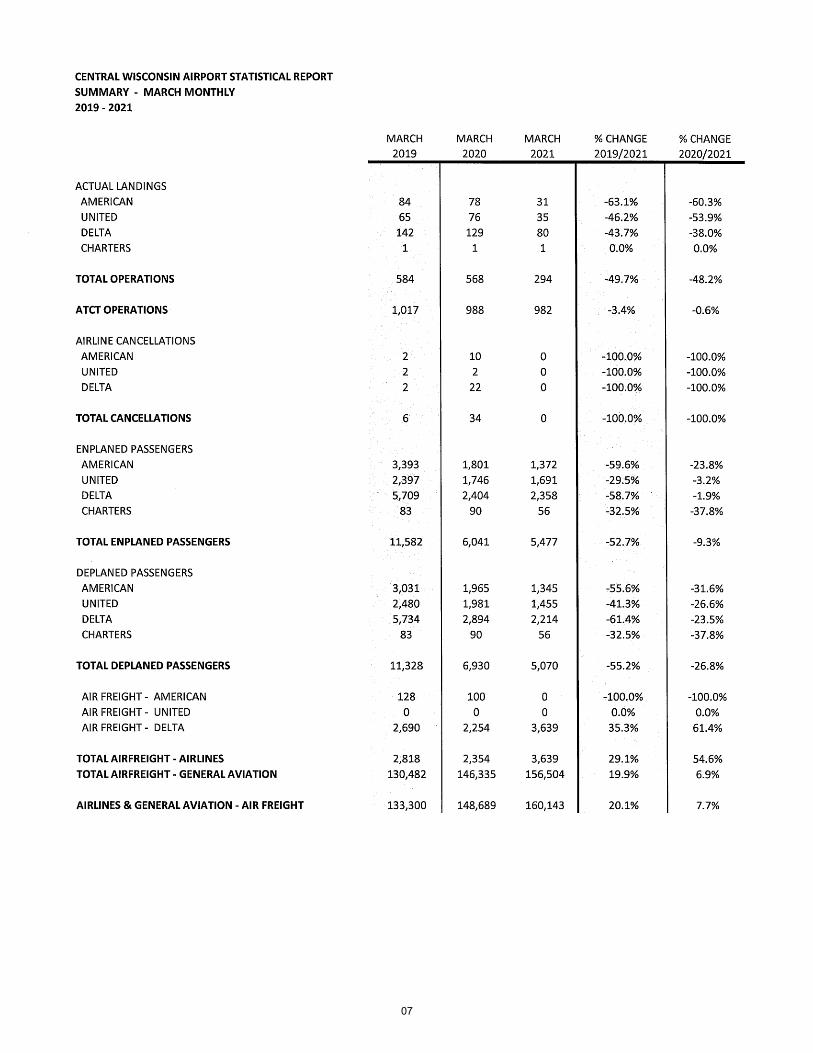
i) Statistics – February & March 2021ii) Flight Scheduleiii) GA Development Updateiv) Marketing Updatev) Legislative Updatevi) Rental Car Updatevii) Quarterly Performance Report
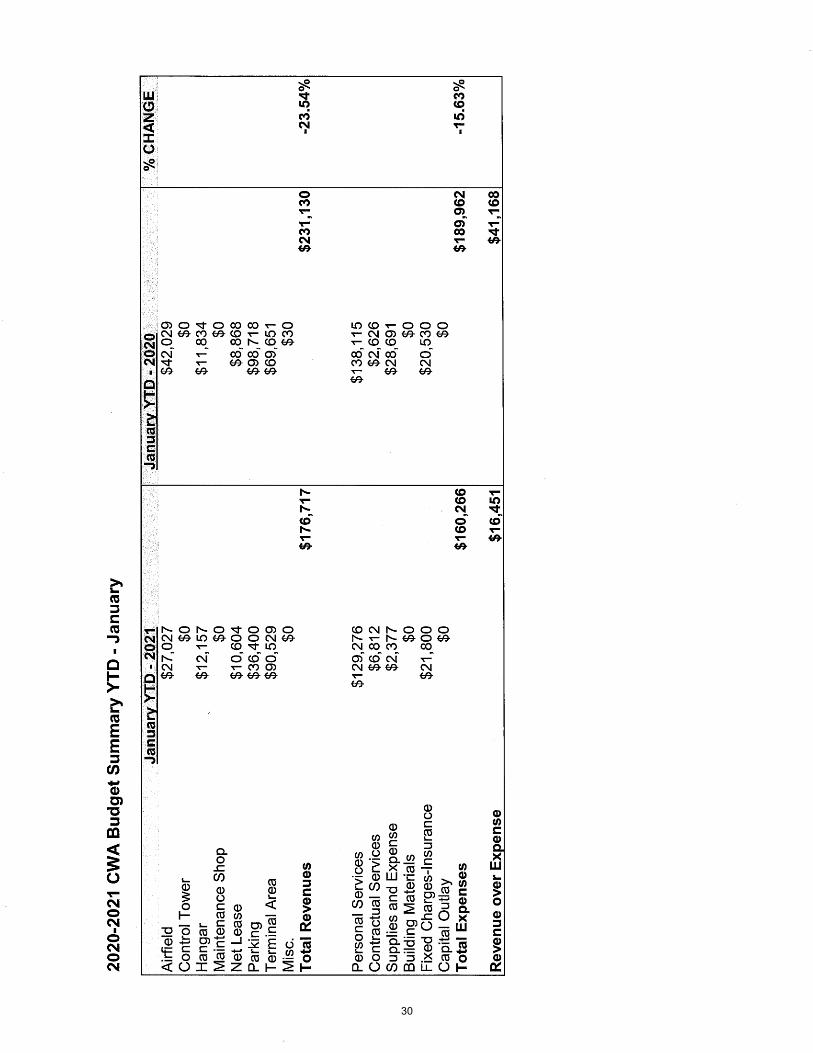
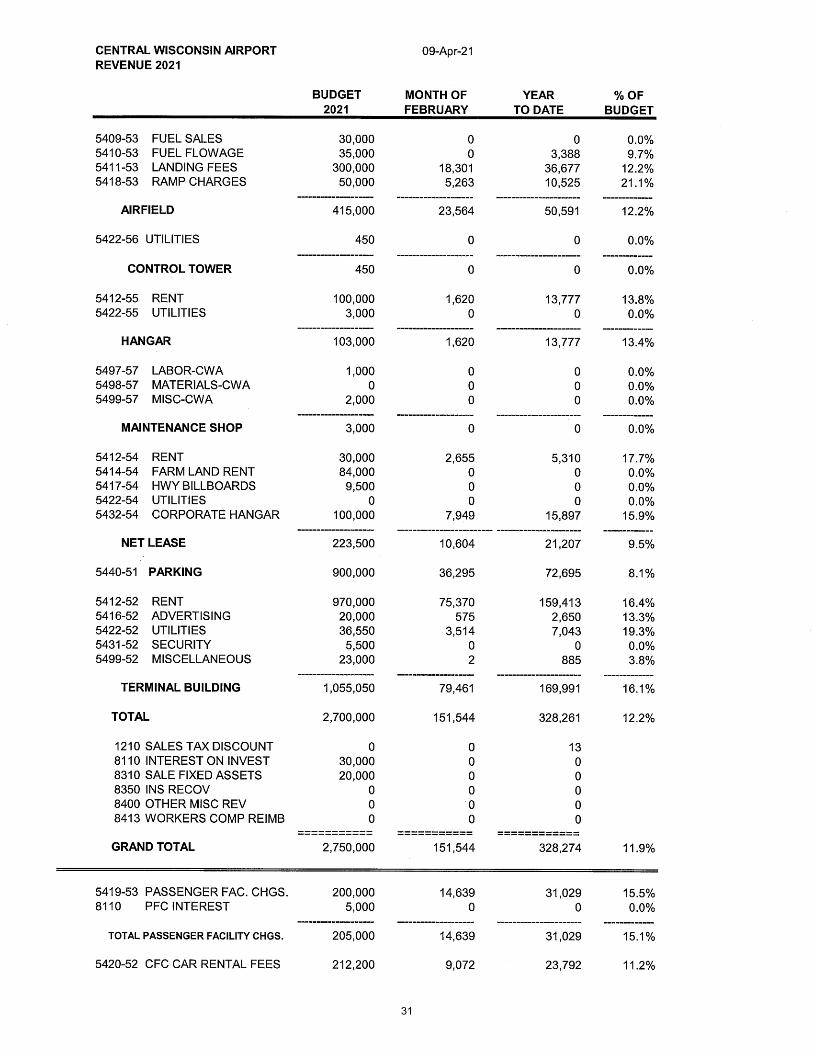
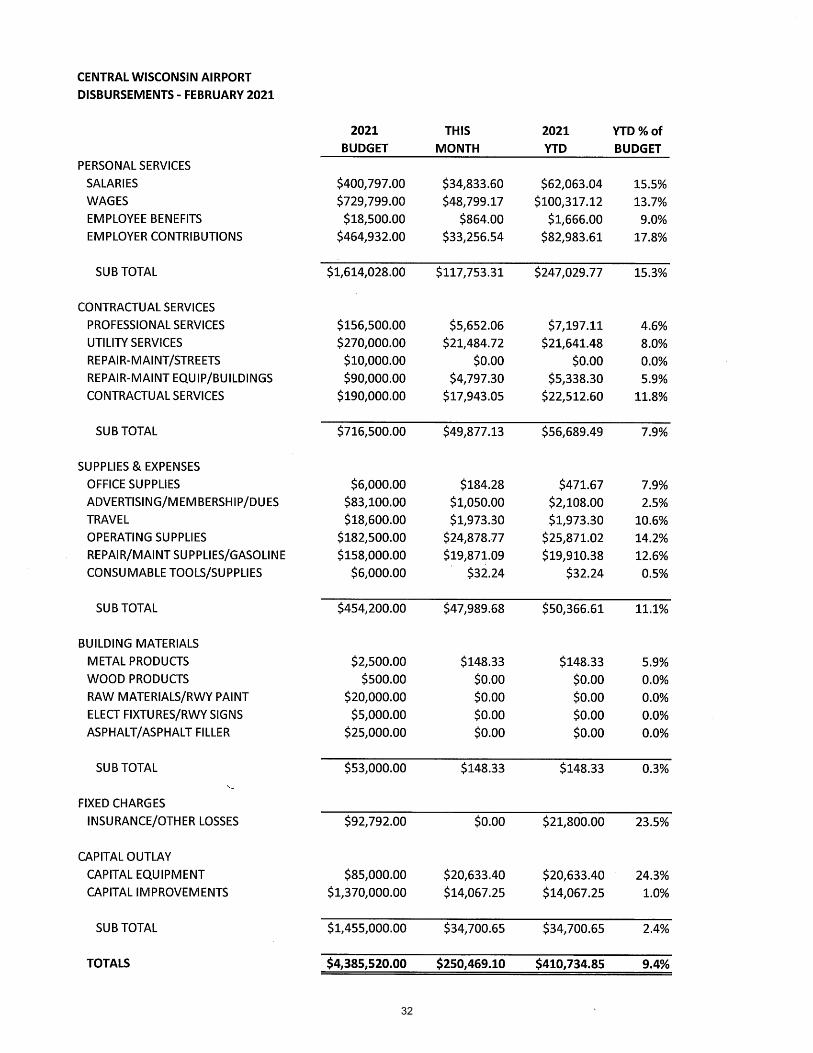
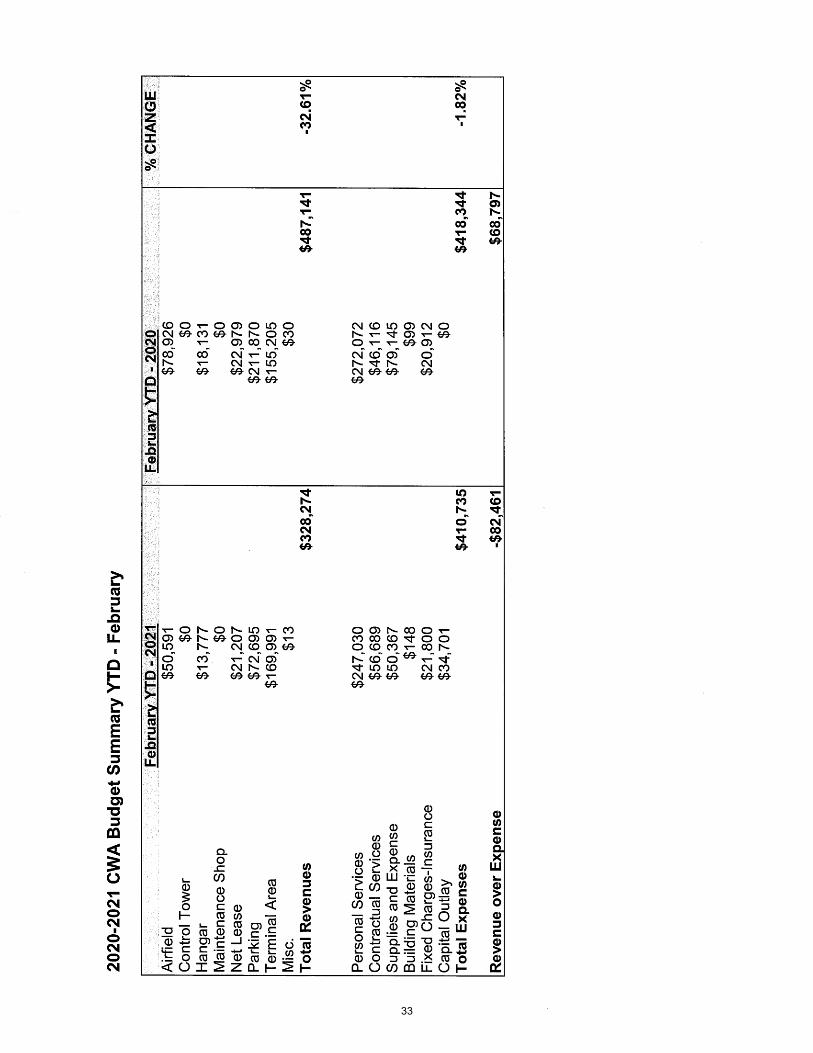
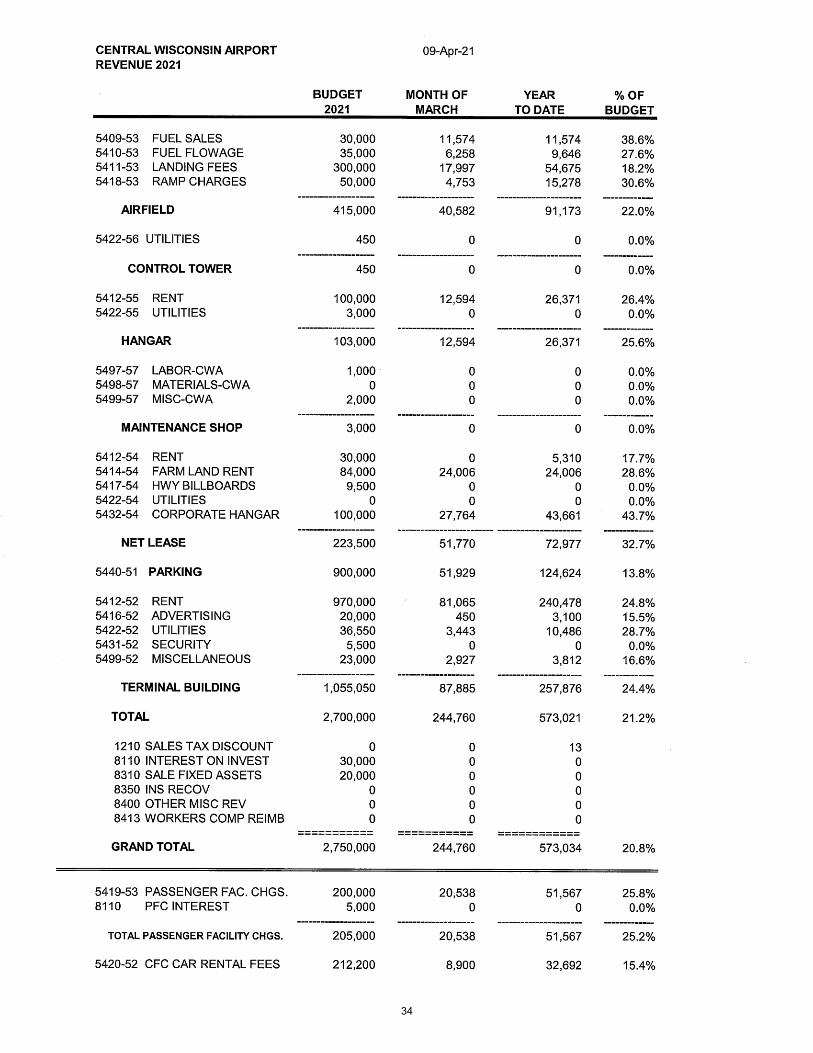
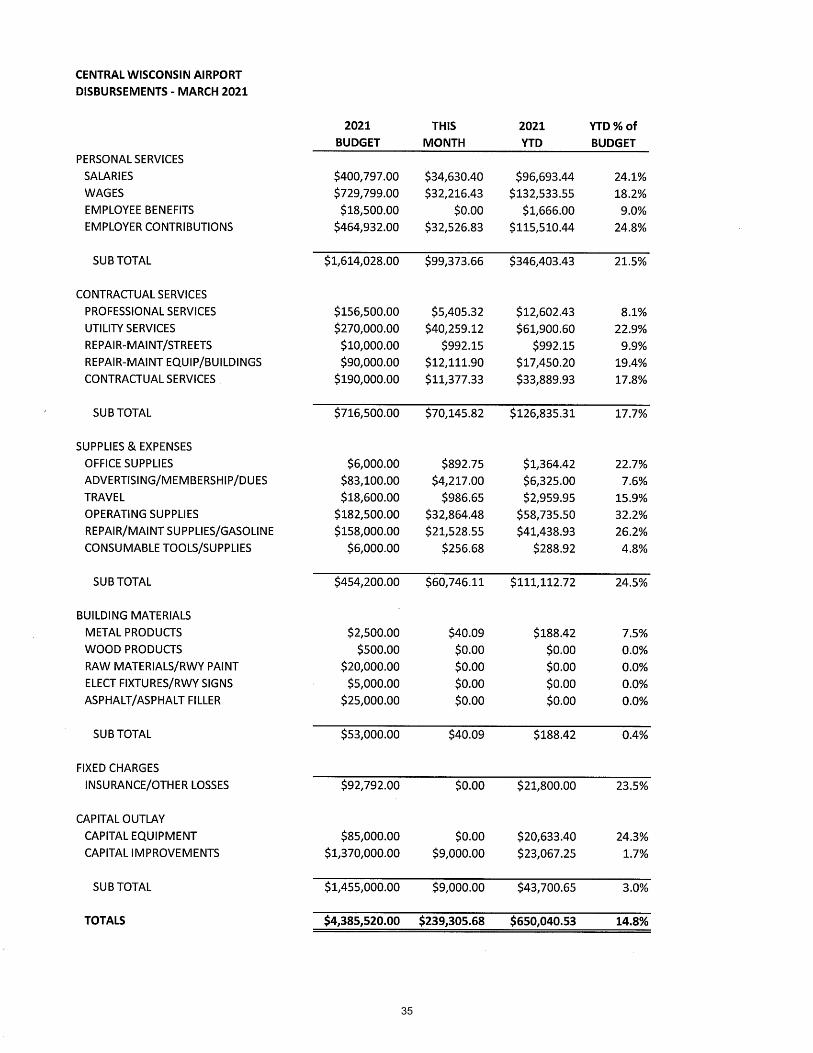
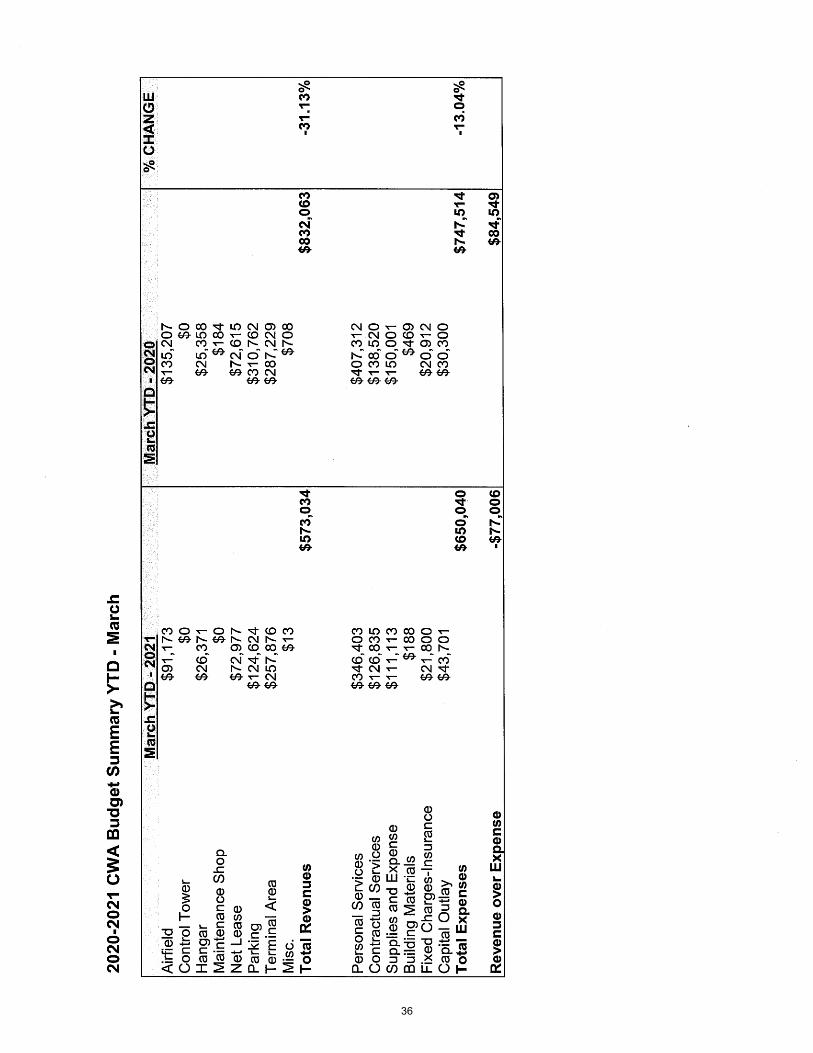
b) Financial Reportsi) Revenues and Expenses – January (Updated), February & March 2021ii) Budget Comparison
c) Operations and Project Reportsi) Operations Updateii) Taxilane E and Flightline Drive Reconstruction Project
5) Adjournment
6) Tour of RWY 17-35 Construction Projecta) A quorum of the Central Wisconsin Joint Airport Board may be taking a tour of the runway 17/35
construction project. No public business will be conducted during this general discussion and tour.
7) Next Scheduled Meeting Date: May 21, 2021 at 8:00 a.m.
Any person planning to attend this meeting who needs some type of special accommodation to participate should callthe County Clerk’s Office at 715-261-1500 or e-mail [email protected] one business day before the meeting.
01
CENTRAL WISCONSIN JOINT AIRPORT BOARD MEETING MINUTES CENTRAL WISCONSIN AIRPORT TERMINAL
Conference Room B – East Terminal Upper Level, Mosinee, Wisconsin February 19, 2021 - 8:00 a.m.
Airport Board: Sara Guild, Chair Dave Ladick, Vice Chair Lonnie Krogwold Kurt Kluck – Excused
Brent Jacobson Ray Reser – Excused Chris Dickinson
Staff: Brian Grefe, Airport Director Mark Cihlar, Assistant Airport Director
David Drozd, Finance Director Julie Ulrick, Badging Coordinator
Visitors: Randy Van Natta, Becher Hoppe Karl Kemper, Becher Hoppe Call to Order: Meeting called to order by Chair Guild at 8:00 a.m.
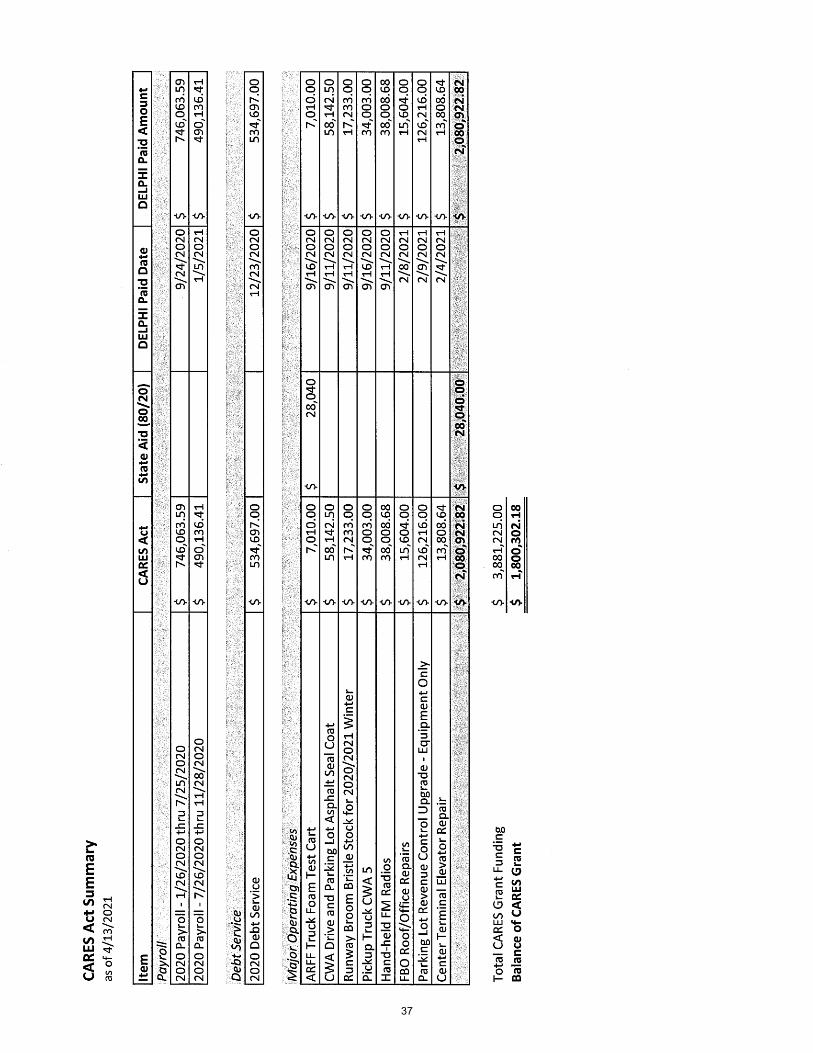
Approval of Minutes: Motion by Krogwold, second by Dickinson to approve the minutes of the January 15, 2021 board meeting. Motion carried unanimously. Public Comment Period: None. Review and Possible Action on Airport Coronavirus Response Grant Program (ACRGP) Resolution: Similar to the CARES Act, the Coronavirus Response and Relief Supplemental Appropriation Act (CRRSAA) (Public Law 116-260) (PDF), signed into law by the President on December 27, 2020, includes nearly $2 billion in funds to be awarded as economic relief to eligible U.S. airports and eligible concessions at those airports to prevent, prepare for, and respond to the COVID-19 pandemic. The FAA has established the Airport Coronavirus Response Grant Program (ACRGP) to distribute the funds. The FAA will make grants to all airports that are part of the national airport system, including all commercial service airports, all reliever airports, and some public-owned general aviation airports. Last week, the FAA Chicago Airports District Office announced that the Central Wisconsin Airport is eligible to receive two grants from the ACRGP. One for $1,561,781 for costs related to operations, personnel, cleaning, sanitization, janitorial services, combating the spread of pathogens at the airport, and debt service payments. The second grant for $30,225 is to provide relief from rent and minimum annual guarantees to on-airport parking, on-airport car rental, and in-terminal airport concessions. These funds must be spent within 4 years, however, FAA guidance encourages that the funds be used as quickly as possible. The funds will offset approximately one year of revenues at CWA with passenger enplanements running at 50% of 2019 levels. When considering ACRGP, and remaining CARES funds, the airport should be able to operate with the revenues associated with 50% passenger enplanements through 2022 with modest reductions to spending. Motion by Ladick, second by Krogwold to approve Resolution R-02-21 approving the acceptance and use of federal Airport Coronavirus Response Grant Program funds. Motion carried unanimously. Staff Reports: Director Report – Brian Grefe: TSA Security Directive 1542-21-01 – The President issued an Executive Order, Promoting COVID-19 Safety in Domestic and International Travel, on January 21, 2021, requiring masks to be worn in airports, on commercial aircraft and in various modes of surface transportation. On February 1, 2021, TSA issued Security Directive (SD) 1542-21-01 requiring masks to be worn at airports and while traveling by air to mitigate the spread of COVID-19. The airport is required to submit non-compliant individuals’ names to TSA and both the airport and local airlines have masks available for passengers and guests. The SD is set to expire on May 11, 2021, with the potential of being extended.
02
Legislative Update – The House Transportation and Infrastructure Committee approved a coronavirus relief package that contains $8 billion for airports and concessionaires. The package also contains $608 million to cover the local match for AIP projects funded in FY21 and FY20. An amendment aimed at requiring COVID testing pre-flight for domestic travel was rejected on technical grounds. Statistics – The January 2021 statistical report shows ATCT operations down 33.3% and enplanements down 65.6%. Late day turns for United and Delta typically have fewer passengers aboard, contributing to lower enplanement numbers. Load factors ranged from 42.2% – 71.7%. Flight Schedule – The current schedule of five daily flights will likely remain through March. United plans on adding an additional flight periodically with an upgraded ERJ175 aircraft and their advanced bookings are highest in the state right now. American is looking at possible additions in April or May. There are a few upcoming charters through Wojo Tours. Financial Reports – David Drozd: Revenues and Expenses Year End Summary – 2020 Pre-Audit – The final pre-audit numbers for 2020 are complete, with possible adjustments needed post-audit. Revenues ended the year at $2,602,881, with expenses ending at $3,137,472. CARES Act funds are being accounted for separately pending direction from the auditors. CARES Act Summary – 2020 – Expenses that have been submitted for reimbursement under the CARES Act include payroll, debt service and several major operating expenses. Reimbursements paid to date total $1,435,157.77. Revenues and Expenses – January 2021 – ACH and electronic transfer payments are backlogged at the county level and the January revenue report does not reflect those funds. An updated report will be ran after the payments are processed and presented at the next meeting. January disbursements end at 3.7% of budget, with no large expenses for the month. Operations & Project Reports – Mark Cihlar: Winter Operations Update – The winter season has been good overall with limited snowfall, but freezing rain was a challenge that called for higher deicer, salt and sand usage. Freezing rain events are budgeted for annually and the runways remained in good condition for evening arrivals. The final close out letter from the FAA was received from the aircraft overrun incident this winter. A training requirement was included in the letter of investigation and has been completed as outlined. Airport actions were not directly a contributing factor, but retraining was conducted on several procedures and will be included in the airport’s Snow and Ice Control Plan. Update on Runway 17/35 Reconstruction Project – The general contractor is preparing for the upcoming runway reconstruction project and their intent is to begin work on March 1st. The project does have a potential impact on flights from having 17/35 shut down during a weather event, but airlines do not anticipate any issues. Taxilane E and Flight Line Drive Reconstruction Project – The 90% design review meeting was held yesterday and the project is on track and will soon be out for bid. Motion to Go into Closed Session (Roll Call Vote Suggested), pursuant to s. 19.85(1)(e), Wis. Stats., for the Purpose of Deliberating or Negotiating the Purchase of Public Properties, the Investing of Public Funds, or Conducting Other Specified Public Business, Whenever Competitive or Bargaining Reasons Require a Closed Session, to Wit: For the purpose of permitting the Airport Board to discuss possible purchase of additional property near the airport and to discuss strategy to be employed by Airport Administration in negotiating said purchase: 8:50 a.m. Motion by Jacobson, second by Dickinson to move into closed session. Roll call vote: Ladick, Krogwold, Guild, Dickinson, Jacobson. All ayes. 03
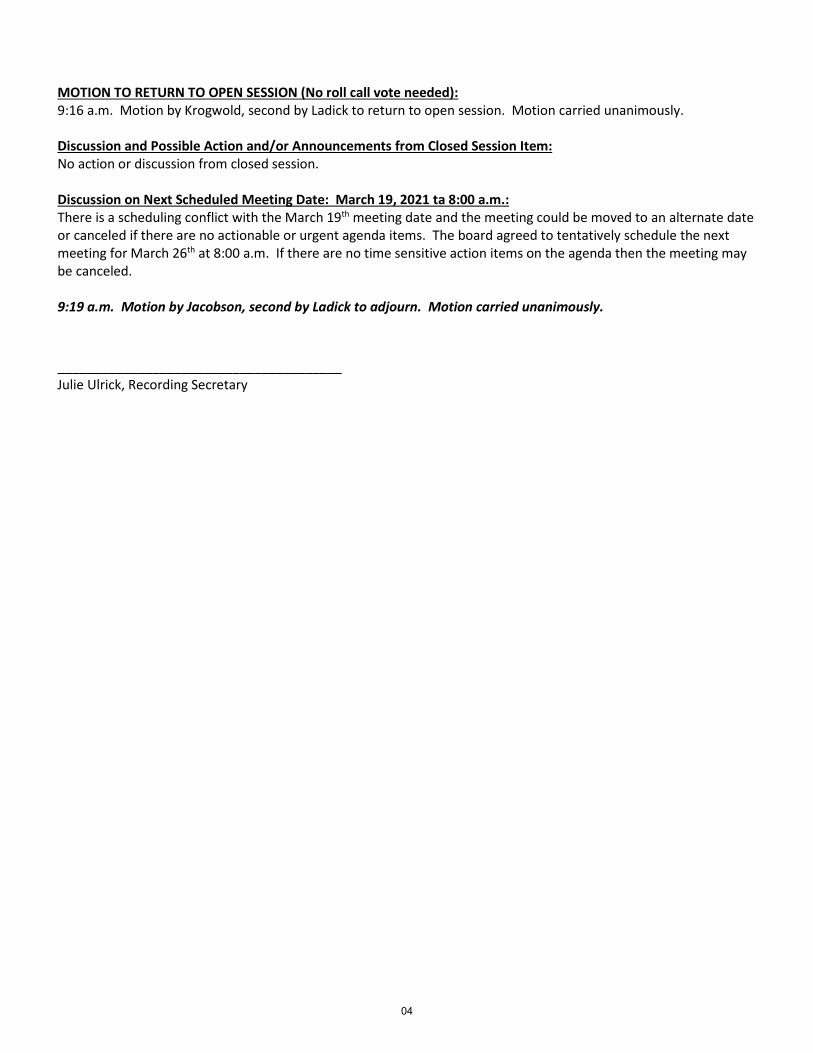
MOTION TO RETURN TO OPEN SESSION (No roll call vote needed): 9:16 a.m. Motion by Krogwold, second by Ladick to return to open session. Motion carried unanimously. Discussion and Possible Action and/or Announcements from Closed Session Item: No action or discussion from closed session. Discussion on Next Scheduled Meeting Date: March 19, 2021 ta 8:00 a.m.: There is a scheduling conflict with the March 19th meeting date and the meeting could be moved to an alternate date or canceled if there are no actionable or urgent agenda items. The board agreed to tentatively schedule the next meeting for March 26th at 8:00 a.m. If there are no time sensitive action items on the agenda then the meeting may be canceled. 9:19 a.m. Motion by Jacobson, second by Ladick to adjourn. Motion carried unanimously. _______________________________________ Julie Ulrick, Recording Secretary
04
05
06
07
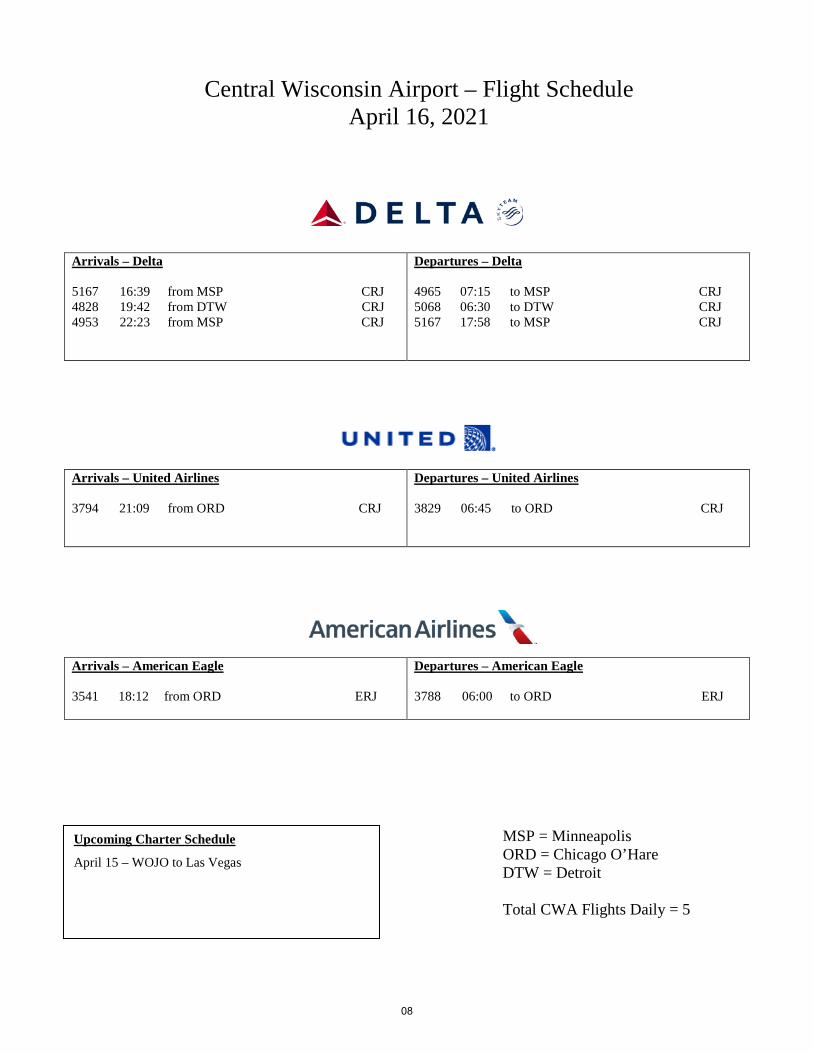
Central Wisconsin Airport – Flight Schedule
April 16, 2021
Arrivals – Delta 5167 16:39 from MSP CRJ 4828 19:42 from DTW CRJ 4953 22:23 from MSP CRJ
Departures – Delta 4965 07:15 to MSP CRJ 5068 06:30 to DTW CRJ 5167 17:58 to MSP CRJ
Arrivals – United Airlines 3794 21:09 from ORD CRJ
Departures – United Airlines 3829 06:45 to ORD CRJ
Arrivals – American Eagle 3541 18:12 from ORD ERJ
Departures – American Eagle 3788 06:00 to ORD ERJ
MSP = Minneapolis
ORD = Chicago O’Hare DTW = Detroit Total CWA Flights Daily = 5
Upcoming Charter Schedule
April 15 – WOJO to Las Vegas
08
CWA Legislative Update – April 2021 Administration Unveils More Details on Infrastructure Plan (Source AAAE Airport Report Today) April 12, 2021
The Biden Administration has released details on how the $25 billion for airports and the nation’s aviation infrastructure included in the president’s American Jobs Plan would be allocated. According to a two-page summary, $10 billion would go toward AIP, $10 billion would be designated for “airport terminal renovation grants,” and another $5 billion is proposed for “FAA National Airspace System Facilities.” Those funds are anticipated over a five-year period. The White House plan is somewhat similar to H.R.2, the infrastructure bill that House Democrats passed last year on a party-line vote. That bill, which is expected to serve as the starting point for this year’s House infrastructure proposal, called for increasing AIP funding from $3.35 billion to $4 billion annually over five years – a $3.25 billion total gain. It also proposed to provide airports with between $3 billion and $4 billion annually for supplemental grants for a broader range of purposes, including terminal upgrades and debt service during the same timeframe for another $17.5 billion. Administration Releases Outline for its FY22 Discretionary Funding Request (Source AAAE Airport Alert) April 9, 2021
The White House today unveiled the outline for its budget request for discretionary spending in Fiscal Year 2022. The document, which was prepared by the Office of Management and Budget, is light on details and reiterates the President’s plan to rebuild the economy and fix our nation’s infrastructure. Department of Transportation The administration is seeking $25.6 billion in discretionary funds for DOT in FY22 – a $317 million increase from the current funding level. The high-level document indicates that the administration is prioritizing air traffic safety and efficiency, in part, by investing in air traffic control modernization. It also highlights the integration of unmanned aircraft systems and commercial space activity into the National Airspace System. Despite the overall recommended increase for DOT, however, the White House is proposing to zero out $2.9 billion for general fund transfers that were used in FY21 to “plus-up” the Airport Improvement Program by $400 million along with $2.5 billion for highways and transit. This is more of an inside-baseball budget move than a lack of support for those programs since the administration anticipates major increases in those areas as part of its $2.3 trillion American Jobs Plan. As we have previously reported, the administration is requesting an additional $20 billion for airports as part of the American Jobs Plan. The document that OMB released today re-emphasizes that the President is “committed to making a once-in-a-lifetime, generational investment to significantly improve America’s transportation infrastructure….” Department of Homeland Security The President’s discretionary budget request proposes a total of $52 billion for the Department of Homeland Security, which is roughly the same amount as provided in FY21. The document provides scant details and does not include any agency specific funding levels for either the Transportation Security Administration or U.S. Customs and Border Protection. As such, we cannot tell whether or not the administration will request funding for TSA law enforcement officer reimbursement grants or TSA staffing of exit lanes in FY22.
09
For DHS, the budget proposal focuses on border security improvements through the use of advanced technology; promotes a humane and efficient immigration system; supports Federal, State, local, non-profit and private entities’ efforts to detect, deter, and recover from malicious cyberattacks; seeks to address the root causes of domestic terrorism through additional grant programs; combats climate change; and revitalizes our nation’s research, development and innovation capacity by investing in projects that will include transportation security technologies. Environmental Protection Agency The budget document highlights the administration’s plans to address pollution caused by Per- and Polyfluoroalkyl Substances. Its discretionary request includes approximately $75 million “to accelerate toxicity studies and research to inform the regulatory development of designating PFAS as hazardous substances and setting enforceable limits for PFAS under the Safe Drinking Water Act.” The document points out that the proposed funding would also go towards “grants for technical assistance as State and local governments deal with PFAS contamination.”
10
Central Wisconsin Airport (CWA)
Quarterly Performance Report
Year Ended Q3 2020
11
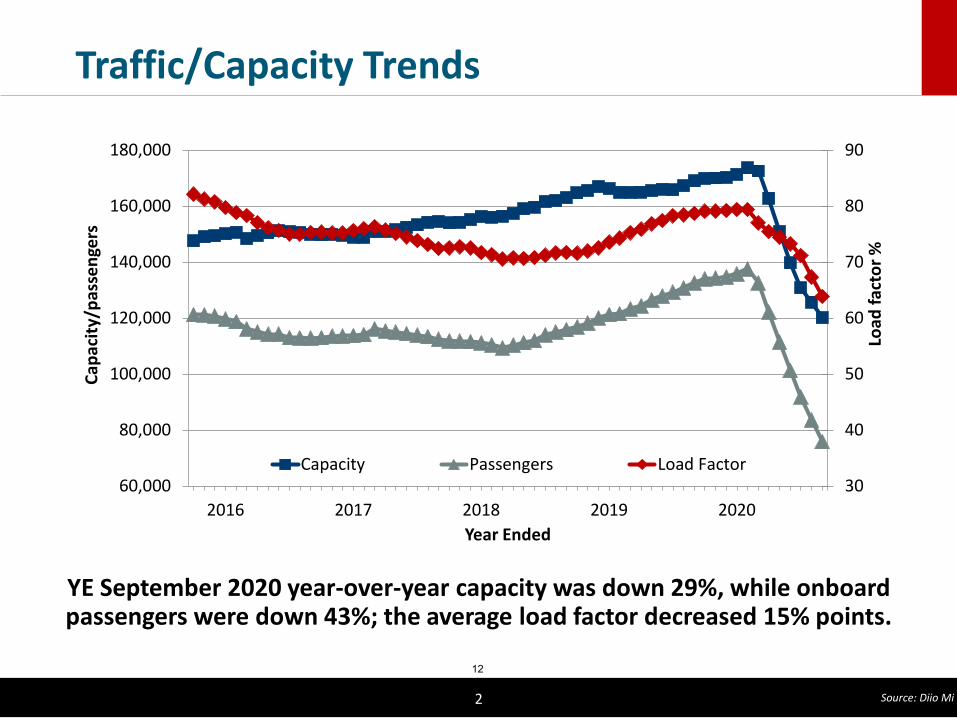
Traffic/Capacity Trends
YE September 2020 year-over-year capacity was down 29%, while onboard passengers were down 43%; the average load factor decreased 15% points.
2 Source: Diio Mi
30
40
50
60
70
80
90
60,000
80,000
100,000
120,000
140,000
160,000
180,000
2016 2017 2018 2019 2020
Load
fact
or %
Capa
city
/pas
seng
ers
Year Ended
Capacity Passengers Load Factor
12
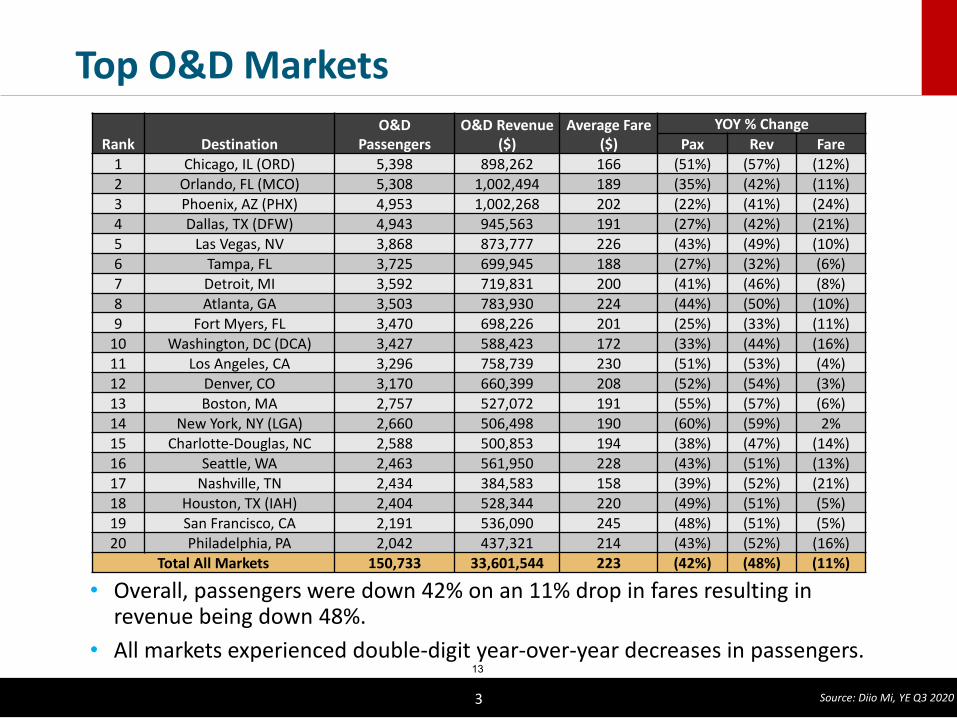
Rank DestinationO&D
PassengersO&D Revenue
($)Average Fare
($)YOY % Change
Pax Rev Fare1 Chicago, IL (ORD) 5,398 898,262 166 (51%) (57%) (12%)2 Orlando, FL (MCO) 5,308 1,002,494 189 (35%) (42%) (11%)3 Phoenix, AZ (PHX) 4,953 1,002,268 202 (22%) (41%) (24%)4 Dallas, TX (DFW) 4,943 945,563 191 (27%) (42%) (21%)5 Las Vegas, NV 3,868 873,777 226 (43%) (49%) (10%)6 Tampa, FL 3,725 699,945 188 (27%) (32%) (6%)7 Detroit, MI 3,592 719,831 200 (41%) (46%) (8%)8 Atlanta, GA 3,503 783,930 224 (44%) (50%) (10%)9 Fort Myers, FL 3,470 698,226 201 (25%) (33%) (11%)
10 Washington, DC (DCA) 3,427 588,423 172 (33%) (44%) (16%)11 Los Angeles, CA 3,296 758,739 230 (51%) (53%) (4%)12 Denver, CO 3,170 660,399 208 (52%) (54%) (3%)13 Boston, MA 2,757 527,072 191 (55%) (57%) (6%)14 New York, NY (LGA) 2,660 506,498 190 (60%) (59%) 2% 15 Charlotte-Douglas, NC 2,588 500,853 194 (38%) (47%) (14%)16 Seattle, WA 2,463 561,950 228 (43%) (51%) (13%)17 Nashville, TN 2,434 384,583 158 (39%) (52%) (21%)18 Houston, TX (IAH) 2,404 528,344 220 (49%) (51%) (5%)19 San Francisco, CA 2,191 536,090 245 (48%) (51%) (5%)20 Philadelphia, PA 2,042 437,321 214 (43%) (52%) (16%)
Total All Markets 150,733 33,601,544 223 (42%) (48%) (11%)
Top O&D Markets
• Overall, passengers were down 42% on an 11% drop in fares resulting inrevenue being down 48%.
• All markets experienced double-digit year-over-year decreases in passengers.
3 Source: Diio Mi, YE Q3 2020
13
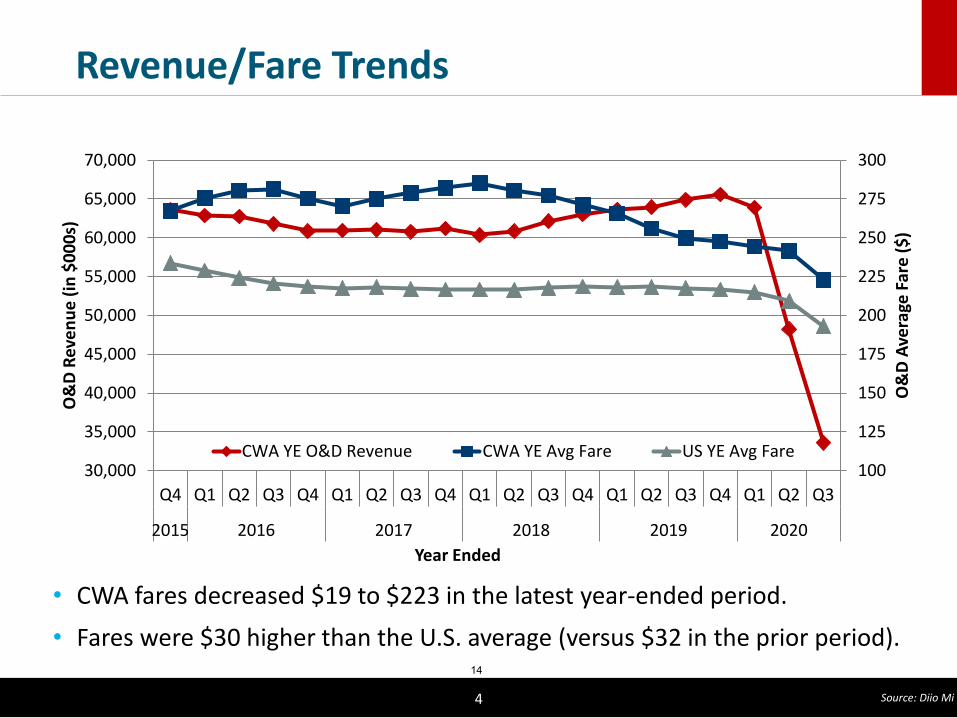
Revenue/Fare Trends
• CWA fares decreased $19 to $223 in the latest year-ended period.• Fares were $30 higher than the U.S. average (versus $32 in the prior period).
4
100
125
150
175
200
225
250
275
300
30,000
35,000
40,000
45,000
50,000
55,000
60,000
65,000
70,000
Q4 Q1 Q2 Q3 Q4 Q1 Q2 Q3 Q4 Q1 Q2 Q3 Q4 Q1 Q2 Q3 Q4 Q1 Q2 Q3
2015 2016 2017 2018 2019 2020
O&
D A
vera
ge F
are
($)
O&
D Re
venu
e (in
$00
0s)
Year Ended
CWA YE O&D Revenue CWA YE Avg Fare US YE Avg Fare
Source: Diio Mi
14
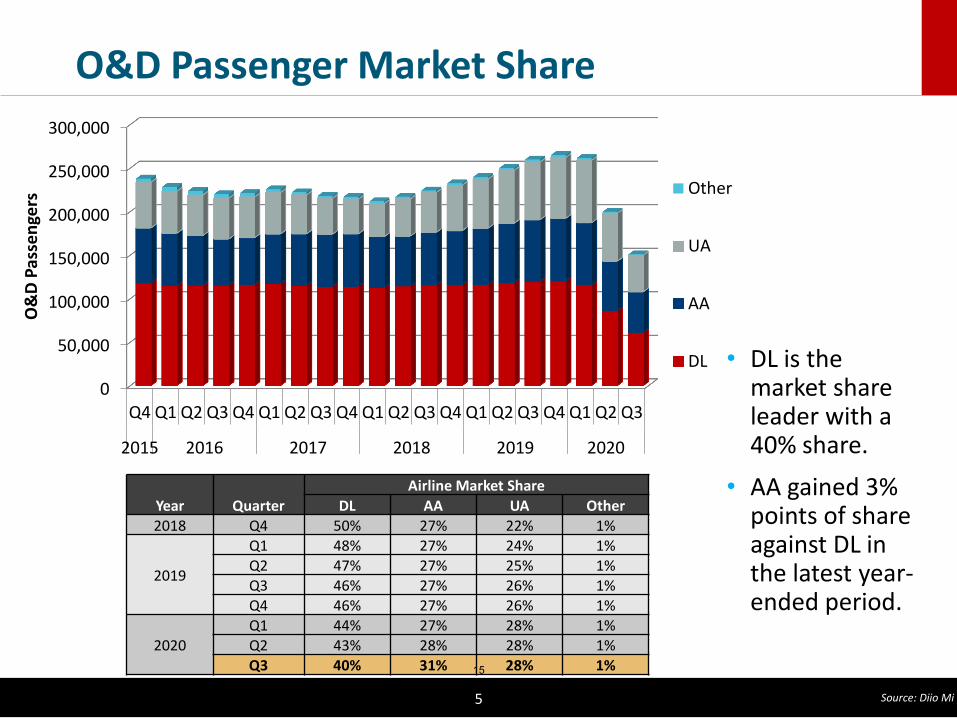
O&D Passenger Market Share
• DL is themarket shareleader with a40% share.
• AA gained 3%points of shareagainst DL inthe latest year-ended period.
5
0
50,000
100,000
150,000
200,000
250,000
300,000
Q4 Q1 Q2 Q3 Q4 Q1 Q2 Q3 Q4 Q1 Q2 Q3 Q4 Q1 Q2 Q3 Q4 Q1 Q2 Q3
2015 2016 2017 2018 2019 2020
O&
D P
asse
nger
s Other
UA
AA
DL
Year QuarterAirline Market Share
DL AA UA Other2018 Q4 50% 27% 22% 1%
2019
Q1 48% 27% 24% 1%Q2 47% 27% 25% 1%Q3 46% 27% 26% 1%Q4 46% 27% 26% 1%
2020Q1 44% 27% 28% 1%Q2 43% 28% 28% 1%Q3 40% 31% 28% 1%
Source: Diio Mi
15
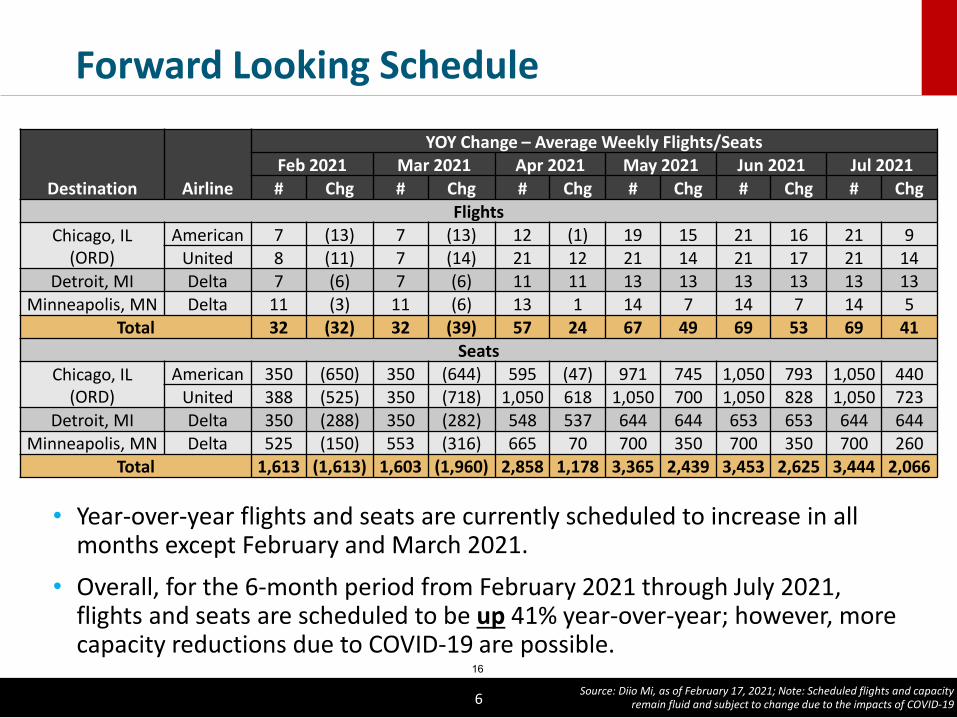
Forward Looking Schedule
• Year-over-year flights and seats are currently scheduled to increase in allmonths except February and March 2021.
• Overall, for the 6-month period from February 2021 through July 2021,flights and seats are scheduled to be up 41% year-over-year; however, morecapacity reductions due to COVID-19 are possible.
6
Destination Airline
YOY Change – Average Weekly Flights/SeatsFeb 2021 Mar 2021 Apr 2021 May 2021 Jun 2021 Jul 2021# Chg # Chg # Chg # Chg # Chg # Chg
FlightsChicago, IL
(ORD)American 7 (13) 7 (13) 12 (1) 19 15 21 16 21 9
United 8 (11) 7 (14) 21 12 21 14 21 17 21 14 Detroit, MI Delta 7 (6) 7 (6) 11 11 13 13 13 13 13 13
Minneapolis, MN Delta 11 (3) 11 (6) 13 1 14 7 14 7 14 5 Total 32 (32) 32 (39) 57 24 67 49 69 53 69 41
SeatsChicago, IL
(ORD)American 350 (650) 350 (644) 595 (47) 971 745 1,050 793 1,050 440
United 388 (525) 350 (718) 1,050 618 1,050 700 1,050 828 1,050 723 Detroit, MI Delta 350 (288) 350 (282) 548 537 644 644 653 653 644 644
Minneapolis, MN Delta 525 (150) 553 (316) 665 70 700 350 700 350 700 260 Total 1,613 (1,613) 1,603 (1,960) 2,858 1,178 3,365 2,439 3,453 2,625 3,444 2,066
Source: Diio Mi, as of February 17, 2021; Note: Scheduled flights and capacityremain fluid and subject to change due to the impacts of COVID-19
16
0.11 0.200.36 0.36
0.490.60 0.67 0.73
0.88
1.401.55
2.19
0.00
0.50
1.00
1.50
2.00
2.50
Seat
s per
Cap
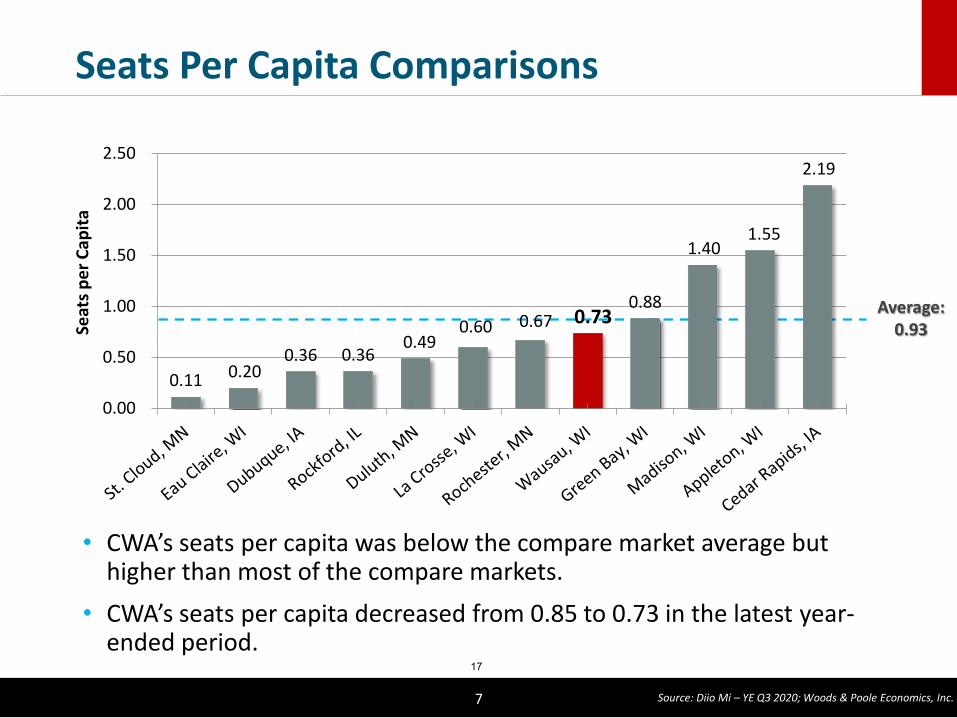
itaSeats Per Capita Comparisons
• CWA’s seats per capita was below the compare market average buthigher than most of the compare markets.
• CWA’s seats per capita decreased from 0.85 to 0.73 in the latest year-ended period.
7
Average: 0.93
Source: Diio Mi – YE Q3 2020; Woods & Poole Economics, Inc.
17
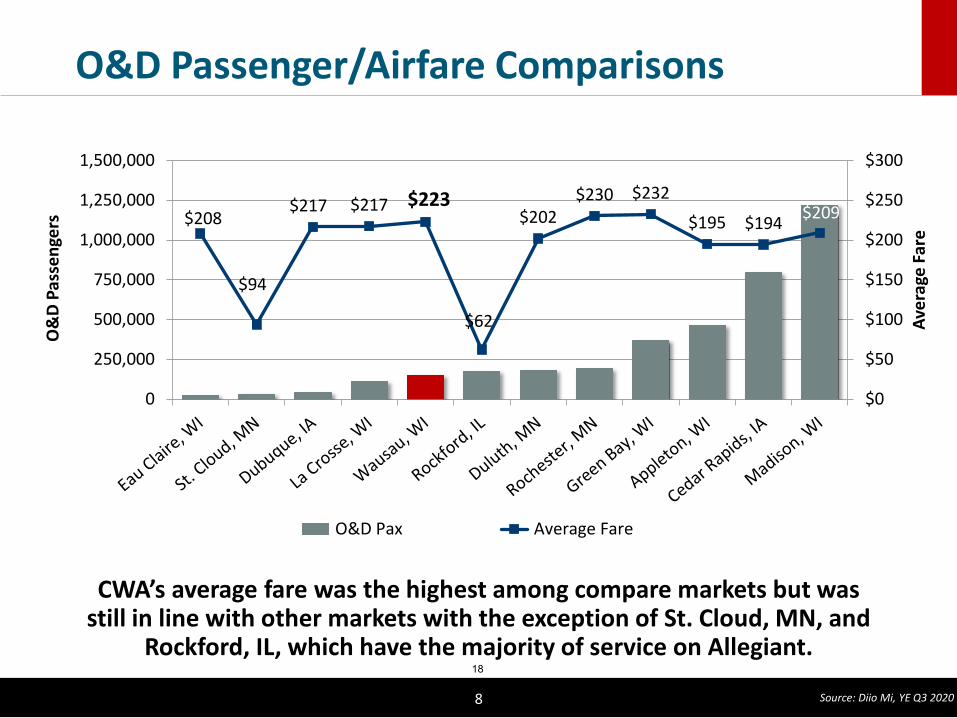
O&D Passenger/Airfare Comparisons
CWA’s average fare was the highest among compare markets but was still in line with other markets with the exception of St. Cloud, MN, and
Rockford, IL, which have the majority of service on Allegiant.
8
$208
$94
$217 $217 $223
$62
$202$230 $232
$195 $194 $209
$0
$50
$100
$150
$200
$250
$300
0
250,000
500,000
750,000
1,000,000
1,250,000
1,500,000
Aver
age
Fare
O&
D P
asse
nger
s
O&D Pax Average Fare
Source: Diio Mi, YE Q3 2020
18
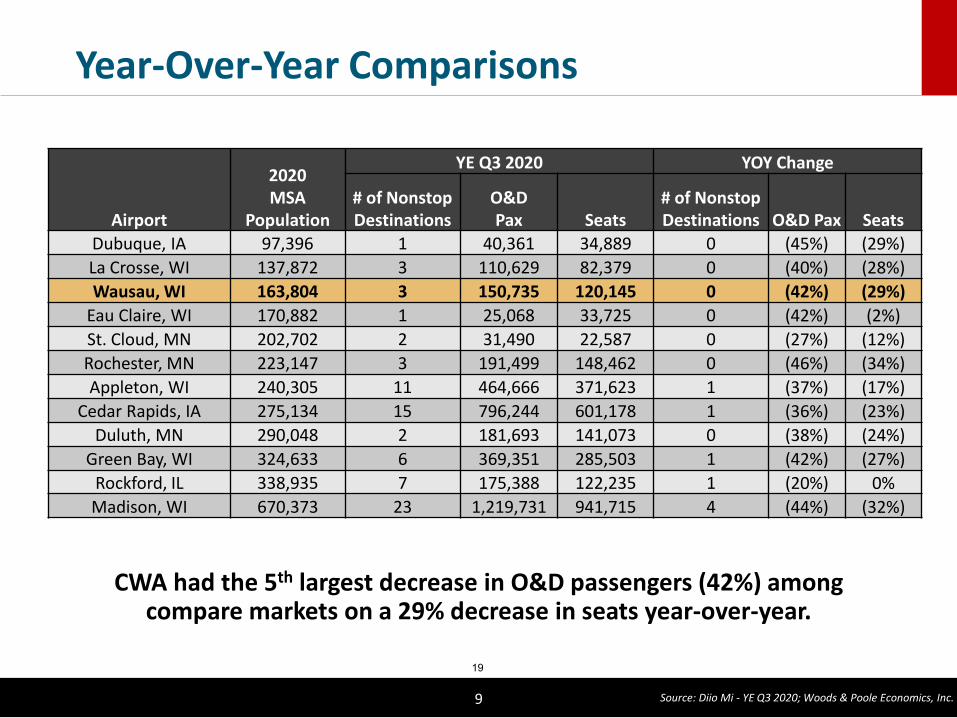
Year-Over-Year Comparisons
CWA had the 5th largest decrease in O&D passengers (42%) among compare markets on a 29% decrease in seats year-over-year.
9
Airport
2020MSA
Population
YE Q3 2020 YOY Change
# of Nonstop Destinations
O&D Pax Seats
# of Nonstop Destinations O&D Pax Seats
Dubuque, IA 97,396 1 40,361 34,889 0 (45%) (29%)La Crosse, WI 137,872 3 110,629 82,379 0 (40%) (28%)Wausau, WI 163,804 3 150,735 120,145 0 (42%) (29%)
Eau Claire, WI 170,882 1 25,068 33,725 0 (42%) (2%)St. Cloud, MN 202,702 2 31,490 22,587 0 (27%) (12%)Rochester, MN 223,147 3 191,499 148,462 0 (46%) (34%)Appleton, WI 240,305 11 464,666 371,623 1 (37%) (17%)
Cedar Rapids, IA 275,134 15 796,244 601,178 1 (36%) (23%)Duluth, MN 290,048 2 181,693 141,073 0 (38%) (24%)
Green Bay, WI 324,633 6 369,351 285,503 1 (42%) (27%)Rockford, IL 338,935 7 175,388 122,235 1 (20%) 0% Madison, WI 670,373 23 1,219,731 941,715 4 (44%) (32%)
Source: Diio Mi - YE Q3 2020; Woods & Poole Economics, Inc.
19
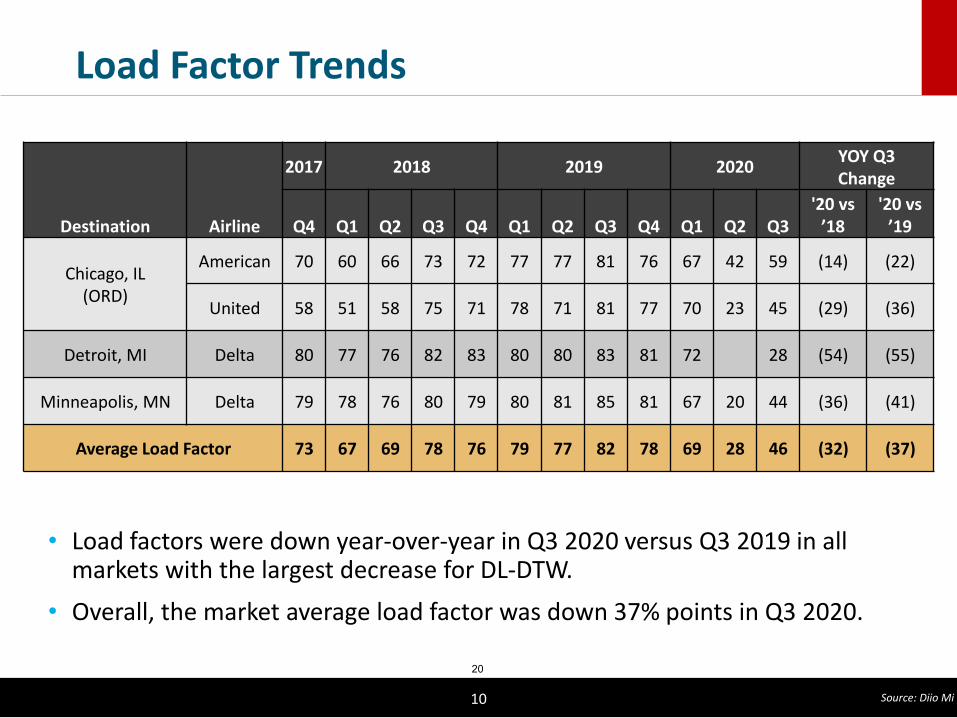
Load Factor Trends
• Load factors were down year-over-year in Q3 2020 versus Q3 2019 in allmarkets with the largest decrease for DL-DTW.
• Overall, the market average load factor was down 37% points in Q3 2020.
10
Destination Airline
2017 2018 2019 2020 YOY Q3Change
Q4 Q1 Q2 Q3 Q4 Q1 Q2 Q3 Q4 Q1 Q2 Q3'20 vs
’18'20 vs
’19
Chicago, IL (ORD)
American 70 60 66 73 72 77 77 81 76 67 42 59 (14) (22)
United 58 51 58 75 71 78 71 81 77 70 23 45 (29) (36)
Detroit, MI Delta 80 77 76 82 83 80 80 83 81 72 28 (54) (55)
Minneapolis, MN Delta 79 78 76 80 79 80 81 85 81 67 20 44 (36) (41)
Average Load Factor 73 67 69 78 76 79 77 82 78 69 28 46 (32) (37)
Source: Diio Mi
20
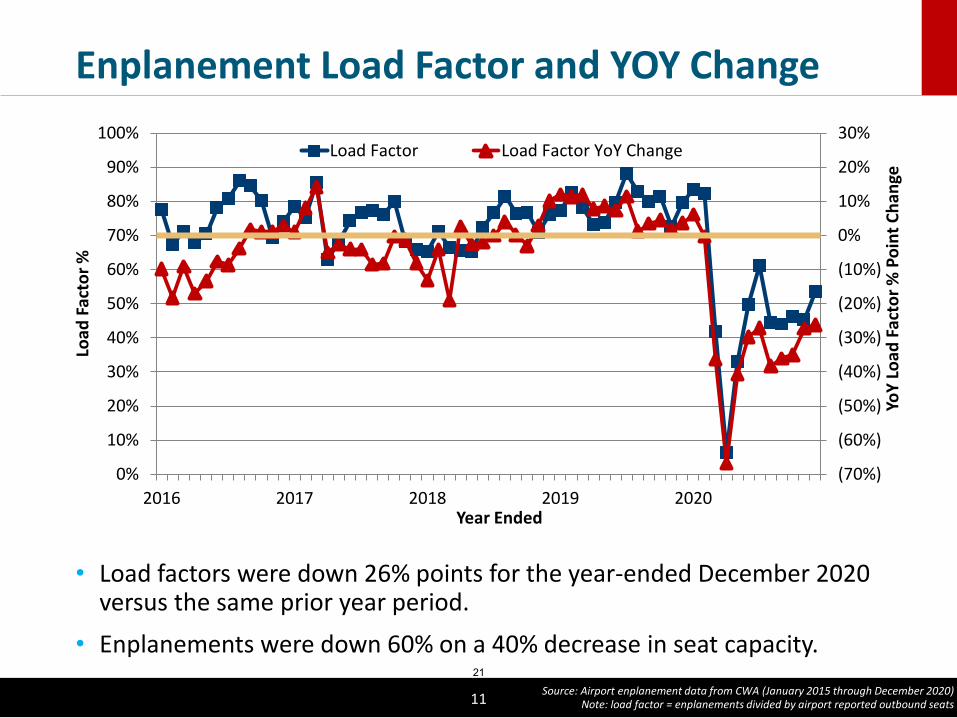
Enplanement Load Factor and YOY Change
• Load factors were down 26% points for the year-ended December 2020versus the same prior year period.
• Enplanements were down 60% on a 40% decrease in seat capacity.
11
(70%)
(60%)
(50%)
(40%)
(30%)
(20%)
(10%)
0%
10%
20%
30%
0%
10%
20%
30%
40%
50%
60%
70%
80%
90%
100%
2016 2017 2018 2019 2020
YoY
Load
Fac
tor %
Poi
nt C
hang
e
Load
Fac
tor %
Year Ended
Load Factor Load Factor YoY Change
Source: Airport enplanement data from CWA (January 2015 through December 2020)Note: load factor = enplanements divided by airport reported outbound seats
21
10
15
20
25
30
35
100 150 200 250 300 350 400 450 500
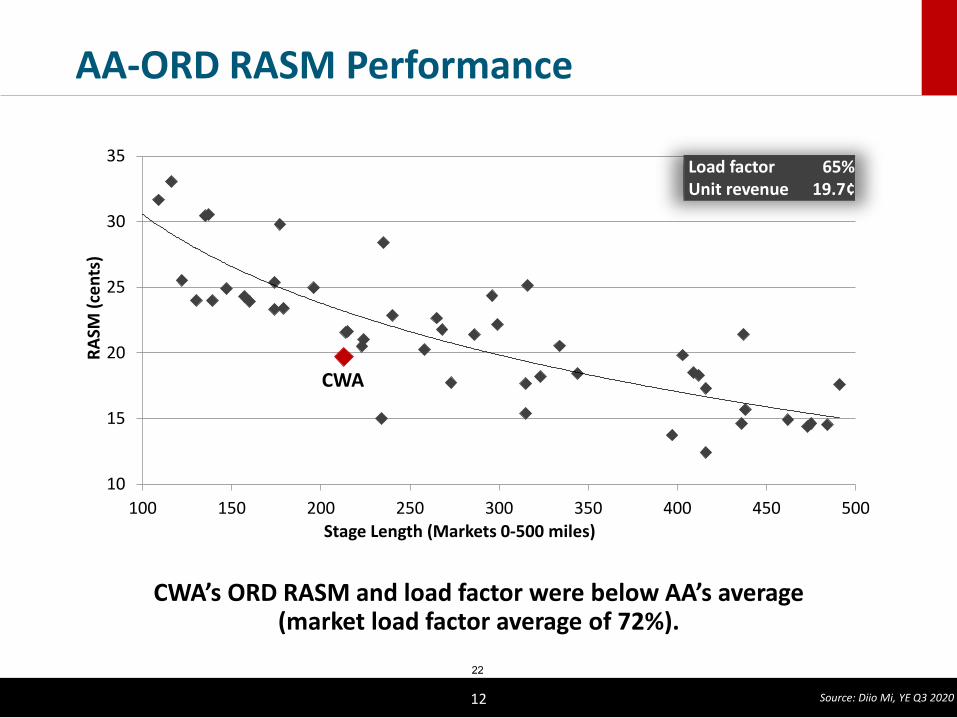
RASM
(cen
ts)
Stage Length (Markets 0-500 miles)
AA-ORD RASM Performance
CWA’s ORD RASM and load factor were below AA’s average (market load factor average of 72%).
12
Load factor 65%Unit revenue 19.7¢
CWA
Source: Diio Mi, YE Q3 2020
22

0
5
10
15
20
25
30
35
100 150 200 250 300 350 400 450 500
RASM
(cen
ts)
Stage Length (Markets 0-500 miles)
UA-ORD RASM Performance
CWA’s ORD RASM was at the average while the load factor was below UA’s average (market load factor average of 71%).
13
Load factor 62%Unit revenue 21.4¢
CWA
Source: Diio Mi, YE Q3 2020
23
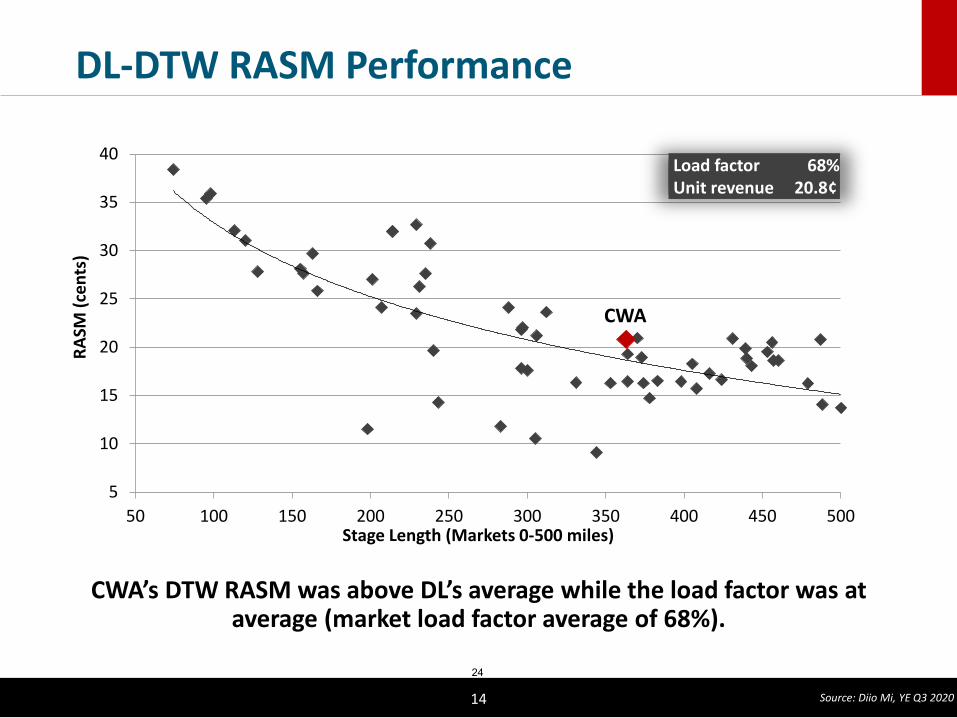
DL-DTW RASM Performance
CWA’s DTW RASM was above DL’s average while the load factor was at average (market load factor average of 68%).
14
CWA
5
10
15
20
25
30
35
40
50 100 150 200 250 300 350 400 450 500
RASM
(cen
ts)
Stage Length (Markets 0-500 miles)
Source: Diio Mi, YE Q3 2020
Load factor 68%Unit revenue 20.8¢
24
DL-MSP RASM Performance
CWA’s MSP RASM was slightly above DL’s average, while CWA’s load factor was below DL’s MSP average of 69%.
15
5
10
15
20
25
30
35
50 100 150 200 250 300 350 400 450 500
RASM
(cen
ts)
Stage Length (Markets 0-500 miles)
CWA
Source: Diio Mi, YE Q3 2020
Load factor 58%Unit revenue 23.7¢
25
RASM Trends
• RASM was down double-digits in all markets in Q3 year-over-year.• Overall, the average market RASM was down 64% at CWA.
16
Destination Airline
2017 2018 2019 2020 YOY Q3Change
Q4 Q1 Q2 Q3 Q4 Q1 Q2 Q3 Q4 Q1 Q2 Q3'20 vs
’18'20 vs
’19
Chicago, IL (ORD)
American 28.9 23.8 28.4 31.5 26.5 27.7 29.4 30.1 26.7 21.3 8.6 12.2 (61%) (59%)
United 25.2 23.1 23.5 30.1 27.4 28.2 26.3 31.9 28.7 23.5 6.7 12.3 (59%) (61%)
Detroit, MI Delta 27.5 26.8 27.6 30.1 27.0 25.3 26.4 25.5 25.9 21.5 5.6 (82%) (78%)
Minneapolis, MN Delta 37.6 38.0 36.9 38.7 35.3 35.7 35.3 39.1 35.1 28.7 6.6 12.7 (67%) (67%)
Total Average 29.6 27.4 28.8 32.5 28.6 28.6 29.0 31.1 28.6 23.2 7.3 11.1 (66%) (64%)
Source: Diio Mi
26
Thank You.
Please be aware that International origin and destination data is restricted to internal purposes only and that any disclosure of the restricted data must be pre-approved in writing by the Department of Transportation.
For additional information, contact:Mead & Hunt, Inc.:Brach CriderManaging Director, Air Service Consulting [email protected]
802 Bagwell BoulevardMurray, KY 42071Phone: (270) 210-6430
27

28
29
30
31
32
33
34
35
36
37