Embed Size (px)
Citation preview

1
CENTRAL SCIENCE LABORATORY
Report to: M A ClookPesticides Safety DirectorateMallard House3, Peasholme GreenYork Y01 2PX
CSL Contract Manager: Dr A D M HartCentral Science LaboratorySand HuttonYorkY041 1LZ
CONTRACT PN0903:IMPROVING THE ASSESSMENT OF
PESTICIDE RISKS TO BIRDS IN ORCHARDS
Objective 1: Use of radio-telemetryto monitor birds’ use of orchards
Authors:
Crocker, D.R., Prosser, P., Tarrant, K.A., Irving P.V.,Watola, G., Chandler-Morris, S. A., Hart, J., Hart, A.D.M.
April 1998
CSL Report No. EH18/02
2
Overview 3
Introduction 5
Methods 6Selection of orchards 6Mist-netting 6Radio-tags and attachment 6Tracking 6
Results 7Bird Behaviour 7Habitat preferences 9Behaviour and habitat 10
Diurnal patterns in habitat use and behaviour 10Activity according to habitat 16
Estimating exposure to pesticides 18
Discussion 23Further Analyses 25
Conclusions 27
Acknowledgements 28
References 28
Appendix 1 30
AppeNdix 2 35
3
CONTRACT PN0903: IMPROVING THE ASSESSMENT OFPESTICIDE RISKS TO BIRDS IN ORCHARDS
Objective 1: Use of radio-telemetryto monitor birds’ use of orchards
OVERVIEW1. The aim of the study was to track common bird species in a range of orchards to
discover where they spent their time, for how long and to what purpose. By thismeans we intended to improve estimates of the exposure of birds to pesticides inorchards.
2. A total of 130 birds (43 blackbirds, 23 blue tits, 34 chaffinches and 30 robins) in21 apple orchards were each monitored though radio-telemetry in order to capture atypical day in the life of each individual.
3. We succeeded in monitoring an average of 8 hours between dawn and dusk on eachindividual. Although radio-telemetry enabled observers to stay close to theirsubjects, birds were visible for little more than 10% of contact time. This meantthat a full log of bird behaviour was not possible. It was possible however toclassify a bird as active or inactive (and by implication as not foraging orpotentially foraging). Blue tits spent significantly more, while blackbirds spentsignificantly less time active than the other species.
4. Habitat was classified as 1) Central -- among orchard fruit trees, 2) Edge -- Orchardhedgerows and verges or 3) Non-orchard habitat. Birds demonstrated markedpreferences for the various habitats in and around orchards. Although all birds inthe study were caught and radio-tagged in orchards, non-orchard habitat was thepreferred location for all but robins. All species preferred non-orchard habitat tocentral habitat among the fruit trees. In addition blackbirds, blue-tits and robinspreferred orchard edges to central habitat. Chaffinches, in contrast, tended to befound more often in the centre of orchards.
5. Because we were interested in the birds’ exposure to pesticides from the things thatthey eat, we wished to know where they get their food and in what quantities. Areasonable assumption may be that the amount of food obtained from a givenlocation is proportional to the time spent there. But this assumption may not alwaysbe justified. For example, birds may visit orchards early in the day when they areactively foraging and spend the hours around the mid-day resting in woodland. Infact, we could find little evidence of any regular diurnal pattern either in behaviouror in habitat preference.
6. Although there was little evidence of any general diurnal patterns, it is still possiblethat individual birds make short forays among orchard fruit trees, returning to

4
hedgerow habitat to consume and digest their prey. No diurnal pattern would beevident in such an example but hedgerow and fruit trees would not be equivalent intheir contribution to diet. We examined the data to see if there was any associationbetween the habitat in which a bird was recorded and its activity there. Blackbirdsand robins were significantly more likely to be recorded as active when they wereamong orchard fruit trees. For these species the gross amount of time spent amongfruit trees is likely to underestimate the proportion of food found there. Thereforefor blackbirds and robins we compared the proportion of “active” time spent inorchard and non-orchard habitat.
7. Frequency distributions of time spent in the orchard and orchard hedges showedthat in several cases, especially the blackbird, the distribution was “U” shaped.Many birds spent either most of their time or else very little of their time in theorchard environment. In the case of blackbirds, the data suggest that the studypopulation could be divided into “residents” which were very faithful to theircapture site and “floaters” who visited the site for long enough to be caught andtagged but who rarely revisited.
8. Our data suggest that for all 4 species followed in and around apple orchards, mostbirds spent less than a quarter of their active time among orchard fruit trees and,apart from chaffinches, the most commonly adopted foraging strategy was to spendless than 10% of active time there. Ninety five percent of blue tits in this studyspent less than 61% of potential foraging time among orchard trees. The 95%quantiles for the other species were: blackbirds 82%, chaffinches 81%, robins 64%.
9. This information may be used to modify the standard calculations estimatingpesticide exposure. For example a blue tit inhabiting an orchard sprayed with 0.5kg of insecticide having an LD50 of 100 mg/kg, would according to standardcalculations be expected to experience a toxicity-exposure ratio of 5.7. If we usethe data from this study showing that 95% of blue tits spend less than 61% of timeamong orchard fruit trees then a more realistic TER would be 9.3.
10.Perhaps the most useful application of our data on the time budgets of birds inorchards is to broaden the focus of risk assessors from individuals to populations.The data can be used to ask what proportion of the population will be exposed topotentially harmful TERs. Taking the case of the blue tit again our data show thatwhile the modified TER is still less than 10 and would, in the absence of otherevidence, be categorised by EPPO as high risk, the proportion of the blue titpopulation likely to experience such conditions is only 8%. This may explain whyinsecticides that are more toxic and applied at higher rates than our hypotheticalexample, appear to have had little direct effect on bird populations in orchards.These population approaches are being investigated further in project PN0920.
11.The possibility that our sample of birds mist-netted in orchards may contain toomany residents and too few visitors is discussed. A remedy is proposed thatweights birds in the sample in inverse proportion to the time they spent in the
5
orchard. Early results suggest that a further downward revision of the time thatbirds spend in orchards may be warranted.
INTRODUCTIONThis project addresses two areas of avian risk assessment which have been identifiedby PSD specialists as priorities for research: improving the estimation of exposure,and providing a scientific basis for assessing the acceptability of effects. Thisdocument reports on the first objective.
Current approaches to assessing pesticide risks to birds start by comparing estimatesof exposure and toxicity by calculating an index of risk, usually in the form of thetoxicity-exposure ratio (TER). The first estimate is usually based on worst-caseassumptions about exposure, including the assumption that the birds spend all theirtime in the treated area and feed exclusively on insects, seeds or other materialcontaining pesticide residues. This is unlikely to be representative of actual conditionsin the field. Therefore, if the first estimate indicates a medium or high risk theseassumptions may be replaced with more realistic ones to assess whether in practice therisk will be acceptable. This adjustment is often difficult due to lack of goodinformation about the use of agricultural habitats by birds and their diets.
Orchards have generally been considered to support larger and more diverse birdpopulations than arable crops or grasslands, a view supported by census data.Orchards also receive relatively high inputs of pesticides. A MAFF Pesticide UsageSurvey of orchards in 1992 found that on average dessert apples receive 17 sprayapplications per year, including repeated applications of several insecticides withrelatively high avian toxicities. Consequently high risk classifications for pesticides inorchards are viewed with some concern, and are likely to lead to requests for furtherdata.
These concerns prompted earlier work in project PV0403, in which the exposure ofbirds to pirimiphos-methyl, chlorpyrifos and carbaryl was assessed in two orchards bycapturing birds and measuring the inhibition of blood enzymes and the presence ofbreakdown products in faeces. Much lower effects were found than would be expectedbased on worst-case TERs, particularly for chlorpyrifos. The most likely explanationwas that bird use of these orchards was much lower than assumed in the riskassessment. If this is generally true of orchards then risk assessments based on theassumption of maximum use will over-estimate risks, possibly leading to unnecessaryrequests for further data (e.g. residue studies and field trials) for firms seekingpesticide approvals.
In order to make assessments more realistic it is necessary to obtain data on the actualuse birds make of orchards. Information is required on: which species use orchards forbreeding or foraging; the types of food they consume; their total daily foodrequirements; and the proportion of daily intake obtained within orchards. For the firstthree aspects a large amount of information exists in the literature, albeit of variable
6
quality. However, little reliable information exists on the proportion of daily intakeobtained in orchards, so this was addressed by the collection of new data in fieldstudies. The most effective approach is the use of radio-tracking to measure theproportion of time spent in orchards by individual birds, augmented by measurementsof food availability and visual observations during tracking to assess the type andproportion of food obtained.
METHODS
Selection of orchardsRadio-tracking data were collected on 21 orchards over a 3 year period mostly takingplace between April and September of 1996 and 1997 in Herefordshire appleorchards. They represented a range of husbandry and pesticide regimes.
In 1995, as a pilot study, radio-tracking was carried out at a single orchard with apesticide input typical of a dessert apple orchards with bush trees. In 1996, 10 ciderorchards were studied consisting of 5 conventional and 5 “organic” orchards. Fourorchards had standard trees grazed by livestock, while the remainder were all bushorchards. In 1997 a further 10 bush orchards were studied 5 of which containeddessert apple varieties and 5 of which were cider apples.
Mist-nettingAll birds were caught using mist-nets erected in the centre and along the edges of theorchards. Our pilot study in 1995 suggested that centrally placed nets were less likelyto catch birds but that the birds caught there were more likely to be faithful to theorchard.
Radio-tags and attachmentAll radio-tags were mounted on the base of the tail feathers as described in Appendix2. Tags were chosen to suit the size of the species being tracked, with tag weight nomore than 5% of the typical species bodyweight. For blackbirds we used BiotrackTW4 transmitters weighing 1.9g. Robins and chaffinches were also tracked usingBiotrack TW4 tags weighing 0.9g while for blue tits we used Holohil LB-2transmitters weighing 0.48g. Tags as light as this were not generally available before1997 Therefore data on blue tits was all collected in 1997.
TrackingA full description of the radio-tracking protocol is included in Appendix 1. Briefly, weintended to capture a representative day in the life of each individual. The very smalltags used meant that battery life was often limited to a few days, so that once a birdwas tagged it was followed intensively for 2 or 3 days. During a typical monitoringsession of one or two hours, a single bird was tracked continuously. The tracker kept

7
close enough to the bird to be sure of its whereabouts but not so close as to disturb it.In the orchard environment this resulted in an observation distance of 20-50m. At 5minute intervals notes were made of a bird's location (to the nearest 10m), the habitatit occupied (e.g. hedge, woodland, orchard floor) and its activity (e.g. foraging,singing). Weather and temperature were also recorded. With the aid of digitalmapping software, data was transferred from field notebooks onto a Microsoft Accessdatabase.
RESULTSA total of 167 birds were radio-tagged of which useful data was obtained for 130(Table 1). As pesticides may be used in apple orchards at any time between March andSeptember, birds were followed through the complete growing season. No attemptwas made to select for age or sex.
Blackbirds were the easiest species to follow with 90% of tagged birds successfullytracked. Blue tits were the most difficult with more than a third of the tagged birdsfailing to provide any data. The most common reason for failures was the loss of thetag, in the case of blue tits, robins and chaffinches, usually through prematuremoulting of the tail feathers to which the tag was attached. Blue tits also tended toattack the tags by pecking at them. This shortened the life of several tags before theproblem was cured with an extra coating of epoxy resin. The other common reasonsfor failing to collect data were when birds migrated out of the study area or when tagdeveloped a fault.
Table 1: Breakdown of birds tagged by species, year, sex and age.Species Total
taggedTotaltracked
1995 1996 1997 Female Male Notknown
Adult Juv
Blackbird 48 43 6 26 11 15 28 30 13Blue tit 36 23 23 5 18 12 11Chaffinch 43 34 2 15 17 12 21 1 29 5Robin 40 30 3 17 10 3 3 24 12 18
167 130
Bird BehaviourField workers kept close contact with birds for an average of 7 to 8 hours over 2 or 3days (Table 2). Birds were in view for relatively little of this time. On average birdswere visible for 11% of recorded time (Fig 1). All four species were equally difficultto see (F= 0.0865, df 3,126, p=.9673)
Table 2: Number of hours, and time-span over which radio-tracking data werecollected.
Species Total Track time(hours)
Duration(days)
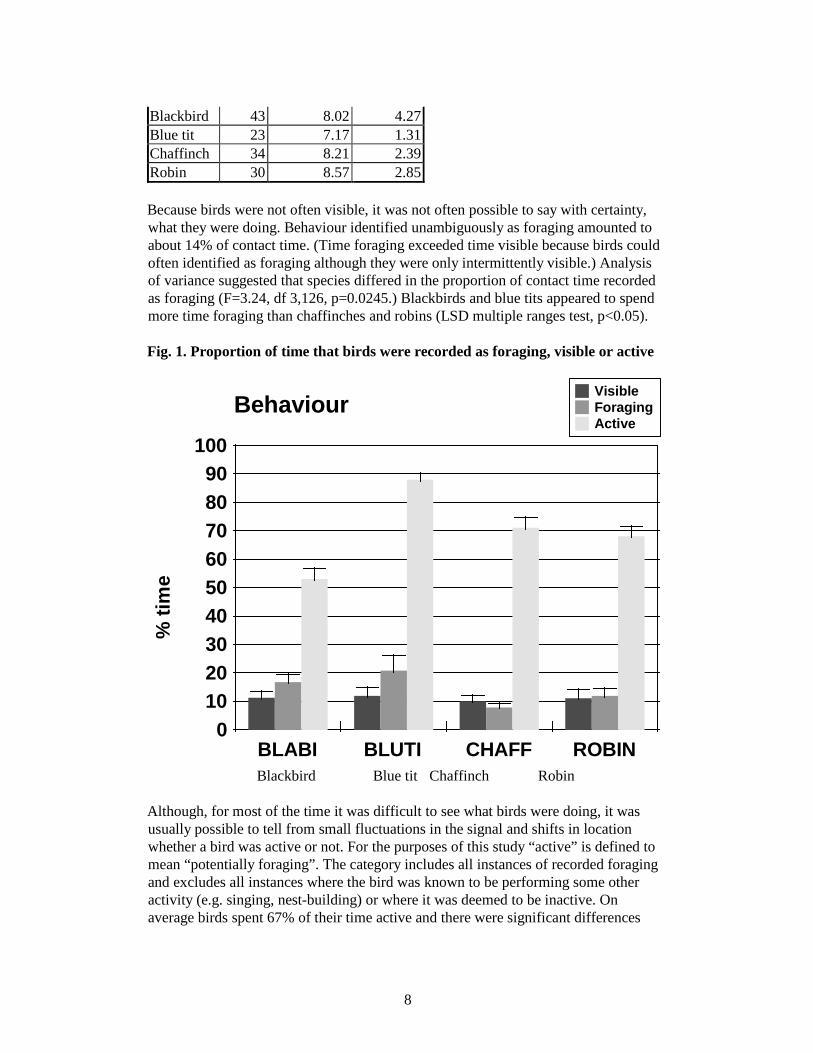
8
Blackbird 43 8.02 4.27Blue tit 23 7.17 1.31Chaffinch 34 8.21 2.39Robin 30 8.57 2.85
Because birds were not often visible, it was not often possible to say with certainty,what they were doing. Behaviour identified unambiguously as foraging amounted toabout 14% of contact time. (Time foraging exceeded time visible because birds couldoften identified as foraging although they were only intermittently visible.) Analysisof variance suggested that species differed in the proportion of contact time recordedas foraging (F=3.24, df 3,126, p=0.0245.) Blackbirds and blue tits appeared to spendmore time foraging than chaffinches and robins (LSD multiple ranges test, p<0.05).
Fig. 1. Proportion of time that birds were recorded as foraging, visible or active
BLABI BLUTI CHAFF ROBIN0
102030405060708090
100
%tim
e
VisibleForagingActive
Behaviour
Blackbird Blue tit Chaffinch Robin
Although, for most of the time it was difficult to see what birds were doing, it wasusually possible to tell from small fluctuations in the signal and shifts in locationwhether a bird was active or not. For the purposes of this study “active” is defined tomean “potentially foraging”. The category includes all instances of recorded foragingand excludes all instances where the bird was known to be performing some otheractivity (e.g. singing, nest-building) or where it was deemed to be inactive. Onaverage birds spent 67% of their time active and there were significant differences

9
between species (F= 17.4, df 3, 126, p = < 0.001). Blue tits spent significantly more,while blackbirds spent significantly less time active than the other species.
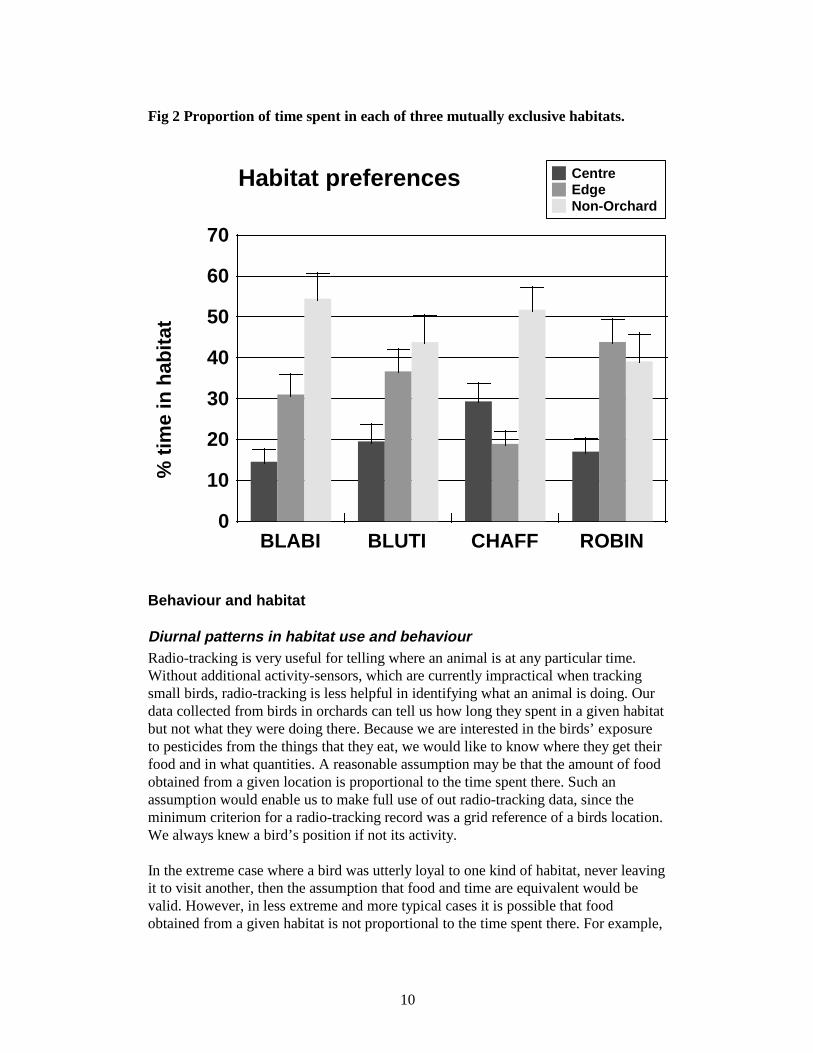
Habitat preferencesBirds demonstrated marked preferences for different habitats in and around orchards(Figure 2). All four species spent long periods of time (an average of 48%) outsideorchard habitat and rather less time (20%) in the orchard centre among the fruit trees.Although all birds in the study were caught and radio-tagged in orchards, non-orchardhabitat was the preferred location for all but robins. Species differences became moreapparent when considering how birds made use of habitat within orchards.Chaffinches spent more time among the orchard fruit trees than blackbirds and robins(F=3.5, df 3.126, p=0.0182). Blackbirds, blue-tits and especially robins spent most oftheir time in hedgerows along orchard edges (F=4.4, df 3, 126, p = 0.0058).
Within each species, paired t-tests (Table 3) showed that all species preferred non-orchard habitat to central habitat among the fruit trees. In addition blackbirds, blue-titsand robins preferred orchard edges to central habitat. The opposite was true forchaffinches which were more often found in the centre of orchards than along theiredges, though in this case the difference was not quite significant (p = 0.055). (In eachcase a negative T-value indicates a tendency for birds to prefer the second habitat inTable 3.)
Table 3: Paired T-tests of habitat preferences within speciesSpecies Habitat df T 2-tail p
Blackbird Centre v Edge 42 -3.02 0.004Centre v Non-Orchard 42 -5 < 0.001Edge v Non-Orchard 42 -2.48 0.017
Blue tit Centre v Edge 22 -2.32 0.03Centre v Non-Orchard 22 -2.64 0.015Edge v Non-Orchard 22 -0.66 0.517
Chaffinch Centre v Edge 33 +1.99 0.055Centre v Non-Orchard 33 -2.48 0.019Edge v Non-Orchard 33 -4.15 < 0.001
Robin Centre v Edge 29 -4.11 < 0.001Centre v Non-Orchard 29 -2.67 0.012Edge v Non-Orchard 29 0.21 0.834
10
Fig 2 Proportion of time spent in each of three mutually exclusive habitats.
BLABI BLUTI CHAFF ROBIN0
10
20
30
40
50
60
70
%tim
ein
habi
tat
CentreEdgeNon-Orchard
Habitat preferences
Behaviour and habitat
Diurnal patterns in habitat use and behaviourRadio-tracking is very useful for telling where an animal is at any particular time.Without additional activity-sensors, which are currently impractical when trackingsmall birds, radio-tracking is less helpful in identifying what an animal is doing. Ourdata collected from birds in orchards can tell us how long they spent in a given habitatbut not what they were doing there. Because we are interested in the birds’ exposureto pesticides from the things that they eat, we would like to know where they get theirfood and in what quantities. A reasonable assumption may be that the amount of foodobtained from a given location is proportional to the time spent there. Such anassumption would enable us to make full use of out radio-tracking data, since theminimum criterion for a radio-tracking record was a grid reference of a birds location.We always knew a bird’s position if not its activity.
In the extreme case where a bird was utterly loyal to one kind of habitat, never leavingit to visit another, then the assumption that food and time are equivalent would bevalid. However, in less extreme and more typical cases it is possible that foodobtained from a given habitat is not proportional to the time spent there. For example,
11
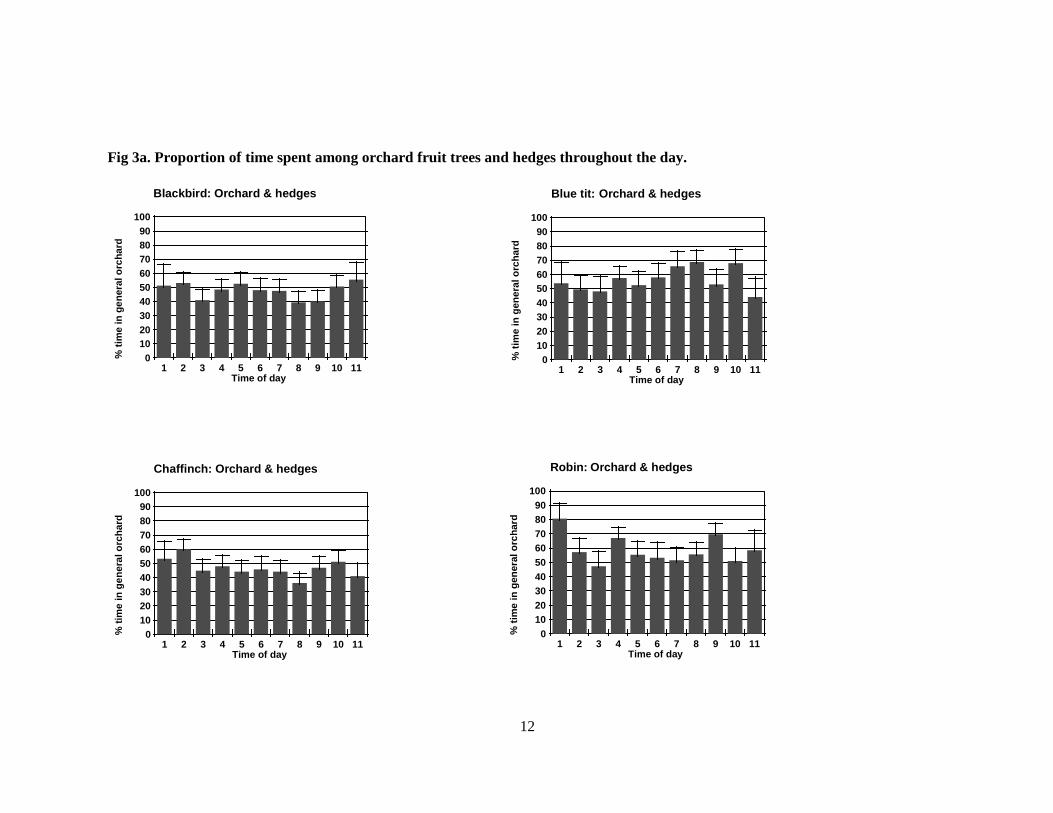
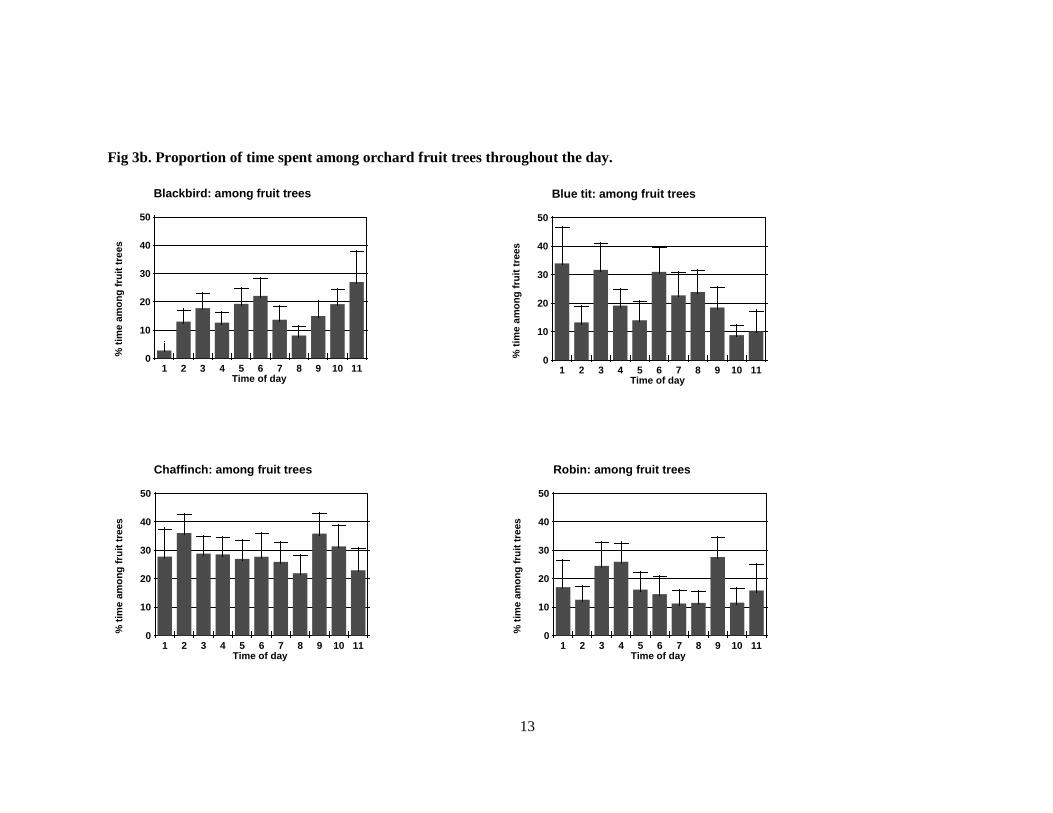
birds may visit orchards early in the day when they are actively foraging and spend thehours around the mid-day resting in woodland. In this case time spent in orchard andwoodland may be similar yet contribute very differently to a birds’ food intake andexposure to pesticide. If birds showed any regular patterns of activity or habitatpreference we may be able to use them to weight our radio-tracking data on residencetimes in habitat to get a more accurate estimate of the food obtained there. Forexample, if we could show that blue-tits were less active at the start of the day whenthe temperature was colder and insects sluggish, we might discount time spent inorchards during early morning by an appropriate amount. We examined the radio-tracking data for each species looking for any diurnal pattern in habitat use andbehaviour (Fig 3a, b, c, d).
Because field work extended over 6 months the time axes in the Figures 3a-3d havebeen calculated to take account of varying day length. The day between dawn anddusk was divided into 10 equal periods with the 11th representing birds foraging afterdusk. Figures 3a and 3b show that birds did not choose to make use of general orchardhabitat, or the central habitat among orchard fruit trees at particular times of the day.Similarly, it did not appear that species were more likely to be active (potentiallyforaging) during some parts of the day than others (Fig 3c). When behaviour wasconfined to that which could definitely be called foraging there was some indicationthat blackbirds and robins had a lull in feeding near mid-day (confirming Lees, 1948)and that blue tits were more active at that time. However, as has already been noted,foraging behaviour accounted for little more than 10% of contact time, so that therewas large variation in average values.
12
Fig 3a. Proportion of time spent among orchard fruit trees and hedges throughout the day.
1 2 3 4 5 6 7 8 9 10 11Time of day
0102030405060708090
100
%tim
ein
gene
ralo
rcha
rd
Blackbird: Orchard & hedges
1 2 3 4 5 6 7 8 9 10 11Time of day
0102030405060708090
100
%tim
ein
gene
ralo
rcha
rd
Chaffinch: Orchard & hedges
1 2 3 4 5 6 7 8 9 10 11Time of day
0102030405060708090
100
%tim
ein
gene
ralo
rcha
rd
Blue tit: Orchard & hedges
1 2 3 4 5 6 7 8 9 10 11Time of day
0102030405060708090
100
%tim
ein
gene
ralo
rcha
rd
Robin: Orchard & hedges
13
Fig 3b. Proportion of time spent among orchard fruit trees throughout the day.
1 2 3 4 5 6 7 8 9 10 11Time of day
0
10
20
30
40
50
%tim
eam
ong
frui
ttre
es
Blackbird: among fruit trees
1 2 3 4 5 6 7 8 9 10 11Time of day
0
10
20
30
40
50
%tim
eam
ong
frui
ttre
es
Blue tit: among fruit trees
1 2 3 4 5 6 7 8 9 10 11Time of day
0
10
20
30
40
50
%tim
eam
ong
frui
ttre
es
Chaffinch: among fruit trees
1 2 3 4 5 6 7 8 9 10 11Time of day
0
10
20
30
40
50
%tim
eam
ong
frui
ttre
es
Robin: among fruit trees

14
Fig 3c. Proportion of time recorded as “active” throughout the day.
1 2 3 4 5 6 7 8 9 10 11Time of day
0102030405060708090
100
%tim
eac
tive
Blackbird: Diurnal activity
1 2 3 4 5 6 7 8 9 10 11Time of day
0102030405060708090
100
%tim
eac
tive
Blue tit: Diurnal activity
1 2 3 4 5 6 7 8 9 10 11Time of day
0102030405060708090
100
%tim
eac
tive
Chaffinch: Diurnal activity
1 2 3 4 5 6 7 8 9 10 11Time of day
0102030405060708090
100
%tim
eac
tive
Robin Diurnal activity

15
Fig 3d. Proportion of time recorded as foraging throughout the day.
1 2 3 4 5 6 7 8 9 10 11Time of day
0
5
10
15
20
25
30
35
%tim
efo
ragi
ng
Blackbird: foraging
1 2 3 4 5 6 7 8 9 10 11Time of day
0
5
10
15
20
25
30
35
%tim
efo
ragi
ng
Blue tit: foraging
1 2 3 4 5 6 7 8 9 10 11Time of day
0
5
10
15
20
25
30
35
%tim
efo
ragi
ng
Chaffinch: foraging
1 2 3 4 5 6 7 8 9 10 11Time of day
0
5
10
15
20
25
30
35
%tim
efo
ragi
ng
Robin: foraging

16
Activity according to habitat
Although there was little evidence of any general diurnal pattern in behaviour orhabitat usage, it is still possible that individual birds make short forays among orchardfruit trees, returning to hedgerow habitat to consume and digest their prey. No diurnalpattern would be evident in such an example but hedgerow and fruit trees would notbe equivalent in their contribution to diet. We examined the data to see if there wasany association between the habitat in which a bird was recorded and its activity there.
Blackbirds and robins were significantly more likely to be recorded as active whenthey were among orchard fruit trees (Fig 4, Table 4). This implies that these specieswere using central orchard habitat for different purposes than other habitat, andtherefore that time spent in the two habitat categories are not equivalent. Given that“active” was defined in this study to mean “potentially foraging”, these data suggestthat blackbirds and robins are more likely to use orchards for foraging. This issupported by the data in Figure 5 and Table 5 showing that blackbirds, robins andchaffinches were more likely to recorded as foraging when they were being trackedamong orchard fruit trees.
Table 4. T-tests comparing % time in orchard centre v elsewhere that was activeSpecies Centre Elsewhere
n % active n % active df t pBlackbird 32 80.00 43 48.49 46.97 5.71 < 0.001Blue tit 19 94.69 23 85.10 40 3.72 0.086Chaffinch 30 79.52 34 71.29 62 1.35 0.181Robin 24 82.97 30 65.42 35.56 3.84 < 0.001
Table 5. T-tests comparing %foraging time in orchard centre v elsewhere.Species Centre Elsewhere
n % foraging n % foraging df t pBlackbird 32 30.92 43 13.86 36.84 2.59 0.014Blue tit 19 15.86 23 21.50 40 -0.59 0.559Chaffinch 30 14.57 34 5.70 36.47 2.2 0.044Robin 24 26.10 30 10.40 27.09 2.17 0.039

17
Fig 4 Proportion of time in among fruit trees and elsewhere that was recorded asactive.
BLABI BLUTI CHAFF ROBIN0
102030405060708090
100
%tim
eac
tive
inha
bita
t
Orchard CentreElsewhere
% time active in orchard centre v elsewhere
*** NS ***NS
Fig 5 Proportion of time among orchard fruit trees and elsewhere that wasrecorded as foraging.
BLABI BLUTI CHAFF ROBIN0
102030405060708090
100
%tim
efo
ragi
ngin
habi
tat
Orchard CentreElsewhere
% time foraging in orchard centre v elsewhere
* * *NS

18
Estimating exposure to pesticidesTo the extent that time spent in a habitat is unlikely to be proportional to foodobtained there, then the time recorded in orchards will not be a good measure of likelyexposure to pesticides. Rather, we should use the “active” time or the time spentforaging by birds in orchards as the appropriate estimator of exposure.
There are several difficulties in using foraging time as the proxy for pesticideexposure. Firstly, behaviour that could unambiguously be called foraging was rare.And likely to be much more variable. (This can be seen in figures 3d and 5.).Secondly, observers were unlikely to record a bird as foraging without having haddefinite visual contact. Birds were more likely to be seen in the relatively open habitatof the orchard fruit trees than the more enclosed hedges, scrub and woodland. Thatbirds are more likely to be recorded as foraging among orchard fruit trees maytherefore be an artefact of their easier visibility. This is less likely to be the case withbehaviour classified as “active” which depended more on evidence of movement thanon visual sightings.
For the purposes of estimating exposure to pesticides in blackbirds and robins, it istherefore proposed to use active time among orchard fruit trees as the key factor. (Asblue tits and chaffinches showed no significant difference in activity between habitatsthen total time among fruit trees should give a reasonable estimate of food obtainedthere for these species.)
In what way may we use information about time in orchards to help estimate pesticideexposure? Figure 6 shows a hypothetical example in which a species distributes itstime normally with a mean of 35%. In this example no bird spent more than 80% ofits time in the orchard and therefore one might use this a worst case for pesticideexposure. Instead of assuming that birds get 100% of their food from a sprayedorchard we would use the empirical evidence to revise the estimate to 80%.
In reality none of bird species in this study behaved like the hypothetical example.Figure 7 shows how the 4 species made use of general orchard habitat including theperimeter hedges. In several cases, especially the blackbird the distribution is muchmore “U” shaped than normal. Many birds spent either most of their time or else verylittle of their time in the orchard environment. In the case of blackbirds, the datasuggest that the study population could be divided into “residents” which were veryfaithful to their capture site and “floaters” who visited the site for long enough to becaught and tagged but who rarely revisited.
Since pesticides are primarily sprayed on fruit trees, then time, and particularly activetime spent in the orchard centre are the most appropriate measures of pesticideexposure. (Figs 8 and 9). That birds were more likely to recorded as active when theywere being tracked among orchard fruit trees is reflected in the frequency distributionsshown in Fig 9 compared to Fig 8. For blackbirds and robins, 95% of the samplepopulation spent less than 82% and 64% respectively of theiractivetime amongorchard fruit trees (solid arrows in Fig 9). The corresponding figures fortotal timespent among orchard fruit trees were markedly lower, 59% for blackbirds and 54% for

19
robins (Fig 9). (Dotted arrows represent the upper 90% confidence limits for the solidarrow values)
Fig. 6. Hypothetical distribution of bird time in orchard.
% time in orchard
95.085.0
75.065.0
55.045.0
35.025.0
15.05.0
Nbi
rds
7
6
5
4
3
2
1
0
Std. Dev = 16.79Mean = 34.7N = 19.00
20
Fig 7: Frequency distribution of time spent among orchard fruit trees andhedges.
% time in orchard & hedges
95.085.0
75.065.0
55.045.0
35.025.0
15.05.0
BlackbirdN
ofbi
rds
16
14
12
10
8
6
4
2
0
Std. Dev =40.03Mean=45.5N =43.00
% time in orchard and hedges
95.085.0
75.065.0
55.045.0
35.025.0
15.05.0
Blue tit
Nof
bird
s
6
5
4
3
2
1
0
Std. Dev =31.13Mean=56.2N =23.00
% time in orchard & hedges
95.085.0
75.065.0
55.045.0
35.025.0
15.05.0
Chaffinch
Nof
bird
s
7
6
5
4
3
2
1
0
Std. Dev =32.31Mean=48.2N =34.00
% time in orchard & hedges
95.085.0
75.065.0
55.045.0
35.025.0
15.05.0
Robin
Nof
bird
s
10
8
6
4
2
0
Std. Dev =36.73Mean=60.9N =30.00

21
Fig 8: Frequency distribution of time spent among orchard fruit trees
%time among orchard fruit trees
95.085.0
75.065.0
55.045.0
35.025.0
15.05.0
Blackbird
Nof
bird
s30
20
10
0
Std. Dev =19.58Mean=14.6N =43.00
59 77
% time among orchard fruit trees
95.085.0
75.065.0
55.045.0
35.025.0
15.05.0
Blue tit
Nof
bird
s
12
10
8
6
4
2
0
Std. Dev =19.72Mean=19.5N =23.00
61 77
% time among orchard fruit trees
95.085.0
75.065.0
55.045.0
35.025.0
15.05.0
Chaffinch
Nof
bird
s
12
10
8
6
4
2
0
Std. Dev =25.79Mean=29.3N =34.00
9281
% time among orchard fruit trees
95.085.0
75.065.0
55.045.0
35.025.0
15.05.0
Robin
Nof
bird
s
16
14
12
10
8
6
4
2
0
Std. Dev =17.38Mean=17.0N =30.00
54 71

22
Fig 9: Frequency distribution of active time spent among orchard fruit trees
%of active time among orchard fruit trees
95.085.0
75.065.0
55.045.0
35.025.0
15.05.0
Robin
Nof
bird
s
14
12
10
8
6
4
2
0
Std. Dev =20.66Mean=19.7N=30.00
8064
%of active time among orchard fruit trees
95.085.0
75.065.0
55.045.0
35.025.0
15.05.0
Chaffinch
Nof
bird
s
10
8
6
4
2
0
Std. Dev =27.29Mean=31.1N=34.00
85 94
%of active time among orchard fruit trees
95.085.0
75.065.0
55.045.0
35.025.0
15.05.0
Blackbird
Nof
bird
s30
20
10
0
Std. Dev =26.90Mean=21.8N=43.00
82 93
%of active time among orchard fruit trees
95.085.0
75.065.0
55.045.0
35.025.0
15.05.0
Blue tit
Nof
bird
s
12
10
8
6
4
2
0
Std. Dev =21.67Mean=21.4N=23.00
8367
23
DISCUSSIONExposure is probably the least well measured element in avian risk assessment(Tiebout and Brugger, 1995). Current risk assessment practice typically takes the mostconservative view that non-target birds obtain all their food from a contaminatedsource. This is unlikely to be true but it is intended to represent a worst case: if apesticide is judged safe for an individual wholly dependent on a pesticide treated cropthen it will be safe for the more realistic example of an individual foraging across avariety of habitats. Our data suggest that for all 4 species followed in and around appleorchards, most birds spent less than a quarter of their active time among orchard fruittrees and, apart from chaffinches, the most commonly adopted foraging strategy wasto spend less than 10% of active time there. What do these figures mean for pesticiderisk assessment?
Clearly, the assumption that the food of orchard birds is always contaminated bypesticide does not sit well with the empirical evidence. Such an assumptionoverestimates pesticide exposure for most individuals by as much as an order ofmagnitude. Our data on the chaffinch, the most consistent central orchard forager,suggest that 23% is the median amount of active time spent by these birds among fruittrees. However, assuming that the median proportion of pesticide-treated foodconsumed by chaffinches in orchards was also 23%, it would not be appropriate toadopt this value as the key statistic for risk assessment calculations on that species. Ifrisk assessments were geared to ensure the safety of the median individual, then byimplication they would be geared to potentially endanger half the population. If on theother hand it is desired to protect all members of a wildlife population from anyadverse effects of pesticides, then risk assessments must either follow the currentworst case assumption of complete exposure, or they must discover what, empirically,is the worst case exposure. Unfortunately, the latter is not a practical proposition: itwould entail monitoring all members of a population all the time.
A compromise may to be design risk assessment to protect the majority of a wildlifepopulation. For example, the data for blue tits in this study suggests that 95% of thepopulation spent less than 61% of potential foraging time among orchard trees (Fig 8).This figure may be incorporated in the standard calculations of exposure as in thefollowing example.
Suppose an insecticide is applied at 0.5 kg a.s./hectare of orchard. The EPPOguidelines (1994) suggest that the residues left on small insects will amount to 14.5mg/kg wet weight. A blue tit weighing 11 g may expend 67 Kj energy each day(Tatner and Bryant 1993). Suppose such a bird was feeding on small caterpillars.Caterpillars have an energy value of 25.05 Kj /g dry weight (Varley 1967), and amoisture content of between 77% and 90% (Gibb, 1954; Slansky, 1993). Assuming amoisture content of 80%, and thus an energy value of 5 kJ/g wet weight, then a blue titwould need to consume 13.3 g of caterpillars a day. This would result in the birdreceiving 17.6 mg a.s./kg body weight. Suppose that the insecticide has an acute oraltoxicity to birds of 100 mg as/kg body weight. The resulting toxicity-exposure ratio

24
(100/17.6) would be 5.69, indicating that blue-tits feeding solely on sprayedcaterpillars would be in danger of consuming more than 1/10th of a lethal dose of a.s.in a day.
Annexes III and VI of EU directive 91/414, groups TERs into three categories: whereTER > 100 and there is no other evidence of risk, then no further testing is required;where 10 < TER≤ 100 then expert judgement is required to decide whether there is aneed for further studies; and where TER≤ 10, further cage or field trials must beconducted and approval shall not be granted unless an appropriate risk assessmentdemonstrates that under field conditions no unacceptable impact occurs. (EPPO callsthese categories high, medium and low risk, respectively.) The hypotheticalinsecticide used in the above example would fall into EPPO’s high risk category andtrigger a more detailed risk assesment, probably including requests for further datafrom the manufacturers.
Our radio-tracking results suggest that 95% of blue-tits find less than 61% of theirfood in orchards. Therefore the standard calculation above could be modified byassuming that an 11g blue tit daily consumes no more than 13.3 x 0.61 = 8.11 gcaterpillars. This would result in a TER of 9.32 bringing it closer to EPPO’s mediumrisk category.
In addition to their value in bringing more reality into the calculation of toxicity-exposure ratios, our data enable risk assessors to broaden their focus from individualsto populations. The data can be used to ask what proportion of the population will beexposed to potentially harmful TERs. Suppose, on the grounds that a ten-foldvariation in toxicity between species is not uncommon (Luttik and Aldenberg, 1997)we define a TER of < 10 as high risk. In the case of blue tits exposed to pesticide withan LD50 of 100 mg/kg, a TER of 10 would mean that birds could afford to consumeno more than 100/10 = 10 mg a.s./kg body weight. We know from the previouscalculation that blue tits spending all their time in sprayed orchards might expect tosustain 17.6 mg as/kg exposure. Therefore if they are not to fall within the high riskcategory, blue tits should obtain no more than 10/17.6 = 57% of their food fromorchards. From our empirical data on residence times (Fig 10) we can say that 8% ofblue tits spent more than 57% of their day in orchards. Therefore a pesticide sprayed at0.5 kg/ha and with an acute oral toxicity of 100 mg/kg might be expected to expose8% of the local blue-tit population to TER < 10. A similar calculation where no morethan 5.7% of food is obtained in orchards suggests that 63% of our sample populationof blue tits will experience TERs of≤ 100.

25
Fig 10: Proportion of the blue tit study population spending more than a given %time among orchard fruit trees
0
10
20
30
40
50
60
70
80
90
100
0 5 10 15 20 25 30 35 40 45 50 55 60 65 70
% time in orchard
%po
pula
tion
exce
edin
g
The challenge for pesticide regulators is in deciding how safe for wildlife, theagricultural environment needs to be. Where theoretical risk assessments find thatbirds and mammals are likely to consume more than 1/10th of a lethal dose ofpesticide in any one day (TER < 10), then current EU regulations will not grantapproval for it’s use unless it can be shown that unacceptable adverse effects areunlikely to follow in practice. Our example of a real blue tit population exposed to arealistic, albeit hypothetical, insecticide shows that while some birds are very likely toexperience TERs < 10, the numbers are rather small, less than 8% when expressed asproportion of the whole orchard population. It should be noted that the WildlifeIncident Investigation Scheme rarely finds small birds poisoned by pesticides inorchards, especially when compared to casualties caused by organochlorines in the1960s and 1970s. In addition Hart et. al, (1995) found little biochemical evidence ofexposure to pesticides in small passerines caught in orchards. Our finding that mostbirds caught in orchards spend little time there, may explain why real insecticides,more toxic and applied at higher rates than our hypothetical example, appear to havehad little direct consequences for bird populations.
Further AnalysesThis section discusses ways in which the data may be further refined to produce moreaccurate estimates or orchard use and hence pesticide exposure. The ideas presentedare sketchy as yet and we intend to develop them further in a later version of thisreport.
26
The main aim of this study was to arrive at a realistic definition of “worst case”exposure to pesticides in orchards. Accordingly, we made special efforts to catch birdsthat were likely to use orchards. We preferred for example, to radio-tag birds whichwere caught in the middle of orchards.(Even so the majority of tagged birds werecaught along the orchard edge, where netting was more productive.) Regardless of ourconscious attempts to select birds, there are reasons for thinking that any sample ofnetted birds will be biased. If the probability of being caught in a mist-net isproportional to the time birds spend near it, then a mist-net will tend to catch thosebirds in whose core territory it is placed. The chances of catching fleeting visitors maybe slimmer. For the purpose of fulfilling our stated aim of defining a realistic worstcase, then such a bias may desirable. It is the orchard’s local population that is mostexposed to pesticides and so, it could be argued, local residents should be the focus ofour exposure estimates.
On the other hand , it might be argued that the proper subject of our concern shouldinclude not only habitual orchard users, but should also encompass the largerpopulation of birds thatevervisits orchards, since this is the true population that maybe exposed to pesticides. If occasional visitors to orchards are under-represented inour sample of radio-tagged birds then our estimate of the “worst case” for the largerpopulation will be too severe, since it may be based on a sample containing adisproportionate number of residents.
Before proceeding, we need to consider two questions.• Is our sample demonstrably biased towards residents? The argument that
the probability of capture in an orchard mist-net is proportional to the timethat a bird spends in the orchard seems very reasonable. However, there arealso other, contrary arguments that could be made. Firstly it may be thatresident birds are more likely to notice and to avoid a large foreign structuresuch as mist net when it suddenly appears in their familiar territory.Newcomers, to whom everything is unfamiliar may be less aware of them.In this case, newcomers rather than residents would more likely to becaught and thus to be over-represented in our sample. Secondly, thefrequency distributions seen in Fig. 8 clearly show that the most numerouscategory was for birds which spent very little time among fruit trees.Residents were rare. This begs the question: what would a frequencydistribution of time spent in orchards look like if we assume that mist-netscapture birds in proportion to the time they spend in orchards? We arecurrently investigating the consequences of such assumptions.
• If residents are over-represented in our sample can we correct the bias?Ifthe bias is caused by our capture methods we could consider how theymight be modified to obtain a more representative sample. For example, wemight place mist-nets in adjacent areas in the hope of catching birds whosecore territories are outside orchards but who make occasional forays intothem. This would obviously entail extra sampling and tracking effort, muchof which would be wasted on birds which subsequently spend no time at allin the orchard. It is difficult to imagine a practicable capture protocol that

27
could be genuinely unselective.
A simpler remedy is to adjust the data we have already collected byweighting it appropriately. Figure 11 shows what the frequency distributionof time spent by blue tits in orchards would look like if we weighted ourempirical data so that birds spending little time in orchards make aproportionately larger contribution to sample. Clearly, the “worst case”example, intended to safeguard 95% of the population, would experienceconsiderably less exposure than in our unweighted observed sample.Further analyses of this sort are currently underway.
Fig. 11: Comparison between observed frequency distribution of blue tits amongorchard trees and a distribution weighted to favour visitors over residents.
CONCLUSIONS1. Radio-telemetry proved a successful technique for gaining information on the use
made by individual birds of orchards. As a result we are much better placed to

28
estimate the likely exposure to orchard pesticides of blackbirds, blue-tits,chaffinches and robins.
2. Most birds caught in orchards spend most of their time elsewhere. There weresignificant differences in habitat use between species. Robins showed a strongpreference for orchard hedgerows, while chaffinches were more likely to be foundamong orchard fruit trees.
3. Time spent in orchards is probably a reliable measure of food obtained there forblue-tits and chaffinches. For blackbirds and robins the proportion ofactivetime isa better measure of their potential exposure to pesticides.
4. Our radio-telemetry data will prove useful in pesticide risk assessments in twoways.
• They may be used to modify Toxicity-Exposure Ratios. Instead of assumingthat birds spend all their time feeding in pesticide treated environments, ourempirical data will provide more realistic estimates.
• We can use them to look beyond “worst case” TERs and consider the riskthat pesticides may pose to the larger population. They enable us to say, forexample, what proportion of a bird population would be likely toexperience TERs of < 10 or < 100.
• In addition to quantitative adjustments to TERs these results may be usedqualitatively to provide a much firmer basis for the expert judgementrequired when TER < 100 and in discussions with registrants.
5. We are currently investigating whether our empirical estimates of orchard use maybe further refined by correcting for any possible biases in the data. The use of theresults for population-based estimates of exposure is being investigated further inproject PN0920.
ACKNOWLEDGEMENTSThis study was funded by the UK Pesticides Safety Directorate. We are grateful to themany growers who gave us access to their orchards and provided information on theiruse of pesticides, to Dr R Fuller of the British Trust for Ornithology for advising onstudy design and to Mr. Chris Fairs of HP Bulmer Limited for introducing us toHerefordhsire cider apple growers.
REFERENCES
EPPO (1994)Decision-making scheme for the environmental risk assessment of plantprotection products, EPPO bulletin24,37-87.

29
EU Council Directive 97/57EC(1997) establishing annex VI to Directive91/414/EEC concerning the placing of plant protection products on the market.
Gibb, J. (1957) Food requirements and other observations on captive tits,Bird Study4, 207-215
Hart, A., Jones, A., Langton, S., Sibson, F., and Thompson, H. (1995) Exposure ofbirds in orchards to pirimiphos-methyl, chlorpyrifos and carabaryl. CSL milestonereport PV0403
Lees, J.(1948) Winter feeding hours of robins, blackbirds and blue-tits,British Birds41, 71-76
Luttik, R & Aldenberg, T. Extrapolation factors for small samples of pesticidetoxicity data: special focus on LD50 values for birds and mammalsEnviron. Toxicol.Chem.16, 1785-1788.
Slansky Jr, F. (1993) Nutritional ecology: the funamental quest for nutrients In N.E.Stamps and T.M. Casey (Eds)Caterpillars: Ecological and Evolutionary Constraintson Foraging,29-91, Chapman & Hall, London.
Tatner, P. & Bryant, D. M. (1993). Interspecific variation in daily energy-expenditure during avian incubation.Journal Of Zoology231, 215-232
Tiebout, H. M. & Brugger, K. E. (1995) Ecological risk assessment of pesticides forterrestrial vertebrates: evaluation and application of the US Environmental ProtectionAgency's Quotient Model.Conservation Biology9: (6):1605-1618.
Varley G C (1967) The effects of grazing by animals on plant productivity. InSecondary productivity of terrestrial ecosystems. K Petrusewicz (Ed.) 773-777.Warsaw.
30
APPENDIX 1
27 November, 2001
Protocol for mist-netting and radio-tracking.
We have 10 sites made up of 5 pairs, each comprising a Dessert and a Cider orchard.We should concentrate on 1 pair at a time, as far as possible doing everythingidentically within each orchard. When enough staff are available (2 ringers + 1 - 2assistants) we should aim to net at both sites simultaneously. Otherwise, nettingshould take place on successive days.
A single person can usually manage to track two birds alternately. Therefore, in idealconditions we would aim to tag (no more than) 2 birds per tracker, spend the rest ofthe week tracking them and begin with a new orchard pair the following Monday. (Inreality the problem is likely to be too few birds rather than a scarcity of staff).
Farm pair priorityLast year, having established the sequence of orchard pairs, we simply repeated thecycle in the same order. This year PSD want to know about the immediate effects ofinsecticide sprays on bird foraging behaviour. We therefore need to be in close contactwith farmers to find out when they are spraying so that we can time our netting andtagging effort to coincide. Ideally we would like to have day or two’s tracking data ona bird shortly before and shortly after the orchard has been sprayed. This may meanbreaking the established sequence of farm visits. Thus if you were due to pay yoursecond visit to farm pair 4 but had good information that farm in pair 1 was about tospray Dursban you might be justified in returning again to pair 1 before pair 4.
Bird species priorityWe hope to track at least as many birds as last year (i.e. more than 60). We have morestaff than last year but we are including blue tits as well as blackbirds, robins andchaffinches in the species list. It would be nice to get data on at least 20 blue tits, 20chaffinches, 10 blackbirds and 10 robins. Chaffinches were hard to catch last year andwhen caught were more difficult to track. I suspect that blue tits may also be tricky tofollow. The best chance of getting decent data on these species is likely to be whenthey are nesting and thus loyal to a restricted territory. I suggest we try our best to getblue tits and chaffinches early in the season. We can probably afford to leaveblackbirds and robins till later.
Ideally, for any single orchard therefore we don't want more than 3 of any one species.So, if you' have already tracked 3 blue tits but no chaffinches in one orchard and youcatch another blue tit, let it go and wait for a chaffinch. It would also help if the 3individuals of a given species were tracked at evenly spaced intervals through theseason. So, if you have already tracked 1 blue tit and no chaffinches, and you nowcatch another blue tit and a chaffinch, tag the chaffinch. In practice, if following theserules means that you don't tag anything, then break the rules.
31
Mist netting.Results from the pilot study in Blackmoor suggested that it was easier to catch birdson the margins of the orchard, by hedges, than among the orchard trees andwindbreaks. However, birds caught at the orchard edge spent less time in the orchard,and were more likely to disappear out of range. Birds caught in the orchard proper, atleast demonstrate that they make some use of orchard habitat. These birds are themore interesting for our purposes. We know that they use the orchard some of thetime; radio-tracking will tell us how much.
If possible, we should put radiotags on centrally caught birds. This may not actually bepossible and it is likely that we may have to resort to netting along the margins.Therefore I suggest that we spend the first morning of the week with more nets amongfruit trees (or internal windbreaks). If we fail to catch birds among the fruit trees thenon subsequent mornings we can increase the nets along the margins or wherever looksmost populated.
At each netting session be sure to record netting site (periphery v central).record length of nets erected and duration of sessionRecord what you caught and in which net you caught it.
Tape lures, Peanut feeders and other enticementsIn the first instance we should try to do without any artificial enticements. The pointof the study is to find out what use local birds make of orchards. If we lure birds infrom elsewhere then the chances are that they will return to elsewhere as soon as weturn it off. Nevertheless, if it proves impossible to catch birds by fair means then wemay have to resort to foul. If we use lures then ideally we should use themconsistently in both members of the farm pair.
If you use a lure or feeder be sure to record, in the netting effort book, where you usedit and for how long
Tracking
1) Continuous monitoring. Decide how long you are going to follow a given bird--1 hr, 30 min. Stick to it. If you decide to follow a bird for an hour, then make sureyou do exactly that. i.e. don't quit early just because the bird is staying put and notdoing much, or because the bird has flown off somewhere inaccessible or becauseyou've lost the signal and are finding it difficult to re-establish contact.
If you lose contact with a bird (or fail make contact in the first place), take a walk andmake every effort to find it within the study area and within the time you previouslyallotted for tracking the bird. If time permits, you may broaden your search outside thestudy area. Information about the absence of a bird from the study site is importantand must be recorded i.e. you need to say where you looked and how much time youspent looking.

32
Spot checks.If you decide not to monitor the behaviour of a bird but simply toestablish its current whereabouts, then do exactly that. i.e. Don't extend theobservation simply because the bird is in a convenient place.
2) Keep a summary log of how many minutes observation a bird has received andhow those observations have been distributed through the day. An effort should bemade to get a good distribution of observations throughout the day. A special effortmay be needed to observations early in the morning and at dusk when birds are mostlikely to be feeding.
timeDate 5-7 7-9 9-11 11-13 13-15 15-17 17-19 19-21 tot1-06 0 30 45 120 60 30 4 hr 453-06 60 15 90 30 60 4 hr 154-06 90 90 50 3 hr 50total 1 hr 0.45 2 hr 15 2.25 1 hr 30 2 hr 30 1 hr 50 1 hr 12 hr 50
3) The battery life for small transmitters is not guaranteed to last more than 7days. Therefore, before tagging small birds ( 20g ) we should ensure that the staff timeis available to monitor them. e.g. it is not a good idea to tag a dunnock on a Friday ifno-one is happy to spend time during the weekend following it. It is probably not agood idea to have more than 2 small birds actively tagged at the same time.
4) Recording observations.• Begin each new bird in a new field note-book. Identify ring no, species, age,sex, wt., moult (i.e. whether tail feathers are this year's or last year's), netting site,colour rings and frequency of radio-tag
• Begin each session with time, date, weather conditions. Classify weather aseither clear skies, broken cloud, overcast, drizzle, rain, mist. Classify wind speedaccording to Beaufort scale (0-9). Use thermometer for Temperature. If weatherconditions change significantly during the monitoring session, then record them again.In any case note them again at the end of a session.
• Attempt to follow the focal bird continuously. When there is any change ofposition or behaviour note the time and describe it. If the bird appears to stay in thesame place doing the same thing, make a note every 5 min indicating no-change.
• Note geographical location (refer to features and nomenclature on master mape.g. Orchard A, Windbreak 6, Temple bungalow, Water pump etc.). If the bird hasmoved into unfamiliar territory, draw a map and identify landmarks so that they maybe added to the master map later.

33
Draw maps. When drawing maps always indicate which way is North. Whendescribing location try not to be ambiguous i.e. don't use words like "near" when youmean "about 20m W of". Say "N (S, E or W) of" rather than "Opposite".
• Physical location:. I suggest the following categories: Orchard floor, orchardfruit trees, orchard floor/trees (i.e. where precise location in orchard is unknown),orchard verge (i.e. grass between orchard and hedge), orchard hedge (i.e.hedge/windbreakwithin the orchard having orchard both sides of the hedge), orchardscrub (scrub surrounded by orchard), perimeter hedge (orchard on one side only),perimeter trees, wood, garden, scrub.
• Attempt to categorise the bird as active or not active. (This may be easier to dofor birds carrying activity sensors) e.g. bird may keep to single windbreak but may beactively moving within it.
• Highlight all visual sightings of focal bird. (e.g. use highlighter pen)For any sighting of the bird which is more than momentary attempt to time it
and describe it. e.g. 14:20:33 - 14:24:40 blackbird seen foraging on orchard alonggrass strip. Returns to Windbreak 6 carrying worm.". For purposes of data entry intothe computer categorise behaviour as flying, foraging, feeding young, gathering nestmaterial, nestbuilding, incubating, singing/calling, alarming, preening, loafing,aggression, courtship, roosting.
• Estimate elevation. e.g. 0m if on ground. If unsure of height in hedge or treecanopy then guess min and max e.g. 2-4m, 4-8m
If bird is seen only briefly flying off. Note the direction it is headed.
5) Notation. (See example.)• Use a vertical line in the margin to indicate that monitoring has beencontinuous
• All time spent must be accounted for. If contact is lost, break the line, note thetime and indicate the break with an "X". Attempt to relocate the bird. When contact isre-established, note time and resume vertical line.
• When you quit a monitoring session, note the time and write "Quit"

34
Example
June 26th 9am1st yr female blackbird, 98glast year's tail featherscaught at netting site: between water pump and windbreak 1 in Orchard IRing No: XP62970 Colour ring: Red, left leg Tag frequency: 173.244
9:12 Start: Dry, overcast, 17C, Wind 2
9:15: In scrub by water pump. Not obviously active. Ht 0-1
9:20 "" ""
9:25 "" ""
9:30 "" ""
9:34 Moves NE into orchard I
9:40:01 seen foraging on orchard floor (grass corridor between rows) 50 m NE of water pump9:45:06
9:49:17 "" ""
9:50:06
9:51 Back in scrub by water pump. Not Active. Ht 0-1m
9:55 ""
9:58 Seen leaving scrub heading NE to Temple WoodX lose contact
10:07 Found on edge of temple wood 100m N of windbreak 7. Active. Ht 5-10
10:09 Moves S 20m along wood edge. Active. Ht 5-10
10:12 Moves SW in direction of Scrub. Signal faint.
10:: 15 In centre of Windbreak 7 opposite water pump. Ht 2-3
10:16 Seen flying into scrub by water pump with nesting material Ht 0-1
10:17. Signal fluctuating. Active?
10:20 "" ""
10:25 "" "" Not active?
10: 30 "" ""
10: 32 X signal faint
10:40 Relocate in S end of Windbreak 1 by Orchard A. Ht 0-410.42 Quit
35
APPENDIX 2
ATTACHING RADIO-TRANSMITTERSTO THE TAIL FEATHERS OF SMALL BIRDS.
INTRODUCTION
A safe and durable method of attaching Biotrack type SS1, SS2 and TW4 radio-transmitters to small birds (<150g) can be achieved by gluing and tying the transmitterto the birds central tail feather shafts. This SOP describes how to apply this method.
SAFETY
No special safety gear is required. Care should be taken when applying fast actionsuper-glue, contact to the skin should be avoided.
To ensure the attachment procedure is undertaken correctly two people are required.One person should possess a valid bird ringing license with the appropriateendorsements.
EQUIPMENT
Radio-transmitter - Type TW4, SS1, SS2 (manufactured by Biotrack).Receiver and Antennae.Plasti-dip / Araldite.* Use whatever potting the transmitter is embedded in. If plasti-dip is applied toaraldite or visa-versa no adhesion will occur.Fast Adhering Super Glue.Super Glue Activator.Waxed Dental Floss.Shearing Cotton.Small Pair of Scissors.Several Bird Bags.
WELFARE
If the captured bird appears unduly stressed at any time during the attachment processthen release the bird as soon as possible. When most small passerines experiencestress they often show the following behavioural traits with increasing stress :
1). Closed eyes and ruffled body feathers.2). Excessive panting.

36
3). Wing shivering.4). Choking - often followed by death.
METHOD
Two people are required, one person to hold the bird (the holder) the other person toattach the transmitter (the attacher). To avoid undue stress to the bird the radio-transmitter should be prepared and attached as soon as possible after the birds captureand processing. If a second person is unavailable at the time of capture then the birdshould be BTO-processed and kept in a bird bag until help is obtained.
1). Transmitter preparation.
Prior to attaching the transmitter first check that it is working. Hold together the wiredbattery - transmitter connectors on the transmitter and tune in the receiver to the pre-specified frequency. Fine tune the receiver until the best transmission signal is heardand note this frequency. Solder the connectors togetherand recheck the transmission.(i.e. check you haven't cooked it with the soldering iron) Cover the exposedconnection with suitable potting, either plasti-dip or araldite, see note above *. Thetransmitter is now ready for attachment.
Transmitter preparation can take several minutes. During this preparation if thecaptured bird is not being processed it should be kept in a bird bag to reduce handlingand stress .
1). Holding the bird. (carried out by the holder)
The bird is best held in two hands with its head pointing towards the holders body.Cup both hands around the bird using the fingers to grip the bird's underbelly and legsand the thumbs to lay over the birds rump and upper-tail coverts. The birds tailfeathers should point away from the holders body and be free from the holders hands.Using the thumbs part the upper-tail coverts and expose the preen gland and the baseof the central tail feather shafts as illustrated in Fig. 1.
2). Gluing the transmitter to the tail. (carried out by the attacher)
Select one of the two central tail feathers. At approximately 5 mm up from the base ofthe tail apply some superglue activator onto the selected feather shaft. During thisprocess the holder must, using a thumb to protect it, cover the exposed preen gland.Add a small drop of superglue to the base of the transmitter and apply the transmitterto the feather shaft about 5 mm up from the base of the tail (Fig. 2). The transmitteraerial should point back along the tail. The transmitter should adhere immediately tothe feather shaft. It is important to use activator as this ensures unlike surfaces adherewhen they are glued together.

37
NOTE : The SS2 transmitter from Biotrack has a groove set in the potting on theunderside of the transmitter. To obtain better adherence when applying the transmitterto the tail feather ensure this groove runs along the feather shaft .
3). Tying the glued transmitter. (carried out by the attacher)
To further secure the glued transmitter to the tail feather it is advisable to also tie it tothe tail feathers. Using waxed dental floss run a cut length along the underside of thetwo central tail feathers, (Fig. 3), until the length of floss lies under the transmitter.Now tie the floss around the transmitter so that the floss is knotted firmly and notslack. The holder can help this process by using a thumb to hold the half tied flossdown on the transmitter and prevent it slackening before the knot is completed. Becareful not to pull too firmly on the floss whilst tying it as this may damage the feathershafts. Add a drop of superglue to the knot and snip off the untied ends with a smallpair of scissors.
To complete the attachment it is now necessary to stabilise the secured transmitter.The transmitter is stabilised by using elasticated shearing cotton to tie the transmitterto the tail feathers. In a similar method to that used with the dental floss run a cutlength of the cotton along the underside of the three most central tail feathers (Fig. 3).For sparrow sized birds and smaller it is advisable to select the four most central tailfeathers. When tying the securing knot pull on the loose ends of the elasticatedshearing cotton so that when the knot is completed the transmitter and tail feathers aretied under tension. Add a drop of superglue to the knot and snip off the loose ends ofshearing cotton. The attached transmitter should now resemble fig. 4.
Finally, the holder should, without changing the way the bird is held, rotate the birdupwards so that the underside of the tail is visible to the transmitter attacher. Now partthe tail feathers to reveal where the transmitter is tied to the tail feather shafts, see fig.5. Avoiding the birds vent apply some activator followed by a drop of superglue to thedental floss and shearing cotton under - tying the feather shafts. The bird is now readyfor release.
4). Releasing the bird. (carried out by the holder)
Release the bird at the site of capture. Normally the bird will fly off unhindered,however on occasions due to stress or disorientation the bird may be reluctant to fly. Ifthis is the case then place the bird in the nearest suitable cover, here it will, undernormal circumstances, quickly recover.

38

39