Embed Size (px)
Citation preview
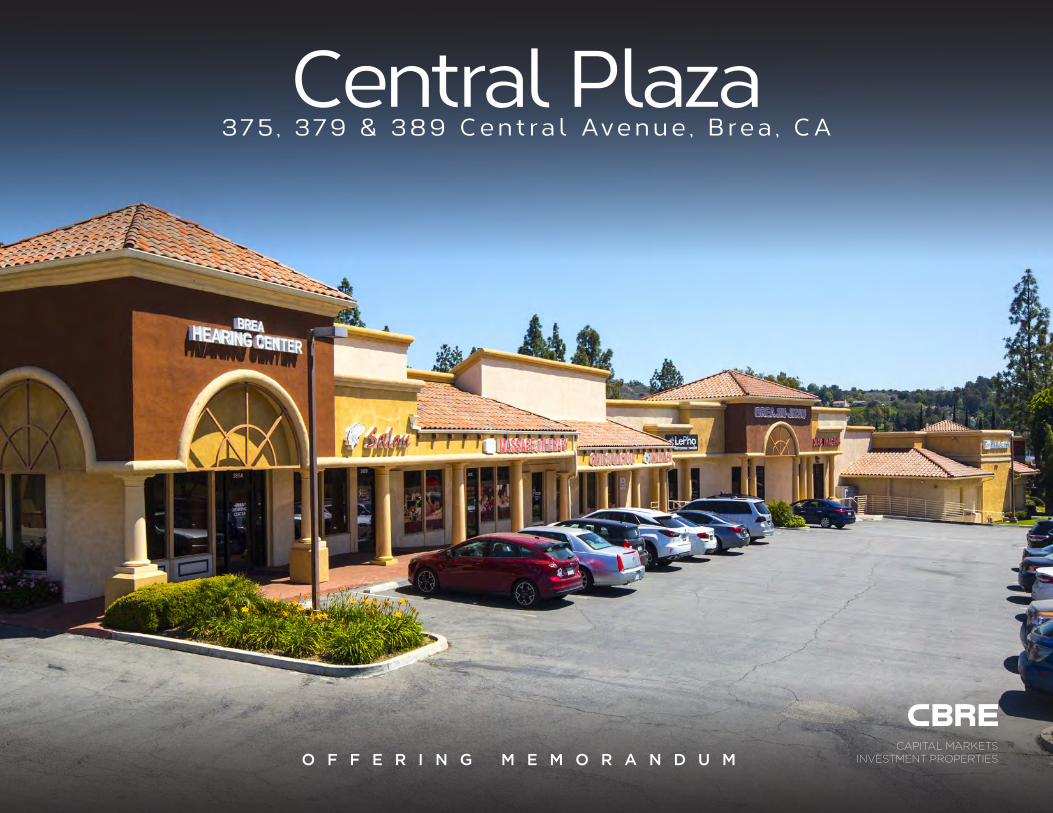
O F F E R I N G M E M O R A N D U MCAPITAL MARKETS
INVESTMENT PROPERTIES
Central Plaza37 5 , 379 & 3 8 9 C e n t ra l Ave n u e , B re a , C A
Affiliated Business Disclosure
CBRE, Inc. operates within a global family
of companies with many subsidiaries and
related entities (each an “Affiliate”) engaging
in a broad range of commercial real estate
businesses including, but not limited to,
brokerage services, property and facilities
management, valuation, investment fund
management and development. At times
different Affiliates, including CBRE Global
Investors, Inc. or Trammell Crow Company, may
have or represent clients who have competing
interests in the same transaction. For example,
Affiliates or their clients may have or express
an interest in the property described in this
Memorandum (the “Property”), and may be
the successful bidder for the Property. Your
receipt of this Memorandum constitutes your
acknowledgement of that possibility and your
agreement that neither CBRE, Inc. nor any
Affiliate has an obligation to disclose to you
such Affiliates’ interest or involvement in the
sale or purchase of the Property. In all instances,
however, CBRE, Inc. and its Affiliates will act in
the best interest of their respective client(s),
at arms’ length, not in concert, or in a manner
detrimental to any third party. CBRE, Inc.
and its Affiliates will conduct their respective
businesses in a manner consistent with the law
and all fiduciary duties owed to their respective
client(s).
Confidentiality Agreement
Your receipt of this Memorandum constitutes
your acknowledgement that (i) it is a
confidential Memorandum solely for your
limited use and benefit in determining whether
you desire to express further interest in the
acquisition of the Property, (ii) you will hold
it in the strictest confidence, (iii) you will not
disclose it or its contents to any third party
without the prior written authorization of the
owner of the Property (“Owner”) or CBRE,
Inc., and (iv) you will not use any part of this
Memorandum in any manner detrimental to
the Owner or CBRE, Inc.
If after reviewing this Memorandum, you have
no further interest in purchasing the Property,
kindly return it to CBRE, Inc.
Disclaimer
This Memorandum contains select information
pertaining to the Property and the Owner, and
does not purport to be all-inclusive or contain
all or part of the information which prospective
investors may require to evaluate a purchase of
the Property. The information contained in this
Memorandum has been obtained from sources
believed to be reliable, but has not been verified
for accuracy, completeness, or fitness for any
particular purpose. All information is presented
“as is” without representation or warranty of
any kind. Such information includes estimates
based on forward-looking assumptions relating
to the general economy, market conditions,
competition and other factors which are subject
to uncertainty and may not represent the
current or future performance of the Property.
All references to acreages, square footages, and
other measurements are approximations. This
Memorandum describes certain documents,
including leases and other materials, in
summary form. These summaries may not be
complete nor accurate descriptions of the full
agreements referenced. Additional information
and an opportunity to inspect the Property
may be made available to qualified prospective
purchasers. You are advised to independently
verify the accuracy and completeness of
all summaries and information contained
herein, to consult with independent legal and
financial advisors, and carefully investigate the
economics of this transaction and Property’s
suitability for your needs. ANY RELIANCE ON
THE CONTENT OF THIS MEMORANDUM IS
SOLELY AT YOUR OWN RISK.
The Owner expressly reserves the right, at its
sole discretion, to reject any or all expressions
of interest or offers to purchase the Property,
and/or to terminate discussions at any time
with or without notice to you. All offers,
counteroffers, and negotiations shall be non-
binding and neither CBRE, Inc. nor the Owner
shall have any legal commitment or obligation
except as set forth in a fully executed, definitive
purchase and sale agreement delivered by the
Owner.
© 2018 CBRE, Inc. All rights reserved.
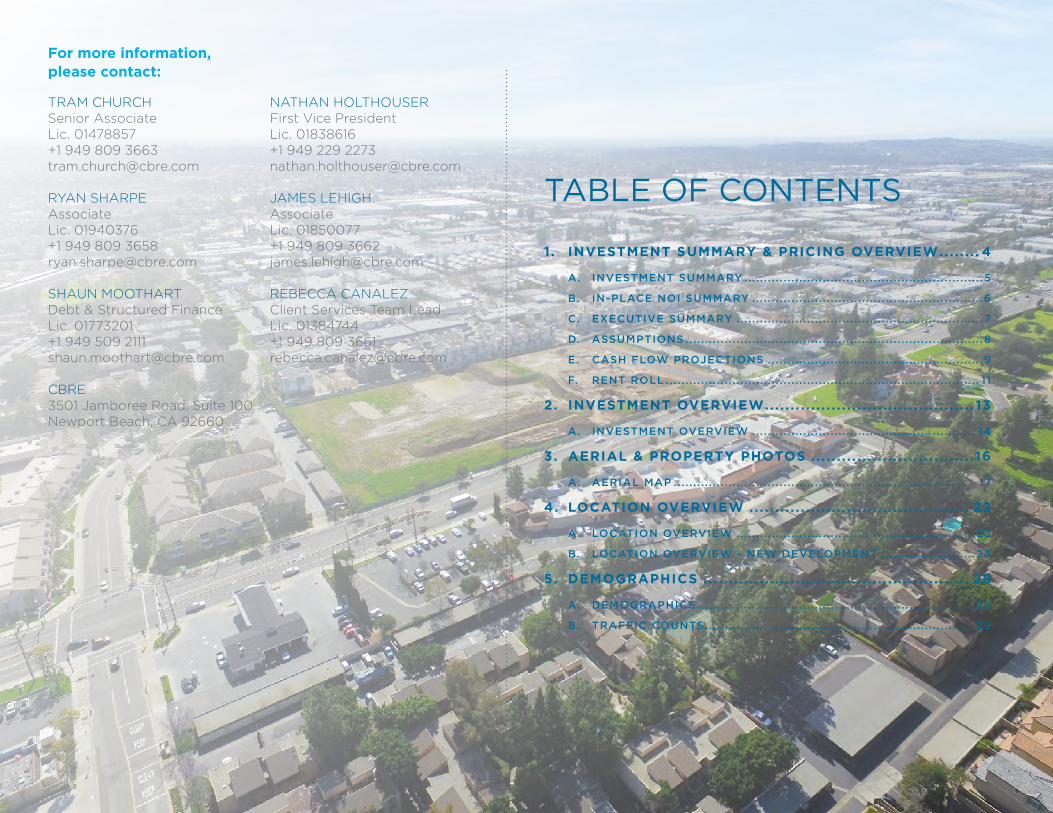
TABLE OF CONTENTS
1. INVESTMENT SUMMARY & PRICING OVERVIEW .. . . . . . . 4
A. INVESTMENT SUMMARY . . . . . . . . . . . . . . . . . . . . . . . . . . . . . . . . . . . . . . . . . . . . . . . . . . . . . . . . . . . . . 5
b. IN-PLACE NOI SUMMARY . . . . . . . . . . . . . . . . . . . . . . . . . . . . . . . . . . . . . . . . . . . . . . . . . . . . . . . . . . .6
C. EXECUTIVE SUMMARY . . . . . . . . . . . . . . . . . . . . . . . . . . . . . . . . . . . . . . . . . . . . . . . . . . . . . . . . . . . . . . . 7
D. ASSUMPTIONS . . . . . . . . . . . . . . . . . . . . . . . . . . . . . . . . . . . . . . . . . . . . . . . . . . . . . . . . . . . . . . . . . . . . . . . . . . . . 8
E. CASH FLOW PROJECTIONS . . . . . . . . . . . . . . . . . . . . . . . . . . . . . . . . . . . . . . . . . . . . . . . . . . . . . . .9
F. RENT ROLL . . . . . . . . . . . . . . . . . . . . . . . . . . . . . . . . . . . . . . . . . . . . . . . . . . . . . . . . . . . . . . . . . . . . . . . . . . . . . . . . 11
2. INVESTMENT OVERVIEW... . . . . . . . . . . . . . . . . . . . . . . . . . . . . . . . . . . . . . . 13
A. INVESTMENT OVERVIEW .. . . . . . . . . . . . . . . . . . . . . . . . . . . . . . . . . . . . . . . . . . . . . . . . . . . . . . . . 14
3. AERIAL & PROPERTY PHOTOS .. . . . . . . . . . . . . . . . . . . . . . . . . . . . . . .16
A. AERIAL MAP . . . . . . . . . . . . . . . . . . . . . . . . . . . . . . . . . . . . . . . . . . . . . . . . . . . . . . . . . . . . . . . . . . . . . . . . . . . . . 17
4. LOCATION OVERVIEW .. . . . . . . . . . . . . . . . . . . . . . . . . . . . . . . . . . . . . . . . . . 22
A. LOCATION OVERVIEW .. . . . . . . . . . . . . . . . . . . . . . . . . . . . . . . . . . . . . . . . . . . . . . . . . . . . . . . . . . . . 23
b. LOCATION OVERVIEW - NEW DEVELOPMENT . . . . . . . . . . . . . . . . . . . . . . . . 24
5. DEMOGRAPHICS . . . . . . . . . . . . . . . . . . . . . . . . . . . . . . . . . . . . . . . . . . . . . . . . . . . . 28
A. DEMOGRAPHICS . . . . . . . . . . . . . . . . . . . . . . . . . . . . . . . . . . . . . . . . . . . . . . . . . . . . . . . . . . . . . . . . . . . . . . . 29
b. TRAFFIC COUNTS . . . . . . . . . . . . . . . . . . . . . . . . . . . . . . . . . . . . . . . . . . . . . . . . . . . . . . . . . . . . . . . . . . . . . 29
TRAM CHURCHSenior AssociateLic. 01478857+1 949 809 [email protected]
RYAN SHARPEAssociateLic. 01940376+1 949 809 [email protected]
SHAUN MOOTHARTDebt & Structured FinanceLic. 01773201+1 949 509 [email protected]
CBRE3501 Jamboree Road, Suite 100Newport Beach, CA 92660
NATHAN HOLTHOUSERFirst Vice PresidentLic. 01838616+1 949 229 [email protected]
JAMES LEHIGHAssociateLic. 01850077+1 949 809 [email protected]
REBECCA CANALEZClient Services Team LeadLic. 01384744+1 949 809 [email protected]
For more information, please contact:
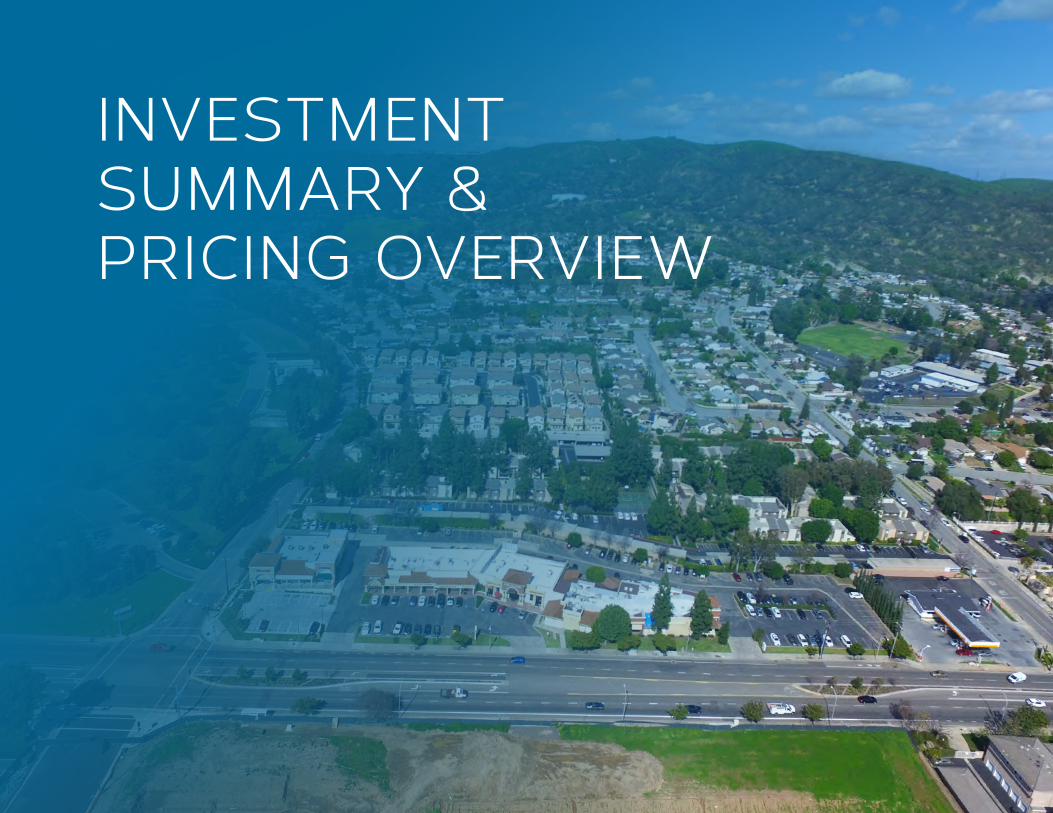
INVESTMENT SUMMARY & PRICING OVERVIEW
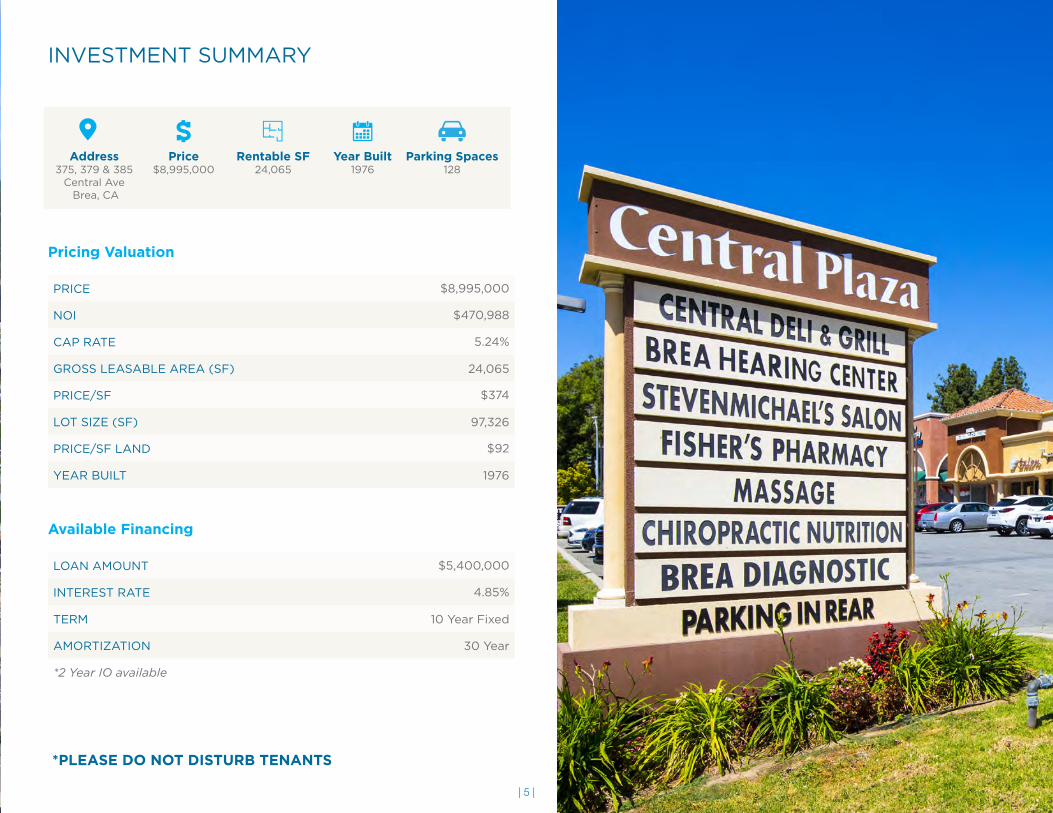
INVESTMENT SUMMARY
PRICE $8,995,000
NOI $470,988
CAP RATE 5.24%
GROSS LEASABLE AREA (SF) 24,065
PRICE/SF $374
LOT SIZE (SF) 97,326
PRICE/SF LAND $92
YEAR BUILT 1976
LOAN AMOUNT $5,400,000
INTEREST RATE 4.85%
TERM 10 Year Fixed
AMORTIZATION 30 Year
*2 Year IO available
Pricing Valuation
Available Financing
Address375, 379 & 385
Central Ave Brea, CA
Price$8,995,000
Rentable SF24,065
Year Built1976
Parking Spaces128
*PLEASE DO NOT DISTURB TENANTS
| 5 |

IN-PLACE NOI SUMMARY
EXPENSES
Operating Expense Source 2016 Actuals [3]
Management Fee (% of EGR) 3.00%
Real Estate Taxes Reassessed Yes [4]
Millage Rate 1.10%
Special Assessments $9,041
Notes:
[3] Operating Expenses are based on the 2016 Actuals grown by 3% annually for 2018, less any owner-specific and one-time expenses.
[4] Real Estate Taxes have been reassessed at the estimated purchase price based on a millage rate of 1.100330% plus special assessments of $9,041.
NET OPERATING INCOME
In-Place NOI Jun-17, Annualized
$ PSF
Size of Improvements 24,065 SF
REVENUES
Scheduled Base Rent
Gross Potential Rent $541,860 $22.52
Absorption & Turnover Vacancy (42,000) (1.75)
Base Rent Abatements 0 0
Total Scheduled Base Rent 499,860 20.77
Expense Reimbursements 161,376 6.71
TOTAL GROSS REVENUE 661,236 [1] 27.48
General Vacancy Loss 0 0
EFFECTIVE GROSS REVENUE 661,236 27.48
OPERATING EXPENSES
CAM (59,268) (2.46)
Management Fee (19,836) (0.82)
Insurance (3,132) (0.13)
Real Estate Taxes (108,012) (4.49)
TOTAL OPERATING EXPENSES (190,248) [2] (7.91)
NET OPERATING INCOME $470,988 $19.57
Capitalization Rate 5.24%
PURCHASE PRICE AS OF JUNE 1, 2017 $8,995,000 $373.78
In-Place Occupancy (At Start of Analysis with No Vacant Lease-Up) 92.73%
Average Occupancy (Includes Vacant Lease-Up and Rollover) –
Notes:
[1] In-Place Net Operating Income is calculated using contractual rents and expense reimbursements as of June 2018, Annualized (with no General Vacancy Loss).. In-Place NOI does not include vacant lease-up revenue, downtime due to near-term expirations, or future rent increases for existing tenants.
[2] Real Estate Taxes are reassessed based on the sales price.
REIMBURSABLE EXPENSES
Month 1 Ju-18
In-Place NOI Jun-18, Annualized
Reimbursable Expenses
CAM
Air Conditiioning 477 5,724
Landscaping 785 9,420
Landscaping Supplies 136 1,632
Licenses & Permits 41 492
Parking Lot Sweeping 64 768
Pest Control 176 2,112
Repairs Maintenance - Bldg M $1,114 13,368
Salaries - Other 358 4,296
Utilities - Electric 175 2,100
Utilities - Trash 751 9,012
Utilities - Water & Sewer 862 10,344
Management Fee 1,653 19,836
Insurance 261 3,132
Real Estate Taxes 9,001 108,012
Total Reimbursable Expenses 15,854 190,248
| 6 |

EXECUTIVE SUMMARY
PROPERTY DESCRIPTION
Property Type Retail Size of Improvements 24,065 SF
Property Address 375, 379 & 385 W. Central Ave Currently Vacant as of 4/1/18 1,750 SF
Brea, CA Current Occupancy as of 4/1/18 92.73%
Projected Occupancy as of 6/1/18 92.73%
ACQUISITION AND RESIDUAL SUMMARY
Purchase Price as of June 1, 2017 $374 PSF $8,995,000
Year 1 Year 2 Year 3
Capitalization Rate 4.82% 5.38% 5.74%
Cash Return 3.71% 5.02% 5.48%
Leveraged Cash Return 1.96% 5.20% 4.14%
3-Year 5-Year 7-Year
Capitalization Rate 5.31% 5.67% 6.02%
Cash Return 4.74% 5.06% 5.38%
Leveraged Cash Return 3.77% 3.97% 4.51%
Net Residual Value as of May 31, 2027 $11,070,000
Net Residual Per Square Foot $460
Residual Capitalization Rate 6.00%
Residual Cost of Sale 3.00%
ALL CASH IRR 7.33%
LEVERAGE SUMMARY [1]
Market Loan
Initial Loan Funding (as of Jun-17) $5,397,000
Loan-To-Value Ratio (Initial Funding) 60.00%
Funding Date Jun-18
Maturity Date May-28
Remaining Loan Term During Analysis 10.0 Years
Amortization Period 30 Years
Initial Interest Only Period (If Any) 24 Months
Interest Rate 4.85%
Loan Constant 6.33%
Origination Fee on Initial Loan Funding 1.00%
Initial Debt Yield 8.04%
Debt Service Coverage Ratio (NOI) 1.27x
Debt Service Coverage Ratio (CF) 0.98x
Purchase Price as of June 1, 2017 $8,995,000
Total Initial Loan Principal (5,397,000)
Total Initial Loan Fees 53,970
Holdbacks and Escrows 0
Initial Equity $3,651,970
LEVERAGED IRR 9.94%
Notes: [1] Leveraged analysis is based on financing that a particular investor may or may not be able to obtain.
| 7 |

ASSUMPTIONS
GLOBAL
Analysis Period
Commencement Date June 1, 2018
End Date May 31, 2028
Term 10 Years
Area Measures
Building Square Feet (NRSF) 24,065 SF
Growth Rates
Consumer Price Index (CPI) 3.00%
Other Income Growth Rate 3.00%
Operating Expenses 3.00%
Real Estate Taxes 2.00%
Market Rent Growth
CY 2019 - 3.00%
CY 2020 - 3.00%
CY 2021 - 3.00%
CY 2022 - 3.00%
CY 2023 - 3.00%
CY 2024 - 3.00%
CY 2025 - 3.00%
CY 2026 - 3.00%
CY 2027 - 3.00%
CY 2028+ - 3.00%
General Vacancy Loss 5.00% [1]
Capital Reserves (CY 2017 Value) $0.10 PSF [2]
VACANT SPACE LEASING
Occupancy and Absorption
Projected Vacant at 6/1/18 1,750 SF
Currently Vacant as of 4/1/18 1,750 SF
Percentage Vacant at 4/1/18 7.27%
Absorption Period 6 Month(s)
Absorption Period Start Date June 1, 2018
First Absorption Occurs On December 1, 2018
Last Absorption Occurs On December 1, 2018
Financial Terms
2018 Monthly Market Rent $2.00 PSF
Rent Adjustment 3.00% Annually
Lease Term 5 Years
Expense Reimbursement Type NNN
Rent Abatements 3 Month(s)
Tenant Improvements ($/NRSF) $15.00 PSF
Commissions 6.00%
EXPENSES
Operating Expense Source 2016 Actuals [3]
Management Fee (% of EGR) 3.00%
Real Estate Taxes Reassessed Yes [4]
Millage Rate 1.100330%
Special Assessments $9,041
SECOND GENERATION LEASING
Shops Restaurant
Retention Ratio 75% 75%
Financial Terms
2018 Monthly Market Rent $2.00 PSF $2.00 PSF
Rent Adjustment 3.00% Annually 3.00% Annually
Lease Term 5 Years 5 Years
Expense Reimbursement Type NNN NNN [5]
Tenanting Costs
Rent Abatements [6]
New 3 Month(s) 3 Month(s)
Renewal 0 Month(s) 0 Month(s)
Weighted Average 0.75 Month(s) 0.75 Month(s)
Tenant Improvements ($/NRSF)
New $10.00 PSF $15.00 PSF
Renewal $5.00 PSF $3.00 PSF
Weighted Average $6.25 PSF $6.00 PSF
Leasing Commissions
New 6.00% 6.00%
Renewal 3.00% 3.00%
Weighted Average 3.75% 3.75%
Downtime
New 6 Month(s) 6 Month(s)
Weighted Average 2 Month(s) 2 Month(s)
Notes:
All market rates are stated on calendar-year basis.
[1] General Vacancy Loss factor includes losses attributable to projected lease-up, rollover downtime, and fixturing downtime. All tenants are subject to this loss factor.
[2] Capital Reserves inflate at 3% annually throughout the duration of the analysis.
[3] Operating Expenses are based on the 2016 Actuals grown by 3% annually for 2018, less any owner-specific and one-time expenses.
[4] Real Estate Taxes have been reassessed at the estimated purchase price based on a millage rate of 1.100330% plus special assessments of $9,041.
[5] Future tenants are assumed to reimburse their pro-rata share of all operating expenses, including management fee.
[6] Free rent includes rent, plus reimbursements.
| 8 |

CASH FLOW PROJECTIONS
Fiscal Year Ending - May 31 2018 2019 2020 2021 2022 2023 2024 2025 2026 2027 2028
Physical Occupancy 91.91% 98.97% 98.15% 99.37% 94.99% 95.14% 98.17% 98.79% 98.73% 92.51% 95.14%
Overall Economic Occupancy [1] 89.92% 93.87% 94.64% 94.65% 93.56% 93.64% 94.51% 94.66% 94.66% 93.38% 92.90%
Weighted Average Market Rent $2.03 $2.09 $2.15 $2.21 $2.28 $2.35 $2.42 $2.49 $2.57 $2.64 $2.72
Weighted Average In Place Rent [2] $1.77 $1.86 $1.96 $2.06 $2.13 $2.28 $2.39 $2.47 $2.55 $2.59 $2.60
Total Operating Expenses PSF Per Year $7.93 $8.16 $8.37 $8.59 $8.78 $9.02 $9.26 $9.48 $9.71 $9.89 $10.28
[3]
REVENUESFY 2018 $/SF/MO
Scheduled Base Rent
Gross Potential Rent $1.87 $540,219 $547,760 $569,598 $598,724 $629,570 $673,507 $695,903 $717,875 $740,687 $756,853 $775,809
Absorption & Turnover Vacancy (0.16) (47,041) (6,147) (11,644) (3,995) (33,526) (33,270) (12,647) (8,867) (9,263) (57,602) (38,864)
Base Rent Abatements (0.08) (22,923) (8,627) (2,868) (2,996) (12,572) (12,571) (4,742) (3,325) (3,473) (7,026) (22,173)
Total Scheduled Base Rent 1.63 470,255 532,986 555,086 591,733 583,472 627,666 678,514 705,683 727,951 692,225 714,772
Expense Reimbursements 0.53 154,174 177,249 188,423 204,568 197,374 201,935 216,789 224,416 229,308 219,711 227,659
TOTAL GROSS REVENUE 2.16 624,429 710,235 743,509 796,301 780,846 829,601 895,303 930,099 957,259 911,936 942,431
General Vacancy Loss 0.00 0 (29,672) (26,114) (36,020) (7,193) (9,874) (32,751) (38,081) (39,063) 0 (10,201)
EFFECTIVE GROSS REVENUE 2.16 624,429 680,563 717,395 760,281 773,653 819,727 862,552 892,018 918,196 911,936 932,230
OPERATING EXPENSES
CAM (0.21) (60,016) (61,817) (63,673) (65,580) (67,549) (69,575) (71,662) (73,811) (76,026) (78,306) (80,658)
Management Fee (0.06) (18,733) (20,417) (21,522) (22,808) (23,210) (24,592) (25,877) (26,761) (27,546) (27,358) (27,967)
Insurance (0.01) (3,172) (3,267) (3,365) (3,466) (3,570) (3,677) (3,788) (3,901) (4,018) (4,139) (4,263)
Real Estate Taxes (0.38) (108,840) (110,836) (112,872) (114,949) (117,067) (119,228) (121,431) (123,679) (125,972) (128,311) (134,605)
TOTAL OPERATING EXPENSES (0.66) (190,761) (196,337) (201,432) (206,803) (211,396) (217,072) (222,758) (228,152) (233,562) (238,114) (247,493)
NET OPERATING INCOME 1.50 433,668 484,226 515,963 553,478 562,257 602,655 639,794 663,866 684,634 673,822 684,737
CAPITAL COSTS
Tenant Improvements (0.21) (59,811) (17,047) (11,474) (12,484) (52,385) (52,382) (19,762) (13,301) (14,473) (29,276) (92,384)
Leasing Commissions (0.13) (38,105) (12,879) (9,030) (9,432) (39,577) (39,575) (14,930) (10,468) (10,934) (22,118) (69,798)
Capital Reserves (0.01) (2,437) (2,510) (2,585) (2,663) (2,742) (2,825) (2,909) (2,997) (3,087) (3,179) (3,275)
TOTAL CAPITAL COSTS (0.35) (100,353) (32,436) (23,089) (24,579) (94,704) (94,782) (37,601) (26,766) (28,494) (54,573) (165,457)
OPERATING CASH FLOW $1.15 $333,315 $451,790 $492,874 $528,899 $467,553 $507,873 $602,193 $637,100 $656,140 $619,249 $519,280
| 9 |

Fiscal Year Ending - May 31 2018 2019 2020 2021 2022 2023 2024 2025 2026 2027 2028
ACQUISITION & RESIDUAL SALE
Acquisition Cost ($8,995,000) 0 0 0 0 0 0 0 0 0 0 All Cash
Net Residual Value [4] 0 0 0 0 0 0 0 0 0 0 11,069,915 IRR
CASH FLOW BEFORE DEBT ($8,995,000) $333,315 $451,790 $492,874 $528,899 $467,553 $507,873 $602,193 $637,100 $656,140 $11,689,164 7.33%
MARKET LOAN [5]
Loan Funding / Payoff 5,397,000 0 0 0 0 0 0 0 0 0 (4,616,997)
Loan Fees (53,970) 0 0 0 0 0 0 0 0 0 0 Leveraged
Annual Debt Service 0 (261,755) (261,755) (341,754) (341,754) (341,754) (341,754) (341,754) (341,754) (341,754) (341,754) IRR
CASH FLOW AFTER DEBT ($3,651,970) $71,561 $190,036 $151,120 $187,145 $125,799 $166,119 $260,439 $295,346 $314,386 $6,730,412 9.94%
NOI Return 4.82% 5.38% 5.74% 6.15% 6.25% 6.70% 7.11% 7.38% 7.61% 7.49%
UNLEVERAGED Cash Return 3.71% 5.02% 5.48% 5.88% 5.20% 5.65% 6.69% 7.08% 7.29% 6.88%
LEVERAGED Cash Return 1.96% 5.20% 4.14% 5.12% 3.44% 4.55% 7.13% 8.09% 8.61% 7.60%
Debt Service Coverage Ratio (NOI) 1.66x 1.85x 1.51x 1.62x 1.65x 1.76x 1.87x 1.94x 2.00x 1.97x
Debt Service Coverage Ratio (CF) 1.27x 1.73x 1.44x 1.55x 1.37x 1.49x 1.76x 1.86x 1.92x 1.81x
Rolling - All Cash IRR N/M 0.74% 4.54% 5.22% 6.47% 7.18% 7.47% 7.64% 7.34% 7.33%
Rolling - Leveraged IRR N/M N/M 3.57% 5.37% 8.34% 9.86% 10.40% 10.66% 10.00% 9.94%
[1] This figure takes into account vacancy/credit loss, absorption vacancy, turnover vacancy, and base rent abatements.[2] This figure does not include any amount related to expense reimbursements. Only Scheduled Base Rent and Fixed/CPI Increases are included in this calculation, which is based on the weighted-average
physical occupancy during each fiscal year.[3] Based on 24,065 square feet[4] Net Residual Value is calculated by dividing Year 11 NOI by the Residual Cap Rate of 6.00% and applying a 3.00% Cost of Sale.[5] Market Debt based on 60% Loan-to-Value, 4.85% Interest Rate, with 24 Months of Interest Only then 30-Year Amortization, and 1.00% Loan Fee.
CASH FLOW PROJECTIONS (CONT.)
| 10 |

RENT ROLL
Square Feet
% of Property
Lease Term Rental Rates
Misc. Rent
RecoveryType
Rent Abatements Market
Assumption /Market RentSuite Tenant Name Begin End Begin Monthly PSF Annually PSF
Month #
% Abated TI’s LC’s
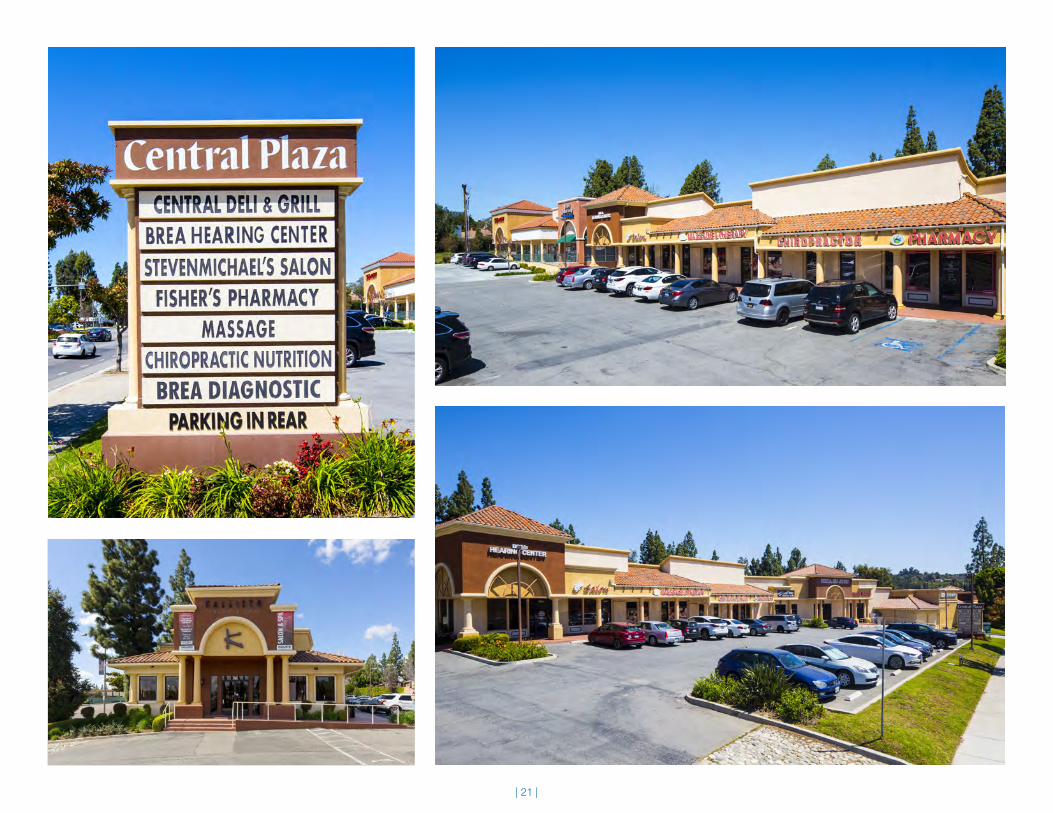
375-A United Medical Imaging 3,360 13.96% Dec-2012 Nov-2018 Current $8,131 $2.42 $97,572 $29.04 - NNN - - - - Market $2.00 NNN
(Shops)Notes: Tenant has one (1) - three (3) year option at $2.49 /sf/mo.
375-B Kallisto Salon & Spa 7,230 30.04% Jan-2005 Jan-2023 Current $12,291 $1.70 $147,492 $20.40 - NNN - - - - Market $2.00 NNN
(Shops)Feb-2020 $12,659 $1.75 $151,902 $21.01
Feb-2021 $13,038 $1.80 $156,457 $21.64
Feb-2022 $13,430 $1.86 $161,157 $22.29
379-A Central Deli & Grill 1,750 7.27% Jan-2010 Dec-2020 Current $2,781 $1.59 $33,372 $19.07 - Gross - - - - Market $2.00 NNN (Restaurant)
Jan-2019 $2,864 $1.64 $34,370 $19.64
Jan-2020 $2,950 $1.69 $35,403 $20.23
379-B Brea Jiu-Jitsu 2,100 8.73% Oct-2012 Aug-2022 Current $4,200 $2.00 $50,400 $24.00 – NNN 72 100% - - Market $2.00 NNN
(Shops)Sep-2018 $4,368 $2.08 $52,416 $24.96 84 100%
Sep-2019 $4,536 $2.16 $54,432 $25.92
Sep-2020 $4,725 $2.25 $56,700 $27.00
Sep-2021 $4,914 $2.34 $58,968 $28.08
Notes: Tenant has one (1) - five (5) year option @ 4% increase over prior rent (modeled below). Tenant has free rent on 9/18 and 9/19 @ 100%.
379-B Brea Jiu-Jitsu 2,100 8.73% Sep-2022 Aug-2027 FUTURE $5,111 $2.43 $61,327 $29.20 – NNN - - - - Market $2.00 NNN
(Shops)OPTION Sep-2023 $5,315 $2.53 $63,777 $30.37
Sep-2024 $5,528 $2.63 $66,339 $31.59
Sep-2025 $5,749 $2.74 $68,985 $32.85
Sep-2026 $5,978 $2.85 $71,736 $34.16
Notes: Tenant has one (1) - five (5) year option @ 4% increase over prior rent (modeled below). Tenant has free rent on 9/18 and 9/19 @ 100%.
379-C VACANT (379-C) 1,750 7.27% Dec-2018 Nov-2023 Dec-2018 $3,500 $2.00 $42,000 $24.00 - NNN 1-3 100% $15.00 $7.29 Market $2.00 NNN
(Shops)Dec-2019 $3,605 $2.06 $43,260 $24.72 $26,250 $12,749
Dec-2020 $3,713 $2.12 $44,555 $25.46 6.00%
Dec-2021 $3,825 $2.19 $45,903 $26.23
Dec-2022 $3,939 $2.25 $47,268 $27.01
385-A Julie A. Ball Audiology 1,490 6.19% Jul-2017 Jun-2022 Current $2,550 $1.71 $30,602 $20.54 - NNN - - - - Option $2.00 NNN
(Shops)Jul-2019 $2,677 $1.80 $32,124 $21.56 Jul-2020 $2,811 $1.89 $33,734 $22.64 Jul-2021 $2,953 $1.98 $35,432 $23.78
Notes: Assume tenant exercises one (1) - five (5) year option with no leasing costs.
385-A Julie A. Ball Audiology 1,490 6.19% Jul-2022 Jun-2027 FUTURE $3,100 $2.08 $37,196 $24.96 - NNN - - - - Option $2.00 NNN
(Shops)OPTION Jul-2023 $3,254 $2.18 $39,053 $26.21
Jul-2024 $3,417 $2.29 $41,005 $27.52 Jul-2025 $3,588 $2.41 $43,061 $28.90 Jul-2026 $3,767 $2.53 $45,207 $30.34
Notes: Assume tenant exercises one (1) - five (5) year option with no leasing costs.
| 11 |

RENT ROLL (CONT.)
Square Feet
% of Property
Lease Term Rental Rates
Misc. Rent
RecoveryType
Rent Abatements Market
Assumption /Market RentSuite Tenant Name Begin End Begin Monthly PSF Annually PSF
Month #
% Abated TI’s LC’s
385-B Steven Michaels Hair Salon
1,156 4.80% Apr-2004 Mar-2019 Current $2,392 $2.07 $28,704 $24.83 - NNN - - - - Market $2.00 NNN (Restaurant)
385-C Brea Bodycare & Massage
1,909 7.93% Oct-2008 Sep-2018 Current $3,341 $1.75 $40,089 $21.00 – NNN - - - - Market $2.00 NNN
(Shops)
385-D Pierce Chiropractic 1,492 6.20% Oct-1999 May-2019 Current $2,770 $1.86 $33,240 $22.28 - NNN - - - - Market $2.00 NNN
(Shops)MTM
Notes: Lease expired 6/04. Assumes tenant remains in-place throughout first year of analysis at same terms.
385-E Fishers Brea Pharmacy 1,828 7.60% May-2001 Apr-2021 Current $3,199 $1.75 $38,388 $21.00 – NNN - - - - Market $2.00 NNN
(Shops)
TOTALS / AVERAGES 24,065 $41,655 $1.87 $499,859 $22.40
OCCUPIED Sq. Ft. 22,315 92.7%
VACANT Sq. Ft. 1,750 7.3%
TOTAL Sq. Ft. 24,065 100.0%
WEIGHTED-AVG LEASE TERM REMAINING: 2.84 Years WEIGHTED-AVG LEASE TERM LAPSED: 10.64 Years
WEIGHTED-AVG LEASE TERM FROM INCEPTION:
13.47 Years
| 12 |
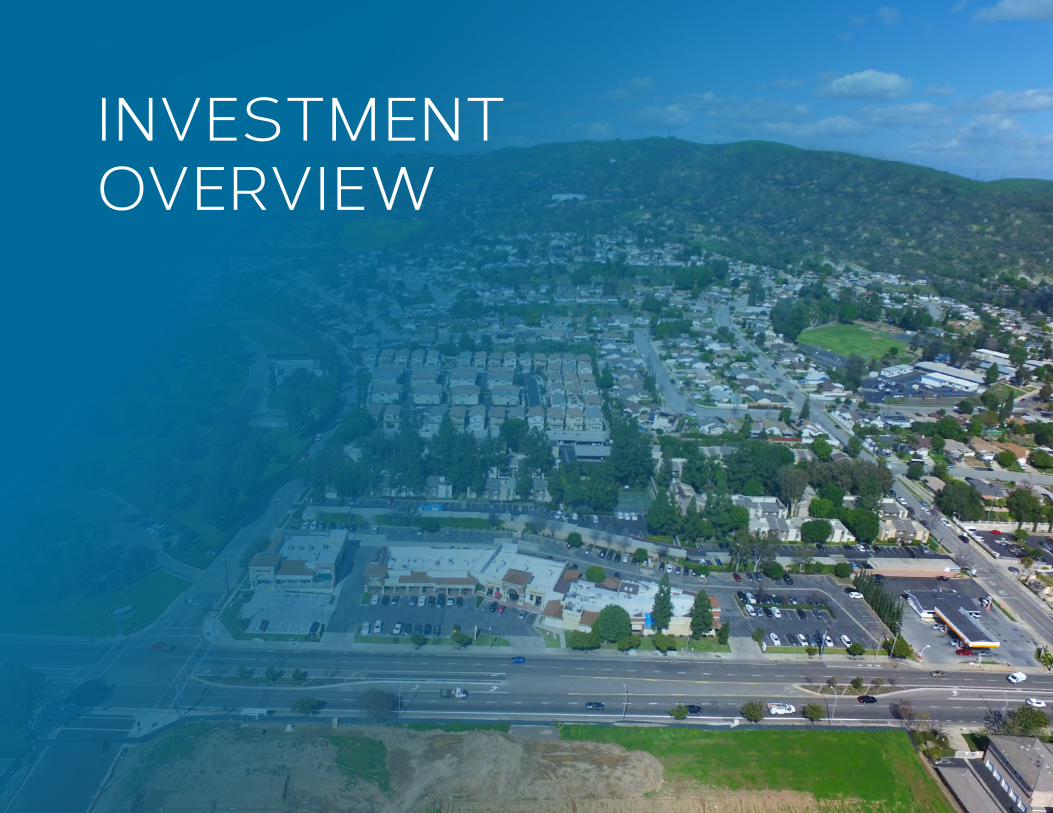
INVESTMENT OVERVIEW

Location MapINVESTMENT OVERVIEW
CBRE has been retained as the exclusive advisor to offer for sale a
100% fee simple interest in the property located at 375, 379, & 385 W.
Central Avenue in Brea, California. The property is a 24,065 square foot
shopping center situated on 2.23 acres of land. This property includes
10 retail units which are 93% occupied. The total current annual gross
revenue is equal to $661,236. The expenses are estimated at $188,826
per year. The net operating income is equal to approximately $470,988
which equates to a 5.24% cap rate. Located directly across the street
from the subject property on Central Avenue is a new development
called Central Park Village Brea (see Location Overview section for
more details).
The city of Brea remains a region with a high demand for retail as the
home to over 4.5 million square feet of retail and 32 shopping centers.
The largest and most famed of these centers is the 1.5 million SF Brea
Mall. The mall welcomes 14 million visitors annually and houses tenants
such as Nordstrom, JCPenney, Macy’s, and Sears. Down the street
from the mall is Brea’s largest power center, the 589,019 SF Brea Union
Plaza which includes, Nordstrom Rack, Sears Outlet, Staples, Home
Depot, and Walmart. Other noteworthy retail centers include the Brea
Marketplace, Birch Street Promenade, Imperial Center East, the Brea
Gateway Shopping Center, and Brea Plaza
Investment Highlights
» Stabilized Orange County Asset - 93% Occupied / Seasoned Tenants
» Large Parcel – 2.24 acre lot
» Dense Population - Approximately 400,000 people live within a
5-mile radius
» Strong Consumer Base - Average Household Income is over
$105,000 per year within a 3-mile radius
» New Central Park Village Development - Located directly across the street from the subject property is a 100 million dollar mixed-use development which consists of retail, medical offices, and 450+ residential units.
Site
| 14 |
| 15 |
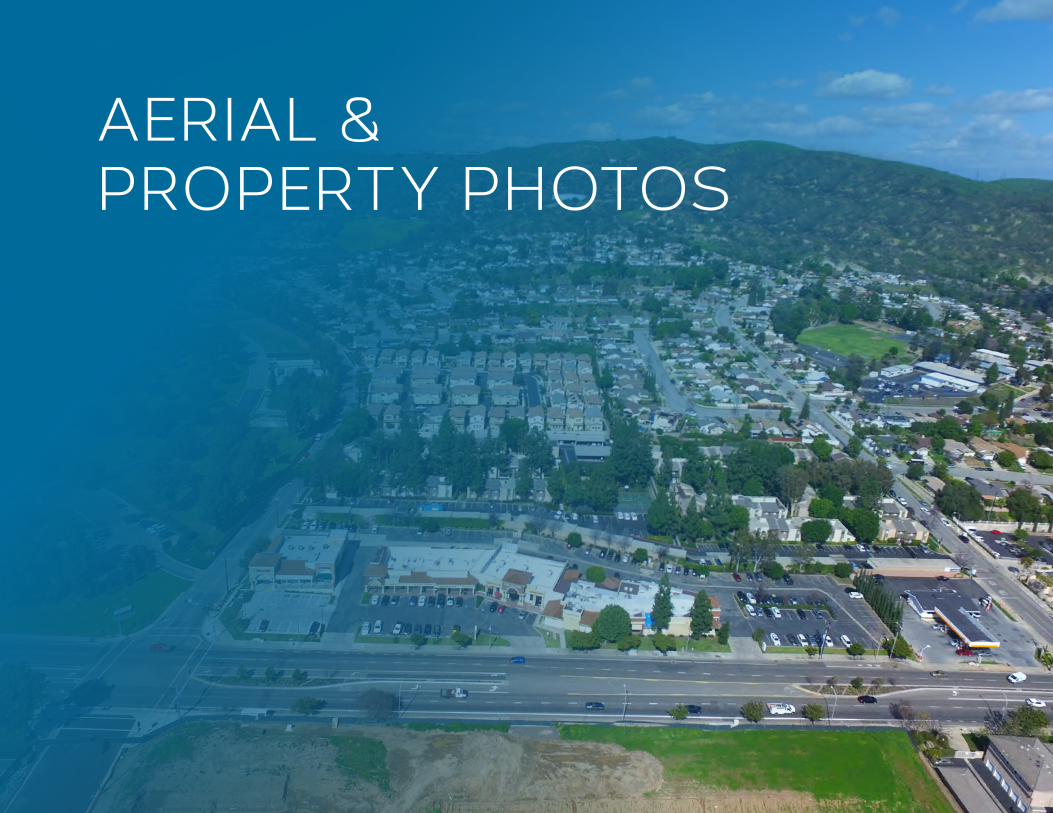
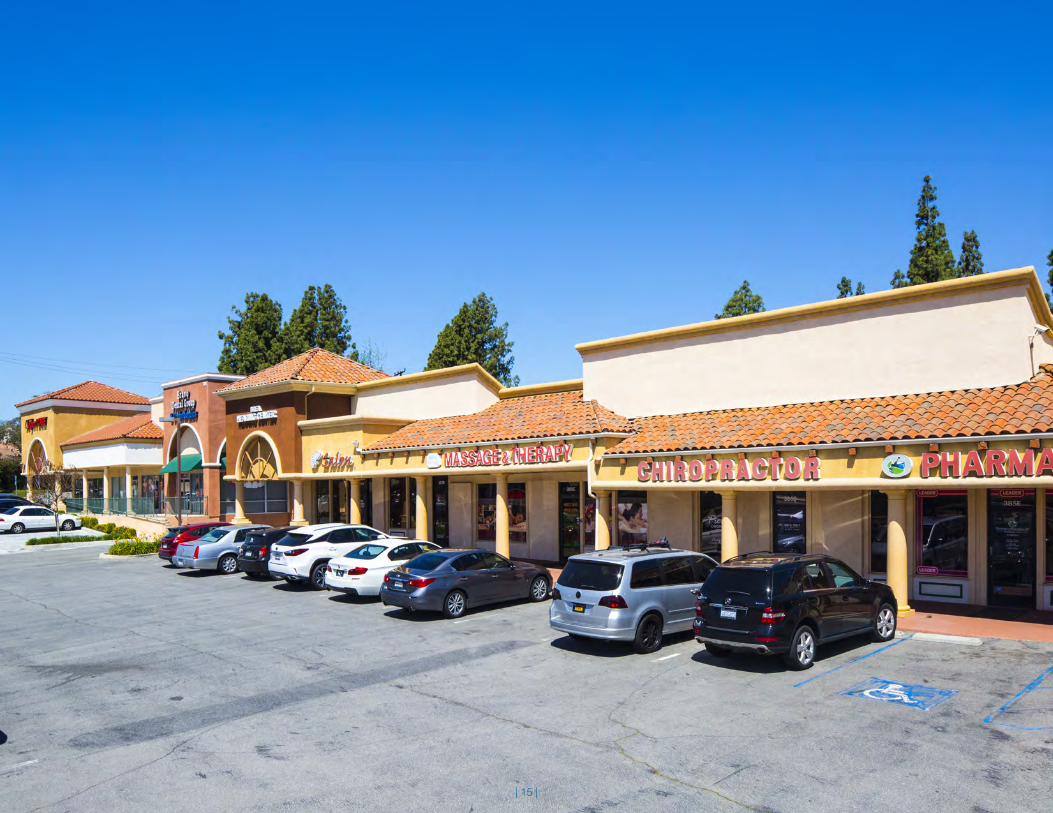
AERIAL & PROPERTY PHOTOS

Central Park Village Development
Central Ave
Site Dr
Site
| 17 |

AERIAL MAP
| 18 |
Central Ave
Site Dr
Site
Central Park Village Development
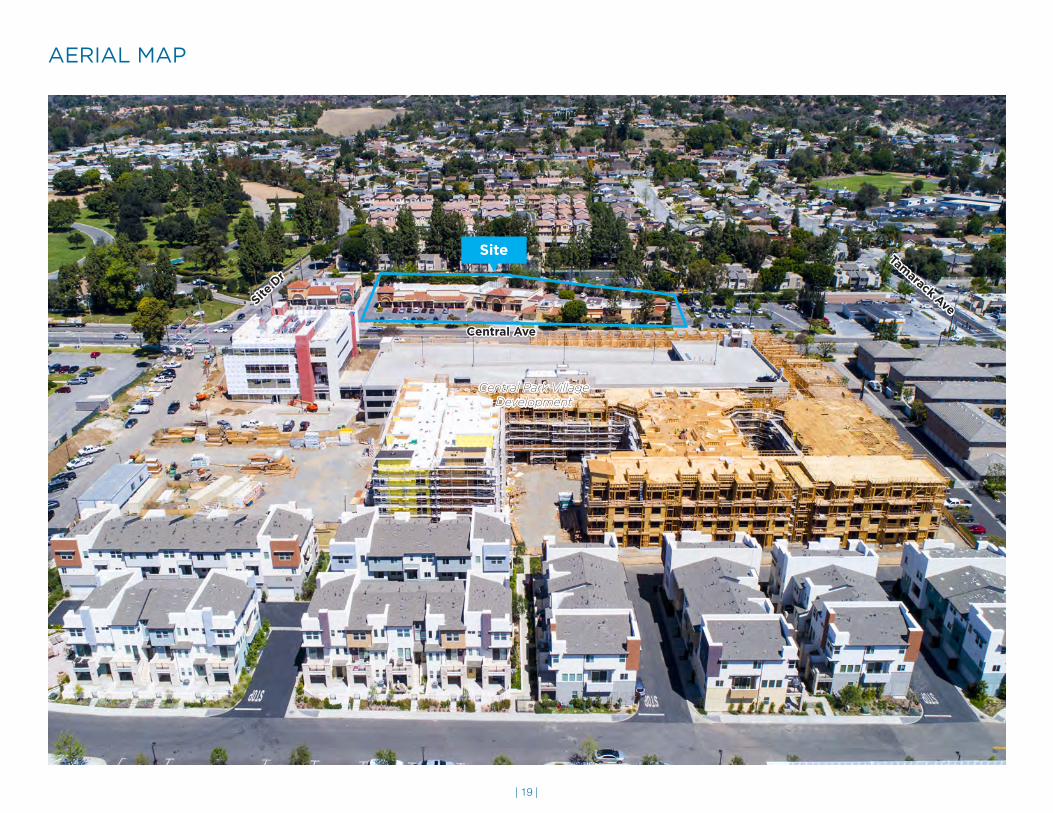
AERIAL MAP
| 19 |
Central Ave
Site D
r
Tamarack Ave
Site
Central Park Village Development
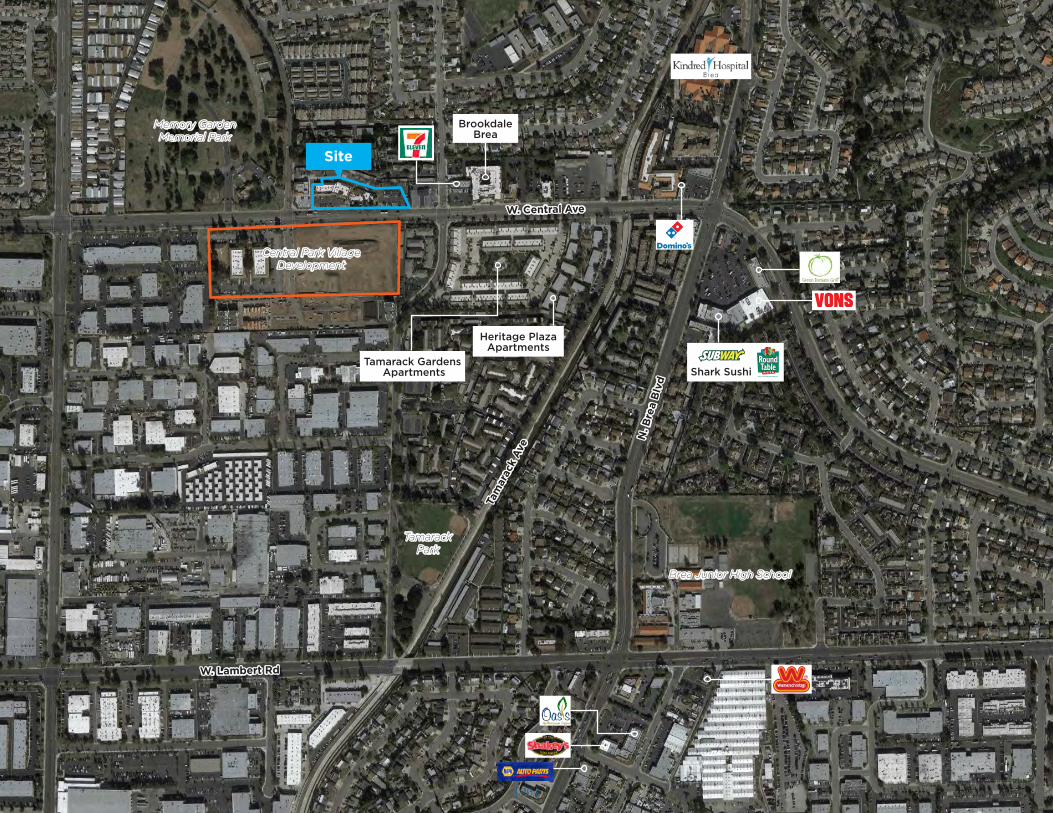
Site
N. B
rea B
lvd
Tam
arac
k A
ve
W. Central Ave
W. Lambert Rd
| 20 |
Central Park Village Development
Memory Garden Memorial Park
Brea Junior High School
Shark Sushi
Heritage Plaza Apartments
brookdalebrea
Tamarack Gardens Apartments
Tamarack Park
| 21 |

LOCATION OVERVIEW
LOCATION OVERVIEW
Brea
Nestled in the foothills on a plateau at the northern
tip of Orange County is the bustling city of Brea.
Home to 40,680 residents, Brea attracts more than
100,000 people daily for work, shop, and play.
Incorporated in 1971, Brea has seen continuous growth
over the years and is anticipated to continue this
growth at a strong rate through 2020. Brea sustains
a strong economy with a high average household
incomes, active downtown, thriving business district,
and booming housing market. Brea City Hall, includes
a large community plunge and hosts a popular
summer Concerts in the Park series, as well as the
annual July 4 County Fair.
Brea is well known for a high quality life and upbeat
business tempo, new development proposals are
anticipated for the future. As population becomes
dense in Southern California and the entire region
becomes increasingly urban, Brea is certain to lead
the way in striking balance on emerging issues.
Revitalization of existing properties are an important
dynamic for Brea and exciting in-fill projects continue
to be the cornerstone of economic development
for the City. The region is committed to responsible
growth and is projected to continue to thrive for years
to come. Brea is bordered by a significant natural
wildlife corridor that also serves as a rare scenic break
within the area’s urban sprawl. Working in conjunction
with neighboring communities, Brea has attracted
national interest from parks and environmental
organizations that recognize the significance of its
setting. Nearby hillsides may well represent the best
legacy for the future.
RETAIL
The city of Brea remains a region with a high demand
for retail as the home to over 4.5 million square feet
of retail and 32 shopping centers. The largest and
most famed of these centers is the 1.5 million SF Brea
Mall. The mall welcomes 14 million visitors annually
and houses tenants such as Nordstrom, JCPenney,
Macy’s, and Sears. Down the street from the mall
is Brea’s largest power center, the 589,019 SF Brea
Union Plaza which includes Babies “R” Us, Nordstrom
Rack, Sears Outlet, Staples, Home Depot, and
Walmart. Other noteworthy retail centers include the
Brea Marketplace, Birch Street Promenade, Imperial
Center East, the Brea Gateway Shopping Center, and
Brea Plaza.
PLACES/EVENTS OF INTEREST
• Brea Mall
• Natural Wildlife Preserve
• Birch Street Promenade
• Carbon Canyon Regional Park
• Black Gold Golf Club
• Cal State University Fullerton
| 23 |
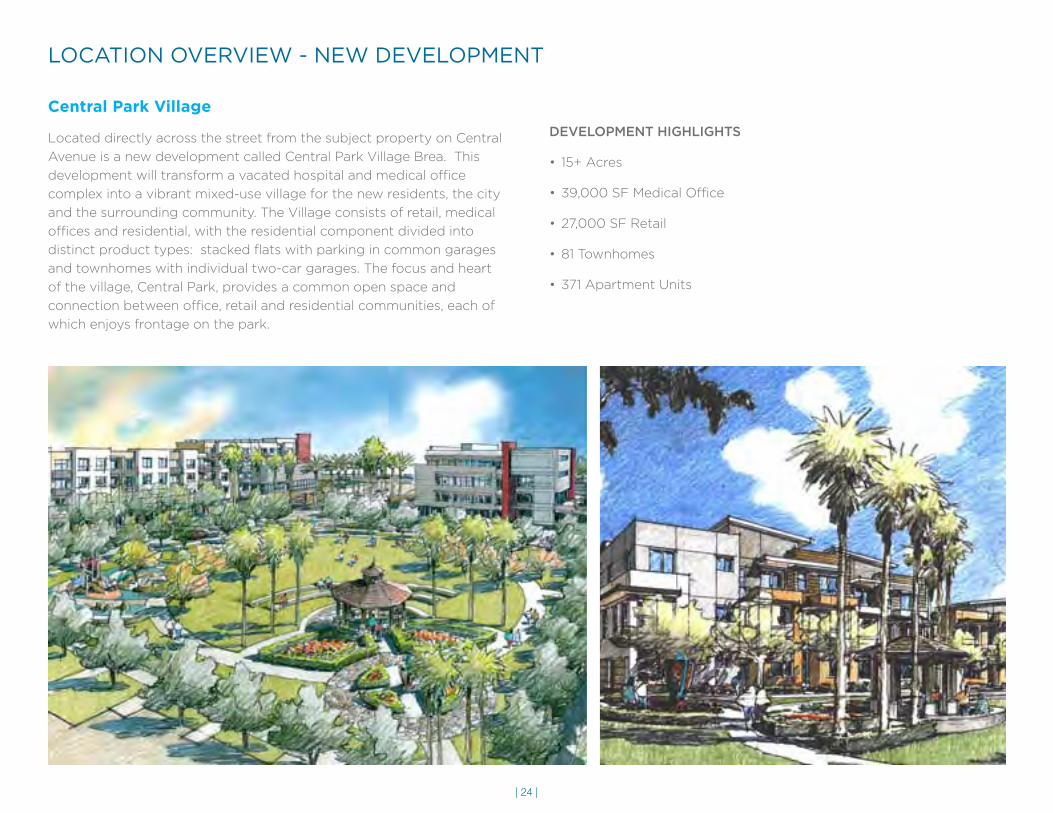
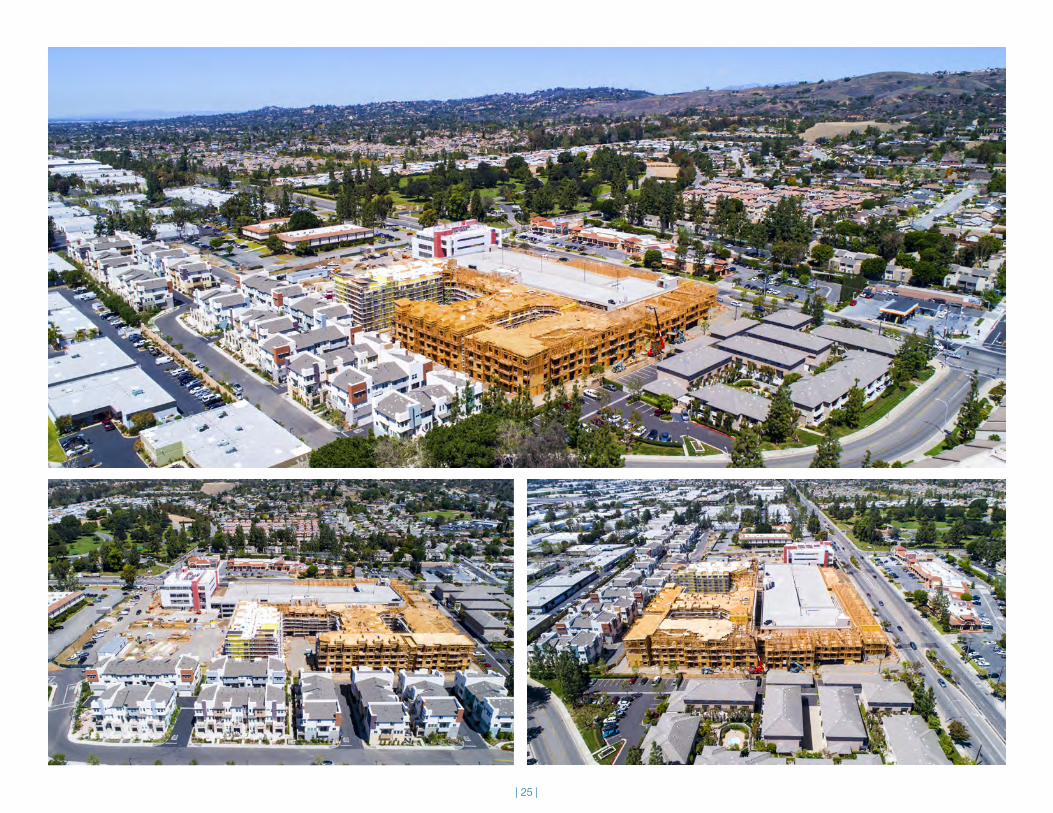
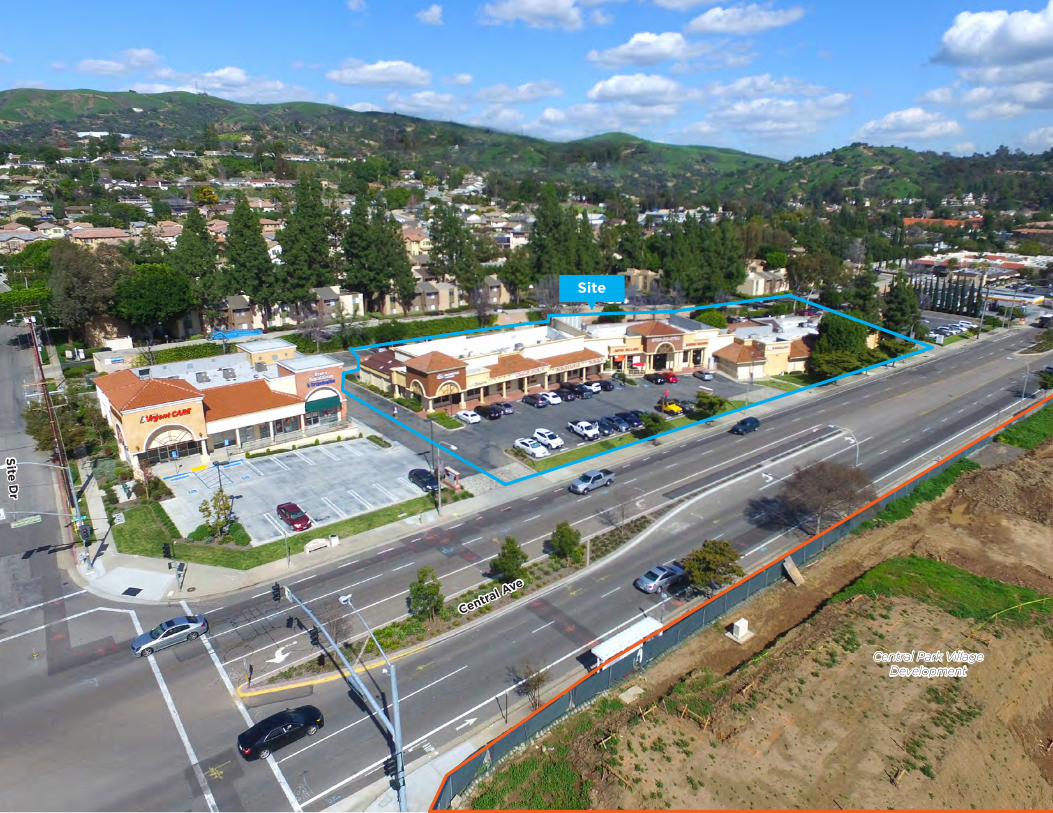
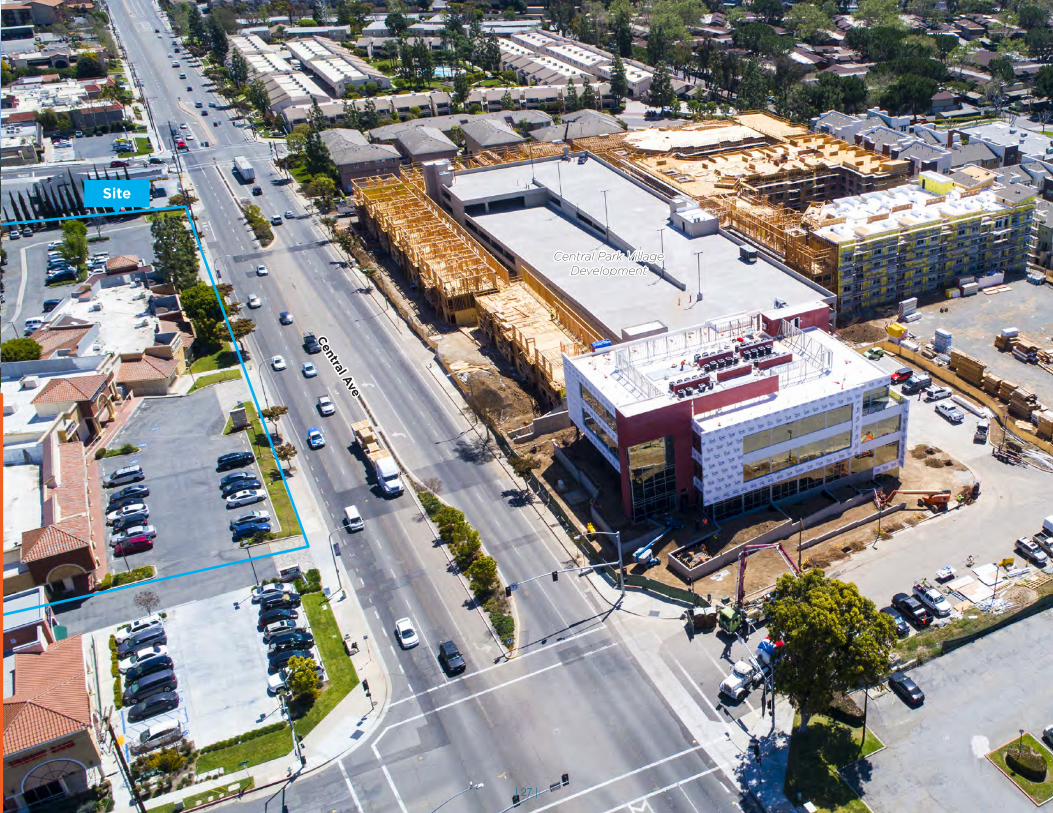
Central Park Village
Located directly across the street from the subject property on Central
Avenue is a new development called Central Park Village Brea. This
development will transform a vacated hospital and medical office
complex into a vibrant mixed-use village for the new residents, the city
and the surrounding community. The Village consists of retail, medical
offices and residential, with the residential component divided into
distinct product types: stacked flats with parking in common garages
and townhomes with individual two-car garages. The focus and heart
of the village, Central Park, provides a common open space and
connection between office, retail and residential communities, each of
which enjoys frontage on the park.
LOCATION OVERVIEW - NEW DEVELOPMENT
DEVELOPMENT HIGHLIGHTS
• 15+ Acres
• 39,000 SF Medical Office
• 27,000 SF Retail
• 81 Townhomes
• 371 Apartment Units
| 24 |
| 25 |
| 26 |
Central Ave
Site
Dr
Site
Central Park Village Development
Central Park Village Development
Site
Central A
ve
| 27 |
DEMOGRAPHICS

DEMOGRAPHICS
1 MILE 3 MILES 5 MILES
POPULATION2016 Population - Current Year Estimate 14,541 110,152 339,889
2021 Population - Five Year Projection 15,305 115,251 354,244
2010 Population - Census 13,748 103,281 324,835
2000 Population - Census 12,576 99,333 311,406
2010-2016 Annual Population Growth Rate 0.90% 1.04% 0.73%
2016-2021 Annual Population Growth Rate 1.03% 0.91% 0.83%
HOUSEHOLDS2016 Households - Current Year Estimate 5,539 36,289 112,206
2021 Households - Five Year Projection 5,779 37,656 116,153
2010 Households - Census 5,316 34,627 108,790
2000 Households - Census 4,949 33,552 104,516
2010-2016 Annual Household Growth Rate 0.66% 0.75% 0.50%
2016-2021 Annual Household Growth Rate 0.85% 0.74% 0.69%
2016 Average Household Size 2.62 3.02 2.99
HOUSEHOLD INCOME2016 Average Household Income $99,665 $105,567 $101,476
2021 Average Household Income $108,868 $115,163 $110,825
2016 Median Household Income $78,664 $80,687 $76,773
2021 Median Household Income $86,972 $89,971 $85,694
2016 Per Capita Income $37,386 $34,973 $33,995
2021 Per Capita Income $40,497 $37,794 $36,824
HOUSING UNITS2016 Housing Units 5,749 37,773 117,160
2016 Vacant Housing Units 210 3.7% 1,484 3.9% 4,954 4.2%
2016 Occupied Housing Units 5,539 96.3% 36,289 96.1% 112,206 95.8%
2016 Owner Occupied Housing Units 3,295 57.3% 23,899 63.3% 70,775 60.4%
2016 Renter Occupied Housing Units 2,244 39.0% 12,390 32.8% 41,431 35.4%
EDUCATION2016 Population 25 and Over 10,304 75,485 234,720
HS and Associates Degrees 5,466 53.0% 38,846 51.5% 117,661 50.1%
Bachelor's Degree or Higher 4,258 41.3% 28,090 37.2% 90,723 38.7%PLACE OF WORK2016 Businesses 1,359 5,722 15,6472016 Employees 19,562 72,497 173,325
©2018 CBRE. This information has been obtained from sources believed reliable. We have not verified it and make no guarantee, warranty or representation about it. Any projections, opinions, assumptions or estimates used are for example only and do not represent the current or future performance of the property. You and your advisors should conduct a careful, independent investigation of the property to determine to your satisfaction the suitability of the property for your needs. Source: Esri
1 mile
3 miles
5 miles
TRAFFIC COUNTS
Street Cross Street Traffic Vol Year
W Central Ave Tamarack Ave W 34,463 2015
| 29 |

© 2018 CBRE, Inc. The information containing in this document has been obtained for sources believed reliable. While CBRE, Inc. does not doubt its accuracy, CBRE, Inc. has not verified it and makes no guarantee, warranty or representation about it. It is your responsibility to independently confirm its accuracy and completeness. Any projections, opinions, assumptions or estimates used are for example only and do not represent the current or future performance of the property, The value of this transaction to you depends on tax and other factors which should be evaluated by your tax, financial and legal advisors. You and your advisors should conduct a careful, independent investigation of the property to determine to your satisfaction the suitability of the property for your needs. Photos herein are the property of their respective owners and use of these images without the express written consent of the owner is prohibited. CBRE and the CBRE logo are service marks of CBRE, Inc. and/or its affiliated or related companies in the United States and other countries. All other marks displayed on this document are the Property of their respective owners.
3501 Jamboree Road, Suite 100Newport Beach, CA 92660