Embed Size (px)
DESCRIPTION
The economic roadmap of Region III for the period 2011-2016.
Citation preview


Republic of the PhilippinesREGIONALDEVELOPMENTCOUNCIL
National Economic and Development AuthorityRegion Ill, Central Luzon
2/F Hyatt Garden Building, Dolores,City of San Fernando, Pampanga 2000
Telefax. Nos. (045) 963-6772 to 73, 961-3902e-mail: [email protected]
(Excerpts from the Minutes of the 13th Regional Development Council III (RDC) Meeting held 25February 2011 at Mimosa Convention Center, Clark Freeport, Pampanga)
RDC Resolution No. 03~1-2011
APPROVING AND ADOPTING THE CENTRAL LUZON MEDIUM TERM REGIONAL DEVELOPMENT PLAN(CL-MTRDP), 2011-2016 AND THE MEDIUM TERM REGIONAL INVESTMENT PROGRAM (MTRIP),2011-2016
the President directed the formulation of Central Luzon Regional Development Plansfor 2011-2016 for incorporation in the Medium Term Philippine Development Plan,2011-2016;
the formulation of the CL-MTRDP 2011-2016 emphasized the production of a gooddocument on the region's direction and priorities for the next six years and theprocess to be observed to maximize people's participation;
the Central Luzon CL-MTRIP is a companion document of the CL-MTRDP, 2011-2016;
the formulation of the CL-MTRIP is in consonance with EO 325 that gives the RDCsthe mandate to review, prioritize and endorse the investments programs and annualbudgets of national government agencies; and,
the CL-MTRIP contains the list of public sector programs and projects necessary torealize the development objectives of the region.
NOW, THEREFORE, ON MOTION DULY SECONDED, BE IT
RESOLVED, AS IT IS HEREBY RESOLVED, That the RDC III approves and adopts the framework ofCentral Luzon Medium Term Regional Development Plan, 2011-2016;
RESOLVED FURTHER, That the RDC III requests all concerned to submit to the secretariat theirproposed priority programs, projects or activities for 2011-2016 consistent with the adoptedframework.
WHEREAS,
WHEREAS,
WHEREAS,
WHEREAS,
WHEREAS,

I
RESOLVED FINALLY, that a copy of this resolution be furnished to all concerned.
Done in Clark Freeport, Parnpanga this 25th day of February in the year of our Lord two thousand andeleven.
Certified Correct by:
N~/-LYNNETIE Y. BAUTISTASecretary, RDC III(Assistant Director, NEDA Ill)
Approved by:
C<={ .--A' . ~
EMIGIO A. MER~OPresiding Officer, RDC III(Regional Director, NEDA Ill)

will act as a common roadmap for our country’s development and for the establishment of the necessary infrastructure that will help us achieve our goal of increasing economic and social opportunities for our people. Guided by our commitment to the UN Millennium Development Goals, our concerted efforts will not only help accelerate economic growth, but will also give our provinces improved access to quality education, health, and social services. We came to government with a mandate to eradicate poverty and create a better futuour nation. As we carry out key reforms in the bureaucracy, we also strive to set in place an environment of sustainable and equitable progress in the coming years. Together, let us fulfill the potential of our great nation.
M A N I L A M A N I L A M A N I L A M A N I L A May 2011
���
Message�
I commend the NEDA Regional Development Councils and all stakeholders in the 17 regions for coming together to formulate your respective Regional Development Plans. May this partnership among regional and local institutions, the private sector, and civil society ensure the continued success of these programs and the distribution of their benefits throughout the country. Along with the Philippine Development Plan, the RDPs will guide our development efforts in the next five years, and
roadmap for our country’s development and for the establishment of the necessary infrastructure that will help us achieve our goal of increasing economic and social opportunities for our people. Guided by our commitment to the UN Millennium
ls, our concerted efforts will not only help accelerate economic growth, but will also give our provinces improved access to quality education, health, and social services.
We came to government with a mandate to eradicate poverty and create a better futuour nation. As we carry out key reforms in the bureaucracy, we also strive to set in place an environment of sustainable and equitable progress in the coming years. Together, let us fulfill the potential of our great nation.
BENIGNOBENIGNOBENIGNOBENIGNO S. AQUINO IIIS. AQUINO IIIS. AQUINO IIIS. AQUINO III President
Republic of the Philippines
�
I commend the NEDA Regional Development Councils and all stakeholders in the 17 regions for coming together to formulate your respective Regional Development Plans. May this partnership among regional and local institutions,
ociety ensure the continued success of these programs and the distribution of their
Along with the Philippine Development Plan, the RDPs will guide our development efforts in the next five years, and
roadmap for our country’s development and for the establishment of the necessary infrastructure that will help us achieve our goal of increasing economic and social opportunities for our people. Guided by our commitment to the UN Millennium
ls, our concerted efforts will not only help accelerate economic growth, but will also give our provinces improved access to quality education, health, and social services.
We came to government with a mandate to eradicate poverty and create a better future for our nation. As we carry out key reforms in the bureaucracy, we also strive to set in place an environment of sustainable and equitable progress in the coming years. Together, let us
Republic of the Philippines
The attainment of our goals requires massive investments in infrastother productive activities. The PDP, along with the RDPs athe proper and equitable allocation of resources people. Likewise, our plans shall climate and disaster risks, promoting good governance and ensuring peace and stability. The RDPs provide the framework for local developmentunits to align their local plans and programs with the RDPs. We likewise seek the support of regional institutions and the private institutions in the realization of the plans which many of them have helped prepare. We need toas we promote public-private partnership to improve the provision of services for our people. I thank the Regional Development Counciland we count on their continued leadership in coordinating development efforts in the regions.
Message� The Regional Development Plans (RDPs) represent the aspirations of Filipinos in different areas of the countryaccompanying documents of the Philippine Development Plan (PDP) 2011-2016, the RDPs also provide the spatial dimension to the national plan by identifying contributions to our goal of a high, sustained and broadbased growth. This “inclusive growth” involves rapid economic expansion that must reach population groups throughout the country through the provision of productive employment opportunities, thereby reducing poverty.
The attainment of our goals requires massive investments in infrastructure, social services and other productive activities. The PDP, along with the RDPs are the key instruments that will guide
allocation of resources to ensure improvements in the welfare of our Likewise, our plans shall direct our efforts in protecting the environment, reducing
climate and disaster risks, promoting good governance and ensuring peace and stability.
the framework for local development. We thus enjoin the local government units to align their local plans and programs with the RDPs. We likewise seek the support of regional institutions and the private institutions in the realization of the plans which many of them have helped prepare. We need to strengthen our multistakeholder cooperation particularly
private partnership to improve the provision of services for our people.
the Regional Development Councils (RDCs) for spearheading the preparation of the RDPs and we count on their continued leadership in coordinating development efforts in the regions.
CAYETANO W. PADERANGACAYETANO W. PADERANGACAYETANO W. PADERANGACAYETANO W. PADERANGASecretary of Socioeconomic Planning
NEDA Director-General
ional Development Plans (RDPs) represent the aspirations of Filipinos in different areas of the country. As accompanying documents of the Philippine Development
the RDPs also provide the spatial dimension to the national plan by identifying the regions’
our goal of a high, sustained and broad-growth” involves rapid
that must reach population groups throughout the country through the provision of productive employment opportunities, thereby reducing poverty.
ructure, social services and the key instruments that will guide
to ensure improvements in the welfare of our direct our efforts in protecting the environment, reducing
climate and disaster risks, promoting good governance and ensuring peace and stability.
enjoin the local government units to align their local plans and programs with the RDPs. We likewise seek the support of regional institutions and the private institutions in the realization of the plans which many of
cooperation particularly private partnership to improve the provision of services for our people.
for spearheading the preparation of the RDPs and we count on their continued leadership in coordinating development efforts in the regions.
CAYETANO W. PADERANGACAYETANO W. PADERANGACAYETANO W. PADERANGACAYETANO W. PADERANGA,,,, JR.JR.JR.JR. Secretary of Socioeconomic Planning and
General

region play a crucial role to balance all the varying interests on hand. Against an accurate assessment of the current situation obtaining in the region, tRegional Development Plan (CLchallenges that will push growth and spread its benefits to everyone.crusade of no less than our President Noynoyeconomic conditions of the disadvantageddistributing opportunities to the underprivileged. The past six years have been relatively betterRegional Development Council (RDC) is on hand for Central Luzon.
�Message�
Greetings! Being a gateway to the world, the role of Central Luzon in national development can never be left to chance. With the advancement in communications and the close inter-connectivityincidents in the outside world impact the poorest far-flung barangays, who all have the human opportunities for progress. Development entities like the Regional Development Council (RDC) III as the primarycoordinator and integrator of all development initiatives in the
region play a crucial role to balance all the varying interests on hand.
Against an accurate assessment of the current situation obtaining in the region, tment Plan (CL-RDP), 2011-2016 squarely addresses critical development
challenges that will push growth and spread its benefits to everyone. This has been the ardent crusade of no less than our President Noynoy: growth and development while elevating the
disadvantaged. The Government should have mechanisms the underprivileged.
The past six years have been relatively better-off but also challenging for the region. With a strong opment Council (RDC) we can continuously strive for improvement because
OSCAR S. RODRIGUEZOSCAR S. RODRIGUEZOSCAR S. RODRIGUEZOSCAR S. RODRIGUEZ RDC III Chairman Mayor, City of San Fernando, Pampanga
Being a gateway to the world, the role of Central Luzon in national With the advancement
connectivity of economies, poorest households in
the human right to equal Development entities like the
Regional Development Council (RDC) III as the primary coordinator and integrator of all development initiatives in the
region play a crucial role to balance all the varying interests on hand.
he Central Luzon-2016 squarely addresses critical development
This has been the ardent growth and development while elevating the
have mechanisms for re-
challenging for the region. With a strong we can continuously strive for improvement because the best
Mayor, City of San Fernando, Pampanga

2016, resulted from the aforesaid multi
network of economic and free port zones shall be
within the zones and host-Local Government Units (LGUs)
leap to growth may be realized
diversification and expansion shall
sustained growth.
The Plan as crafted epitomizes responsiveness, efficiency and straightforward analysis and
presentation. Costs from natural disasters
by integrating Disaster Risk Reduction
the Planning Environment, identification of Development Challenges
Human Rights principles were likewise
inputs equated with land and capital
treated with utmost respect in public
enhancing strategies, legal and physical access to productive assets and basic social services
particularly of the farming communities
The report is organized following a one
solutions to the priority development problems.
A brief yet substantive introduction
Challenges. The more detailed report on the analysis of the Planning Environment is
make the main document brief and uncluttered without excessive details.
The priority Programs and Projects were deduced from the Strategies. Thus, these are well
reflect their substantive contribution to higher and sustained growth.
On the whole the CL-RDP mirrors the oneness of the Region III stakeholders to pursue sustainable
and inclusive development.
Foreword�
From 2004-2009, Central Luzon maintained its niche as the third
largest contributor to national output. However, f
8.64 percent in 2004, its annual share slid down to 8.1 percent
in 2009. With this as background, the stakeholders
put their minds together and diagnosed the causes
the region from soaring above its accustomed place
income generation given its vast potentials and
opportunities that the special economic and free p
The Central Luzon Regional Development Plan (CL
resulted from the aforesaid multi-sectoral collaboration. Under the Plan the
network of economic and free port zones shall be unleashed through infrastructure and skill upgrade
Local Government Units (LGUs) so that the needed synergy for a
may be realized. Through the process, technology upgrade and investment
hall fortify the region’s human and physical capital for a more
The Plan as crafted epitomizes responsiveness, efficiency and straightforward analysis and
osts from natural disasters are minimized and benefits from development optimized
Disaster Risk Reduction (DRR) and Climate Change Adaptation (CCA) in the analysis of
dentification of Development Challenges and Strategy formulation
likewise used. Labor is treated not only as one of the productive
equated with land and capital but as human person, endowed with dignity
public policies. Expectedly, employment genera
enhancing strategies, legal and physical access to productive assets and basic social services
particularly of the farming communities assumed high importance in the Plan.
The report is organized following a one-page summary that presents the linkages of the proposed
solutions to the priority development problems.
A brief yet substantive introduction provides a background for the succeeding
hallenges. The more detailed report on the analysis of the Planning Environment is
make the main document brief and uncluttered without excessive details.
The priority Programs and Projects were deduced from the Strategies. Thus, these are well
reflect their substantive contribution to higher and sustained growth.
RDP mirrors the oneness of the Region III stakeholders to pursue sustainable
REMIGIO A. MERCADO
NEDA III - Regional Director
RDC III Vice-Chairman
2009, Central Luzon maintained its niche as the third
However, from a high of
slid down to 8.1 percent
the stakeholders in the region
causes holding down
above its accustomed place in national
given its vast potentials and the wide array of
and free port zones offer.
Central Luzon Regional Development Plan (CL-RDP), 2011-
sectoral collaboration. Under the Plan the potentials of the
through infrastructure and skill upgrade
so that the needed synergy for a higher
technology upgrade and investment
’s human and physical capital for a more
The Plan as crafted epitomizes responsiveness, efficiency and straightforward analysis and
minimized and benefits from development optimized
) in the analysis of
and Strategy formulation.
not only as one of the productive
endowed with dignity, who must be
generation and income-
enhancing strategies, legal and physical access to productive assets and basic social services
he linkages of the proposed
the succeeding Development
hallenges. The more detailed report on the analysis of the Planning Environment is appended to
The priority Programs and Projects were deduced from the Strategies. Thus, these are well-knit and
RDP mirrors the oneness of the Region III stakeholders to pursue sustainable
REMIGIO A. MERCADO
Regional Director

TABLE�OF�CONTENTS�
RegionalDevelopmentCouncilResolutionNo.03-01-2011 MessageofPresidentBenignoS.AquinoIII
MessageofNEDASecretaryCayetanoW.PaderangaJr.MessageofRDCChairmanOscarS.RodriguezForewordofNEDARegionalDirectorRemigioA.Mercado
Chapter1 Introduction 1-3Chapter2 DevelopmentChallenges 4-22Chapter3 OurDesiredFuture 23-35Chapter4 PriorityProgramsandProjects 36-48Chapter5 MonitoringPlanImplementation 49-50Annex1 ThePlanningEnvironment 51-84

List�of�Tables�
�
Table�1.��
CL-RDP�Indicators� 50�
Table�2.��
GRDP/GVA�Actual�Growth�Rates�vs�Plan�Targets,�Central�Luzon�Region,�2004-2009��
55�
Table�3.��
Inflation�Rate�by�Major�Commodity�Group,�Central�Luzon�Region,�2004-2009� 56�
Table�4.� Household�Population�15�Years�Old�and�Over�by,�Employment�Status:�Central�Luzon:�2006-2009��
57�
Table�5.� Profile�of�Local�and�Overseas�Filipino�Domestic�Workers,��
57�
Table�6.� Number�of�Employed�by�Industry�Central�Luzon:�2008-2009��
58�
Table�7.� Human�Development�Index�by�Province:�Philippines�and�Central�Luzon�1994,�1997�and�2000��
59�
Table�8.� Basic�and�Functional�Literacy�Rates:�Central�Luzon�1989,�1994,�2003��
60�
Table�9�� National�Achievement�Test�Results�(%):�Central�Luzon��
61�
Table�10.� Vulnerable�Sectors�in�Central�Luzon,�2009��
63�
Table�11.� Road�Density,�Philippines�and�Central�Luzon,�As�of�End�2008��
68�
Table�12.� List�of�Airport,�Region�III�as�of�end�2009��
70�
Table�13.� Existing�Power�Plants�in�Central�Luzon��
71�
� � � � � � � � �
� � � � � � �
� � � � � � �� � �� � ��� � � � � ��� � � �������������� � � � � � � � � �

� � � � � List�of�Figures���Figure�1.� Existing�Flood�Forecasting�&�Warning�System�(FFWS)� �
�20�
Figure�2.� Enhanced�W�Corridor���
�26�
Figure�3.� Satellite�image�of�Central�Luzon�
�51�
Figure�4.� Incidence�of�Poor�Population�(%):�Central�Luzon�
�52�
Figure�5.� GRDP:�Growth�Rates�(%)�Central�Luzon,�1985=100�
�53�
Figure�6.� Road�Development�in�Aurora,�2009� �
�66�
Figure�7.� Section�of�Manila�North�Road�Improvement,�2009�
�66�
Figure�8� Governance�and�Policy�Infrastructure�Framework�
�72�
Figure�9.� IRA�Independency�Ratio,�by�region�Year�2004�to�2007�
�75�
Figure�10� �IRA�Independency�Ratio,�by�province�Year�2004�to�2007� �
�76�
Figure�11.� Capital�Formation�budget�ratio,�by�region�Year�2004�to�2007�
�77�
Figure�12.� Capital�Formation�Budget�Ratio,�by�province� Year�2004�to�2007� �
�78�
Figure�13.� Risk�to�Projected�Rainfall�Change�
�80�
Figure�14.� Risk�to�Typhoons�
�80�
Figure�15.� Impacts�of�global�warming�on�sea�level�rises�
�81�
Figure�16.� High�Risks�to�Typhoons�
�82�

1
Chapter�1:�Introduction� To realize P-Noy's “Social Contract with the People” of Central Luzon (CL), the formulation of the Regional Development Plan (RDP), 2011-2016 emphasized the production of a good document on the region’s direction and priorities for the next six years and the process to be observed to maximize people’s participation. This is intended to ensure that the growth strategies will be realistic in sustaining growth and relevant in making effective poverty reduction strategies in the region. Substantive inputs from the Provinces and the Program/Project beneficiaries were drawn and made part of the Plan.
I. Regional�Development�Agenda�
The Central Luzon 20/20 Vision for 2025 and the Regional Development Agenda (RDA) served as the basic framework in Plan preparation. As crafted, the Vision Statement in the RDA: Central Central Central Central Luzon: A SustainabLuzon: A SustainabLuzon: A SustainabLuzon: A Sustainable and Caring Global Gateway through Publicle and Caring Global Gateway through Publicle and Caring Global Gateway through Publicle and Caring Global Gateway through Public----PrivatePrivatePrivatePrivate----Partnership and Growth for Partnership and Growth for Partnership and Growth for Partnership and Growth for All All All All provided the development directions of the RDP. The Region’s 2025 Vision presupposes that improving the quality of lives of the people of Central Luzon requires concerted efforts among all stakeholders – government (national and local), business sector and civil society in harnessing the region’s potentials for economic growth. The following are the Basic Descriptors of the Vision Statement:
1. A Sustainable and Caring Global GatewayA Sustainable and Caring Global GatewayA Sustainable and Caring Global GatewayA Sustainable and Caring Global Gateway. To be sustainable, the share of the Central Luzon in the Gross Domestic Product (GDP) as measured in its Gross Regional Domestic Product (GRDP) cannot afford to experience “a boom-bust cycle”, much less a consistent downward trend. From 9.5 percent in 1991-2000, the average share of Region III in the GDP went down to 8.8 percent. Its GRDP’s contribution to growth was on a consistent decline, from 12.3 percent in 1981-1990 to 7.9 percent in 1991-2000, it dove further to 6.7 percent in 2001-2006. The RDP must identify the determinants and their interrelations that slow down its growth and pull down Region III’s share in the national output. It will determine the most critical and ease them to boost performance and unleash the region’s potentials for the better. To sustain consistent output increase, measures to reduce the adverse effects of disasters and enable the region to adapt to climate change shall be consciously pursued.
On the other hand, a Caring Global Gateway means that the marginalized and the vulnerable will be accorded access to adequate social protection and safety nets amidst the opening of the region to world commerce because of the presence of the airport and seaport facilities in the special economic and free port zones and their connectivity to the region’s improved road network system.
2. PublicPublicPublicPublic----PrivatePrivatePrivatePrivate----PartnershipPartnershipPartnershipPartnership. Public-Private-Partnership (PPP) is the principal means to
facilitate attainment of the Sustainable and Caring Global Gateway. The region shall harness the benefits of the very high trust rating for P-Noy from all sectors of society particularly the business community. Legislation is the primary instrument to exploit this opportunity. However, the region’s strong relationship and the synergy it developed with the business community and civil society organizations shall be continuously adopted as a cross-cutting strategy in the pursuit of regional growth.

2
Public-Private-Partnership shall be aggressively promoted in areas where the current fiscal situation will not warrant national government funding support. Investments in infrastructures particularly transport and electric power shall be promoted as top priority for the contractual arrangements.
3. Growth for AllGrowth for AllGrowth for AllGrowth for All. The directions that will guide and the interventions that will implement the
RDP must be crafted in such a manner that “no one shall be left behind”. While a high private investment level is expected to boost opportunities for productive employment and income growth, it does not however guarantee income equality among population groups. Thus, specific interventions to address inequality of access to health, education and other social services and to productive assets will form part of the Plan’s poverty reduction strategies.
Gains from income growth, improved capital investments and poverty reduction programs will all be negated unless governance concerns are addressed. Hence, measures to address corruption, weak rule of law and public institutions and deficient policies shall take a dominant position in the Plan.
II. Schedule�of�RDP�Preparation
To enable local development planning efforts to catch up with the Medium-Term Philippine Development Plan (MTPDP) preparation, a work schedule for the preparation of the RDP was adopted and followed. This helped ensure that priority regional and local needs are reflected in the national plan.
III. Priority�Sectoral/Sub-Sectoral�Issue�Matrix� In addition to the consultations that were conducted with National Government Agencies (NGAs) and the private sector partners to draw inputs to RDP preparation, a Priority Sectoral/Sub-Sectoral Issue Matrix (P-SIM) was prepared, disseminated and consolidated by NEDA-3 to facilitate input generation from various stakeholders (see attached Annex “A”). The P-SIM consisted of five columns to be filled by development partners, as follows:
1. Sectoral/SubSectoral/SubSectoral/SubSectoral/Sub----Sectoral Issue/ConcernSectoral Issue/ConcernSectoral Issue/ConcernSectoral Issue/Concern. . . . Identifies the problem being addressed by the agency as part of its legal mandate as shown by comparison of statistics/ benchmarking of indicators, surveys, insights from in-depth case studies and analysis.
2. Brief Description of the Issue/ConcernBrief Description of the Issue/ConcernBrief Description of the Issue/ConcernBrief Description of the Issue/Concern.... Discusses why the issue or concern is a problem to include its determinants or factors that make up as causes. It may also include the location where such problem is being observed or experienced.
3. Existing Agency Program or ProjectExisting Agency Program or ProjectExisting Agency Program or ProjectExisting Agency Program or Project. . . . The title of the Program or Project implemented by the concerned agency to address the issue or concern.
4. Assessment of Effect or ImpactAssessment of Effect or ImpactAssessment of Effect or ImpactAssessment of Effect or Impact. Effect refers to the rate to be given which in this case is in a scale of Low, Medium or High depending on the benefits immediately generated for the target beneficiaries such as number, areas covered, problems solved, other projects enhanced, etc. Impact refers to the long-term change as evidenced by Outcome Indicators.
5. Implementation ProblemsImplementation ProblemsImplementation ProblemsImplementation Problems. . . . Advances reasons why the pre-identified objectives of the Program or Project have not been attained to include factors within and outside the control of the implementing agency such as policy/legislation gaps.

3
IV. Report�Structure
The main report of CL-RDP 2011-2016 consists of five chapters and several annexes. The first chapter sets out the rationale, process and inputs generated in crafting the substantive content. The second chapter summarizes the development issues and concerns and challenges that impinge the socio-economic development of the region. It likewise introduces the possible implications of these challenges and issues on the overall development pace while identifying key factors that can facilitate the search for answers to the former.
The third chapter outlines the priority development directions through a discussion of the
horizontal linkages of the proposed major projects to the development objectives, strategies and goals. The chapter opens up with a description of the preferred long term scenario for the region followed by its implication or translation on the physical conditions through the long term spatial strategy.
The fourth chapter translates the development objectives into more operational terms
through development programs and projects which shall be funded through the regular budgeting process of the national government and its instrumentalities complemented by local government financing.
The last chapter discusses the main implementation mechanisms including proposed
policies and procedures for investment prioritization and fund sourcing approaches. It also presents a monitoring plan that provides the instruments and processes for information gathering processing and decision-making.

4
Chapter�2:� Development�Challenges�
I. Introduction�
A diagnosis of the current situation of the population, economy, physical resources of CL and its contribution to the national output has surfaced critical development challenges that constrained the region’s otherwise stronger potentials and more promising opportunities for faster growth. Determinants of the constraints were identified through consultations with different stakeholders. The detailed analysis of the planning environment is presented in Annex 1.
II. Development�Challenges��
A.A.A.A. High and Sustained High and Sustained High and Sustained High and Sustained GrowthGrowthGrowthGrowth. . . . From 1993 to 2009, while Central Luzon maintained its
position as the number three largest contributor to the national output, its contribution was
notably on a consistent decline, from a high of 9.94 percent to a low of 8.1 percent.
Sustaining and increasing growth is crucially important as a challenge for the region in view
of the need for the national economy to be elevated to a higher growth plane to catch up with
its Southeast and East Asian neighbors.
B.B.B.B. “Inclusive Gr“Inclusive Gr“Inclusive Gr“Inclusive Growth”owth”owth”owth” as a key philosophy of the Philippine Development Plan (PDP) implies Non-Discrimination which is a core principle of Human Rights. Non-discrimination denotes equalization of social and economic forces so that those who are economically deprived may at least be given opportunities to grow. For purposes of regional development planning and policy reform, this means that those who are “left behind” must be given opportunities to be drawn back to the development cycle by hauling them out of the financial difficulty. This situation continually impairs and nullifies their capacity to contribute to long-term investment intended to address disparity in infrastructures sought after by prospective investors and accord easy access to basic social services and safeguards for the most at risks of having their human rights violated amidst a tight local fiscal situation. A glaring challenge that faces the region’s development stakeholders to achieve “inclusive growth” is how to mainstream the numerous indigenous peoples residing in the region, from the mountain areas of Zambales, Aurora, Tarlac, Bulacan and Pampanga to the coasts of Zambales and Aurora. Our rural agricultural and fishing families are also sectors that need to be considered in our search for “inclusive growth”.
C.C.C.C. Improving IntraImproving IntraImproving IntraImproving Intra---- and Interand Interand Interand Inter----Regional Circulation and the land transportation access to the Regional Circulation and the land transportation access to the Regional Circulation and the land transportation access to the Regional Circulation and the land transportation access to the east and west coasts of the regioneast and west coasts of the regioneast and west coasts of the regioneast and west coasts of the region. In the midst of the accomplishments on transportation infrastructures mentioned in Annex 1 there is still much work to be done. The region still needs to pursue the implementation of capital investment projects strategic and critical to stimulate, accelerate and sustain economic growth. Projects will address blockades along national highways, roads and bridges that lead to major tourist destinations and underdeveloped areas, flood control and drainage facilities that will mitigate flooding including improvement of conflict-affected areas that promote development and resolve peace and order problems. The North Luzon Expressway (NLEX) has become the fastest link of the different industrial estates in Bulacan for their supply and export requirements. The locators of the different ecozones and industrial estates in Bataan, in addition to their own port facilities, may also

5
access the facilities in Clark and Subic through the Roman Highway. All other industrial estates in Central Luzon may benefit once the key arterial road networks of the region are improved, expanded, or rehabilitated. The region supports the integrated management of the port facilities of Subic and airport in Clark. The region shall also endeavor to provide cheaper alternative land routes by improving the levels of service of existing road sections running parallel to the North Luzon Expressway or operation of railway services. Physically connecting the eastern coasts and western coasts to the central corridor shall be given emphasis. This includes opening and construction of new road sections along the east-west corridor especially the Zambales-Tarlac and Nueva Ecija-Aurora connections. Rehabilitation and improvement of existing road sections shall precede new construction especially in areas adjacent to the central corridor. Rehabilitation and improvement of farm-to-market roads and improvement of rural-urban road connections are expected to support or catalyze productivity improvements in the agriculture sector through lesser production costs. In the same manner, improving the levels of services of inter-regional roads shall strengthen the region’s role of being a catchment area of raw materials where processing activities can be economically located. The region’s port system shall be improved in accordance with the national government priorities in “Strong Republic Nautical Highway”. An exemption shall be the conscious effort to develop Dingalan as an International Port of Entry. The establishment of a reliable network of airports between key tourist destinations (Zambales and Aurora) with Clark Airport as regional hub shall be pursued. It must be emphasized that the development of all the transport modes in the region shall be consistently guided by the principle of “seamlessness”, all development interventions shall consider inter-modal connections. Eight percent or 181 of the total 2,169 kilometers of national roads in Region 3 remain unpaved. Eight national bridges are still bailey or timber waiting to be made permanent. Of the 534 cases of road traffic accidents reported in the region, 71 or a little more than 13 percent are attributed to road defects.
D.D.D.D. Strengthening Strengthening Strengthening Strengthening MMMMSMEsSMEsSMEsSMEs. From a largely agri-based economy, Central Luzon has evolved over the years to a region now anchored on services and industry. Influencing this transformation is the conversion of the former U.S. military bases located in the region to Special Economic Zones that had as a result inducing industrial and urban growth, and the region’s proximity to Metro Manila which had the region serving as spill over catchment to Metro Manila’s population. Subsequent to these developments, Central Luzon emerged as one of the country’s major economic contributors, ranking third to NCR and CALABARZON in share to the national output. Central Luzon still has a lot of room to grow, what with existing available space in the
ecozones dotting the region and the ample supply of trainable labor. But as the same

6
condition may be said of other regions here and abroad, this makes it imperative for the
region to continuously endeavour to make itself a cut above the rest or enhance its
competitive edge. This calls for the region to rise up to the following challenges and address
these in order that it may continue to move forward and allow its people to enjoy the fruits of
a thriving economy. This includes strengthening the region’s Micro, Small and Medium
Enterprises (MSMEs) which form bulk of the region’s industry and service sectors base.
Difficulties in accessing financial assistance packages resulting from high interest rates and stringent collateral requirements deter the rapid development of our MSMEs. This is compounded by inadequacies in product design, development and packaging efforts, high cost of doing business due to corruption and red tape, unreliable and expensive power supply, and freight costs. The Information and Communication Technology (ICT) sub-sector specifically is faced with inadequate supply of English-proficient manpower. Raising the level of competitiveness of Central Luzon MSMEs especially on the quality of MSME products is a must. Products must conform to international standards so that focus should not only be on the domestic market but on penetrating the export market. Other concerns hounding the MSMEs in the region are summarized below:
1. Lingering mismatch of labor supply and demand. The skills and level of proficiency of
available labor do not meet the standards or requirement of industries. Priority attention
should therefore be given to capability building or human resource development in these
areas especially for targeted industries.
2. Streamlining of business permit and licensing procedure and harmonizing documentary
requirements. One-Stop-Shops have been established in some areas and the processing
time for business permit and license (BPL) applications were cut substantially. The long
list of requirements for BPL applications remains, however, a concern among investors,
and therefore ways of improving this must continue to be an objective for facilitating
investment.
3. Promotion of backward and forward linkages of industries. This is to ensure
sustainability of industries in the production chain by linking the sources of inputs to
output markets. Such linkage at the moment is deemed needing more bridging effort or
assistance.
4. Reducing the cost of doing business to increase competitiveness of industries.
5. Harmonizing policies and defining incentives for promoting investments in the region.
LGUs do not have investment codes that would guide investment promotion and regulate
the conduct of business.
6. Consolidating or coordinating support services for business promotion. There is need to
coordinate assistance dispersed to the various agencies to facilitate provision of these
especially to industry winners and help push for their growth.
7. Entry of cheap imported goods erodes MSMEs’ business confidence level especially of
start-ups.

7
E.E.E.E. IncreIncreIncreIncreasing Agriculture Productivity and Farming Family Incomes and Attaining Rice asing Agriculture Productivity and Farming Family Incomes and Attaining Rice asing Agriculture Productivity and Farming Family Incomes and Attaining Rice asing Agriculture Productivity and Farming Family Incomes and Attaining Rice Sufficiency and Food Security.Sufficiency and Food Security.Sufficiency and Food Security.Sufficiency and Food Security. As a major producer of food items especially rice, fishes, fruits, vegetables, poultry and swine, Central Luzon enjoys a comparative advantage that is further boosted by its proximity to large domestic markets and easy access to international markets. Thus, it is incumbent on the region to produce these food items at higher efficiencies and qualities to be able to compete both in the domestic market against imported primary products and in the international market against local products and other imported items. In the domestic front, priority shall be accorded to untangling obstacles to make food cheap and plentiful. This is especially true for rice whereby increasing production is imperative to keep at pace with the increasing local demand due to increasing population amidst decreasing production areas due to conversion to other uses.
The region faces declining productivity or below national average productivity for some of its
agricultural products where it plays a major role. Palay productivity is well above the national
average but is shown to decline from 2007. Where the threat of conversion is palpable, not
to mention low farm income, improving and sustaining a high level of productivity is critical to
ensuring food security and sufficiency, competitiveness of agricultural products and
enhancing farm income.
The extent of prime lands available for agricultural production is slowly decreasing due to pressures of conversion into other higher value activities such as urban or industrial development. The pressure is even higher in the central plains where the infrastructures are developed. Landowners and farmer-beneficiaries alike succumb to tempting offers of real estate developers to acquire the former’s properties for conversion. The extent of lahar-affected areas that remains unused almost 20 years after Mt. Pinatubo’s eruption adds to the sector’s dilemma. The sector still reels from high cost of production and low farm prices because of poor or lack
of access to markets. The challenge thus is on reducing the cost of production, strengthening
farmers’ organizations and improving marketing efficiency and access, for farmers to get the
optimum possible return from their investment. Demand is still high for support
infrastructure to agriculture such as farm-to-market roads, post-harvest and storage facilities,
irrigation facilities, transportation, and food terminals. Among the needed post-harvest
facilities are dryers, warehouses, cold storages and world-class sanitary abattoirs.
Post-harvest practices and facilities continue to be inadequate contributing to high losses in handling and processing. Although Central Luzon is the rice bowl of the country, there is still widespread practice of sun-drying on concrete pavements and roads resulting in low quality milled rice and spillage losses. For high value fruits and vegetables, the diversification program has been constrained by the inability of packaging and handling technologies to keep pace with market demands. Mangoes, for example, are still transported in traditional bamboo or reed baskets (kaings) which result to in-transit damages like fruit skin bruising. The Department of Science and Technology (DOST) has been very active in adapting packaging technologies especially for mangoes but this has yet to receive popular support because of the additional investment it requires.

8
With the exception of the swine industry, agriculture output is realized from the sale of raw and primary products. This leaves the farmers vulnerable to depressed prices during surplus production events (bumper harvests). A zero-waste approach to agriculture that involves processing into secondary and final consumer products could provide alternative income streams and provide off-farm employment opportunities. The need to increase value-adding for agricultural products through processing and upgrading from micro-level production to commercial scale has been felt for quite a time. The latter is to seize opportunity for export and increasing income. For example, although Aurora is a net palay exporter, milled rice is relatively more expensive since post harvest facilities are wanting in the province. They have to buy milled rice from outside the province. The mango producers of Zambales and Bataan easily fall prey to traders especially during production gluts due to the absence of post-harvest processing activities in the area and the non-availability of technology to lengthen mango shelf life. The same is true for the onion growers in Nueva Ecija, who have limited access to storage facilities. Compounding the problem of onion growers is smuggling and importation of onions at a time when Nueva Ecija farmers are harvesting their onions, and unavailability of locally produced onion seeds. Most farming families experience a dearth in sources of additional income generating activities especially after planting. For coconut farmers in Aurora and mango producers of Zambales and Bataan, onion growers of Nueva Ecija, rice farmers and fishpond operators of Bulacan and Pampanga, the long idle periods between harvests can be used for other more productive activities but they need technical, marketing and financial assistance.
Enhancing the quality of our agricultural products to meet export-quality standards remains a
standing challenge. The region’s mango industry for instance requires packing houses and
Extended Water Treatment Facility which are needed for prolonging product shelf-life and
ensuring that products conform to phytosanitary standards as required for export products.
The opportunities offered by the international demand for higher value-added fishery products have not been exploited by Central Luzon’s fish farmers. Most of them produce fish to meet local demands yet fall prey to low farm gate prices especially during production gluts. The profitability of going into production for the international market and other high-end users was proven time and again by a very few producers. For instance, although the region is a major producer of tilapia, the product is unable to meet the size requirements of hotels and restaurants. Thus, the Philippines is a net importer of fish fillet although the quality and taste of tilapia can easily surpass those of the imported fillets. Productivity improvements in the fishery subsector may be achieved by extending assistance to our small and medium fish-farmers in improving their production processes and increasing their access to processing centers for their products to be globally competitive. In contrast, the forestry subsector is hounded by low value adding activities among the major players in the logging industry. There are very limited value-adding activities performed within the region for logs harvested especially from the Sierra Madres. On the other hand, our wood-based furniture industry has gained national and international acknowledgement for superior craftsmanship. The latter, however, is being faced with problems on availability of raw materials to sustain their production. In contrast, the big logging companies are continuously harvesting logs and exporting (outside the region) lumber and other low value-added products.
9
With globalization just around the corner, CL’s agricultural production systems have yet to reach efficiency levels that may be comparable to neighboring countries. Costs of production per unit of output need to be competitive in order to sustain production and provide livelihood to the rural households. Cheaper substitute imports can easily replace major commodities and, therefore, threaten inefficient systems. Through the identification and delineation of Strategic Agriculture and Fishery Development Zones (SAFDZ), it was hoped that farmers shall be encouraged to shift to more globally competitive crop production systems. Efforts by the Department of Agriculture (DA) through the Bureau of Soils and Water Management (BSWM), crop suitability information have become available for some years now. However, internal resources and constraints posed by the devolution of the agricultural extension function limit its capabilities to make this information readily and directly available to farmers. Information borne out of researches by State Universities and Colleges (SUCs) and other research institutions in the region need to reach and benefit the farmers.
The extensive land resources of Central Luzon that are highly suitable for high value crops have yet to be fully harnessed. It is sad to note that farmers in the region stick to their time-tested production systems. Only a select few (especially those who are within the radius of influence of research centers) dare venture into new systems that recognize the region’s comparative advantages that can be used to respond to the demands of emerging domestic and international markets. For example, the region’s corn production is a measly 143,000 metric tons, way below the requirement of the poultry and livestock industry. Yet the Bureau of Soils and Water Management (BSWM) shows that there are extensive areas in the region, especially in the western and eastern parts, that are technically and financially viable for corn production but are presently planted to other low value traditional crops. The need to increase production areas for corn to support the region’s livestock and poultry
industry cannot be overemphasized. Though the region is the center of swine and poultry
production and maintains a good concentration of feed mills, bulk of the corn requirement of
the said industries are imported from other regions and sources outside the country. This
situation had thus led these industries to suffer from high production cost.
Growing demand for small ruminants (goat and sheep) meat and other derivative products
has been noted. Though the Central Luzon State University(CLSU’s) Small Ruminant Center
has developed and perfected technologies for the production of goat, supply has remain
limited and unable to meet expanding demand for goat meat.
Disease control is critical to the livestock and poultry sector in so much as the region
provides for a significant share of the country’s meat and poultry supply. DA reports the
region is now Foot-and-Mouth-Disease (FMD)-free but with vaccination. Despite this positive
development, the region continues to contend with other disease outbreaks. This hence calls
for efforts at intensifying disease control and ensuring that we meet and keep up to
standards, to sustain growth of the sector and the region’s meat processing industry, as well
as expand our market reach.
Industrial and urban crawl is slowly eroding the areas for livestock and poultry production.
Sustaining the growth of these sectors and maintaining the position of the region as a major
10
producer hence requires that the industry is allotted adequate land and protected from
encroachment from human settlement and industries.
Pollution of our water bodies, deterioration of coastal and marine ecosystems and poor
management of fishing operations are threatening to undercut fish production. Rehabilitation
of the region’s coastal and inland water bodies, pollution control and increased monitoring
and extension to promote better management are deemed therefore crucial and must be
given focus if the region were to see the sustainability of its fish industry.
With increasing variation in climate pattern and the region’s high vulnerability to weather
disturbances, Research and Development (R&D) on Climate Change Adaptation (CCA) is
crucial to enabling the region cope with or mitigate the impact of climate change. This is
particularly important especially as the region shares the largest in the country’s staple and
therefore is critical in ensuring the stability of the country’s rice production.
Saline water intrusion in certain rice production areas in the region, such as in Pampanga,
Bulacan and Bataan, covering about seven thousand hectares is undermining rice farming
and productivity in these areas. The challenge is in converting these areas to alternative
productive uses. One alternative according to the Bureau of Fisheries and Aquatic Resources
(BFAR) is the conversion of these once productive rice lands to fishponds for growing saline
tilapia.
Small volumes of production of each of so many farmers limit their access to external markets even with price information provided by the DA. Economies of scale and the perishable nature of agricultural commodities dictate a need to consolidate them at the least time. Facilitating the consolidation through common service facilities and a more efficient market exchange system shall contribute to improved productivities. One way to effect
consolidation is strengthening farmers’ organizations and encouraging farmers to work collectively to seize opportunities for reducing production cost and increasing access to markets. Backward and forward linkages are better promoted when farmers are organized and work collectively. Integration increases productivity and maximizes return to investment in agricultural production. Farm diversification cushions small farmers from price fluctuations and economic shocks particularly those brought about by extreme weather and temperature changes. Other issues that have been repeatedly raised as causes of agricultural underdevelopment of Central Luzon include: (1) poor management of water resources; (2) poor access to technologies; (3) high transport costs; (4) supply inadequacies of certified and good seeds; and, (5) unexplored alternative products and opportunities.
F.F.F.F. Attracting more Tourists.Attracting more Tourists.Attracting more Tourists.Attracting more Tourists. Central Luzon enjoys certain advantages that present opportunities for developing tourism. For one, Region III is the gateway to Northern Luzon, a more popular tourist destination. As a gateway, people pass through the region, giving way to people-region encounter and the opportunity for raising awareness and interest on what the region has to offer. The natural or geographic make-up of the region, characterized by a mix of coastal, lowland and upland, favors diversity of attractions and, therefore, a variety of tourism markets. The region’s proximity to Metro Manila is also a plus factor as it offers a convenient reprieve for a huge local market seeking short-duration rest and recreation. Add to these

11
pluses are the region’s infrastructure such as airports, sea port, and road network. With these existing, the region has a lot more opportunity to attract or invite tourists.
Yet, the same advantages would not matter much if there are no attractions – of the right
quality and quantity – to speak of. The region, in this case, would continue to be just a stop-
over or a jump-off point to other destinations. Such appears to be the case as the region,
though showing uptrend in visitor arrival, still lags in the list of favored destinations in the
country. This means that the region is unable to capture the potential market size or value
that the said elements mentioned for attracting tourists could generate.
Several factors, according to industry stakeholders, are locking up the opportunities that
could push industry growth further up. The challenges as listed below range from institutional
gaps, underinvestment in tourism, weak marketing, to lack of a sense of tourism culture and
synergy in tourism promotion and development:
1. Fragmented or disjointed tourism promotion, activities and attractions. There’s no
program that would tie up the various destinations or attractions. Efforts at attracting
visitors/tourists are localized or location or LGU- specific. This tends to limit the choices
of tourists in terms of places to visit or attractions to enjoy.
2. Lack of packaged tourism attractions resulting in tourism operators focusing on
outbound market promotion.
3. Preserving integrity of the environment or environmental quality not integral to tourism
development. Efforts at tourism promotion weakly involve enhancing the adjoining or
surrounding environment. Again, focus is on attraction-specific development than on
holistic management.
4. Increasing capacity to meet demand for large conventions. The facilities in the region,
even at Clark and Subic, prevent the region from accommodating large conventions,
which is showing good demand.
5. Outside of Clark and Subic, in recent years, investments in beach resorts have increased
along the China Sea coastline (from Bataan to Iba) and in the Pacific coastline (Dingalan,
Baler and Dinalungan of Aurora) but a considerable number of the facilities that have
been put up are below tourist standards. The owners have expressed their need for
financial assistance packages to improve their facilities. Tourist spots are either
inadequate or in poor condition. The latter manages to attract only the local market.
6. Inadequate transport system or services designed for tourists and high transport cost.
Where there are vehicles, transport fares are not standard and are exorbitant.
7. Lack of a definitive market position or brand with which to identify Central Luzon
tourism. Industry stakeholders posit that it would help the region better promote itself if it
carries a brand that would project a good image of the region.
8. Limited air seat capacity of international flights at the Diosdado Macapagal International
Airport (DMIA).

12
9. The region, Clark in particular, as just a jump off point, indicates the need to enhance
the overall look and impression of Central Luzon that will elevate it from being just a
gateway to an inviting tourism destination.
10. Need for visitor information and assistance centers in tourism areas to help guide/assist
tourists in moving around the region.
11. Need to enhance quality of attractions and security in destinations.
12. Inculcating the culture of tourism that would have all stakeholders participating and
contributing to promoting tourism in the region.
13. Weak local government capacity for tourism promotion and development thus rendering
local tourism potentials largely untapped.
G.G.G.G. InInInIncreasingcreasingcreasingcreasing Housing Units. Housing Units. Housing Units. Housing Units. The Housing and Urban Development Coordinating Council
(HUDCC) estimated that almost half a million (461,368) housing units are needed to fill in
the cumulated shortage of decent housing in the region from 2005-2010. The problem is
made more urgent by the location of a sizeable chunk of these families along easement of
river banks and other waterways and on the mountain slopes constantly at risk of being
wiped away by flood water and buried by massive soil downpour from landslides.
H.H.H.H. The assessment of the GGGGovernance, overnance, overnance, overnance, PPPPolicy and olicy and olicy and olicy and IIIInstitution nstitution nstitution nstitution highlighted the following development challenges that hold off the capacity of the region to move and accelerate growth and translate beneficiaries of social services and programs as active participants of regional development: 1) Lack of Growth-Stimulating and Efficient Operating Activities; 2) Lack of Substantive Insights from the Mandated Review of the Local Government Code (LGC); 3)Weak Support of Regional Line Agencies (RLAs) to RDC-Identified Priority PPAs; 4) Lack of Formal Mechanism at the Regional Level on How Financially Incapable LGUs can address resource constraints in the implementation of their Priority Programs/Projects; 5) Absence of Administrative Sanctions for non-compliance with R.A. 9184; 6) Small Value attached to the Code of Ethical Standards for Government Employees; 7) Lack of a common regional standard for business permit processing; and, 8) Lack of unified regional crime prevention.
1. Lack of Growth-Stimulating and Efficient Operating Activities. It may be gleaned from the
foregoing that although degrees vary, areas with high Internal Revenue Allotment (IRA) Independency ratios have relatively higher budget that they can mobilize for capital investment projects. For Region III, to have more funds available for capital formation and create longer reach for the vulnerable, a review of the current operating processes must be conducted to make regional operations more efficient.
An interface of IRA Independency Ratios and investible funds for capital formation will indicate that while Regions CAR, 2 and 7 had lower IRA Independency Ratios in 2004, they got higher percentage ratios for their budget available for capital investment. In 2005, Bicol Region was added to the other three regions which while having lower IRA Independency Ratios had higher investible fund for capital formation. Eight other regions followed suit in 2006. This number was reduced to five in 2007.

13
Using Region III as benchmark, the number of regions having higher IRA Independency Ratios namely Regions I, III, NCR and IV did not change. This means that the gap between IRA and Own-Source-Revenues (OSRs) is so wide that in four years their number and composition did not change altogether. Despite this phenomenon, the number of provinces having financial capacity to invest in capital formation changed. This means that as far as having more funds for capital investment, improved operational efficiency highly matters. The inability to come out from IRA dependence is noticeable also across the region. Using Region III IRA Independency Ratio of 32.49 percent as reference, five out of the seven provinces of Central Luzon fell short of the standard mark for the period 2004-2007. Thus, if assistance is not forthcoming as in the case of Aurora’s relatively inability to fund its capital investment projects, the general observation nationwide and regionwide for regions and provinces to graduate from IRA dependency appeared even more difficult.
Hence, bail-out measures need to be adopted and implemented in this regard. To effect, sustain and accelerate growth, economic activities must be deliberately pursued to ensure not only efficiency in operations but also higher investments for capital formation.
2. Lack of Substantive Insights from the Mandated Review of the LGC. Entitlement to IRA
and their amounts are provided for under the LGC. Their entitlement cannot be challenged even by executive fiat because by law their releases are deemed automatic. But while the share of the LGUs in the national wealth is facilitative of local development efforts in this respect, its relevance must be subject of continuing review.
Used as criteria in IRA determination under the LGC are population level, land area and equal sharing. The formula falls short of considering other factors which could serve as vital inputs to making IRA responsive and relevant to changing local development requirements after twenty years from implementation of LGC such as the impact of the unique geographic characteristics of an area, the dynamics of the population primarily their attitude and capacity to change, the values of local government officials such as their appreciation of geographically inter-locking growth and development concerns which could have been vital inputs to the mandatory review of the LGC. Section 521 of the LGC clearly provides for its mandatory review every five years as minimum.
3. Weak Support of Regional Line Agencies (RLAs) to RDC-Identified Priority PPAs. The Regional Development Council (RDC) is supposedly the forum whereby the Regional Development Plan (RDP) is coordinated, harmonized, synchronized and integrated. Ideally, the RDP must be a reflection of various interests, the implementation process of which a full-proof measure at ensuring the realization by the claimholders of their entitlements to public goods, resources and institutions necessary for a life of dignity.
Past experiences and the prevailing practice at RDC III are symptomatic not only of the lack of transparency as to how region-based priority programs and projects, their identification and targeting are being undertaken at the national level and their ultimate translation into agency budgets. The continuing lack of transparency in the system is constantly subjecting the most vulnerable persons and geographic areas to being “left out”. This is not in harmony with the right to information principle being espoused by the P-Noy Administration. It is not consistent with the non-discriminatory quality of the “inclusive growth” of the MTPDP.

14
Anecdotal incidents point to LGU priority programs and projects being passed on to legislators for “chance funding”. After almost two decades of decentralization, regional counterparts of national government agencies continue to function more as extensions of their central offices and less as representatives of LGUs trying to reach out to central government through the RDC for budgetary support.
Worse, craving for budgetary support from elsewhere has actually been perpetuating a history of institutional dysfunctionalism and myopia towards local governance concerns and an attitude of indifference towards the more organized and systemic development planning. In view of the lack of attribution on the difference that development planning could make on people’s lives, what should have been an effective window for making people and communities realize as a critical factor for effective local leadership is continuously being wasted and rendered meaningless. A clear opportunity for making one vital criterion in the selection of good local leaders is being lost.
4. Lack of Formal Mechanism at the Regional Level on How Financially Incapable LGUs can address resource constraints in the implementation of their Priority Programs/Projects. Totally leaving the impediments to growth to the relatively financially incapable LGUs and those with relatively poor geographic conditions starts with non-recognition of their incapacity to fend for themselves. Continuing disregard of this problem practically leaves them at the mercy of national government agencies and legislators for budgetary support.
Loans are not a viable option not only because of the stringent requirements for eligibility but also the high social costs should they become unable to repay. Sovereign guarantees are an indispensable requirement for Official Development Assistance (ODA). LGUs that will likely benefit from these guarantees are those financially capable.
Build-Operate-Transfer (BOT) is likewise not a viable option because private investors would naturally look for good infrastructure, reliable market, and predictable tax policies the implementation of which would again have irreversible cost to local constituencies. Past attempts at vertical haul-out has been questioned because of the perceived potential risks from serving as disincentive to better economic performers. The high cost to poor economic performers is manifested in slow growth and increasing incidence of poverty, which undoubtedly has wide-ranging implications on the country as a whole.
5. Absence of Administrative Sanctions for non-compliance with R.A. 9184 “Government
Procurement Return Act”. In addition to the reported collusion in the qualification of winning bidders, which by its nature is hard if not impossible to prove, anecdotal incidents of leakages in the procurement of supplies, contractors and consultants time and again surface. Transparent processes abound in the law. However, non-compliance therewith entails no administrative sanctions to parties to the transactions, hence better judgment would be to just ignore and be beyond its scope.
6. Small Value attached to the Code of Ethical Standards for Government Employees. Republic Act No. 6713 provides for the obligation of every permanent employee of government to submit his/her Statement of Assets, Liabilities and Net Worth (SALN) every year. It is an efficient way of noting wide variations in Net Worth of those working in government. Unexplained disproportionate increases in Net Worth are good subjects of criminal investigation. Accomplishing SALNS has ceased being a solemn and formal duty attached to the public office. Its value sometimes is reduced to a mechanical act
15
subject for experts to work on ingeniously for the purpose of evading possible investigation.
While accusations at manipulating SALN would subject the accuser to stigma and social humiliation, there is no body or entity in the region to whom to go to for recourse should reports at “remedying” the numbers being placed at the SALN are known. Although the prevailing rule is that the burden of proof lies on the government officials who accomplish and execute the SALN, the opposite appears to be what is happening. This norm leaves those guilty of wrong doing literally untouched. This continuing mockery of the Human Rights Principle of Rule of Law is still prevalent despite the enactment of a related law, Republic Act No. 1379 or the Law on Forfeiture of Ill-Gotten Wealth.
7. Lack of a common regional standard for business permit processing. The fiscal autonomy accorded to LGUs is manifested even in areas where uniformity should be observed if the region is to be promoted as a common investor destination area. Variations in business processing caused by the dichotomized performance of the respective mandates of LGUs and NGAs are observed at the local level.
8. Lack of unified regional crime prevention. Crime statistics of the region are suggestive of the wide differences as to how Local Chief Executives (LCEs) in Central Luzon address peace and order, and security concerns. The differences of appreciation and the relative values attached to peace and security as a factor in investment promotion and development by LCEs continue to pose as a challenge to the region. The nature of linkage and coordination between the different national law-enforcement agencies such as the Philippine National Police (PNP), Armed Forces of the Philippines (AFP), and the National Bureau of Investigation (NBI) and the LGUs impacts on the real nature of this development challenge.
I. Complementation of Ecozones and MSMEs for Investment Expansion and Job Creation. Complementation of Ecozones and MSMEs for Investment Expansion and Job Creation. Complementation of Ecozones and MSMEs for Investment Expansion and Job Creation. Complementation of Ecozones and MSMEs for Investment Expansion and Job Creation.
The region is host to an extensive network of special economic zones and Freeport areas yet
large tracts of lands within the proclaimed areas remain unoccupied and unproductive. The
marching challenge is how to make these employment generators live up to their
expectations of being major attractions to investments and job creation. As of 2009, there
are 354,000 jobless persons in Central Luzon. Despite the growing importance of
remittances from Overseas Filipino Workers (OFWs) a size percentage of whom come from
Region III, owing to the negative non-economic externalities that overseas employment
brings to the individual household, focus shall be given to domestic employment.
Constituting the bulk of those domestically employed at almost 60 percent, the Service
Sector is expected to play crucial role. Comparing 2008 and 2009, except for Electricity, Gas
and Water Supply, and Construction, the Service Sector considerably led the increase in the
number of employed persons. MSMEs and the Economic and Freeport Zones must work in
tandem for the domestic employment in-filling. This would require integration and
complementation of Economic and Freeport Zones and local MSMEs for skills re-tooling,
technology upgrading and investment expansion and diversification.
J.J.J.J. Stable Investment Showing in the Economic and Freeport Zones. Stable Investment Showing in the Economic and Freeport Zones. Stable Investment Showing in the Economic and Freeport Zones. Stable Investment Showing in the Economic and Freeport Zones. While continuing, the
dwindling share and erratic behavior of investment inflows within the Subic and the Clark
Special Economic and Freeport Zones are making hard or slowing down the development of

16
the zones into logistics and transshipment hub. This suggests that competition of logistic and
transshipment service facilities around the globe are continually posing stiff competition
coupled with the complete recovery that the world still needs to go through after the
setbacks it suffered from the financial crunch it experienced more than two years ago.
K.K.K.K. Producing Globally Competitive Human Resources and Achieving the Region’sProducing Globally Competitive Human Resources and Achieving the Region’sProducing Globally Competitive Human Resources and Achieving the Region’sProducing Globally Competitive Human Resources and Achieving the Region’s Millennium Millennium Millennium Millennium Development Goals.Development Goals.Development Goals.Development Goals. Realizing Central Luzon’s Millennium Development Goals (MDGs) on education and environmental sustainability by 2015 is a continuing challenge since it is forecast that the targets for universal primary education especially in the elementary education completion rates and environmental sustainability target indicators for Central Luzon may be difficult to attain. The development of a globally competitive human resource base requires preparing and sustaining the fitness of the economically productive population. Such should be founded on improved basic education, improved access to health services, world-oriented higher education and ensuring that their mental baggage is minimal especially those relating to their dependents. Basic education is continuously hounded by low enrolment of school age population and low performance of students in achievement tests. About 90 out of 100 children 6-11 years old and 66 out of 100 children 12-15 years old were enrolled in government elementary and secondary schools respectively. This is compounded by the weak holding power of schools as about 73 out of 100 pupils and 61 out of 100 students completed elementary and secondary levels respectively in SY 2008-2009. The low performance of students in achievement tests is an offshoot of inadequate classrooms with the attendant facilities like desks and tables, computers which are absent in almost all schools, shortage of teachers and textbooks and poor preparation of teacher-graduates. For SY 2010-2011, a total of 1,435 classrooms in the elementary level and 4,190 in the secondary are needed to meet the standard ratio of one classroom for every 45 students. The present classroom student ratio reached as high as 1:166 in one of the elementary schools and 1:293 in one of the secondary schools. Attendant problems are limited school site and ownership problems that are required in the provision of classrooms. Textbook to student ratio ranging from 1:2 to 1:4 in the elementary level and 1:2 to 1:5 at the secondary level was far from ideal. Teacher to student ratio was below the standard reaching as low as 1:405 in one of the elementary schools and 1:368 in one of the secondary schools. The requirement for additional teachers number 692 at the elementary level and 1,461 at the secondary level for SY 2010-2011. Increasing cost of education- related expenses, lack of personal interest and inability to cope with schoolwork are said to be the main causes of children not attending school or dropping-out of school. For higher education, the persistent mismatch of school curriculum with the requirements of industry particularly in Information Technology, Business and Medicine is continually causing the production of potential unemployed. Graduates who fail to meet labor market placement standards because of the mismatch symptomatic of a continuing wastage in precious investment resources and results to foregone income from being unproductive.
The overall health status of the population may be gleaned from some basic health statistics such as infant deaths, prevalence of malnutrition and incidence of water-borne and preventable diseases. A total of seven out of 1,000 live births died before reaching the first

17
year of life in 2003. Moreover, there were still 2,626 births (1.49 %) that were attended by untrained hilots in 2000. About 10.71 percent of total births or 18,831 had weights below the standard of 2.5 kilos. About 10.95 percent of children 0-5 years old had weights below the normal range (underweight) and 3.24 percent had weights above the normal range (overweight). This is the most important stage in the development of children and interventions along this are imperative. The above situation was worse among school children where almost one-fifth (19.69 %) of them were underweight. The spatial distribution of malnutrition among pre-school children by municipality indicates that the problem is more pronounced in the eastern and western parts of the region. Water borne and preventable disease patterns such as diarrhea afflicted 85,477 persons or 990 per 100,000 population and has been the second leading cause of morbidity for years. This is due to the accessibility of potable water to only 87.27 percent of households and sanitary toilet facilities to 86.37 percent. Fully immunized children accounted for only 85 percent of all infants.
The continuing violation of the Ecological Solid Wastes Management Act of 2003 leads to air pollution, water pollution and the clogging of local canals aggravating the flooding problem and its attendant social concerns especially in the urban area.
L.L.L.L. Optimizing Benefits from Mineral Resources.Optimizing Benefits from Mineral Resources.Optimizing Benefits from Mineral Resources.Optimizing Benefits from Mineral Resources. The Philippines is believed to be mineral-rich with an estimated potential mining wealth of US$840 billion. Reports have it that the country ranks among the top ten countries of the world in terms of gold, copper, nickel and chromite. Thus said, the government is driving efforts to push for the development of the country’s mineral resources to tap this vast potential wealth and gain as much as it could in terms of investments and revenues to add to resources necessary for the country’s development. Yet the value of mining is not only in its direct investments and revenues but also in its indirect economic spin off. Mining is said to have a multiplier effect on upstream and downstream industries, which when put together is estimated to have a potential value-added of P300 billion annually. Central Luzon is endowed with both metallic and non-metallic mineral resources that when
tapped in accordance with the provisions of the country’s mining laws could bring about
economic growth. Mining, however, does not only impact the national economy but lends
also to local development as the laws provide for the sharing of the gains from the economic
activity with the host communities , as it also promotes local employment.
To jumpstart investments in the industry, the government identified priority mineral development and exploration projects of which three are in Central Luzon. The latter are Acoje PGE Nickel Project in Sta. Cruz, Candelaria, Zambales, Akle Cement Project in San Ildefonso, Bulacan, and Sta. Cruz Nickel Project also in Sta. Cruz, Zambales. In addition to these three projects, 36 Mineral Production Sharing Agreement (MPSAs) and 15 industrial permits have also been approved and registered in the region.
While it is widely recognized that the development of the industry will create opportunities including jobs, transfer of technology and skills, concerns on environmental damage, benefits not reaching the poor and destruction of aesthetic attractions in mined areas deter full-swing development. Already mining issues involving institutional jurisdiction, process
18
flaws and violation of environmental regulations are felt around the region, and these it must address if mining were to be sustained as a viable industry and for the full benefit of mining to redound to the region’s development. The region must ensure that as much as the potential contribution of mining to the region’s economy is significant, it shall nonetheless pose no cost to life and the environment.
The following specific issues and concerns have been identified by the Mines and Geo-
sciences Bureau (MGB) and other industry stakeholders as besetting the sector and
constraining or threatening to undermine its growth:
1. Conflict in the issuance of small scale mining permits (SSMP) of LGUs that include:
a. issuance of SSMP within Mineral Reservation areas, which is under the
jurisdiction of Department of Environment and Natural Resources (DENR)-
MGB, protected areas, Community-Based Forest Management (CBFM) areas
and other forest lands without securing the necessary permit from the DENR
b. issuance of SSMP within existing nationally approved mining rights that have
resulted in overlapping claims and therefore conflict between large-scale
and small-scale permitees
c. issuance of SSMP without the proper Provincial Mining Regulatory Board
(PMRB) review and endorsement
d. issuance of permits that are not in accordance with prescribed mining
rights: 30-day special mining rights or one year permit to quarry
e. issuance of SSMP without the appropriate Environmental Compliance
Certificate (ECC) issued by the DENR-Environmental Management Bureau
(EMB) and Environmental and Rehabilitation Program as well Social
Development and Management Program (SDMP)
2. Issuance of ECC by the LGU
3. Allowing the transport of mineral ores without the appropriate ore transport permit
(OTP) or issuance of the OTP beyond the maximum allowable volume tonnage limit
4. Use of heavy equipment in SSMP operations, which is not only contrary to law but may
be adverse to the environment
5. Collection of inappropriate taxes and fees (e.g. environmental tax, scholarship fees,
regulatory fees, extraction fees)
6. Non-payment of national taxes particularly excise tax and royalty payments to
indigenous peoples
RA 7942 “Philippine Mining Act of 1995” is clear on the pursuit of responsible and sustainable mining as an avenue for attaining sustainable economic development. But if the industry’s stakeholders do not so much as to comply or remain true to their tasks as
19
provided, then mining would continue to be seen as destructive to humans and the environment rather than as a medium for economic growth. The main challenge is in harmonizing the functions of the concerned national authorities and that of the LGUs even as they play distinct roles. How the stakeholders coordinate may be the key to untangling the shackles that hold down rather than enable the region to enjoy the maximum benefit from mining.
M.M.M.M. Climate Change and Disaster RisksClimate Change and Disaster RisksClimate Change and Disaster RisksClimate Change and Disaster Risks ManagementManagementManagementManagement remain a big challenge for the sustainable economic development of Central Luzon. “The large impacts of natural disasters are not only related to the geography of the country and its high exposure to natural hazards, but also to its vulnerability, which is closely linked to poverty and environmental management.” In urban areas, poverty drives many poor families to live in high-risk areas. In the rural areas, disasters throw poor families back into poverty who are forced to rely on coping mechanisms that reduce their long-term chances for improving their lives. The risks posed by global climate change will severely affect key pillars of socio-economic development that include natural resources, agriculture, infrastructure, water resources and human health. While there is uncertainty on the likely conditions and changes in some climate variables resulting from global warming, there are predictors of possible climate change impacts in the country. Amidst the dearth of prediction models that reduce uncertainties for climate change impacts at the sub-national and sub-regional levels, it is certain that surface temperature is rising and more warm days and lesser cool ones have been recorded. These temperature variations have already increased the risks to the country and local level socio-economic development. Although uncertainties continue to cloud the possible impacts of climate change at the local levels, it is certain that increases in average temperatures that result in natural disasters are already taking their toll on the socio-economic development of Central Luzon. This is due not only to the natural hazards to which the region is exposed but also because of its vulnerabilities that are exacerbated by poverty and environmental degradation. The most likely to be affected sector of the economy is the agriculture sector upon which a considerable number of the region’s poor depend for their livelihood.
Being in the central plains of Luzon Island with three extensive river basins (Pampanga River, Agno River and Angat River) and having low-lying urban and economic activity centers, the region’s fundamental priority is to ensure that past and future socio-economic investments shall not be wiped out in a wink of an eye due to the occurrences of natural hazards. The urgency of more effective disaster risk management is further emphasized by the occurrences of climate change indications in recent months and years.
The outdated disaster management policy framework of the Philippines has recently been addressed with the enactment of the National Disaster Risk Reduction and Management Law (Republic Act No. 10121). The law emphasizes the need to understand the development-disaster nexus from local to national government and even within the private sector and the inclusion of disaster risk management issues in development financing decisions. This requires strengthening of capabilities of decision-makers in incorporating climate-change issues in public investment decisions. Aside from physical interventions to minimize risks to natural hazards such as flood control structures and drainage works, there is an urgency of improving disaster forecasting and early detection capacities as pre-requisites to disaster preparedness.

20
Related to disaster preparedness capacities are capacities of LGUs to respond to emergency requirements. These include stockpiling of ready-to-eat and easy-to-open stuff and basic necessities of victims of natural disasters such as floods, landslides and mudflows.
Most LGUs need to be capacitated on disaster risk management and on improving disaster risk reduction considerations in their respective Comprehensive Land Use Plans (CLUPs). However, national government technical agencies also need to step up their database on natural hazards threatening specific areas in the region and make these available to planners and decision makers for them to arrive at informed decisions.
Typhoons, earthquakes, volcanic eruptions and unusual climatic occurrences pose threats
and hazards to humans, infrastructures, properties and economic activities. These raise the
cost of development or draw funds and investments away from development.
An average of 20 typhoons visits the country each year. About 15 of these affect Central Luzon. Typhoons combine with monsoons discharge a high rate of precipitation in the region. And because many of the region’s areas are low-lying (e.g. Pampanga Delta, Poponto and Central Tarlac), flooding usually accompanies typhoons and monsoons. The two most extensive river basin areas that are usually affected by flooding are the Agno River Basin and the Pampanga Delta shown in Figure 1. The DPWH has put in place flood forecasting and early warning systems in these two areas. The national government has likewise invested in programs and projects to alleviate the flooding problem in these areas. Local governments (such as Tarlac and San Fernando Cities) have also invested in improving the drainage systems in their respective urban areas.
Figure 1
21
Although much has been spent in infrastructures and other engineering interventions, unusual rainfall events still submerge extensive areas in the region. Tarlac, Nueva Ecija, Bulacan and Pampanga are usually worst affected. In the case of the Pampanga Delta area, the implementation of Phase II of the Pampanga River Irrigation and Flood Control Project did not push through due to some social acceptability issues. The river systems in the Pampanga River Network experienced decreases in capacities due to siltation and lahar deposition. Several Mt. Pinatubo rehabilitation projects were implemented to increase the conveyance capacities of these rivers. However, the magnitude and extent of the lahar affected areas and the limited resources of government have left some areas to depend on reactive solutions to the flooding problems. The most controversial is the Pampanga Delta Flood Control Project. Phase I was fully completed in 2002 after two loan extensions and 11 years of implementation. About 1.5 kilometers was deleted from the original project design not only because of price escalation but more especially due to strong opposition from the non-government organizations (NGOs) and families to be displaced in Barangay Candelaria, Macabebe, Pampanga up to Barangay Meyto, Calumpit Bulacan. Implementation of Phase II may not proceed unless consensus among stakeholders is realized. Relocation has become a very sensitive issue that local politicians have either shied away or used the controversy to pursue their political ends. Another major contributor to flooding in some areas in the region is the discharge of unusually high volumes of impounded surface run-off in the region’s hydroelectric and irrigation dams (Angat and Pantabangan). Operators of these two dams are forced to release water since the dam capacities have decreased due to siltation and the high rates of run-off accumulation. These have been blamed on the denudation of their respective watersheds. Indeed, the forest cover in several critical watersheds throughout the region diminished through time, blamed primarily on illegal logging, kaingin and encroachment. It was also determined that limited and overlapping mandates in the management of forest resources (watersheds included) weaken the implementation of otherwise resource conservation programs in these areas.
N.N.N.N. Ensuring Sustainable Groundwater Yields and Balancing Competing DemandsSustainable Groundwater Yields and Balancing Competing DemandsSustainable Groundwater Yields and Balancing Competing DemandsSustainable Groundwater Yields and Balancing Competing Demands among industries, domestic and agricultural uses is a challenge that needs to be addressed considering that water is an essential commodity for all these three uses. This would necessitate identifying and protecting aquifer recharge areas, protection of existing proclaimed critical watersheds and identification of new critical watersheds for protection. A related challenge is how to mobilize multi-sector support for this activity.
O.O.O.O. Environmental Protection and Waste ManagementEnvironmental Protection and Waste ManagementEnvironmental Protection and Waste ManagementEnvironmental Protection and Waste Management The environment and the natural
resources around us tell so much of the life we live. They form the core of what determine
and shape human survival and human development.
Air, water and land provide the basics of what humans need to survive. Their availability
ensures that we live and fulfill our human task. But to live and enjoy life, man needs to have
these basics in quality and quantity that would allow for sustainable living. To have them
differently would be to limit life and limit living it meaningfully and to the fullest.
The challenge remains for Central Luzon to protect resources that are presently in good state
or from further degradation; to rehabilitate and restore those that can still be redeemed and

22
be of productive use; and to enhance the quality of its environment to levels beneficial to
people and the economy.
Attention is needed in the following environmental responses:
• Maintaining and preserving the region’s protected areas and biodiversity;
• Protecting the region’s forest lands and watersheds from degradation;
• Reforestation and rehabilitation of degraded upland and mangrove areas;
• Rehabilitation and restoration of Manila Bay and the region’s other coastal and marine resources;
• Urban greening and sanitation;
• Regular air and water quality monitoring;
• Waste water treatment and solid and liquid waste disposal management.

23
Chapter�3:�Our�Desired�Future�
I. Introduction
The chapter describes the future desired physical, socio-economic and institutional conditions that shall prevail in Central Luzon in the long run. It summarizes the aspirations and dreams of the people as gathered from existing planning documents and personal accounts superimposed with an appreciation of the region’s intrinsic features and characteristics. The Region’s vision statement presented in the succeeding section has been deliberately made simple to make it easily understood and more effective in rallying stakeholders towards a common future. In summary, Central Luzon’s development directions and priority interventions may be seen in the chart next page.

24
Globally -
Competitive,
Progressive and
Resilient Citizenry
Central
Luzon: A
Sustainable
and Caring
Global
Gateway
through
Public-
Public
Partnership
and
Growth for
All
High, Sustained and
Inclusive Growth
World – Class
passenger mobility
and cargo distribution
network
Sustainable Land –
Using Activities
Socially Responsible
Property Rights
Effective, Responsive
and Transparent
Governance
VISION GOALS OBJECTIVES STRATEGIES
DEVELOPMENT DIRECTIONS DEVELOPMENT INTERVENTIONS
High GRDP per capita
High Employment and Family Income Level
Equality in Income Distribution and Poverty
Reduction
Minimized Natural Disaster Casualties and
Economic Losses
Cheap and Plentiful Food
Improved Access to Health Services
Improved Land Transport Access from Urban
Core to East and West Coasts
Increased Level of Services of Strategic Roads
and North- South Links
Integrated Land, Air, and Sea Transport Modes
Improved Profitability and Sustainability of MSME’s
Developed Clark – Subic Regional Tourism Hub
Improved Basic Education Achievement Rates
World- Oriented HEIs
Highly Employable Technical and Voc. Skills
Green Upland Area Clean Coastal Zone
Healthy Urban Area Environment Friendly Mining
Productive Lahar-
Covered Areas
Upgraded Tourism
Establishments
Increased Rural
Farmer and Fisher
Folk Income
Security Over Property
Rights
Accountable government personnel
performance tracking
Transparent public
finance
Greater private
sector participation
MSME- Focused Regional
Investment and Employment Code
Efficient Financial Intermediation
for MSMEs
Population Management
Mainstreamed DRR in Local
Development Planning/ Land Use
Planning and Governance
National Budget Support to Regionally -
Prioritized Tourist Destinations
LGU Capital- Forming Capability
PPP as Preferred Mode of Funding
Tourism , Infrastructures and Value
Adding Process Technology
Off- School English Proficiency
Strict Implementation of Existing Laws
and Mainstreaming Disaster Risk
Reduction in Local Planning and Policy
Implementation Continue Upgrading of Services and
Facilities within the Economic Zones
Focused Investment in High Priority
Skills
Multi-stream and integrated Delivery of
Support Services to Farmers and Farming
Communities
Modified Property Ownership as Means to
Boost Agricultural Production Efficiency and
Productivity
Seamless Business Permit Processing
Public Access to Production Processes and
Factor – Product Market Interaction
Focused and Targeted Peace and Security as
Banner Program in Regional Investment /
Tourism Promotions
Access to Product Design, Packaging and
Handling Technologies for MSMEs
Equal Access to Product Design, Packaging
and Handling Technologies for MSMEs
Greater Access to Development
Opportunities through “Equity Regional
Budget” for Infrastructures and Social
Services
Technical Support for Greater Access to
Product Design Packaging and Handling
Technologies for MSMEs and Agri-
Processors
P R O G R A M S
P R O J E C T S
A C T I V I T I E S

25
II. Vision�Statement�and�Its�Elements
“Central Luzon: A Sustainable and Caring Global Gateway“Central Luzon: A Sustainable and Caring Global Gateway“Central Luzon: A Sustainable and Caring Global Gateway“Central Luzon: A Sustainable and Caring Global Gateway
through Privatethrough Privatethrough Privatethrough Private----Public Partnership Public Partnership Public Partnership Public Partnership and Growth for All”and Growth for All”and Growth for All”and Growth for All”
This statement underscores adherence to sustainable development principles as underpinnings of the region’s preferred development path without compromising future abilities to provide the needs of successor generations. It presupposes that improving the quality of lives of the present and the next generation of Central Luzon requires concerted efforts among all stakeholders -- government (national and local), on one hand, and business sector and civil society, on the other, to harness the region’s potentials for economic production and inclusive growth. Underlying assumptions include: (1) that when people from all sectors in the region converge and engage in productive activities, the region’s wealth shall increase; (2) that economic growth shall be driven by resource-based activities resulting to inclusive improvements in the general welfare; (3) that when the region’s natural resources are put to sustainable use, inclusive economic growth shall also be sustained; (4) that the participation of government, business sector and civil society to economic growth must be clear to all; (5) that sustained economic growth of the region can be enhanced by considering the external environment – market and technological opportunities; (6) that local governments are in the forefront of the economic development process with national government providing the necessary backstop. In the long term or by 2025, the people of Central Luzon shall be globally-competitive in skills and knowledge that form the foundation of a highly productive human resource base. All families, irrespective of location or race are able to provide for their basic needs and are satisfied with the general living conditions in their own localities. Gone will be sites of informal dwellers, of children unable to go to school, of mendicants roaming the streets, of insurgents rising in arms against the government, of congested penal institutions, of labor unions staging strikes and lock-outs, and of crimes to life and property perpetrated by lawless elements. These shall be replaced by a picture of people from all walks of life happily going about their productive economic activities. The regions’ agricultural areas shall be showcases of productivity, profit and resiliency. We can see efficient post-harvest handling and processing facilities operating at full capacities, marketing networks that do not undermine the producers, farmers searching on-line in their barangays or houses for better prices of their commodities or for state-of-the-art production and processing technologies.
On sloping areas and uplands, we shall observe not only soil and water conservation measures supporting crop production, the vibrant green cover of critical watersheds and biodiversity in other protected areas but also forest production activities that consider the carrying capacity of the resource base and environment-friendly technologies. In some areas, we shall come in contact with resource extracting miners who care for the environment they are working on. We shall also find mined-out areas that have blossomed into productive communities.
One can go to either the east or west coast and frolic in the waters or one can go swimming in the region’s numerous river systems. In the urban areas, the unsightly mounds of uncollected garbage, traffic congestion, smog and flooding shall be things of the past. In the

26
few instances when natural hazards strike, there shall be no losses in lives and disruptions in economic activities shall be short-lived as there shall be minimal destruction of safely-located critical infrastructures.
As a favored international convention center and inter-regional tourism hub, Central Luzon shall be exhibiting efficient tourist-friendly services and facilities. Regular international flights for passengers shall be landing on the runways of Clark and Subic with connecting domestic flights to key tourist destinations in other parts of the region and the country. An array of tourism activities and sites shall be offered in the seven provinces. Visitors shall have no fear in going around the region. They can easily find their way around because of international standard road signages, information centers, and accommodating population. Once a tourist visits any place in the region, he or she shall be induced to stay longer and explore the rest of the region.
By that time also, investors shall be confident of their investments in the region. Industries and higher value-adding activities catering to both domestic and international market demands shall mushroom in our developed industrial estates. There shall be streams of highly productive labor supply that have gained knowledge and skills that are comparable to any other in the world. A Silicon Valley-like industrial enclave shall be a banner area of the region. In addition to supporting the transport requirements of locators in industrial estates, Clark and Subic’s air and sea assets shall have developed into competitive logistics and transshipment hubs in the Asia-Pacific Region. A transshipment hub in Dingalan, Aurora shall complement them. This east-west multi-nodal physical connection shall form the backbone of the region’s drive towards becoming a global gateway between Asia and the rest of the world. While the private sector and civil society are doing their contributions to wealth creation, local governments are providing social services and operating facilities that are accessible to all people and at creditable levels of efficiency and effectiveness. Both national government agencies and Local Government Units (LGUs) are maintaining a regulatory environment conducive to economic growth. Thus, business permitting processes and systems shall be transparent and predictable. Complementation between national government and LGUs shall be expected in their endeavors.
III. Spatial�Strategy
To attain the vision, Central Luzon shall continue to adopt the Enhanced “W” Growth Corridor spatial strategy. Although maintaining the original “W”, the enhanced version recognizes the potentials and opportunities of Aurora. It is “enhanced” in the sense that the spatial strategy indicates the importance of an effective urban-rural link as a vehicle for “inclusive growth”. This is shown in Figure 2. through the emergence of an ear looping towards Baler and Dingalan then extending up to the western side of the region to Iba, Zambales crossing the original legs of the “W” thereby effectively providing an
ENHANCED
CORRIDOR
Figure 2
27
alternate connection between and among them.
The growth corridors will continue to maximize the comparative advantages and development roles of the provinces and development areas in the region. The first leg of the W (blue strip) or western portion of the region is designated as the tourism corridor. It starts from the northernmost town of Sta. Cruz and Masinloc in Zambales up to Subic Bay Metropolitan Authority (SBMA) area. The inner leg or Central portion (orange strip) will constitute the industrial heartland. The eastern portion (dark green corridor) will showcase agricultural areas devoted to high value crops and agro-forestry. It runs along the fertile westerm part of Bulacan and through the areas of Nueva Ecija. The ear part and the lateral leg (light green) will be a combination of tourism and agriculture development.
IV. Development�Goals�and�Objectives
Below are the six long-term development Goals that directly support the attainment of the Vision. They are translated into medium-term development objectives which compose a six-year success slice under each stated Goal.
GOAL 1: High Sustained and Inclusive Growth
The continuous decline of the regional contribution to the national output shall be arrested and reversed.
A. High GRDP per capita The Gross Regional Domestic Product (GRDP) per capita of the region shall be increased to equalize that of the country. From a -3.35 percent GRDP per capita growth rate between 2008 and 2009, Central Luzon’s GRDP per capita shall be increased from 3-5 percent at constant price for the coming six years.
B. High Employment and Family Income Level The employment rate of the region between 2008 and 2009 remained at 90.8 percent. As this was a global recessionary regime, this means that the government’s fiscal expenditure expansionary policy proved effective. With the global and national economy preparing for onward march to recovery, employment rate for the coming six years shall be raised by 2-3 percent or around 200,000 to 300,000 jobs generated. Employment generation is the most pervasive anti-poverty measure, the sustainably high level of which would translate to high future human capital productivity and cost-effectiveness in government’s pro-poor programs. Central Luzon shall maintain its position as the region across the country with the third highest annual average family income from 2003-2009. Between 2003 and 2006, the region experienced 1.88 percent increase in annual average family income, and between 2006 and 2009, it posted a hefty rise of 35.58 percent. For the coming six years, the region is expected to maintain a 36 percent upswing in the growth rate of annual average family income.
C. Equality in Income Distribution Gini coefficient shall be reduced from the 2006’s .3994 to around .3222 in six years with corresponding reduction in poverty and subsistence incidence.

28
GOAL 2: Globally-Competitive, Progressive, and Resilient Citizenry
By 2016, the region shall be inhabited by people whose skills are of world-class standard and caliber. Access to state-of-the-art technical skills shall be facilitated by a synergy from an Ecozone-Host LGU economic integration. Heavy presence of foreigners in retail trade shall dictate the types of skills that would be preferred by industries. A dynamic industry-academe linkage shall ensure employability of graduates. Investment expansion from MSMEs and responsive poverty reduction strategies shall push hard employment generation and access to development opportunities down to the most vulnerable and marginalized.
High and sustained investment expansion from private sector and relevant social programs shall make ripe opportunities for progress to everyone. Growth and development and the benefits they generate in the process shall be protected and sustained by making a disaster-consciousness populace. Regional and local development planning shall integrate climate change adaptation and disaster risk reduction as permanent planning frameworks, hence bringing anticipated socio-economic dislocation and growth-suspending disasters to a minimum, set the tone for a speedy recovery and rehabilitation, and institutionalize the culture of resiliency for the citizens.
A. Minimize natural disaster casualties and economic losses
Identification and characterization of various natural hazards and the location of exposed population shall equip policy decision-makers with the correct information and enable them to institute the necessary measures to ensure their own personal safety and their property. With DRR/CCA as framework, land use planning and proper implementation of zoning ordinances shall be utilized to the fullest. Focus shall be given to the agricultural sector where a considerable number of poor depend for their livelihood.
B. Make food cheap and plentiful
Food items such as rice, fish, fruits, vegetables, poultry and swine shall be produced at higher efficiencies, moved at lower transport cost from the farm to the market and offered for sale in bulk at relatively low prices. Organizing of farmers/fisher folks, farm diversification, post-harvest processing, packaging and handling shall give more power and value to the producers and their products, strict implementation of anti-smuggling laws will enhance their income and their peso’s purchasing power. Adequate storage support shall save the farmers/fisher folks from the seasonality of price fluctuations and create an atmosphere of stable price for the farmer/fisher folk’s produce.
C. Improve basic education achievement rates
Provision of adequate teachers, classrooms, desks, tables, and computers is expected to result in higher participation rates, completion rates and National Achievement Tests (NAT) results.
D. Improve access to health services
A healthy citizenry is a requisite to sustained and high level of productivity. Private appropriations for personal health and medical care and access of the deprived to government-provided services are geared to maintain a state of healthy physical and mental well-being for the citizens. Interventions in this regard shall create a stock of human capital of world-class standard.
29
E. Support the development of world-oriented higher education institutions
The region’s exposure to state-of-the-art technology through the network of economic zones, the adaptability of the export industry to the requirements of international partners, and the liberalized retail trade environment are open windows to the knowledge and skill requirements of the global economy. Addressing mismatch in industry requirements and the types of quality of graduates shall position the region’s by Higher Education Institutions (HEIs) and technical-vocational institutions into a state of continuing relevance to existing, new and emerging industry requirements.
F. Highly employable technical and vocational skills
Employment of the region’s middle-level manpower trained formally through the
government-initiated Technical-Vocational Education and Training (TVET) Programs
will immediately help improve regional output, alleviate poverty situation, optimize
results from the government development interventions in TVET and socially market,
locally and abroad, the skills honed and acquired through formal trainings. For the
coming six years, the region’s TVET Programs shall increase the regional TVET
graduates employment average by almost 10 percent that is from the current 36.54
percent to 45 percent.
GOAL 3: World-Class passenger mobility and cargo distribution network
A. Improve land transport access from the urban core to the east and west coasts
Physical connectivity of the region’s urban core to the agricultural areas shall ensure efficiency of production and consumption processes, integrate factor and product markets, and produce the necessary skill requirements in the process. Efficient road networks shall facilitate access to development opportunities to mainstream the economically deprived to the productive sector.
B. Increase the level of service of strategic roads and north-south arterial links
The strategic connection accorded by the region’s road network systems, being the transit point from the urban metropolis and the resource-rich agricultural areas to the north, while providing the needed economic impetus to grow has been constantly putting a strain on the region’s infrastructures. The region shall adapt to the growing requirements of the commodity exchange to capture the vast economic opportunities that the process offers. Timely adaptability in terms of physical expansion and quality upgrade of the north-south arterial links is of crucial importance.
C. Integrate the three modes of transportation (land, air and sea)
Air and sea transport serves an equally important role in passenger and goods movement within and outside of the region and the country. While the distinct role each (to include land transport) plays is recognized, integration of the three transport modes (land, air and sea) shall create the needed synergy.
GOAL 4: Sustainable Land-Using Activities
A. Ensure that mining operations are environment-friendly
Historically, ”left-out” mined-out areas are a rich source of anecdotes of sad experiences of host communities who were made more economically deprived and

30
whose future was at high risk owing to a damaged environment. Strict implementation of the Philippine Mining Act in the region’s mining concession areas shall ensure that mining operations are not only cognizant of the fragile nature of mining areas but accord the host communities the lifetime privilege and opportunity of getting economically better-off after mine pull-out.
GOAL 5: Socially-Responsible Property Rights
A. Security over property rights
The region shall take full advantage of the term-extension of the Comprehensive Agrarian Reform Program (CARP) by strictly tracking the pace of individual titling (evidentiary of absolute ownership) of agricultural lots physically segregated for and actually appropriated by farmer-beneficiaries. While the Certificate of Land Ownership Award (CLOA) has accorded them some degree of tenurial security over their realty, it has not provided them absolute security as to motivate them toward economic growth and financial stability.
B. Improve the profitability and sustainability of MSMEs
Being massive job generators, MSMEs are the primary anti-poverty instruments by private sector partners, they are primary movers for widening the middle class base, an explicitly pronounced target by the President himself during his term. To make their influence felt in the region’s economic growth in the long-run, appropriate technical, marketing, financial and policy support shall be provided.
C. Increase rural farming and fisher folk family incomes
Various forms of support (financial, technical, market) to the farming and fishing families are all geared towards improving their productivity and enhancing their income. Specific direct anti-poverty programs aimed at ensuring their access to development opportunities are intended to improve their peso purchasing power.
GOAL 6: Effective, Responsive and Transparent Governance
Effective, responsive and transparent governance starts with a working institutional arrangement between various Local Government Units (LGUs) and the national government agencies in the region. Clear delineation of roles shall attach responsibility. The objectives of programs and projects, and the intention of policies must find translation in real terms for their effect. Public transactions and their documentation shall be made public as an obligation. Avenues for redress of grievance must made known to all citizens.
A. Upgrade tourism establishments
The natural or geographic tourist attractions with the ancillary services shall be positioned by developing them in their right quality and quantity. National government-LGU collaboration shall be aggressively pursued so that tourism promotion shall be conducted in an efficient and coherent manner.
B. Develop Clark-Subic regional tourism hub
Efforts at making Clark-Subic a regional tourism hub are being intensified through upgrading of airport and seaport facilities, increasing air seat capacities of

31
international flights, tightened security within the Clark Special Economic and Freeport Zone and its vicinity, private sector’s establishment of hotels and restaurants, close collaboration between and among the Regional Development Council (RDC) III, Subic-Clark Alliance for Development Council (SCADC) and host LGUs in tourism planning.
C. Recover lahar-covered areas for productive uses
While the sand being extracted from the vast lahar-laden areas is a glaring source of regular local revenues for quite a time, technical and market studies, and advocacies on alternative contractual arrangements will help convert massive lahar-laden areas to optimal productive uses.
V.� Development�Strategies��
An analysis of the planning environment yielded the Development Challenges (see Chapter 3) which are given focus and emphasis in the Plan. The analysis extracted development opportunities which if unlocked would enable the region reach its full potential towards accelerated, sustainable growth for all.
Below are the cross-sectoral strategies considered in the conceptualization and initial design
of Programs and Projects to ensure that they are responsive and effective means to attain the medium-term objectives and the long-term goals and vision of Central Luzon.
A. Multi-Stream and Integrated Delivery of Support Services to Farmers and Farming
Communities
The strategy is intended to be both an employment and direct anti-poverty strategy. It
involves a direct response to addressing poverty as a multidimensional rural phenomenon.
Integrated services shall include legal guarantee to tenurial security over farmlands, equal
access to agricultural support services, key infrastructures for health and education services,
income-enhancing production processes and technologies, microfinance among others.
Organize Information Technology-based networking among farmers especially on the pricing
of their products shall be given emphasis. State University and College (SUC)-LGU
collaboration in agricultural extension shall be intensively pursued with support from the
local leagues and SUC development consortia as lead.
B. Modified Property Ownership for Individual Farm Lands to Promote Agricultural Production
Efficiency and Productivity
The value and utility of information on factor integration, technology utilization and market
diversification have either remained unappreciated as income-enhancing opportunities or
government support services fall short of the level required to capacitate farmers and fisher
folks to invest and take risks. To optimize the value of individual farm landholdings, the
government shall devise investment in income-enhancing production module packages that
will be made available for free to farmers and fisher folks. An open contractual arrangement

32
between government and farmers/fisher folks shall be promoted as marketable
opportunities for large private investments.
C. Continuous Upgrading of Services and Facilities within the Special Zones
Owing to the tightly competitive regime among special economic and free ports zones around
the globe, continuous upscaling of infrastructures such as road, electric power and
telecommunications within the special economic and free port zones and in the host-LGUs
shall be aggressively pursued. This would require the creation of a robust common policy
framework among all development players particularly the zone authorities and the
concerned NGAs and LGUs.
D. Seamless Business Processing
National government agencies and LGUs are governed by different laws. Hence, in inter-
agency undertaking such as business permit processing and issuances, irritants arose from
unsynchronized work and time schedules. Whether from national or LGU, the public to
include existing and prospective investors are disadvantaged through the process. A
continuing dialogue between concerned NGAs and LGUs must be conducted to address
specific concerns to establishing a seamless business processing system.
E. Equal Access to Information on Production Processes and Factor-Product Market Integration
Information on productive inputs and products, their sources, and prices shall form part of
the data base of every LGU as an investment promotion measure. Possible gaps in forward
and backward linkaging in production processes shall create an open system to investment
opportunities, technology access and upgrading and market diversification. The information
shall provide opportunities for small investors to establish strategic business alliances as an
income-enhancing strategy.
F. Regionwide Focused and Targeted Peace and Security Program as Banner in Regional
Investment and Tourism Development Plans
The inability to formulate a coherent peace and security for the region arises out of the
exercise of local autonomy by various LGUs in the region. This problem persists despite the
obvious advantages from the point of view of investment promotion. The lack of
commitment resulting from independent actions and responses shall be addressed through
continuing dialogue between and among the different players. This will be inputted as a
singular promotional measure in the Investment and Tourism Development Plans.
G. Technical Support for Greater Access to Product Design, Packaging and Handling
Technologies for MSMEs and Agri-Processors
Hard work in the farms and individual skills and unique craftsmanship in micro- and small
non-farm enterprises are strengths of the region. However, lack of access or wrong

33
appreciation on the benefits of marketable product design and packaging and standardized
product handling continually work against product competitiveness and dominance. A review
on the current efforts on this must be done so that concerned agencies are able to re-
position their support services.
H. Greater Access to Development Opportunities through an “Equity Regional Budget” for
Infrastructures and Welfare Services
Spatial variations across the region on the relative physical access to welfare services by
provinces continually serve as binding constraint to sustainable and equitable growth and
ultimately to poverty reduction efforts. Using equal access to development opportunities as
framework, the region shall identify priority areas for intervention to address the
fragmentation of welfare service delivery arising of lack of physical access. To complement
physical integration, fragmented delivery of health services resulting from the independent
administrative delineation of responsibilities shall be resolved.
I. Optimize Public-Private-Partnership as Dominant Mode for Funding Priority Tourism Facilities,
Critical Infrastructures and Investments in Value-Adding Technology for Province’s Principal
Agricultural Products
Inter-provincial Production and Technology Centers focused on the province’s comparative
agricultural product advantage shall be established in strategic areas in the region. The
strategy shall be an income-enhancing measure for farming and foresting communities
through adoption of value-adding technologies. Along with priority tourism facilities and
networks, P-P-P shall be pushed as the most preferred mode of implementing this strategy.
J. Address Weaknesses in English Proficiency as Competitive Edge in Employment through
Alternative Learning Modes
Despite our perceived advantage over the use of the English language, the ICT sector in the
region is experiencing shortage of English-proficient workers. This indicates the lack or
incorrect usage of the English language in schools. Other Asians are continuously exerting
efforts to penetrate this exclusive realm. Concerned education agencies in the region shall
look into the causes of the low level of English-proficiency of students and graduates.
Alternative modes of improving current proficiency levels shall be adopted.
K. Strengthen LGU Capital-Forming Capabilities through Decentralization Policy Reforms
Data show that the spatial disparity in capital-forming capability of Central Luzon provinces is
real. This is translated to present deprivation by the poor of opportunities for physical
survival and clear opportunities for future growth. RDC III must be given authority to
eliminate the obvious geographic variations among provinces by conferring it with some
authority to determine budgetary allocation of selected RLAs for priority Programs and
Projects it will identify.

34
L. National Government Budget Prioritization of Regionally-Identified Tourist Destinations
Tourism is dependent on quality infrastructure and stable peace and security structure. It is
continuously beset by dichotomized organizational set-up and processes in the development
of tourism facilities and investment and tourism promotion. A nationally-determined budget
focused on regionally-identified strategic tourist destinations shall create a responsive
budget harmonize current efforts by various actors.
M. Efficient Financial Intermediation for MSMEs through Unification of Banks and Non-Bank
Institutions
Banks and other financial institutions in the region shall treat MSMEs as a special assistance
area. Barriers in terms of loan access and slim chances for survival, growth and
sustainability shall be eliminated by packaging their services in terms of greater flexibility in
loan extension and other support services intended to ensure their profitability. Policy
flexibility on loans and minimum indicators on the extent technical and marketing support to
be extended shall constitute the minimum Terms of Reference (TOR) in their strategic
alliances.
N. Regional Omnibus Investment and Employment Code focused on MSME productivity, growth
and employment
RDC III shall initiate the completion and harmonization of local investment promotion and
incentives programs, plans or codes. It shall work on the formulation of a Regional
Investment and Employment Code (RIEC) focused on MSME growth, productivity and
employment capacity. The strategy is intended to sustain the enduring and more stable
character of MSMEs as massive employer of local human capital.
O. Population Management
For greater effectiveness of anti-poverty measures, population growth of special groups shall
be directly and consciously managed. The strategy is intended to ease the pressure on
government resources and optimize the benefits from its investment. It will facilitate the
haul-out process from the vicious cycle and permanently mainstream them into the
productive sectors.
P. Strict Implementation of Existing Laws and Mainstreaming Disaster Risk Reduction in Local
Planning and Policy Implementation.
The massive costs of disasters to development pace and investments are recognized.
Suspended growth because of disaster occurrences shall be avoided by mainstreaming DRR
into the usual planning cycle so that development interventions, being disaster-reduction-
based may serve as more stable basis for long-term growth scenario. The national directive
and regional development strategy is already being downloaded to the provincial level
through the standardized mainstreaming guidelines.
35
Good governance in DRR involves the strict implementation of existing laws particularly the
Forestry, Mining, Clean Air Act, Ecological Solid Waste Management Act, the National Building
Code, the Water Code and local Zoning Ordinances. The conduct of constant dialogue
between the Forest Management Bureau (FMB), Mines and Geo-Sciences Bureau (MGB) and
the Environmental Management Bureau (EMB) of the Department of Environment and
Natural Resources (DENR) and clear delineation of the roles between and among the DENR
and its attached bureaus and the LGUs exercising jurisdictional authority over the subject
areas. Encouraged and aggressive civil society participation in policy implementation is
imperative.
Social safety nets shall be provided to the extremely deprived and potential victims of
disasters in order to mitigate their sufferings and facilitate their mainstreaming into the
productive sectors. Social protection shall be given to those who graduated by poverty but
owing to the onslaught of disasters shall relegate them again to a state of extreme
deprivation.
Q. Focus Investment in High Priority Skills
The continuing mismatch in skill and industry requirements need to be narrowed down or
closed. This is manifested by the disparity in the TVET graduates and those employed in the
discipline they were formally trained. The Key Employment Generators (KEGs) of the country
and the region, those emerging locally and those sourced from opportunities that the global
market offer shall find their place in the TVET curricular offerings, the timing of their offering,
and the packaging of training design and instructional materials preparation.
Alignment with high priority skills, timing and relevance of program offerings shall immediately
result to efficiency in program implementation and high employability of acquired skills.
Variants of government scholarships shall be designed to minimize losses from risks of long
unemployment and maximize outcome from skills immediately employed. Results-based
monitoring of graduates employability shall be a permanent feature of government’s TVET
programs so that the Technical Education and Skills Development Authority (TESDA) shall not
only be imparting quality knowledge to program takers but transforming manpower potentials
to actual skills-users and skills-developers in the region’s productive sectors.

36
Chapter�4:� Priority�Programs�and�Projects�
I.� Introduction� Development objectives are translated into more operational terms through development programs and projects which shall be funded through the regular budgeting process of the national government and its instrumentalities complemented by local government financing. Some of the projects or activities that are beyond the capacity of either national or local governments to finance shall be packaged to tap other financing sources or proposed for innovative financing arrangements especially through Public-Private-Partnership.
II. Priority�Programs,�Projects�and�Policies�
The Programs and Projects identified under each stated Development Objective are as
follows:
A. Minimized�Natural�Disaster�Casualties�and�Economic�Losses�
1.1.1.1. Landslide and Flashflood Hazard and Risk Mapping in Central LuzonLandslide and Flashflood Hazard and Risk Mapping in Central LuzonLandslide and Flashflood Hazard and Risk Mapping in Central LuzonLandslide and Flashflood Hazard and Risk Mapping in Central Luzon. The first phase of this project shall cover the provinces within the Sierra Madre Mountain Range while the second phase shall cover areas in Mariveles and Zambales mountains. The project aims to generate hazard and risk maps that may serve as guides in urban and regional planning and in formulating and designing mitigation measures and in giving proper warnings to people at risk. The study involves analyses of topographic maps, air photos and satellite imageries to map geomorphologic features relevant to landslide and flashflood susceptibility. Initial interpretation shall be verified by aerial and ground-based surveys. The data shall be processed, integrated and analyzed using Geographic Information System (GIS). In general, the project shall: (1) identify and characterize slopes prone to landslides; (2) identify and characterize river morphological features critical for flashflood generation, such as river constrictions, alluvial fans and deltas; (3) identify and map areas where water can be temporarily impounded by natural dams, which can be breached suddenly to release water as flashfloods; and (4) identify and map population centers and vital infrastructures at risk.
2.2.2.2. Urgent Rehabilitation and Improvement of Agno River Flood Control ProjectUrgent Rehabilitation and Improvement of Agno River Flood Control ProjectUrgent Rehabilitation and Improvement of Agno River Flood Control ProjectUrgent Rehabilitation and Improvement of Agno River Flood Control Project. The project involves river training works, dike construction, and channel excavation at the downstream of Agno River at Lingayen Gulf. A temporary retarding basin at Poponto swamp in Moncada and Paniqui, Tarlac to regulate the flow of floodwater downstream is currently being established. The dike system of Tarlac River, also silted with lahar and a tributary of Agno River, will also be improved.
3.3.3.3. Pinatubo Hazard UrgentPinatubo Hazard UrgentPinatubo Hazard UrgentPinatubo Hazard Urgent Mitigation Project V (PHUMP)Mitigation Project V (PHUMP)Mitigation Project V (PHUMP)Mitigation Project V (PHUMP). This project is designed to
rehabilitate areas in Zambales, Pampanga and Tarlac devastated by the eruption of Mt. Pinatubo and the subsequent lahar flows. The completion of PHUMP (Phases I, II, III, IV, & V) is envisioned to fully address lahar and flooding problem in Tarlac, Zambales, and

37
Pampanga. Japan International Cooperation Agency (JICA) has committed to provide funding assistance for the completion of PHUMP and provided funds for the completion of Phases I to IV. A detailed study has been commissioned for the implementation of Phase V involves the river basin affected by Mt. Pinatubo eruption in Zambales. These are the Bucao-Balin Baquero, and Sto. Tomas- Marella rivers. The study once completed may be proposed for possible JICA funding.
4.4.4.4. Pampanga Delta Development Program Pampanga Delta Development Program Pampanga Delta Development Program Pampanga Delta Development Program –––– Flood Control ComponentFlood Control ComponentFlood Control ComponentFlood Control Component. This project is one
of the most celebrated flood control projects implemented in Region III. Like the Agno River, the Pampanga River has a huge watershed encompassing Central Luzon that extends to Cagayan Valley. The huge volume of water it carries during rainy season floods significant portion of Pampanga and Bulacan provinces. The project essentially involved the improvement of Pampanga River mouth to 15.5 km upstream by dredging the low water channel with provision of parallel dikes and construction of related structures.
The loan became effective on the 2nd quarter of 1990. After two loan extensions and 11 years of implementation, Phase I of the project was completed in 2002. The main cause of delay was Right of Way (ROW) acquisition attributed to low property valuation coupled by strong opposition by the local community including the Municipality of Calumpit, Bulacan. This resulted in downsizing of project scope. The government has spent almost P1 billion for ROW acquisition alone. A total of 70 hectares were provided to resettle about 1,800 families.
Below are the major components proposed under Phase II:
a) Continuation of the dike system - the low and high water channel completed under Phase I will be extended up to the Candaba swamp passing through the Municipality of Calumpit, Bulacan;
b) Expansion and improvement of Labangan Floodway - The existing Labangan
floodway which collects flood water from Candaba Swamp (Southern Part) and Angat river, passes through Calumpit, Hagonoy, and Paombong in Bulacan before emptying in Manila Bay. Under the 20-year flood discharge, Labangan channel will be expanded from 80 meters to a width of 750 meters.
c) Resettlement area/Base mound – Around 198 hectares of resettlement lands will be
established to accommodate some 6,700 families who would be dislocated once the Labangan floodway is widened and deepened.
5.5.5.5. Pasig Pasig Pasig Pasig –––– Potrero River Diking System (FVR Mega Dike)Potrero River Diking System (FVR Mega Dike)Potrero River Diking System (FVR Mega Dike)Potrero River Diking System (FVR Mega Dike) Development ProgramDevelopment ProgramDevelopment ProgramDevelopment Program.... The project
is part of the overall lahar mitigation intervention in the Pasig - Potrero river system implemented to contain the spread of lahar. The proximity of this river system with the region’s center of trade and economic activities made it the most potentially destructive. The situation was further aggravated by the shifting of lahar materials (piracy) at source upstream in 1992 and 1994 which shifted the flow of pyroclastic material from the Abacan and Sacobia-Bamban river system to the Pasig-Potrero river system.
The system (a.k.a. FVR Mega Dike) is a network of dikes with reinforced concrete (facing riverside), enclosing the headwaters of the Pasig-Potrero river in the municipality of Porac down to the lower reaches of the river just before the Gapan-San-Fernando-Olongapo (GSO) road. The structure is more than 37 kilometers in length with an average height of

38
10 meters, and is designed to accommodate 70 million cubic meters of lahar deposits. Some of its weak portion were breached in the past but were readily repaired and fortified.
There is a need to implement regular dredging maintenance works and ensure that quarrying operations do not compromise the integrity of the diking system and bridge structures within the mega dike and Pasig-Potrero river system.
6.6.6.6. ValenzuelaValenzuelaValenzuelaValenzuela----ObandoObandoObandoObando----MeycauyaMeycauyaMeycauyaMeycauyan Drainage Improvement and Related Works Projectn Drainage Improvement and Related Works Projectn Drainage Improvement and Related Works Projectn Drainage Improvement and Related Works Project. The project aims to address flooding problem in Valenzuela, Obando and Meycauyan, Bulacan Areas. Project components are as follows: i) raising and strengthening of existing masonry walls on the left bank of Meycauayan river, ii) raising of existing riprap dike on the left bank of Meycauyan river, iii) channeling, construction of dike, and establishment of regulation pond, iii) raising of Obando-Bulacan Road, iv) establishment of pumping stations and flood control gate structures, among others. The project is in project feasibility preparation stage.
7.7.7.7. GapanGapanGapanGapan----San FernandoSan FernandoSan FernandoSan Fernando----Olongapo (GSO)Road Olongapo (GSO)Road Olongapo (GSO)Road Olongapo (GSO)Road Development ProgramDevelopment ProgramDevelopment ProgramDevelopment Program (Phase I & II)(Phase I & II)(Phase I & II)(Phase I & II). GSO I & II are basically roads and bridges upgrading and/or widening undertaking with dredging component. It is located in the Mt. Pinatubo-affected area in the Province of Pampanga. The main beneficiaries are the municipalities of Bacolor, Lubao, Sta. Rita and Guagua in Pampanga and Dinalupihan in Bataan and the City of San Fernando. Its main component involves the raising or reconstruction of Sta. Cruz Bridge and the widening from two to four lanes, the section from Sta. Barbara Bridge to Sta. Cruz. GSO II involves the construction of the Lubao Bypass and the widening of the GSO section from Sta. Cruz, Lubao to Layac, Dinalupihan, Bataan.
To complete the rehabilitation of the entire stretch of GSO, DPWH may prioritize for road expansion, heightening or even realignment , the flood-prone Mexico- Arayat- Cabiao section.
8.8.8.8. CommunityCommunityCommunityCommunity----Based Forest Management (CBFM).Based Forest Management (CBFM).Based Forest Management (CBFM).Based Forest Management (CBFM). The program will mainly establish tree plantations, develop agro-forestry, and implement livelihood projects for beneficiaries. The program will also include management of coastal marine resources thru maintenance of CBFM mangrove areas.
9.9.9.9. Forestry Sector Forestry Sector Forestry Sector Forestry Sector program (Phase II).program (Phase II).program (Phase II).program (Phase II). This nationwide project aims to restore inherent
multiple functions of watershed and to improve the living standards of upland dwellers by utilization of natural resource in a sustainable manner. The project covers some 36,600 hectares of forestland in the watersheds of Upper Pampanga River located in the province of Nueva Ecija. This represents around forty seven percent of the whole forestland within the watershed. Component activities include community organization and mobilization, rural infrastructure improvement, institutional strengthening and site development.
10.10.10.10. Sierra Madre Reforestation Program.Sierra Madre Reforestation Program.Sierra Madre Reforestation Program.Sierra Madre Reforestation Program. The project aims to improve the forest cover of denuded areas on the slopes of Sierra Madre within the region that are not presently covered by special reforestation projects of the DENR or concerned LGUs. Initial focus shall be areas that are identified critical watersheds but have not yet been included under the National Integrated Protected Area System. An initial activity shall be an assessment of all forest resources of the region and determining the actual tenure arrangements with the view of determining present open access areas.

39
11.11.11.11. Arayat National Park Development ProjectArayat National Park Development ProjectArayat National Park Development ProjectArayat National Park Development Project. The project aims to effectively protect, conserve and manage Arayat national park in order to maintain ecological biodiversity and promote sustainable development. Under the project, degraded areas within proclaimed protection zones shall be restored. The project shall also strengthen linkages with NGOs, LGUs, POs, NGAs in the biodiversity conservation, management and development of the park. Provision of livelihood opportunities to local residents shall also be undertaken.
12.12.12.12. Watershed Community Development ProgramWatershed Community Development ProgramWatershed Community Development ProgramWatershed Community Development Program. The project contains a comprehensive
program to directly benefit communities located in watershed areas in the province of Aurora. It has the following components: (1) environmental literacy and awareness activities; (2) strengthening of municipal watershed management committees; (3) implementation of environment enhancing projects; and, (4) establishment of pilot watershed community development centers.
B. Improved� Land� Transport� Access� from� the� Urban�Core� to� the� East�and�West�Coasts�
1.1.1.1. North Rail Project.North Rail Project.North Rail Project.North Rail Project. The Philippine National Railways (PNR) operates the North line, South Line, and the Metro Rail Commuter. The North and South Lines run through an aggregate of 1,296-kilometer route. The North Line caters to the provinces of Bulacan, Pampanga, Tarlac, Pangasinan, Nueva Ecija, La Union, and Ilocos, until its closure sometime in 1989. Railway is adjudged as an important mass transport system as it provides a fast and convenient way of moving people and goods.
Since its closure, the Philippine National Railways (PNR) has been trying to revive the mainline North. The PNR together with the Bases Conversion Development Authority (BCDA) and other parties formed a consortium, which established the North Rail Corporation. The objective is to modernize the North Line through the development of Manila-Clark Rapid Railway System (MCRRS). The project will link Bonifacio Global City and Clark Freeport Zone (CFZ). Based on the study, MCRRS can become independently viable if initially operated between Malolos, Bulacan and Caloocan City. However, if the entire stretch is constructed linking Clark and Bonifacio Global City, MCRRS needs full operation of DMIA as source of ridership.
North Rail is one of the projects ordered by the President to have its contract renewed.
2.2.2.2. IbaIbaIbaIba----TarlacTarlacTarlacTarlac----Sta.Rosa Road.Sta.Rosa Road.Sta.Rosa Road.Sta.Rosa Road. The completion of the Tarlac-Iba Section may not yet be realized in the medium-term considering that a BOT taker is yet to be secured due to limited traffic demand. However, there is a need to increase the reliability of the Tarlac City to Sta. Rosa section most especially in La Paz, Tarlac where perennial flooding is observed during the rainy season. This condition forces small and light vehicles to use longer alternative routes and even heavy vehicles to do the same during the height of flooding. As such, addressing this situation should be given priority by the DPWH.
3.3.3.3. DinalupihanDinalupihanDinalupihanDinalupihan----Angeles Road (DAR) Widening and Upgrading.Angeles Road (DAR) Widening and Upgrading.Angeles Road (DAR) Widening and Upgrading.Angeles Road (DAR) Widening and Upgrading. This is one of the many roads in the region that was severely affected by the eruption of Mt. Pinatubo. The bridges crossing Pasig-Potrero and Porac-Gumain Rivers were already completed. It is to be noted that this road is parallel to the SCTEX. It serves as an alternate or service route.
4.4.4.4. North Luzon Expressway Extension Project (TarlacNorth Luzon Expressway Extension Project (TarlacNorth Luzon Expressway Extension Project (TarlacNorth Luzon Expressway Extension Project (Tarlac----PangasinanPangasinanPangasinanPangasinan----La Union ELa Union ELa Union ELa Union Expressway or xpressway or xpressway or xpressway or TPLEx) .TPLEx) .TPLEx) .TPLEx) . The project proposes to extend the North Luzon Expressway from Sta. Ines up

40
to Rosario, La Union in order to shorten travel time to the industrial estates in Central Luzon and the main entry and exit points of products and people in Limay, Mariveles, Subic and Clark.
C. Increased� Level� of� Service� of� Strategic� Roads� and� North-South�Arterial�Links�
1. Manila North Road (MNR) Widening and Upgrading.Manila North Road (MNR) Widening and Upgrading.Manila North Road (MNR) Widening and Upgrading.Manila North Road (MNR) Widening and Upgrading. The expected completion and operation of the newly upgraded NLE may divert traffic to MNR considering the magnitude of the increase in toll fees. Obviously, it is not possible to operate two (2) parallel expressways in order to induce competition. However, motorists and the riding public may be given choice by upgrading and widening MNR. Currently, the said section is congested and prone to flooding specially during the rainy season. Widened MNR, coupled by coordinated traffic management schemes initiated by local government units (LGUs) concerned is a strong boost to the logistics and transshipment hub agenda of the region. Meycauayan-Tarlac Section, Phases 1 and 2 were already completed.
2. Cagayan Valley Road (CVR) Widening and UpgradingCagayan Valley Road (CVR) Widening and UpgradingCagayan Valley Road (CVR) Widening and UpgradingCagayan Valley Road (CVR) Widening and Upgrading.... The CVR together with the MNR are the main north-south arterial connection of Central Luzon to the rest of the Northern Luzon Regions. The congestion of CVR is particularly evident in i) Plaridel-Baliuag, ii) Cabanatuan City and, iii) San Jose City sections. Under the Upgrading of Pan-Philippine Highway Project, the entire stretch will be rehabilitated and bypasses on critically congested sections will be constructed. Detailed engineering started in 2001. Construction is completed in most part of Region 3.
D. Integrated�Land,�Air�and�Sea�Transport�Modes�
1. Dingalan International Port.Dingalan International Port.Dingalan International Port.Dingalan International Port. The construction and operation of an international port of entry in Dingalan shall pave the way for improved access to the Pacific side not only for Central Luzon but for Metro Manila as well. The project involves: (1) delineation and proclamation of the proposed port zone; (2) preparation of feasibility studies and detailed engineering plans for the port; (3) Gabaldon-Dingalan Road Improvement; and (4) Dingalan-Umiray Road improvement.
2. Global Gateways ProgramGlobal Gateways ProgramGlobal Gateways ProgramGlobal Gateways Program. The program aims to strengthen the linkage between Subic, Clark and Tarlac’s industrial estates by advocating for the unification of the port and air assets of the former two under a single management in order to increase efficiency and accessibility to locators. The Subic-Clark Alliance for Development Council (SCADC) in charge of the program.
3. Feeder Airports Development (Baler and Iba).Feeder Airports Development (Baler and Iba).Feeder Airports Development (Baler and Iba).Feeder Airports Development (Baler and Iba). The project involves the required set of
interventions that shall lead to the operation of feeder airports in Iba, Zambales and Baler, Aurora. Runway widening and extension complemented by road access improvements, fencing and facilities development form the core of activities under this project.
4. Aurora Pacific Economic Zone (APECO) Facilities DevelopmentAurora Pacific Economic Zone (APECO) Facilities DevelopmentAurora Pacific Economic Zone (APECO) Facilities DevelopmentAurora Pacific Economic Zone (APECO) Facilities Development. The project includes the construction of port and airport facilities and corporate center buildings within the proclaimed APECO area.
41
5. Freeport Area of Bataan (FAB) Port Development ProgramFreeport Area of Bataan (FAB) Port Development ProgramFreeport Area of Bataan (FAB) Port Development ProgramFreeport Area of Bataan (FAB) Port Development Program. The project entails the improvement of port facilities in the Freeport Area of Bataan including berthing, anchorage, cargo handling and holding.
6. Conversion of the Roman Highway to a toll expresswayConversion of the Roman Highway to a toll expresswayConversion of the Roman Highway to a toll expresswayConversion of the Roman Highway to a toll expressway. Roman Expressway was constructed as a faster alternate route from the North Luzon Expressway to the Bataan Peninsula, particularly to the industrial areas in the southern coast such as the Limay Petrochemical complex and the Freeport Area of Bataan. The highway is regularly traversed by heavy laden cargo trucks and fuel containers resulting to regular decrease of the pavement and surface quality. Thus, the maintenance of the whole stretch has always posed a problem in mobilizing funds for its maintenance as a high capacity highway. With its conversion to a toll expressway through private sector participation may unburden the national government of its regular maintenance.
E. Upgraded�Tourism�Establishments�
1.1.1.1. Rehabilitation of Tourism FacilitiesRehabilitation of Tourism FacilitiesRehabilitation of Tourism FacilitiesRehabilitation of Tourism Facilities. The region has several tourist destinations. However, these are inadequate and below standard. The region, by encouraging the private sector, shall invest in the rehabilitation and upgrading of existing tourism facilities, such as those in Biak-na-Bato in Bulacan, Mt. Arayat and Mt. Samat in Pampanga and Bataan respectively. Furthermore, the infrastructure sector will be tapped to put in place support infrastructure, such as access roads to tourism areas.
2.2.2.2. Tourism Information Development ProjectTourism Information Development ProjectTourism Information Development ProjectTourism Information Development Project. This project includes the operation or
strengthening of existing tourist information centers or visitor information desks in key areas in all provinces. A component activity shall be the enhancement of Central Luzon’s regional tourism website and the preparation and uploading of linked provincial tourism websites.
3.3.3.3. Strengthening of Local Tourism OfficesStrengthening of Local Tourism OfficesStrengthening of Local Tourism OfficesStrengthening of Local Tourism Offices. This project involves a capability building
program for local tourism officials and employees in planning, programming, implementation and monitoring of tourism development projects. It shall also include assistance in developing and operating local systems and procedures in accrediting tourist establishments. Through the project, some LGUs may be assisted in formulating their local tourism codes.
F. Developed�Clark-Subic�Regional�Tourism�Hub�
1.1.1.1. SubicSubicSubicSubic----Clark InterClark InterClark InterClark Inter----Regional Tourism HubRegional Tourism HubRegional Tourism HubRegional Tourism Hub. Under this project, intra-provincial, inter-provincial and inter-regional tourism circuits shall be identified with the Clark-Subic area serving as the hub. A major activity shall be the preparation or updating of the Central Luzon Tourism Master Plan, strengthening of the association of tourism establishments in the region and the local government tourism offices, promotion and conduct of a series of tourism festivals, promotion and preparation of collaterals.
2.2.2.2. Improvement Of Physical Access To Tourist DestinationsImprovement Of Physical Access To Tourist DestinationsImprovement Of Physical Access To Tourist DestinationsImprovement Of Physical Access To Tourist Destinations. The Department of Public
Works and Highways and Local Government Units shall jointly identify sections of the region’s road network that lead to key tourist destinations and prioritize the same for rehabilitation, repair, reconstruction or improvement. At the same time, road directional

42
signage shall be improved to be at par with international standards. Initially, the replacement of road signage shall be done in major roads and along other roads leading to the identified key tourist destinations.
Other components of this program shall include: the development of a fast craft ferry route through Manila-Corregidor-Bataan; opening of Clark-Baler and Clark-Iba air routes for passengers. Public-Private-Partnership shall be the main engine to keep this program running.
G. Improved�Profitability�and�Sustainability�of�MSMEs�
1.1.1.1. Small and Medium Enterprises (SME) Development.Small and Medium Enterprises (SME) Development.Small and Medium Enterprises (SME) Development.Small and Medium Enterprises (SME) Development. The Regional SME Team intends to
provide SMEs several services such as giving assistance on marketing and product
design, thru the establishment of a regional design and packaging center. The Team
intends to intensify information and education campaign on available government loan
guarantee programs. Recommendations to financial institutions for financing programs
that will rationalize collateral requirements of SMEs will also be made. The local
government units and government agencies will be enjoined to fully implement the anti-
red tape act (ARTA). To further assist SMEs reduce the cost of doing business, DTI shall
continuously follow through the consistent reduction in the processing time for
government transactions.
2.2.2.2. Establishment of a Regional PackEstablishment of a Regional PackEstablishment of a Regional PackEstablishment of a Regional Packaging and Design Center.aging and Design Center.aging and Design Center.aging and Design Center. The center, to be operated
jointly by the DTI and DOST, shall house experts on product design and packaging who
can be tapped to assist SMEs or local governments in improving their products to make
them globally-competitive. Also, trainings and seminars on packaging and product
design shall be regularly conducted by the center for prospective and active
entrepreneurs in the region.
3.3.3.3. Establishment of a peace and security information network.Establishment of a peace and security information network.Establishment of a peace and security information network.Establishment of a peace and security information network. The concept of “watch your neighborhood” will be encouraged from the smallest unit like the subdivision, sitio, barangay, municipality, city, province, region. Information and reporting will be treated with confidentiality to encourage the reporting to security agencies. Information through landline and mobile phone hotlines may assuage fear of retribution. A Peace and Order Communication System complete with the necessary Infrastructure (equipment, system), marketing and an integrated information dissemination system and Information Education Communication (IEC) materials to generate greater security consciousness and support from the citizenry.
4.4.4.4. Strengthening of Barangay Peace and Order Councils.Strengthening of Barangay Peace and Order Councils.Strengthening of Barangay Peace and Order Councils.Strengthening of Barangay Peace and Order Councils. Barangay Peace and Order
Councils will be strengthened through training and logistical support. Priority will be given to the capability building for Barangay Tanods in mediation, peace keeping and law enforcement.
5.5.5.5. Business Permits and Licensing SystemBusiness Permits and Licensing SystemBusiness Permits and Licensing SystemBusiness Permits and Licensing System (BPLS)(BPLS)(BPLS)(BPLS). The project seeks to establish computer-based permitting and business license processing and issuance in all local government units throughout the region through the assistance of the Department of the Interior and Local Government.

43
H. Environment-Friendly�Mining�Operations�
1.1.1.1. Mining Industry RevitalizationMining Industry RevitalizationMining Industry RevitalizationMining Industry Revitalization . The Mines and Geo-Sciences Bureau (MGB), the
Environment Management Bureau (EMB) and host LGUs shall work hand in hand to
proactively promote preferred environment-friendly mining and quarrying operators in
mineral and non-mineralized resource-rich areas. While the industry shall be revitalized
through operating new mines or quarries, or reopening idle or abandoned mines,
standardized appropriate environment-protective measures must be required before
mining permits and concessions are granted. The MGB intends to operate a One-Stop-
Shop (OSS) and Mineral Information Action Center (MIAC) for the judicious and fast
granting of mining permits.
I. Cheap�and�Plentiful�Food�
1.1.1.1. Bulacan North Food Terminal CBulacan North Food Terminal CBulacan North Food Terminal CBulacan North Food Terminal Complexomplexomplexomplex.... This project of the Provincial Government of
Bulacan, will contribute to the region’s vision of agricultural modernization, countryside
development and food security. Specifically, it will promote proper handling, packaging,
processing of agricultural products, which will result into lower post-harvest losses,
product quality and better prices. Ground-breaking ceremonies for the construction of the
project were held in December 2008. The rites signaled the start of construction of a
two-storey building that will house some 760 trading stalls.
2.2.2.2. Establishment of Online Trading and Commodity Exchange NetworkEstablishment of Online Trading and Commodity Exchange NetworkEstablishment of Online Trading and Commodity Exchange NetworkEstablishment of Online Trading and Commodity Exchange Network. This project directly supports the operation of the proposed Bulacan North Food Terminal. An initial step of this project is the identification and registration of commodity trading groups in collaboration with the existing business-to-business initiatives of the Land Bank of the Philippines. Business centers shall be established in key municipalities while the hub shall be located in the North Food Terminal. Online computer terminals shall also be established in barangays to provide farmers with easy access to market information.
3.3.3.3. Agricultural Extension IntensificationAgricultural Extension IntensificationAgricultural Extension IntensificationAgricultural Extension Intensification. The Department of Agriculture, Bureau of Fisheries and Aquatic Resources, PhilRice, state colleges and universities (SCUs), and local government units (LGUs) will consolidate efforts to identify technological interventions both in farming and fisheries, and to disseminate such knowledge to farmers and fisher folks. The project also involves the mobilization and re-tooling of devolved agricultural extension personnel and strengthening of the network of farmers’ training centers.
4.4.4.4. Freshwater Fishes (Freshwater Fishes (Freshwater Fishes (Freshwater Fishes (TilapiaTilapiaTilapiaTilapia and Pangasius)and Pangasius)and Pangasius)and Pangasius) Development Program.Development Program.Development Program.Development Program. This collaborative
undertaking among the private sector, local governments and the Department of Agriculture seeks to expand the production of one-piece-a-kilo tilapia for fillet. Through the project, small tilapia growers shall be organized to consolidate their fishponds into minimum of 80-hectare production farms and extended assistance (technology, financing and marketing). The project also entails assistance to the production of pangasius fish and the establishment of cold storage facilities in the region’s fishpond areas. It also involves assistance in establishing fish processing activities and facilities.
5.5.5.5. Mango Mango Mango Mango Development ProgramDevelopment ProgramDevelopment ProgramDevelopment Program. This involves the establishment of a mango research and training center and the conduct of scientific researches on the pests and diseases

44
affecting the industry. It shall also include post harvest processing research and technology generation and dissemination.
6.6.6.6. Agricultural Research Development ProgramAgricultural Research Development ProgramAgricultural Research Development ProgramAgricultural Research Development Program. This entails strengthening the research
capabilities of SCUs and other research institutions in the region focusing on commodities where the region enjoys comparative advantages. This involves establishment of research centers on onion, tilapia, mango and forest products in Nueva Ecija University of Science and Technology, Pampanga Agricultural Colleges, Ramon Magsaysay Technological University and Aurora State College of Technology, respectively.
7.7.7.7. Quality Fish Brood Stock/Fingerling ProductionQuality Fish Brood Stock/Fingerling ProductionQuality Fish Brood Stock/Fingerling ProductionQuality Fish Brood Stock/Fingerling Production. The Bureau of Fisheries and Aquatic Resources (BFAR) thru its Regional Fish Production Centers shall maintain and produce and disperse quality brood stock and fingerlings of freshwater, brackish water and marine fish species.
J. Increased�Rural�Farming�and�Fisher�Folk�Family�Incomes��
1.1.1.1. Establishment Establishment Establishment Establishment oooof A Cold Storage Chain f A Cold Storage Chain f A Cold Storage Chain f A Cold Storage Chain iiiin The Region.n The Region.n The Region.n The Region. This private sector-driven project is a means to consolidate small farmer productions and increase their capabilities to respond to market changes. Through the project, farmers’ vulnerability to depressed prices during bumper harvests shall be lessened. Both onion and mango growers shall benefit from this project.
2.2.2.2. Promotion Promotion Promotion Promotion oooof Contract Growing Arrangements Between Farmers And Processorsf Contract Growing Arrangements Between Farmers And Processorsf Contract Growing Arrangements Between Farmers And Processorsf Contract Growing Arrangements Between Farmers And Processors. The main activity under this project involves establishment and maintenance of a databank of agri-processors and producers within and outside the region. This databank shall be available to the region’s producers. A support activity shall be the holding of regular conferences and dialogues between industry players and producers before the onset of the planting season.
3.3.3.3. Agricultural Production Support ProgramAgricultural Production Support ProgramAgricultural Production Support ProgramAgricultural Production Support Program. The project involves the dissemination of soil/crop suitability maps to farmers and farmer organizations by the Department of Agriculture through the local agriculture offices. It also involves the conduct of capability training programs for local agricultural technicians to keep them abreast with production technologies. Logistical assistance shall also be included.
4.4.4.4. Common PostCommon PostCommon PostCommon Post----Harvest Processing, Handling Harvest Processing, Handling Harvest Processing, Handling Harvest Processing, Handling aaaand Storage Facilities nd Storage Facilities nd Storage Facilities nd Storage Facilities aaaand Service Centersnd Service Centersnd Service Centersnd Service Centers. Under this project, the Department of Agriculture, in close coordination with local government units, shall cause the establishment of common service facilities for the region’s major crops in strategic areas. The operation of the centers shall be turned over to cooperatives that shall also be provided capability building programs.
5.5.5.5. Feasibility Study on the Establishment of Nueva EcijaFeasibility Study on the Establishment of Nueva EcijaFeasibility Study on the Establishment of Nueva EcijaFeasibility Study on the Establishment of Nueva Ecija----Aurora AgriAurora AgriAurora AgriAurora Agri----Processing CenterProcessing CenterProcessing CenterProcessing Center. The study shall determine the feasibility of establishing a central processing point for Nueva Ecija and Aurora raw agri- and forest products for value-adding purposes and technical capability upgrading of farmers and farm workers. The center is planned to serve as technology transfer facilitation and productivity-upgrade mechanism. The nature of linkage that must be established with APECO for optimality shall be highlighted.
6.6.6.6. Establishment of Digital VillagesEstablishment of Digital VillagesEstablishment of Digital VillagesEstablishment of Digital Villages. This project shall involve the establishment of online workstations in Barangay kiosks where farmers can access online information on

45
agriculture and related areas. The project shall also include a training component to benefit farmers and key local leaders on the use and maintenance of their facility.
7.7.7.7. Land acquisition, distribution and support servicesLand acquisition, distribution and support servicesLand acquisition, distribution and support servicesLand acquisition, distribution and support services. The intervention shall complete the land distribution aspect of agrarian reform. To ensure the viability and sustainability of the distributed farm lots, adequate support facilities shall be provided. These facilities to be provided in Agrarian Reform Communities (ARCs) include farm-to-market roads, irrigation, power supply, among others. Non-infrastructure support namely, capability-building and community organization shall likewise be provided.
K. Lahar-Covered�Areas�Restored�to�Productive�Use�
1.1.1.1. Rehabilitation of Existing Irrigation SystemsRehabilitation of Existing Irrigation SystemsRehabilitation of Existing Irrigation SystemsRehabilitation of Existing Irrigation Systems. The National Irrigation Administration (NIA)
shall embark on an assistance program to LGUs that are maintaining communal irrigation systems requiring rehabilitation and improvements. Special attention shall be given to lahar-affected areas which for two decades have remained barren and idle. Large tracts of land in these areas can more than offset the losses in area coverage for agricultural production resulting from uncontrolled agricultural land conversion.
2.2.2.2. Recovery of LaharRecovery of LaharRecovery of LaharRecovery of Lahar----covered Agricultural Production areas Project.covered Agricultural Production areas Project.covered Agricultural Production areas Project.covered Agricultural Production areas Project. The project involves
assistance to owners of agricultural lands covered by lahar around Mt. Pinatubo.
3.3.3.3. Bamboo Development Project.Bamboo Development Project.Bamboo Development Project.Bamboo Development Project. Bamboo is a fast-growing grass ideal for re-vegetation and known for its tenacity to resist typhoons and strong ground-holding character in the midst of floods. Propagation has started but supply level needs to be sustained for lack of enough space for nurseries.
L. Improved�Basic�Education�Achievement�Rates�
1.1.1.1. Provision of educational facilities that include classrooms with the attendant facilities, Provision of educational facilities that include classrooms with the attendant facilities, Provision of educational facilities that include classrooms with the attendant facilities, Provision of educational facilities that include classrooms with the attendant facilities, textbooks, computer sets at the elementary and secondary levelstextbooks, computer sets at the elementary and secondary levelstextbooks, computer sets at the elementary and secondary levelstextbooks, computer sets at the elementary and secondary levels. The intervention involves the construction of school classrooms and provision of equipment, supplies and materials which are indispensable to improving access to and ensuring quality basic education. The construction of 2,564 (709 elementary and 1,855 secondary) classrooms shall result in the attainment of the standard 1:45 classroom-pupil ration. Provision of textbooks will help realize the standard 1:1 pupil-textbook ratio. The construction of computer laboratories with 50 sets of computers to 341 secondary schools and the provision of 20 computer sets to 2,422 established laboratory schools shall ensure the transfer of necessary computer literacy skills.
2.2.2.2. Skills Training cum Classroom ConstructionSkills Training cum Classroom ConstructionSkills Training cum Classroom ConstructionSkills Training cum Classroom Construction. A combination of infrastructure and
capacity-building, the intervention is intended to speed up the provision of classrooms through the innovative scheme of classroom construction and parallel technology transfer. It has the two-pronged objective of increasing the regional stock of elementary and high school classrooms through the construction of new classrooms and the provision of employable technical skills.
3.3.3.3. Financial assistance and scholarship to deserving poor students.Financial assistance and scholarship to deserving poor students.Financial assistance and scholarship to deserving poor students.Financial assistance and scholarship to deserving poor students. The financial inability
of poor families to send their children to school despite their exceptional intelligence

46
renders them helpless. The program is intended to reverse this state of affairs by making the cost of education affordable for them through the provision of financial support in the form of subsidy, the grant of special privileges, and other alternative schemes resulting in exemption from payment of school fees and/or the provision of stipends or allowances.
4.4.4.4. Early childhood care and development.Early childhood care and development.Early childhood care and development.Early childhood care and development. The pre-elementary needs of children ages 3-6
years in terms of proper nutrition and favorable learning environment has lifelong effects on the child’s learning capability and emotional and psychological disposition as human person. The program is characterized by integrated developmental approach in addressing the inadequacy and irrelevance of support mechanisms to the child’s development by providing equipment, supplies, materials to children-beneficiaries and capacity-building interventions to parents and service providers.
5.5.5.5. Elementary Science and Math Centers ProjectElementary Science and Math Centers ProjectElementary Science and Math Centers ProjectElementary Science and Math Centers Project. The Department of Education and the
concerned provincial government shall partner in establishing mathematics centers in strategic elementary schools in every congressional district in the region. The project also involves the establishment of similar science centers. These centers shall serve as models for basic education provision on Mathematics and science for elementary pupils, and shall also serve as training centers for elementary school teachers on the subject.
M. World-Oriented�Higher�Education�Institutions�
1.1.1.1. Capacity building of service providersCapacity building of service providersCapacity building of service providersCapacity building of service providers. The program is intended to raise the skills
competency levels of providers of health, educational and social welfare services to optimize the impact of social service interventions and improve quality of education.
2.2.2.2. Training Program on Production ProcessesTraining Program on Production ProcessesTraining Program on Production ProcessesTraining Program on Production Processes in Economic and Freeport Zonesin Economic and Freeport Zonesin Economic and Freeport Zonesin Economic and Freeport Zones. . . . Economic and Freeport Zones shall be declared as centers of technology transfer. Due accreditation of programs and certification of competencies shall be given by Technical Education and Skills Development Authority (TESDA).
3. Program forProgram forProgram forProgram for AcademeAcademeAcademeAcademe----Industry LinkageIndustry LinkageIndustry LinkageIndustry Linkage. . . . This will include a review of the existing curricula and a continuing review and assessment of the teaching capability of courses where licensed graduates clog the unemployment market. Commission on Higher Education (CHED’s) regulatory powers shall be used in terms of curricular offering; its scholarship programs shall provide the ‘carrot’ policy for courses forecast to be highly employable.
4.4.4.4. Academic Academic Academic Academic Research on the State of the English Language as Competitive Research on the State of the English Language as Competitive Research on the State of the English Language as Competitive Research on the State of the English Language as Competitive Edge in Edge in Edge in Edge in Employment.Employment.Employment.Employment. The study is intended to diagnose the real state of English language for college graduates and recommend measures to arrest its further degradation as a medium of instruction in schools and as medium in communication in work places. Filipino’s competency and skill in the use of English over other Asians serves as competitive edge in employment. The study will arrest the inroad of other Asians in the realm which has been dominated by Filipinos.

47
N. Relevant� Technical-Vocational� Education� and� Training� Programs�(TVET)��1. Intensified Social Marketing and Advocacy Program of TVET at the enterprise and
community level
2. Strict implementation of the TESDA Quality Monitoring System
3. Re-design of TVET scholarship programs for efficiency and relevance
4. Development of practical and relevant training modules for more effective results based
on TVET graduates’ employability
5. Annual tracking of TVET Program graduates and evaluation for its continuing relevance
and flexibility in the local and global labor market
O. Improved�Access�to�Health�Services�
1.1.1.1. Establishment of Botica ng Barangay and expansion of the service outlets of Gamot na Establishment of Botica ng Barangay and expansion of the service outlets of Gamot na Establishment of Botica ng Barangay and expansion of the service outlets of Gamot na Establishment of Botica ng Barangay and expansion of the service outlets of Gamot na
Mabisa at AbotMabisa at AbotMabisa at AbotMabisa at Abot----Kaya (GMA 50)Kaya (GMA 50)Kaya (GMA 50)Kaya (GMA 50). High cost of medicines does not only make the poor susceptible to diseases, they also fall prey to unscrupulous counterfeit and fraudulent drug dealers. Both the Botica ng Barangay (BnB) and Gamot na Mabisa at Abot-kaya (GMA) 50 are programs intended to make affordable and available commonly-dispensed effective medicines. Under the BnB, drugs are dispensed to barangay residents with the aid of qualified service providers. GMA 50 is provided through service outlets in the Unified Local Health System (ULHS) hospitals.
2.2.2.2. Monitoring and Testing of Water PotabilityMonitoring and Testing of Water PotabilityMonitoring and Testing of Water PotabilityMonitoring and Testing of Water Potability. Regular monitoring and testing of water
quality is aimed at preventing and minimizing the incidence of water-borne diseases. It involves technical assistance in the detection of unsafe water and advocacy on the hazards it may cause to end-users.
P. Security�over�Property�Rights�for�the�Vulnerable�and�Marginalized�
1.1.1.1. Implementation of the De Soto Property Rights Program in the Region.Implementation of the De Soto Property Rights Program in the Region.Implementation of the De Soto Property Rights Program in the Region.Implementation of the De Soto Property Rights Program in the Region. This is a national project to improve access by urban poor residing in government lands to capital by providing them rights over the lands where their houses are built. The rights can be used as collateral for loan transactions by the concerned families.
2.2.2.2. Delineation, titling of ancestral domains/landsDelineation, titling of ancestral domains/landsDelineation, titling of ancestral domains/landsDelineation, titling of ancestral domains/lands. Determination of land areas owned by Indigenous Peoples (IPs) under the concept of native title as well as their categorization into Certificate of Ancestral Domain Claims (CADCs) and Certificate of Ancestral Domain Titles (CADTs) has to be undertaken for the promotion of their development as distinct sector of society. Delineation of seven (7) CADC areas in the region is targeted for completion.

48
3.3.3.3. Ancestral Domain Development Program.Ancestral Domain Development Program.Ancestral Domain Development Program.Ancestral Domain Development Program. The project aims to fast-track the delineation and processing of ancestral domain titles of indigenous communities and assist them in fully harnessing the benefits that may be generated in their domains. The project shall also include the establishment of an IP cultural center in each of the provinces where studies of past cultural practices shall be encouraged.
Q. Executive�and�Legislative�Agenda��
1.1.1.1. Establishment of a Regional Budget Allocation FundEstablishment of a Regional Budget Allocation FundEstablishment of a Regional Budget Allocation FundEstablishment of a Regional Budget Allocation Fund (RBAF) in which the Regional Development Council (RDC) III shall be given authority to allocate funds for provinces infrastructure and other projects for the socially-disadvantaged under the existing budgeting processes.
2.2.2.2. Creation of a special courtCreation of a special courtCreation of a special courtCreation of a special court to specifically and strictly monitor the enforcement or non-enforcement of the “participation” provisions of the Local Government Code in the preparation of Comprehensive Land Use Plans (CLUPs) and Comprehensive Development Plans (CDPs). Consolidation of local plans and investment programs shall be tracked to ensure coherence of development challenge definition, objective and target-setting and project identification and relevance of intervention for linkage and relevance of plans and for greater effective results.
3.3.3.3. InstInstInstInstitutionalization of a Public Reporting Systemitutionalization of a Public Reporting Systemitutionalization of a Public Reporting Systemitutionalization of a Public Reporting System for Revenue Collection and Public Fund Spending down to the community level.
4.4.4.4. Creation of a Regional Ombudsman Creation of a Regional Ombudsman Creation of a Regional Ombudsman Creation of a Regional Ombudsman to track performance and conduct of public officials and employees.

49
Chapter�5:� Monitoring�Plan�Implementation��
RationaleRationaleRationaleRationale. Monitoring the implementation of the 2011-2016 Central Luzon Regional Development Plan shall focus on answering on a regular or annual basis the following questions: 1. What are the indicators that can measure the attainment of each development
objective? 2. What projects identified in the investment program have been funded? 3. Of the funded projects, what projects were completed within the year? 4. What are the development objectives being addressed by each implemented project and
what are the indicators that measure the attainment of the objectives? 5. Are there changes in the development indicators before the planning period up to latest
available data sets? 6. What is the status of each unfunded project? What is the implication to the overall plan
objective if such projects are not funded and implemented?
Clearly these questions cannot be answered from the existing Regional project Monitoring System alone although the reports generated from the RPMES can be valuable inputs to determining the plan’s implementation status. It should be noted that in any monitoring systems, there is a need to determine the baseline conditions using an indicator system that should be able to measure in the future whether the development objectives are being met or not. This set of indicators shall be different from project-based implementation performance indicators. The succeeding section presents the indicator system that shall adopted for the monitoring of the 2011-2016 CL-RDP. 2011201120112011----2016 CL2016 CL2016 CL2016 CL----RRRRDP DP DP DP . The following indicator system is an attempt to measure the attainment of the adopted development objectives using existing secondary datasets that are readily available in national government agencies, statistics generating offices and local government units. It does not propose any indicator that shall require primary data gathering. There are two sets of indicators: the first set being those pertaining to the attainment of the long term vision and its elements; while the second set tries to capture performance on the medium term development objectives. Thus, each objective has a corresponding set of indicators. The proposed indicator system is summarized in the following Table of Indicators:
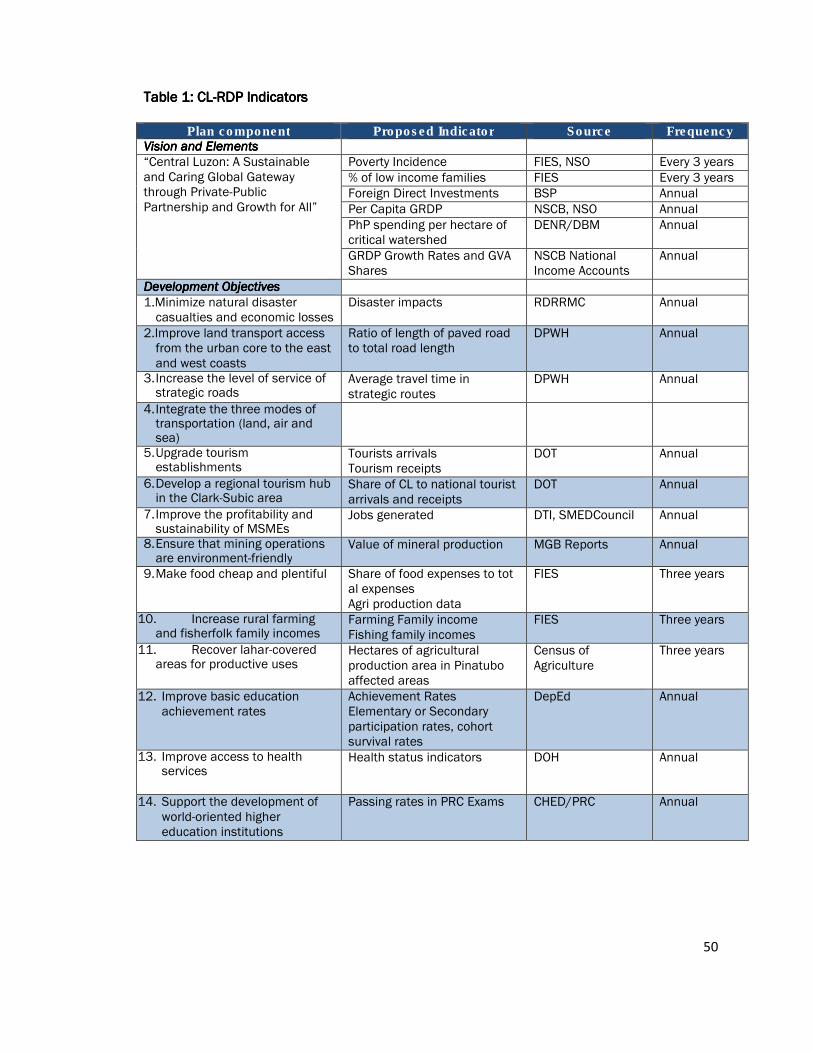
50
Table 1: CLTable 1: CLTable 1: CLTable 1: CL----RDP IndicatorsRDP IndicatorsRDP IndicatorsRDP Indicators
Plan component Proposed Indicator Source Frequency Vision and ElementsVision and ElementsVision and ElementsVision and Elements
“Central Luzon: A Sustainable and Caring Global Gateway through Private-Public Partnership and Growth for All”
Poverty Incidence FIES, NSO Every 3 years
% of low income families FIES Every 3 years
Foreign Direct Investments BSP Annual
Per Capita GRDP NSCB, NSO Annual
PhP spending per hectare of critical watershed
DENR/DBM Annual
GRDP Growth Rates and GVA Shares
NSCB National Income Accounts
Annual
Development ObjectivesDevelopment ObjectivesDevelopment ObjectivesDevelopment Objectives
1.Minimize natural disaster casualties and economic losses
Disaster impacts RDRRMC Annual
2.Improve land transport access from the urban core to the east and west coasts
Ratio of length of paved road to total road length
DPWH Annual
3. Increase the level of service of strategic roads
Average travel time in strategic routes
DPWH Annual
4. Integrate the three modes of transportation (land, air and sea)
5. Upgrade tourism establishments
Tourists arrivals Tourism receipts
DOT Annual
6. Develop a regional tourism hub in the Clark-Subic area
Share of CL to national tourist arrivals and receipts
DOT Annual
7. Improve the profitability and sustainability of MSMEs
Jobs generated DTI, SMEDCouncil Annual
8. Ensure that mining operations are environment-friendly
Value of mineral production MGB Reports Annual
9. Make food cheap and plentiful Share of food expenses to tot al expenses Agri production data
FIES Three years
10. Increase rural farming and fisherfolk family incomes
Farming Family income Fishing family incomes
FIES Three years
11. Recover lahar-covered areas for productive uses
Hectares of agricultural production area in Pinatubo affected areas
Census of Agriculture
Three years
12. Improve basic education achievement rates
Achievement Rates Elementary or Secondary participation rates, cohort survival rates
DepEd Annual
13. Improve access to health services
Health status indicators DOH Annual
14. Support the development of world-oriented higher education institutions
Passing rates in PRC Exams CHED/PRC Annual
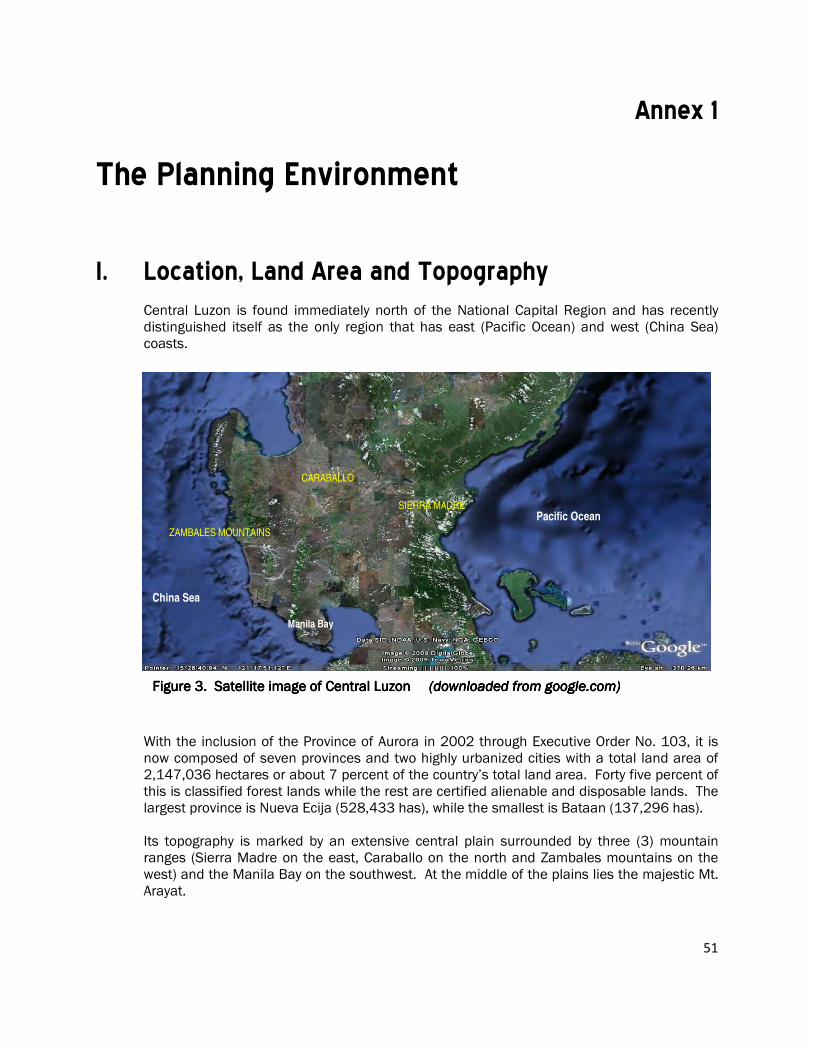
51
Figure 3Figure 3Figure 3Figure 3. Satellite image of Central Luzon . Satellite image of Central Luzon . Satellite image of Central Luzon . Satellite image of Central Luzon (downloaded from google.com)(downloaded from google.com)(downloaded from google.com)(downloaded from google.com)
SIERRA MADRE
ZAMBALES MOUNTAINS
CARABALLO
Pacific Ocean
China Sea
Manila Bay
Annex�1�
The�Planning�Environment�
�I.� Location,�Land�Area�and�Topography��
Central Luzon is found immediately north of the National Capital Region and has recently distinguished itself as the only region that has east (Pacific Ocean) and west (China Sea) coasts.
With the inclusion of the Province of Aurora in 2002 through Executive Order No. 103, it is now composed of seven provinces and two highly urbanized cities with a total land area of 2,147,036 hectares or about 7 percent of the country’s total land area. Forty five percent of this is classified forest lands while the rest are certified alienable and disposable lands. The largest province is Nueva Ecija (528,433 has), while the smallest is Bataan (137,296 has). Its topography is marked by an extensive central plain surrounded by three (3) mountain ranges (Sierra Madre on the east, Caraballo on the north and Zambales mountains on the west) and the Manila Bay on the southwest. At the middle of the plains lies the majestic Mt. Arayat.

52
The region has a long coastline and only the provinces of Tarlac and Nueva Ecija are landlocked. Several municipalities in the province of Bulacan and Pampanga with coasts along Manila Bay experience regular tidal flooding that are often exacerbated by high intensity, short duration rainfall occurrences. The same areas contribute to freshwater fish production of the region and of the country since extensive fishponds are operating here. This is also true in low-lying and flood-prone areas in other provinces where mangrove and nipa areas are used for the construction of fishponds.
II. Population
Central Luzon’s population as of 2010 is estimated at 10, 159,300. By 2015 the population is projected to increase to 11,124,400, accounting for 11 percent of the total population of the Philippines and one of the most populous regions.
The annual population growth rate between the years 2000 and 2007 was 2.36 percent which is slower than the 3.2 percent annual increase registered between 1995 and 2000.
The population is relatively young with those aged 15 years and below comprising more than one-third or 35.3percent of the population in 2000.
Central Luzon is rapidly urbanizing. In 2000, about 4.86 million or 60.5 percent of the population were living in barangays classified as urban, a marked increase from 41.8 percent urbanization recorded in 1980. Such high urban growth, poses strains in the availability of quality critical basic services and resources such as water, electricity, sanitation, waste management, public health, services, education and environment.
III. Family�Income�and�Poverty�Incidence
On the average incomes of families have risen, but income distribution deteriorated between 2003 and 2006 with the Gini coefficient rising from 0.3515 to 0.3994.
35.5
29.2
16.821.4
17.520.7
17.75
0
5
10
15
20
25
30
35
40
1991 1994 1997 2000 2003 2006 2015
Fig. 4 . Incidence of Poor Population (%) in Central Luzon
Incidence
MDG Target
Source: National Statistics Office

53
The share of income of families in the highest decile was more than thirteen times the share of those in the poorest decile. On the whole, significant progress has been made in the fight against poverty in the region. The proportion of the population classified as poor decreased from 35.5 percent in 1991 to 15.3 percent in 2009 (NSCB). With the exception of the years 2000 and 2006 the incidence of poor population steadily declined. In 2006, NSCB estimated that 26.6 percent of children, 16.5 percent of youth, 18.9 percent of women, 20.2 percent of farmers, 23.9 percent of fishermen are living in poverty. The Millennium Development Goal (MDG) target of halving the incidence of poor population by 2015 or lowering the incidence to 17.75 percent has a very high probability of being achieved. Compared to the other regions, Central Luzon has the second lowest incidence of poor population. Bataan, Pampanga, and Bulacan belong to the top seven provinces with the least incidences of poor. However, the absolute number of poor remains sizeable at 1,914,590 persons as of 2006 belonging to 320,109 families. Gains are uneven within the region. More than 70 percent of the poor live in Nueva Ecija, Bulacan and Tarlac.
IV. Gross�Regional�Domestic�Product
From 2004-2009 Central Luzon’s economic output grew from P381.4 to P 576.6 billion. In real terms, GRDP expanded by 16.2 percent with an annual average growth of 2.9 percent. The main contributor was the services sector, which grew annually at an average of 4.7 percent. All sub-sectors of services expanded led by transportation, communication and storage (TCS), finance and the ownership of dwellings and real estate (ODRE) industries. These three sub-sectors expanded more than six percent during the period. Growth in the TCS can be attributed to the growth of land transportation and mobile phone industries.
2 2.74
5.9
3.8
-1.4
-5
0
5
10
'03-'04 '04-'05 '05-'06 '06-'07 '07-'08 '07-'08
Figure 5. GRDP Growth Rate (%) : Central Luzon, 1985 = 100
Source: National Statistics Office

54
The expansion of ODRE in particular, and the services sector as a whole may also be attributed to spending of families with OFW relatives. Based on the National Statistics Office survey, the number Overseas Filipino Workers from Central Luzon has more than doubled since 2003. As of 2009, it was estimated that 14.7 percent of country’s Overseas Filipino Workers were from the region. This could explain the rise in the number of banks and levels of bank deposits. Industry sector accounted for 35.6 percent of GRDP but its roller-coaster performance resulted in only 1.1 percent average annual growth during the period. The manufacturing sector is the largest industry with a share of 23% of Central Luzon’s total GDP in 2009.
Mostly micro and small scale establishments, manufacturing is dominated by food processing; electrical and electronic components and equipment; furniture; and garments. The manufacturing industry is highly vulnerable to external shocks hence its performance is inconstant. Construction and electricity gas and water sectors posted modest growths but these were not enough to offset the slump in manufacturing and mining sub- sectors. Mining and quarrying industry contribution to the region’s economy remains minuscule despite the region’s rich mineral deposits. Since 2004, industry sector has been overtaken by services in its share to regional GDP.
Agriculture managed a 2.8 percent GVA increase despite the onslaught of several typhoons and unabated conversion of agricultural lands to other uses. Palay production consistently increased as a result of increasing use of high yielding varieties and offsetting decreases in livestock and fishery production. The region continued to top other regions in the production of onion, hog and poultry.
In 2009 Central Luzon contributed 8.1 percent to the total GDP of the country, enough to maintain its rank as the third largest contributor among the regions. However the region’s contribution has slipped from 8.6 percent in 2004 due to contracting contributions of industry and services sector. This occurred despite the presence of a network of special economic zones and Freeport zones in the region composed of Subic Bay Freeport Zone, Clark Freeport Zone, the recently converted Freeport Area of Bataan (from the Bataan Economic Zone), Luisita Industrial Park, Hermosa Industrial Estate, Bataan Petrochemical Complex, the Limay Military Industrial Special Economic Zone and a host of smaller private industrial estates in Bulacan and Pampanga. The Aurora Pacific Economic Zone (APECO) is a recent addition to this network. Years have passed since the establishment of most of these economic zones and although some have attracted locators that opened up thousands of jobs, there remains large tracts of lands within the proclaimed areas that remain unoccupied and undeveloped.
Overall, the region did not reach the growth targets due to the lackluster performance of the industry sector and lesser than expected growth of the services sector. Table 2 summarizes the target and actual growth rates in GRDP and Gross Value Added (GVA) in the three major industry groups, Agriculture, Fishery and Forestry (AFF), Industry and Services and reasons for attainment/non-attainment of plan targets.

55
TableTableTableTable 2222. GRDP/GVA Actual Growth Rates vs Plan Targets. GRDP/GVA Actual Growth Rates vs Plan Targets. GRDP/GVA Actual Growth Rates vs Plan Targets. GRDP/GVA Actual Growth Rates vs Plan Targets Central Luzon Region, 2004Central Luzon Region, 2004Central Luzon Region, 2004Central Luzon Region, 2004----2009200920092009.
Period GRDP
Gross Value Added (GVA)
Agriculture, Fishery and
Forestry Industry Services
2003-2004
Growth Target (%) 4.8 3.7 5.0 5.4
Actual Growth (%) 2.0 1.1 -0.8 5.5
Reasons for Deviations
• Political instability pulls down investments.
• Typhoons Violeta, Winnie and Yoyong swept though the region during the latter part of the year and adversely affected the livestock sector, particularty pulling down by carabao, cattle and hog production.
• Growth of TCS, trade and finance
2004-2005
Growth Target (%) 5.1 4.0 5.4 5.8
Actual Growth (%) 2.7 3.8 0.1 4.7
Reasons for Deviations
• Slower growth for rice and decreases in the livestock and commercial fishery sectors offset the gains made in the other subsectors causing the agriculture sector to achieve a lower than expected growth for the year.
• Political instability continue to pull down investments
2005-2006
Growth Target (%) 6.0 4.1 6.8 6.4
Actual Growth (%) 4.4 4.8 2.8 5.8
Reasons for Deviations
• On going construction of SCTEX, Casecnan, and Subic Bay Port pushep up construction.
• The DA attributes the better-than expected growth to better weather conditions that had growths in the region’s major products – palay, swine, and poultry and aquaculture- pushed up ahead of the previous year’s level.
• Lower than previous year investment yields results in low GVA for manufacturing.
2006-2007
Growth Target (%) 6.5 4.3 7.6 6.9
Actual Growth (%) 5.9 6.6 3.4 7.8
Reasons for Deviations
• Area expansion in the grains subsector because of better weather condition, better consumer demand and government interventions in the livestock and fishery subsectors helped sector growth exceed target.
• On-going construction of SCTEX, Casecnan, and Subic Bay Port contributed to the growth of the construction sector.
• Further decrease in investment dampens manufacturing.
2007-2008
Growth Target (%) 6.1 4.6 4.5 6.9
Actual Growth (%) 3.7 2.9 5.1 3.1
Reasons for Deviation
• Palay production for 2008 posted a growth of 3,014,347 MT, 2.46 percent increase from the previous year’s 2,942,113 MT. The overall corn production of the region for the year 2008 posted 13.76 percent from 198.590 MT to 225,915 MT. Total fish production for 2008 increased by 6 percent.
• The number of approved building permits issued in the region increased by 60.5 % in 2008 compared to 2007. Housing loans availed though PAGIBIG likewise increased significantly between 2007 and 2008 by 177.2 percent.
• Construction of SCTEX, Casecnan, and Subic Bay Port
2008-2009
Growth Target (%) 6.5 5.2 4.7 7.5
Actual Growth (%) -1.4 -2.1 -3.8 1.1
Reasons for Deviation
• The region took hit from the weather disturbances -- particularly from typhoons Ondoy and Pepeng -- that occurred during the year and the global recession that has the Philippine’s trading partners cutting on their demand for our export products.
Source: NSCB
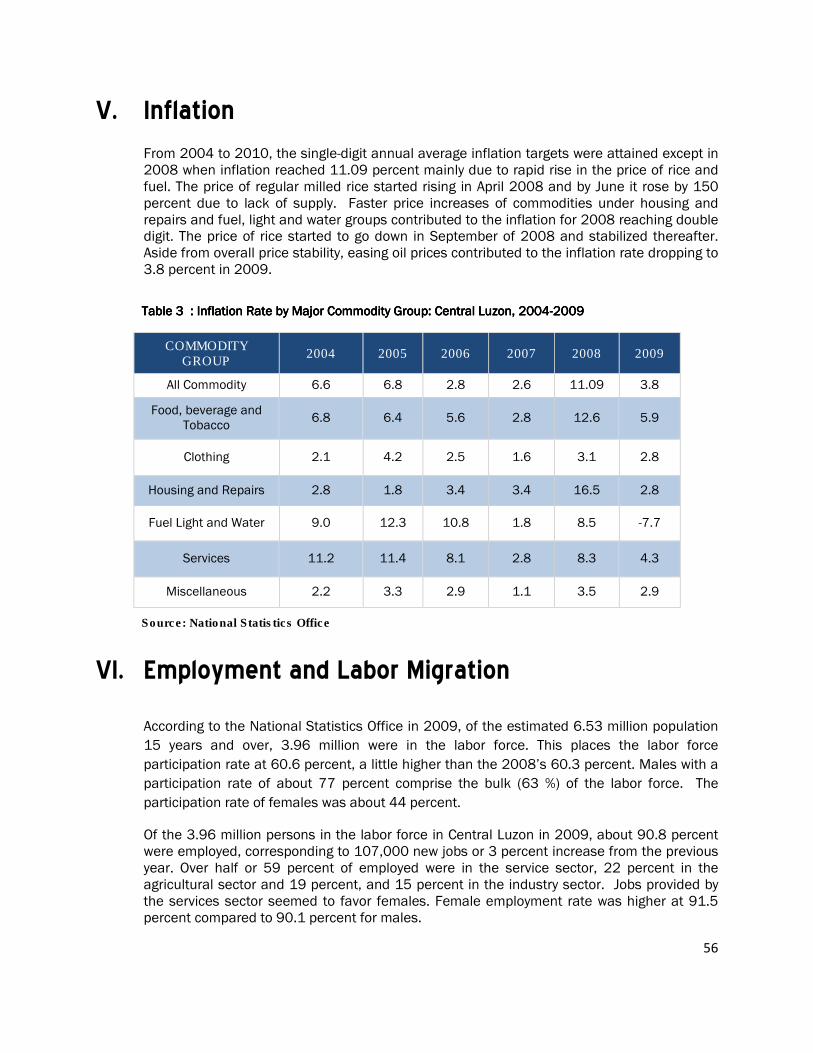
56
V. Inflation
From 2004 to 2010, the single-digit annual average inflation targets were attained except in 2008 when inflation reached 11.09 percent mainly due to rapid rise in the price of rice and fuel. The price of regular milled rice started rising in April 2008 and by June it rose by 150 percent due to lack of supply. Faster price increases of commodities under housing and repairs and fuel, light and water groups contributed to the inflation for 2008 reaching double digit. The price of rice started to go down in September of 2008 and stabilized thereafter. Aside from overall price stability, easing oil prices contributed to the inflation rate dropping to 3.8 percent in 2009.
�����
VI.� Employment�and�Labor�Migration
According to the National Statistics Office in 2009, of the estimated 6.53 million population
15 years and over, 3.96 million were in the labor force. This places the labor force
participation rate at 60.6 percent, a little higher than the 2008’s 60.3 percent. Males with a
participation rate of about 77 percent comprise the bulk (63 %) of the labor force. The
participation rate of females was about 44 percent.
Of the 3.96 million persons in the labor force in Central Luzon in 2009, about 90.8 percent were employed, corresponding to 107,000 new jobs or 3 percent increase from the previous year. Over half or 59 percent of employed were in the service sector, 22 percent in the agricultural sector and 19 percent, and 15 percent in the industry sector. Jobs provided by the services sector seemed to favor females. Female employment rate was higher at 91.5 percent compared to 90.1 percent for males.
Table 3Table 3Table 3Table 3 : Inflation Rate by Major Commodity Group: Central Luzon, 2004: Inflation Rate by Major Commodity Group: Central Luzon, 2004: Inflation Rate by Major Commodity Group: Central Luzon, 2004: Inflation Rate by Major Commodity Group: Central Luzon, 2004----2009200920092009
COMMODITY GROUP
2004 2005 2006 2007 2008 2009
All Commodity 6.6 6.8 2.8 2.6 11.09 3.8
Food, beverage and Tobacco
6.8 6.4 5.6 2.8 12.6 5.9
Clothing 2.1 4.2 2.5 1.6 3.1 2.8
Housing and Repairs 2.8 1.8 3.4 3.4 16.5 2.8
Fuel Light and Water 9.0 12.3 10.8 1.8 8.5 -7.7
Services 11.2 11.4 8.1 2.8 8.3 4.3
Miscellaneous 2.2 3.3 2.9 1.1 3.5 2.9
Source: National Statistics Office

57
Data from 2006 show that unemployment rate is on a decreasing trend even in 2008 and 2009, when the effects of the global financial crisis hit the country. Nevertheless, unemployment remains a very serious problem because the 9.2 percent unemployment rate in 2009 converted to actual number was 354,000 jobless persons in Central Luzon. At the same time, it should be noted that the employment creation program of the government that was part of the Economic Resiliency Plan could partly explain the growth in employment particularly in 2009. Thus, was not largely due to new investments, which provide more sustainable employment. Underemployment both in terms of proportion and magnitude maintained its declining trend suggesting improving utilization of labor. Domestic and international migration is usually resorted to in response to difficulties in finding employment in the home communities. Most parts of Central Luzon are domestic migration destinations while at the same time a source of international migrants (Table 5). Crude estimates show that using the rate of natural increase registered between 2000 and 2005 of 19 for every thousand population, the natural increase of Central Luzon’s population would have been 550,000 less than the population count in 2007. More than half of the migration went into the province of Bulacan (about 300,000 persons).
Table 5. Table 5. Table 5. Table 5. Profile of Local and Overseas Filipino Domestic WorkersProfile of Local and Overseas Filipino Domestic WorkersProfile of Local and Overseas Filipino Domestic WorkersProfile of Local and Overseas Filipino Domestic Workers
ItemItemItemItem Local Domestic WorkersLocal Domestic WorkersLocal Domestic WorkersLocal Domestic Workers Overseas Domestic WorkersOverseas Domestic WorkersOverseas Domestic WorkersOverseas Domestic Workers
Age 15–24 25–34 Education level Elementary school graduates High school and college graduates Work experience Little prior work experience Broad range of work experience Originating region Visayas, Bicol, Southern Tagalog NCR, Southern Tagalog, Ilocos,
Cagayan Valley, Central Luzon, Socsargen, Western Visayas
NCR = national capital region. Source: Sayre, 2005.
Table 4Table 4Table 4Table 4 . Household Population 15 Years Old and Over by Employment Status: Central Luzon: . Household Population 15 Years Old and Over by Employment Status: Central Luzon: . Household Population 15 Years Old and Over by Employment Status: Central Luzon: . Household Population 15 Years Old and Over by Employment Status: Central Luzon: 2006 2006 2006 2006 ---- 2009200920092009
IndicatorIndicatorIndicatorIndicator 2006200620062006 2007200720072007 2008200820082008 2009200920092009
HH Population 15 years old and over 6,091 6,227 6,368 6,531
Labor Force Participation Rate (%) 60.5 60.8 60.3 60.6
Labor Force 3687 3788 3,840 3,956
Employed (%) 89.4 90.0 90.8 90.8
Employed (No.) 3298 3410 3,485 3,592
Unemployed (%) 11.6 10.0 9.2 9.2
Unemployed (No.) 389 379 355 364
Underemployed (%) 10.5 10.3 8.7 7.8
Underemployed (No.) 370 350 303 281
Souce: National Statistics Office

58
Several studies have shown that the extensive domestic and international migration from the Philippines has consequences for the migrants and their families, as well as for the economy at large. Migrants pay a high personal price because they do not get to see their children, spouses and families. Long periods of absence may spur infidelities and separation (Edillon: 2007:32) and also contribute to the spread of sexually transmitted infections. Children are deprived of their parents and tend to perform worse at school, particularly in the absence of their mothers (Batistella and Conaco, 1996).
Overseas migration has likewise implications to society as a whole. The Philippine economy’s growth and ability to withstand external shocks have been partly attributed to transfers from abroad that represent about 10 % of gross domestic product (in 2007). However, a risk of brain drain and care drain resulting from migration of educated health professionals exacerbates existing problems of the health system in the Philippines. This in turn may compromise the quality of human capital needed to sustain economic development that may be compounded by the poor academic performance resulting from parents’ absence thereby weakening the future human capital of the country.
“Some studies stress the multiplier effect, as international remittances increase demand for goods and services (ADB, 2004), but others find that remittances have little impact on improving poverty levels because they are spent mainly on consumption rather than in income generating activities (Opiniano, 2004). There are also studies that claim that
Table 6Table 6Table 6Table 6 . Number of Employed by Industry. Number of Employed by Industry. Number of Employed by Industry. Number of Employed by Industry Central Luzon: 2008 Central Luzon: 2008 Central Luzon: 2008 Central Luzon: 2008 –––– 2009200920092009
SECTOR/ INDUSTRYSECTOR/ INDUSTRYSECTOR/ INDUSTRYSECTOR/ INDUSTRY 2008200820082008 2009200920092009
ALL INDUSTRIES 3,485 3592
AGRICULTURE, FISHERY AND FORESTRY
Agriculture, Hunting and Forestry 737 720
Fishing 55 54
INDUSTRY
Mining and Quarrying 6 6
Manufacturing 411 401
Electricity, Gas and Water Supply 16 21
Construction 246 258
SERVICES
Wholesale and Retail Trade, Repair of Motor Vehicles, Motor Cycles and Personal and HH Goods
771 812
Hotels and Restaurants 131 134
Transport, Storage and Communications 379 398
Financial Intermediation 38 40
Real Estate, Renting and Business Activities 94 102
Public Administration and Defense, Compulsory Social Security 150 152
Education 113 122
Health and Social Work 46 468
Other Community, Social and Personal Service Activities 119 128
Private Households with Employed Persons 171 185
Extra-Territorial Organizations and Bodies 1 1
Source: National Statistics Office

59
extensive international remittances may present moral hazard to the economy, as the incentive for remittance dependent families to participate in the economy goes down (Chami, et.al. in Opiniano, 2004)”.
VII.� Human�Development�
By and large Central Luzon’s state of human development has advanced reasonably. As Table 9 shows, the Human Development Index (HDI) in all the seven provinces improved. Between 1994 and 2000, the average rise in under the Human Development in the region registered higher than the national average suggesting that human development is faster in the region compared to other regions.
However, while Central Luzon advanced fairly well in some indicators, in others, movements were almost negligible or even backwards. At the same time, a number of statistics available at lower disaggregation reflect wide disparities of growth within the region.
A. Health�and�Nutrition� Infant and Child Mortality Rates have declined significantly. Infant Mortality Rate (IMR) was reduced from 45 per 1000 live births in 1990 to 24 in 2008. Mortality rate among children below five years old (U-5 MR)was also reduced from 61 per 1000 children aged les than 5 years old to 29 in 2008. The trend suggests the region will very likely attain the Millennium Development Goal (MDG) target of reducing mortality rate to 20 deaths per 1000 under-5 children.
Meanwhile, Maternal Mortality Rate (MMR) based on the administrative records of the Department of Health (DOH) regional office from 1990 to 2009 is on a declining trend albeit at a very much slower pace than IMR and U-5 Mortality rates. In addition, MMR is highly variable over short periods such as five years. From 2005 to 2009, for instance, MMR rose from 11 in 2005 to 53 in 2008 and down to 10 in 2009. The figures may be attributed to data deficiencies but may also reflect that only a little over half (56%) of births are delivered in health facilities (2008 National Demographic and Health Survey (NDHS) and about one in four pregnant women is nutritionally at-risk. Given the current slow rate of MMR decline the MDG target for MMR is unlikely to be reached.
Table 7Table 7Table 7Table 7. Human . Human . Human . Human Development Development Development Development Index,1994,1997,2000Index,1994,1997,2000Index,1994,1997,2000Index,1994,1997,2000
ProvinceProvinceProvinceProvince 1994199419941994 1997199719971997 2000200020002000
Philippines 0.627 0.629 0.656
Central Luzon
Aurora 0.567 0.591 0.623
Bataan 0.653 0.727 0.746
Bulacan 0.727 0.702 0.760
Nueva Ecija 0.626 0.605 0.635
Pampanga 0.664 0.648 0.665
Tarlac 0.581 0.608 0.605
Zambales 0.586 0.601 0.622
Source: NSCB

60
The ten most frequent causes of deaths include both non-communicable and communicable diseases such as diseases of the heart, cancer, and pneumonia. Over the years, deaths due to communicable diseases have lessened as a result of the expansive immunization and other programs of the DOH. Even so, pulmonary tuberculosis, which remains a major cause of death, is still a serious concern.
The ten leading causes of morbidity reported (2003-2008) included both communicable and non-communicable diseases. On top are Acute Respiratory Infection (ARI), diarrhea, hypertension, bronchitis or bronchiolitis. The high incidence of dengue cases in the region is still a major challenge. More than 6,000 cases of dengue were reported from January to October 2010. This is doubly higher than the same period in 2009.
The 2008 Food and Nutrition Research Institute (FNRI) National Nutrition Survey results revealed that among children, 0-5 years old, 20.2 % are underweight and 18.9 % are underheight. Central Luzon had the lowest percentage of underheight and second with lowest underweight among the 17 regions. Prevalence of underweight and underheight children 0-5 was lower in Central Luzon than the national averages at 26.2% and 27.9% respectively.
Comparing the provinces, Aurora, has twice as much percentage of underweight children than Pampanga. Also, Aurora and Nueva Ecija’s proportion of underweight and underheight are higher than the regional average. Significantly, for both indicators, the 2008 levels are higher than the 2005 levels suggesting worsening nutritional status.
The differences in nutritional status among the provinces are even more evident among 6-10 year old children. In Aurora, close to half are underweight while there are less than twenty percent in Bulacan, Bataan, Nueva Ecija, Pampanga, and Tarlac.
Underweight lactating mothers and nutritionally at-risk pregnant women are common. In 2008, 17.6 percent of lactating mothers are underweight whilst 24.4 percent of pregnant women are nutritionally at-risk.
B. Basic�Education�� Based on the 2003 Functional Literacy, Education and Mass Media Survey (FLEMMS), Central Luzon’s basic and functional literacy rate stood at 96.9 and 86.9 percent respectively. At both levels of literacy, the region exceeded the national average and is higher than most regions. Females surpass males for both simple and functional literacy.
The second MDG of achieving universal
primary education will not be attained if the current trend in Participation Rate reported by the Department of Education (DepEd ) will not be reversed right away. Elementary Participation Rate in SY 2008-2009
Table 8Table 8Table 8Table 8. Basic and Functional Literacy Rates: . Basic and Functional Literacy Rates: . Basic and Functional Literacy Rates: . Basic and Functional Literacy Rates: Central Luzon, 1989, 1994, 2003 Central Luzon, 1989, 1994, 2003 Central Luzon, 1989, 1994, 2003 Central Luzon, 1989, 1994, 2003
YearYearYearYear Basic LiteracyBasic LiteracyBasic LiteracyBasic Literacy Functional Functional Functional Functional LiteracyLiteracyLiteracyLiteracy
1989 93.7 84.1
1994 96.3 87.3
2003 96.9 86.9
Source: FLEMMS 1989,1994,2003

61
stood at 89.53 percent the lowest since SY 1990-1991. Also in 2008-2009, Cohort Survival Rate was 72.94 percent, which means that out of 100 Grade 1 students, only 73 reach Grade 6. At the Secondary level, participation rate in SY 2008 – 2009 was alarmingly low at 65.52 percent while the Cohort Survival Rate was 64.95%. Both indicators are below their levels in SY 2000- 2001.
Despite the policy on free education, increasing cost of education related expenses and lack of personal interest, inability to cope with schoolwork, are said to be the main causes of children not attending school or dropping-out of school. The Department of Social Welfare and Development (DSWD) estimated that as much as 20 percent of households have working children ages 5-17 years old in order to augment family income. Many of these children are not only deprived of education and proper nutrition but are exposed to abuses and hazards. The various programs aimed at improving learning competencies have not raised the competency scores of students at acceptable levels. Table 8 shows the National Achievement Test (NAT) results of Grade VI and Fourth Year High School students in the region in Math, English and Science. At both levels, scores obtained by students were way below the cut-off score of 75 percent which means that students are not acquiring the necessary competencies for Math, English and Science.
The poor performance of the students may be attributed to persistent shortages of classrooms, furniture, teachers and textbooks in many public schools. Although not reflected in regional averages, wide disparities at the school levels are common. In addition to shortages, a large number of Grade I enrolees did not have early childhood education. Being ill-prepared to absorb their lessons, they are consequently left behind. Such is carried through over the years that could explain why the scores at the secondary level are noticeably lower than the elementary level.
Through the management of the Technical Education and Skills Development Authority (TESDA), Central Luzon realized significant gains in the provision of technical and vocational education.
Table 9Table 9Table 9Table 9. National Achievement Test Results (%): Centra. National Achievement Test Results (%): Centra. National Achievement Test Results (%): Centra. National Achievement Test Results (%): Central l l l LuzonLuzonLuzonLuzon, SY 2005 , SY 2005 , SY 2005 , SY 2005 ----2006 to SY 2008 2006 to SY 2008 2006 to SY 2008 2006 to SY 2008 ---- 2009200920092009
LEVEL/ SUBJECT
2004-2005
2005-2006
2006-2007
2007-2008
2008-2009
Grade 6
Math 53.84 50.96 63.28 66.99 71.91
English 50.77 52.67 63.31 65.05 64.6
Science 55.25 45.57 55.93 63.30 65.67
4th Year H.S.
Math 48.19 45.32 40.86 - -
English 49.70 45.30 50.81
Science 37.64 35.94 42.91
Source: Department of Education 3

62
C. Technical�Vocational�Education�and�Training�
The region achieved modest accomplishments in the last five years in improving the access
and quality of technical vocational education and training.
Total TVET enrollment from 2006 – 2007 reached 684,673 while graduates reached
534,521. Community-based (ComB) training represents 41.0 percent of the total graduates
or a total of 219,297 graduates. Community based training graduates dropped by half in
2008 due to the upgraded standard set by the TESDA region 3 for the program to have
technology content (at least one core competency) in order to respond to the needs of the
priority industries. The program is gradually recovering with graduates numbering 41,495 in
2010, seventy-nine (79.0 %) of the 2007 total graduates. Enterprise-based training (EBT)
programs meanwhile accounted for only 5.1 percent of the total graduates. There is a need
to intensify efforts at convincing industries in the region to support this program. As of 2010,
only 39 firms out of more or less 3,600 industries across the Region are actively participating
in the EBT.
The number of registered Technical Vocational Institutions (TVIs) has considerably increased,
from only 89 in 2004 to 477 as of 2010. Of the total, 454 are private TVIs located mosly in
Bulacan and Pampanga. Aurora province has the least number with only six TVIs.
Around 41 percent (217,215) of the 534,521 graduates took competency assessment with
an average certification rate of 73 percent. The figure is 11 percent below the national
TESDA target of 100 percent of all graduates of registered programs undergoing competency
assessment.
To assess employability of TVET students, graduates are monitored by the TESDA. Based on
graduates from 2008 – 2010, the region’s employment averaged 38.2 percent. The figure is
almost 17 percent below the national target of 55 percent. To improve employability of
graduates and ensure that trainings remain relevant, TESDA made an inventory of highly in-
demand skills in the region.
D. Housing� The Housing and Urban Development Coordinating Council (HUDCC) estimated the region’s housing need from 2005 to 2010 at 461,368 units.
Many of the families living in substandard houses are also those located in areas vulnerable to flooding, landslides and other hazards, hence the need to have decent housing is more urgent. Moreover, substantial resources and time of the DSWD, Local Government Units (LGUs), Non-Government Organizations (NGOs) and People’s Organizations (POs) are taken up from year to year by the task of relief and rehabilitation of families of victims of disasters.

63
E. Vulnerable�Sectors� Central Luzon’s state of human development has certainly gain notable advancement, yet there are indisputably still many people being left behind. For the next six years, programs, projects and activities shall deliberately be designed such that the poorest and the most vulnerable groups are benefited.
Table 10Table 10Table 10Table 10: Vulnerable Sectors in Central Luzon: Vulnerable Sectors in Central Luzon: Vulnerable Sectors in Central Luzon: Vulnerable Sectors in Central Luzon
Sector/Sector/Sector/Sector/GroupGroupGroupGroup Estimated NumberEstimated NumberEstimated NumberEstimated Number
Poor
320,109 poor families involving 1,914590 persons 65,746 subsistence or food poor families involving 422,438 individuals (2006, NSCB)
Unemployed 9.0% or 369,000 individuals in January 2010 (NSO)
Families at risk to disaster
322,144 families in 1,277 barangays from 102 municipalities (DSWD)
Working children 262,009 children 5-17 years old
Indigenous Peoples 35,919 families or 195,867 individuals (2009, NCIP)
Others groups
undernourished children and youth, out-of-school youth, persons with disabilities, senior citizens, women with poor maternal health, persons with disabilities, OFW s
VIII.�Agriculture�
Central Luzon continues to be one of the country’s agricultural pillars, ranking second following Cavite-Laguna-Batangas-Rizal-Quezon (CALABARZON) in contribution to the Gross Value Added (GVA) in Agriculture, Fishery and Forestry (AFF) with share of 10 percent.
Said contribution is made more significant by the fact that the region ranks among the top producers of the country for many of its agricultural and fishery products.
The region in fact leads in the production of its staple, i.e. rice, and in onion and okra production. The latter is now also being exported apart from it being sold locally.
Central Luzon has the biggest area devoted to rice production and accounts for about 21 percent of the national irrigated palay output. Farm productivity or yield per hectare while above national average [4.22 metric tons (MT) for the region as against 3.59 national average in 2009] has shown decline from the 2007 level. The province of Nueva Ecija contributes nearly half (48%) of the region’s palay output.
Onion production in the region tops all other regional production with share of the national output at 57 percent. The latter amounts to about 73,000 MT in 2009 produced from an area of about 8,000 hectares mainly in Nueva Ecija. Although yield per hectare of onion is above national average, this has shown decline in the 2005-2009 period.

64
Of the other priority vegetables, okra production with share of 36 percent of the national output takes the lead in Central Luzon. Tarlac Province is exporting okra to Japan.
Central Luzon has the largest area among regions planted to carabao mango at about 25,000 hectares and the biggest number of bearing trees. This makes the region the third largest producer of the fruit in the country with production volume accounting for about eight percent of the national output. Nevertheless, production would have been higher had yield per hectare not been declining. The region in fact has one of the lowest yields per bearing tree among regions.
Aside from the abovementioned, Region 3 is also a major producer – being in the top five or ten among regions – of tomato, garlic, eggplant, peanut, mongo and camote (sweet potato).
The region plays a major role in fish supply as it ranks fourth in aquaculture production and
fifth in inland municipal fishing. Pampanga shares bulk of the region’s aquaculture produce
with about 67 percent generated in the province.
In livestock and poultry, Central Luzon is a dominant player as it leads in chicken with a 34
percent share of the national output, second in hog with share of 15 percent, third in duck
with a 29 percent share, second in chicken egg supply with 19 percent and the largest share
in duck egg supply with 24 percent.
�IX.� Industry�and�Services�Export is marked by negative growth from 2005-2009 from a high of 43 growth rate in 2004,
though said negative growth has been on the decline.
Investments bounced back in 2009 as the region registered positive growth during the year
following two consecutive negative growth from 2006-2007. The sluggish and poor showing
of both investments and exports is a result of the financial crunch and other crises the world
market went through in the last five years.
Pampanga and Zambales account for bulk of exports and investments in the region. Export
winners are electronics, machinery and transport equipment and garments/textile.
Region 3 ranks third in share of Micro- Small and Medium-Enterprises (MSMEs) in the entire
country. The sector accounts for 99 percent of the total number of establishments in the
region, with bulk of MSME establishments in the trading and services business.
Services account for bulk of Central Luzon’s economy with 40.9 percent share in 2009.
Industry follows this sector with share in 2009 of 34.7 percent. Relative to the national
economy, Central Luzon ranks third in the country in terms of contribution to the Gross Value
Added (GVA) in the industry sector while fifth in the services sector following National Capital
Region (NCR), Cavite-Laguna-Batangas-Rizal-Quezon (CALABARZON), Central Visayas and
Western Visayas.
65
In the services sector, the region is in the top three among regions in the Transportation,
Communication and Storage (TCS), Owners Dwelling and Real Estate (ODRE) and
government services sub-sectors. In terms, nonetheless, of share to the region’s GVA in
services, the top three sub-sectors are Trade, TCS, and Private Services in that order.
X.� Tourism�
Visitor arrival has been increasing at an average annual rate of 8.5 percent over the last 10
years. The bulk of the regional visitors converge in Zambales and Pampanga (59% and 23%
in 2009, respectively). Domestic or local tourists make up for a significant share (73%) of
the region’s visitors.
�
XI.� Mining�
Mining areas or those covered with mining tenements cover 44, 235 hectares or just two
percent of the region’s total land area. The province of Zambales accounts for the largest
area – 59 percent of total area with approved mining tenements – currently mined in the
region. One of the priority projects in fact already in operation is in Zambales: the Acoje
Nickel Project of Crau-Fil Asian Mining/Rusina.
Mining contributes about 0.1 percent to the annual GVA in industry in the last decade.
Employment share is 0.2 percent. Notwithstanding this share, Region 3, particularly
Zambales, has been identified as one of 12 areas exhibiting strong mineral potential.
As of August 2009, there were 54 approved mining applications distributed as follows:
Mineral Production Sharing Agreement (MPSA) – 36, exploration permit – three, and
industrial permit – 15. Small scale mining is also carried out in all provinces covering about
one thousand hectares, with the biggest slice accounted for by Nueva Ecija. Small scale
mining primarily involves quarrying of sand and gravel.
While nickel production shows fluctuation as it follows demand in the world market,
production of non-metallic minerals (e.g. sand and gravel, salt, limestone) is on the uptrend
with growth in value averaging 10 percent.
�XII.�Land�Transportation�and�Circulation��Circulation of goods and people within and outside the region is facilitated by a combination of roads, airports and seaports. The construction of a railway system from Clark to and from the National Capital Region is in its initial stage of implementation. The rehabilitation of the Northrail is a necessity in view of the fast urbanization of southwestern Central Luzon
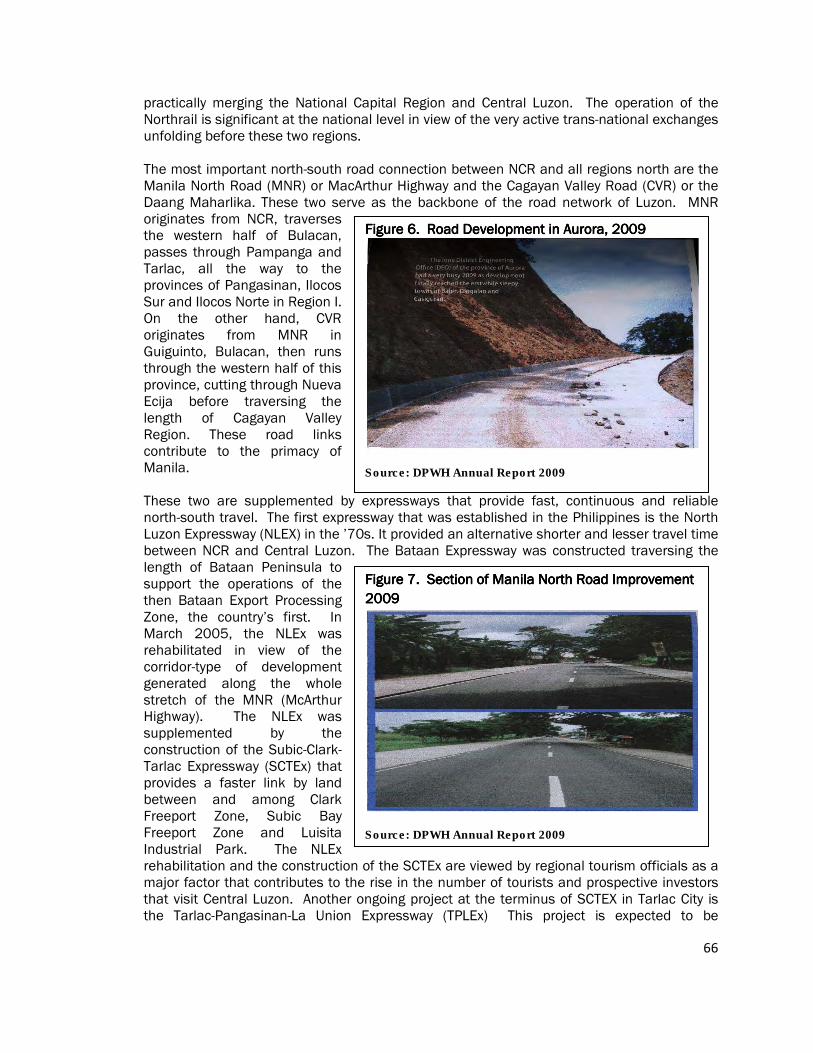
66
Figure 6Figure 6Figure 6Figure 6. Road Development in Aurora, 2009. Road Development in Aurora, 2009. Road Development in Aurora, 2009. Road Development in Aurora, 2009
Source: DPWH Annual Report 2009
Figure 7Figure 7Figure 7Figure 7. . . . Section of Manila North Section of Manila North Section of Manila North Section of Manila North RoadRoadRoadRoad ImprovementImprovementImprovementImprovement
2009 2009 2009 2009
Source: DPWH Annual Report 2009
practically merging the National Capital Region and Central Luzon. The operation of the Northrail is significant at the national level in view of the very active trans-national exchanges unfolding before these two regions.
The most important north-south road connection between NCR and all regions north are the Manila North Road (MNR) or MacArthur Highway and the Cagayan Valley Road (CVR) or the Daang Maharlika. These two serve as the backbone of the road network of Luzon. MNR originates from NCR, traverses the western half of Bulacan, passes through Pampanga and Tarlac, all the way to the provinces of Pangasinan, Ilocos Sur and Ilocos Norte in Region I. On the other hand, CVR originates from MNR in Guiguinto, Bulacan, then runs through the western half of this province, cutting through Nueva Ecija before traversing the length of Cagayan Valley Region. These road links contribute to the primacy of Manila.
These two are supplemented by expressways that provide fast, continuous and reliable north-south travel. The first expressway that was established in the Philippines is the North Luzon Expressway (NLEX) in the ’70s. It provided an alternative shorter and lesser travel time between NCR and Central Luzon. The Bataan Expressway was constructed traversing the length of Bataan Peninsula to support the operations of the then Bataan Export Processing Zone, the country’s first. In March 2005, the NLEx was rehabilitated in view of the corridor-type of development generated along the whole stretch of the MNR (McArthur Highway). The NLEx was supplemented by the construction of the Subic-Clark-Tarlac Expressway (SCTEx) that provides a faster link by land between and among Clark Freeport Zone, Subic Bay Freeport Zone and Luisita Industrial Park. The NLEx rehabilitation and the construction of the SCTEx are viewed by regional tourism officials as a major factor that contributes to the rise in the number of tourists and prospective investors that visit Central Luzon. Another ongoing project at the terminus of SCTEX in Tarlac City is the Tarlac-Pangasinan-La Union Expressway (TPLEx) This project is expected to be

67
completed in 2013. In December 2010, the Investment Coordination Committee-Technical Board (ICC-TB) approved the Central Luzon Link Expressway (CLLEx) project of DPWH. This toll way will also start at the terminus of SCTEx in Tarlac City, pass through Cabanatuan City and end in San Jose City. The full implementation of the project requires an implementation period of 10 years. Other expressways being proposed to be constructed include Sierra Madre Marginal Highway, Manila Bataan Coastal Road, and portion of the Tarlac–Iba Road. However, current traffic demand is not yet sufficient to support viable operation. The East-West arterial lateral connection provides access perpendicular or cutting through the north-south backbones completely connecting the eastern and western seaboards of Central Luzon. The major east-west link of the region is presently provided by three (3) road sections, namely Tarlac–Iba, Tarlac-Sta. Rosa, and the Cabanatuan-Pantabangan-Baler roads. These roads bisect the region and facilitate access to both China Sea and Pacific Ocean. This link, however, is incomplete as the Zambales side of the Tarlac-Iba Road is not yet open making Zambales still inaccessible via Tarlac and vice-versa. The alternative access routes to and from Zambales are through Sta-Cruz-Pangasinan-Camiling Tarlac, the SCTEx-Subic-Iba or through the Gapan-Olongapo-Subic-Iba routes. The recent cut-off of Botolan has made ingress and egress to Iba and resource-rich part of Zambales costly and difficult. This situation is not conducive to prospective investors because of the added transport costs it would entail resulting from the re-routing through Pangasinan Province. The recent experience, however, is providential because it depicted in no uncertain terms the value of completing an east-west lateral connection through Tarlac City. To accommodate increased economic interaction between Zambales and Pangasinan, the Mangatarem-Sta. Cruz Highway is expected to assume a more important role in inter-regional connection. Likewise, a considerable length in Aurora is yet to be paved completely. Only the sections in Tarlac are in good condition, Nueva Ecija and Aurora’s sides still require improvement.
It must be emphasized that current access to and from Zambales is limited to two points, the Sta Cruz side and Subic side. Most of the current traffic going to and from Zambales uses the route via Subic. The alignment of the SCTEx provides an opportunity to shorten travel time to the province through the interchange in Porac, Pampanga that may directly connect to the municipality of San Marcelino bypassing the high traffic road between Olongapo and Subic.
Strategic Roads are those roads cutting through areas not covered by, or in support of, the north-south arterial backbones and the east-west laterals. Considered as one of the most important strategic roads in the region is the one connecting and passing through Gapan City, San Fernando City, and Olongapo City now known as Jose Abad Santos Avenue (JASA). Although it does not technically provide a connection between the east and west coast, it functions as such by the extent and magnitude of the traffic it handles to and from the different urban centers in the Region.
Much has been achieved in improving the land transportation and circulation network of the region in the past six years. Several new roads were built and many have been rehabilitated or upgraded including bridges which were converted from temporary to permanent. Major efforts were extended in different areas of the region damaged and destroyed by calamities. Most implementation targets of various projects have been attained. The Department of Public Works and Highways (DPWH) 3 which is the government’s main implementing agency for infrastructure projects in the region has focused its efforts and resources to implement

68
Table 11Table 11Table 11Table 11. Road Density, Philippines and Central . Road Density, Philippines and Central . Road Density, Philippines and Central . Road Density, Philippines and Central Luzon, as of end 2008Luzon, as of end 2008Luzon, as of end 2008Luzon, as of end 2008
AreaAreaAreaArea Road Road Road Road Length Length Length Length
(in kms.)(in kms.)(in kms.)(in kms.)
Land Area Land Area Land Area Land Area (in ha.)(in ha.)(in ha.)(in ha.)
Road Road Road Road DensityDensityDensityDensity
Philippines 29,650 33,867,795 1.69
Central LuzonCentral LuzonCentral LuzonCentral Luzon 2,0752,0752,0752,075 2,201,4632,201,4632,201,4632,201,463 1.411.411.411.41
Aurora 258 314,732 3.17
Bataan 280 137,298 2.96
Bulacan 280 279,610 1.00
Nueva Ecija 502 575,133 1.52
Pampanga 286 206,247 1.34
Tarlac 277 305,360 1.43
Zambales 192 383,083 1.15
Source: DPWH 2008 Annual Report
programs and projects that best support the regional development agenda with consideration to the various programs of the national government like for instance the Luzon Urban Beltway of the Super Regions, 10-Point Economic Agenda and President’s Bridge Program, among others. Last year alone the DPWH reports that it was able to implement a total of 2,409 projects, foremost are the following: Improvement of Tarlac-Nueva Ecija-Aurora Dingalan Port Road; Baler-Casiguran Road; and Widening of Manila North Road. The Tarlac-Nueva Ecija-Dingalan Port Road is among the projects under the Luzon Urban Beltway of Super Regions envisioned to spread development in the countryside. It facilitates agricultural, industrial and tourism growth development to the three provinces. It complements the roll on-roll off transport system in the country particularly the operation of Dingalan Port in Aurora as it will not only assure mobility of transport and services it will also guarantee road user’s savings through the reduction of vehicle operating costs and lower vehicle maintenance costs. Envisioned to be the connecting point of two major economic zones from the East for Aurora and the west for Zambales, through the SCTEX, the road is expected to boost production in its influence areas in Aurora, Nueva Ecija, Tarlac and Zambales. The Baler-Casiguran Road on the other hand further stimulates economic growth in the northern towns of Aurora. Nineteen modern bridges were constructed as part of the highway including the 735 linear meters long Dibutunan (bridge) in Dipaculao town. The Manila North Road also known as MacArthur Highway is considered the oldest highway in the country, hence its improvement and widening remains one of the most visible legacies of the past administration. For the past several years, the MNR has been accommodating around 40,000 vehicles daily. With the interconnection of two major expressways namely the North Luzon Expressway (NLEX) and the Subic-Clark-Tarlac Expressway (SCTEX), the widened MNR parallel to NLEX will enhance its support role in providing transport services to freight and passengers from Metro Manila, Bulacan, Pampanga and Tarlac. There were also projects started and are set to be completed within 2010 e.g., Flood Control Works for the Third River, Opening of Lubao By-Pass Road to Jose Abad Santos Avenue (JASA) and Construction of Access Road to Floridablanca Interchange all in Pampanga and Construction of the North Food Exchange Interchange in Bulacan. In 2008 priority was focused on road capacity improvement and traffic management to address the worsening traffic congestion in major urban centers. Road management reached greater heights through the establishment of computerized road information and management support system (RIMSS) in almost all regions of the country including Central

69
Luzon. This program is aimed at improving the quality and delivery of services through the provision and management of national roads. The Pan Philippine Highway was completed in most parts of Region 3. During this year, the road density of the region was registered at 1.41km. per sq. km. Major flood control projects in large river basins were also implemented such as the Pampanga Delta Development Project and the Tarlac section of the Agno River Flood Control Project. Again, the DPWH continued fast-tracking critical projects for the region and has proven its commitment in driving development through progressive public works in 2007. The Meycauayan-Tarlac Section, Phase II of the MNR was completed. More water supply facilities were made available to the public through the Rural Water Supply and Sanitation Sector Project of the agency.
Below are some of the projects undertaken in the region from 2004 to 2006:
o Widening and improvement of Manila North Road, Meycauayan-Tarlac City Section,
Phase I - PhP467.5 million o North Luzon Expressway, Plaridel Bypass - PhP50 million o Tarlac-Nueva Ecija-Aurora-Dingalan Port Road, 15 kms. - PhP460 Million o Pinatubo Hazard Urgent Mitigation Project, PhP3.3 billion o Four bridges under the ADB Sixth Road Project-Bridge Component in Bulacan, PhP164.1
million o Two bridges under the ADB Sixth Road Project-Bridge Component in Zambales and
Tarlac, PhP111.6 million o 275.3 kms. of national roads and 10,004 linear mts. of national bridges with a total
value of PhP1.36 billion; o 229 flood control projects the completed portions of which have a value of PhP237.3
million; o 293 classrooms, 2 buildings, 590 other infrastructure projects which completed portions
have a value of PhP365.2 million; o 6.4 kilometers of farm-to-market roads and 358 projects with a total cost of PhP110.3
million under the budget of Department of Agriculture; o 42.9 kilometers of farm-to-market road with a total cost of PhP121.3 million under the
Agrarian Reform Infrastructure Support Projects; and, o 673 classrooms and 6 buildings with a cost of PhP7.1 million under the budget of the
Department of Education.
XIII.�Air�and�Sea�Transport�
Airports are as important as seaports in connecting islands. In terms of status, airports are classified either as operational or non-operational. Operational airports include those with temporary permits and those with extended contracts. On the other hand, non-operational airports are those with expired contracts and temporarily closed. Airports are further classified as public or private, based on their function or purpose. Private airports are those which are intended for personal and commercial use. Public airports are those which are operated and maintained by the government through the Air Transportation Office (ATO).

70
Table 12Table 12Table 12Table 12. Airports, Region III, as of end 2009. Airports, Region III, as of end 2009. Airports, Region III, as of end 2009. Airports, Region III, as of end 2009
AerodromeAerodromeAerodromeAerodrome LocationLocationLocationLocation ClassificationClassificationClassificationClassification StatusStatusStatusStatus
Baler Aurora Feeder Operational
Castillejos Zambales Feeder -do-
Clark Pampanga International -do-
Dilasag Pateco Aurora Private -do-
Iba Zambales Feeder -do-
Omni Aviation Corp.
Pampanga Private -do-
Plaridel Bulacan Feeder -do-
Poon Coto Zambales Private -do-
Samal Bataan Private -do-
Subic Zambales International -do-
Voice of America Tarlac Private -do-
Source: DPWH
Public airports are subdivided as international, alternate international, trunkline, secondary and feeder. International airports serve international gateways with regular international flights while alternate international serves irregular international flights. Trunkline airports serve principal commercial centers of the country with regular commercial flights having high traffic density. On the other hand, feeder airports are those found in towns and rural communities and accommodate general aviation operations. Secondary airports serve towns and cities with commercial flights but have less density of traffic.
As of end 2009, there are 11 airports in the region. In terms of utility, six are public and five are private. There are two alternate international airports, the Diosdado Macapagal International Airport (DMIA) in Clark Field, Pampanga and the Subic Bay International Airport (SBIA) in Olongapo City, Zambales. Of late many projects were implemented for the advancement of the DMIA, namely: terminal expansion program worth PhP130 million to accommodate more than two million passengers annually; construction of a world-class aircraft hangar facility capable of housing various aircrafts such as Boeing 747-8 and Airbus A380 worth PhP1 billion; and, granting by the Japan International Cooperation Agency (JICA) of at least $5 million (PhP225 million) for a “transition study” that would make the DMIA the country’s premiere international airport. The study is expected to be finished by the fourth quarter of 2010.
In the case of the Subic Bay International Airport (SBIA), Federal Express (FedEx), its no.1 client, left Subic as its Asia Pacific hub in February 2009 and moved to China. There are reports that the airport may be converted into a logistics hub. Authorities are studying the idea of making Subic a subsidiary airport to Clark. The utility of Baler and Iba airports are not maximized due to limited traffic.
Region III is fortunate to have a seaport - the Subic Port, which at present is considered one of the most developed and busiest not only in the country but also in South East Asia. It is operated and managed by the Subic Bay Metropolitan Authority or SBMA. The port has a natural harbor of up to 13.7 meters covering a total area of 41 hectares. Only recently a new container terminal with two berths was constructed with a total capacity of 300,000 Twenty- Foot Equivalent Units (TEUs) each, enough to accommodate all types of sea vessels- from small crafts, commercial yachts, ferryboats to container vessels, cargo ships, oil tankers and aircraft carriers.
�
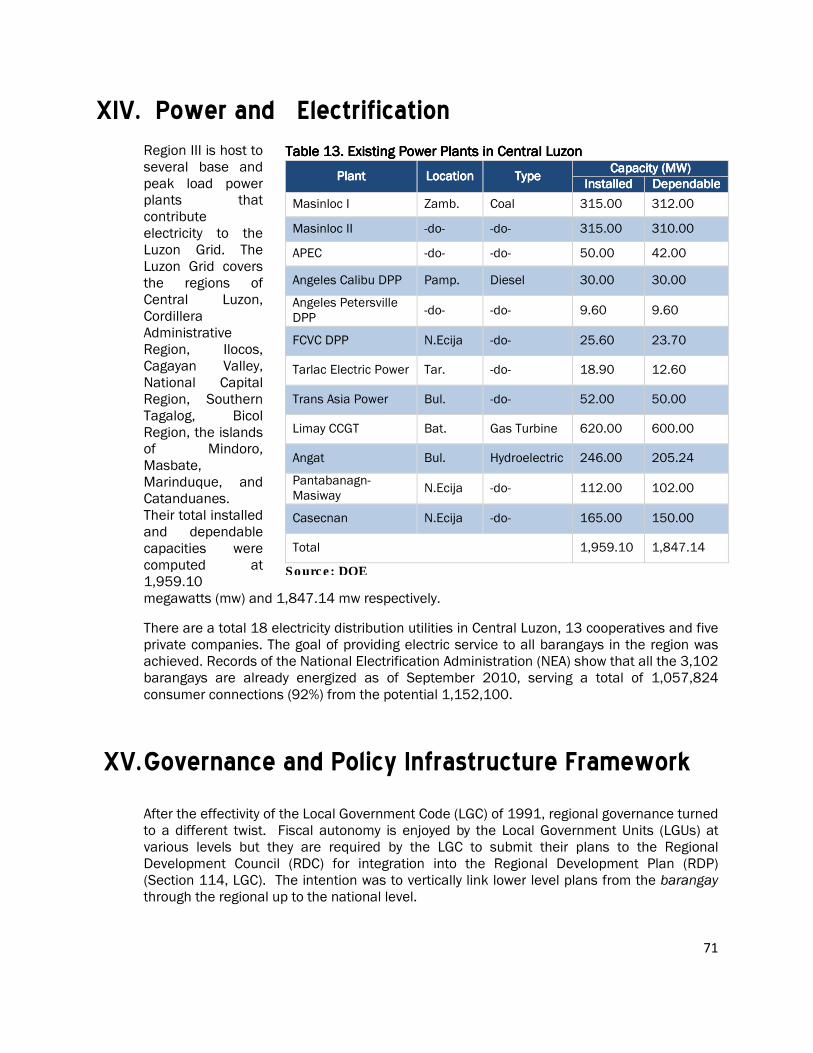
71
Table 13Table 13Table 13Table 13. . . . Existing Power Plants in CentralExisting Power Plants in CentralExisting Power Plants in CentralExisting Power Plants in Central LuzonLuzonLuzonLuzon
PlantPlantPlantPlant LocationLocationLocationLocation TypeTypeTypeType Capacity (MW)Capacity (MW)Capacity (MW)Capacity (MW)
InstalledInstalledInstalledInstalled DependableDependableDependableDependable
Masinloc I Zamb. Coal 315.00 312.00
Masinloc II -do- -do- 315.00 310.00
APEC -do- -do- 50.00 42.00
Angeles Calibu DPP Pamp. Diesel 30.00 30.00
Angeles Petersville DPP
-do- -do- 9.60 9.60
FCVC DPP N.Ecija -do- 25.60 23.70
Tarlac Electric Power Tar. -do- 18.90 12.60
Trans Asia Power Bul. -do- 52.00 50.00
Limay CCGT Bat. Gas Turbine 620.00 600.00
Angat Bul. Hydroelectric 246.00 205.24
Pantabanagn-Masiway
N.Ecija -do- 112.00 102.00
Casecnan N.Ecija -do- 165.00 150.00
Total 1,959.10 1,847.14
Source: DOE
XIV.��Power�and���Electrification�Region III is host to several base and peak load power plants that contribute electricity to the Luzon Grid. The Luzon Grid covers the regions of Central Luzon, Cordillera Administrative Region, Ilocos, Cagayan Valley, National Capital Region, Southern Tagalog, Bicol Region, the islands of Mindoro, Masbate, Marinduque, and Catanduanes. Their total installed and dependable capacities were computed at 1,959.10 megawatts (mw) and 1,847.14 mw respectively.
There are a total 18 electricity distribution utilities in Central Luzon, 13 cooperatives and five private companies. The goal of providing electric service to all barangays in the region was achieved. Records of the National Electrification Administration (NEA) show that all the 3,102 barangays are already energized as of September 2010, serving a total of 1,057,824 consumer connections (92%) from the potential 1,152,100.
�XV.�Governance�and�Policy�Infrastructure�Framework�
After the effectivity of the Local Government Code (LGC) of 1991, regional governance turned to a different twist. Fiscal autonomy is enjoyed by the Local Government Units (LGUs) at various levels but they are required by the LGC to submit their plans to the Regional Development Council (RDC) for integration into the Regional Development Plan (RDP) (Section 114, LGC). The intention was to vertically link lower level plans from the barangay through the regional up to the national level.

But while plan integration has been lodged with the RDC, Regional Line Agencies (RLAs) have consistently prepared their respective agency plans and budgets in accordance with their central agency thrusts, guidance, and direction. The absence of a transpareNational Government Agencies (NGAs) to capture local development needs and priorities other than the public consultations being conducted in the preparation of the MediumPhilippine Development Plan (MTPDP) leaves the appreciation of locand priorities from the perspective of central government offices. The extent in which people participate in plan formulation falls short of reflecting, integrating and defining people’s aspirations, interests and sentiments into the development plan. Intended to provide the link between the national and local level plans, RDC III manages to capture local needs, aspirations, and development objectives in the Regional Development Plan (RDP). However, non-reflection of the libetween the national and the local in terms of budgetary support despite the issuance of Memorandum Circular No. 54 in 2004 practically leaves priority local development programs and projects without institutional connection to the central government. development challenge to LGUs, having been endowed with fiscal autonomy under the LGC, the current financial capacities of most LGUs in the Central Luzon region is indicative of their anticipated slow future growth paces, suppressive of the region’s otherwise optimal contribution to national growth and what should have been an ideal levelled playing field as far as access to development opportunities for the most vulnerable and make economic gains shared by all under the guiding principle of “inclusive growth” in the MTPDP, 20102016. Governance is a process by which decisions are arrived at, implemented or not implemented. Policies are the tools by which these decisions are given stable, sustainable andframework within which to operate on a relatively permanent basis. institutions as the “rules of the game in a society or the human devised constraints that shape human interaction”. Being of human nature, institutions are inevpersonal values, beliefs, and tradition. Studies would show that apart from political instability, corruption occupies the highest position as far as the ranking of local business environment factors that influence private investment decision-making. While national political processes and decisions have greater influence on political instability, common crimes such as those against persons and property are more relevant subjects for regional planning.
But while plan integration has been lodged with the RDC, Regional Line Agencies (RLAs) have consistently prepared their respective agency plans and budgets in accordance with their central agency thrusts, guidance, and direction. The absence of a transpareNational Government Agencies (NGAs) to capture local development needs and priorities other than the public consultations being conducted in the preparation of the MediumPhilippine Development Plan (MTPDP) leaves the appreciation of local development needs and priorities from the perspective of central government offices. The extent in which people participate in plan formulation falls short of reflecting, integrating and defining people’s aspirations, interests and sentiments into the national
Intended to provide the link between the national and local level plans, RDC III manages to capture local needs, aspirations, and development objectives in the Regional Development Plan (RDP).
reflection of the link between the national and the local in terms of budgetary support despite the issuance of Memorandum Circular No. 54 in 2004 practically leaves priority local development programs and projects without institutional connection to the central government. While this current arrangement may be viewed as a development challenge to LGUs, having been endowed with fiscal autonomy under the LGC, the current financial capacities of most LGUs in the Central Luzon region is indicative of their
e growth paces, suppressive of the region’s otherwise optimal contribution to national growth and what should have been an ideal levelled playing field as far as access to development opportunities for the most vulnerable and make economic
all under the guiding principle of “inclusive growth” in the MTPDP, 2010
Governance is a process by which decisions are arrived at, implemented or not implemented. Policies are the tools by which these decisions are given stable, sustainable andframework within which to operate on a relatively permanent basis. Northinstitutions as the “rules of the game in a society or the human devised constraints that shape human interaction”. Being of human nature, institutions are inevitably influenced by personal values, beliefs, and tradition.
Studies would show that apart from political instability, corruption occupies the highest position as far as the ranking of local business environment factors that influence private
making. While national political processes and decisions have greater influence on political instability, common crimes such as those against persons and property are more relevant subjects for regional planning.
FigFigFigFig 8888....
72
But while plan integration has been lodged with the RDC, Regional Line Agencies (RLAs) have consistently prepared their respective agency plans and budgets in accordance with their central agency thrusts, guidance, and direction. The absence of a transparent process by National Government Agencies (NGAs) to capture local development needs and priorities other than the public consultations being conducted in the preparation of the Medium-Term
al development needs
2004 practically leaves priority local development programs and projects without institutional While this current arrangement may be viewed as a
development challenge to LGUs, having been endowed with fiscal autonomy under the LGC, the current financial capacities of most LGUs in the Central Luzon region is indicative of their
e growth paces, suppressive of the region’s otherwise optimal contribution to national growth and what should have been an ideal levelled playing field as far as access to development opportunities for the most vulnerable and make economic
all under the guiding principle of “inclusive growth” in the MTPDP, 2010-
Governance is a process by which decisions are arrived at, implemented or not implemented. Policies are the tools by which these decisions are given stable, sustainable and legal
North (1990) defined institutions as the “rules of the game in a society or the human devised constraints that
itably influenced by
Studies would show that apart from political instability, corruption occupies the highest position as far as the ranking of local business environment factors that influence private
making. While national political processes and decisions have greater influence on political instability, common crimes such as those against persons and property

73
Governance impacts heavily on decisions of investors to part with their money for capital formation purposes (foregone present consumption) and production of goods and services for future consumption. Increased investment means higher economic growth and more business activities which will eventually result to higher income, broader tax base, and more relaxed fiscal space. A favourable fiscal position will enable government to funnel its resources to growth-based initiatives and those that directly address poverty. Reduced cost of doing business is a matter of policy innovation in view of the complexity of delivering the expected outputs and because of the many players involved, i.e., the national government, LGUs and the private sector and the different frameworks that influence their respective positions. For 2006, 2009 and 2010, geographic disparity of crime statistics among the various provinces and highly-urbanized cities of the region is noticeable. This suggests lack of unison in the way the region is addressing peace and security. While the relatively “peaceful and secure” Aurora and Olongapo City may be more inviting for private investors and necessary government support for their promotion as investment destination, the region’s relatively efficient transport mobility and communication system accord criminal elements to easily shift commission of crime across provinces and cities. This situation necessitates the crafting of a unified and coherent peace and security strategy at the regional level. As far as addressing the more challenging peace and security problems minimal variations and almost perfect consistency were observed across geographic locations for certain areas. For 2006, Bulacan topped the other provinces as far as the number of crimes against persons such as Murder and Homicide. This was not a problem for Pampanga for that year but the latter ranked number one as far as the most number of crimes against property, which are Robbery and Theft. For 2009, Nueva Ecija assumed the topmost position as far as Murder, and Bulacan retained its previous place as far as Homicide. In addition, it registered the most of number of cases for Crimes against Property. This trend continued until August 2010. Across crimes, Physical Injury consistently occupied the topmost rung in the ladder. Physical injury does not involve loss of life and may be described as moderate as far as the gravity of criminal offenses. Based on investment surveys, corruption assumes the second most important factor before an investor would decide for or against investing in an area. To boost investment and in compliance with the human rights obligation to respect, a national strategy to eradicate corruption in public life must be vigorously pursued. In Region III however, the dearth of documents and data is preventing an accurate assessment on how regional governance has been responding to this particular concern. True to its nature, corruption is committed clandestinely. Coupled with the evolved “culture” after a century-long bureaucratic practice especially among revenue-generating agencies, this situation is making very difficult for prosecutorial agencies of government to seriously initiate, pursue investigations and legal actions for purposes of exacting accountability. Corruption in Region III may be described as “petty” not because of the amount of money involved in unlawful transactions but more of the positions by those in the administrative hierarchy. Regional offices would usually require “backers” or patrons at the top echelon in

74
order to perpetuate their illegal acts. Since the results expected of them can be easily measured, the regularity of processes can easily be counter-checked, if there is a will. Corruption at the regional level is relatively easily tractable. However, the lack of a formal regional structure and recourse mechanisms for claimholders of public goods and services is making the identification of such unlawful acts hard to document and systematize and could hardly be given any weight in any adjudicatory proceedings. The absence of real power on the part of the RDC to decide on fund allocation, in view of the centralized administrative set-up we have, is making it hard for LGU-members to have the realization of the human rights of their claimholders as far as budget prioritization. As a matter of policy, growth-stimulating investments needing budgetary support still require national level decision. This is an apparent weakness in the regional governance process. While priority interventions are identified at the regional level, fully considering the unique political and economic situations of Region III, the absence of a formal mechanism especially intended to concretize such interventions is making inefficient and even meaningless what should have been a more relevant, cost-effective and devolution-responsive budgeting process. The need to obtain central agencies’ approval of regionally-determined development priorities is making hard for RDC III to be more forward-looking and pro-active in its stance, sometimes its role being relegated to a mere commentator of an annual agency budget proposal prepared without its active participation. Despite the clear legal requirement, one critical reason why LGU-RDC members lack the conscientiousness to submit their development plans for consolidation by RDC III is the anticipated lack of budgetary support for their priority development interventions at the regional level. This is also one area where even well-meaning private sector partners and civil society organizations in the region is found wanting as an agendum for reform. The awkward position by which government might be put in public view in the light of non-compliance by LGUs with Section 114 of the LGC and the corresponding action to be taken by RDC has been preventing RDC III to press hard for the compliance with the law. Unavoidably, this practice has its high cost too – primarily the non-integration, non-reflection and the utter disregard of important national government policy directions particularly those on disaster risk reduction-climate change adoption and human rights norms, standards and principles. Despite the value of the integration of these important planning frameworks, the lack of linkage between local level budgeting and regional level budgeting has inevitably resulted to their exclusion. ““““Inclusive Growth” as a key philosophy of the MTPDP implies Non-Discrimination which is a core principle of Human Rights. Non-discrimination denotes equalization of social and economic forces so that those who are economically deprived may at least be given opportunities to grow. For purposes of regional development planning and policy reform, this means that those who are “left behind” must be given opportunities to be drawn back to the development cycle by hauling them out of the financial difficulty. This situation which continually impairs and nullifies their capacity to contribute to long-term investment is intended to address disparity in infrastructures sought after by prospective investors and accord easy access to basic social services and safeguards for the most at risks of having their human rights violated amidst a tight local fiscal situation.

IRA Independency Ratio is an indication of the extent of support the national government extends to LGUs and the degree to which such support is needed. After almost 20 years of devolution, below is the picture for Region III compared with other regions (interdisparity) and the situation of the seven provinces of Central Luzon compared to one anoth(intra-regional disparity). InterInterInterInter----Regional IRA Independency Disparity. Regional IRA Independency Disparity. Regional IRA Independency Disparity. Regional IRA Independency Disparity. Luzon can be grouped with those of the National Capital Region and Regions 1 and 4 have relatively high IRA Independency Ratios.group and trailing behind Region 1, Region 3 managed to climb up to the third place outdoing Region 1 in 2006 and 2007. From 2004occupied the first and second places respectively.
Inter-regional disparity in terms of income levels of various LGUs (Provinces, Cities and Municipalities) is indicative of poor policy implementation in terms of investment promotion, income generation and economic growth. Although the formula as far as IAllotment (IRA) allocation among LGUs is concerned is provided for by law, every LGU is conferred with local autonomy on the utilization of its revenues and other receipts and the generation of the same from various sources.
IntraIntraIntraIntra----RegionRegionRegionRegional Disparities on IRA Independency.al Disparities on IRA Independency.al Disparities on IRA Independency.al Disparities on IRA Independency.between the IRA Independency Ratios of Aurora, Nueva Ecija, Pampanga, Tarlac and Zambales for the period 2004low capacity of the five provinces to stimulate investments and boost economic activities in their areas.
Source: Commission on Audit (COA)
IRA Independency Ratio is an indication of the extent of support the national government and the degree to which such support is needed. After almost 20 years of
devolution, below is the picture for Region III compared with other regions (interdisparity) and the situation of the seven provinces of Central Luzon compared to one anoth
Regional IRA Independency Disparity. Regional IRA Independency Disparity. Regional IRA Independency Disparity. Regional IRA Independency Disparity. For 2004-2007, Local Governments in Central Luzon can be grouped with those of the National Capital Region and Regions 1 and 4 have relatively high IRA Independency Ratios. Occupying the fourth and last place in the group and trailing behind Region 1, Region 3 managed to climb up to the third place outdoing Region 1 in 2006 and 2007. From 2004-2007, NCR and Region 4 consioccupied the first and second places respectively.
regional disparity in terms of income levels of various LGUs (Provinces, Cities and Municipalities) is indicative of poor policy implementation in terms of investment promotion, income generation and economic growth. Although the formula as far as IAllotment (IRA) allocation among LGUs is concerned is provided for by law, every LGU is conferred with local autonomy on the utilization of its revenues and other receipts and the generation of the same from various sources.
al Disparities on IRA Independency.al Disparities on IRA Independency.al Disparities on IRA Independency.al Disparities on IRA Independency. Within Central Luzon, the glaring disparity between the IRA Independency Ratios of Aurora, Nueva Ecija, Pampanga, Tarlac and Zambales for the period 2004-2007 as against Bulacan and Bataan indicates the relatively
pacity of the five provinces to stimulate investments and boost economic activities in
Figure 9Figure 9Figure 9Figure 9 .
Source: Commission on Audit (COA)
75
IRA Independency Ratio is an indication of the extent of support the national government and the degree to which such support is needed. After almost 20 years of
devolution, below is the picture for Region III compared with other regions (inter-regional disparity) and the situation of the seven provinces of Central Luzon compared to one another
Local Governments in Central Luzon can be grouped with those of the National Capital Region and Regions 1 and 4 which
Occupying the fourth and last place in the group and trailing behind Region 1, Region 3 managed to climb up to the third place
2007, NCR and Region 4 consistently
regional disparity in terms of income levels of various LGUs (Provinces, Cities and Municipalities) is indicative of poor policy implementation in terms of investment promotion, income generation and economic growth. Although the formula as far as Internal Revenue Allotment (IRA) allocation among LGUs is concerned is provided for by law, every LGU is conferred with local autonomy on the utilization of its revenues and other receipts and the
Within Central Luzon, the glaring disparity between the IRA Independency Ratios of Aurora, Nueva Ecija, Pampanga, Tarlac and
2007 as against Bulacan and Bataan indicates the relatively pacity of the five provinces to stimulate investments and boost economic activities in

Source: Commission on Audit (COA)
Exercising revenue-raising powers under the LGC, LGU can derive their income internally (Own-Source Resources) and externally principally from their share in National Government coffers through the IRA. By providing for their corporate and broad taxing powers and innovative means for revenue generation, the clear intent of the LGC was primarily to stimulate local growth and eventually graduate from too much dependence on the national government for support to selfStrong local economies would mean greater access to quality basic social service After almost two decades, such intent however still has to produce the expected results for various reasons. Producing results is not only a matter of simply rea new regional administrative setclimb up to an independency ratio of 7.88 percent in 2007 experienced a sharp drop in 2006 down to 5.25 percent. Aurora was transferred from Region IV to Region III in 2002 by virtue of Executive Order No. Local political leadership has been clamouring for changes in this respectlegislation has been considered as a viable option, if experience at past efforts would be the gauge, the same is not expected to be forthcoming soon. An administrative reform at the level of the RDC is more realistic, the same being immediately executable being within the ambit of the ordinance powers of the President. Data would show that the Office of the President actually controls more than 80 percent of the national budget, and to necessitates subjecting the current processes to reportion of the national budget gives special attention to the more vulnerable LGUs, enhance
Figure 10Figure 10Figure 10Figure 10....
Source: Commission on Audit (COA)
raising powers under the LGC, LGU can derive their income internally Resources) and externally principally from their share in National Government
coffers through the IRA. By providing for their corporate and broad taxing powers and innovative means for revenue generation, the clear intent of the LGC was primarily to
late local growth and eventually graduate from too much dependence on the national government for support to self-sufficiency. Aggregated local growth means national growth. Strong local economies would mean greater access to quality basic social service
After almost two decades, such intent however still has to produce the expected results for reasons. Producing results is not only a matter of simply re-grouping provinces under
a new regional administrative set-up. A good example is Aurora which although managed to climb up to an independency ratio of 7.88 percent in 2007 experienced a sharp drop in 2006 down to 5.25 percent. Aurora was transferred from Region IV to Region III in 2002 by virtue of Executive Order No. 103.
adership has been clamouring for changes in this respectlegislation has been considered as a viable option, if experience at past efforts would be the gauge, the same is not expected to be forthcoming soon. An administrative reform at the
l of the RDC is more realistic, the same being immediately executable being within the ambit of the ordinance powers of the President.
Data would show that the Office of the President actually controls more than 80 percent of the national budget, and to put P-Noy’s Social Contract with the Filipino Peoplenecessitates subjecting the current processes to re-thinking to ensure that a substantive portion of the national budget gives special attention to the more vulnerable LGUs, enhance
76
raising powers under the LGC, LGU can derive their income internally Resources) and externally principally from their share in National Government
coffers through the IRA. By providing for their corporate and broad taxing powers and innovative means for revenue generation, the clear intent of the LGC was primarily to
late local growth and eventually graduate from too much dependence on the national sufficiency. Aggregated local growth means national growth.
Strong local economies would mean greater access to quality basic social services.
After almost two decades, such intent however still has to produce the expected results for grouping provinces under
hich although managed to climb up to an independency ratio of 7.88 percent in 2007 experienced a sharp drop in 2006 down to 5.25 percent. Aurora was transferred from Region IV to Region III in 2002 by
adership has been clamouring for changes in this respect. But while legislation has been considered as a viable option, if experience at past efforts would be the gauge, the same is not expected to be forthcoming soon. An administrative reform at the
l of the RDC is more realistic, the same being immediately executable being within the
Data would show that the Office of the President actually controls more than 80 percent of Social Contract with the Filipino People into action
thinking to ensure that a substantive portion of the national budget gives special attention to the more vulnerable LGUs, enhance

Source: Commission on Audit (COA)
their wealth-generating potentials and improve their capacity to provide access to basic social services by the marginalized, the excluded, and the neglected. The basic rationale underlying the administrative delineation of regions was to enable them to move with greater speed and efficiency as a more manageable administrative unit. To be translated with greater speed, efficiency and effectiveness, the sound management principle of span of control dictates that the content of the budget, its execution and its monimust be placed under the authority of the Regional Development Council (RDC) III. Such measure is intended to readministrative governance set Local Financial Capacity for Capital FormationLocal Financial Capacity for Capital FormationLocal Financial Capacity for Capital FormationLocal Financial Capacity for Capital Formationpercent of the local budget is spent on Personal Services (PS). If expenses for maintenance
and operation are added then what is left for LGUs developmslice of their general budget. If tales will be given probative weight, despite COA Guidelines on what can be considered as within the scope of the Development Fund (DF), LGUs have developed the habit of wanting to put mor
It is the National Government that usually provides for longBut if this is to be fully relied on, greater amount of evidence is still needed to prove the consistency of government pron In 2004, Region III bested the other nine regions as far as the financial capacity to invest in capital formation, which except for Bicol Region However, it had the lowest budget for
Figure 11Figure 11Figure 11Figure 11....
Audit (COA)
generating potentials and improve their capacity to provide access to basic social services by the marginalized, the excluded, and the neglected.
The basic rationale underlying the administrative delineation of regions was to enable them greater speed and efficiency as a more manageable administrative unit. To be
translated with greater speed, efficiency and effectiveness, the sound management principle of span of control dictates that the content of the budget, its execution and its monimust be placed under the authority of the Regional Development Council (RDC) III. Such measure is intended to re-create a relevant and proactive RDC and a responsive regional administrative governance set-up.
Local Financial Capacity for Capital FormationLocal Financial Capacity for Capital FormationLocal Financial Capacity for Capital FormationLocal Financial Capacity for Capital Formation. Data would show that generally around 45percent of the local budget is spent on Personal Services (PS). If expenses for maintenance
and operation are added then what is left for LGUs development projects is only a miniscule slice of their general budget. If tales will be given probative weight, despite COA Guidelines on what can be considered as within the scope of the Development Fund (DF), LGUs have developed the habit of wanting to put more projects within the scope of DF.
It is the National Government that usually provides for long-term huge capital investments. But if this is to be fully relied on, greater amount of evidence is still needed to prove the consistency of government pronouncements with its actuations.
Region III bested the other nine regions as far as the financial capacity to invest in capital formation, which except for Bicol Region were all from the Visayas and Mindanao. However, it had the lowest budget for capital investment as shown by its 23.34 percent ratio;
77
generating potentials and improve their capacity to provide access to basic
The basic rationale underlying the administrative delineation of regions was to enable them greater speed and efficiency as a more manageable administrative unit. To be
translated with greater speed, efficiency and effectiveness, the sound management principle of span of control dictates that the content of the budget, its execution and its monitoring must be placed under the authority of the Regional Development Council (RDC) III. Such
create a relevant and proactive RDC and a responsive regional
. Data would show that generally around 45-55 percent of the local budget is spent on Personal Services (PS). If expenses for maintenance
ent projects is only a miniscule slice of their general budget. If tales will be given probative weight, despite COA Guidelines on what can be considered as within the scope of the Development Fund (DF), LGUs have
e projects within the scope of DF.
term huge capital investments. But if this is to be fully relied on, greater amount of evidence is still needed to prove the
Region III bested the other nine regions as far as the financial capacity to invest in re all from the Visayas and Mindanao.
capital investment as shown by its 23.34 percent ratio;

Source: Commission on Audit (COA)
NCR had the highest budget for capitalterms, the difference is even larger. Sharply dropping to a measly .01 percentage points in 2005, Central Luztwo other regions, namely Region 7 and CAR in terms of capacity to invest in capitalactivities. At 23.03 percent ratio in 2006better performing 12 regions, outcompeting only Robtained the lowest at 7.91 percent. For 2007, Region III bounced back and has outdone 7 other regions. But at 21.14 percent ratio it appeared the most sluggish in the cohort of the “better performers”. From 2004-2007, the region has had more or less subdued behaviour as far as available finances for capital investment projects. Across provinces, for 2005 and 2006, the two provinces of Aurora and Pampanga had relatively small amount of available money for investment in capital formation. In 2007, Pampanga posted a sharp rise to 36.5its budget for capital investment almost doubling its 2006 level of 18.39 percent and surpassing the regional level of 21.14 percent. This leaves out only the province of Aurora which even experienced a drastic drop to 1.5 percent of its budgefree for capital investment. The extent of deprivation by the province is a lot greater than that of the Autonomous Region in Muslim Mindanao (ARMM) in 2007 which posted the lowest rate of 7.98 among all the regions nationwide. Traequivalent to P4,816,010, a negligible amount for long
Being mountainous, the unique topography of Aurora has even exacerbated the problem. Low investment in capitalthe people of the province but also the realization of their normative entitlhuman rights particularly their physical access to education, health, other social services, productive assets, and development opportunities to improve the quality of their lives.
Relatively lower PS and MOOE in 2007 was responsible fcapital investment in the case of Pampanga, from 18.39 percent in 2006 to 36.55 percent in 2007. Government Transactions. Working within the framework of reduced cost of doing business and implicit in addressing corruptio
Figure 12Figure 12Figure 12Figure 12....
Source: Commission on Audit (COA)
NCR had the highest budget for capital-forming investment at 36.04 percent. In absolute terms, the difference is even larger.
Sharply dropping to a measly .01 percentage points in 2005, Central Luzon outdid additional two other regions, namely Region 7 and CAR in terms of capacity to invest in capitalactivities. At 23.03 percent ratio in 2006, however, it was the lowest among the relatively better performing 12 regions, outcompeting only Regions 5, 11, 12 and the ARMM which obtained the lowest at 7.91 percent. For 2007, Region III bounced back and has outdone 7 other regions. But at 21.14 percent ratio it appeared the most sluggish in the cohort of the
07, the region has had more or less subdued behaviour as far as available finances for capital investment projects. Across provinces, for 2005 and 2006, the two provinces of Aurora and Pampanga had relatively small amount of available money for
in capital formation. In 2007, Pampanga posted a sharp rise to 36.5its budget for capital investment almost doubling its 2006 level of 18.39 percent and surpassing the regional level of 21.14 percent. This leaves out only the province of Aurora which even experienced a drastic drop to 1.5 percent of its budget that may be considered free for capital investment. The extent of deprivation by the province is a lot greater than that of the Autonomous Region in Muslim Mindanao (ARMM) in 2007 which posted the lowest rate of 7.98 among all the regions nationwide. Translated in absolute terms, this is equivalent to P4,816,010, a negligible amount for long-term capital investment.
Being mountainous, the unique topography of Aurora has even exacerbated the problem. Low investment in capital-forming projects does not only jeopardize the future wellthe people of the province but also the realization of their normative entitlements to various human rights particularly their physical access to education, health, other social services, productive assets, and development opportunities to improve the quality of their lives.
Relatively lower PS and MOOE in 2007 was responsible for the almost double budget for capital investment in the case of Pampanga, from 18.39 percent in 2006 to 36.55 percent
Government Transactions. Working within the framework of reduced cost of doing business and implicit in addressing corruption, businesses must be assured of transparent and
78
forming investment at 36.04 percent. In absolute
on outdid additional two other regions, namely Region 7 and CAR in terms of capacity to invest in capital-forming
however, it was the lowest among the relatively egions 5, 11, 12 and the ARMM which
obtained the lowest at 7.91 percent. For 2007, Region III bounced back and has outdone 7 other regions. But at 21.14 percent ratio it appeared the most sluggish in the cohort of the
07, the region has had more or less subdued behaviour as far as available finances for capital investment projects. Across provinces, for 2005 and 2006, the two provinces of Aurora and Pampanga had relatively small amount of available money for
in capital formation. In 2007, Pampanga posted a sharp rise to 36.55 percent of its budget for capital investment almost doubling its 2006 level of 18.39 percent and surpassing the regional level of 21.14 percent. This leaves out only the province of Aurora
t that may be considered free for capital investment. The extent of deprivation by the province is a lot greater than that of the Autonomous Region in Muslim Mindanao (ARMM) in 2007 which posted the lowest
nslated in absolute terms, this is term capital investment.
Being mountainous, the unique topography of Aurora has even exacerbated the problem. forming projects does not only jeopardize the future well-being of
ements to various human rights particularly their physical access to education, health, other social services, productive assets, and development opportunities to improve the quality of their lives.
or the almost double budget for capital investment in the case of Pampanga, from 18.39 percent in 2006 to 36.55 percent
Government Transactions. Working within the framework of reduced cost of doing business n, businesses must be assured of transparent and

79
efficient government processes because this would enable them to attribute responsibility in case of non-performance. Time means money for the business such that any delay in completing transactions with government in the exercise of its regulatory powers is an unnecessary expense. Simple and transparent processes of dealing with government will, therefore be, inviting to prospective investors and an incentive to existing investors. It is also a measure to eliminate potential source of corruption.
If Region III is to be promoted as one and common destination for investors, geographic disparity among its LGUs must be eliminated. From the regular monitoring reports received by the Department of Trade and Industry, Region III, as of the 2nd Quarter of 2010, the following were the observations made:
• There is no time difference between new and business applications for renewal. The implication is this would serve as disincentive being generally viewed as a plausible lack government support to performing private businesses.
• Shorter processing time for less urbanized municipalities within the same province. As a result, expected benefits in terms of increased investments because of low transaction costs are not optimized.
• Longer processing time for business application renewals. This serves as an unnecessary burden for performing businesses.
• Almost nil processing time for new applications, which suggests low level of value attached to the difference on what business process streamlining can do for the local economy.
Geographic disparity between and among municipalities in the same province is indicative of the weak supervision by the province in promoting it as a common target area for private investments. The following observations were noted from all the municipalities/cities of the provinces of Bataan, Pampanga, Tarlac and Nueva Ecija, six municipalities of Aurora, eight municipalities of Bulacan, and one city and one municipality from Zambales. From monitoring reports as of March 31, 2010, the upgrading initiated by the Department of Trade and Industry in January 2010 generally resulted in shorter processing time for the eight pilot cities of Central Luzon, namely: Balanga, Malolos, Cabanatuan, Gapan, Angeles, San Fernando, Tarlac and Olongapo.
XVI.�Climate�change�and�Natural�Disaster�Risks��
The study conducted by the Manila Observatory and commissioned by the Department of Environment and Natural Resources in 2007 although done on a national level, provides a view of the changing climatic conditions in the country across regions and provinces.

80
The results of the study indicate: (1) surface temperature increases that are consistent with the global and national trends; (2) local variations in rainfall distribution; (3) acceleration of sea level rise; and (4) typhoon occurrences. The increases in regional land and sea surface temperatures in the past 40 years observed by Manton, et.al. (2001) led the Manila Observatory (2007) to predict more hot days and warm nights with fewer cold days and
nights in the coming years. Central Luzon is predicted to have low risk in terms of projected temperature increases except for the province of Pampanga which has medium risk .
Predictions of local variations in rainfall over the country have been limited by research and technical capabilities and utilize extrapolation of past rainfall trends into the future although global models predict increases in rainfall amount over this part of subtropical Asia. Using the Manton, et.al. (2001) study, the Manila Observatory predicts that Central Luzon’s provinces shall be subjected to high and very high risks to projected rainfall changes (Figure 13).
Villarin, et.al (2008) advance that accelerated sea level rise resulting from expansion of oceans due to warming and the melting of mountain glaciers and polar ice is a phenomenon that shall affect and threaten the Philippine archipelago. In the same report, the authors cite evidence provided in the results of a study conducted by the UK Climate Research Unit in Manila and Legaspi that show an increase in sea level rise that started in the 1970s. Rodolfo and Siringan (2006) in Villarin, et.al. (2008) advance that ground subsidence due to over-extraction of groundwater compounds the impacts of sea level rise in urban centers. It may be worth noting that settlements in the Philippines started to develop along coasts and
Fig. 13Fig. 13Fig. 13Fig. 13....
Fig. 14Fig. 14Fig. 14Fig. 14
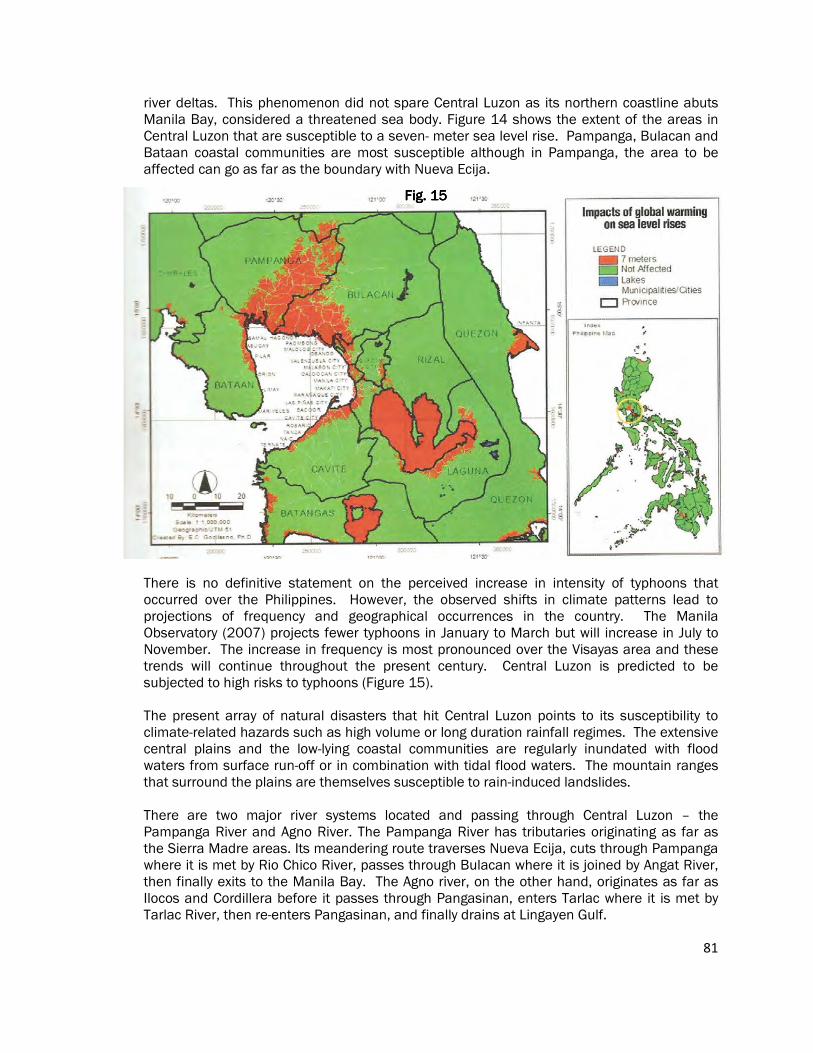
81
river deltas. This phenomenon did not spare Central Luzon as its northern coastline abuts Manila Bay, considered a threatened sea body. Figure 14 shows the extent of the areas in Central Luzon that are susceptible to a seven- meter sea level rise. Pampanga, Bulacan and Bataan coastal communities are most susceptible although in Pampanga, the area to be affected can go as far as the boundary with Nueva Ecija.
There is no definitive statement on the perceived increase in intensity of typhoons that occurred over the Philippines. However, the observed shifts in climate patterns lead to projections of frequency and geographical occurrences in the country. The Manila Observatory (2007) projects fewer typhoons in January to March but will increase in July to November. The increase in frequency is most pronounced over the Visayas area and these trends will continue throughout the present century. Central Luzon is predicted to be subjected to high risks to typhoons (Figure 15). The present array of natural disasters that hit Central Luzon points to its susceptibility to climate-related hazards such as high volume or long duration rainfall regimes. The extensive central plains and the low-lying coastal communities are regularly inundated with flood waters from surface run-off or in combination with tidal flood waters. The mountain ranges that surround the plains are themselves susceptible to rain-induced landslides.
There are two major river systems located and passing through Central Luzon – the Pampanga River and Agno River. The Pampanga River has tributaries originating as far as the Sierra Madre areas. Its meandering route traverses Nueva Ecija, cuts through Pampanga where it is met by Rio Chico River, passes through Bulacan where it is joined by Angat River, then finally exits to the Manila Bay. The Agno river, on the other hand, originates as far as Ilocos and Cordillera before it passes through Pangasinan, enters Tarlac where it is met by Tarlac River, then re-enters Pangasinan, and finally drains at Lingayen Gulf.
Fig. 15Fig. 15Fig. 15Fig. 15

82
The structure of the region’s economy shows that it is susceptible to the occurrence of natural disasters. Agriculture output continues to be a significant contributor to economic output. Rice and freshwater fisheries are major products and their production areas are found along the low- lying areas especially for fisheries and in flat to gently sloping areas for rice. These areas are very susceptible to flooding and increases or decreases in rainfall volumes shall have implications on the production levels. The vulnerability of the people in these areas is compounded by the high incidence of poverty in the same areas. The same may be construed for people living in sloping areas that are susceptible to landslides. Industry sector is anchored on the large industrial estates in the region. Freeport Area of Bataan is the first export processing zone in the country and located along the coasts of Mariveles in the Bataan Peninsula. Clark and Subic Economic and Freeport Zones, Hacienda Luisita in Tarlac and smaller private industrial estates in Bulacan and Pampanga house manufacturing industries that rely on continuous power supply, efficient telecommunications services, transportation facilities and housing for their operations. These requirements are all susceptible to typhoons and their operations grind to a halt in times of intense weather disturbances. Power and telecommunication lines are usually felled by intense typhoons and their workers are unable to report to work due to cuts in transport systems. Flooding usually is experienced in urban areas where most of their workers live. Central Luzon’s economy has recently been resuscitated from the effects of the eruption of Mt. Pinatubo in 1991 and the earthquake of 1990. Although these were geological events, the impacts were exacerbated by climatic hazards as our experience with lahar has shown when these were mobilized by heavy rainfall. And though the lahar deposits have since stabilized, the uncertainties surrounding rainfall regimes resulting from climate change may remobilize these deposits and threaten anew settlements in the low-lying areas.
In 2009 the PAGASA put up the Pampanga Flood Forecasting and Warning Communication system (PRBFFWC). It is equipped with a network of monitoring facilities consisting of rainfall, water level, combined rainfall and water level and three repeater stations, a central station
Fig. 16Fig. 16Fig. 16Fig. 16

83
and monitoring stations. The PRBFFWC is tasked to monitor hydrological situation, forecast and provide flood warnings to the flood-prone areas within the Pampanga river basin. Residents living in low-lying and flood prone areas in the provinces of Pampanga, Bulacan and Nueva Ecija are assured of early, concise and up-to-date reports on weather, rainfall and the water level of the Pampanga River. The project was built at a cost of PhP460 million sourced through a grant from the Japan International Cooperation Agency (JICA).
In Central Luzon there are three active faults i.e., the Philippine Fault which passes along Nueva Ecija province, the extension of the Marikina Valley Fault System at Angat, Bulacan and active faults east and south of the Zambales Range. Earthquake generators on the other hand are the Casiguran Fault located offshore of Casiguran in Aurora, Philippine Fault extension north of the region and the Lubang Fault near Lubang Island and Mindoro Island.
“The large impacts of natural disasters are not only related to the geography of the country and its high exposure to natural hazards, but also to its vulnerability, which is closely linked to poverty and environmental management.” In urban areas, poverty drives many poor families to live in high-risk areas. In the rural areas, disasters throw poor families back into poverty who are forced to rely on coping mechanisms that reduce their long-term chances for improving their lives.
The risks posed by global climate change will severely affect key pillars of socio-economic development, that include natural resources, agriculture, infrastructure, water resources and human health. While there is uncertainty on the likely conditions and changes in some climate variables resulting from global warming, there are predictors of possible climate change impacts in the country. Amidst the dearth of prediction models that reduce uncertainties for climate change impacts at the sub-national and sub-regional levels, it is certain that surface temperature is rising and more warm days and lesser cool ones have been recorded. These temperature variations have already increased the risks to the country and local level socio-economic development.
Although uncertainties continue to cloud the possible impacts of climate change at the local levels, it is certain that increases in average temperatures that result in natural disasters are already taking their toll on the socio-economic development of Central Luzon. This is due not only to the natural hazards to which the region is exposed but also because of its vulnerabilities that are exacerbated by poverty and environmental degradation. The most likely to be affected sector of the economy is the agriculture sector upon which a considerable number of the region’s poor depends for their livelihood.
XVII.Terrorism�and�Armed�Threats� To date, the main organized armed threat to internal security stems from the operations of the Central Luzon Regional Committee (CLRC) which is an organ of the Communist Party of the Philippines/New People’s Army/National Democratic Front (CPP/NPA/NDF). Communist Terrorist guerrilla fronts are operating in Pampanga, Bulacan and Nueva Ecija. In 2006 and 2007, the Internal Security Operations (ISO) of the Armed Forces of the Philippines (AFP) effected the neutralization of Communist-Terrorist (CT) leaders, regular members and functional staff. Sectoral front organizations remain active and aggressive in Central Luzon and sustained their activities and roles in the urban areas through the exploitation of human security issues and through extra-judicial killings.
84
As of late last year, the AFP and the PNP are still confronted with the existence of two warring factions, the pro-Sison and the anti-Sison groups. Per their assessment, the Marxist-Leninist Party of the Philippines/Rebolusyonaryong Hukbong Bayan (MLPP/RHB) still conducts party and mass base building. On the other hand, the rejectionist faction continues its extortion activities in order to survive. They are conducting limited Ideological, Political and Organizational (IPO) activities to avoid being branded as ordinary criminals.
At least 632 members of two communist rebel groups operating in Central Luzon surrendered to government authorities last year. The Army’s 7ID pronounced that 20 other communist guerrillas operating within the division’s area of operations have also been classified as “neutralized”. From the total 652 rebels who yielded, 147 had their firearms given up by the end of 2008. The AFP has reported that the number of NPA guerrilla fronts had been cut down from 87 in 2007 to 62 at the end of 2008, a good indication it is right on target of crushing the communist insurgency.