Embed Size (px)
Citation preview
CENTRAL ETOBICOKE HUBPRELIMINARY REPORT
February 17, 2017


SOCIAL PLANNING TORONTO | 1
INTRODUCTION
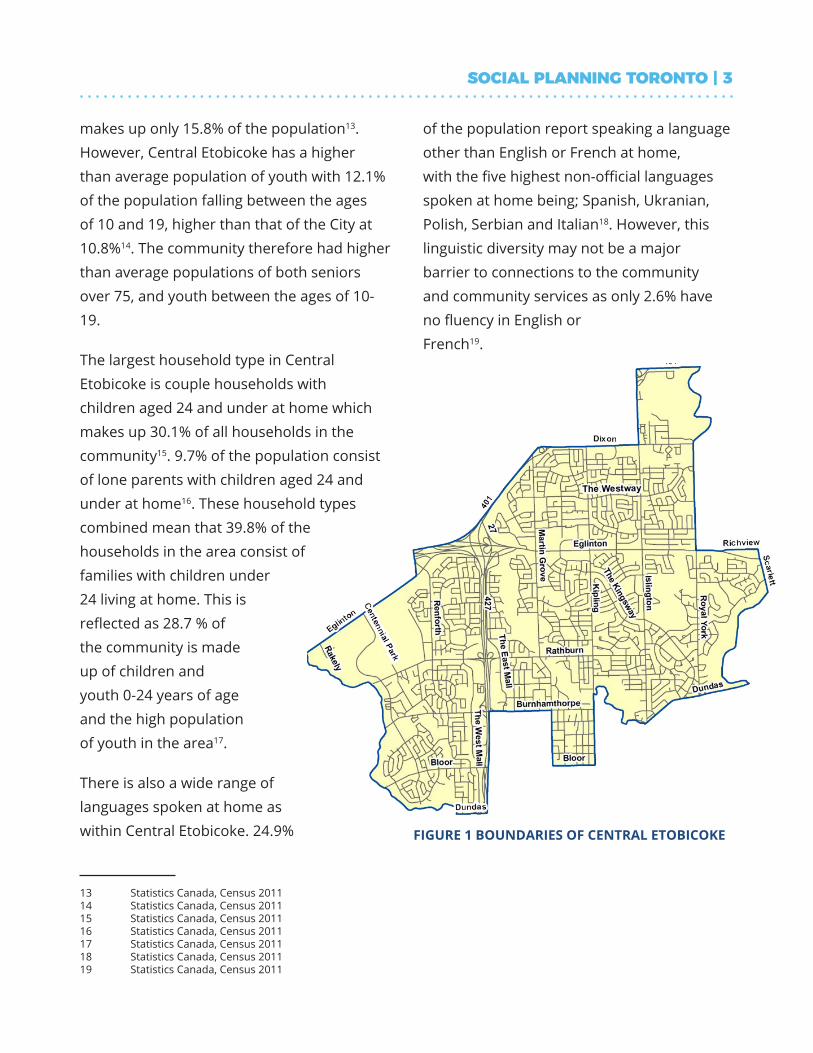
Central Etobicoke is a large geographic area composed primarily of wards 3 and 4, located in the west-end of Toronto. The boundaries stretch north to the 401, south to Burnamthorpe Road (with some parts reaching Dundas), west to include Centennial park and east just beyond Royal York Road. The area includes smaller neighbourhoods like The West Mall, the East Mall, Kingsview village, Mabelle, Scarlettwood court, Willowridge and Capri.
Historically central Etobicoke has been perceived as a well-to-do middle-class community. However, the City of Toronto is seeing major changes in its socio-economic geography. According to University of Toronto Professor David Hulchanski’s 2010 study: The Three Cities within Toronto: Income Polarization Among Toronto’s Neighbourhoods, this transformation entails high levels of wealth emerging increasingly in the downtown core and increasing pockets of low-income in the surrounding inner suburbs1. Hulchanski states that many smaller communities have become parts of “City three” — areas where income levels have decreased 20% or more since the 1970’s2.
The common perception of many communities as middle class has traditionally
1 Hulchanski, 20102 Hulchanski, 20103 Statistics Canada. 2014 T1FF4 Statistics Canada. 2014 T1FF
glossed over the reality— that within the inner suburbs, there are numerous pockets of poverty. As a result, these populations are severely underserved, as these areas have few services and resources geared to the low-income population. Over the years, little has been done to increase access to services to better accommodate community needs and there is limited research exploring the realities of “special mismatch” faced by these populations.
This report uses data on a census tract level to provide a closer look at the realities residents face, the needs of the community, and the gaps in support they encounter. The data shows a more complex picture than what has previously been assumed. The data demonstrates serious needs in the area, and few resources to address them. The community has various pockets of poverty, which have gone unrecognized. These pockets, which are scattered throughout the community, have poverty rates which reach as high as 26.9%3 overall, with specific populations like children in poverty reaching rates as high as 38.7%4. In addition, the community also contains a large population of two vulnerable groups - youth and seniors; populations which typically require increased access to services. This is coupled with the fact that there is an unusually low number of services in the area. The community
2 | CENTRAL ETOBICOKE HUB PRELIMINARY REPORT
also lacks mobility and has some of the lowest scores in both walkability and transit accessibility which has created a challenge for the community as residents have further constraints on access to services and resources.
DATA COLLECTION
Multiple sources of data were used to create this preliminary report. The demographic data represented was gathered from both the 2011 Census and the 2014 T1 Family File Taxfiler data which were accessed through the Community Data Program. Data from Wellbeing Toronto5, Toronto Public health’s: The Walkable City: Neighbourhood Design and Preferences, Travel Choices and Health6, The Martin Prosperity Institute and Urban heart Toronto7 were also used. Finally, a SWOT analysis (strengths, weakness, opportunities, and threats) was also held with community stakeholders to provide insights on the context of the community. The SWOT analysis provided feedback from 20 stakeholders from 15 community serving organizations and community leaders.
5 Wellbeing Toronto, 20166 Toronto Public Health, 20127 Urban Heart, 20108 Statistics Canada, Census 20119 Statistics Canada, Census 201110 Statistics Canada, Census 201111 Statistics Canada, Census 201112 Statistics Canada, Census 2011
DEMOGRAPHICS IN CENTRAL ETOBICOKE
In 2011 Central Etobicoke had a total population of 108,1918, demonstrating a 2.3%9 population growth over a five-year period between the 2006 and 2011 census years. The population growth demonstrated in Central Etobicoke was lower than that of Toronto overall, which saw a population growth of 4.5%10 city-wide in the same five-year period. Census data shows the area is made up of diverse age groups with high populations of both seniors, youth and children. The community has a higher population of seniors than Toronto overall, with 10.7% of Central Etobicoke’s population consisting of seniors 75 years and older, whereas in Toronto, this demographic group is only 7.2% of the population11. This demographic gap gets larger when we look at seniors aged 65 and over, which makes up 19.1% of the community’s population, but only 14.4% of the City population12.
Toronto has a significantly higher proportion of those age 25-39 (23.1% of the population) whereas in Central Etobicoke this age group
SOCIAL PLANNING TORONTO | 3
makes up only 15.8% of the population13. However, Central Etobicoke has a higher than average population of youth with 12.1% of the population falling between the ages of 10 and 19, higher than that of the City at 10.8%14. The community therefore had higher than average populations of both seniors over 75, and youth between the ages of 10-19.
The largest household type in Central Etobicoke is couple households with children aged 24 and under at home which makes up 30.1% of all households in the community15. 9.7% of the population consist of lone parents with children aged 24 and under at home16. These household types combined mean that 39.8% of the households in the area consist of families with children under 24 living at home. This is reflected as 28.7 % of the community is made up of children and youth 0-24 years of age and the high population of youth in the area17.
There is also a wide range of languages spoken at home as within Central Etobicoke. 24.9%
13 Statistics Canada, Census 201114 Statistics Canada, Census 201115 Statistics Canada, Census 201116 Statistics Canada, Census 201117 Statistics Canada, Census 201118 Statistics Canada, Census 201119 Statistics Canada, Census 2011
of the population report speaking a language other than English or French at home, with the five highest non-official languages spoken at home being; Spanish, Ukranian, Polish, Serbian and Italian18. However, this linguistic diversity may not be a major barrier to connections to the community and community services as only 2.6% have no fluency in English or French19.
FIGURE 1 BOUNDARIES OF CENTRAL ETOBICOKE

4 | CENTRAL ETOBICOKE HUB PRELIMINARY REPORT
As previously noted, the community has traditionally been perceived as a middle-class, well-to-do community, and when looking at the data on a macro level, a similar narrative arises. Couple families with and without children in the community appear to have higher incomes than couple families in Toronto overall. For example, only 15.6% of Central Etobicoke couple families have incomes under $40,000 compared to 26.5% in Toronto (an increase of more than 10%)20. In addition, 48.7% of Central Etobicoke couple families have incomes over $100,000 compared to 36.4% in Toronto21. However, the statistics change
20 Statistics Canada, Census 201121 Statistics Canada, Census 201122 Statistics Canada, Census 201123 Statistics Canada, Census 2011
drastically when looking at lone parent families in central Etobicoke. 40.4% of all lone-parent families make under $40,000 annually22. That represents almost half of the population of lone-parent families. Yet in comparison to Toronto overall, lone-parent families in central Etobicoke appear to have higher incomes than lone parent families in Toronto overall, where 50.9% of lone parent families have incomes under $40,00023.
FIGURE 2 POVERTY RATES: POPULATION
SOCIAL PLANNING TORONTO | 5
DIVERGENT NEIGHBOURHOODS: A DIFFERENT STORY
The above data provides an image which continues to present central Etobicoke as a middle-class community, which for a long time meant that the community did not demonstrate the need for extensive community resources. Recreation services have been kept at a minimal cost in the community by using cheaper alternatives like delivering programs in schools rather than investing in community centres24.
However, when we look at the community on a smaller scale, a more nuanced picture develops. Though of the overall population
24 Bahen, Austini, Humeel, Alagarajah & Kakamousias 201625 Statistics Canada. 2014 T1FF26 Statistics Canada. 2014 T1FF27 Statistics Canada. 2014 T1FF
only 13.8% are living in poverty, at the census tract level, there are several pockets in the area where poverty levels reach up to 27%25. This is shown in the map below which indicates four communities in different parts of the Central Etobicoke which have poverty levels between 20-26.9%, and many others with rates which vary from 10-19.9%26.
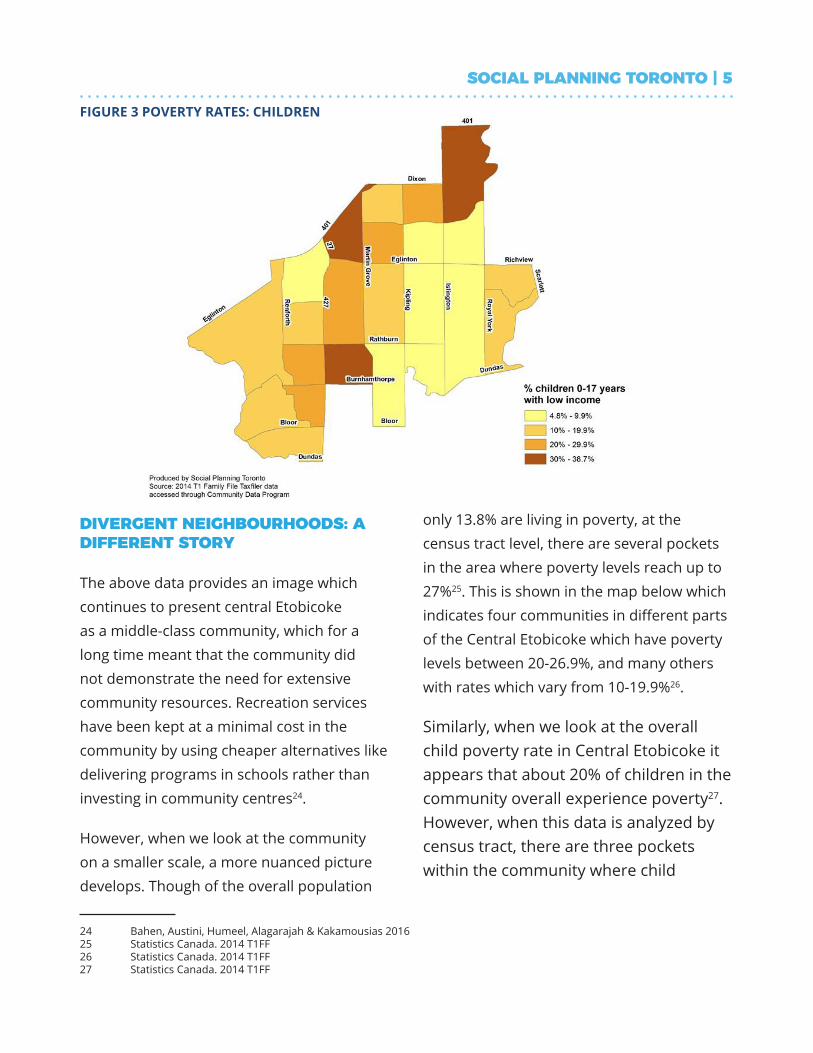
Similarly, when we look at the overall child poverty rate in Central Etobicoke it appears that about 20% of children in the community overall experience poverty27. However, when this data is analyzed by census tract, there are three pockets within the community where child
FIGURE 3 POVERTY RATES: CHILDREN

6 | CENTRAL ETOBICOKE HUB PRELIMINARY REPORT
poverty reaches between 30-38.7%, as shown by the map below28.
When we look at specific population such as the poverty rates of lone-parents families, the poverty rates reaches as high as 25.6% (more than a quarter of the population of lone-parent families)29. Poverty rates of non-census family persons (largely consisting of single people living alone) also reaches 23.7%30.
28 Statistics Canada. 2014 T1FF29 Statistics Canada. 2014 T1FF30 Statistics Canada. 2014 T1FF
A focus on the census tract level data, and in specific populations in the community, presents a different image of Central Etobicoke, with concentrated pockets of poverty among various populations.
SERVICE PROVISION
As poverty in the area is difficult to identify, and really only visible at the census tract level, less emphasis has been placed over the years on providing services, infrastructure
FIGURE 4 WELLBEING TORONTO TOOL MAP OF SERVICES
(THE PEACH/WHITE COLOURED AREA REPRESENTS CENTRAL ETOBICOKE)
SOCIAL PLANNING TORONTO | 7
and resources to address the needs of people who need access to services. A clear example of this was presented in the paper The Recreation Gap: A Case for Resource investment in Etobicoke Centre which argued that there is inequitable access to recreational facilities Central Etobicoke31. This can also be seen by visually comparing resources and services in Central Etobicoke and in other areas like Trinity-Spadina community on Well-being Toronto32.
This lack of service provision is significant as in addition to the concentrated pockets of poverty, it is clear from the data that the community also has a high population of seniors, age 75 or older, higher than that of Toronto overall. Seniors experience multiple barriers and need to have resources put in place to help ensure their well-being. For example, research has shown that many seniors experience social isolation which can lead to depression. This is of concern in Central Etobicoke where many seniors are living alone. Seniors benefit from physical activity and from support services that help ensure they stay healthy, programs that which in turn reduce the reliance on the health care system33.
Having a high population of seniors should,
31 Bahen, Austini, Humeel, Alagarajah & Kakamousias, 201632 WellBeing Toronto,201633 Bahen, Austini, Humeel, Alagarajah & Kakamousias, 201634 Bahen, Austini, Humeel, Alagarajah & Kakamousias, 201635 Statistics Canada, 201136 Murtry & Curling 2008:34
therefore, amplify the importance of having resources to help eliminate some of the barriers seniors face. Having public spaces for seniors to interact, form relationships and socialize is valuable. As well having recreational activities and active living programs increase physical health, reduce mental health symptoms, and have social benefits34. Yet the community lacks many of the resources, leaving the high population of seniors in the community underserved and with little or no access to resources which met their needs.
The community also has a high population of youth and of households with children age 24 and under living at home. Almost one-third of Central Etobicoke population consist of children and youth 24 years and younger35. Similar to seniors, children, youth and families with children heavily depend on community services. Children need access to after-school and recreational programs in order to thrive and The Roots of Youth Violence report also emphasized that youth need access to “spaces for community activities including meetings, recreation, the arts and service providers” in order to create safe communities where youth are meaningfully engaged36. Again, in Central Etobicoke,
8 | CENTRAL ETOBICOKE HUB PRELIMINARY REPORT
10.8 %37 of the population consist of youth ages 10-18, a transitional age where access to services, safe space, and meaningful relationships with caring adults is impactful. This is especially true of children/youth who are experiencing poverty, a population which reaches up to 38.7 %38 in some pockets of Central Etobicoke.
Affordable recreational programs and community resources are especially needed in communities with many lone parents families, who face higher poverty rates (25.6%). For single parents, access to community services and resource are extremely beneficial and can significantly
37 Statistics Canada, Census 201138 Statistics Canada, 2014 T1FF39 Statistics Canada, 2014 T1FF
help these families manage cost. Yet the community has little access to resources for youth and children.
The demographic data demonstrates that within Central Etobicoke there are larger populations of seniors and children/youth who typically benefit from community resources and support. In addition, when the area was scaled down to the census tract level the data showed many pockets of poverty, with poverty rates reaching nearly 40% in some areas39.
In addition to the limited amount of services and community resources
FIGURE 5 CENTRAL ETOBICOKE: WALKABILITY
SOCIAL PLANNING TORONTO | 9
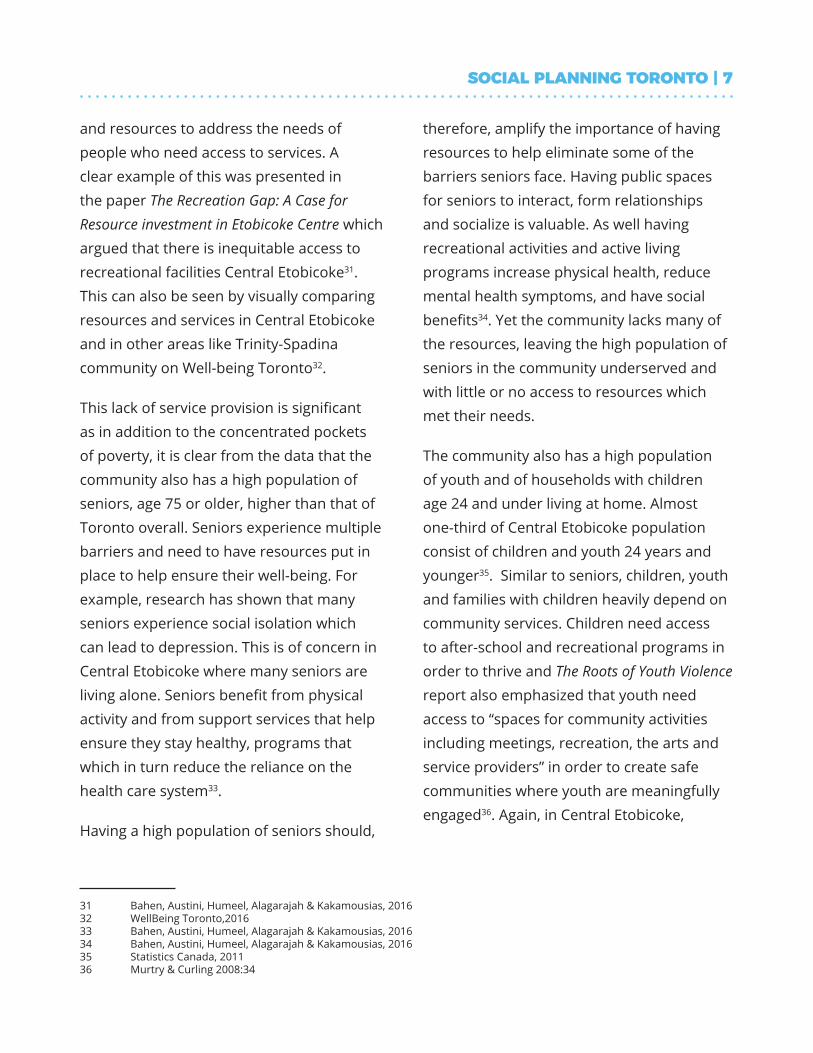
in the area, data also shows that mobility is a major concern in the community. According to The Recreation Gap report, four of the least walkable neighbourhoods in Toronto are located in Central Etobicoke40. In fact, in the City of Toronto’s walkability index, the entire community received either low or medium-low in walkability scores and Toronto’s Urban Heart report deemed communities in Central Etobicoke like East Mall, West Mall, Scarlettwood court, The Westway and Richview below the target for walk score41.
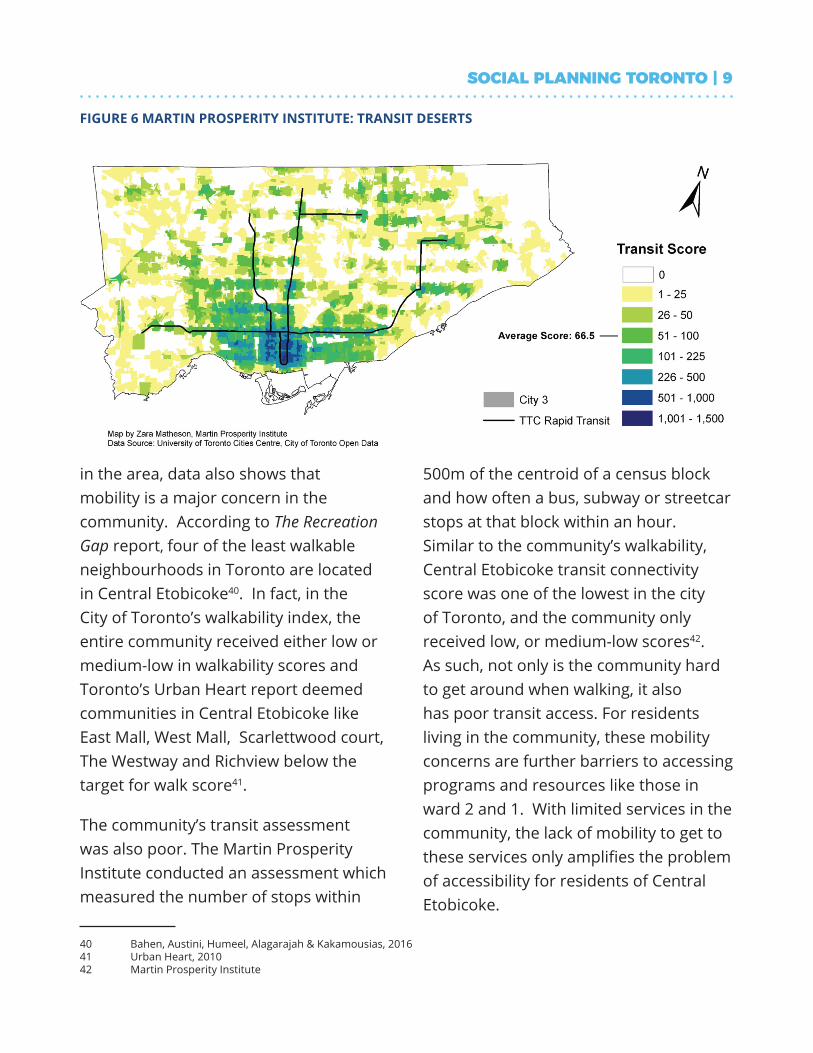
The community’s transit assessment was also poor. The Martin Prosperity Institute conducted an assessment which measured the number of stops within
40 Bahen, Austini, Humeel, Alagarajah & Kakamousias, 201641 Urban Heart, 201042 Martin Prosperity Institute
500m of the centroid of a census block and how often a bus, subway or streetcar stops at that block within an hour. Similar to the community’s walkability, Central Etobicoke transit connectivity score was one of the lowest in the city of Toronto, and the community only received low, or medium-low scores42. As such, not only is the community hard to get around when walking, it also has poor transit access. For residents living in the community, these mobility concerns are further barriers to accessing programs and resources like those in ward 2 and 1. With limited services in the community, the lack of mobility to get to these services only amplifies the problem of accessibility for residents of Central Etobicoke.
FIGURE 6 MARTIN PROSPERITY INSTITUTE: TRANSIT DESERTS
10 | CENTRAL ETOBICOKE HUB PRELIMINARY REPORT
SWOT ANALYSIS
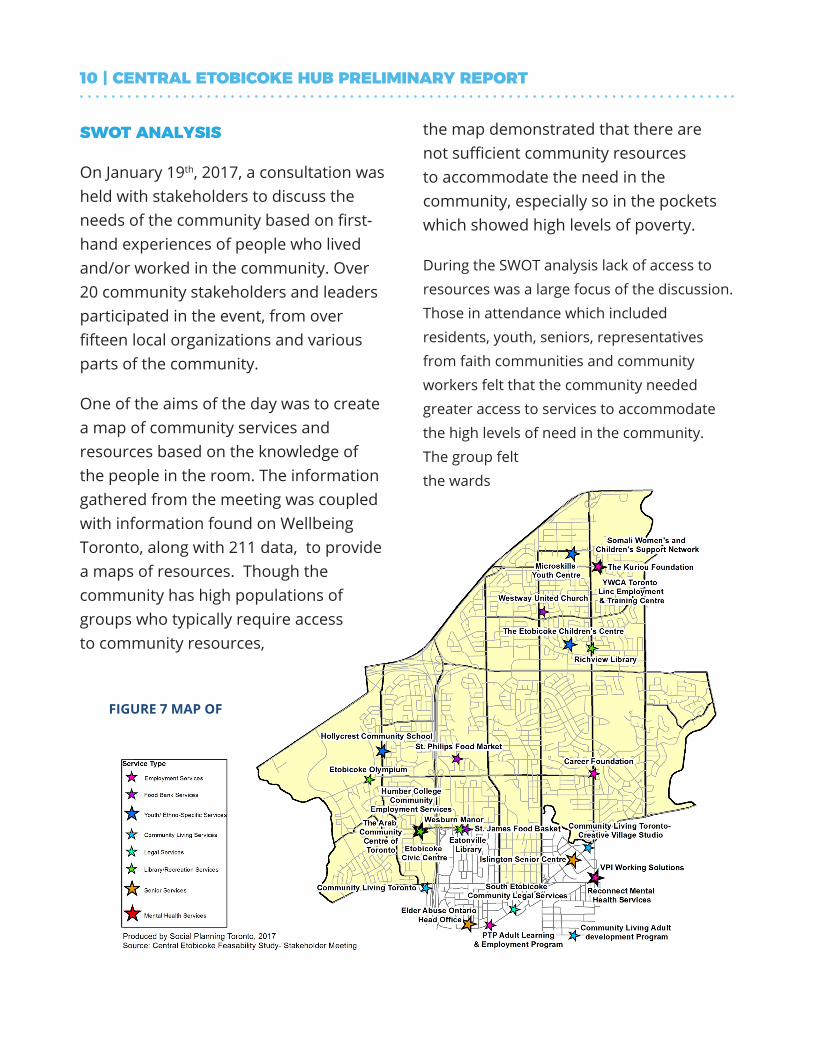
On January 19th, 2017, a consultation was held with stakeholders to discuss the needs of the community based on first-hand experiences of people who lived and/or worked in the community. Over 20 community stakeholders and leaders participated in the event, from over fifteen local organizations and various parts of the community.
One of the aims of the day was to create a map of community services and resources based on the knowledge of the people in the room. The information gathered from the meeting was coupled with information found on Wellbeing Toronto, along with 211 data, to provide a maps of resources. Though the community has high populations of groups who typically require access to community resources,
the map demonstrated that there are not sufficient community resources to accommodate the need in the community, especially so in the pockets which showed high levels of poverty.
During the SWOT analysis lack of access to resources was a large focus of the discussion. Those in attendance which included residents, youth, seniors, representatives from faith communities and community workers felt that the community needed greater access to services to accommodate the high levels of need in the community. The group felt the wards
FIGURE 7 MAP OF
SOCIAL PLANNING TORONTO | 11
contained a minimal number of community services. For many, this is problematic because of the large populations of youth, seniors and the pockets of poverty which exist in the community. Many of the group participants felt that services needed by the community were often offered by organizations from outside the community, meaning residents either had long travel times, or services would only be offered on certain days, both of which decreased accessibility. There was also a discussion surrounding the tendency of service providers to move outside the community, leaving gaps in services in the community. Overall the group felt that there were shortfalls in many aspects of community services.
There was a lack of employment services to assist residents in finding a job, and limited access to health service providers as the community has limited access to hospitals, medical/psychological clinics and no access to a community health centre in the area. Libraries were seen as too few and far apart as Richview library is the only major branch, and Eatonville and Elbrook were smaller, often crowded and sometimes had limited hours. For the high population of seniors, there were few long-term care homes, and little sustainable community supports for these seniors. Finally, the group felt that within the community there was little
43 Bahen, Austini, Humeel, Alagarajah & Kakamousias, 2016
recreational spaces, a topic recently research by students at York University43. Though the group acknowledge that one of its assets was having a newly revitalized park like Centennial park in the area, they also noted that the park was not accessible for those using transit, and was highly underutilized, especially by youth. The overall consensus in the room was that the community was severely lacking in infrastructure, and physical presence of agencies and services were minimal.
Participants expressed concern not only the about the limited amount of service available but also at the distance/travel times, to access those services, Central Etobicoke’s low walkability scores and poor transit access deepened the stakeholders’ concerns about access to service, as did the widely scattered geography of the pockets of poverty found through the census tract analysis.
Another topic which arose in this discussion was the lack of communication and social cohesion within the community. Many argued that one of the barriers to accessing services in the community is a lack of awareness and information channels in the community. There was a lack of awareness of programs and services available in the community and many service providers worked in silos with too little information sharing taking place. As such there was not enough coordination to support referral
12 | CENTRAL ETOBICOKE HUB PRELIMINARY REPORT
plans to facilitate wraparound care which results in multiple intakes for those accessing services. This scattered nature of services, coupled with the lack of mobility in the community meant that often residents travel quite far from program to program in order to get full support.
Many of the service providers argued that within the social service sectors, there was a lack of knowledge of what other programs existed in the community. Service providers found it hard to interact with each other due to the lack of a physical space where service providers could gather, and because of the geography of the area which meant service providers were quite far from one another. In fact, according to Urban Heart Toronto’s 2010 report, most parts of the community scored low for access to community spaces for meeting. A central access point of common connecting place was seen as a key mechanism for addressing this challenge.
Many felt that having a shared space could help facilitate better service access to residents as it would encourage collaboration, opportunities for referrals and coordination. Collaborative space provides an opportunity to improve collective impact by breaking down service silos and creating integrated supports to address the needs of the community. Shared space can also increase knowledge sharing between service
providers and residents in the community. This would give both seniors, and youth a space to access for their own programs, and could also facilitate intergenerational learnings between the youth and seniors in the community. One of the assets reported by the group was the large amount of social clubs, faith groups, resident groups and many other groups in the community, and a strong history of volunteerism. Having a shared space that these groups could use would help facilitate connections between these groups, and encourage collaboration. This has additional value as many noted that the demographic changes in the community had precipitated a growing divide in the community. Issues of inequality can create a sense of disconnection, a weakened sense of community, and declining local pride. Many felt like having community space would help create more opportunities for people to connect with their shared concerns. In other words, this space could create social cohesion across the many diverse populations in the community.
SOCIAL PLANNING TORONTO | 13
CONCLUSION
The data presented here demonstrates a need that has traditionally been overlooked in Central Etobicoke. The community, though typically presented as well-off, has multiple concentrated pockets of poverty, where poverty levels reach up to 26.9%44. The poverty rate of children in the community is also high in certain pockets, where the rate reaches up to 37.8%45.
These pockets of poverty are coupled with the high population of both seniors, and youth—populations which typically require access to community services. This shows a definite need for more community resources and infrastructure in the community.
Yet the Wellbeing Toronto analysis shows the number of services in the area is low. This was also shown in the SWOT analysis which developed a map of community resources, which showed the resources that currently exist in the community do not sufficiently meet the needs.
In addition, residents face multiple barriers to accessing resources because of the community’s geographic structure and the lack of mobility demonstrated by the communities low transit and walkability score.
The data and the community input both demonstrates the need for common connecting places that are accessible, inclusive and provide opportunities and supports. These access points need to support youth, seniors, individuals living alone, and families, to interact and become fully engaged, healthy, socially included, and participating citizens. The community identified a need for implementation of a shared space model to increase access to community space which will bring together various groups and decrease barriers to accessing these spaces.
44 Statistics Canada, 2014 T1FF45 Statistics Canada, 2014 T1FF

SOCIAL PLANNING TORONTO | 15
REFERENCES
• Bahen, J., Austini, L., Hummel, C., & Alagarajah, A. (2016). The Recreation Gap: A case for Resource Investment in Etobicoke Centre (Winter). Toronto: York University.
• Hulchanski, J.D. (2010) The Three Cities within Toronto: Income Polarization Among Toronto’s Neighbourhoods, 1970–2000. Research Bulletin 41, Centre for Urban & Community Studies,
• Transit Deserts & Hulchanski’s Three Cities (Rep.). (n.d.). Toronto: Martin Prosperity Institute
• McMurtry, R. R., & Curling, A. (2008). The review of the roots of youth violence. Ontario: ServiceOntario Publications.
• Statistics Canada. (2006). 2006 cumulative profile, Toronto (23 census tracts). [Data file]. Retrieved from Community data program http://communitydata.ca/
• Statistics Canada. (2011). 2011 cumulative profile, Toronto (23 census tracts). [Data file]. Retrieved from Community data program http://communitydata.ca/
• Statistics Canada. (2014). T1 Family Tax filer Data, Toronto (23 census tracts). [Data file]. Retrieved from Community data program http://communitydata.ca/
• Toronto Public Health. The Walkable City: Neighbouthood Design and Preferences, Travel Choices and Health. April 2012
• Wellbeing Toronto. (n.d.). Retrieved January 31, 2017, from http://map.toronto.ca/