Embed Size (px)
Citation preview

CENTRAL CORRIDOR P L A N N I N G P R O J E C T
BACKGROUND REPORT SAN FRANCISCO PLANNING DEPARTMENT MAY 2011

http://centralcorridor.sfplanning.org
© 2011 San Francisco Planning Department
1650 Mission Street Suite 400 San Francisco, CA 94103-3114 www.sfplanning.org

EXECUTIVE SUMMARY 01
INTRODUCTION 02
CITYWIDE CONTEXT 04
Regional Policies and Transit Oriented Development 04
Local Policies and Planning Efforts 05
Population, Housing and Employment Growth 06
Housing Trends 07
Housing Growth Potential 08
Job Trends 09
Trends in Job Types 11
Trends in Building Types 12
Trends in Location Selection 13
Job Growth Potential 13
4. CENTRAL CORRIDOR PLAN AREA 15
Land Use 16
Existing Uses and Building Types 16
Existing Zoning 18
Development Demand and Potential 20
Transportation 22
Existing Conditions 22
Future Conditions 23
Economy 24
Existing Conditions 24
Future Condition 25
5. NEXT STEPS 26
Table of Contents

The Central Corridor area provides an excellent opportunity for transit-oriented development

The Bay Area’s population is expected to grow substan-tially in the upcoming decades. Housing and employ-ment markets are increasingly looking to San Francisco as a place to accommodate a substantial portion of this growth. Additionally, state, regional, and local policies are all supportive of orienting new develop-ment to areas served by transit, as a way to reduce greenhouse gases and support other environmental and economic goals. Combined, these market and policy factors convey that substantial growth will occur in San Francisco within the foreseeable future.
Within San Francisco, the Central Corridor area provides an excellent opportunity for transit-oriented development. This area is already well-served by transit, which will be substantially enhanced by the anticipated Central Subway. The area includes substan-tial development opportunity, including numerous undeveloped or underdeveloped parcels, although zoning will likely have to be revisited in some areas in order to enable these opportunities.
Demand for development within the Central Corridor is already high, and is expected to increase. The neigh-borhood’s diverse economy and culture are attractive to residents and employers. Of particular interest is this area’s development as the hub of San Francisco’s information technology and digital media industries. It is anticipated that companies in these sectors will increasingly seek to locate in and around the Central Corridor, benefitting from proximity to similar firms, to San Francisco’s well-educated workforce, and to its central geographic position linking the traditional downtown financial district with the educational and employment hub of Mission Bay. As these sectors have been identified as vital to San Francisco’s economic wellbeing, it is important to work to accommodate their success.
Executive Summary
�C E N T R A L C O R R I D O R R E P O R T 2 0 1 1

IntroductionThe Central Subway railway project is an investment of approximately $1.5 billion in transit infrastructure that will provide easy and rapid connection between southern South of Market (SoMa) and Chinatown. See Figure 1. In anticipation of this investment, the Plan-ning Department is undertaking the Central Corridor Project to examine how land use patterns in this area might best complement and capitalize on the new transit infrastructure. This paper is intended to provide the land use background and context for this planning effort.
Much of the area close to the Central Subway corridor has been closely scrutinized in planning efforts over the last decade. This includes the recently adopted
East SoMa Plan of the broader Eastern Neighbor-hoods Plan process, and the ongoing Western SoMa Plan. One important note about the completed East SoMa/Eastern Neighborhoods Plan is that the Plan-ning Department decided in 2008 to not rezone an important swath of land in SoMa along the Central Subway corridor as part of that large plan. Because of its proximity to downtown, and because of the anticipated Central Subway investment, it was thought that this area should be the subject of a more focused planning process, to ascertain the appropriate land use controls. The Central Corridor Project will serve as that focused process, considering those parcels omitted from the Eastern Neighborhoods Plans along with the land along the rest of the Fourth Street corridor.
S A N F R A N C I S C O P L A N N I N G D E P A R T M E N T�

Figure 1 CENTRAL SUBwAY AREA
BRYANT ST
BERRY ST
MINNA ST
PERRY ST
HA
RR
IET
ST
CLARA ST
MARKET ST
SHIPLEY ST
BLUXOME ST
STILLMAN ST
RIT
CH
ST
TEHAMA ST
STEVENSON ST
NATOMA ST
RU
SS
ST
CLEMENTINA ST
JESSIE ST
TABER PLMO
RR
IS S
T
FREELON ST ZOE
ST
GIL
BE
RT
ST
WELSH ST
HA
WTH
OR
NE
ST
MA
RY
ST
MO
SS
ST
AN
NIE
ST
ES
SE
X S
T
GUY PL
NE
W M
ON
TGO
ME
RY
ST
SH
ER
MA
N S
T
ME
RLI
N S
T
CHANNEL ST
STA
NFO
RD
ST
SOUTH PARK
RIZAL ST
BO
AR
DM
AN
PL
OA
K G
RO
VE
ST
VARNEY PL
RIN
CO
N S
T
LUS
K S
TLANSING ST
YE
RB
AB
UE
NA
LN
ELIM ALY
CLY
DE
ST
EC
KE
RS
T
CO
LIN
P K
ELL
Y J
R S
T
LAP
U-L
AP
U S
T
CO
LUM
BIA
SQ
UA
RE
ST
MIN
T S
T
LUC
ER
NE
ST
BU
TTE
PL
CLA
RE
NC
E P
L
DE BOOM ST
MA
BIN
I ST
SH
AW
ALY
STE
RLI
NG
ST
VAS
SA
RP
L
AHERN WAY
KA
PLA
N L
N
MA
LDE
NA
LY
TULIP ALY
GA
LLA
GH
ER
LN
HUNT ST
TAN
DA
NG
SO
RA
WELSH ST
STEVENSON ST
FEDERAL ST
JESSIE STJESSIEST
JESSIE ST
NATOMA ST
STEVENSON ST
MINNA ST
CLEMENTINA ST
06TH
ST
TEHAMA ST
TS
HT4
TS
HT7
TS
DR3
TS
DN2
TS
HT5
TS
HT6
BRYANT ST
FOLSOM ST
HOWARD ST
BRANNAN ST
HARRISON ST
TOWNSEND ST
MISSION ST
ELLIS ST
TURK ST
EDDY ST POST ST
GEARY STBUSH ST
SUTTER ST
MARKET ST
JONES
ST
OFARRELL ST
MAS
ON ST
TAYL
OR ST
KEAR
NY ST
PINE ST
GRANT AV
E
POW
ELL S
T STOCKT
ON ST
KING ST
SANSO
ME
ST
LEAV
ENW
ORTH S
T
MosconeWest
MosconeCenter
YerbaBuenaGardens
AT&TPark
MontgomeryBART/MuniStation
PowellBART/MuniStation
Caltrain Station
SFMOMA
UnionSquare
General Areaof Study
1,000 Feet
Central CorridorSAN FRANCISCO
N
80
280
Solid lines represent surfacerail, dashed lines representsubway.
CaltrainBART
Muni Central SubwayPriorityDevelopmentArea
�C E N T R A L C O R R I D O R R E P O R T 2 0 1 1

Citywide Context
Reconsidering the future of any portion of the City requires consideration of its place within the context of the larger city and the region. This is even more critical in relation to the Central Corridor project area, given its proximity to regional and local transit; to the major job centers of Downtown and Mission Bay; and its location inside SOMA, a magnet for new and growing technology companies.
Regional Policies & Transit-Oriented Development
The California state legislature has taken several actions which highlight the increasing importance of transit oriented development. The Global Warming Solutions Act of 2006, or AB 32, mandated statewide reductions in greenhouse gas emissions. In 2008, Senate Bill 375 required regions as a whole to reduce greenhouse gas emissions by linking growth to transit, through the creation of a regional land use frame-work.1 As a regional transit hub, job center, population center, and tourist destination, San Francisco will be expected to accommodate a significantly larger portion of the region’s growth than it has in recent decades of sprawling growth throughout the region’s less urban-ized areas – at pattern that is not sustainable. Further, as the fuel prices increase, auto ownership is expected to diminish in the medium to long term,2 which would likely bring more demand to the most transit connected hubs in the region.
S A N F R A N C I S C O P L A N N I N G D E P A R T M E N T�

Transit-oriented development, in which neighbor-hoods are designed to maximize access to transit, will be a major component of SB375’s implementation. In the Bay Area, transportation is the single largest source of greenhouse gas emissions, with passenger travel in cars and light trucks causing more than 40% of those emissions. Transforming some of that passenger travel to transit, biking or walking will not only support environmental goals, but economic and social ones as well: reduction of energy consumption and greenhouse gas emissions associated with driving, less air pollu-tion, increased physical activity, lower vehicle accident rates, lower household transportation expenses, and high return on municipal infrastructure investment.
While concentrating both jobs and housing (and other uses) near major transit centers reduces auto travel, research has consistently shown a notably stronger correlation between transit usage and the proximity of jobs to transit as opposed to the proximity of housing to transit.3 Workers, in determining whether to take transit or drive to work, are more sensitive to distance from major transit on the job end of the commute trip than on the home end.
Research has also shown significant ridership increases with increases in employment density along rail lines.4 These factors suggest that locating high-density jobs adjacent to major regional transit and its local transit linkages can both maximize regional transit use and minimize greenhouse gas emissions from auto travel.
Local Policies and Planning Efforts
Based on trends of increasing traffic on city streets and the limited space available to their expansion, the San Francisco City Planning Commission and Board of Supervisors in 1973 adopted the “Transit First Policy” as a part of the General Plan, giving top priority to public transit investments. This policy has for a generation encouraged multi-modalism, empha-sizing investment in transit, bicycling and walking. It has also formed the backbone of land use planning in the City. The Transit First Policy was incorporated into the City Charter in 1999.
Beginning with the Downtown Plan in 1984, San Francisco’s planning efforts have focused on managing growth by directing it towards areas supported by transit. These community planning efforts have partnered plans for growth with supportive infrastructure and neighborhood improvements. Recently adopted plans include land use recommenda-tions, an improvement program to address needs for transit, open space, child care and other facilities, and strategies to work towards affordable housing needs, including project-specific programs for increased affordability requirements and fees. Each plan also includes an implementation strategy to work toward the realization of the plan’s vision, including funding mechanisms.
�C E N T R A L C O R R I D O R R E P O R T 2 0 1 1

Population, Housing and Employment Growth
The Association of Bay Area Governments (ABAG) produces biennial long-term (i.e. 25-year) projections for employment, households and population for the counties in the San Francisco Bay Area. ABAG’s current forecasting methodology emphasizes growth in areas with well-developed transit systems, and attempts to minimize environmental-, land-use- and transportation-related impacts of growth. Thus, even with a recent downward adjustment made to reflect the effects of the recession, ABAG’s 2009 projections allocate a significant proportion of the region’s growth to San Francisco and to the other urbanized centers of the Bay Area, such as Santa Clara County (San Jose) and Alameda County (Oakland). As many as 68,000 new households, and over 154,000 new jobs are projected for the City by 2035. This represents an allo-cation of over 15% of the region’s jobs (compared to 17% today) and almost 20% of the region’s household growth (compared to 13% today).
Still, it is important to note that projections are not necessarily accurate, nor are they static. A review of
ABAG’s historical projections in relation to actual San Francisco growth rates illustrates that while its projections for housing have been reasonably close, its employment projections have varied significantly from actual job growth, and have not been able to reflect the more dynamic cycles of the City’ job market. Additionally, today’s market conditions make the near future relatively difficult to project: while housing growth has been strong, the number of jobs has fluctuated in the past few decades. The total number of jobs in the City is nearly the same today as in 1985, but they have clustered in and near the Downtown as San Francisco increasingly becomes a hub of knowledge- and culture-based jobs, while it has shed back-office and industrial jobs throughout the City. Because of this uncertainty, projections can be expected to change over the next 20 years – in fact, ABAG recently revised its overall regional employment projections downwards in response to the recession. However, further projections are still likely to continue to prioritize growth in San Francisco, along with other Bay Area transit-served centers, over less served areas.
Table 1 ABAG PROjECTIONS 2009 - SAN FRANCISCO
2010 2015 2020 2025 2030 2035 GROwTH
EMPLOYMENT 544,750 569,720 599,060 631,790 665,030 698,790 154,040 jobs
HOUSEHOLDS 346,680 359,170 372,750 386,800 400,700 415,000 68,320 units
Source: Association of Bay Area Governments, 2010
S A N F R A N C I S C O P L A N N I N G D E P A R T M E N T�
Housing Trends
San Francisco’s population growth has increased steadily over the past three decades, growing at a rate between 35,000 to 50,000 new residents per decade. Census data from 2009 demonstrated that the City has surpassed its 1950s population peak, with over 800,000 current residents. This population growth, combined with a decreasing household size, has created substantial demand for new housing in San Francisco.
In response to this demand, housing development in San Francisco accelerated. Between 1999 and 2009, over 24,000 units were built, including 6,700 alone in 2008-09. However, despite the increase in production, housing prices over that period almost doubled, from an median $369,230 to $611,410 for a two-bedroom home, with a peak of $737,500 in 2005. Affordable
housing continues to be by far the most salient housing issue in San Francisco (as well as the Bay Area). While housing production over the past decade has been significant as noted above, development has not fully kept pace with affordability needs. About 26% of the new housing built since 2000 qualifies as affordable to households making less than median income.
The types of housing constructed in recent years have included small-scale infill buildings, mid-rise condo-miniums, and high rise development tied specifically to urban neighborhoods near Downtown. The latter category has seen substantial growth in recent years, with over 8,000 new high-rise units in the develop-ment pipeline.
�C E N T R A L C O R R I D O R R E P O R T 2 0 1 1

Housing Growth Potential
As described above, San Francisco’s planning efforts have attempted to manage growth by directing it towards areas supported by transit. The resulting community planning efforts, including recently adopted area plans, redevelopment areas and major projects both adopted and underway, provide estimated capacity for more than 73,000 new housing units, in a diversity of neighborhood types.5 For more detail, see Table 2. Scattered infill capacity under existing zoning regulations throughout the city adds capacity for another 17,000 units. Therefore, there is more than adequate capacity to accommodate the ABAG house-hold growth number of 68,000 households. However, even more capacity is necessary if for the market to provide a better balance of supply and demand to improve overall affordability.
Table 2 OVERVIEw OF RECENT PLANNING PROGRAMS
(1) Adopted plan area estimates are cited from eah plan’s Final Environmental Impact report (EIR), and plan areas under development are cited from Notice of Preparation (NOP). In adopted plan areas, plan area estimates subtract any development since plan adoption, to represent remaining develop-ment potential.
(2) Downtown residential projection based on soft site calculation.
(3) Downtown job projection based on soft site calculation, and includes opportunities in existing vacant space.
(4) Port projections based on preliminary development proposals on major Port sites.
Plan Area Year Adopted Projected Housing(1) Projected jobs(1)
Balboa Park 2009 1,780 725
Candlestick/Hunters Point Shipyard 2010 10,500 10,000
Central Waterfront 2008 2,020 500
Downtown (C-3 & other) 1984 13,850(2) 47,400(3)
East SoMa 2008 2,887 5,500
Executive Park Under development 1,600 75
Japantown Under development 500 850
Market and Octavia 2007 5,960 3,000
Mission 2008 1,696 3,000
Mission Bay 1998 3,000 21,000
Parkmerced Under development 5,677 900
Pier 70(4) Under development - 8,000
Rincon Hill 2005 4,100 -
Seawall Lot 337/ Pier 48(4) Under development 900 3,000
Showplace Square/Potrero Hill 2008 3,180 4,500
Transbay Terminal & Transit Center District Under development 4,665 25,000
Treasure Island Under development 7,000 2,750
Visitacion Valley 2008 1,585 500
Western SoMa Under development 2,700 6,000
TOTAL 73,100 152,325
S A N F R A N C I S C O P L A N N I N G D E P A R T M E N T�

job Trends
Overall, with the exception of the dot com peak, San Francisco has not seen much net job growth in the past 25 years. San Francisco witnessed strong employment growth in the 1960s to the mid 1980s. This was also the period of peak office space construc-tion, following the introduction of the Bay Area Rapid Transit System in the early 1970s. However, beginning in the 1980s, back-office jobs increasingly found their way to more outlying parts of the region,6 and many of the jobs gained during the boom peak of 2000 were lost in the subsequent bust. While there are a many possible explanations for the relative stalemate in terms of San Francisco jobs, one would be mistaken if one took that for a long term stasis in the city’s
economic geography. Just as manufacturing jobs have declined for the nation as a whole over the past 30 years, so has San Francisco seen a restructuring of its economy, with job losses chiefly in the manufacturing, wholesale and transportation sectors, while the service industries have grown. This shift in sectors translates to strongest growth in the cultural, institutional and educational group, retail and entertainment, and office. See Figure 2. And while that shift in sectors means that net job growth has been negligible, nearly 20 million square feet of commercial space has been added to accommodate the new workspaces needed by these growing sectors (for more detail, see Table 2), primarily in the transit-served central areas of the City,
0%
10%
20%
30%
40%
50%
60%
70%
80%
90%
100%
19761977
19781979
19801981
19821983
19841985
19861987
19881989
19901991
19921993
19941995
19961997
19981999
20002001
20022003
20042005
20062007
2008
c ieho te lindusre to ffice
Overall Job Change 1976-2008
Office
Retail, Entertainment
Industrial
Hotel
Cultural, Institutional, Educational
Annualized Growth: -1.6%
Annualized Growth: 1.7%
Annualized Growth: 3.0%
350,000400,000450,000500,000550,000600,000650,000
1976 1981 1986 1991 1996 2001 2006
Annualized Growth: 1.6%
Figure 2 EMPLOYMENT GROwTH BY LAND USE ACTIVITY, 1976-2008
�C E N T R A L C O R R I D O R R E P O R T 2 0 1 1

like Downtown. Since at this point the City’s economy has largely shed those industrial and back office jobs that it is likely to, any new jobs created in the City are likely to be net gains. It is important to note that long-standing land use controls limit growth of major workspaces in the City outside of the Downtown and immediately adjacent areas in order to focus growth near transit and protect neighborhood character.
While ABAG’s job projections are ambitious, repre-senting an annualized growth rate of 1.4%, well above recent growth rates and even above the 1.2% growth rate of the mid-1980 boom, there are environmental and economic forces at work nationwide that support these projections for increased growth in the City. With gasoline costs rising, consciousness about carbon emissions increasing, increasing overall demonstrations of the workforce’s desire to have a shorter commute, and the attractiveness of urban areas to the younger
working population, more and more companies are recognizing the desire of their employees to be in center cities. The priority of access to an educated urban workforce is shifting the balance of the financial trade off for companies in choosing between cheaper suburban locations and accessible urban ones. Employers, particularly knowledge industry employers, are realizing the connection between urban density and creative productivity. There is a growing understanding of cities as centers of innovation, where invention and creation occur separately from produc-tion. And more recently, many firms have made moves to urban areas specifically to be part of the “knowledge spillover” phenomenon, where innovation occurs as a result of exchange of ideas across firms and industries.7 All of these factors, combined with recent federal and regional policies to direct growth towards cities,8 point to the continued attractiveness of urban areas to new jobs.
S A N F R A N C I S C O P L A N N I N G D E P A R T M E N T�0

Trends in job Types
Since 1990, both financial services and corporate head-quarters employment has declined in San Francisco, and new sources of job growth in San Francisco have focused on the Bay Area’s technology economy. Many of these jobs are located in smaller companies, as opposed to large corporations: as of 2007, one out of every four jobs in San Francisco was in a company that employed less than 20 workers, and 43% of all workers were employed by companies with fewer than 50 employees.9
Cities have long been centers for innovation, and San Francisco more recently has made a name for itself as a center for technology innovation. The City has been particularly successful in generating and attracting creatively focused firms generating high technology products and knowledge-based goods and
services. Recognizing this, the City’s 2007 Economic Strategy targets certain kinds of sectors which meet economic goals and social goals, such as high growth potential and high paying jobs relative to education. This strategy also focuses specifically on the types of “knowledge-based” jobs that benefit from the clus-tering offered by high density urban areas and from proximity to similar firms. Such jobs can span office-oriented sectors such as information technology, digital media, and biotechnology; retail- and service-oriented sectors such as retail, accommodations, and health care; and PDR-oriented sectors such as construction and transportation. ABAG’s job growth projections roughly mirror this goal, projecting approximately 65,000 office jobs, 65,000 retail and service jobs, and 22,000 Production/ Distribution/ Repair (PDR) jobs.
��C E N T R A L C O R R I D O R R E P O R T 2 0 1 1

Trends in Building Types
As noted above, this shift in economic activity has resulted in demand for certain building types, in San Francisco and across the region. With respect to the San Francisco Bay Area, three common templates have been prominent:
1. The decentralized suburban low-rise office campus model (or models), relying on freeway access and inexpensive land.10 In San Francisco, with its scarce amount of developable land, this relatively low density template is more or less absent from the repertoire 11
2. The downtown high-rise model, relying on a high density employment model of agglomeration economics and sector specialization, and, above all, transit access.12 As a result of this type of demand, San Francisco’s downtown has become home to about half of the city’s jobs, including three-quarters of its office jobs, and a significant proportion of the region’s commuter jobs. This model is typified by development in the Downtown office core.
3. Mid-rise buildings in relatively dense, activity-rich parts of the city, including both re-use of formerly industrial buildings, and new construction. This model is most typical of the South of Market area, while ongoing efforts are being taken to replicate this in Mission Bay.
While the City’s major boom in office space, occurring between 1965 and 198113 was concentrated predomi-nantly in the high rise form in C-3-O zoning district, job growth in later decades took a more diverse form. Overall, the business eco-system in San Francisco reveals a diversity of use profiles and sizes. While the Financial District still is favored by many financial and real estate firms, more recent growth in information and knowledge sector jobs has located in industrial building types in the greater SoMa area – attractive for their open and flexible large floor plans, physical details (e.g. exposed concrete/brick/timber, operable windows) and relative affordability, especially given
their proximity to downtown transit access and urban amenities. The South of Market district is, for example, favored by many new media companies such as Twitter, Zynga and Adobe. Indeed currently the SoMa area has lower vacancy rates and is commanding nearly comparable rents to traditionally pricier Finan-cial District high rises. The City has clearly been well-served by its diversity in sizes and types of workspaces, providing a lesson that its policies should not just cater to tall buildings, but include mid-rise and smaller scale infill compatible with the neighborhood scale.
S A N F R A N C I S C O P L A N N I N G D E P A R T M E N T��

Trends in Location Selection
The locational preferences of these new jobs can be projected somewhat by past demand. Office jobs tend to locate in areas rich in transit and other amenities for their workers, although telecommuting and the increase in self-employment has diversified the geography which can serve office workers. As described above, there is also substantial diversity within this sector: while financial and management firms tend to prefer Downtown, technology companies (including information technology, digital media, and biotechnology) have shown a preference for the older buildings in SoMa and/or for co-locating with important institutions such as UCSF. Retail and service jobs tend to locate in convenient locations for their customers, resulting in clusters Downtown (e.g., the tourist-serving accommodations and retail sectors) as well as throughout the City’s neighborhoods (e.g., local-serving retail). While PDR jobs prefer to locate where land is less expensive and where conflicts with neighbors limited, many of these jobs, such as those in the construction and transportation sectors, are not often tied to a specific locale.
job Growth Potential
The Downtown Plan, the pending Transit Center District Plan, the Mission Bay Redevelopment Plan, and the Port’s ongoing planning efforts, and to some extent the Candlestick - Hunters Point Shipyard Redevelopment Plan and the Eastern Neighborhoods Plan, placed particular emphasis on creating jobs for economic vitality. Other area plans have focused on more housing growth, with associated jobs created by meeting neighborhood retail and service needs. Together, through these cumulative efforts, the City has identified areas that can accommodate up to 152,000 jobs, relatively close to ABAG’s employment projection of 154,000 new jobs (see Table 1), but with no excess space to support market-based locational decisions.
In some ways, this planned space matches job growth potential relatively well. Retail and service jobs are well provided for in these Plan areas in expanded neigh-borhood commercial districts inside of Plan Areas. Growth in PDR jobs is accommodated in the recently planned PDR districts, particularly given that much of
��C E N T R A L C O R R I D O R R E P O R T 2 0 1 1

the PDR job growth anticipated is in aspatial uses such as transportation and construction. Office jobs seeking Downtown high-rise locations are also likely accom-modated, given the current vacancy rate of about 13%, and the addition of new space planned to be added through the Transbay Transit Center District Plan.
However, given the low vacancy rate in SoMa, the recent Salesforce.com purchase of a large portion of the remaining sites in Mission Bay, and the potential for space demand by retail and service sector jobs, office uses seeking to locate in the South of Market and Mission Bay may have more difficulty.
Thus, while the City has existing overall total capacity for projected jobs, both the market demand and policy-direction for these jobs – in terms of location
and building type – may not match supply, as much of the theoretical job capacity is in outlying and less-transit served parts of the City. This is of particular concern for the wide range of newer office types being attracted to the City, which thus far shy away from the typical Downtown high rise and are otherwise compelled to look outside of the City as they cannot find room to grow on either developable land zoned for job space in transit-served central areas or existing vacancy within the finite universe of mid-rise large floorplate buildings.
For economic development purposes, as well as to ensure job growth is directed towards transit, addi-tional planning work may be required to ensure that land use policies appropriately support employment growth.
S A N F R A N C I S C O P L A N N I N G D E P A R T M E N T��

The Central Subway transit line, an extension of the 3rd Street light rail line that runs up the southeast side of the City and through Mission Bay, will run through the South of Market neighborhood under Fourth Street, and then under Stockton Street to Clay Street in the Chinatown neighborhood. The northern section of this new subway runs through the dense, relatively built out neighborhoods of Union Square and China-town, and is planned to relieve pressure from the City’s heavily-used #30 and #45 bus lines. The southern stretch of the railway spans the Yerba Buena area as well as less developed portions of SoMa, where it is expected that the line could support additional rider-
ship brought by growth. The Central Corridor Project will focus on the southern portion of the railway line, generally along the 3rd, 4th and 5th Street corridors from Mission Street on the north to Townsend Street on the south (the exact boundaries of the study area will be defined as part of the planning process).
The following local context is therefore focused on the likely plan area and its vicinity. It is not intended as an exhaustive analysis of the project area’s existing condi-tions, but rather a quick survey of the area’s conditions as they relate to its Citywide and regional context, discussed above.
Central Corridor Plan Area
��C E N T R A L C O R R I D O R R E P O R T 2 0 1 1

Existing Uses and Building Types
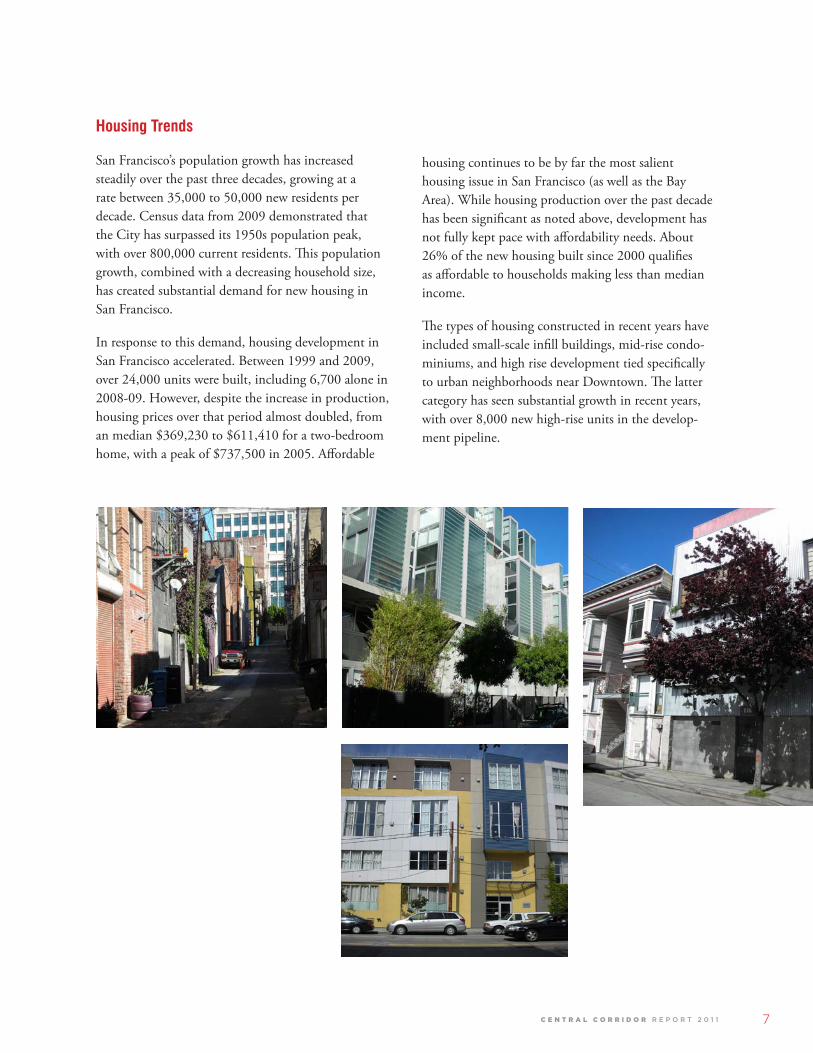
Traditionally a mixed use district, the Study Area contains a wide range of land uses often located side-by-side or even in the same building, with no one land use predominating.14 This includes a substantial number of housing units, offices, industrial spaces, retail spaces, and cultural and social institutions. See Figure 3. The northern end of the Central Corridor features a number of large parcels with a concentration of higher density residential uses, including a signifi-cant number of senior and affordable housing develop-ments, as well as regionally important museums and cultural facilities. The southern end contains more fine-grained development featuring primarily office, industrial retail, and entertainment uses.
In addition to this range of uses, the buildings them-selves exhibit a range of styles and ages. Although very few buildings remain from before 1906, many were built in the years immediately thereafter. Other major time periods of construction include redevelopment in the 1960s and modern buildings from the past 15 years.
The Planning Department recently completed the South of Market Area Historic Resource Survey, which covers the majority of the study area except for the blocks between Mission and Folsom Streets; and iden-tified buildings and districts of historic significance.15
Building heights vary considerably, ranging from single story buildings to buildings of 20 stories and above. While the typical building height is consider-ably less than in the financial district, the density is still substantially higher than those parts of the City further from downtown.
This mix of uses and buildings has supported the development of authentic and unique neighborhoods in and around the Study Area. This neighborhood character, in addition to other economic factors (see below) has proven attractive to new residential and commercial development.
Land Use
S A N F R A N C I S C O P L A N N I N G D E P A R T M E N T��
Figure 3 LAND USE MAP
��C E N T R A L C O R R I D O R R E P O R T 2 0 1 1

Existing Zoning
The existing zoning in the corridor is a hodge-podge from the past several decades -- from the Downtown Plan in the 1980s, the South of Market Plan in the early 1990s, and the Eastern Neighborhoods in the 2000s. Further, many parcels that were in the Yerba Buena Redevelopment Area have recently reverted back to even earlier zoning districts.
The northern portion of the Central Corridor Study Area maintains a strong relationship with Downtown, including C-3 and MUO zoning that supports high-density residential and office, and has higher height limits (over 12 stories). Much of this area was formerly part of the Yerba Buena Redevelopment Area, which terminated in January 2011.
A swath of land ringing this area north of the freeway is currently zoned primarily for housing, designated MUR and RSD, which require a ratio of 3 square
feet of housing for every square foot of other uses, effectively limiting other uses primarily to ground floor retail, but excluding new buildings that are predominantly commercial. These areas mostly allow buildings up to eight stories (though up to twelve stories in places), with requirements for further height sculpting on alleys.
South of Harrison street, zoning in the study area is predominated by the SLI (“Service Light Industrial”) light industrial zone, which does not permit new housing, except deed-restricted affordable housing, or office uses, except in historic buildings. These use restrictions have effectively preserved this area with low-scale, (1-2 story) low density commercial uses. Additionally, permitted heights are lower than other portions of the corridor (typically four to eight stories).
S A N F R A N C I S C O P L A N N I N G D E P A R T M E N T��

4TH
ST
3RD
ST
2ND
ST
5TH
ST
6TH
ST
BRYANT ST
FOLSOM ST
HOWARD ST
BRANNAN ST
BERRY ST
MARKET ST
HARRISON ST
TOWNSEND ST
MISSION ST
MINNA ST
PERRY ST
HA
RR
IET
ST
CLARA ST
SHIPLEY ST
ELLIS ST
STILLMAN ST
BLUXOME ST
TURK ST
RIT
CH
ST
TEHAMA ST
EDDY ST
POST ST
NATOMA ST
GEARY STR
US
S S
T
STEVENSON ST
CLEMENTINA ST
SUTTER ST
JESSIE ST
BUSH ST
TABER PL
MO
RR
IS S
T
JONE
S ST
ZOE
ST
OFARRELL ST
FREELON ST
KING ST
MAS
ON ST
GIL
BE
RT
ST WELSH ST
HAW
THO
RN
E S
T
KEAR
NY ST
MA
RY
ST
MO
SS
ST
ES
SE
X S
T
NE
W M
ON
TGO
ME
RY
ST
SH
ER
MA
N S
T
GU
Y P
L
STA
NFO
RD
ST
SOUTH PARK
BO
AR
DM
AN
PL
RIZAL ST
RIN
CO
N S
T
VARNEY PL
DOW PL
MINT PLZ
EC
KE
R S
T
CO
LIN
P K
ELL
Y JR
ST
CO
LUM
BIA
SQ
UA
RE
ST
BONIFACIO ST
FEDERAL ST
DE BOOM ST
STE
RLI
NG
STAHERN WAY
STEVENSON ST
MINNA ST
TEHAMA ST
WELSH ST
JESSIE STJESSIE ST
NATOMA ST
P P
SLI
M-2
SLI
MB-RA
PP
P
MB-O
SLI
P
P
C-3-S
C-3-S
C-3-R C-3-R
SLI
P
SLI
MUO
SLI
P
P
SLI
C-3-S
P
MUO
P
P
SLI
SLI
SSO
SLI
P
P
SLI
SB-DTR
P
P
MB-RA
P
SSO
MB-RAMB-RA
P
MUO
MB-RA
MUR
SLI
SLI
SLI
P
SLI
P
MURSL
I
MURMUR
MUR
SB-DTR
P
C-3-S
C-3-S
MUO
MUR
SLI
MUG
RSD
C-3-G
MUO
SLI
SLI
C-3-O
SLI
P
MUO
MUO
MUR
MUR
MUO
SLI
C-3-O
C-3-G
P
MUO
C-3-O
SB-DTR
RC-4 RC-4
C-3-O
MUO
RC-4
RSD
P
C-3-S
MUO
C-3-SC-3-O
C-3-R
MUO
P
C-3-O
RC-4
C-3-O
C-3-R
C-3-G
P
SLI
RED
MB-RA
MUR
C-3-S
SLI
C-3-O
C-3-S
SLI
MUR
P
SLI
SLI
RC-4
RC-4
SLI
C-3-G
C-3-G
RC-4
C-3-S
MUR
C-3-O
M-2
C-3-O
C-3-O
MUO
MUO
C-3-O C-3-O
SLISLI
MUG
MUO
RED
SLI
P
RED
C-3-G
C-3-S
MUR
C-3-R
C-3-G
C-3-O
SLI
C-3-R C-3-R C-3-R C-3-O
MUG
RSD
MUO
SB-D
TR
RED
SLI
MUO
C-3-S
MUG
SSO
MUG
C-3-O
C-3-O
MUR
P
C-3-
G
SPD
C-3-R
M-1
SPD
C-3-R
MUR
SPD
C-3-O(SD)
SPD
SLI
PC-3
-R
C-3-O
MUO
SLI SLI
MUR
C-3-
R
C-3-R
C-3-R
C-3-O
C-3-O(SD)
RED
NCT
C-3-O
C-3-O
SSO
RH DTR
NCT
C-3-O
C-3-R
MUG
C-3-O(SD)
C-3-O C-3-O
C-3-O
MUG
RH DTR
C-3-O
C-3-
OC-3-
R
C-3-
O
NCT
RH DTR
MUO
C-3-O(SD)
TB DTR
NCT
RED
C-3-
G
NCT
C-3-G
C-3-R
MUG
C-3-G
C-3-G
SLI
MUG
SB-D
TR
MUG
C-3-O(SD)
C-3-O(SD)
MUO
C-3-O(SD)
RH DTR
C-3-S
NCT
NCT
C-3-
G
C-3-O
SSO
C-3-O
MUO
C-3-G
MUG
SLI
C-3-O(SD)
NCT
M-1
NCT
C-3-O
NCT
MUO
C-3-O
SLI
NCT
MUG
MUG
M-1
1,000 FeetNORTHCentral CorridorExisting Zoning Districts
80
280
Figure 4 EXISTING ZONING DISTRICTS
��C E N T R A L C O R R I D O R R E P O R T 2 0 1 1

Development Demand and Potential
In recent years, there has been high development demand within the Study Area. This demand is driven by factors discussed elsewhere in this paper, such as the proximity to downtown, existing and proposed transit, neighborhood character, and the allure of the SoMa “brand”. This demand is mostly for residential and office uses, with a modicum of retail and cultural uses, whereas it is anticipated that any new industrial uses would locate in the “PDR” zoning districts created by the Bayview and Eastern Neighborhoods Plans. For the last eight years, South of Market area in general has seen more new residential construction than any other part of the City, with growth of over 8,000 units in the last decade. Additionally, compared to Down-
town, vacancy rates for commercial development are substantially lower while rents are equivalent or more.
Despite the recent development boom, the area still has substantial development potential. There are a number of potential development sites in the Study Area, with smaller sites interspersed throughout, and larger sites mostly located south of Harrison Street. Development sites include parcels that are undevel-oped (e.g., surface parking lots) or “underdeveloped” (e.g., low-rise, older non-residential buildings that are not historic resources). Realizing this development potential may require revisions to the land use and height controls on these parcels.
4TH
ST
3RD
ST
2ND
ST
5TH
ST
6TH
ST
BRYANT ST
FOLSOM ST
HOWARD ST
BRANNAN ST
BERRY ST
MARKET ST
HARRISON ST
TOWNSEND ST
MISSION ST
MINNA ST
PERRY ST
HA
RR
IET
ST
CLARA ST
SHIPLEY ST
ELLIS ST
STILLMAN ST
BLUXOME ST
TURK ST
RIT
CH
ST
TEHAMA ST
EDDY ST
POST ST
NATOMA ST
GEARY ST
RU
SS
ST
STEVENSON ST
CLEMENTINA ST
SUTTER ST
JESSIE ST
BUSH ST
TABER PL
MO
RR
IS S
T
JONE
S ST
ZOE
ST
OFARRELL ST
FREELON ST
KING ST
MAS
ON ST
GIL
BE
RT
ST WELSH ST
HAW
THO
RN
E S
T
KEAR
NY ST
MA
RY
ST
MO
SS
ST
ES
SE
X S
T
NE
W M
ON
TGO
ME
RY
ST
SH
ER
MA
N S
T
GU
Y P
L
STA
NFO
RD
ST
SOUTH PARK
BO
AR
DM
AN
PL
RIZAL ST
RIN
CO
N S
T
VARNEY PL
DOW PL
MINT PLZ
EC
KE
R S
T
CO
LIN
P K
ELL
Y JR
ST
CO
LUM
BIA
SQ
UA
RE
ST
BONIFACIO ST
FEDERAL ST
DE BOOM ST
STE
RLI
NG
STAHERN WAY
STEVENSON ST
MINNA ST
TEHAMA ST
WELSH ST
JESSIE STJESSIE ST
NATOMA ST
110
MB-RA
50-X
340-I
340-I
50-X
65-X
150-X
400-I
30-X
65-X
MB-RA
65-X
50-X
65-X
30-X
105-F
OS
90-X
130-E
105-K
65-X
65-X
MB-RA
MB-RA
30-X
45-X
85-X
45-X
30-X
MB-RA
320-I
50-X
65-X
50-X
90-X
120-X
50-X
65-X
85-X
130-G
30-X 65-X
45-X
105-F
160-F
85-X
45-X
45-X
30-X
85-X
65-X
50-X
50-X
65-X
85-X
160-F
45-X
160-F
85-X
200-S
45-X
130-G
400-X
250-S
320-S
90-X
320-I
160-F
45-X
105-F
65-X
85-X
130-F
85-X
450-S
55-X
320-I
85-X
65-X
200-X
OS
65-X
500-I
500-S
130-L
65-X
105-
F85-X
50-X
85-X
55-X
40-X
65-X80-130-F
65-X
160-S
40-X/85-B45-X
65-X
160-F
45-X
80-130-F
45-X
85-X
40-X
85-X
160-F
350-S
45-X 80-X
50-X
120-X
30-X
120-X34
0-I
45-X
400-X
45-X
130-F
450-S
80-130-F
120-X
40-X/85-B
90-X
45-X
85-X
550-S
50-X
120-X
500-S250-S
45-X
85-X
65-X
85-X
80-T-120-T
160-
S
85-X
80-T-120-T
500-S
80-T-120-T
85-X
85-X
65-X
80-130-F80-T
45-X
120-X
65/200-R
OS
85-X
45-X
50-X
45-X
105/200-R
45-X
30-X
65-X
300-S
40-X
130-E
350-S
40-X
65-X
55-X55-X
200-S
40-X
65-X
40-X
340-I
550-S
350-S
500-I
80-130-F
65-X
120-X
65-X
45-X
500-I
80-130-F
300-S
80-T-130-T
350-S
50-X
45-X
80-T-120-T
65-X
150-S
150-S
150-S
80-130-F
225-
X 80-1
30-F
105-
F
120-X
150-S
250-S
45-X
45-X
120-F
550-S
45-X
150-S
80-T-120-T
45-X
OS
45-X
130-L
65-X
150-S
550-S
45-X
150-S
450-
S80-130-F
45-X
80-130-F
45-X
350-S
320-I45-X
80-130-F
120-X
85-X
65-X
135-X
45-X
120-X
80-X
85-X
40-X/85-B
110-X
80-X
400-S
65-X
225-S
65-X
120-F
340-
I
80-X
550-S
85-X
85-TB
45-X
85-X
300-S
85-X
150-
S
65-X
80-130-F
250-
S
85-X
120-X
550-S
150-S
150-
S
500-S
150-S
350-
S
85-X
40-X
65-X
85-X
120-X
84-X
350-S
55-X
65-X
50-X
250-
S
160-
F
85-X
65-X
85-X
45-X
85-X
65-X
50-X
85-X
85-X
550-S
300-S85-X
85-X
150-S
450-
S
85-X
90-X
85-X
85-X
120-
X
85-X
110-X
85-X
65-X
400-
I
85-X
85-X
120-X
300-S
350-
S
65-X
65-X
150-S
65-X
300-
S
65-X
160-S
450-
S
1,000 FeetNORTHCentral CorridorExisting Height/Bulk Districts
80
280
S A N F R A N C I S C O P L A N N I N G D E P A R T M E N T�0

Caltrain
Central Subway (Muni Metro)
4TH
ST
3RD
ST
2ND
ST
5TH
ST
6TH
ST
BRYANT ST
FOLSOM ST
HOWARD ST
BRANNAN ST
BERRY ST
MARKET ST
HARRISON ST
TOWNSEND ST
MISSION ST
MINNA ST
PERRY ST
HA
RR
IET
ST
CLARA ST
SHIPLEY ST
ELLIS ST
STILLMAN ST
BLUXOME ST
TURK ST
RIT
CH
ST
TEHAMA ST
EDDY ST
POST ST
NATOMA ST
GEARY STR
US
S S
T
STEVENSON ST
CLEMENTINA ST
SUTTER ST
JESSIE ST
BUSH ST
TABER PL
MO
RR
IS S
T
JONE
S ST
ZOE
ST
OFARRELL ST
FREELON ST
KING ST
MAS
ON ST
GIL
BE
RT
ST WELSH ST
HAW
THO
RN
E S
T
KEAR
NY ST
MA
RY
ST
MO
SS
ST
ES
SE
X S
T
NE
W M
ON
TGO
ME
RY
ST
SH
ER
MA
N S
T
GU
Y P
L
STA
NFO
RD
ST
SOUTH PARK
BO
AR
DM
AN
PL
RIZAL ST
RIN
CO
N S
T
VARNEY PL
DOW PL
MINT PLZ
EC
KE
R S
T
CO
LIN
P K
ELL
Y JR
ST
CO
LUM
BIA
SQ
UA
RE
ST
BONIFACIO ST
FEDERAL ST
DE BOOM ST
STE
RLI
NG
STAHERN WAY
STEVENSON ST
MINNA ST
TEHAMA ST
WELSH ST
JESSIE STJESSIE ST
NATOMA ST
Over 401’
201’ - 400’Under 40’
41’ - 100’
101’ - 200’
1,000 FeetNORTHCentral CorridorExisting Building Heights Map
80
280
Figure 5 EXISTING BUILDING HEIGHTS MAP
��C E N T R A L C O R R I D O R R E P O R T 2 0 1 1

Existing Conditions
The Study Area contains a strong and diverse trans-portation network. The area consists of wide surface streets designed to accommodate private vehicles. The area is well served by a number of regional and local transit services, including:
The Bay Area Rapid Transit (BART) regional rail line, which connects the northern half of the study area to the East Bay and northern San Mateo County, including San Francisco International Airport, via the Montgomery Street and Powell Street stations:
The Caltrain regional rail line, which connects the southern half of the study area to San Mateo and Santa Clara counties via its terminus at 4th and King Streets.
The Transbay Terminal (both the temporary terminal at Beale and Howard and the permanent terminal under construction at 1st and Mission), which connects the northern half of the study area to much of the East Bay (via AC Transit and
Transportation
WestCAT), Marin County (via Golden Gate Transit), and San Mateo County (via SamTrans) through regional express buses. In addition to reaching the Transbay Terminal, SamTrans and Golden Gate Transit provide limited service within the Study Area.
The MUNI Metro rail line, which connects much of western San Francisco to the study area via the Montgomery Street and Powell Street stations (serving the northern portion of the study area) and the 4th and King station (serving the southern half of the study area).
MUNI local bus service, which directly serves the entire study area via bus lines such as the 10, 12, 14, 27, 30, 45, and 47.16
Existing bicycle lanes serving the area exist on Howard, Folsom, Townsend, and 5th Streets. The area’s relatively high density is also supportive of walking, although its intensity of wide, one-way streets, long blocks, relatively poor sidewalk conditions with few
Poor Pedestrian Conditions on Fourth Street
S A N F R A N C I S C O P L A N N I N G D E P A R T M E N T��

amenities, and presence of an elevated freeway and its associated ramps, do not provide a positive pedestrian experience. The street realm in the area presents many major physical and psychological challenges for pedes-trian circulation in the area.
The area is also well-served by the freeway system, including Interstate 80, which bisects the Central Corridor into northern and southern portions, and Interstate 280, which feeds the south side of the area.
Future Conditions
Citywide growth is expected to add significant demand to the existing transportation capacity within the Study Area.17 Several projects are proposed to help alleviate this congestion. The most important is the Central Subway, expected to be completed by 2017. The Central Subway is expected to move 76,000 daily riders through the corridor by 2030, with a peak hourly capacity of almost 5,000 riders in each direc-tion. Stations will include new underground facilities in Chinatown, at Union Square/Market Street, and at Moscone Center, with above ground stations at
Brannan and King Streets. Additional transportation improvements include the Caltrain Downtown Extension which, when complete, will further extend Caltrain through the study area through an under-ground tunnel to the Transbay Transit Center near 1st and Mission Streets, improvements to MUNI made through the Transit Effectiveness Project, anticipated improvements to the Bicycle Network, and streetscape improvements intended to improve walkability in SoMa.
��C E N T R A L C O R R I D O R R E P O R T 2 0 1 1

Existing Conditions
The South of Market neighborhood has played a significant role in the City’s recent economic develop-ment, particularly its role as a hub for interactive, media-based businesses. The area is already is home to a significant concentration of the City’s workforce. There are estimated to be over 58,000 workers in the Central Corridor Study Area and surrounding vicinity, representing over 10% of the City’s workers.18 Of the Central Corridor’s workers, about two-thirds work in offices, with the rest mostly evenly split between retail, production/distribution/repair (PDR), and cultural/institutional/educational work. Compared to the city as a whole, this area is more office-oriented, lacks the presence of medical workers found in other sectors, and otherwise has a somewhat similar sector split.
This area has been an important hub for media-based companies for nearly two decades. Well served by transit, the area’s large warehouses and secondary office spaces provided an ideal location for developing indus-tries seeking inexpensive space. Coined “Multimedia Gulch” in the mid-90s, the area continues to attract world-renowned and cutting-edge technology firms such as Twitter and Zynga, as well as the strartups that aim to emulate their success. These firms cite SoMa’s diverse character and the presence of similar firms as a substantial part of its draw.
Economy
S A N F R A N C I S C O P L A N N I N G D E P A R T M E N T��

Future Conditions
The economic profile of the Study Area is certain to change over the next 20 years, likely in unpredictable ways. However, two trends can be identified at this time that can point to a potential economic future in the Study Area. The first is the continued development of SoMa as a hub for technology-oriented firms. There are a number of reasons why such development is foreseeable, including:
The overall growth of this sector of the economy, of which the Bay Area has been a primary center for decades.
Tendency of similar firms to cluster around existing hubs, such as SoMa.
The trend of firms locating where the workers are, coupled by the propensity of the sector’s young, educated workers to live in San Francisco as opposed to more suburban Silicon Valley.
The City’s Economic Strategy supports this sector, particularly to ensure that successful firms have the space to grow from startups to dominant companies in their field. 19
The second trend is the commensurate de-industri-alization of the Study Area. Whereas San Francisco’s production, distribution, and repair sector is not expected to continue its historic decline, comparative land values and land use conflicts will likely drive these uses towards the new PDR Districts established in the Bayview, Central Waterfront, Showplace Square, and Mission neighborhoods. 20
��C E N T R A L C O R R I D O R R E P O R T 2 0 1 1

Next Steps In February 2011 the Planning Department began initial community outreach to introduce the Central Corridor planning effort and initiate dialogue on the planning effort’s key issues:
Land Use: What is the right mix and density of uses (e.g. offices, housing, retail, institutions, entertainment) throughout the corridor? How can we accommodate transit-oriented growth while preserving and enhancing the qualities that make the area the dynamic place that it is today? A key objective of the project is to consider the future of the parcels that currently retain industrial designations (i.e. SLI, M-1), in addition to re-considering, as necessary, the land use controls for other parcels.
Urban Form: Do the current height and bulk rules reflect the kind of place and support the kinds of activities that people envision for the corridor? What buildings types will achieve the right balance between livability, neighborhood character, economic vitality, and density?
Pedestrian Environment: What pedestrian improve-ments are necessary, particularly around the planned Central Subway stations, to make the corridor a safe and attractive place to walk? Where are the “hot spots” for priority improvement? Where are there opportuni-ties to create needed public space? In the context of broader transportation and circulation planning efforts that are ongoing for the South of Market (e.g. ENTRIPS, Transit Effectiveness Project, Bicycle Plan), the Planning Department will work closely with the SFMTA, a partner in this effort, and the community to identify key opportunities for specific pedestrian improvements in the corridor.
Initial public outreach will last through early summer 2011. In this phase the Planning Department hopes to hear from all community members and groups who have a stake in its future about their vision for this area (including workers, residents, businesses, and organiza-tions), and generally to spur conversation about the corridor’s future. Formation and public discussion of the plan’s recommendations will take place through
the summer and fall, with release of a draft plan at the end of the year.
CENTRAL CORRIDOR PROJECT
Project Timeline 2011-2012
FEBJAN1
2011 2012
2 3 4 5 6 7 1 28 9 10 11 12MAR APR MAY JUN JUL SEPAUG OCT NOV DEC JAN FEB
Draft Plan Release
Continued WorkshopsPUBLIC OUTREACH
pending funding
PLAN DEVELOPMENT
EIR INITIATION
Stakeholder sessions
Walking tours
Storefront charrette
Online forums
Land Use
Urban Form
Streetscape
Open House on Draft Plan
pending fundingfunded
pending fundingfunded
S A N F R A N C I S C O P L A N N I N G D E P A R T M E N T��

1 The Bay Area’s framework, referred to as the Sustainable Communities Strategy, is currently under development and expected to be completed in April 2013. See www.onebayarea.org.
2 Phil Goodwin, Joyce Dargay, and Mark Hanly, “Elasticities of Road Traffic and Fuel Consumption with Respect to Price and Income: A Review”, Transport Reviews, Vol. 24, No. 3, May 2004: 275-292.
3 Jed Kolko, “Making the Most of Transit,” Public Policy Institute of California, (February 2011); Research literature summarized in Todd Litman, Land Use Impacts on Transport (Victoria, BC: Victoria Transport Policy Institute, 2011).
4 Judy S. Davis and Samuel Seskin, “Effects of Urban Density on Rail Transit”, Land Lines, Vol. 8, No. 3, May 1996.
5 In fact, San Francisco’s development pipeline has about 70 percent of that number under review or construction right now.
6 Robert Cervero and John Landis, “Suburbanization Of Jobs And The Journey To Work: A Submarket Analysis Of Commuting In The San Francisco Bay Area”, Journal of Advanced Transportation, Volume 26, Issue 3, Winter 1992: 275-297.
7 Jerry Carlino, “The Economic Role of Cities in the 21st Century,” Business Review, Q3 2005: 9-15.
8 At federal level, see the recent HUD/DOT/EPA partnership,; at regional level see AB32 & SB375
9 City of San Francisco, San Francisco Economic Strategy, 2007. http://www.oewd.org/media/docs/SF%20Economic%20Strategy%20Report.pdf
10 Gary Pivo, “The net of mixed beads suburban office development in six metropolitan regions,” Journal of the American Planning Association, Volume 56, Issue 4, December 1990: 457-469.
11 With the exception of areas like India Basin and Executive Park, which do not house a high number of jobs.
12 Robert Cervero and John Landis, “Twenty years of the Bay Area Rapid Transit system: Land use and development impacts,” Transportation Research Part A: Policy and Practice, Volume 31, Issue 4, July 1997: 309-333.
Footnotes 13 Office space more than doubled, growing from 26
million square feet to 55 million square feet between 1965 and 198, according to the “San Francisco Downtown Area Plan.” Another approximately 35 million square feet has been constructed in the C3O since then.
14 For more information on the history of SoMa’s land use and buildings, see Page & Turnbull’s South of Market Historical Context Statement, June 30, 2009 (go to http://somasurvey.sfplanning.org, and click on “Historic Context Statement”)
15 For the complete results of the Survey, see http://somasurvey.sfplanning.org
16 With the implementation of the City’s Transit Effectiveness Project, many of these routes shall change. However, this area will continue to be well-served by local MUNI service.
17 For more information, see the EN TRIPS Future Conditions Report at easternneighborhoods. www.sfplanning.org
18 Employment data from Dun & Bradstreet 2009.
19 City of San Francisco, San Francisco Economic Strategy, 2007. http://www.oewd.org/media/docs/SF%20Economic%20Strategy%20Report.pdf
20 Economic and Planning Systems, “Supply/Demand Study for Production, Distribution, and Repair (PDR) in San Francisco’s Eastern Neighborhoods”, 2005. http://www.sf-planning.org/Modules/ShowDocument.aspx?documentid=1929
��C E N T R A L C O R R I D O R R E P O R T 2 0 1 1

Mayor
Edwin M. Lee
Board of Supervisors
David Chiu, President
Mark Farrell
John Avalos
David Campos
Carmen Chu
Malia Cohen
Jane Kim
Sean Elsbernd
Eric Mar
Scott Wiener
Ross Mirkarimi
Planning Commission
Christina Olague, President
Ron Miguel, Vice-President
Michael Antonini
Gwyneth Borden
Kathrin Moore
Hisashi Sugaya
Rodney Fong
Planning Department
John Rahaim, Planning Director
Sarah Dennis Phillips, Project Supervisor
Joshua Switzky, Project Manager
Steve Wertheim, Project Coordinator
Gary Chen, Graphics
Sandra Soto-Grandona, Graphics Assistance & Outreach
Aksel Olsen, Data Manager
Acknowledgements
S A N F R A N C I S C O P L A N N I N G D E P A R T M E N T��