Embed Size (px)
Citation preview
Undiscovered Resources Largest Undiscovered Field
MFS Prob. Oil (MMBO)
(0-1) F95 F50 F5 Mean F95 F50 F5 Mean F95 F50 F5 Mean F95 F50 F5 Mean
Oil Fields 1 75 446 1,192 516 158 951 2,751 1,134 9 55 171 68 23 95 329 123
Gas Fields 6 133 759 2,011 874 4 26 73 31 50 175 540 217
Total 1.00 75 446 1,192 516 291 1,709 4,763 2,008 13 81 244 99
1.00
Central Burma Basin, Assessment Unit 80480101Assessment Results Summary
[MMBO, million barrels of oil. BCFG, billion cubic feet of gas. MMBNGL, million barrels of natural gas liquids. MFS, minimum field size assessed (MMBO or BCFG). Prob., probability (including both geologic and accessibility probabilities) of at least one field equal to or greater than the MFS. Results shown are fully risked estimates. For gas fields, all liquids are included under the NGL (natural gas liquids) category. F95 represents a 95 percent chance of at least the amount tabulated. Other fractiles are defined similarly. Fractiles are additive under the assumption of perfect
positive correlation. Shading indicates not applicable]
Field Type Gas (BCFG) NGL (MMBNGL) (MMBO or BCFG)

80480101Central Burma BasinMonte Carlo Results
Forecast: Oil in Oil Fields
Summary:Display range is from 0.00 to 1,500.00 MMBOEntire range is from 11.29 to 2,598.80 MMBOAfter 50,000 trials, the standard error of the mean is 1.59
Statistics: ValueTrials 50000Mean 515.63Median 446.33Mode ---Standard Deviation 355.23Variance 126,189.05Skewness 0.90Kurtosis 3.56Coefficient of Variability 0.69Range Minimum 11.29Range Maximum 2,598.80Range Width 2,587.51Mean Standard Error 1.59
Frequency Chart
MMBO
.000
.005
.010
.016
.021
0
260.5
521
781.5
1042
0.00 375.00 750.00 1,125.00 1,500.00
50,000 Trials 560 Outliers
Forecast: Oil in Oil Fields
Page 1

80480101Central Burma BasinMonte Carlo Results
Forecast: Oil in Oil Fields (cont'd)
Percentiles:
Percentile MMBO100% 11.2995% 74.9790% 114.0485% 152.1480% 191.1775% 230.0570% 269.4665% 310.7960% 353.6555% 398.8350% 446.3345% 496.4040% 549.6135% 605.6730% 665.1325% 733.1720% 807.2715% 901.1210% 1,018.595% 1,191.960% 2,598.80
End of Forecast
Page 2

80480101Central Burma BasinMonte Carlo Results
Forecast: Gas in Oil Fields
Summary:Display range is from 0.00 to 3,500.00 BCFGEntire range is from 20.96 to 7,002.40 BCFGAfter 50,000 trials, the standard error of the mean is 3.72
Statistics: ValueTrials 50000Mean 1,134.10Median 950.57Mode ---Standard Deviation 831.21Variance 690,908.32Skewness 1.15Kurtosis 4.55Coefficient of Variability 0.73Range Minimum 20.96Range Maximum 7,002.40Range Width 6,981.45Mean Standard Error 3.72
Frequency Chart
BCFG
.000
.006
.011
.017
.022
0
278
556
834
1112
0.00 875.00 1,750.00 2,625.00 3,500.00
50,000 Trials 692 Outliers
Forecast: Gas in Oil Fields
Page 3

80480101Central Burma BasinMonte Carlo Results
Forecast: Gas in Oil Fields (cont'd)
Percentiles:
Percentile BCFG100% 20.9695% 158.2390% 237.2485% 320.3780% 400.6175% 482.6070% 569.9165% 658.3160% 749.6855% 848.2850% 950.5745% 1,059.3240% 1,172.3535% 1,299.9230% 1,440.1525% 1,598.4720% 1,776.4115% 1,995.9910% 2,276.725% 2,751.230% 7,002.40
End of Forecast
Page 4
80480101Central Burma BasinMonte Carlo Results
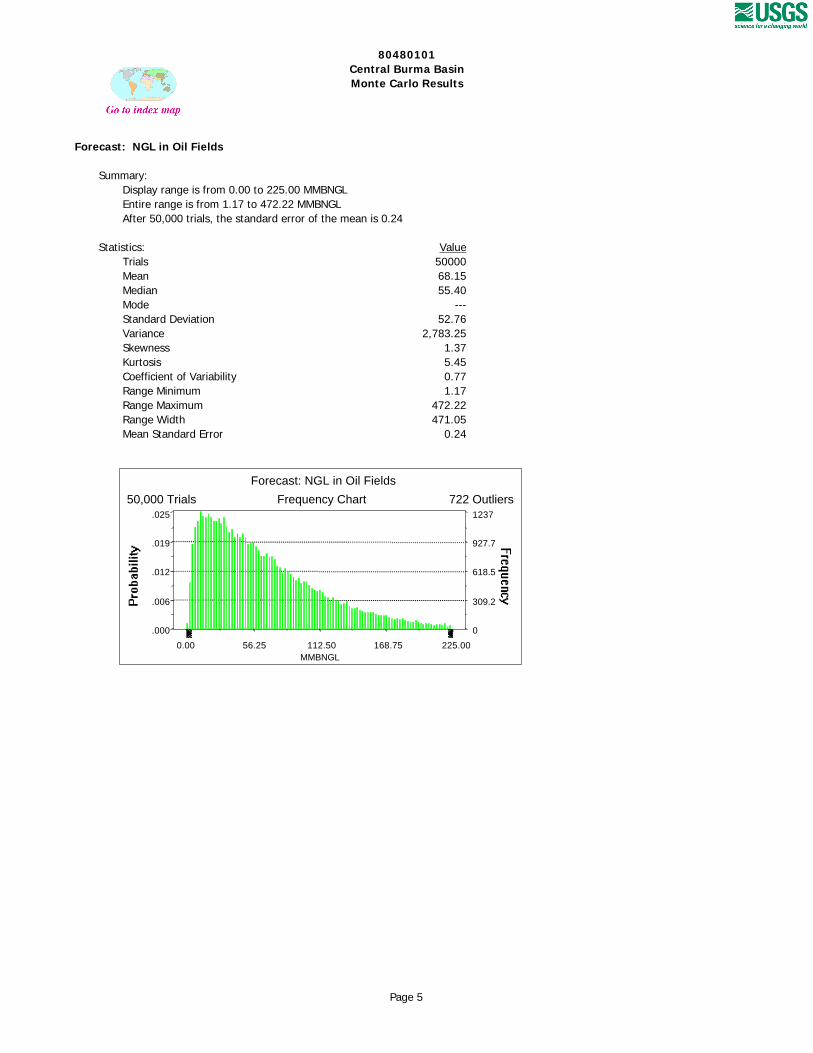
Forecast: NGL in Oil Fields
Summary:Display range is from 0.00 to 225.00 MMBNGLEntire range is from 1.17 to 472.22 MMBNGLAfter 50,000 trials, the standard error of the mean is 0.24
Statistics: ValueTrials 50000Mean 68.15Median 55.40Mode ---Standard Deviation 52.76Variance 2,783.25Skewness 1.37Kurtosis 5.45Coefficient of Variability 0.77Range Minimum 1.17Range Maximum 472.22Range Width 471.05Mean Standard Error 0.24
Frequency Chart
MMBNGL
.000
.006
.012
.019
.025
0
309.2
618.5
927.7
1237
0.00 56.25 112.50 168.75 225.00
50,000 Trials 722 Outliers
Forecast: NGL in Oil Fields
Page 5
80480101Central Burma BasinMonte Carlo Results
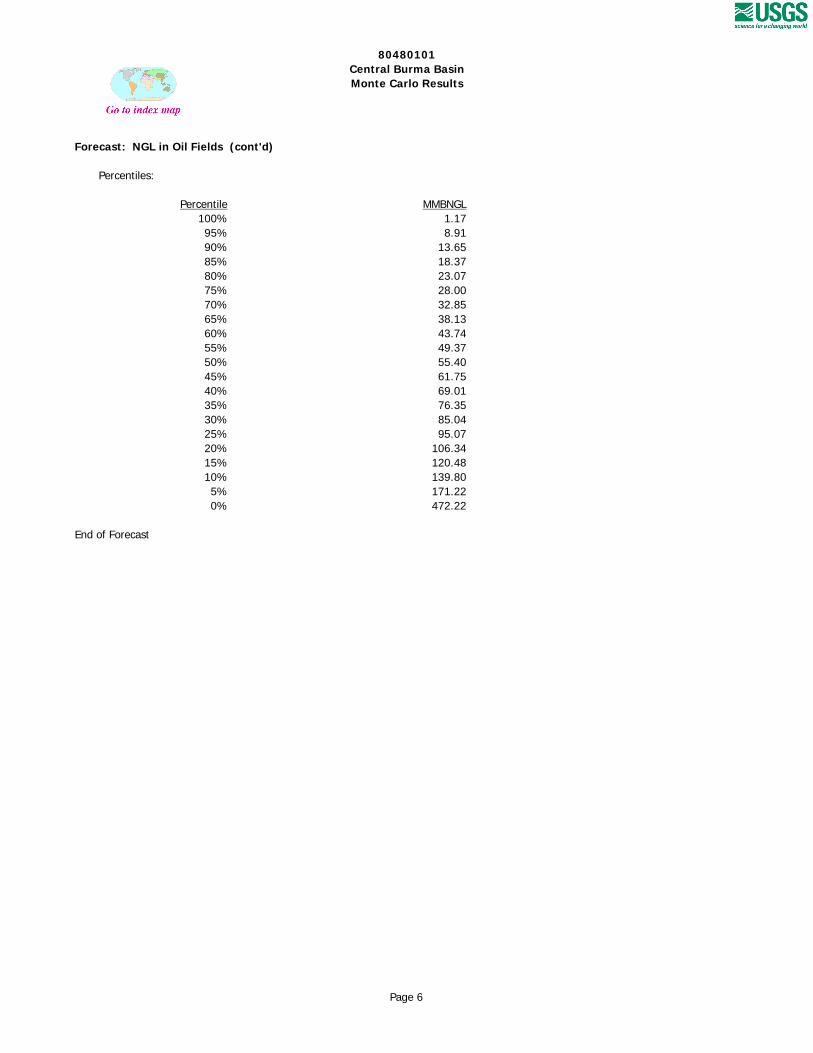
Forecast: NGL in Oil Fields (cont'd)
Percentiles:
Percentile MMBNGL100% 1.1795% 8.9190% 13.6585% 18.3780% 23.0775% 28.0070% 32.8565% 38.1360% 43.7455% 49.3750% 55.4045% 61.7540% 69.0135% 76.3530% 85.0425% 95.0720% 106.3415% 120.4810% 139.805% 171.220% 472.22
End of Forecast
Page 6

80480101Central Burma BasinMonte Carlo Results
Forecast: Largest Oil Field
Summary:Display range is from 0.00 to 400.00 MMBOEntire range is from 2.80 to 499.97 MMBOAfter 50,000 trials, the standard error of the mean is 0.42
Statistics: ValueTrials 50000Mean 123.29Median 95.47Mode ---Standard Deviation 95.02Variance 9,028.46Skewness 1.47Kurtosis 5.06Coefficient of Variability 0.77Range Minimum 2.80Range Maximum 499.97Range Width 497.18Mean Standard Error 0.42
Frequency Chart
MMBO
.000
.007
.014
.021
.028
0
352.7
705.5
1411
0.00 100.00 200.00 300.00 400.00
50,000 Trials 1,106 Outliers
Forecast: Largest Oil Field
Page 7
80480101Central Burma BasinMonte Carlo Results
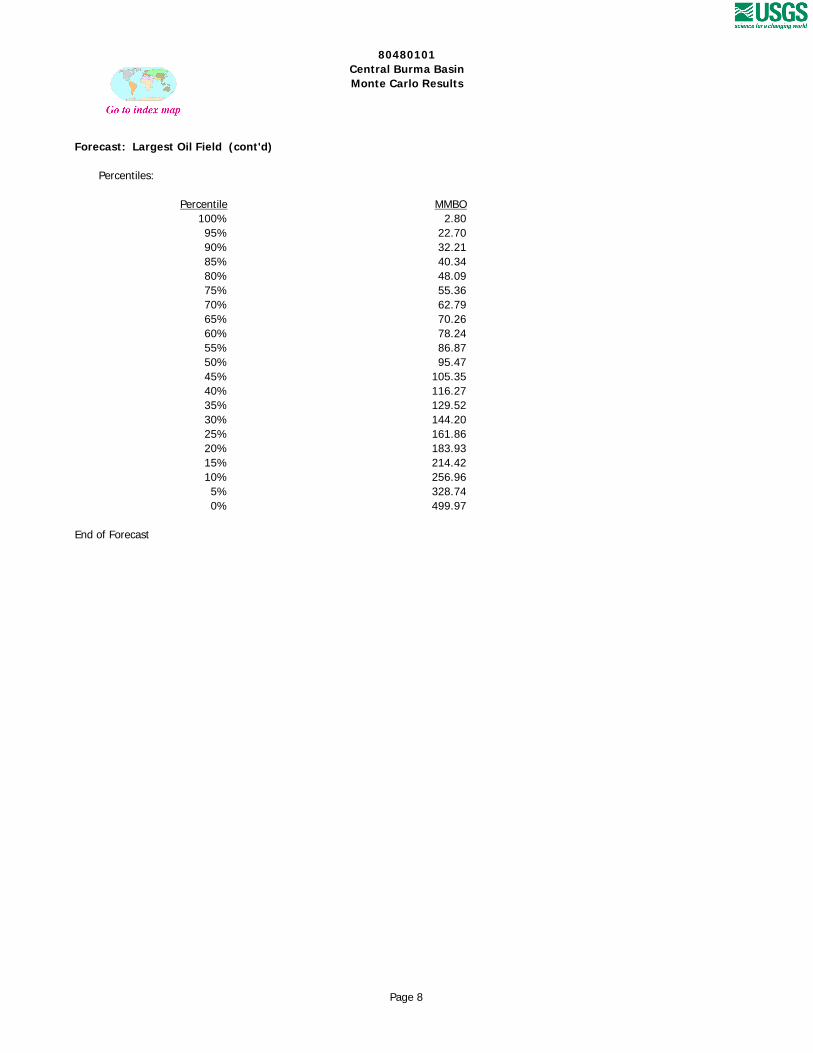
Forecast: Largest Oil Field (cont'd)
Percentiles:
Percentile MMBO100% 2.8095% 22.7090% 32.2185% 40.3480% 48.0975% 55.3670% 62.7965% 70.2660% 78.2455% 86.8750% 95.4745% 105.3540% 116.2735% 129.5230% 144.2025% 161.8620% 183.9315% 214.4210% 256.965% 328.740% 499.97
End of Forecast
Page 8

80480101Central Burma BasinMonte Carlo Results
Forecast: Gas in Gas Fields
Summary:Display range is from 0.00 to 2,500.00 BCFGEntire range is from 15.57 to 4,262.42 BCFGAfter 50,000 trials, the standard error of the mean is 2.66
Statistics: ValueTrials 50000Mean 874.33Median 758.91Mode ---Standard Deviation 595.59Variance 354,729.14Skewness 0.86Kurtosis 3.39Coefficient of Variability 0.68Range Minimum 15.57Range Maximum 4,262.42Range Width 4,246.85Mean Standard Error 2.66
Frequency Chart
BCFG
.000
.005
.010
.016
.021
0
259.2
518.5
777.7
1037
0.00 625.00 1,250.00 1,875.00 2,500.00
50,000 Trials 544 Outliers
Forecast: Gas in Gas Fields
Page 9

80480101Central Burma BasinMonte Carlo Results
Forecast: Gas in Gas Fields (cont'd)
Percentiles:
Percentile BCFG100% 15.5795% 132.6190% 198.4985% 260.5780% 324.6975% 392.0170% 460.3365% 530.5360% 601.8255% 677.8950% 758.9145% 840.8440% 930.9335% 1,027.0930% 1,131.6325% 1,246.0820% 1,375.0615% 1,531.3310% 1,722.055% 2,011.460% 4,262.42
End of Forecast
Page 10
80480101Central Burma BasinMonte Carlo Results
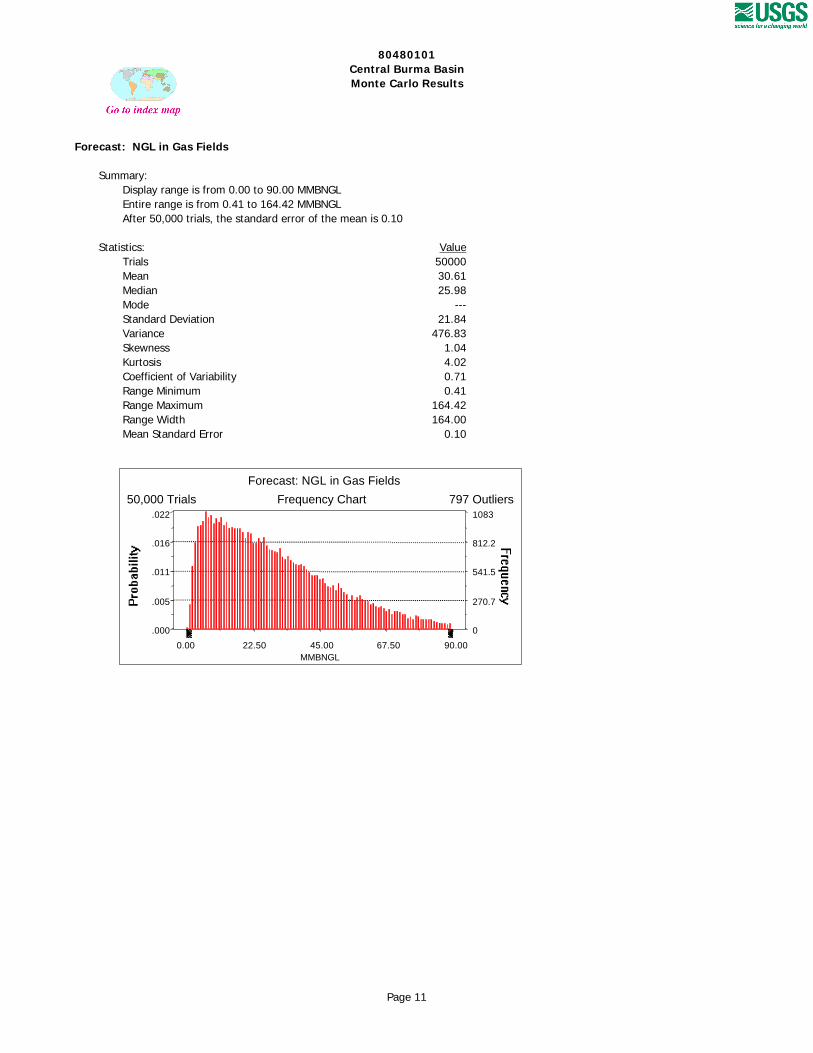
Forecast: NGL in Gas Fields
Summary:Display range is from 0.00 to 90.00 MMBNGLEntire range is from 0.41 to 164.42 MMBNGLAfter 50,000 trials, the standard error of the mean is 0.10
Statistics: ValueTrials 50000Mean 30.61Median 25.98Mode ---Standard Deviation 21.84Variance 476.83Skewness 1.04Kurtosis 4.02Coefficient of Variability 0.71Range Minimum 0.41Range Maximum 164.42Range Width 164.00Mean Standard Error 0.10
Frequency Chart
MMBNGL
.000
.005
.011
.016
.022
0
270.7
541.5
812.2
1083
0.00 22.50 45.00 67.50 90.00
50,000 Trials 797 Outliers
Forecast: NGL in Gas Fields
Page 11
80480101Central Burma BasinMonte Carlo Results
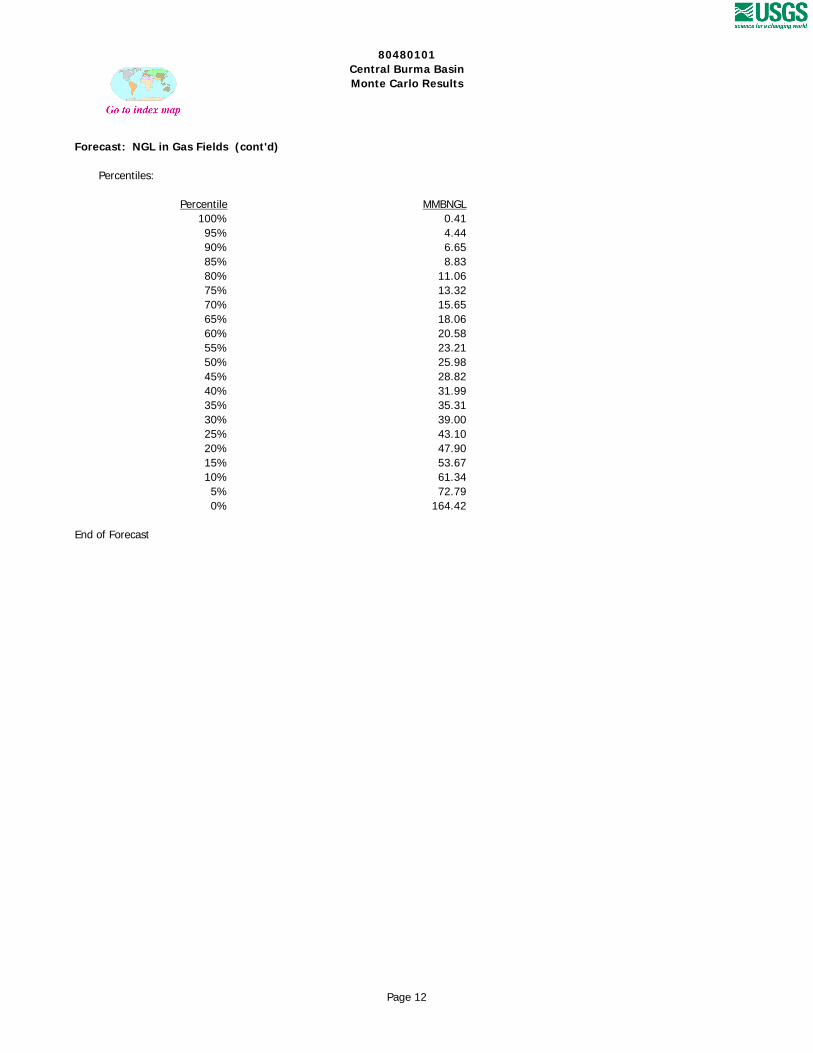
Forecast: NGL in Gas Fields (cont'd)
Percentiles:
Percentile MMBNGL100% 0.4195% 4.4490% 6.6585% 8.8380% 11.0675% 13.3270% 15.6565% 18.0660% 20.5855% 23.2150% 25.9845% 28.8240% 31.9935% 35.3130% 39.0025% 43.1020% 47.9015% 53.6710% 61.345% 72.790% 164.42
End of Forecast
Page 12
80480101Central Burma BasinMonte Carlo Results
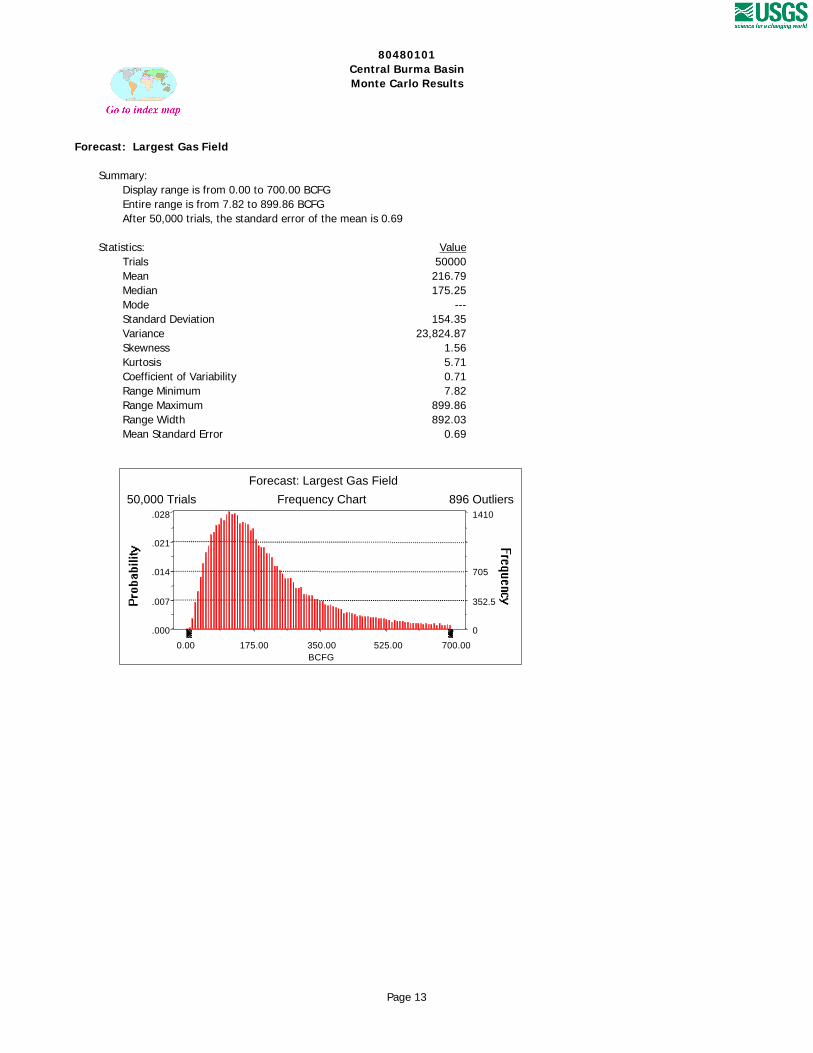
Forecast: Largest Gas Field
Summary:Display range is from 0.00 to 700.00 BCFGEntire range is from 7.82 to 899.86 BCFGAfter 50,000 trials, the standard error of the mean is 0.69
Statistics: ValueTrials 50000Mean 216.79Median 175.25Mode ---Standard Deviation 154.35Variance 23,824.87Skewness 1.56Kurtosis 5.71Coefficient of Variability 0.71Range Minimum 7.82Range Maximum 899.86Range Width 892.03Mean Standard Error 0.69
Frequency Chart
BCFG
.000
.007
.014
.021
.028
0
352.5
705
1410
0.00 175.00 350.00 525.00 700.00
50,000 Trials 896 Outliers
Forecast: Largest Gas Field
Page 13

80480101Central Burma BasinMonte Carlo Results
Forecast: Largest Gas Field (cont'd)
Percentiles:
Percentile BCFG100% 7.8295% 50.1590% 67.5685% 81.9780% 95.9375% 108.7570% 121.2965% 133.9460% 147.3455% 160.9750% 175.2545% 190.7040% 208.5235% 227.6930% 250.7125% 278.2220% 312.2215% 357.5710% 422.845% 540.490% 899.86
End of Forecast
Page 14
80480101Central Burma BasinMonte Carlo Results
Assumptions
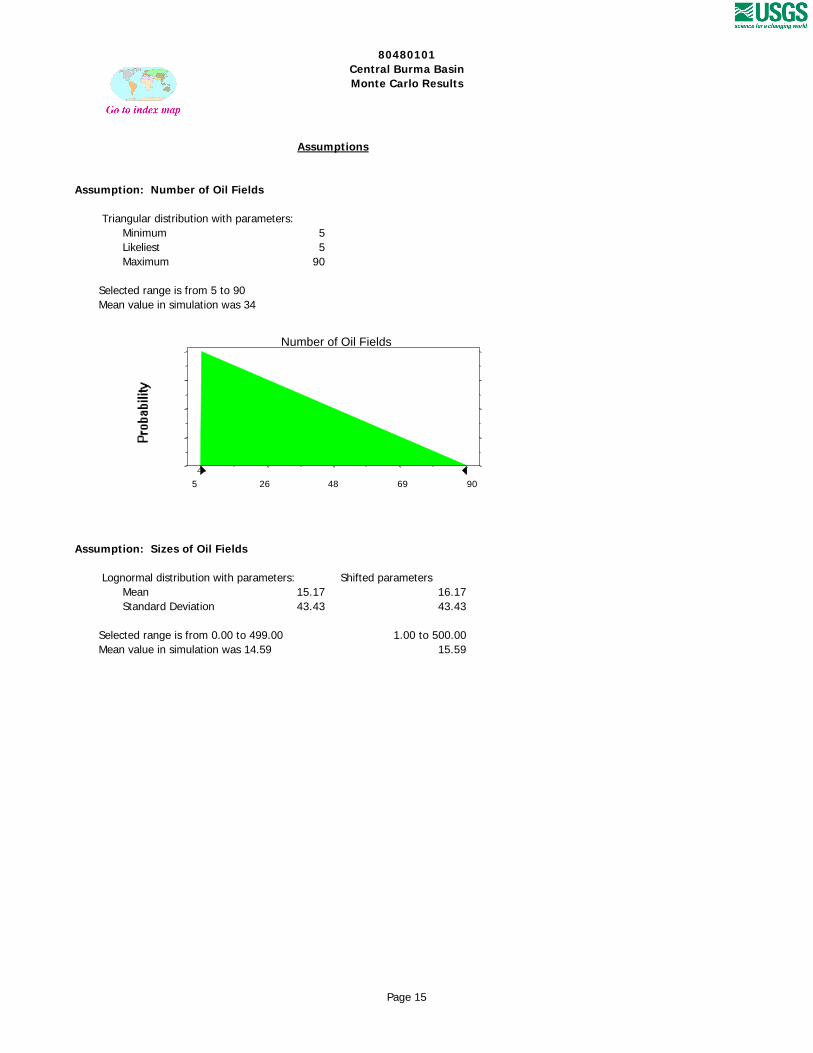
Assumption: Number of Oil Fields
Triangular distribution with parameters:Minimum 5Likeliest 5Maximum 90
Selected range is from 5 to 90Mean value in simulation was 34
Assumption: Sizes of Oil Fields
Lognormal distribution with parameters: Shifted parametersMean 15.17 16.17Standard Deviation 43.43 43.43
Selected range is from 0.00 to 499.00 1.00 to 500.00Mean value in simulation was 14.59 15.59
5 26 48 69 90
Number of Oil Fields
Page 15
80480101Central Burma BasinMonte Carlo Results
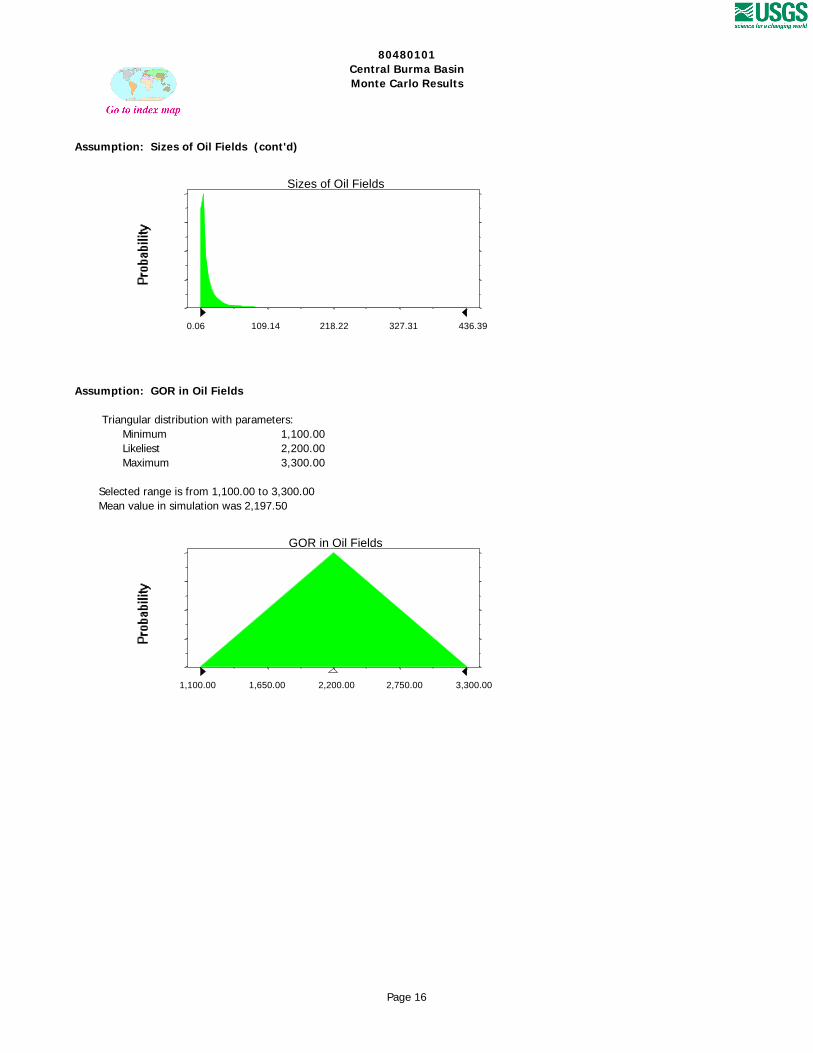
Assumption: Sizes of Oil Fields (cont'd)
Assumption: GOR in Oil Fields
Triangular distribution with parameters:Minimum 1,100.00Likeliest 2,200.00Maximum 3,300.00
Selected range is from 1,100.00 to 3,300.00Mean value in simulation was 2,197.50
0.06 109.14 218.22 327.31 436.39
Sizes of Oil Fields
1,100.00 1,650.00 2,200.00 2,750.00 3,300.00
GOR in Oil Fields
Page 16
80480101Central Burma BasinMonte Carlo Results
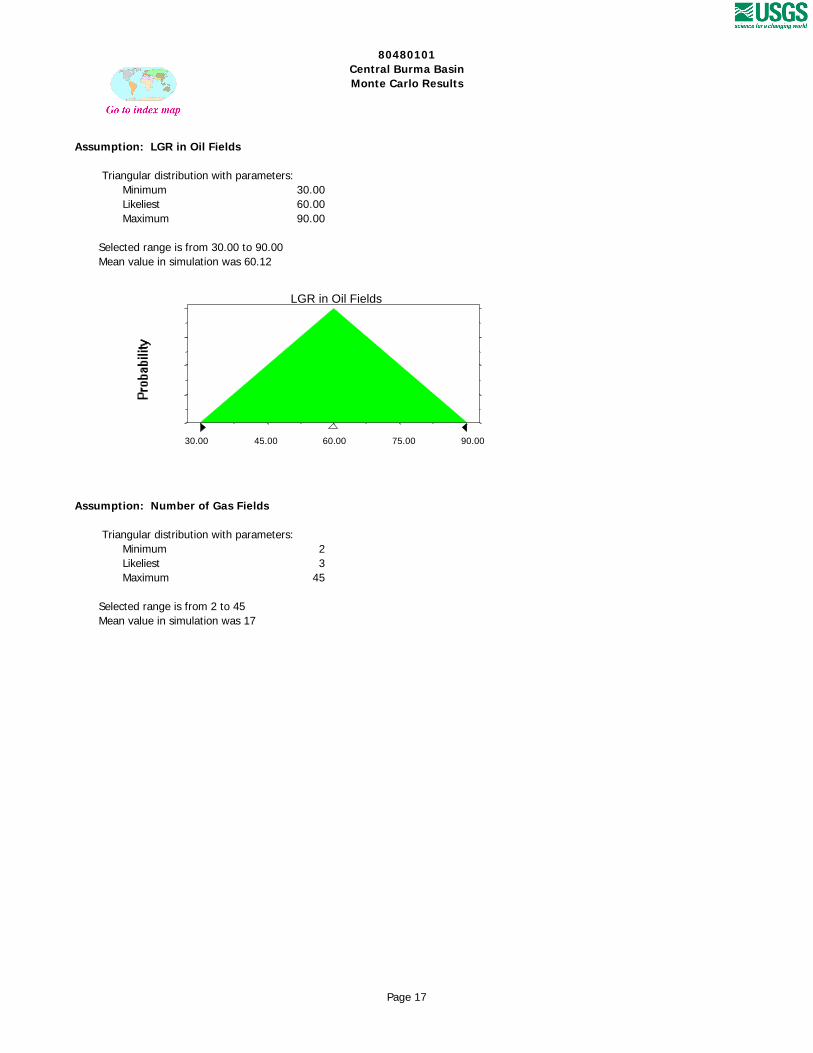
Assumption: LGR in Oil Fields
Triangular distribution with parameters:Minimum 30.00Likeliest 60.00Maximum 90.00
Selected range is from 30.00 to 90.00Mean value in simulation was 60.12
Assumption: Number of Gas Fields
Triangular distribution with parameters:Minimum 2Likeliest 3Maximum 45
Selected range is from 2 to 45Mean value in simulation was 17
30.00 45.00 60.00 75.00 90.00
LGR in Oil Fields
Page 17
80480101Central Burma BasinMonte Carlo Results
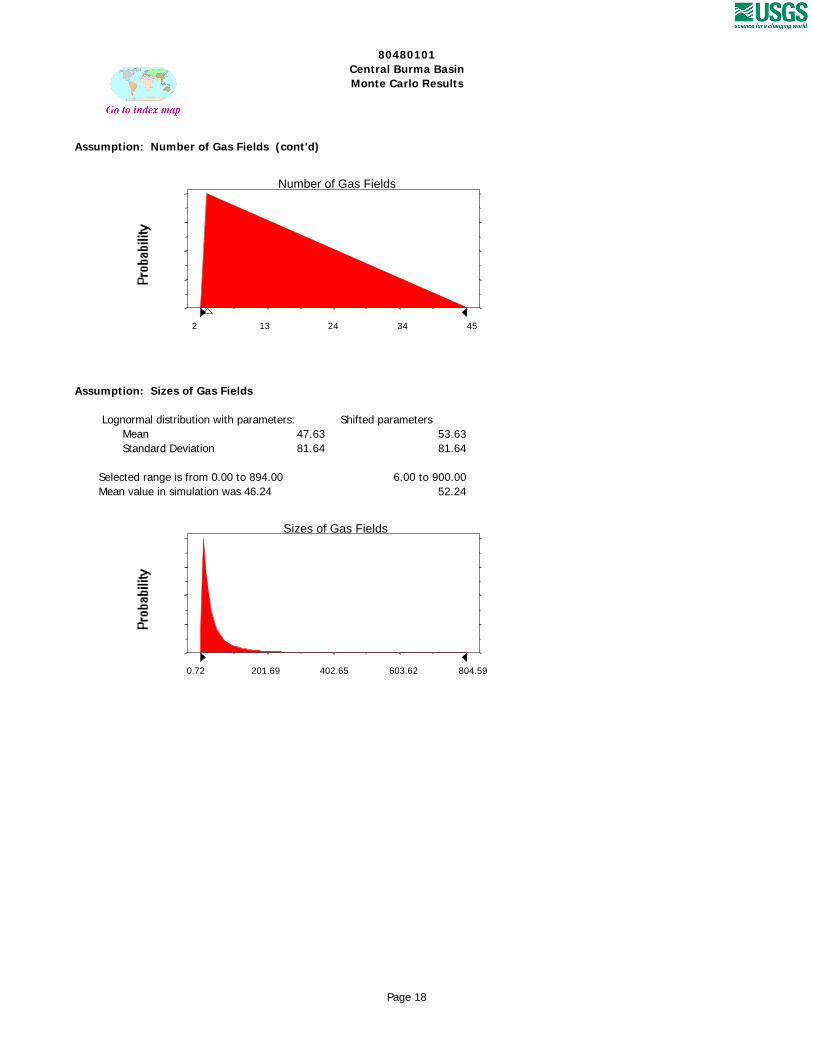
Assumption: Number of Gas Fields (cont'd)
Assumption: Sizes of Gas Fields
Lognormal distribution with parameters: Shifted parametersMean 47.63 53.63Standard Deviation 81.64 81.64
Selected range is from 0.00 to 894.00 6.00 to 900.00Mean value in simulation was 46.24 52.24
2 13 24 34 45
Number of Gas Fields
0.72 201.69 402.65 603.62 804.59
Sizes of Gas Fields
Page 18
80480101Central Burma BasinMonte Carlo Results
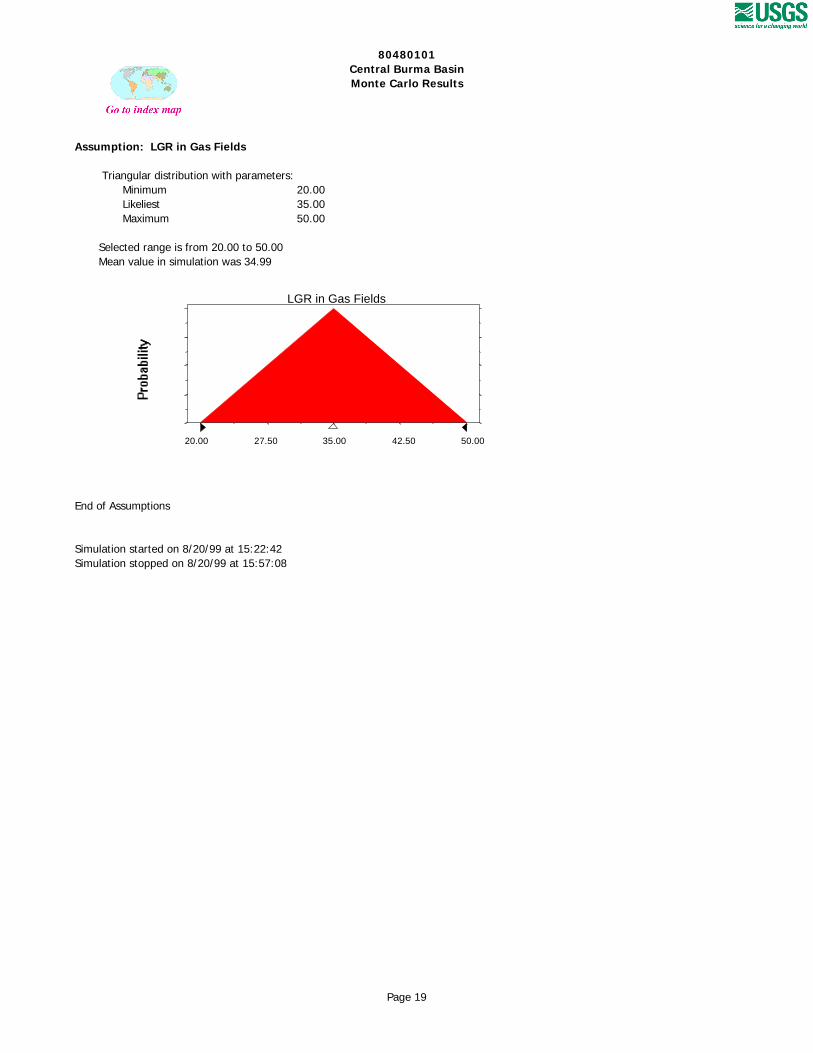
Assumption: LGR in Gas Fields
Triangular distribution with parameters:Minimum 20.00Likeliest 35.00Maximum 50.00
Selected range is from 20.00 to 50.00Mean value in simulation was 34.99
End of Assumptions
Simulation started on 8/20/99 at 15:22:42Simulation stopped on 8/20/99 at 15:57:08
20.00 27.50 35.00 42.50 50.00
LGR in Gas Fields
Page 19


![Los Angeles Basin Groundwater Adjudication Summary · District of Southern California [8][10], and the Central Basin Municipal Water District (CBMWD) website [1]: Central Basin was](https://img.pdfslide.us/doc/110x75/5fc2fd86e9a69d796e219f91/los-angeles-basin-groundwater-adjudication-summary-district-of-southern-california.jpg)