Embed Size (px)
Citation preview

Central Arkansas Water
COMPREHENSIVE ANNUAL FINANCIAL REPORT For the Years Ended
December 31, 2015 and 2014
221 East Capitol Avenue P.O. Box 1789
Little Rock, Arkansas 72203 www.carkw.com
Prepared by the Finance Department

Central Arkansas Water
TABLE OF CONTENTS
Introductory Section
Transmittal Letter ................................................................................................................................... 1
Organizational Chart ............................................................................................................................. 13
Board of Commissioners ....................................................................................................................... 15
Management Team ............................................................................................................................... 17
Certificate of Achievement for Excellence in Financial Reporting ...................................................... 19
Glossary of Acronyms and Abbreviations ............................................................................................ 21
Financial Section
Independent Auditor’s Report .............................................................................................................. 23
Management’s Discussion and Analysis ............................................................................................... 29
Basic Financial Statements
Statements of Net Position .............................................................................................................. 44
Statements of Revenues, Expenses and Changes in Net Position .................................................... 46
Statements of Cash Flows ................................................................................................................ 48
Statements of Fiduciary Net Position ............................................................................................... 48
Statements of Changes in Fiduciary Net Position ............................................................................ 50
Notes to Financial Statements ......................................................................................................... 53
Required Supplementary Information
Schedule of the Utility’s Proportionate Share of the Net Pension Liability ………………………………..…83
Schedule of the Utility’s Contributions to the Arkansas Public Employees Retirement System…....84
Other Postemployment Benefit Plan (OPEB) ‐ Schedule of Funding Progress ................................. 85
Other Postemployment Benefit Plan (OPEB) ‐ Schedule of Employer Contributions ...................... 86

(This page intentionally left blank)

Central Arkansas Water
TABLE OF CONTENTS (Continued)
Statistical Section (Unaudited)
Index ...................................................................................................................................................... 87
Financial Trends
Ten Year Summary of Revenues, Expenses and Rate Increases ....................................................... 90
Ten Year Summary of Net Position ................................................................................................... 92
Ten Year Summary of Write‐Offs ..................................................................................................... 94
Revenue and Debt Capacity
Ten Year Summary of Revenues, Expenses and Debt Service Coverage .......................................... 96
Ten Year Summary of Outstanding Debt to Customer Count .......................................................... 98
Ten Year Summary of Ten Largest Water Customers .................................................................... 100
Demographic and Economic Information
Largest Employers within Pulaski County ....................................................................................... 102
Ten Year Summary of Demographic and Economic Statistics within Pulaski County ................................................................................................................. 103
Operating Information
Ten Year Summary of New Connections ........................................................................................ 106
Ten Year Summary of System Highlights ........................................................................................ 107
Ten Year Summary of Capital Assets .............................................................................................. 108
Ten Year Summary of Filled Positions by Department ................................................................... 110
Schedule of Water Rates ................................................................................................................ 111
Other Required Report
Independent Auditor’s Report on Internal Control over Financial Reporting and on Compliance and Other Matters Based on an Audit of Financial Statements Performed in Accordance with Government Auditing Standards ................................................. 113

(This page intentionally left blank)

Introductory Section

221 EAST CAPITOL AVENUE • POST OFFICE BOX 1789 • LITTLE ROCK, ARKANSAS 72203 • (501) 377-1200
April 14, 2016 To the Board of Commissioners and Our Customers: We are pleased to present the Comprehensive Annual Financial Report (CAFR) of Central Arkansas Water (CAW or the Utility) for the years ended December 31, 2015 and 2014. We believe the report presented is accurate in all material respects; that it is presented in a manner designed to fairly set forth the financial position, the changes in financial position and cash flows of the Utility; and that all disclosures necessary to enable the public to gain the maximum understanding of the Utility’s financial activity have been included. Additionally, the Financial Section of this report includes a detailed discussion and analysis by management of the Utility’s financial performance for the years ended December 31, 2015 and 2014. Responsibility for both the accuracy of the presented data and the completeness and fairness of the presentation, including all disclosures, rests with the Utility. The CAFR follows the guidelines recommended by the Government Finance Officers Association of the United States and Canada (GFOA). THE REPORTING ENTITY In 1936, the City of Little Rock purchased the water facilities serving the south side of the Arkansas River. The City of North Little Rock purchased the water facilities serving its corporate boundaries and rural customers in 1959. Following the acquisitions by the respective cities, the municipalities appointed separate governing boards to oversee operations, planning, and expansion of Little Rock Municipal Water Works and the North Little Rock Water Department. On March 5, 2001, city and water officials signed a Water Utilities Consolidation Agreement. On July 1, 2001, Little Rock Municipal Water Works and the North Little Rock Water Department officially merged operations under the governance of a single entity, Central Arkansas Water. The Utility remains under public ownership. A seven member Board of Commissioners governs the Utility and I, as Chief Executive Officer, oversee day‐to‐day operations and administration. The Utility’s organizational structure includes seven departments: Administration, Distribution, Engineering, Finance, Customer Relations & Public Affairs, Information Services, and Water Quality & Operations. The Utility produces, stores, treats, and distributes water for a population of approximately 400,000 in Central Arkansas. The major components of the system are two raw water supplies, Lake Winona and Lake Maumelle; a regulating and storage facility, Jackson Reservoir; two treatment facilities, Jack H. Wilson Treatment Plant (the Wilson Plant) and Ozark Point Treatment Plant (the Ozark Point Plant); approximately 2,370 miles of public pipeline; 23 booster pumping stations; and 28 remote storage facilities. As of December 31, 2015, the Utility provides water service to approximately 515 square miles and approximately 126,000 active customer accounts.

2
The combined safe yield of the two water sources is approximately 120 million gallons per day (MGD). The maximum treatment capacity of the Wilson Plant is 133 MGD and the treatment capacity of the Ozark Point Plant is 24 MGD. The Utility has a combined 46 million gallons in remote storage capacity serving 19 pressure systems and another 25 million gallons in storage at the treatment plants.
MAJOR INITIATIVES AND ACCOMPLISHMENTS IN 2015 Administration
CAW continued a strong commitment to diversity and inclusion initiatives throughout the organization in 2015. Extensive harassment/discrimination/diversity and inclusion training was conducted by outside experts for all employees in 2015. First, our Diversity and Inclusion Team (DIT ‐ 14 employees), then all supervisors/managers (40 employees), and finally all employees of the utility (281) were trained. Additionally, our DIT rolled out a new initiative to celebrate National Diversity Month in October by interviewing a diverse group of CAW employees and spotlighting one participating employee via intranet/email each day. Finally, CAW once again held the distinction, for the fourth year in a row, of being the largest participating organization in the 2015 Just Communities of Arkansas (JCA) Walk for commUNITY, with 67 CAW walkers participating and the largest amount of money raised for JCA through the walk and CAW fundraisers. The Arkansas Recycling Coalition (ARC) awarded CAW the 2015 Government Recycler of the Year Award for leading by example and epitomizing the front lines of sustainable business practices, which focus on the benefits of reusing, repurposing, and recycling materials while reducing waste in the environment. The Recycling Coalition also recognized CAW’s dedication to sustainable waste management in Arkansas. Additionally, The Association of Metropolitan Water Agencies (AMWA) honored CAW with the Sustainable Water Utility Management Award, one of AMWA’s top utility management awards, for our commitment to management that achieves a balance of innovative and successful efforts in areas of economic, social and environmental endeavors. AMWA commended CAW for its efforts to assure rate stability and establish dedicated funds for watershed protection and CAW’s implementation of a comprehensive watershed management plan that involved close collaboration with private property owners and governmental partners to ensure a high‐quality drinking water supply. CAW was also recognized for our efforts to quantify pipeline replacement needs, increase energy efficiency, implement recycling programs, and remove hazardous materials from sensitive areas. Human Resources continued to focus on ensuring that the Utility’s recruitment programs, policies, procedures, compensation, and employee benefits attract and retain competent, motivated and diverse employees. 2015 saw a significant increase in recruitment activities and was a high volume year for recruitment, with 45 positions filled, including four upper level exempt positions successfully filled following key retirements. Positions were filled, on average, within 8.6 weeks, which is slightly above the Society for Human Resources Management standard of 7 weeks, and which is due to our extensive recruitment process to ensure the exceptional quality of our new hires. Even with increasing retirements as expected due to the baby boomer generation, at 6.8%, CAW’s annual turnover for 2015 was impressively nearly one third of the national average turnover for state and local governments (18.4%). Professional certification, training and employee development continue to be key initiatives for CAW. The number of employees holding designated certifications exceeded the level of job certifications required by 19% in 2015.

3
Adjustments previously made in the calculation methodology for cost of benefits provided for continued tracking against the Bureau of Labor Statistics/Society for Human Resources Management cost of benefits benchmark, which calculates benefits as a percent of total compensation (wages + benefits), rather than wages only. CAW’s 2015 cost of benefits of 28.51% was just below the national average for state and local governments of 28.6%. During 2015, the Environmental Health and Safety (EHS) section emphasized personal safety through monthly safety meetings and other focused initiatives. EHS conducted 77 training sessions that provided over 2,300 hours of safety training for our employees. In addition, the EHS section undertook a significant enhancement of security control systems within the Utility in order to ensure safety and security of all facilities. This work implements a number of recommendations of the Vulnerability Assessment for the Utility that was created in 2014‐2015 and includes creating access control profiles for each job description throughout the Utility. The Utility generated $23,060 in private‐sector revenue and personal monetary donations in 2015 for the Help to Others Customer Assistance Fund (H2O). In addition, the Utility contributed $21,600 to this special program that provides assistance to families, senior citizens and other individuals who are experiencing financial crisis and need assistance in paying utility bills. Help to Others, a substantively self‐sustaining program, has been funded with over $1,094,600 since its inception in November of 2004. Its primary revenue source is advertising fees that local merchants and businesses pay to place coupon advertising in the monthly billing statements of CAW and its utility billing partners. The program is an essential component of our community outreach, as families and senior citizens weather difficult economic climates and other hardships. Distribution
In 2015 the Distribution Department completed over 20,000 work orders on CAW assets ranging from pump stations to storages tanks, including water mains, meters, valves, and hydrants. Staff installed variable frequency drives in numerous pump stations to increase operating efficiencies and extend the useful life of pumps and motors. The department installed a stand‐by generator at Pump Station No. 23, and began work building and replacing all the programmable logic controllers (PLC) filter controls at the Wilson Plant with anticipated completion in early 2016. Distribution continues to be proactive regarding water infrastructure replacement and rehabilitation needs through its aggressive 2‐inch diameter galvanized pipe replacement program. A total of 15,000 linear feet of 2‐inch diameter galvanized pipe was replaced in 2015 using the department’s directional boring machine. Over 600,000 linear feet of 2‐inch diameter galvanized pipe needs to be replaced system wide. Distribution exceeded the Utility’s goal of 5,000 meters by replacing 8,000 water meters through its 16 year meter change out program. This includes 1,586 meters replaced in a combined effort with the Customer Relations and Public Affairs Department. The department strives to maintain outstanding levels of service for our customers. CAW had a total of 548 spontaneous main breaks in 2015, however, only 23 of those breaks caused unplanned outages due to their emergency nature. The Distribution Department continued a valve inspection program which began in 2013. During 2015, distribution staff inspected 15,354 valves bringing the total number inspected to 31,347 out of a total of 33,428 valves in the CAW system that have been inspected and tested. The initial inspection of each valve in the system is expected to conclude by the end of February 2016.

4
In addition to inspecting the valves in our system, Distribution staff inspected and gathered global positioning system (GPS) data for 420 hydrants and 670 valves in the Maumelle Water Management (MWM) system in December in preparation for the pending merger between MWM and CAW. This was just over half the hydrants and valves in the MWM system and the remainder were completed in January 2016. This data on the MWM system will be entered into the CAW geographic information system (GIS) database. Finally, during 2015 a major accomplishment for the City of Little Rock as well as CAW was the upgrade of the city’s international organization for standardization (ISO) fire rating from a class 2 to a class 1. The Little Rock Fire Department is one of only 144 departments nationwide to earn the highest rating. The CAW distribution system is a large contributor to the new rating due to CAW’s inspection program and the dependable and superior hydrant flows provided by the system. Engineering
The Engineering Department, through capital improvement projects and private developer construction, managed and oversaw the replacement of 6.8 miles of public water mains, installation of 5.0 miles of new public water mains, and installation of 3.6 miles of new private water mains in 2015. Also, 7.1 miles of public water mains and 0.2 miles of private water mains were retired in 2015. In 2015, the Engineering Department designed and managed the installation of approximately 6,000 linear feet of galvanized pipe replacement performed by contract and designed the installation of approximately 15,000 linear feet of galvanized pipe replacement performed in‐house by the CAW Distribution Department. Other major projects the Engineering Department managed and inspected to completion in 2015 include:
Supported the feasibility assessment of the proposed merger between CAW and MWM, merger scheduled to occur March 1, 2016;
Completed 44 relocation projects ranging in length from 50 feet to 5,400 feet and pipe size from 2‐inch to 16‐inch for street, road, and drainage improvements initiated by the Arkansas Highway and Transportation Department and the cities of Little Rock, North Little Rock, Sherwood, and Maumelle;
Commenced a preliminary engineering report with a qualified consulting engineer to study an alternate raw water supply from the Arkansas River should the supply from Lake Maumelle become compromised;
Commenced and managed to completion a preliminary engineering report from a qualified consulting engineer that made a detailed study of the Wilson Plant Pump Station No. 1A, making recommendations for extensive improvements to the pumping and electrical equipment and building structure of the pump station;
Designed and commenced the construction phase of a capital project to replace approximately 6,300 feet of 2‐inch galvanized water pipe and 2,500 linear feet of 6‐inch asbestos‐cement water pipe with new PVC and ductile iron pipe in the Dixie Addition area of North Little Rock;
Designed and commenced the construction phase of a capital project to replace approximately 3,700 feet of 12‐inch asbestos‐cement water pipe with new ductile iron pipe along East Roosevelt Road in Little Rock;

5
Designed and commenced the construction phase of a capital project to replace approximately 800 feet of 74 year old 16‐inch steel water pipe with new ductile iron pipe in the Riverdale area of Little Rock;
Designed and commenced the construction phase of a capital project to construct a new booster pumping station for the North Little Rock and Sherwood service area located in the vicinity of the North Little Rock Airport.
Also in 2015, the Engineering Department completed engineering designs for several new projects scheduled for construction in 2016 and beyond, including water main relocations due to new street/highway improvements and replacement of troublesome galvanized and asbestos‐cement water mains.
Finance
For the sixth consecutive year, the Finance Department received both the Distinguished Budget Presentation Award and the Certificate of Achievement for Excellence in Financial Reporting from the GFOA. The GFOA Distinguished Budget Presentation Awards Program recognizes those state and local governments that prepare budget documents of the very highest quality that reflect both the guidelines established by the National Advisory Council on State and Local Budgeting and the GFOA’s best practices on budgeting. The GFOA Certificate of Achievement for Excellence in Financial Reporting Program (CAFR Program) recognizes those state and local governments that go beyond the minimum requirements of generally accepted accounting principles to prepare comprehensive annual financial reports that evidence the spirit of transparency and full disclosure. Purchasing personnel worked with Distribution and Little Rock Wastewater Utility (LRWU) on a joint venture to improve interior and exterior lighting at the Clearwater Facility by participating in Entergy’s Solutions Arkansas Program which offers a number of programs to help lower monthly bills and achieve sustainability objectives. Purchasing worked to ensure the latest and tested fixtures were procured for the project. CAW staff negotiated an additional five (5) year warranty extending the warranty period to ten (10) years. At project completion, CAW received a rebate check from Entergy in the amount of $29,467. Projected annual energy savings amount to 197,970 kWh with an estimated demand reduction of 4.09 kWh and estimated annual bill savings of $19,796. Based on the total estimated annual kWh savings, the greenhouse gas reduction is 139.77 metric tons of carbon dioxide. In addition, Purchasing worked closely with CAW’s chassis vendor to manage the complete process of configuring vehicles by mounting service and dump bodies on new chassis which saved CAW over $7,200 during 2015. Finance automated the collection of capital project data and presented the 2016 Capital Improvement Plan Supplement concurrently with the 2016 Financial Plan. This document is designed to be a highly visual document, to improve capital planning and to provide detail into all capital projects exceeding $250,000 for the five year period of 2016 – 2020.

6
Finance assisted in the issuance of $7.5 million in refunding water revenue bonds at a true interest cost of 2.40%. The proceeds were used to refund the remaining principal balance of the 2010B issue that carried a 3.52% interest rate. The reduction in debt service payments over a fifteen year period totals approximately $710,000. Customer Relations and Public Affairs (CRPA)
The Customer Relations and Public Affairs (CRPA) Department was formed in late 2013 and encompasses the Communications Section, the Customer Service Section, and the Public Policy Section of the Utility. The formation of this department allows CAW to take a more holistic approach to managing relationships with both external and internal audiences and ensure that all interactions with the Utility provide an exceptional experience that exceeds expectations. In 2015, the Communications Section continued customer communication through billing‐based content, website, and social media while also expanding to a more robust email‐based communication effort along with our paperless billing enhancements. In addition, the section modified its social media management strategy, bringing a majority of the outreach efforts in‐house but also partnering with local bloggers to provide content‐rich materials for distribution through social media and online venues. Throughout 2015, the Communications Section issued over 35 press releases and received approximately 110 media reports regarding the Utility and its activities. The Utility also repeated its Customer Satisfaction Survey, first completed in 2012, and included questions regarding media consumption outlets for target populations. The survey provides insight into customer satisfaction but will also help to ensure marketing efforts are most effectively reaching the desired audience. Also in mid‐2015, the Communications section assumed responsibility for coordinating and facilitating the sustainability efforts of the Utility. The dormant Sustainability Team was reactivated and added seven new members. A vision for the team was finalized and specific short and long‐term goals and initiatives were identified and initiated. CAW also modified its H2O hardship assistance program’s funding structure, identifying alternative revenue sources that will provide approximately twice the annual funding for customer hardship assistance while also reducing the overhead costs and extensive time investment of the prior coupon approach. In addition, CAW secured commitments from LRWU for a minimum annual contribution of $40,000 to the H2O program, further increasing the program’s potential impact. The Utility continues to have strong stakeholder involvement and heightened consumer interest in public‐policy initiatives and the development of strategies to address various issues and challenges the Utility is facing. In addition to embracing stakeholder input on various projects related to watershed protection, water conservation, and resources utilization, the Utility took a proactive approach to media‐relations for a number of key activities in 2015 including: education programs, tours, special events of CAW and other organizations, television appearances, and public service involvement. Through these efforts, the Utility educated over 500,000 individuals throughout the Central Arkansas region regarding leak detection, wise water use for irrigation systems, freeze precaution efforts, and other core initiatives. The Utility continued to market and promote enrollment in paperless billing and use of improved online account management features. At the end of 2015, approximately 6.9% of the Utility’s customers are enrolled in paperless billing. Following a robust quality assurance process that reviewed a printing of every customer bill, the Utility modified the presentation of the billing statement in September of 2015 in order to more clearly convey critical billing information while modernizing the look and feel of the statement.

7
The Customer Service Section, in partnership with Information Services, also transitioned to an electronic workorder management system in mid‐2015. The transition from a paper‐based system to an electronic, tablet‐based system will enhance utility operations through improved tracking of workorder aging, improved customer service response times, additional information available for customer service staff, and reduced paper usage throughout the utility. The Customer Service Section also continued to install and evaluate Advanced Meter Reading (AMR) technology, replacing 141 failing and outdated touch read meters with advanced AMR meters and replacing one meter route with AMR meters, reducing meter reading costs significantly for the 170 meters affected. The Utility also piloted the use of cellular metering technology on 10 selected accounts with extreme accessibility issues to determine if the use of this technology may be a viable alternative in certain situations. Information Services
Information Services continues to work with the EnQuesta 4 billing system and take advantage of its new features. Some of the new customer features offered include paperless billing; application program interfaces, auto pay, and document designer. Currently, 8,882 customers have signed up for paperless billing, 7,346 for auto pay, and 36,434 have initiated online customer accounts. The numbers have almost doubled in a year. Information Services also worked with the EnQuesta vendor, Systems & Software, to redesign the billing statement. This was a two and a half year project consisting of several redesigns, and four months verifying over 125,000 bills. In a collaborative effort with the Customer Service and Billing sections, the staff implemented a paperless work order process for the Customer Service Field Group. The new system, which runs on iPad tablets over a cellular internet connection, integrates EnQuesta with our existing Computerized Maintenance Management System, Cityworks, and our existing enterprise GIS, ArcGIS. By adding the application programming interfaces to these systems we were able to bridge communication between all three back‐end databases in real‐time. This has resulted in several operational efficiencies such as more timely communication between field and office staff, digital record archiving with search and retrieval capabilities, digital audit trails of work history, as well as decreased man‐hours printing, shuffling and filing paper based work orders. The new integration of EnQuesta with GIS and Cityworks also allows a map/geographic approach for each Field Technicians daily work activities. CAW uses a Wide Area Network (WAN) to support and communicate with satellite locations. During 2015, a large portion of the phone system was upgraded to Cisco’s latest software/hardware release. The phone system at Lake Maumelle was also upgraded to the same Cisco system. This replaced an antiquated phone system that only retired Southwestern Bell employees could work on. The new system gives CAW staff the ability to add and make changes to this system. Water Quality and Operations
Source and Treatment Operations The Utility ensured the highest quality of water by conducting 114,000 water quality analyses, continually monitoring treatment and distribution resulting in maintaining full compliance with the federal Safe Drinking Water Act (SDWA) and the State of Arkansas’ Rules and Regulations Pertaining to Public Water Systems. CAW’s laboratory remains one of the few utility laboratories in the State certified for coliform analyses under the Total Coliform Rule of the SDWA. CAW provided 21.1 billion gallons of treated high quality water for our customers in 2015.

8
In anticipation of joining the “Partnership for Safe Drinking Water”, CAW requested a Comprehensive Performance Evaluation (CPE) be conducted by Arkansas Department of Health (ADH) staff in an effort to provide direction for CAW in its endeavors to meet criteria for the Partnership which will result in higher quality water. In 2015, CAW joined the Partnership for Safe Drinking Water and began assessment of its water treatment operations with the goal of optimizing its operation. As part of the optimization process, the department began a strategic planning effort in partnership with Raftelis Financial Consultants, Inc. which will assist in creating a path towards continual improvement. Additionally, the Utility modified the filter control system at the Ozark Point Plant to provide more flexibility, robustness, and resilience at this part of the treatment process. Watershed Management The Watershed Management Program is the Utility’s source water protection program for its two water supply reservoirs, Lake Maumelle and Lake Winona. Responsibilities include: implementation of the Lake Maumelle Watershed Management Plan; water quality monitoring for both lakes and select tributaries; overseeing conservation land purchases; managing and monitoring forested lands; working with county and state government for implementation of regulatory programs; and inspection of activities that may pose a water quality risk in the respective watersheds. The Utility continued its efforts on various projects involving water quality protection, water, land conservation, and resource utilization. In 2015, a second payment was received from Arkansas Game and Fish Commission (AGFC) for the Lake Maumelle Wildlife Management Area (WMA). The WMA is a joint effort between CAW and AGFC. As part of this partnership, AGFC paved the parking lot at Sleepy Hollow in June and proposed considerations for regulation changes for the 2016 hunting guidebooks. In 2015, the program worked with Kleinschmidt Associates to develop a plan for Recreation Management on CAW‐owned properties in the two watersheds. Two workshops were held in August; one conducted for agency personnel, and another for watershed residents and recreation public, to identify and address recreation‐related needs, wants, and concerns. Kleinschmidt collated the information gathered and produced a draft recommendation and framework in late 2015. The final report will be delivered in early 2016. Watershed staff continued to evaluate multiple properties for possible purchase in 2015. The Conservation Lands scoring matrix was refined and lead to the purchase of 150.8 acres in 2015, including 40 acres in Perry County. A conservation easement, negotiated in 2014, to protect water quality on 295 acres of critical riparian habitat in the watershed was also finalized in 2015. Preparation studies to remove a concrete low‐water crossing near the Highway 10 entrance to the former Winrock Grass Farm property were conducted with various partners. Staff and partners conducted assessments of fish and mussel communities and habitat classifications in the vicinity of the crossing to be removed. Land and stream surveys were also conducted for model development and impact potential. Staff is waiting on approval of the models from FEMA before the removal can take place.

9
A Forest Legacy grant application for the purchase of 138 acres in the Reece Creek drainage area was submitted to the U.S. Forest Service for the 2017 funding cycle. This is the first segment in a four‐phase request and additional acreage will be added if funding becomes available. The national ranking list of Forest Legacy projects will be released in early 2016. One prescribed burn was conducted in April 2015. On April 8, 193 acres were burned near Bufflehead Bay on the south shore of the lake. The use of prescribed burns is also a management method identified in the Silvicultural Management Plan. Prescribed fire reduces risk of catastrophic wildfire and improves water quality by reducing the amount of decaying woody debris and increasing the herbaceous understory. On April 27, 2014 an EF4 tornado passed over Lake Maumelle damaging 122 acres of standing hardwood, pine saw timber and pulpwood on the south side of the lake, and 137 acres of standing pine, hardwood saw timber and pulpwood on the north side of the lake. A quick response was necessary in order to prevent insect infestation and to maintain value of the downed and damaged timber. The damaged area on the north side of Lake Maumelle was re‐planted in early 2015 with a mix of native hardwood and shortleaf pine seedlings. Pine regeneration will occur naturally on the site as well. Natural regeneration will occur on the south side of the lake. Work continued under the Memorandum of Agreement with the University of Arkansas and Louisiana State University to research and determine the optimal procedures for the Utility’s forest restoration strategy at the former Winrock Grass Farm. Various combinations of herbicides were applied to test plots to determine the best method of eradicating zoysia grass to reduce competition for future tree seedlings. Work on this project began in late 2012 and concluded in 2015. The study suggested a two‐part herbicide application of sulfometuron in the summer and OUST following planting. Planting preparations continued in 2015, and planting will take place in early 2016. A study conducted through an agreement with Arkansas Tech University, evaluated baseline biological monitoring of tributaries at various locations throughout the Lake Maumelle Watershed. The purpose of this research is to provide the utility with comprehensive baseline data used for determining the current “health” of the watershed. The Utility partnered with Audubon to provide programs in area schools, conduct “bird walks” in the watershed and hold four rain barrel workshops. Additionally, staff continued to develop and provide education and outreach through: Science, Technology, Engineering and Math (STEM) nights at the Museum of Discovery; hosting informational booths at various conferences and events; presenting program information at national and local forums; providing watershed residents with educational information regarding management events through mail notifications; and developing new brochures and website content. In October the Utility held its 7th Annual Lake Sweep around Lake Maumelle. This year’s cleanup included options for community residents to dispose of tires, electronic waste, and recyclables. In total, the cleanup collected approximately 50 bags of trash, 15 bags of recycling, and 46 tires, which were kept from entering the waterways. Additionally, crews were able to conduct maintenance on the trails at Bufflehead Bay and Loon Point as well as remove silt fencing from the new construction at the Sleepy Hollow Boat Launch.
10
Water Quality The Water Quality program investigates water quality changes and trends in the watersheds, source waters, water treatment, and delivery systems through sample collection and analysis. Targeted studies initiated at these systems are conducted in order to better understand and assess water quality and implications for management and treatment. The Water Quality & Operations Department negotiated an agreement with the U.S. Geological Survey (USGS) for the long‐term, ongoing water quality and flow monitoring of Lake Maumelle and its tributaries. As a part of the program, staff contributed $13,500 of in‐kind services for work associated with the 2015 monitoring plan, reducing costs associated with relying solely on USGS personnel. Water Quality staff monitors both the CAW and Wye Mountain systems for bacteria, trihalomethanes and other water quality parameters. Water Quality staff continue to consolidate and streamline the data review process and informational databases. An improved integrated data management system will allow historical, current, and future data to be presented in a more efficient manner. Analytical Laboratory The Analytical Laboratory serves a support role to the Watershed Management, Water Quality, and Source and Treatment Operations sections. Through the analyses of a variety of environmental and operational samples for chemical and physical parameters, the laboratory provides sound data that serves as the basis for determination of drinking water quality compliance, watershed and source water health, treatability, and long term monitoring initiatives. The laboratory operates seven days a week. On average, over 300 daily analyses are conducted (9500 /month) for an estimate of 114,000 analyses in 2015. The process of evaluating and replacing analytical laboratory equipment to update current capabilities has continued with the purchase of a total organic carbon analyzer. This equipment will allow the Utility to continue to optimize its operations for disinfection by‐products reduction. In addition, the equipment allows staff to more efficiently and reliably assess water quality in the watersheds, lakes, treatment plants, and distribution systems. RELEVANT FINANCIAL POLICIES Based on capital financing, debt management, and fiscal responsibility guidelines, periodic reviews of all outstanding debt are performed to identify refunding opportunities. Refunding is considered (within federal tax law constraints) if and when there is a net economic benefit from the refunding or the refunding is needed in order to modernize covenants essential to operations, or to restructure the payment of existing debt. As a general rule, the present value savings of a particular refunding should exceed 3%. Bond market conditions in 2015 allowed the Utility to refund the Series 2010B Bonds. The reduction in debt service payments over a fifteen year period totals approximately $710,000.

11
OTHER INFORMATION
Independent Audit An independent audit by certified public accountants is important in determining the reliability of the Utility’s financial statements. The importance of such verification has been recognized by the federal and state government, the Utility’s bond holders, and the general public. The Utility contracted with the accounting firm of Thomas & Thomas LLP for this audit. The audit was conducted in accordance with auditing standards generally accepted in the United States of America and the standards applicable to financial audits contained in Government Auditing Standards, issued by the Comptroller General of the United States. The auditor’s report has been included in the Financial Section of this report. Award The GFOA awarded a Certificate of Achievement for Excellence in Financial Reporting to CAW for its CAFR for the year ended December 31, 2014. This is a prestigious national award recognizing conformance with the highest standards for preparation of state and local governmental financial reports. A Certificate of Achievement was awarded because CAW published an easily readable and efficiently organized CAFR. This report must satisfy both generally accepted accounting principles and applicable program requirements. A Certificate of Achievement is valid for a period of 1 year only. We believe that our current CAFR continues to meet the Certificate of Achievement program’s requirements and we are submitting it to the GFOA to determine its eligibility for another certificate.
Acknowledgements The preparation of this report has been accomplished due to the dedicated and professional efforts of the Finance Department, with staff cooperation from the Utility’s other departments. We thank the Board of Commissioners for continued support in planning and conducting the Utility’s financial affairs in a responsible and progressive manner.
Respectfully submitted,
Tad Bohannon Chief Executive Officer CTB/jbm

12
(This page intentionally left blank)

13

14
(This page intentionally left blank)

Central Arkansas Water
BOARD OF COMMISSIONERS
15
Jay Hartman Commissioner
Carmen Smith Commissioner
Marie‐Bernarde Miller Commissioner
Eddie Powell Commissioner
John Braune Commissioner
Roby Robertson, Ph.D. Chair
Anthony Kendall Vice Chair

16
(This page intentionally left blank)

Central Arkansas Water
MANAGEMENT TEAM
17
Graham W. Rich, P.E., BCEE Chief Executive Officer Thad Luther, P.E., BCEE Chief Operating Officer C. Tad Bohannon Chief Legal Counsel
Robert Hart, P.E., BCEE Technical Services Officer Becky Wahlgreen Chief Administrative Officer Jeff Mascagni, CPA, CGFM Chief Financial Officer John Tynan Director of Customer Relations and Public Affairs Terry Bice Director of Distribution Jim Ferguson, P.E. Director of Engineering Kevin Hall Director of Environmental Health and Safety Allen Vincent Director of Information Services Randy Easley Director of Water Quality and Operations

18
(This page intentionally left blank)

19
Central Arkansas Water
CERTIFICATE OF ACHIEVEMENT

20
(This page intentionally left blank)

21
Central Arkansas Water
GLOSSARY OF ACRONYMS AND ABBREVIATIONS ADH Arkansas Department of Health
AGFC Arkansas Game and Fish Commission
AMWA Association of Metropolitan Water Agencies
AMR Advanced Meter Reading
ARC Arkansas Recycling Coalition
CAFR Comprehensive Annual Financial Report
CAW Central Arkansas Water
CRPA Customer Relations and Public Affairs
DIT Diversity and Inclusion Team
EF Enhanced Fujita Scale
EHS Environmental Health and Safety
GFOA Government Finance Officers Association of the United States and Canada
GIS Geographic Information System
GPS Global Positioning System
H2O Help to Others Customer Assistance Fund
ISO International Organization for Standardization
JCA Just Communities of Arkansas
kWh Kilowatt Hour
LLP Limited Liability Partnership
LRWU Little Rock Wastewater Utility
MGD Million Gallons per Day
MWM Maumelle Water Management
OPEB Other Postemployment Benefits
PLC Programmable Logic Controllers
USGS U.S. Geological Survey
SDWA Safe Drinking Water Act
STEM Science, Technology, Engineering, and Mathematics
WAN Wide Area Network
WMA Wildlife Management Area

22
(This page intentionally left blank)

Financial Section

Thomas & Thomas LLP
Certified Public Accountants
23
www.thomasthomasllp.com Little Rock Office 201 E. Markham, Suite 500, Little Rock, Arkansas 72201 Telephone (501) 375-2025 FAX (501) 375-8704
Texarkana Office 2900 St. Michael Drive, Suite 302, Texarkana, Texas 75503 Telephone (903) 831-3477 FAX (903) 831-3482
Members American Institute Certified Public Accountants Center for Public Company Audit Firms and PCPS
INDEPENDENT AUDITOR’S REPORT
Board of Commissioners Central Arkansas Water Little Rock, Arkansas
Report on the Financial Statements
We have audited the accompanying financial statements of Central Arkansas Water (the Utility) and its fiduciary funds as of and for the years ended December 31, 2015 and 2014, and the related notes to the financial statements, which collectively comprise the Utility’s basic financial statements as listed in the table of contents. Management’s Responsibility for the Financial Statements
Management is responsible for the preparation and fair presentation of these financial statements in accordance with accounting principles generally accepted in the United States of America; this includes the design, implementation and maintenance of internal control relevant to the preparation and fair presentation of financial statements that are free from material misstatement, whether due to fraud or error. Auditor’s Responsibility
Our responsibility is to express opinions on these financial statements based on our audits. We conducted our audits in accordance with auditing standards generally accepted in the United States of America and the standards applicable to financial audits contained in Government Auditing Standards, issued by the Comptroller General of the United States. Those standards require that we plan and perform the audits to obtain reasonable assurance about whether the financial statements are free from material misstatement. An audit involves performing procedures to obtain audit evidence about the amounts and disclosures in the financial statements. The procedures selected depend on the auditor’s judgment, including the assessment of the risks of material misstatement of the financial statements, whether due to fraud or error. In making those risk assessments, the auditor considers internal control relevant to the entity’s preparation and fair presentation of the financial statements in order to design audit procedures that are appropriate in the circumstances, but not for the purpose of expressing an opinion on the effectiveness of the entity’s internal control. Accordingly, we express no such opinion. An audit also includes evaluating the appropriateness of accounting policies used and the reasonableness of significant accounting estimates made by management, as well as evaluating the overall presentation of the financial statements. We believe that the audit evidence we have obtained is sufficient and appropriate to provide a basis for our audit opinions.

24
Board of Commissioners Central Arkansas Water Page Two Opinions
In our opinion, the financial statements referred to on the preceding page present fairly, in all material respects, the respective financial position of the Utility and its fiduciary funds as of December 31, 2015 and 2014, and the respective changes in financial position and, where applicable, cash flows thereof for the years then ended in accordance with accounting principles generally accepted in the United States of America. Emphasis of Matter
As discussed in Note 10 to the financial statements, in 2015 the Utility adopted the accounting requirements of Governmental Accounting Standards Board Statement No. 68, Accounting and Financial Reporting for Pensions, which resulted in a restatement of the Utility’s net position as of January 1, 2015. Our opinions are not modified with respect to this matter. Other Matters
Required Supplementary Information
Accounting principles generally accepted in the United States of America require that management’s discussion and analysis on pages 29 through 42 be presented to supplement the basic financial statements. Also required is a schedule of the Utility’s proportionate share of the net pension liability, a schedule of the Utility's contributions to the pension plan, a schedule of funding progress related to the other postemployment benefits (OPEB) trust, a fiduciary fund of the Utility, and a schedule of employer contributions related to the OPEB trust, which are included on pages 83 through 86, respectively. Such information, although not a part of the basic financial statements, is required by the Governmental Accounting Standards Board, as it is considered to be an essential part of financial reporting for placing the basic financial statements in an appropriate operational, economic or historical context. We have applied certain limited procedures to the required supplementary information in accordance with auditing standards generally accepted in the United States of America, which consisted of inquiries of management about the methods of preparing the information and comparing the information for consistency with management’s responses to our inquiries, the basic financial statements, and other knowledge we obtained during our audit of the basic financial statements. We do not express an opinion or provide any assurance on the information because the limited procedures do not provide us with sufficient evidence to express an opinion or provide any assurance. Other Information
Our audits were conducted for the purpose of forming opinions on the financial statements that collectively comprise the Utility’s basic financial statements. The introductory section on pages 1 through 21 and statistical section on pages 87 through 111 are presented for purposes of additional analysis and are not a required part of the basic financial statements. The introductory section and the statistical section have not been subjected to the auditing procedures applied in the audit of the basic financial statements, and accordingly, we do not express an opinion or provide any assurance on them.

25
Board of Commissioners Central Arkansas Water Page Three Other Information (Continued)
Other Reporting Required by Government Auditing Standards
In accordance with Government Auditing Standards, we have also issued our report dated April 14, 2016 on our consideration of the Utility’s internal control over financial reporting and on our tests of its compliance with certain provisions of laws, regulations, contracts, and grant agreements and other matters. The purpose of that report is to describe the scope of our testing of internal control over financial reporting and compliance and the results of that testing, and not to provide an opinion on internal control over financial reporting or on compliance. That report is an integral part of an audit performed in accordance with Government Auditing Standards in considering the Utility’s internal control over financial reporting and compliance.
Certified Public Accountants April 14, 2016 Little Rock, Arkansas

26
(This page intentionally left blank)

27
Management’s Discussion and Analysis

28
(This page intentionally left blank)

Central Arkansas Water
MANAGEMENT’S DISCUSSION AND ANALYSIS December 31, 2015 and December 31, 2014
29
This section of the CAFR presents management’s analysis of the Utility’s financial performance during the fiscal years ended December 31, 2015 and 2014. We encourage readers to consider the information presented here in conjunction with the transmittal letter, the financial statements, and the notes to the financial statements. Unless otherwise indicated, amounts are rounded to the nearest thousand dollars. Financial Highlights
The Utility net position decreased by $8,836,000 in 2015, as compared to a $3,620,000 increase in 2014. Implementation of new accounting standards for reporting pension liability resulted in a prior period adjustment of $15,256,000. Change in net position before the impact of the pension adjustment was an increase of $6,419,000. A large part of the increase in 2014, $2,254,000, is attributable to funds or equity contributed by customers, developers, and other entities or grantors for improvements and extensions of Utility assets.
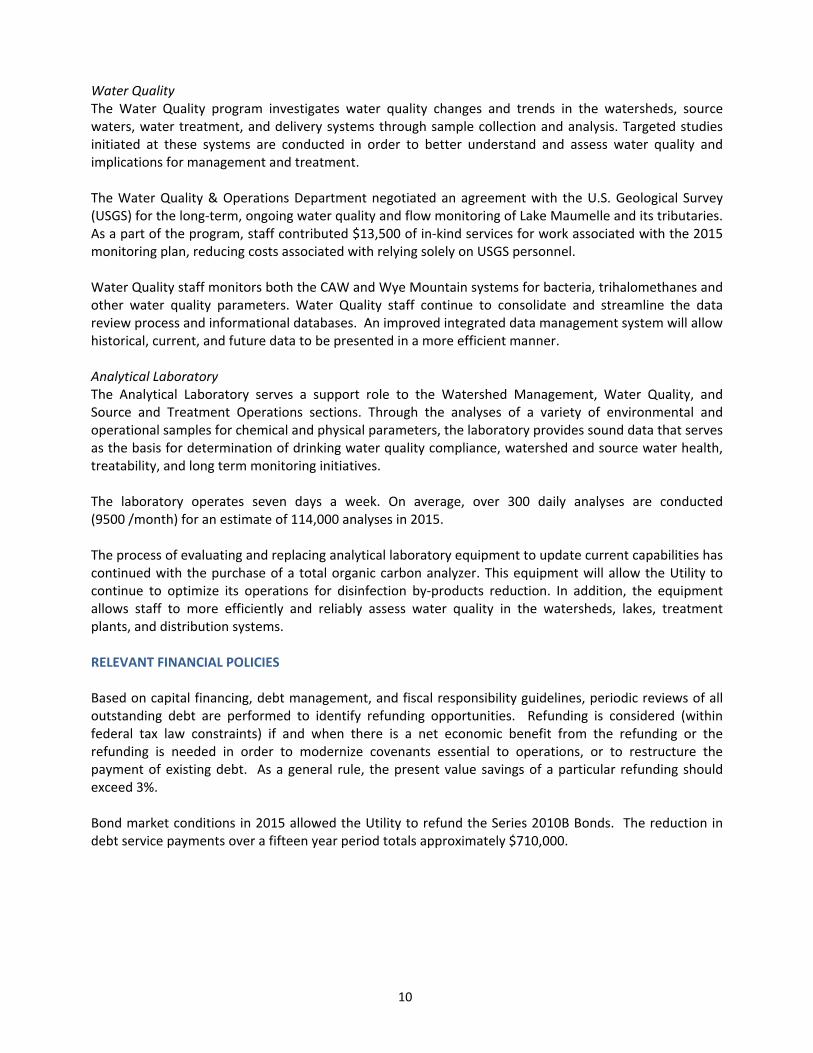
Operating revenues increased $2,483,000, or 5%, in 2015 after decreasing $2,447,000, or 5%, in 2014. The 2015 increase and 2014 decrease were primarily attributable to fluctuation in customer water consumption. Operating expenses increased by $536,000 from 2014 to 2015 and increased by $269,000 from 2013 to 2014, primarily due to increased personnel costs.
The Utility’s total noncurrent liabilities increased during 2015 by $12,870,000 and decreased during 2014 by $3,632,000. The increase in 2015 is primarily attributable to pension liability. The decrease in 2014 is primarily attributable to normal scheduled debt service payments and the current refunding of the series 2004 bonds.
Overview of the Financial Statements
This discussion and analysis is intended to serve as an introduction to the Utility’s basic financial statements. The basic financial statements are comprised of the statements of net position, the statements of revenues, expenses and changes in net position, and the statements of cash flows, as well as the statements of fiduciary net position, and the statements of changes in fiduciary net position. The notes to financial statements provide additional information regarding amounts presented in the basic financial statements. This report also contains additional required supplementary information in addition to the basic financial statements themselves. The financial statements of the Utility are designed to provide readers with a broad overview of the Utility’s finances in a manner similar to a private sector business. The Utility’s financial statements are prepared using the economic resources measurement focus and full accrual basis of accounting, consistent with the requirements of the Governmental Accounting Standards Board (GASB) applicable to enterprise funds. Deferred outflows and inflows of resources are financial statement elements distinct from assets and liabilities and represent a consumption or production of net position that applies to future periods and so will not be recognized as an outflow or inflow of resources until then. The Utility’s deferred outflows and inflows of resources consist of deferred loss and gain, respectively, on debt refunding transactions, and pension related deferred outflows and inflows. A deferred loss or gain on refunding results from the

Central Arkansas Water
MANAGEMENT’S DISCUSSION AND ANALYSIS (Continued) December 31, 2015 and 2014
30
Overview of the Financial Statements (Continued)
difference in the carrying value of refunded debt and its reacquisition price and is amortized over the shorter of the life of the refunded or refunding debt. Pension related deferred outflows and inflows consist of CAW’s proportionate share of pension related items due to differences between projected and actual experience, contributions to the plan not recognized in pension expense, and changes in actuarial assumptions. These items are a result of new accounting standards requiring CAW to recognize CAW’s share of pension plan liabilities and pension expense. The statements of net position present information about the four elements that make up the Utility’s statements of net position. Net position is the difference between assets and deferred outflows of resources and liabilities and deferred inflows of resources. Over time, increases or decreases in net position may serve as a useful indicator of whether the financial position of the Utility is improving or deteriorating.
The statements of revenues, expenses and changes in net position present information that shows how the Utility’s net position changed during the years presented. All changes in net position are reported as soon as the underlying event giving rise to the change occurs, regardless of the timing of the related cash flows. Thus, revenues and expenses are reported in this statement for some items that will result in cash flows in future periods (e.g., water revenues for water service provided in the current reporting period that will not be collected until the next reporting period or expenses associated with goods or services received by the Utility in the current reporting period that will be paid for in the next reporting period).
The statements of cash flows present information about the Utility’s cash receipts, cash payments, and the net changes in cash resulting from operating, investing, and financing activities.
The statements of fiduciary net position and statements of changes in fiduciary net position provide information about resources accumulated in the Other Postemployment Benefits (OPEB) Trust to fund the costs of postemployment healthcare benefits for eligible employees as well as the assets and liabilities of Brushy Island Public Water Authority (Brushy Island), held by the Utility as receiver. These resources are held in trust and are not available to support the Utility’s programs or to satisfy any of the Utility’s liabilities that are not directly related to funding postemployment healthcare benefit costs or Brushy Island debt service.
The notes to financial statements provide additional information that is essential to a full understanding of the data provided in the financial statements.
In addition to the basic financial statements and accompanying notes, this report also presents certain required supplementary information that includes information about the Utility’s progress in funding its obligation to provide other postemployment benefits to its employees.

Central Arkansas Water
MANAGEMENT’S DISCUSSION AND ANALYSIS (Continued) December 31, 2015 and 2014
31
Financial Analysis (Continued)
2015 2014 2013
Assets
Total current assets 52,165,000$ 52,528,000$ 52,089,000$
Restricted noncurrent assets 4,702,000 3,890,000 7,258,000
Net capital assets 396,445,000 393,268,000 391,753,000
Total Assets 453,312,000$ 449,686,000$ 451,100,000$
Deferred Outflows of Resources 4,909,000$ 560,000$ 632,000$
Liabilities
Total current liabilities 17,551,000$ 15,579,000$ 17,279,000$
Total noncurrent liabilities 92,151,000 79,281,000 82,913,000
Total Liabilities 109,702,000$ 94,860,000$ 100,192,000$
Deferred Inflows of Resources 2,196,000$ 227,000$ ‐$
Net Position
Net investment in capital assets 320,026,000$ 312,636,000$ 309,457,000$
Restricted – expendable 7,188,000 6,059,000 7,121,000
Unrestricted 19,109,000 36,464,000 34,961,000
Total Net Position 346,323,000$ 355,159,000$ 351,539,000$
Operating RevenuesLittle Rock water sales 30,213,000$ 28,474,000$ 29,206,000$ North Little Rock water sales 13,525,000 12,738,000 12,985,000 Wholesale 3,721,000 3,858,000 3,807,000 Penalties 879,000 917,000 860,000 Turn‐on charges 989,000 1,010,000 1,101,000 Ancillary charges 4,022,000 3,930,000 4,096,000 Other revenue 732,000 671,000 1,990,000
Total Operating Revenues 54,081,000 51,598,000 54,045,000
Operating ExpensesAdministration 2,599,000$ 2,471,000$ 2,365,000$ Distribution 10,257,000 10,659,000 10,495,000 Engineering 1,694,000 1,821,000 1,773,000 Finance 2,582,000 2,548,000 2,586,000 Customer relations and public affairs 4,436,000 4,459,000 4,178,000 Information services 3,050,000 3,134,000 2,902,000 Source and treatment 8,012,000 7,717,000 7,889,000 Water quality 2,024,000 1,911,000 1,936,000 General 2,113,000 1,971,000 2,017,000 Depreciation 11,247,000 10,787,000 11,068,000
Total Operating Expenses 48,014,000 47,478,000 47,209,000
Operating Income 6,067,000 4,120,000 6,836,000

Central Arkansas Water
MANAGEMENT’S DISCUSSION AND ANALYSIS (Continued) December 31, 2015 and 2014
32
Financial Analysis (Continued)
2015 2014 2013
Nonoperating Revenues (Expenses)Transfers to Cities of LR and NLR (659,000)$ (659,000)$ (608,000)$ Gain (loss) on disposal of capital assets 76,000 26,000 250,000 Investment income 195,000 199,000 111,000 Bond and other interest expense, net (2,408,000) (2,320,000) (2,348,000)
Total Nonoperating Expenses (2,796,000) (2,754,000) (2,595,000)
Income Before Contributions 3,271,000 1,366,000 4,241,000
Contributions Capital contributions from grantors 127,000 ‐ 48,000 Contributions‐in‐aid of construction 3,022,000 2,254,000 865,000
Total Contributions 3,149,000 2,254,000 913,000
Change in Net Position 6,420,000 3,620,000 5,154,000
Net Position – Beginning of Year 355,159,000 351,539,000 346,385,000
Pension Related Restatement of Net Position (15,256,000) ‐ ‐
Net Position ‐ Beginning of Year, as Restated 339,903,000 351,539,000 346,385,000
Net Position – End of Year 346,323,000$ 355,159,000$ 351,539,000$
Statements of Net Position
As noted earlier, net position may serve, over time, as a useful indicator of the Utility’s financial position. At the close of 2015 and 2014, the Utility’s assets and deferred outflows of resources exceed liabilities and deferred inflows of resources by $346,323,000 and $355,159,000, respectively. The largest portion of net position, 92% in 2015 and 88% in 2014, reflects the Utility’s investment in capital assets, less related outstanding debt incurred to acquire those assets. The Utility uses these capital assets to provide services to customers of the Utility and consequently, these assets are not available for future spending. Although the Utility’s investment in capital assets is reported net of related outstanding debt, it should be noted that
the resources needed to repay this debt must be provided from other sources since the capital assets themselves cannot be used to liquidate these liabilities. Depreciation is recorded on all depreciable capital assets using the straight‐line method. During the year, no changes were made in the method of recording capital assets, nor were there any changes made to any of the standard service lives of those assets. There were no significant changes in the condition of infrastructure assets. Funds that were budgeted for infrastructure maintenance were adequate for needs that arose during the year.

Central Arkansas Water
MANAGEMENT’S DISCUSSION AND ANALYSIS (Continued) December 31, 2015 and 2014
33
Financial Analysis (Continued)
Statements of Net Position (Continued)
An additional portion of the Utility’s net position, 2% in 2015 and 2014, is comprised of resources that are subject to external restrictions on how they may be used. In 2015, restricted net position increased $1,129,000, and there was a decrease of $1,062,000 during 2014. Balances in restricted net position accounts will fluctuate as resources are accumulated to repay outstanding bonds and construction proceeds are spent. The remaining balance of net position, $19,109,000 in 2015 and $36,464,000 in 2014, is unrestricted and may be used to meet the Utility’s ongoing obligations to customers and creditors. Unrestricted net position decreased $17,355,000 in 2015 and increased $1,503,000 in 2014. The 2015 decrease is attributable to pension liability, while the 2014 increase is primarily attributable to a rate increase.
‐
50
100
150
200
250
300
350
400
2013 2014 2015
Restricted 7,121,000 6,059,000 7,188,000
Unrestricted 34,961,000 36,464,000 19,109,000
Net Investment in Capital Assets 309,457,000 312,636,000 320,026,000
$ M
illions
Components of Net Position

Central Arkansas Water
MANAGEMENT’S DISCUSSION AND ANALYSIS (Continued) December 31, 2015 and 2014
34
Financial Analysis (Continued)
Statements of Net Position (Continued)
Financial ratios are used to analyze relationships between different pieces of financial information. Ratio analyses can present information about an entity’s operating performance and financial position. Short‐term liquidity can be demonstrated using the current ratio and quick ratio. The current ratio is calculated by dividing current assets by current liabilities. The quick ratio is similar to the current ratio but excludes inventory because inventory is normally the least liquid current asset. A number greater than 1 indicates current assets in excess of current needs that can be applied to future periods. The current ratios as of December 31, 2015 and 2014 are 3.0 and 3.4, respectively. This ratio means for every $1.00 in current liabilities as of December 31, 2015, the Utility has $3.00 in current assets. For the periods ending December 31, 2015 and 2014, the quick ratios for each year are 2.8 and 3.2, respectively. Efficiency can be demonstrated by calculating the average collection period of billed revenue. Other agencies are included in the monthly bills issued to customers (i.e., Little Rock Wastewater Utility, North Little Rock Waste Water Utility, Little Rock Solid Waste Services Division, Pulaski County Sanitation Division, and others); however, these balances are subtracted from accounts receivable so that a comparison can be made between water receivables and water revenues. Turnover is calculated by dividing total operating revenue by total water accounts receivable; then 365 days is divided by the Receivables Turnover to arrive at an Average Collection Period of 20 days and 18 days as of December 31, 2015 and 2014, respectively. The Utility continues to strive to improve cash flow and customer service by offering a variety of payment options. In addition to accepting payments at the Capitol Avenue office in Little Rock, the Utility offers flexibility in bill payment options by allowing customers to pay their bills by automatic bank draft, on‐line at the Utility website, by mail, by telephone through a third‐party service provider, on‐line through third‐party payment providers, or at third‐party payment locations throughout the service area. During 2015, the Utility promoted our paperless billing and an online account portal for customers where they can view account history, usage history and print out their invoices among other options. Another important ratio is the debt utilization ratio. The debt utilization ratio is calculated by dividing total liabilities by total assets and is 24% and 21% for 2015 and 2014, respectively. According to American Water Works Association’s 2013 benchmarks, the median ratio is 32%. It is the policy of the Utility not to make any adjustments to net position unless a prior period adjustment is necessary. Prior period adjustments were recorded during 2015 as a result of implementation of applicable accounting pronouncements. Statements of Revenues, Expenses and Changes in Net Position
Operating Revenues
A cost of services study completed during 2012 resulted in the Board of Commissioners passing a rate resolution for the years 2013, 2014, and 2015. On January 1, 2013 and January 1, 2014, rate revenues increased by 3.8% and 3.7% respectively. There were no scheduled rate adjustments in 2015.

Central Arkansas Water
MANAGEMENT’S DISCUSSION AND ANALYSIS (Continued) December 31, 2015 and 2014
35
Financial Analysis (Continued)
Statements of Revenues, Expenses and Changes in Net Position (Continued)
Operating Revenues (Continued)
Operating revenue for 2015 increased $2,483,000 over 2014 levels and decreased $2,447,000 in 2014 over 2013 levels. Water consumption totaled 17.7, 17.0 and 18.2 billion gallons in 2015, 2014, and 2013, respectively. The operating revenue increase in 2015 and decrease in 2014 are primarily due to these consumption fluctuations as a result of weather conditions. Higher than normal rainfall in the spring and summer months can have a significant impact on sprinkler consumption. The following graph illustrates sources of revenue during the year ended December 31, 2015.
Retail Water Sales (80.87%), $43,738,000
Wholesale Water Sales (6.88%), $3,721,000
Penalties and Turn‐on Charges (3.45%),
$1,868,000
Ancillary Charges (7.45%), $4,022,000
Other Revenue (1.35%), $732,000
Retail Water Sales (80.87%) Wholesale Water Sales (6.88%)
Penalties and Turn‐on Charges (3.45%) Ancillary Charges (7.45%)
Other Revenue (1.35%)

Central Arkansas Water
MANAGEMENT’S DISCUSSION AND ANALYSIS (Continued) December 31, 2015 and 2014
36
Financial Analysis (Continued)
Statements of Revenues, Expenses and Changes in Net Position (Continued)
Operating Expenses
• Administration – Administration costs include management, human resources, environmental health and safety expenses. During 2015, expenses for total administrative costs increased $127,000. The management section increased by $245,000, human resources increased by $10,000, safety decreased by $133,000, and commissioner expenses increased by $5,000, to account for the total increase. Management increases in 2015 resulted from expenditures to Hawkins‐Weir Engineers, Inc. for the Maumelle Water Management (MWM) consolidation feasibility study and the consolidation route study and to Raftelis Financial Consultants, Inc. for the water rate study. Safety cost reduction was realized from a reduction in security staffing. In 2014, management cost increases of approximately $101,000 were primarily the result of additional payroll costs associated with hiring in‐house legal staff. During the same year, Communications was transferred to a new department Customer Relations and Public Affairs.
• Distribution – The Distribution Department includes expenses for maintaining water mains, booster pumping stations, water storage tanks, vehicles, treatment plants, and other facilities. 2015 costs decreased $402,000 over 2014. Administration expense decreased $60,000 in payroll costs attributable to retirements. Plant maintenance decreased by $3,000 for materials and maintenance costs at the Ozark Point Plant and the Wilson Plant. Capitalized labor increased by $78,000, from $1,287,000 in 2014 to $1,365,000 in 2015. Distribution system maintenance decreased by $260,000 in materials, job costs, and fuel. Several factors resulted in an increase of $164,000 in 2014 Distribution Department costs over costs reported in 2013. Administration increased $34,000 which was attributable to increased payroll costs. Plant maintenance increased by $116,000 for materials and maintenance costs at the Ozark Point Plant and the Wilson Plant. Operation and maintenance costs in distribution system maintenance increased by $14,000 due to a reduction in the amount of capitalized labor. Distribution system maintenance increased by $30,000 in materials and job costs.
• Engineering – The Engineering Department includes expenses for the planning, design, and inspection of construction improvements within the water system. Engineering is comprised of divisions for administrative staff, new service, cross connection, and regionalism. 2015 engineering costs decreased $127,000. Reduction in payroll expense resulted from fewer filled positions and less capitalized labor as the primary contributors. Capitalized labor decreased by $40,000 over 2013 causing O&M costs to increase. 2014 engineering costs increased by $48,000 over 2013.
• Finance – The Finance Department includes costs related to finance and budgeting, purchasing, and billing. Expenses for the department increased by $34,000 in 2015. The increase can be attributed to payroll increases compared to 2014 when there were several high impact retirements. 2014 total department costs declined $38,000 from 2013 expenditures due to employee retirements and associated decreases in payroll costs.

Central Arkansas Water
MANAGEMENT’S DISCUSSION AND ANALYSIS (Continued) December 31, 2015 and 2014
37
Financial Analysis (Continued)
Statements of Revenues, Expenses and Changes in Net Position (Continued)
Operating Expenses (Continued)
Customer Relations and Public Affairs – Customer Relations and Public Affairs includes costs related to customer service‐office and field operations, communications, and public affairs. Total expenses decreased $22,000 from 2014 levels, and were attributable to reduced special project spending and lower fuel costs in 2015. 2014 expenses increased $281,000 over 2013 levels. Factors affecting the increase were restructuring of two departments which allocated employees differently and an increase in meter reading costs due to the addition of a Wye Mountain employee.
Information Services – The Information Services Department expenses are related to maintaining information systems, computer operations, and telecommunications of the Utility. Information Services is divided into Information Services (IS) administration and Geographic Information Services (GIS). Department costs decreased by $84,000 in 2015 compared to the previous year, primarily attributable to decreased communication costs in telephone, network, wireless and internet services. Department costs increased by $232,000 from 2013 to 2014. The IS section increased by $183,000 and the GIS section increased by $49,000 during the period. In IS, the largest cost factors were telephone $46,000, interactive voice response maintenance $12,000, and network and computer hardware $60,000. In GIS, the largest cost factors were $7,000 in software and equipment, and $32,000 in payroll and benefit costs.
Source and Treatment – Expenses for Source and Treatment include treatment and maintenance of the lakes. During 2015, total department costs increased by $295,000. Contributing expenses were in electric and chemical costs which were affected as a result of plant chemical optimization while additional consumption resulted in electrical cost increases. During 2014, total department costs decreased by $172,000, attributable to lower chemicals and power costs.
Water Quality (formerly watershed activities) –The Watershed section was added in 2008 to oversee watershed protection for the Utility. Related expenses include monitoring water‐quality and watershed land‐use activities, building support for watershed protection and providing the Board of Commissioners with water quality recommendations. Water Quality expenditures increased by $113,000 compared to 2014. A majority of this increase was due to Watershed staff restructuring which included adding more technical positions and additional responsibilities as it has broadened its scope of operations. Previously in 2013, Water Quality was realigned to incorporate watershed activities into the Water Quality Department to more accurately reflect departmental goals and initiatives. For the years 2013 and 2014, the cost variances were not significant.

Central Arkansas Water
MANAGEMENT’S DISCUSSION AND ANALYSIS (Continued) December 31, 2015 and 2014
38
Financial Analysis (Continued)
Statements of Revenues, Expenses and Changes in Net Position (Continued)
Operating Expenses (Continued)
General – General expenditures include expenditures for insurance and building maintenance at the James T. Harvey Administration Building, along with other costs. The largest expenditure items include group, retiree and workers compensation insurance and bad debt expense. General expenditures increased by $142,000 from 2014. Cost increases were $58,000 in workers compensation insurance, $71,000 in injuries and damage claims, and $24,000 in in bad debt expense. General expenditures decreased $46,000 from 2013 to 2014. Combined insurance costs for group insurance, retiree insurance, workers compensation, and business insurance decreased by $37,000.
‐ 1 2 3 4 5 6 7 8 9 10 11 12
Administration
Distribution
Engineering
Finance
Customer Relations and Public Affairs
Information Services
Source and Treatment
Water Quality/Watershed Protection
General
Depreciation
Millions
2013
2014
2015

Central Arkansas Water
MANAGEMENT’S DISCUSSION AND ANALYSIS (Continued) December 31, 2015 and 2014
39
Financial Analysis (Continued)
Statements of Revenues, Expenses and Changes in Net Position (Continued)
Nonoperating Revenues (Expenses)
• Investment Income – 2015 investment income decreased by $5,000 from 2014, and 2014 increased $88,000 from 2013. The 2015 decrease may be attributed to small fluctuations in interest rates. While 2014 increase is due to greater investment in certificates of deposit, yielding more than money market cash account.
• Bond Interest Expense – Net bond interest expense for 2015 is $2,408,000, compared to $2,320,000 for 2014. Capitalized interest, which offsets interest expense, totaled $152,000 in 2015 and $515,000 in 2014.
• Capital Contribution from Grantors – $127,000 in capital grants awarded during 2015. During 2014, no capital grants were awarded.
• Contributions‐In‐Aid of Construction – Contributions‐in‐aid of construction may be received as cash or equity. In 2015, contributed equity totaled $2,544,000 and contributed cash totaled $478,000. In 2014, contributed equity totaled $2,062,000 and contributed cash totaled $192,000. These two years show the variability of contributions from year to year as a result of new construction. Contributed equity is an asset of the Utility and is maintained as part of the system.
Capital Assets and Debt Administration
The significant components of the Utility’s capital asset balances, as well as the outstanding balances of debt issued to acquire, improve or construct capital assets are detailed below:
Capital Assets
Major capital projects completed during 2015 include the following:
Project Description Total Cost
Completion of construction project to replace old galvanized water pipe with 5,870 feet of 2‐inch and 3‐inch PVC pipe in the Hillcrest area of Little Rock.
$ 584,000
Completion of construction project to install 1,487 feet of 12‐inch ductile iron pipe for the relocation of existing water facilities for a new Arkansas Highway and Transportation Department Highway 365 (MacArthur Drive) viaduct over the Union Pacific railroad located in North Little Rock.
$ 315,000
Completion of construction project to install 2,286 feet of 12‐inch ductile iron pipe for relocation of existing water facilities, street and drainage improvements along Sherrill and Mabelvale Cutoff Road constructed by the City of Little Rock.
$ 375,000

Central Arkansas Water
MANAGEMENT’S DISCUSSION AND ANALYSIS (Continued) December 31, 2015 and 2014
40
Financial Analysis (Continued)
Capital Assets and Debt Administration (Continued)
Capital Assets (Continued)
Project Description Total Cost
Completion of construction project to install 560 feet of 12‐inch and 1,188 feet of 8‐inch ductile iron pipe for the relocation of existing water facilities for a new Arkansas Highway and Transportation Department Highway 367 (South Arch Street) viaduct over the Union Pacific railroad located in Little Rock.
$
200,000
Paid for the relocation of 1,265 of 20‐inch water pipe for the new Broadway Bridge construction over the Arkansas River.
$
1,319,000
Major capital projects completed during 2014 include the following:
Project Description Total Cost
Installation of 6,220 linear feet of 2‐inch PVC water main along and around Washington Street in North Little Rock to replace old, high maintenance galvanized pipe.
$ 260,000
Completion of the construction phase for the water treatment plant improvements necessary for the Utility to meet the 2014 USEPA Stage 2 D/DBP Rule.
$ 15,100,000
Broadway Bridge South Water Main Connection project consisting of new 12‐inch and 20‐inch water pipe installation, meter vault construction, and bore and encasement under Ark. State Hwy. 10, work in preparation for the demolition of the existing Broadway Bridge and new bridge construction over the Arkansas River.
$ 354,000
Lining of 1,350 linear feet of 50‐year old 16‐inch cast iron pipe with a cured‐in‐place pipe liner to rehabilitate the original pipe that was prone to spontaneous leakage and breaks. The rehabilitated pipe runs along North University Ave from Cantrell Rd to South Country Club Blvd.
$ 643,000
Installation of 5,150 linear feet of 3‐inch and 6‐inch water main in various locations within Little Rock and North Little Rock to replace old, high maintenance galvanized pipe.
$ 458,000

Central Arkansas Water
MANAGEMENT’S DISCUSSION AND ANALYSIS (Continued) December 31, 2015 and 2014
41
Capital Assets and Debt Administration (Continued)
Capital Assets (Continued)
Project Description Total Cost
Relocation of 450 linear feet of 6‐inch water main and 400 linear feet of 24‐inch transmission main due to the reconstruction of a road bridge along Remount Road in North Little Rock.
$ 187,000
Relocation of 4,422 linear feet of 12‐inch, 142 linear feet of 8‐inch, and 456 linear feet of 6‐inch water mains along Cantrell Road (Ark State Hwy No. 10) in Little Rock due to widening and reconstruction of the highway by the Arkansas State Highway Department.
$ 775,000
Installation of 3,487 linear feet of 12‐inch, 2,450 linear feet of 8‐inch, and 330 linear feet of 6‐inch water main to replace old, high maintenance asbestos‐cement and cast iron pipe in three different locations within Little Rock.
$ 686,000
Relocation of 3,100 linear feet of 12‐inch water main due to street and drainage improvement construction by the City of Little Rock along Scott Hamilton Road, north of Baseline Road
$
494,000
Acquisition of approximately 41 acres of property within the Lake Maumelle Watershed.
$ 402,000
Upgrade of the customer information and billing software. $ 762,000
Capital assets are discussed further in Note 1 and Note 6 to the financial statements.
Debt Administration
At the end of 2015, The Utility had total outstanding debt of $76,734,000. Total debt decreased by $4,232,000, or 5%, in 2015, after decreasing $4,477,000, or 5%, in 2014. The 2015 decrease is primarily attributable to normal recurring debt service payments and the current refunding of the Series 2010B bonds. The 2014 decrease is primarily attributable normal recurring debt service payments and the current refunding of the Series 2004 bonds.
Long‐term debt is discussed further in Note 7 to the financial statements.

Central Arkansas Water
MANAGEMENT’S DISCUSSION AND ANALYSIS (Continued) December 31, 2015 and 2014
42
Economic Factors and Next Year’s Financial Plan and Rates
Local, state, and federal government have been the area’s major employers for many years. Medical facilities, banks, and other service industries are also very important to the local economy. Government and medical facilities employers in particular have kept the local economy relatively stable during the recent economic downturn. Both the cities of Little Rock and North Little Rock have revitalized their respective downtown areas, which have in turn attracted major corporations in a variety of industries. The local economy has slowly recovered from the 2008 recession and compares favorably to national figures in many categories. Unemployment in Pulaski County is currently 4.0%, which is on par with the 4.1% experienced in 2007 prior to the 2008 recession. Unemployment is also favorable compared to the national rate of 5.0%. Net accounts receivable write‐offs decreased slightly from 0.8% to 0.7% of total operating revenue, as did the number of customers requesting payment assistance. The Utility factored in no retail rate increases in 2016. Wholesale rates will increase approximately 10.0% in 2016. The Utility also continues to factor in conservative consumption estimates, reduced levels of growth‐related revenues, and a minimal return on financial investments in the 2016 Financial Plan. Rate increases of 8.9% are scheduled for 2017 and 2018. The 2016 Financial Plan outlines the Utility’s plans to continue to provide high quality, cost‐effective service to its customers. The 2016 Financial Plan includes $20,660,000 in total capital expenditures which will be funded $1,245,000 from excess working capital, $2,153,000 from capital grants, $1,250,000 from a 2016 bond issue, $930,000 from capital improvement charges, and $1,942,000 from watershed protection fees. Budgeted capital expenditures also include the purchase of water rights for 100 million gallons per day from DeGray Lake with a loan in the amount of $4,640,000 from Department of U.S. Army. The remaining $8,500,000 is funded from rates, and primarily consists of routine asset additions and replacements in the system. Request for Information
This financial report is designed to provide a general overview of the Utility’s finances. Questions concerning any information in the report or requests for additional financial information should be addressed to Jeff Mascagni, Chief Financial Officer; Central Arkansas Water; 221 East Capitol Avenue; Little Rock, Arkansas 72202.

43
Basic Financial Statements

Central Arkansas Water
See accompanying notes to financial statements.
44
STATEMENTS OF NET POSITION December 31, 2015 and 2014
2015 2014ASSETSCurrent AssetsUnrestricted cash and cash equivalents $ 10,126,314 $ 16,196,144 Unrestricted investments 20,712,957 16,521,681 Accounts receivable – consumers, net 10,704,449 9,977,269 Other receivables 1,189,062 607,308 Inventory 2,287,290 2,325,906 Other current assets 398,746 415,893
Total Unrestricted Current Assets 45,418,818 46,044,201
Restricted cash and cash equivalents 5,958,824 5,720,813 Restricted investments 787,389 762,875
Total Restricted Current Assets 6,746,213 6,483,688
Total Current Assets 52,165,031 52,527,889
Noncurrent AssetsRestricted investments 4,698,750 3,887,124 Restricted accrued interest receivable 3,437 2,417
Total Restricted Noncurrent Assets 4,702,187 3,889,541
Capital assets, net of accumulated depreciation 396,444,881 393,268,447
Total Noncurrent Assets 401,147,068 397,157,988
Total Assets 453,312,099 449,685,877
DEFERRED OUTFLOWS OF RESOURCES
Deferred outflow related to pensions 4,390,398 ‐
Deferred loss on refunding of bonds payable 518,639 560,057
Total Deferred Outflows of Resources 4,909,037 560,057
TOTAL ASSETS AND DEFERRED OUTFLOWS OF RESOURCES $ 458,221,136 $ 450,245,934

Central Arkansas Water
See accompanying notes to financial statements.
45
STATEMENTS OF NET POSITION (Continued) December 31, 2015 and 2014
2015 2014LIABILITIES Current LiabilitiesAccounts payable and accrued expenses 2,096,680$ $ 1,194,198 Payroll and related liabilities 2,574,772 2,424,101 Long‐term obligations ‐ current portion 399,882 154,621 Due to other agencies 5,733,879 5,322,463
Total Current Liabilities Payable from Unrestricted Assets 10,805,213 9,095,383
Consumer deposits ‐ current portion 994,831 903,306 Long‐term obligations ‐ current portion 5,201,739 4,875,400 Accrued interest payable 549,643 704,982
Total Current Liabilities Payable from Restricted Assets 6,746,213 6,483,688
Total Current Liabilities 17,551,426 15,579,071
Noncurrent LiabilitiesUnearned revenue 991,863 662,966 Consumer deposits 2,725,163 2,681,755 Long‐term obligations, net 71,132,878 75,936,250 Net pension liability 17,301,107 ‐
Total Noncurrent Liabilities 92,151,011 79,280,971
Total Liabilities 109,702,437 94,860,042
DEFERRED INFLOWS OF RESOURCESDeferred inflow related to pensions 1,992,627 ‐ Deferred gain on refunding of bonds payable 203,130 226,796
Total Deferred Inflows of Resources 2,195,757 226,796
TOTAL LIABILITIES AND DEFERRED INFLOWS OF RESOURCES 111,898,194 95,086,838
Net PositionNet investment in capital assets 320,025,891 312,635,439 Restricted ‐ expendable: Bond requirements 5,237,093 4,519,265 Future capital expenditures 1,951,054 1,540,059
Unrestricted 19,108,904 36,464,333 Total Net Position 346,322,942 355,159,096
TOTAL LIABILITIES, DEFERRED INFLOWS OF RESOURCES
AND NET POSITION $ 458,221,136 $ 450,245,934
Central Arkansas Water
See accompanying notes to financial statements.
46
STATEMENTS OF REVENUES, EXPENSES AND CHANGES IN NET POSITION Years Ended December 31, 2015 and 2014
2015 2014
OPERATING REVENUESLittle Rock water sales 30,213,245$ 28,473,732$ North Little Rock water sales 13,525,139 12,738,385Wholesale 3,721,179 3,858,475 Penalties 878,500 916,613 Turn‐on charges 989,227 1,010,229 Ancillary charges 4,022,409 3,929,969 Other revenue 731,607 670,741
Total Operating Revenues 54,081,306 51,598,144
OPERATING EXPENSESAdministration 2,598,576 2,471,360 Distribution 10,256,858 10,659,085 Engineering 1,694,457 1,821,276 Finance 2,582,474 2,548,209 Customer relations and public affairs 4,436,408 4,458,680Information services 3,050,213 3,133,821 Source and treatment 8,011,935 7,717,004 Water quality 2,024,136 1,911,167 General 2,112,725 1,971,006Depreciation 11,246,626 10,786,930
Total Operating Expenses 48,014,408 47,478,538 Operating Income 6,066,898 4,119,606
(Continued)

Central Arkansas Water
See accompanying notes to financial statements.
47
STATEMENTS OF REVENUES, EXPENSES AND CHANGES IN NET POSITION (Continued) Years Ended December 31, 2015 and 2014
2015 2014NONOPERATING REVENUES (EXPENSES)Transfers to Cities of Little Rock and North Little Rock (659,088)$ (658,776)$ Gain on disposal of capital assets 76,092 26,456 Investment income 194,795 199,334 Bond and other interest expense, net (2,408,154) (2,320,427)
Total Nonoperating Expenses (2,796,355) (2,753,413)
INCOME BEFORE CONTRIBUTIONS 3,270,543 1,366,193
CONTRIBUTIONSContributions‐in‐aid of construction 3,021,520 2,253,550 Capital contributions from grantors 127,396 ‐
Total Contributions 3,148,916 2,253,550
CHANGE IN NET POSITION 6,419,459 3,619,743
NET POSITION, BEGINNING OF YEAR 355,159,096 351,539,353
PENSION RELATED RESTATEMENT OF BEGINNING NET POSITION (15,255,613) ‐
NET POSITION, BEGINNING OF YEAR, AS RESTATED 339,903,483 ‐
NET POSITION, END OF YEAR 346,322,942$ 355,159,096$

Central Arkansas Water
See accompanying notes to financial statements.
48
STATEMENTS OF CASH FLOWS Years Ended December 31, 2015 and 2014
2015 2014CASH FLOWS FROM OPERATING ACTIVITIESCash receipts from customers 52,587,114$ 51,660,851$ Cash payments to suppliers for goods and services (13,439,610) (15,417,535) Cash payments to employees for services (21,127,315) (20,219,072) Cash payments for employees pension benefits (2,479,699) (2,466,274) Cash receipts from other sources 731,607 670,741 Net Cash Provided by Operating Activities 16,272,097 14,228,711
CASH FLOWS FROM NONCAPITAL FINANCING ACTIVITIESTransfers to Cities of Little Rock and North Little Rock (659,088) (658,776) Net Cash Used by Noncapital Financing Activities (659,088) (658,776)
CASH FLOWS FROM CAPITAL AND RELATED FINANCING ACTIVITIESAcquisition and construction of capital assets (10,468,152) (9,423,312) Proceeds from issuance of bonds 8,149,955 14,520,118 Payment to refunded bond escrow agent (7,745,000) (14,170,000) Principal paid on long‐term obligations (4,639,704) (4,067,362) Interest paid on long‐term obligations (2,936,497) (3,292,108) Payments received from lessee 328,897 333,333 Contributions‐in‐aid of construction 478,243 191,589 Capital contributions from grantors 127,396 ‐ Proceeds from sale of capital assets 93,675 62,548 Net Cash Used by Capital and Related
Financing Activities (16,611,187) (15,845,194)
CASH FLOWS FROM INVESTING ACTIVITIESProceeds from maturities of investment securities 17,497,584 13,139,584 Purchases of investment securities (22,546,250) (17,449,996) Interest and dividends 215,025 98,099 Net Cash Used by Investing Activities (4,833,641) (4,212,313)
NET DECREASE IN CASH AND CASH EQUIVALENTS (5,831,819) (6,487,572)
CASH AND CASH EQUIVALENTS, BEGINNING OF YEAR 21,916,957 28,404,529
CASH AND CASH EQUIVALENTS, END OF YEAR 16,085,138$ 21,916,957$
(Continued)

Central Arkansas Water
See accompanying notes to financial statements.
49
STATEMENTS OF CASH FLOWS (Continued) Years Ended December 31, 2015 and 2014
2015 2014RECONCILIATION OF OPERATING INCOME TO NET CASHPROVIDED BY OPERATING ACTIVITIESOperating income 6,066,898$ 4,119,606$ Adjustments to reconcile operating incometo net cash provided by operating activitiesDepreciation 11,246,626 10,786,930 Bad debt expense 335,000 311,000 Change in operating assets and liabilitiesAccounts receivable ‐ consumers, net (1,062,180) 813,041 Other receivables (581,754) (1,562) Inventory (1,473,752) (1,287,026) Other current assets 17,147 (55,695) Accounts payable and accrued expenses 1,379,369 (235,878) Payroll and related liabilities 150,671 167,326 Due to other agencies 411,416 (522,007) Consumer deposits 134,933 132,976 Deferred outflows related to pensions (352,277) ‐
Net Cash Provided by Operating Activities 16,272,097$ 14,228,711$
RECONCILIATION OF CASH AND CASH EQUIVALENTS TOSTATEMENTS OF NET POSITIONCurrent Assets ‐ Cash and Cash EquivalentsUnrestricted 10,126,314$ 16,196,144$ Restricted 5,958,824 5,720,813
Total Cash and Cash Equivalents 16,085,138$ 21,916,957$
Gain on disposal of capital assets 76,092$ 26,456$ Contributions‐in‐aid of construction 2,543,277 2,061,961 Inventory capitalized 1,512,368 1,402,947 Capital asset acquisitions in accounts payable 476,887 222,872 Capital asset acquisitions financed with notes payable 242,124 ‐ Increase in fair value of investments 21,250 121,530
SUPPLEMENTAL DISCLOSURE OF CASH TRANSACTIONS Interest expense incurred 2,559,763 2,835,532 Interest capitalized 151,609 515,105
SUPPLEMENTAL DISCLOSURE OF NONCASH TRANSACTIONS

Central Arkansas Water
See accompanying notes to financial statements.
50
STATEMENTS OF FIDUCIARY NET POSITION December 31, 2015 and 2014
OPEB Brushy OPEB Brushy
Trust Island Trust Island
ASSETS
Cash and cash equivalents 870,242$ 81,798$ 1,039,316$ 135,166$ Restricted cash and cash equivalents ‐ 13,694 ‐ 105,422U.S. Treasury obligations 248,673 ‐ 348,718 ‐ Certificates of deposit 2,032,537 ‐ 1,388,975 ‐ Exchange traded funds 255,107 ‐ 255,187 ‐ Accounts receivable ‐ 8,197 ‐ 8,316Accrued interest receivable 7,938 6 11,460 5Capital assets, net ‐ 1,719,928 ‐ 1,753,240
TOTAL ASSETS 3,414,497$ 1,823,623$ 3,043,656$ 2,002,149$
LIABILITIES
Accounts payable 3,900$ ‐$ 3,398$ ‐$ Long‐term obligations ‐ 621,739 ‐ 861,964Accrued interest payable ‐ 3,305 ‐ 281Consumer deposits ‐ 5,825 ‐ 5,975
Total Liabilities 3,900 630,869 3,398 868,220
NET POSITION
Held in trust 3,410,597 1,192,754 3,040,258 1,133,929
Total Net Position 3,410,597 1,192,754 3,040,258 1,133,929
TOTAL LIABILITIES AND NET POSITION 3,414,497$ 1,823,623$ 3,043,656$ 2,002,149$
2015 2014

Central Arkansas Water
See accompanying notes to financial statements.
51
STATEMENTS OF CHANGES IN FIDUCIARY NET POSITION Years Ended December 31, 2015 and 2014
OPEB Brushy OPEB Brushy
Trust Island Trust IslandADDITIONS
Employer contributions 710,052$ ‐$ 697,607$ ‐$ Water sales ‐ 88,766 ‐ 92,961Debt service fees ‐ 99,157 ‐ 99,077Investment income 26,813 75 21,057 61
Total Additions 736,865 187,998 718,664 192,099
DEDUCTIONS
Premiums paid 351,216 ‐ 305,626 ‐ Transfers to Central Arkansas Water ‐ 88,616 ‐ 92,861Administrative expenses 15,310 849 12,599 849Depreciation ‐ 33,312 ‐ 33,312Interest ‐ 6,396 ‐ 6,323
Total Deductions 366,526 129,173 318,225 133,345
CHANGE IN NET POSITION 370,339 58,825 400,439 58,754
NET POSITION, BEGINNING OF YEAR 3,040,258 1,133,929 2,639,819 1,075,175
NET POSITION, END OF YEAR 3,410,597$ 1,192,754$ 3,040,258$ 1,133,929$
2015 2014

52
(This page intentionally left blank)

Central Arkansas Water
NOTES TO FINANCIAL STATEMENTS December 31, 2015 and 2014
53
NOTE 1: NATURE OF OPERATIONS AND SUMMARY OF SIGNIFICANT ACCOUNTING POLICIES (a) Reporting Entity Central Arkansas Water (the Utility) is an independent public entity established effective July 1, 2001, to own and operate a consolidated water system, as authorized under Act 982 of 2001 of the 83rd General Assembly of the State of Arkansas (the State). The Utility operates pursuant to a Consolidation Agreement, as amended, executed by and between the City of Little Rock, Arkansas; the City of North Little Rock, Arkansas; the Board of Commissioners of Little Rock Municipal Water Works; and the Board of Commissioners of the North Little Rock Water Department. Serving a retail and wholesale population of approximately 400,000 in 20 cities and communities located in Pulaski, Saline, Grant, Faulkner, Perry and Lonoke counties, the Utility is the largest water supplier in the State of Arkansas. The Utility’s mission is to enhance the quality of life for Central Arkansas by delivering high‐quality water and dependable service that exceed customer expectations; protecting and ensuring a long‐term water supply for future generations; and serving as responsible stewards of public health, utility resources and the environment. The governing board of the Utility is a Board of Commissioners, comprised of seven members who serve seven year terms. Membership on the Board of Commissioners is subject to confirmation by the City of Little Rock Board of Directors and the North Little Rock City Council. Rates may be established by the Board of Commissioners; however, before any rate changes may be implemented, the Board of Commissioners must give three months’ notice to the City of Little Rock Board of Directors and the North Little Rock City Council and hold at least one public hearing on the proposed change(s) in rates. A change in rates may not be implemented if both the City of Little Rock Board of Directors and the North Little Rock City Council vote disapproval of the rate change. In the absence of such disapproval, the rate change will be implemented as proposed. The issuance of revenue bonds is subject to the same requirements. Under the terms of the Consolidation Agreement, the Utility is required to pay a franchise fee to the cities of Little Rock and North Little Rock based on water revenues billed within the respective cities. The rate, which cannot exceed 10.0%, was 10.0% for the City of Little Rock and 6.9% for the City of North Little Rock during 2015 and 2014. These franchise fees, which are not included in revenues or expenses on the Utility’s statements of revenues, expenses and changes in net position, totaled approximately $3,300,000 and $3,100,000 for the years ended December 31, 2015 and 2014, respectively. The Utility is also required to pay an additional amount to each city equal to ad valorem taxes that would have been payable to each city if such taxes were assessed on the Utility’s real property and improvements. These payments, which are reported as a nonoperating expense on the Utility’s statements of revenues, expenses and changes in net position, totaled approximately $659,000 for both the years ended December 31, 2015 and 2014. The accompanying financial statements present the Utility and its fiduciary funds. (b) Basis of Accounting The financial statements of the Utility are prepared in accordance with accounting principles generally accepted in the United States of America (US GAAP) as applicable to enterprise funds of governmental entities using the economic resources measurement focus and the accrual basis of accounting. An enterprise fund is a proprietary fund type used to account for operations that are financed and operated
Central Arkansas Water
NOTES TO FINANCIAL STATEMENTS December 31, 2015 and 2014
54
NOTE 1: NATURE OF OPERATIONS AND SUMMARY OF SIGNIFICANT ACCOUNTING POLICIES (Continued) (b) Basis of Accounting (Continued) in a manner similar to private business enterprises, where the intent is that the costs, including depreciation, of providing goods or services to the general public on a continuing basis be financed or recovered primarily through user charges. Revenues are recorded when earned and expenses are recorded at the time liabilities are incurred, regardless of the timing of the related cash flows. The Governmental Accounting Standards Board (GASB) is responsible for establishing US GAAP for state and local governments through its pronouncements (Statements and Interpretations). (c) Basis of Presentation
The presentation of the Utility’s financial statements follows the requirements of GASB Statement
No. 34, Basic Financial Statements – and Management’s Discussion and Analysis – for State and Local
Governments – applicable to enterprise funds, as amended (GASB No. 34). In accordance with the
requirements of this standard, the Utility’s net position is categorized into net investment in capital
assets; amounts restricted, yet expendable for the purposes of funding future capital expenditures,
fulfilling bond requirements and refunding consumer deposits; and amounts unrestricted, as applicable.
Net investment in capital assets represents the balance of capital assets, net of accumulated depreciation,
reduced by outstanding bonds or other debt attributable to the acquisition, construction or improvement
of those assets. The restricted component consists of net position, the use of which is restricted to
purposes or time periods specified by individuals or entities external to the Utility, such as creditors,
grantors, contributors, or by laws or regulations. Unrestricted net position includes all other net position
available for operating purposes. In addition, operating revenues and expenses derived from or related directly to providing water supply, treatment and distribution services are distinguished from nonoperating revenues and expenses for purposes of presentation on the Utility’s statements of revenues, expenses and changes in net position. Operating revenues consist primarily of user charges, and operating expenses include the costs of maintaining and operating the water supply, treatment and distribution systems, including depreciation on capital assets. All revenues and expenses not meeting this definition are reported as nonoperating revenues and expenses. When an expense is incurred that can be paid using either restricted or unrestricted resources (net position), the Utility’s policy is to first apply the expense toward restricted resources, if restrictions have been met, and then toward unrestricted resources.
The Utility utilizes fiduciary funds to report assets that are held in a trustee or agency capacity for others and that cannot be used to support the general operations of the Utility. The Utility’s fiduciary funds include the following:
The Other Postemployment Benefits (OPEB) Trust Fund is an employer benefit trust fund used to report the accumulation and use of resources to pay health insurance benefits for eligible retirees, as well as related liabilities for anticipated future benefits.

Central Arkansas Water
NOTES TO FINANCIAL STATEMENTS December 31, 2015 and 2014
55
NOTE 1: NATURE OF OPERATIONS AND SUMMARY OF SIGNIFICANT ACCOUNTING POLICIES (Continued) (c) Basis of Presentation (Continued)
The Brushy Island Public Water Authority Fund (Brushy Island) is a private purpose trust fund used to report assets and liabilities held by the Utility as receiver, pursuant to the terms and conditions of a court order issued in August 2005 by the Third Division Circuit Court of Pulaski County, Arkansas. As receiver, the Utility is responsible for the day‐to‐day and long‐term management and operation of Brushy Island as a water supplier for Brushy Island customers. The Utility is not responsible for or liable for any debts or obligations of Brushy Island, except in its role as receiver. The agreement provides that until such time as the debt is retired, the terms of the order may not be changed without the consent of the Utility.
The transactions and balances of the fiduciary funds are also reported using the economic resources measurement focus and the accrual basis of accounting. (d) Cash and Cash Equivalents For purposes of the presentation on the statements of cash flows, cash and cash equivalents include all restricted and unrestricted cash on hand, demand deposit accounts, money market deposit accounts, money market mutual funds and other short‐term investments and certificates of deposit with original maturities of 3 months or less at the date of purchase. (e) Investments Investments are reported at fair value based on quoted market prices. Purchases and sales of investments are recorded on a trade date basis. Interest income is accrued as it is earned. Investment income includes all interest earned on investments, as well as realized and unrealized gains and losses. (f) Accounts Receivable, Net Accounts receivable include balances due from customers for services or water provided, net of an allowance for uncollectible amounts. Customer deposits may be required when credit is extended to customers. Accounts receivable are ordinarily due 20 days after the billing date. Payments are considered delinquent if not received on or before the due date, and a 10% late charge is assessed. The allowance for uncollectible accounts receivable is estimated by management, taking into consideration the age of outstanding receivables, specific facts and circumstances pertaining to certain customers, customer payment histories and other historical collection statistics. Individual accounts receivable balances are written off for inactive customers at the point when all internal collection attempts have been exhausted. All balances previously written off must be repaid in order for a customer to restore service. (g) Inventory Inventory consists of materials and supplies used in the operation, maintenance and construction of or improvements to capital assets. Amounts in inventory are reported at the lower of cost, determined using the weighted average method, or market.

Central Arkansas Water
NOTES TO FINANCIAL STATEMENTS December 31, 2015 and 2014
56
NOTE 1: NATURE OF OPERATIONS AND SUMMARY OF SIGNIFICANT ACCOUNTING POLICIES (Continued) (h) Capital Assets, Net of Accumulated Depreciation It is generally the Utility’s policy that assets to be used in operations with an initial value or cost greater than or equal to $5,000 and an estimated useful life of greater than one year are reported as capital assets. Capital assets are recorded at historical cost, including all direct salaries, materials and supplies related to construction and improvements completed by Utility personnel. Interest costs related to acquiring or constructing capital assets are also capitalized as part of the cost of the related asset. Contributed assets are recorded at the estimated fair value on the date of contribution. Costs related to major additions and betterments of capital assets are capitalized, while costs of repairs and maintenance that do not add value or extend the useful life of the related asset are expensed as incurred. Depreciation is provided using the straight‐line method over the following estimated useful lives:
Asset Type Years
Water source and mains 75
Buildings and improvements 15 – 40
Land improvements 10 – 20
Purification, pumping and distribution equipment 6 – 20
Other equipment 5 – 20 Management evaluates events or changes in circumstances affecting capital assets to determine whether impairment has occurred. Such events or changes may include physical damage, obsolescence, changes in or new laws or regulations, construction stoppage or environmental factors. If it is determined that an asset is impaired and that impairment is other than temporary, impairment losses are recorded. There were no impairment losses recorded for the years ended December 31, 2015 and 2014. ( i ) Deferred Outflows/Inflows of Resources Deferred outflows and inflows of resources are financial statement elements distinct from assets and liabilities and represent a consumption or production of net position that applies to future periods and so will not be recognized as an outflow or inflow of resources until then. The Utility’s deferred outflows and inflows of resources consist of deferred outflows/inflows of resources related to the Utility’s pension plan activities, as further discussed in Note 10, and the deferred loss and gain, respectively, on debt refunding transactions. A deferred loss or gain on refunding results from the difference in the carrying value of refunded debt and its reacquisition price and is amortized over the shorter of the life of the refunded or refunding debt.

Central Arkansas Water
NOTES TO FINANCIAL STATEMENTS December 31, 2015 and 2014
57
NOTE 1: NATURE OF OPERATIONS AND SUMMARY OF SIGNIFICANT ACCOUNTING POLICIES (Continued) (j) Compensated Absences Utility policies permit employees to earn time off benefits that may be realized in the form of a cash payment or paid time off. A liability for compensated absences and related expense are recognized as the time off benefits are earned by employees using regular pay rates in effect at December 31. (k) Long‐Term Obligations Long‐term obligations are reported net of any applicable premiums or discounts. Premiums and discounts are deferred and amortized over the life of the bonds using the effective interest method. Debt issuance costs, including underwriter fees, are reported as period costs when incurred. ( l ) Due to Other Agencies The Utility acts as billing agent for other public utility service providers. Amounts billed on behalf of these other entities are initially recorded as accounts receivable and a liability due to other agencies, until such time as the amounts are collected and remitted to the appropriate entity. (m) Revenue Recognition Revenues for water supply, treatment and distribution services are recognized in the period during which the related services are provided. Revenues include an estimate of charges for services provided but unbilled at year end. Revenues are reported net of conservation rate discounts totaling approximately $231,000 and $225,000 for the years ended December 31, 2015 and 2014, respectively. (n) Contributions‐in‐Aid of Construction Contributions‐in‐aid of construction include cash and capital assets contributed by customers, developers or other entities to improve or extend the Utility system. (o) Pensions For purposes of measuring the net pension liability, deferred outflows of resources and deferred inflows of resources related to pensions, and pension expense, information about the fiduciary net position of the Arkansas Public Employees Retirement System Plan (APERS Plan) and additions to/deductions from APERS Plan’s fiduciary net position have been determined on the same basis as they are reported by the APERS Plan. For this purposes, benefit payments (including refunds of employee contributions) are recognized when due and payable in accordance with the benefit terms. Investments are reported at fair value. (p) Use of Estimates The preparation of the financial statements in conformity with accounting principles generally accepted in the United States of America requires management to make estimates and assumptions that affect the amounts reported in the financial statements and accompanying notes. Actual results could differ from those estimates. (q) Reclassifications Certain reclassifications have been made to the 2014 balances in order to conform to presentation in the Utility’s 2015 financial statements.
Central Arkansas Water
NOTES TO FINANCIAL STATEMENTS December 31, 2015 and 2014
58
NOTE 1: NATURE OF OPERATIONS AND SUMMARY OF SIGNIFICANT ACCOUNTING POLICIES (Continued) (r) Income Taxes As a special purpose governmental entity, the Utility is exempt from federal and state income taxes. (s) Recently Adopted Accounting Standards GASB Statement No. 68, Accounting and Financial Reporting for Pensions – An Amendment of GASB Statement No. 27, (GASB 68) issued June 2012, as amended by GASB Statement No. 71, Pension Transition for Contributions Made Subsequent to the Measurement Date – an Amendment of GASB Statement No. 68, issued November 2013, became effective for the Utility on January 1, 2015. This statement establishes accounting and financial reporting requirements for pensions that are provided to employees of state and local governmental employers through pension plans that are administered through certain trust agreements, as well as for nonemployer governments that have a legal obligation to contribute to those plans. In addition, this statement establishes standards for measuring and recognizing liabilities, deferred outflows and inflows of resources and related expense. The impact on the accompanying financial statements of the adoption of GASB 68 is further discussed in Note 10 and Note 11. (t) Recently Issued Accounting Standards GASB Statement No. 72, Fair Value Measurement and Application, issued February 2015, will be effective for the Utility on January 1, 2016. This statement establishes accounting and financial reporting requirements related to fair value measurements and provides guidance for applying fair value to certain investments and disclosures related to all fair value measurements. Management of the Utility has not yet determined the impact that adoption of this statement will have on the Utility’s financial statements or related disclosures. GASB Statement No. 74, Financial Reporting for Postemployment Benefit Plans Other Than Pension Plans, issued June 2015, will be effective for the OPEB Trust on January 1, 2017. This statement establishes accounting and financial reporting requirements for OPEB plans. Management of the Utility has not yet determined the impact that adoption of this statement will have on the OPEB Trust’s financial statements or related disclosures. GASB Statement No. 75, Accounting and Financial Reporting for Postemployment Benefits Other than Pensions, issued June 2015, will be effective for the Utility on January 1, 2018. This statement establishes accounting and financial reporting for postemployment benefits other than pensions. Management of the Utility has not yet determined the impact that adoption of this statement will have on the Utility’s financial statements or related disclosures.
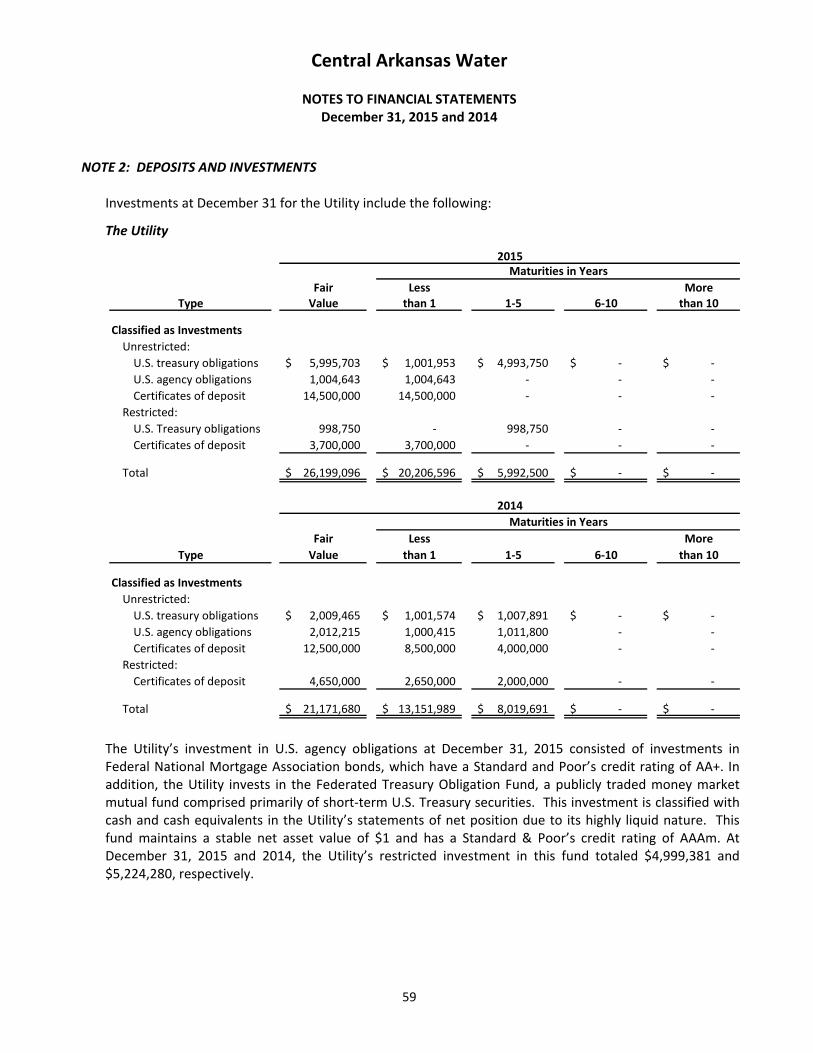
Central Arkansas Water
NOTES TO FINANCIAL STATEMENTS December 31, 2015 and 2014
59
NOTE 2: DEPOSITS AND INVESTMENTS Investments at December 31 for the Utility include the following:
The Utility
Fair Less MoreType Value than 1 1‐5 6‐10 than 10
Classified as Investments
Unrestricted:
U.S. treasury obligations 5,995,703$ 1,001,953$ 4,993,750$ ‐$ ‐$
U.S. agency obligations 1,004,643 1,004,643 ‐ ‐ ‐
Certificates of deposit 14,500,000 14,500,000 ‐ ‐ ‐
Restricted:
U.S. Treasury obligations 998,750 ‐ 998,750 ‐ ‐
Certificates of deposit 3,700,000 3,700,000 ‐ ‐ ‐
Total 26,199,096$ 20,206,596$ 5,992,500$ ‐$ ‐$
Fair Less More
Type Value than 1 1‐5 6‐10 than 10
Classified as Investments
Unrestricted:
U.S. treasury obligations 2,009,465$ 1,001,574$ 1,007,891$ ‐$ ‐$
U.S. agency obligations 2,012,215 1,000,415 1,011,800 ‐ ‐
Certificates of deposit 12,500,000 8,500,000 4,000,000 ‐ ‐
Restricted:
Certificates of deposit 4,650,000 2,650,000 2,000,000 ‐ ‐
Total 21,171,680$ 13,151,989$ 8,019,691$ ‐$ ‐$
Maturities in Years
Maturities in Years
2014
2015
The Utility’s investment in U.S. agency obligations at December 31, 2015 consisted of investments in Federal National Mortgage Association bonds, which have a Standard and Poor’s credit rating of AA+. In addition, the Utility invests in the Federated Treasury Obligation Fund, a publicly traded money market mutual fund comprised primarily of short‐term U.S. Treasury securities. This investment is classified with cash and cash equivalents in the Utility’s statements of net position due to its highly liquid nature. This fund maintains a stable net asset value of $1 and has a Standard & Poor’s credit rating of AAAm. At December 31, 2015 and 2014, the Utility’s restricted investment in this fund totaled $4,999,381 and $5,224,280, respectively.

Central Arkansas Water
NOTES TO FINANCIAL STATEMENTS December 31, 2015 and 2014
60
NOTE 2: DEPOSITS AND INVESTMENTS (Continued) Investments at December 31 for the OPEB Trust include the following:
OPEB Trust
Fair Less MoreType Value than 1 1‐5 6‐10 than 10
Classified as InvestmentsRestricted:U.S. Treasury obligations 248,673$ ‐$ 248,673$ ‐$ ‐$ Certificates of deposit 2,032,537 1,120,611 911,926 ‐ ‐
Exchange traded funds 255,107 255,107 ‐ ‐ ‐
Total 2,536,317$ 1,375,718$ 1,160,599$ ‐$ ‐$
Fair Less MoreType Value than 1 1‐5 6‐10 than 10
Classified as InvestmentsRestricted:U.S. Treasury obligations 348,718$ 100,711$ 248,007$ ‐$ ‐$ Certificates of deposit 1,388,975 647,837 741,138 ‐ ‐ Exchange traded funds 255,187 255,187 ‐ ‐ ‐
Total 1,992,880$ 1,003,735$ 989,145$ ‐$ ‐$
2015Maturities in Years
2014Maturities in Years
(a) Interest Rate Risk Interest rate risk is the risk that changes in interest rates will adversely affect the fair value of an investment. In accordance with its investment policy, the Utility manages its exposure to declines in fair values by limiting investments to securities with a maturity of not more than five years from the date of purchase.
(b) Credit Risk Credit risk is the risk that the issuer or other counterparty will not fulfill its obligations. To minimize exposure to credit risk, the Utility’s investment policy specifies the types of securities in which the Utility may invest. In general, the following investments are considered permissible investments:
direct obligations of the United States government
open end, government obligation money market mutual funds
obligations that are fully guaranteed, secured or insured by United States government agencies, instrumentalities and government‐sponsored entities

Central Arkansas Water
NOTES TO FINANCIAL STATEMENTS December 31, 2015 and 2014
61
NOTE 2: DEPOSITS AND INVESTMENTS (Continued)
(b) Credit Risk (Continued)
repurchase agreements that are fully collateralized by direct obligations of the United States government and general obligations of any state of the United States or political subdivision thereof
general obligations of the states of the United States and of the political subdivisions, municipalities, commonwealths, territories or insular possessions thereof
pre‐funded municipal bonds, the principal and interest of which are fully secured by the principal and interest of a direct obligation of the United States government
revenue bond issues of any state of the United States or any municipality or any political subdivision thereof
(c) Custodial Credit Risk For a deposit or investment, custodial credit risk is the risk that, in the event of the failure of the counterparty, the Utility will not be able to recover the value of the deposits, investments or collateral securities that are in the possession of an outside party. State statutes require the Utility to maintain cash balances on deposit with financial institutions located within the State and that account balances in excess of amounts insured by the Federal Deposit Insurance Corporation (FDIC) be collateralized by the financial institution in accordance with state statutes. All of the Utility’s deposit account balances are fully insured by the FDIC or secured by collateral. All investments are held in the name of the Utility by the Utility’s agent.
(d) Concentration of Credit Risk With the exception of securities that are direct obligations of the U.S. government, deposit accounts that are fully insured by the FDIC or fully collateralized, and money market mutual funds with an underlying investment portfolio that is limited principally to U.S. government obligations, the Utility’s policy states that no more than 20% of the total balance may be invested in any single investment or in securities of a single obligor.
NOTE 3: RESTRICTED ASSETS
Assets restricted to meet the requirements of each of the Utility’s bond ordinances include the following accounts and their related accrued interest receivable:
Bond accounts are maintained to segregate funds that will be used to make debt service payments on each of the Utility’s outstanding bond issues.
Debt service reserve accounts are maintained for each of the Utility’s bond issues and include amounts as stipulated by the underlying bond agreements to ensure the Utility’s ability to meet debt service obligations if revenues are insufficient to do so during a given period. Funding of the debt service reserve accounts is typically based on a percentage of the maximum annual debt service requirements (see Note 7).

Central Arkansas Water
NOTES TO FINANCIAL STATEMENTS December 31, 2015 and 2014
62
NOTE 3: RESTRICTED ASSETS (Continued) Assets restricted for future capital expenditures include the following accounts and their related accrued interest receivable:
Construction accounts include unspent bond proceeds and are maintained for the first three years of each of the Utility’s bond issues to pay construction invoices associated with the capital project funded by the related debt.
The system development charges account serves to recover the cost of capital improvements or facility expansions attributable to new development. New customers are charged a one‐time fee for system development based on meter size.
The capital investment charges account funds the cost of capital improvements or facility expansions associated with treated water transmission and distribution, pumping or storage facilities.
Funds in the depreciation account are used to recover cost associated with the replacement of capital assets. A flat percentage of operating revenues are transferred to the account each month.
The consumer deposits account includes funds accumulated through the collection of deposits during the process of establishing new services. Residential account deposits are automatically refunded and applied to the account balance after 12 months of service if the account is in good standing.
Balances in these restricted accounts at December 31 are as follows:
2015 2014
Bond requirements 5,786,770$ 5,224,280$
Future capital expenditures 1,948,249 1,538,134
Consumer deposits 3,713,381 3,610,815
Total Restricted Assets 11,448,400$ 10,373,229$
NOTE 4: ACCOUNTS RECEIVABLE ‐ CONSUMERS, NET
Accounts receivable ‐ consumers, net includes amounts due from Utility customers for water sales and other related services provided, net of an allowance for uncollectible amounts, as well as amounts due from customers of other entities for which the Utility serves as billing agent. These amounts are as follows at December 31:
2015 2014
Water sales and services 4,887,407$ 4,389,028$
Billed for other agencies 6,021,918 5,774,558
Less allowance for doubtful accounts (204,876) (186,317)
Total Accounts Receivable ‐ Consumers, Net 10,704,449$ 9,977,269$

Central Arkansas Water
NOTES TO FINANCIAL STATEMENTS December 31, 2015 and 2014
63
NOTE 5: BOARD DESIGNATED ASSETS
Board designated assets include resources set aside by the Board for specified purposes, as follows: (a) Rate Stabilization Trust The rate stabilization trust was established by Resolution 2010‐03 for the purpose of minimizing or leveling rate increases and providing additional cash for operations during revenue shortfall years. Deposits into this account may be made at the discretion of the Board of Commissioners; however, the balance may not exceed $20 million. Funds may be withdrawn and used for any lawful purpose. (b) Watershed Protection Trust The Watershed Protection Trust was established by Resolution 2008‐05 to fund the Watershed Management Program, which includes land purchases, water quality monitoring and other measures deemed necessary to protect the water supply in the Lake Maumelle Watershed area from potential sources of pollution. The Utility’s customers are charged a flat monthly rate for Watershed protection based on meter size. Balances in these accounts are as follows at December 31:
2015 2014
Rate stabilization 8,073,415$ 8,040,881$ Watershed protection 1,589,400 2,296,683
Total Board Designated Assets 9,662,815$ 10,337,564$
The board designated assets were reported on the statements of net position in the following classifications at December 31:
2015 2014
Cash and cash equivalents 1,165,315$ 3,837,564$
Investments 8,497,500 6,500,000
Total Board Designated Assets 9,662,815$ 10,337,564$

Central Arkansas Water
NOTES TO FINANCIAL STATEMENTS December 31, 2015 and 2014
64
NOTE 6: CAPITAL ASSETS A summary of changes in capital asset balances that occurred during the years ended December 31, 2015 and 2014 follows:
Balance Transfers, Balance
12/31/2014 Additions Disposals Net 12/31/2015
Capital Assets,
Non‐depreciable
Land and land use rights 46,192,915$ 1,293,864$ ‐$ 1,520$ 47,488,299$ Construction in progress 2,150,054 11,102,008 ‐ (4,372,018) 8,880,044
Total capital assets,
Non‐depreciable 48,342,969 12,395,872 ‐ (4,370,498) 56,368,343
Capital Assets, Depreciable
Buildings and
improvements 60,806,083 110,688 ‐ ‐ 60,916,771
Land improvements 2,253,459 5,624 ‐ ‐ 2,259,083
Water source 33,211,941 ‐ ‐ ‐ 33,211,941
Purification 42,180,124 168,732 ‐ 100,741 42,449,597
Pumping 26,233,796 13,969 ‐ 162,251 26,410,016
Distribution 335,078,600 852,972 (397,096) 4,086,585 339,621,061
Other equipment 28,573,745 893,489 (364,316) 20,921 29,123,839
Total capital assets,
depreciable 528,337,748 2,045,474 (761,412) 4,370,498 533,992,308
Less Accumulated
Depreciation
Buildings and
improvements 23,545,287 1,487,451 ‐ ‐ 25,032,738
Land improvements 187,745 113,235 ‐ ‐ 300,980
Water source 13,572,330 547,224 ‐ ‐ 14,119,554
Purification 17,084,156 1,600,272 ‐ ‐ 18,684,428
Pumping 14,872,262 719,669 ‐ ‐ 15,591,931
Distribution 89,825,495 5,631,900 (379,513) ‐ 95,077,882
Other equipment 24,324,995 1,147,578 (364,316) ‐ 25,108,257
Total accumulated
depreciation 183,412,270 11,247,329 (743,829) ‐ 193,915,770
Total Capital Assets, Net 393,268,447$ 3,194,017$ (17,583)$ ‐$ 396,444,881$

Central Arkansas Water
NOTES TO FINANCIAL STATEMENTS December 31, 2015 and 2014
65
NOTE 6: CAPITAL ASSETS (Continued)
Balance Transfers, Balance
12/31/2013 Additions Disposals Net 12/31/2014
Non‐depreciable
Land and land use rights 46,032,162$ 160,713$ ‐$ 40$ 46,192,915$
Construction in progress 21,527,876 10,640,264 ‐ (30,018,086) 2,150,054
Total capital assets,
Non‐depreciable 67,560,038 10,800,977 ‐ (30,018,046) 48,342,969
Capital Assets, Depreciable
Buildings and
improvements 49,154,620$ 161,500$ ‐$ 11,489,963$ 60,806,083$
Land improvements 1,478,894 ‐ ‐ 774,565 2,253,459
Water source 32,927,318 284,623 ‐ ‐ 33,211,941
Purification 37,518,831 45,677 ‐ 4,615,616 42,180,124
Pumping 25,796,891 42,767 ‐ 394,138 26,233,796
Distribution 323,590,447 (11,310) (477,306) 11,976,769 335,078,600
Other equipment 27,139,956 1,014,074 (347,280) 766,995 28,573,745
Total capital assets,
depreciable 497,606,957 1,537,331 (824,586) 30,018,046 528,337,748
Less Accumulated
Depreciation
Buildings and
improvements 22,186,612 1,358,675 ‐ ‐ 23,545,287
Land improvements 103,991 83,754 ‐ ‐ 187,745
Water source 13,025,096 547,234 ‐ ‐ 13,572,330
Purification 15,609,363 1,474,793 ‐ ‐ 17,084,156
Pumping 14,130,994 741,268 ‐ ‐ 14,872,262
Distribution 84,791,800 5,486,895 (453,200) ‐ 89,825,495
Other equipment 23,566,613 1,094,311 (335,929) ‐ 24,324,995
Total accumulated
depreciation 173,414,469 10,786,930 (789,129) ‐ 183,412,270
Total Capital Assets, Net 391,752,526$ 1,551,378$ (35,457)$ ‐$ 393,268,447$
Capital Assets,
NOTE 7: LONG‐TERM DEBT
The Utility’s long‐term debt includes the following:
(a) Revenue Bonds 2007 Water Revenue Bonds
The Series 2007 Bonds were issued in July 2007 to finance the cost of certain capital improvements to the water system, to establish a debt service reserve for the Series 2007 Bonds and to pay the costs of issuing the Series 2007 Bonds. The Series 2007 Bonds are special obligations of the Utility, payable solely from the net revenues of the water system. Principal payments are due annually on October 1 beginning in 2008, with the final payment scheduled in 2027. Interest payments are due semiannually on April 1 and October 1.

Central Arkansas Water
NOTES TO FINANCIAL STATEMENTS December 31, 2015 and 2014
66
NOTE 7: LONG‐TERM DEBT (Continued)
(a) Revenue Bonds (Continued) 2010A Water Revenue Bond
The Series 2010A Bond was issued to replace the then outstanding Series 2009 Bond. The Series 2010A Bond was issued to change terms, particularly the requirement for security for the outstanding debt. The bond was issued through the Arkansas Natural Resources Commission (ANRC) and the Arkansas Development Finance Authority (ADFA) from monies in the Drinking Water State Revolving Fund Account (Revolving Loan Fund), created by Arkansas Code Annotated Section 15‐22‐1102 to finance the cost of planning, design, construction, and/or rehabilitation of the treatment facilities of the water system, paying cost incidental thereto and paying approved expenses incurred in connection with the issuance of the bond. The Series 2010A Bond is a special obligation of the Utility, payable solely from stabilized net revenues of the water system, as defined in the related bond agreements. Principal and interest payments are due semi‐annually on April 15 and October 15, with the final payment scheduled in 2032.
2010C Water Revenue Bonds
The Series 2010C Bonds were issued to refinance a portion of the cost of acquisition of approximately 915 acres of real property within the Lake Maumelle watershed, to establish a debt service reserve for the Series 2010C Bonds and to pay the costs of issuing the Series 2010C Bonds. The Series 2010C Bonds are special obligations of the Utility, payable solely from stabilized net revenues of the water system, as defined in the related bond agreements. Principal payments are due annually on October 1, with the final payment date due in 2023. Interest payments are due semiannually on April 1 and October 1.
2011A Water Revenue Bond
The Series 2011A Bond was issued through the ANRC and the ADFA from monies in the Revolving Loan Fund to finance the cost of planning, design, construction, and/or rehabilitation of the treatment facilities of the water system, paying cost incidental thereto, and paying approved expenses incurred in connection with the issuance of the bond. The Series 2011A Bond is a special obligation of the Utility, payable solely from the stabilized net revenues of the water system, as defined in the related bond agreements. Principal and interest payments are due semi‐annually on April 15 and October 15, with the final payment scheduled in 2034.
2011B Refunding Water Revenue Bonds
The Series 2011B Bonds were issued to refund the then outstanding Series 2002 Bonds. The difference between the reacquisition price and the net carrying amount of the refunded bonds of $794,919 is reported as a deferred outflow of resources in the statements of net position and is being charged to operations through the year 2022 using the straight‐line method. The Series 2011B Bonds are special obligations of the Utility, payable solely from the stabilized net revenues of the water system, as defined in the related bond agreements. Principal and interest payments are due semi‐annually on April 15 and October 15, with the final payment scheduled in 2022.

Central Arkansas Water
NOTES TO FINANCIAL STATEMENTS December 31, 2015 and 2014
67
NOTE 7: LONG‐TERM DEBT (Continued)
(a) Revenue Bonds (Continued) 2012A Water Revenue Bonds
The Series 2012A Bonds were issued to finance the cost of certain capital improvements to the water system, to pay the then outstanding balance on a capital lease obligation, to establish a debt service reserve for the Series 2012A Bonds and to pay the cost of issuing the Series 2012A Bonds. The Series 2012A Bonds are special obligations of the Utility, payable solely from stabilized revenues of the water system, as defined in the related bond agreements. Principal payments are due annually on October 1, with the final payment scheduled in 2032. Interest payments are due semiannually on April 1 and October 1. 2014 Refunding Water Revenue Bonds
The Series 2014 Bonds were issued to refund the then outstanding Series 2004 Bonds. The difference between the reacquisition price and the net carrying amount of the refunded bonds of $236,657 is reported as a deferred inflow of resources in the statements of net position and is being amortized through the year 2024 using the straight‐line method. The Series 2014 Bonds are special obligations of the Utility, payable solely from the stabilized net revenues of the water system, as defined in the related bond agreements. Principal and interest payments are due semi‐annually on April 1 and October 1, with the final payment scheduled in 2024. 2015 Refunding Water Revenue Bonds
On August 1, 2015, the Utility issued $7,445,000 of revenue refunding bonds to refund the then outstanding Series 2010B Bonds. The difference between the reacquisition price and the net carrying amount of the refunded bonds of $30,177 is reported as a deferred outflow of resources in the statements of net position and is being amortized through the year 2030 using the straight‐line method. The Series 2015 Bonds are special obligations of the Utility, payable solely from the stabilized net revenues of the water system, as defined in the related bond agreements. Principal and interest payments are due semi‐annually on April 1 and October 1 beginning in 2015, with the final payment scheduled in 2030. The current refunding reduced total debt service payments over the next 15 years by approximately $710,000. This results in an economic gain (difference between the present values of the debt service payments on the old and new debt) of approximately $570,000. Frazier Pike/ANRC Bond Payable
During 2015, the Utility began providing water to an unincorporated area along Frazier Pike in Pulaski County, Arkansas that had previously relied upon well water. The Frazier Pike community was the recipient of funding provided by ANRC including a Water Development Bond that the Utility assumed totaling $250,000. Principal and interest payments are due annually on December 1 beginning in 2017, and are to be paid through a debt service charge assessed the Frazier Pike customers. The bond is secured solely by a lien on and pledge of the Frazier Pike water surcharge, as defined in the related bond agreements. In conjunction with providing water service to Frazier Pike customers, the Utility acquired capital assets totaling approximately $850,000.

Central Arkansas Water
NOTES TO FINANCIAL STATEMENTS December 31, 2015 and 2014
68
NOTE 7: LONG‐TERM DEBT (Continued)
(b) Mid‐Arkansas Water Alliance Water Storage Allocation Purchase Agreement The Utility is party to an agreement with Mid‐Arkansas Water Alliance (MAWA), along with 9 other municipal water providers, to purchase a portion of the water storage rights at Greers Ferry Lake allocated to MAWA by the U.S. government. The Utility and each of the nine other parties to the agreement have been allocated a portion of the debt incurred by MAWA to acquire the storage rights, based on each party’s respective share of the total storage area. The initial amount of the debt allocated to the Utility totaled $284,623, and annual payments of $17,155 are required, including interest at a variable rate determined by the Secretary of the Treasury (4.125% at December 31, 2015 and 2014). The amortization period of the debt depends upon actual repayments of all parties to the agreement and may vary; however, at December 31, 2015, there were 18 payments remaining, resulting in a final payment due in 2033.
(c) Other Long‐Term Obligations The Utility acquired conservation land easements totaling approximately $893,000 during 2015 that were partially financed through notes payable. The balances outstanding at December 31, 2015 totaled approximately $633,000 and are payable in annual installments through 2017. Changes in long‐term debt for the years ended December 31, 2015 and 2014, are as follows:
Balance Balance Amounts Amounts Due
December 31, December 31, Due Within Greater Than
2014 Increases Decreases 2015 One Year One YearBonds Payable
Bonds payable 77,980,244$ 7,695,000$ (12,230,399)$ 73,444,845$ 5,201,739$ 68,243,106$
Add issuance premiums 2,617,429 87,382 (262,812) 2,441,999 ‐ 2,441,999
Bonds Payable, Net 80,597,673 7,782,382 (12,493,211) 75,886,844 5,201,739 70,685,105
Other Long‐term Obligations 368,598 634,007 (154,950) 847,655 399,882 447,773
Consumer Deposits 3,585,061 1,133,078 (998,145) 3,719,994 994,831 2,725,163
Total Long‐Term Debt 84,551,332$ 9,549,467$ (13,646,306)$ 80,454,493$ 6,596,452$ 73,858,041$
Balance Balance Amounts Amounts Due
December 31, December 31, Due Within Greater Than
2013 Increases Decreases 2014 One Year One Year
Bonds payable
Bonds payable 83,482,529$ 12,586,519$ (18,088,804)$ 77,980,244$ 4,875,400$ 73,104,844$
Add issuance premiums 1,443,119 1,696,942 (522,632) 2,617,429 ‐ 2,617,429
Bonds Payable, Net 84,925,648 14,283,461 (18,611,436) 80,597,673 4,875,400 75,722,273
Other Long‐term Obligations 517,158 ‐ (148,560) 368,598 154,621 213,977
Consumer Deposits 3,452,085 1,066,885 (933,909) 3,585,061 903,306 2,681,755
Total Long‐Term Debt 88,894,891$ 15,350,346$ (19,693,905)$ 84,551,332$ 5,933,327$ 78,618,005$

Central Arkansas Water
NOTES TO FINANCIAL STATEMENTS December 31, 2015 and 2014
69
NOTE 7: LONG‐TERM DEBT (Continued) Bonds payable at December 31, 2015, include the outstanding principal balance of the following revenue bond issues:
Interest Final Original TotalRates Maturity Issue Outstanding
2007 Water revenue bonds 4.75% 2027 17,625,000$ 12,565,000$
2010A Water revenue bond 1.00% (1) 2032 13,400,000 11,713,701
2010C Water revenue bonds 2.0% ‐ 4.0% 2030 8,830,000 3,040,000
2011A Water revenue bond 2.25% (1) 2034 4,000,000 3,781,144
2011B Refunding water revenue bonds 2.5% ‐ 4.0% 2022 13,500,000 9,160,000
2012A Water revenue bonds 2.0% ‐ 4.0% 2032 17,515,000 15,405,000
2014 Refunding water revenue bonds 2.0% ‐ 5.0% 2024 10,850,000 10,085,000
2015 Refunding water revenue bonds 2.0% ‐ 3.0% 2030 7,445,000 7,445,000
Frazier Pike/ANRC bond 3.90% 2033 250,000 250,000
93,415,000$ 73,444,845$
(1) In addition to interest, the Utility is required to pay a 1.00% service fee.
The following schedule shows the annual debt service of the bonds payable outstanding at December 31, 2015:
Fiscal Year Principal Interest Total
2016 5,201,739$ 2,398,280$ 7,600,019$
2017 5,394,434 2,214,710 7,609,144
2018 5,561,993 2,046,716 7,608,709
2019 5,734,976 1,861,738 7,596,714
2020 5,903,398 1,702,004 7,605,402
2021‐2025 25,519,432 5,407,168 30,926,600
2026‐2030 15,302,442 1,900,723 17,203,165
2031‐2034 4,826,431 218,979 5,045,410
73,444,845$ 17,750,316$ 91,195,161$
Payment of principal and interest on all bonds except the Frazier Pike/ANRC bond is secured by a pledge of Utility revenues. The 2010A, 2010C, 2011A, 2011B, 2012A, 2014 and 2015 Water Revenue Bonds are subordinate to the 2007 Water Revenue Bonds.
Parity debt may be issued by the Utility provided that there is no event of default and net revenues for the immediately preceding two calendar years exceed an amount equal to not less than the sum of (a) 120% of the average annual debt service of all outstanding debt, and (b) the maximum annual debt service on the proposed parity debt.

Central Arkansas Water
NOTES TO FINANCIAL STATEMENTS December 31, 2015 and 2014
70
NOTE 7: LONG‐TERM DEBT (Continued)
The terms of the bond agreements impose certain restrictive covenants on the Utility. Generally, the Utility is required to establish and maintain water rates to provide net revenues in each fiscal year at least equal to the sum of (a) 120% of the aggregate debt service, excluding amounts payable on repayment obligations, for the forthcoming fiscal year, (b) 100% of the repayment obligations, if any, which will be due and payable during the forthcoming fiscal year and (c) 100% of the amounts, if any, required by the indenture to be deposited into the debt service reserve account during the forthcoming fiscal year. In addition, the Utility must establish and maintain debt service reserve accounts as follows:
Senior debt ‐ the lesser of (a) 10% of the original principal amount outstanding, (b) maximum annual debt service or (c) 125% of average annual debt service Subordinate debt – the lesser of (a) 5% of the original principal amount outstanding or (b) 50% of maximum annual debt service
The Utility is also required to maintain working capital in an amount sufficient to ensure efficient operation and maintenance of the water system, and such reserve must not be less than an amount reasonably estimated to pay the operations and maintenance costs of the water system for the next 3 calendar months. The Utility was in compliance with all debt covenants for the years ended December 31, 2015 and 2014. (d) Unearned Revenue The Utility entered into a long term lease agreement with the Arkansas State Game and Fish Commission in 2013. Payments received are reported as unearned revenue and are recognized as operating revenue over the term of the 99 year agreement. The final payment, due in 2015, has been reported as other receivable at December 31, 2015.
NOTE 8: RISK MANAGEMENT The Utility has commercial insurance to cover various potential risk areas including automobile liability, theft or destruction of business assets, directors’ and officers’ liability, employment practices liability, and crime. Settled claims have not exceeded this commercial coverage in any of the three preceding years. Under state law the Utility is protected by tort immunity. The Utility is self‐insured for a portion of its exposure to risk of loss from work‐related employee injuries and illnesses (workers’ compensation) up to $400,000 per occurrence for employees with a maximum liability coverage of $1,000,000. All full‐time employees are covered by the plan.

Central Arkansas Water
NOTES TO FINANCIAL STATEMENTS December 31, 2015 and 2014
71
NOTE 9: COMMITMENTS AND CONTINGENCIES
(a) Construction Contracts The Utility had commitments totaling approximately $1,276,000 and $432,000 at December 31, 2015 and 2014, respectively, for construction contracts. Certain contracts related to these commitments include a provision for the retainage of a portion of the fees on the work completed to date. Retainage payable related to these contracts included in the statements of net position totaled approximately $123,000 and $10,000 at December 31, 2015 and 2014, respectively. These amounts will be paid upon completion and inspection of the facilities.
(b) Other Support funded by government grants is recognized as the Utility performs the contracted services or incurs outlays eligible for reimbursement under the grant agreements. Grant activities and outlays are subject to audit and acceptance by the granting agency and, as a result of such audit, adjustments could be required. In the opinion of the Utility’s management, such adjustments, if any, will not be significant to the Utility’s financial statements.
NOTE 10: PENSIONS AND OTHER POST‐EMPLOYMENT BENEFITS
(a) Arkansas Public Employees Retirement System Plan Description. The Utility contributes to the Arkansas Public Employees Retirement System Plan (APERS Plan), which is a cost‐sharing multiple‐employer defined benefit plan created by the Arkansas Legislature. The APERS Plan provides retirement and disability benefits, annual cost of living adjustments and death benefits to plan members and beneficiaries. Benefits are fully vested upon reaching five years of service and are established by state statute. Benefits of the APERS members are calculated on the basis of age, final average salary, years of service and a benefit factor. Authority to establish and amend benefits is provided by state statute.
Contributions. Plan members hired after July 1, 2005, are required to contribute 5.00% of their annual covered salary, and the Utility is required to contribute a percent of covered salary at an actuarially determined rate. The contributions are deducted from the employee’s wages or salary and remitted by the Utility to the APERS Plan on a semi‐monthly basis. The employer contribution rates applicable were 14.88% (July 1, 2013 to June 30, 2014); 14.76% (July 1, 2014 to June 30, 2015) and 14.50% (July 1, 2015 to December 31, 2015). The contribution requirements of plan members and the Utility are established and may be amended by the APERS Board of Trustees. The Utility’s contributions for the years ending December 31, 2015, 2014 and 2013 were $2,479,699, $2,466,274 and $2,386,830, respectively, which were equal to the required contributions for each year.
Pension Liabilities, Pension Expense, Deferred Outflows of Resources, and Deferred Inflows of Resources Related to Pensions. At December 31, 2015, the Utility reported a liability of $17,301,107 for its proportionate share of the net pension liability. The net pension liability was measured as of June 30, 2015, and the total pension liability used to calculate the net pension liability was determined by an actuarial valuation as of that date. The Utility’s proportion of the net pension liability was based on a projection of the Utility’s long‐term share of contributions to the pension plan relative to the projected contributions of all participating entities, actuarially determined. At December 31, 2015, the Utility’s proportion was 0.94%.

Central Arkansas Water
NOTES TO FINANCIAL STATEMENTS December 31, 2015 and 2014
72
NOTE 10: PENSIONS AND OTHER POST‐EMPLOYMENT BENEFITS (Continued)
(a) Arkansas Public Employees Retirement System (Continued) Contributions payable to APERS at December 31, 2015 totaled approximately $86,000 and is included in payroll and related liabilities in the statements of net position.
For the year ended December 31, 2015, the Utility recognized the actuarially determined pension expense of approximately $2,127,000. At December 31, 2015, the Utility reported deferred outflows of resources and deferred inflows of resources related to pensions from the following sources:
Deferred
Outflows of
Resources
Deferred Inflows
of Resources
Changes of assumptions 2,553,275$ ‐$
Changes in proportion and differences between employer
contributions and proportionate share of contributions 270,017 ‐
Differences between expected and actual experience ‐ 1,134,234
Net difference between projected and actual investment
earnings on pension plan investments ‐ 858,393
Contributions to the plan not recognized in pension expense 343,779 ‐
Utility contributions subsequent to the measurement date 1,223,328 ‐
Total 4,390,399$ 1,992,627$
The $1,223,328 of deferred outflows of resources resulting from the Utility’s contributions subsequent to the measurement date will be recognized as a reduction of the net pension liability in the year ended December 31, 2016. Amounts reported as deferred outflows of resources and deferred inflows of resources will be recognized in pension expense as follows:
Year ending December 31,
2016 1,334,350$
2017 111,022
2018 (46,813)
2019 954,555
2020 44,658
Thereafter ‐
Actuarial Assumptions. The total pension liability in the June 30, 2015 actuarial valuation was determined using the following assumptions, applied to all periods included in the measurement:
Inflation 2.50% Salary increases 3.95% – 9.85% including inflation Investment rate of return 7.50%
Mortality rates were based on the RP‐2000 Combined Healthy mortality table, projected to 2020 using Projection Scale BB, set‐forward two years for males and one year for females.

Central Arkansas Water
NOTES TO FINANCIAL STATEMENTS December 31, 2015 and 2014
73
NOTE 10: PENSIONS AND OTHER POST‐EMPLOYMENT BENEFITS (Continued)
(a) Arkansas Public Employees Retirement System (Continued) The long‐term expected rate of return on pension plan investments was determined using a building‐block method in which best‐estimate ranges of expected future real rates of return (expected returns, net of pension plan investment expense and inflation) are developed for each major asset class. These ranges are combined to produce the long‐term expected rate of return by weighting the expected future real rates of return by the target asset allocation percentage and by adding expected inflation. Best estimates of arithmetic real rates of return for each major asset class included in the APERS Plan’s target asset allocation as of June 30, 2015, are summarized in the table below:
Asset Class
Target
Allocation
Long‐Term
Expected Real
Rate of Return
Broad Domestic Equity 42% 6.82%
International Equity 25% 6.88%
Real Assets 12% 3.07%
Absolute Return 5% 3.35%
Domestic Fixed 16% 0.83%
Total 100%
Discount Rate. The discount rate used to measure the total pension liability was 7.50%. The projection of cash flows used to determine the discount rate assumed that employee contributions will be made at the current contribution rate and that employer contributions will be made at rates equal to the difference between the actuarially determined contribution rates and the member rate. Based on these assumptions, the pension plan’s fiduciary net position was projected to be available to make all projected future benefit payments of current plan members. Therefore, the long‐term expected rate of return on pension plan investments was applied to all periods of projected benefit payments to determine the total pension liability.
Sensitivity of the Utility’s Proportionate Share of the Net Pension Liability to Changes in the Discount Rate. The following presents the Utility’s proportionate share of the net pension liability calculated using the discount rate of 7.50%, as well as what the Utility’s proportionate share of the net pension liability would be if it were calculated using a discount rate that is 1 percentage point lower (6.50%) or 1 percentage point higher (8.50%) than the current rate:
Discount Rate
Utility's
Proportionate
Share of Net
Pension Liability
1% decrease 6.50% 28,499,387$
Current discount rate 7.50% 17,301,107$
1% increase 8.50% 7,988,076$

Central Arkansas Water
NOTES TO FINANCIAL STATEMENTS December 31, 2015 and 2014
74
NOTE 10: PENSIONS AND OTHER POST‐EMPLOYMENT BENEFITS (Continued)
(a) Arkansas Public Employees Retirement System (Continued) Plan Fiduciary Net Position. Detailed information about the APERS Plan’s fiduciary net position is available in the separately issued APERS Plan financial report, which may be obtained by making a written request at 124 West Capitol Avenue, Suite 400, Little Rock, Arkansas 72201 or by calling 501‐682‐7800 or 800‐682‐7377.
(b) IRS Section 401(a) An Employee Savings Plan under IRS Code 401(a) established by Little Rock Municipal Water Works was transferred to the Utility on July 1, 2001. Employee participation in this plan is mandatory. At December 31, 2015, there were 283 plan members. Plan members are required to contribute 1% of covered salary. Plan provisions and contribution requirements, including any matching contributions by the Utility, are established and may be amended by the Utility’s Board of Commissioners. Total plan member contributions and the Utility’s matching contributions were approximately $173,000 and $169,000 for the years ended December 31, 2015 and 2014, respectively.
(c) Other Post‐Employment Benefits General The Utility sponsors and administers a single‐employer defined benefit healthcare plan providing medical insurance benefits for retirees meeting all of the following eligibility requirements:
• The retiree must have been hired by the Utility on or before December 31, 2009.
• The retiree must have 20 years or more of continuous service with the Utility.
• The retiree must be receiving retirement benefits from APERS.
• The retiree must not obtain full‐time employment elsewhere.
• If the retiree is eligible for Medicare, the retiree must carry and pay for both Parts A and B Medicare coverage.
Assets of the plan are held in the OPEB Trust and may only be used to pay expenses associated with administration of the plan and healthcare benefits for participating retirees. Arkansas Municipal League serves as Trust Administrator. Financial statements and required schedules of the plan are not publicly available in a stand‐alone financial report; therefore, the Utility includes the financial statements of the plan and all required disclosures and schedules in this report. At December 31, 2015, there were 83 retirees receiving health care benefits under the plan.

Central Arkansas Water
NOTES TO FINANCIAL STATEMENTS December 31, 2015 and 2014
75
NOTE 10: PENSIONS AND OTHER POST‐EMPLOYMENT BENEFITS (Continued)
(c) Other Post‐Employment Benefits (Continued) Contributions, Benefits and Funding Policy The contribution requirements of and benefits available to plan members are established by the Utility and may be amended as deemed necessary. At present, the Utility will contribute amounts necessary to pay healthcare premiums for single coverage of eligible retirees as described in the paragraphs that follow. In the event that a retiree obtains full‐time employment elsewhere or obtains coverage under another group health plan, the Utility will discontinue coverage of that retiree under this plan. If an employee meets the eligibility requirements described above and retires upon reaching age 65, the Utility pays 100% of single member coverage under either a) the Utility’s group health plan or b) a Medicare supplement selected by the Utility, according to the following guidelines based upon years of service:
Eligible retirees who have completed at least 20 years of continuous service prior to January 1, 2010, are provided coverage under the same group health plan provided to active employees.
Eligible retirees who have completed less than 20 years of continuous service prior to January 1, 2010, are provided coverage under a Medicare supplement selected by the Utility.
If an employee meets the eligibility requirements described above, but retires before reaching age 65, the employee may receive early retiree healthcare benefits under the same group health plan provided to active employees until he or she is eligible for Medicare benefits. The Utility may pay up to 100% of the single coverage premiums for those eligible for early retiree healthcare benefits until the sooner of the date the employee reaches age 65 or the period of years set forth below:
For those employees with at least 15 years of continuous service as of January 1, 2010, who later retire and meet the eligibility requirements described above, the Utility will pay early retiree healthcare premiums as follows:
Years of Continuous
Service upon
Retirement
Years of Early Retiree
Healthcare Premiums
Paid by the Utility
At least 20 3
At least 25 4
At least 30 5

Central Arkansas Water
NOTES TO FINANCIAL STATEMENTS December 31, 2015 and 2014
76
NOTE 10: PENSIONS AND OTHER POST‐EMPLOYMENT BENEFITS (Continued)
(c) Other Post‐Employment Benefits (Continued) Contributions, Benefits and Funding Policy (Continued)
For employees with at least 10 years and less than 15 years of continuous service as of January 1, 2010, who later retire and meet the eligibility requirements described above, the Utility will pay early retiree healthcare premiums as follows:
Years of
Continuous
Service upon 50% by the Utility and
Retirement 100% by the Utility 50% by the Retiree
At least 20 2 1
At least 25 3 1
At least 30 4 1
Years of Early Retiree Healthcare Premiums Paid
For employees with less than 10 years of continuous service as of January 1, 2010, who later retire and meet the eligibility requirements described above, the Utility will pay early retiree healthcare premiums as follows:
Years of
Continuous
Service upon 50% by the Utility and
Retirement 100% by the Utility 50% by the Retiree
At least 20 1 1
At least 25 2 1
At least 30 3 1
Years of Early Retiree Healthcare Premiums Paid
Employees hired on or after January 1, 2010, are not entitled to retiree healthcare benefits, except as provided by Arkansas Statute, which requires that any Utility employee vested in APERS benefits who is at least age 55 and has completed 20 years of service may continue to receive the same medical benefits as active employees, provided the retiree pays the full premium amount. Annual OPEB Cost and Net OPEB Obligation The Utility’s annual OPEB cost is calculated based on the annual required contribution (ARC) of the employer, an amount actuarially determined that represents a level of funding that, if paid on an ongoing basis, is projected to cover normal cost for each year and amortize any unfunded actuarial liabilities (or funding excess) over a period not to exceed 30 years.

Central Arkansas Water
NOTES TO FINANCIAL STATEMENTS December 31, 2015 and 2014
77
NOTE 10: PENSIONS AND OTHER POST‐EMPLOYMENT BENEFITS (Continued)
(c) Other Post‐Employment Benefits (Continued) Annual OPEB Cost and Net OPEB Obligation (Continued) The following table shows the components of the Utility’s annual OPEB cost for the years ended December 31, 2015, 2014 and 2013, the amount actually contributed to the plan and changes in the Utility’s net OPEB obligation:
2015 2014 2013
Annual required contribution 710,052$ 697,607$ 678,354$
Interest on net OPEB obligation ‐ ‐ ‐
Adjustment to actuarial required contribution ‐ ‐ ‐
Annual OPEB cost 710,052 697,607 678,354
Contributions made 710,052 697,607 678,354
Net OPEB obligation – beginning of year ‐ ‐ ‐
Net OPEB obligation – end of year ‐$ ‐$ ‐$
The Utility’s annual OPEB cost, the percentage of annual OPEB cost contributed to the plan, and the net OPEB obligation for 2015 and the two preceding years are as follows:
Amount
Contributed
12/31/2015 $ 710,052 $ 710,052 100% $ ‐
12/31/2014 $ 697,607 $ 697,607 100% $ ‐
12/31/2013 $ 678,354 $ 678,354 100% $ ‐
Percentage of
Annual OPEB
Cost
Contributed
Net OPEB
Obligation
Fiscal Year
Ended
Annual OPEB
Cost
Funded Status and Funding Progress As of December 31, 2015, the most recent actuarial valuation date, the actuarial accrued liability (AAL) for benefits was $11,647,189, and the actuarial value of assets was $3,410,597, resulting in an unfunded actuarial accrued liability (UAAL) of $8,236,592 and a funded ratio of 29.3%. At December 31, 2015, the covered payroll (annual payroll of active employees who may eventually receive benefits covered by the plan) was $16,482,337, and the ratio of the UAAL to the covered payroll was 50.0%.

Central Arkansas Water
NOTES TO FINANCIAL STATEMENTS December 31, 2015 and 2014
78
NOTE 10: PENSIONS AND OTHER POST‐EMPLOYMENT BENEFITS (Continued)
(c) Other Post‐Employment Benefits (Continued) Funded Status and Funding Progress (Continued) The schedule of funding progress, presented as required supplementary information following the notes to the financial statements, presents multiyear trend information about whether the actuarial values of plan assets are increasing or decreasing over time relative to the actuarial accrued liabilities for benefits. The schedule of employer contributions, also presented as required supplementary information following the notes to the financial statements, presents trend information about the amounts contributed to the plan by the Utility in comparison to the annual required contribution (ARC).
Actuarial Methods and Assumptions Actuarial valuations of an ongoing plan involve estimates of the value of reported amounts and assumptions about the probability of occurrence of events far into the future. Examples include assumptions about future employment, mortality and the healthcare cost trends. Actuarially determined amounts are subject to continual revision as actual results are compared with past expectations and new estimates are made about the future.
Projections of benefits for financial reporting purposes are based on the substantive plan (the plan as understood by the employer and the plan members) and includes the types of benefits provided at the time of each valuation and the historical pattern of sharing of benefit costs between the employer and plan members to that point. The actuarial methods and assumptions used include techniques that are designed to reduce the effects of short‐term volatility in actuarial accrued liabilities and the actuarial value of assets, consistent with the long term perspective of the calculations. In the December 31, 2015 actuarial valuation, the projected unit credit method was used. The actuarial assumptions included a discount rate of 5.0%. The actuarial value of plan assets was equal to the market value of those assets. Monthly premiums for those retirees under the current plan was assumed to be $418.80, with health care costs expected to be 8.0% the next year and decreasing 0.5% each year thereafter until the rate reached 5.0% in the seventh year. The discount rate and the health care cost trend rate incorporate an assumed annual inflation rate of 3.5%. During the year ended December 31, 2015, the life expectancy table utilized by the actuary was changed from the 1994 Uninsured Pensioners Mortality Table to the RP 2014 Mortality Table to use the most current life expectancy information available. The actuary estimates that this change increased the UAAL by approximately $398,000. The UAAL is amortized using the level dollar method with 24 years remaining at December 31, 2015 as the plan was closed to new participants on January 1, 2010. The assumed discount rate was lowered from 5.5% to 5.0% as of December 31, 2015. The net impact of this change and other changes in assumptions was to increase the UAAL by almost $780,000.

Central Arkansas Water
NOTES TO FINANCIAL STATEMENTS December 31, 2015 and 2014
79
NOTE 11: PRIOR PERIOD ADJUSTMENT In June 2012, the GASB issued GASB 68 which became effective for the Utility on January 1, 2015. The provisions of GASB 68 improve accounting and financial reporting by state and local governments for pensions. The Statement also improves information provided by state and local governmental employers about financial support for pensions that is provided by other entities, in part by requiring state or local government employers to recognize a net pension liability for defined pension plans. The adoption of this Statement by the Utility resulted in a cumulative reduction in the beginning net position of the Utility of approximately $15,256,000, as follows:
Beginning unrestricted net position, as previously reported 36,464,333$
Prior period adjustment ‐ implementation of GASB 68:Net pension liability adopted as of January 1, 2015 (13,161,142) Deferred outflows 1,993,444 Deferred inflows (5,302,744) Beginning deferred outflows for pension contributions madeprior to January 1, 2015 1,214,829
Adjustment to beginning net position (15,255,613)
Beginning unrestricted net position, as restated 21,208,720$
Prior periods have not been restated due to the fact that all relevant information was not provided by APERS.
NOTE 12: SUBSEQUENT EVENTS
On March 1, 2016, the Utility issued $22,750,000 Acquisition and Construction Water Revenue Bonds (Maumelle Water System Acquisition Project), Series 2016 to refund debt assumed by the Utility from the Maumelle Water Management (MWM). The Series 2016 Bonds are special obligations of the Utility, payable solely from long term debt surcharge revenues collected within the MWM service area. Principal and interest payments are due semi‐annually on April 1 and October 1, commencing October 1, 2016 with the final payment scheduled in 2030. The proceeds of the bond issue will be used to pay the then outstanding balances of MWM debt. These bonds were issued in conjunction with the merger of the Utility with the operations of MWM, which was effective February 29, 2016. Subsequent to the merger, the Utility will provide water to the 7,200 customers previously served by MWM. The Utility will record the MWM assets acquired and liabilities assumed by MWM during 2016.

80
(This page intentionally left blank)

81
Required Supplementary Information

82
(This page intentionally left blank)

See independent auditor’s report.
83
Central Arkansas Water
REQUIRED SUPPLEMENTARY INFORMATION
Schedule of the Utility’s Proportionate Share of the Net Pension Liability December 31, 2015
Utility's proportion of the net pension liability 0.94%
Utility's proportionate share of the net pension liability 17,301,107$
Utility's covered‐employee payroll 16,881,194$
Utility's proportionate share of the net pension liability as a percentage of its
covered‐employee payroll 102.49%
Plan fiduciary net position as a percentage of the total pension liability 80.39%
*The amounts presented for the fiscal year were determined as of June 30, 2015

See independent auditor’s report.
84
Central Arkansas Water
REQUIRED SUPPLEMENTARY INFORMATION
Schedule of the Utility’s Contributions to Arkansas Public Employees Retirement System Year ended December 31, 2015
Contractually required contribution 2,479,699$
Contributions in relation to the contractually required contribution 2,479,699
Contribution deficiency (excess) ‐$
Utility's covered‐employee payroll 16,881,194$
Contributions as a percentage of covered‐employee payroll 14.69%
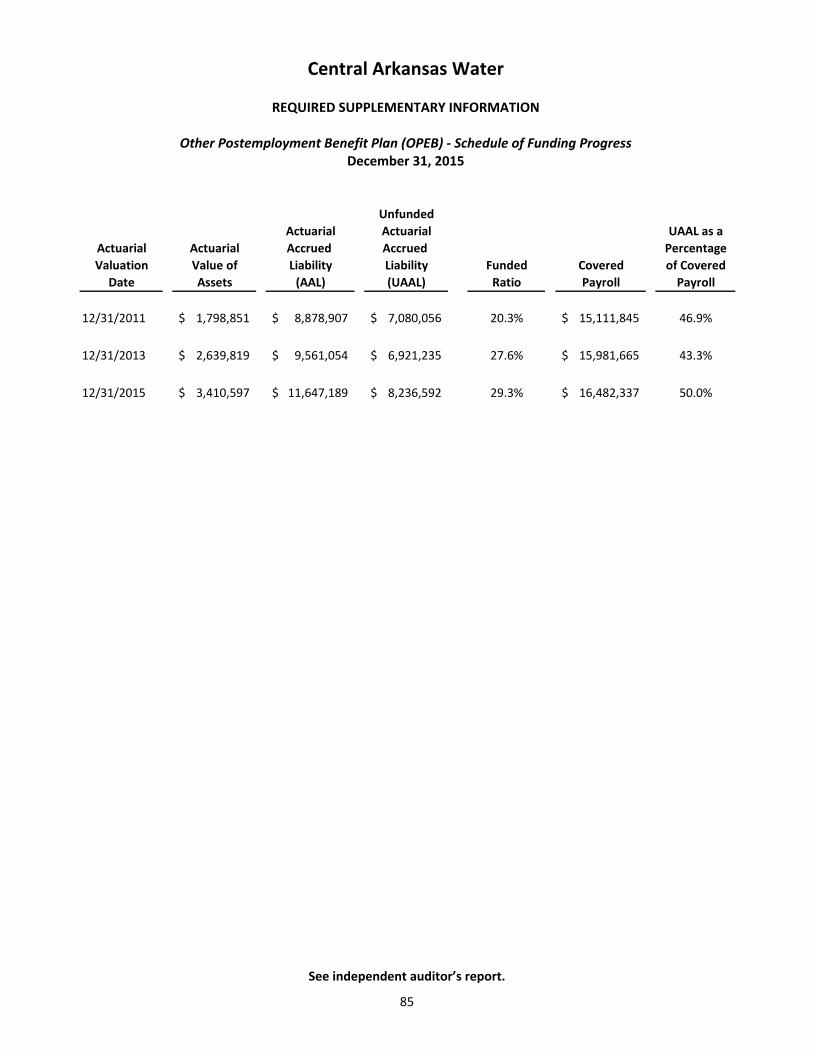
See independent auditor’s report.
85
Central Arkansas Water
REQUIRED SUPPLEMENTARY INFORMATION
Other Postemployment Benefit Plan (OPEB) ‐ Schedule of Funding Progress December 31, 2015
Unfunded
Actuarial Actuarial UAAL as a
Actuarial Accrued Accrued Percentage
Value of Liability Liability Funded Covered of Covered
Assets (AAL) (UAAL) Ratio Payroll Payroll
1,798,851$ 8,878,907$ 7,080,056$ 20.3% 15,111,845$ 46.9%
2,639,819$ 9,561,054$ 6,921,235$ 27.6% 15,981,665$ 43.3%
3,410,597$ 11,647,189$ 8,236,592$ 29.3% 16,482,337$ 50.0%12/31/2015
12/31/2013
Valuation
Actuarial
12/31/2011
Date

86
Central Arkansas Water
REQUIRED SUPPLEMENTARY INFORMATION
Other Postemployment Benefit Plan (OPEB) ‐ Schedule of Employer Contributions December 31, 2015
Actuarial Date
12/31/2011 710,820$ 100%
12/31/2013 678,354$ 100%
12/31/2015 710,052$ 100%
Annual Required
Contribution
Percentage
Contributed

Statistical Section (Unaudited)

Central Arkansas Water
STATISTICAL SECTION INDEX
87
This section of the Utility’s comprehensive annual financial report presents detailed information to provide a context for understanding what the information in the financial statements, notes to financial statements and required supplementary information says about the Utility’s overall financial health. Financial Trends ................................................................................................................................... 89
These schedules contain trend information to help readers understand how the Utility’s financial performance and well‐being have changed over time.
Revenue and Debt Capacity ................................................................................................................. 95
These schedules contain information to help readers assess the Utility’s most significant revenue source, water revenues. Also included in this section is information to help the reader assess the affordability of the Utility’s current levels of debt outstanding and the Utility’s ability to issue additional debt in the future.
Demographic and Economic Information ......................................................................................... 101
These schedules offer demographic and economic indicators to help readers understand the environment within which the Utility’s financial activities take place.
Operating Information ....................................................................................................................... 105
These schedules contain system and infrastructure data to help readers understand how the information in the Utility’s financial report relates to the services the Utility provides and the activities it performs.

88
(This page intentionally left blank)

89
Financial Trends

Central Arkansas Water
TEN YEAR SUMMARY OF REVENUES, EXPENSES AND RATE INCREASES 2006 – 2015 (Unaudited)
90
2006 2007 2008 2009
Operating RevenuesWater sales 35,608,990$ 37,442,971$ 37,547,537$ 37,706,526$
Penalties 635,521 714,390 742,402 754,955
Turn‐on charges 995,720 1,020,307 1,132,302 1,110,714
Ancillary charges 3,259,665 3,238,139 3,044,787 2,797,505
Watershed protection fees ‐ ‐ ‐ 651,652
Other revenue 732,109 1,118,918 839,430 524,358
Total Operating Revenues 41,232,005 43,534,725 43,306,458 43,545,710
Operating ExpensesAdministration 2,698,346 2,946,927 3,107,367 2,945,649
Distribution 9,423,267 9,200,010 9,536,879 9,832,889
Engineering 1,387,524 1,551,157 1,637,505 1,700,254
Finance and customer service 5,482,798 5,679,973 5,751,256 5,980,026
Finance ‐ ‐ ‐ ‐
Customer relations and public affairs ‐ ‐ ‐ ‐
Information services 2,857,553 2,805,933 2,834,869 2,752,820
Source and treatment 6,562,594 7,054,139 7,555,875 7,882,414
Watershed protection ‐ ‐ 849,428 965,800
Water quality ‐ ‐ ‐ ‐
General 1,971,479 1,955,895 2,355,892 2,033,790
Depreciation and amortization 8,396,197 8,287,340 8,642,459 8,640,467
Total Operating Expenses 38,779,758 39,481,374 42,271,530 42,734,109
Nonoperating Revenues (Expenses)Transfers to Cities of LR and NLR (401,275) (412,656) (462,528) (537,936)
Gain (loss) on disposal of capital assets 138,154 75,004 184,625 157,520
Investment income 1,415,298 1,530,756 738,133 163,318
Bond and other interest expense, net (883,116) (1,256,639) (1,315,979) (1,042,072)
Total Nonoperating Revenues (Expenses) 269,061 (63,535) (855,749) (1,259,170)
Contributions Contributions‐in‐aid of construction 6,417,351 6,930,433 10,232,358 5,253,734
Capital contributions from grantors ‐ ‐ ‐ 4,000,000
Total Contributions 6,417,351 6,930,433 10,232,358 9,253,734
Change in Net Position 9,138,659$ 10,920,249$ 10,411,537$ 8,806,165$
% Water Rate Increase (1) 9.4% 9.8% 9.6% 3.4%
Source: Central Arkansas Water Finance Department
(1) Little Rock inside‐city residential typical bill % increase (typical bill based on 650 cubic feet consumption)

Central Arkansas Water
TEN YEAR SUMMARY OF REVENUES, EXPENSES AND RATE INCREASES (Continued) 2006 – 2015 (Unaudited)
91
2010 2011 2012 2013 2014 2015
44,734,656$ 47,899,601$ 49,448,601$ 45,998,541$ 45,070,592$ 47,459,563$
888,654 915,430 891,014 859,938 916,613 878,500
1,057,057 1,019,839 1,195,622 1,101,038 1,010,229 989,227
2,631,082 2,841,724 3,014,509 3,083,148 2,917,964 3,005,354
982,812 999,083 1,003,492 1,012,991 1,012,005 1,017,055
636,345 596,503 716,994 1,990,277 670,741 731,607
50,930,606 54,272,180 56,270,232 54,045,933 51,598,144 54,081,306
2,766,339 2,842,433 2,252,142 2,364,744 2,471,360 2,598,576
9,915,785 9,994,051 9,817,795 10,495,249 10,659,085 10,256,858
1,758,261 1,779,691 1,768,725 1,773,172 1,821,276 1,694,457
5,992,816 6,186,750 ‐ ‐ ‐ ‐
‐ ‐ 2,605,926 2,585,870 2,548,209 2,582,474
‐ ‐ 4,055,518 4,176,286 4,458,680 4,436,408
2,818,444 3,005,343 3,013,314 2,902,303 3,133,821 3,050,213
8,181,092 8,556,749 9,423,762 7,889,209 7,717,004 8,011,935
1,032,201 1,158,939 1,062,484 ‐ ‐ ‐
‐ ‐ ‐ 1,936,431 1,911,167 2,024,136
2,549,123 2,048,645 2,345,009 2,017,004 1,971,006 2,112,725
9,138,823 9,589,451 10,346,997 11,068,273 10,786,930 11,246,626
44,152,884 45,162,052 46,691,672 47,208,541 47,478,538 48,014,408
(551,290) (584,388) (602,832) (608,436) (658,776) (659,088)
118,562 (476,219) 204,043 249,854 26,456 76,092
56,820 118,372 76,650 111,482 199,334 194,795
(1,049,990) (900,468) (1,579,723) (2,348,152) (2,320,427) (2,408,154)
(1,425,898) (1,842,703) (1,901,862) (2,595,252) (2,753,413) (2,796,355)
8,552,085 9,573,703 2,826,327 864,644 2,253,550 3,021,520
‐ 4,000,000 171,514 47,903 ‐ 127,396
8,552,085 13,573,703 2,997,841 912,547 2,253,550 3,148,916
13,903,909$ 20,841,128$ 10,674,539$ 5,154,687$ 3,619,743$ 6,419,459$
5.9% 5.3% 0.0% 3.8% 3.7% 0.0%

Central Arkansas Water
TEN YEAR SUMMARY OF NET POSITION 2006 – 2015 (Unaudited)
92
2006 2007 2008 2009
Net PositionNet investment in capital assets 250,633,560$ 258,483,966$ 268,480,427$ 280,199,889$ Restricted – expendable 5,689,550 7,942,708 8,841,017 7,127,200Unrestricted 15,027,542 15,844,227 15,360,994 14,161,514
Total Net Position 271,350,652$ 282,270,901$ 292,682,438$ 301,488,603$
Source: Central Arkansas Water Finance Department
(1) Beginning net position was restated by The Utility during the year ended December 31, 2015, as a result of implementation of
GASB Statement No. 68.

Central Arkansas Water
TEN YEAR SUMMARY OF NET POSITION (Continued) 2006 – 2015 (Unaudited)
93
2010 2011 2012 2013 2014 2015(1)
284,393,022$ 299,621,462$ 302,315,617$ 309,457,263$ 312,635,439$ 320,025,891$ 9,038,701 6,466,360 7,988,462 7,121,040 6,059,324 7,188,147
21,437,276 29,622,305 36,080,587 34,961,050 36,464,333 19,108,904
314,868,999$ 335,710,127$ 346,384,666$ 351,539,353$ 355,159,096$ 346,322,942$

Central Arkansas Water
TEN YEAR SUMMARY OF WRITE‐OFFS 2006 – 2015 (Unaudited)
94
Write‐Offs /Year Water Sales Write‐Offs Water Sales
2006 35,608,990 144,898 0.41%
2007 37,442,971 225,043 0.60%
2008 37,547,537 205,420 0.55%
2009 37,706,526 193,601 0.51%
2010 44,734,656 249,268 0.56%
2011 47,899,601 290,008 0.61%
2012 49,448,601 257,771 0.52%
2013 45,998,541 239,301 0.52%
2014 45,070,592 369,709 0.82%
2015 47,459,563 316,441 0.67%
Source: Central Arkansas Water Finance Department

95
Revenue and Debt Capacity

Central Arkansas Water
TEN YEAR SUMMARY OF REVENUES, EXPENSES AND DEBT SERVICE COVERAGE 2006 – 2015 (Unaudited)
96
2006 2007 2008 2009
Water sales 35,608,990$ 37,442,971$ 37,547,537$ 37,706,526$
Penalties 635,521 714,390 742,402 754,955
Turn‐on charges 995,720 1,020,307 1,132,302 1,110,714
Ancillary charges 3,259,665 3,238,139 3,044,787 2,797,505
Watershed protection fees ‐ ‐ ‐ 651,652
Proceeds from sale of capital assets 887,107 852,053 1,036,972 972,888
Investment income 1,415,298 1,530,756 738,133 163,318
Other revenue 732,109 1,118,918 839,430 524,358
Total Revenues 43,534,410 45,917,534 45,081,563 44,681,916
Administration 2,698,346 2,946,927 3,107,367 2,945,649
Distribution 9,423,267 9,200,010 9,536,879 9,832,889
Engineering 1,387,524 1,551,157 1,637,505 1,700,254
Finance and customer service 5,482,798 5,679,973 5,751,256 5,980,026
Finance ‐ ‐ ‐ ‐
Customer relations and public affairs ‐ ‐ ‐ ‐
Information services 2,857,553 2,805,933 2,834,869 2,752,820
Source and treatment 6,562,594 7,054,139 7,555,875 7,882,414
Watershed protection ‐ ‐ 849,428 965,800
Water quality ‐ ‐ ‐ ‐
General 1,971,479 1,955,895 2,355,892 2,033,790
Transfers to Cities of LR and NLR 401,275 412,656 462,528 537,936
Total Expenses 30,784,836 31,606,690 34,091,599 34,631,578
Transfers to rate stabilization account(2) ‐ ‐ ‐ ‐
12,749,574$ 14,310,844$ 10,989,964$ 10,050,338$
Maximum Annual Debt Service on
3,323,528$ 4,720,529$ 4,720,529$ 5,536,739$
3.84 3.03 2.33 1.82
Note: Revenues and expenses included in statements of revenues, expenses and changes in net position, but excluded above
consist of the following: depreciation and amortization, loss on disposal of capital assets, interest expense,
(1)Bond Requirement is 1.2.
(2)Per Resolution 2010‐03, transfers to the rate stabilization account within 90 days after year end are excluded from net
revenues and transfers from the rate stabilization account within 90 days after year end are included in net revenues.
Net Revenues
Expenses
Revenues
contributions‐in‐aid of construction and capital contributions from grantors.
Debt Service on Revenue Bonds(1)
Source: Central Arkansas Water Finance Department
Revenue Bonds
Ratio of Net Revenues to Maximum Annual

Central Arkansas Water
TEN YEAR SUMMARY OF REVENUES, EXPENSES AND DEBT SERVICE COVERAGE (Continued) 2006 – 2015 (Unaudited)
97
2010 2011 2012 2013 2014 2015
44,734,656$ 47,899,601$ 49,448,601$ 45,998,541$ 45,070,592$ 47,459,563$
888,654 915,430 891,014 859,938 916,613 878,500
1,057,057 1,019,839 1,195,622 1,101,038 1,010,229 989,227
2,631,082 2,841,724 3,014,509 3,083,148 2,917,964 3,005,354
982,812 999,083 1,003,492 1,012,991 1,012,005 1,017,055
1,154,252 1,378,313 1,270,452 1,259,097 62,548 93,675
56,820 118,372 76,650 111,482 199,334 194,795
636,345 596,503 716,994 1,990,277 670,741 731,607
52,141,678 55,768,865 57,617,334 55,416,512 51,860,026 54,369,776
2,766,339 2,842,433 2,252,142 2,364,744 2,471,360 2,598,576
9,915,785 9,994,051 9,817,795 10,495,249 10,659,085 10,256,858
1,758,261 1,779,691 1,768,725 1,773,172 1,821,276 1,694,457
5,992,816 6,186,750 ‐ ‐ ‐ ‐
‐ ‐ 2,605,926 2,585,870 2,548,209 2,582,474
‐ ‐ 4,055,518 4,176,286 4,458,680 4,436,408
2,818,444 3,005,343 3,013,314 2,902,303 3,133,821 3,050,213
8,181,092 8,556,749 9,423,762 7,889,209 7,717,004 8,011,935
1,032,201 1,158,939 1,062,484 ‐ ‐ ‐
‐ ‐ ‐ 1,936,431 1,911,167 2,024,136
2,549,123 2,048,645 2,345,009 2,017,004 1,971,006 2,112,725
551,290 584,388 602,832 608,436 658,776 659,088
35,565,351 36,156,989 36,947,507 36,748,704 37,350,384 37,426,870
(2,100,000) (2,600,000) (3,300,000) ‐ ‐ ‐
14,476,327$ 17,011,876$ 17,369,827$ 18,667,808$ 14,509,642$ 16,942,906$
6,799,714$ 6,884,537$ 8,061,331$ 7,909,925$ 7,645,191$ 7,600,019$
2.13 2.47 2.15 2.36 1.90 2.23

Central Arkansas Water
TEN YEAR SUMMARY OF OUTSTANDING DEBT TO CUSTOMER COUNT 2006 – 2015 (Unaudited)
98
Year
2006 103,492 10,881 60 7
2007 105,419 11,003 62 7
2008 105,905 11,064 57 7
2009 106,371 11,041 64 7
2010 106,235 11,041 63 8
2011 106,556 11,160 63 9
2012 106,961 11,243 64 9
2013 108,116 11,297 57 9
2014 108,426 11,411 56 9
2015 109,007 11,419 50 9
Source: Central Arkansas Water Finance Department
CommercialResidential Large Volume Wholesale

Central Arkansas Water
TEN YEAR SUMMARY OF OUTSTANDING DEBT TO CUSTOMER COUNT (Continued) 2006 – 2015 (Unaudited)
99
Total Outstanding
4,091 1,445 119,976 39,175,000$ 327$
3,358 1,552 121,401 55,135,000$ 454$
3,357 1,593 121,983 53,025,000$ 435$
3,568 1,661 122,712 59,520,017$ 485$
3,758 1,686 122,791 72,891,876$ 594$
3,497 1,723 123,008 75,463,932$ 613$
3,554 1,772 123,603 92,506,391$ 748$
3,748 1,821 125,048 85,442,806$ 683$
3,782 1,850 125,534 80,966,271$ 645$
3,955 1,880 126,320 76,734,499$ 607$
Debt
Outstanding
Total
Customer Count
Debt to
Fire Services
Private
Customers
Total
Sprinkler

Central Arkansas Water
TEN YEAR SUMMARY OF TEN LARGEST WATER CUSTOMERS 2006 – 2015 (Unaudited)
100
2006 2007 2008 2009 2010 2011 2012 2013 2014 2015
Jacksonville Water Works 1 1 1 1 1 1 1 1 1 1
Bryant Water and Sewer 2 2 2 2 3 2 2 2 2 2
Salem Water Alliance ‐ 6 8 8 4 4 3 3 3 3
Mid‐Arkansas Utilities 3 3 3 3 2 3 4 4 4 5
University of Arkansas for
Medical Sciences 9 8 5 4 5 6 5 5 5 6
Arkansas Department of
Corrections ‐ ‐ ‐ 10 10 9 10 9 6 7
Sage V Foods ‐ ‐ ‐ ‐ ‐ ‐ ‐ ‐ 7 10
Cabot WaterWorks ‐ ‐ ‐ ‐ ‐ ‐ 9 10 8 8
Shannon Hills Water Department ‐ ‐ ‐ ‐ ‐ ‐ ‐ ‐ 9 4
Baptist Health System 7 9 7 7 8 7 7 7 10 9
Chicopee/Polymer Group 10 10 ‐ ‐ ‐ ‐ ‐ ‐ ‐ ‐
Veterans Administration
Hospitals 8 7 6 5 7 ‐ 8 8 ‐ ‐
3‐M Company 5 4 4 6 6 8 ‐ ‐ ‐ ‐
Arkansas Electric Cooperative 4 5 ‐ ‐ 9 5 6 6 ‐ ‐
North Little Rock Burns Park 6 ‐ ‐ ‐ ‐ ‐ ‐ ‐ ‐ ‐
St. Vincent Doctors Hospital ‐ ‐ 9 ‐ ‐ ‐ ‐ ‐ ‐ ‐
Arkansas Military Department ‐ ‐ 10 ‐ ‐ 10 ‐ ‐ ‐ ‐
Little Rock Parks Department ‐ ‐ ‐ 9 ‐ ‐ ‐ ‐ ‐ ‐
Source: Central Arkansas Water Finance Department

101
Demographic and Economic Information

Central Arkansas Water
102
LARGEST EMPLOYERS WITHIN PULASKI COUNTY 2015 vs. 2006 (Unaudited)
Percentage
of Total
Employer Type of Business Rank Employees Employment Rank Employees
State of Arkansas Government 1 32,200 19% 1 28,100 Local Government Government 2 28,800 17%Federal Government Government 3 9,200 5% 2 9,400 University of Arkansas for Medical Sciences Medical Services 4 8,500 5% 3 8,500
Baptist Health Medical Services 5 7,000 4% 5 7,571 Little Rock Air Force Base Government 6 4,500 3% 6 4,500 Acxiom Data Processing 7 4,388 3% 7 4,388 Little Rock School District Education 8 3,511 2%Central Arkansas Veterans Health Care Systems Medical Services 9 3,500 2% 10 2,785
Entergy Arkansas Utility (Electric) 10 2,738 2% 9 2,881 Pulaski County Public School District Education ‐ 3,900 ‐ 4 7,868
St. Vincent InfirmaryMedical Center Medical Services ‐ 2,600 ‐ 8 3,500
Total 110,837 64% 79,493
Total Employment 172,350 177,500
Source: Central Arkansas Water Finance Department
2015 2006
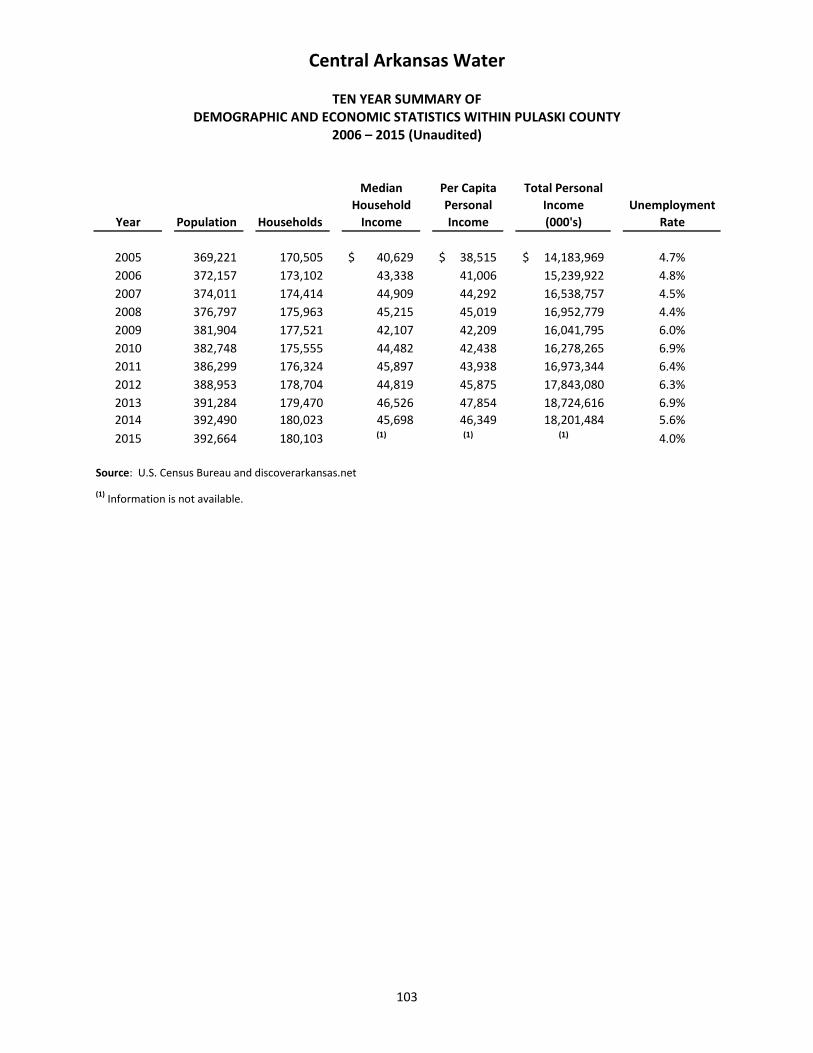
Central Arkansas Water
TEN YEAR SUMMARY OF DEMOGRAPHIC AND ECONOMIC STATISTICS WITHIN PULASKI COUNTY
2006 – 2015 (Unaudited)
103
Median Per Capita Total Personal
Household Personal Income Unemployment
Year Population Households Income Income (000's) Rate
2005 369,221 170,505 40,629$ 38,515$ 14,183,969$ 4.7%
2006 372,157 173,102 43,338 41,006 15,239,922 4.8%
2007 374,011 174,414 44,909 44,292 16,538,757 4.5%
2008 376,797 175,963 45,215 45,019 16,952,779 4.4%
2009 381,904 177,521 42,107 42,209 16,041,795 6.0%
2010 382,748 175,555 44,482 42,438 16,278,265 6.9%
2011 386,299 176,324 45,897 43,938 16,973,344 6.4%
2012 388,953 178,704 44,819 45,875 17,843,080 6.3%
2013 391,284 179,470 46,526 47,854 18,724,616 6.9%
2014 392,490 180,023 45,698 46,349 18,201,484 5.6%
2015 392,664 180,103 (1) (1) (1) 4.0%
Source: U.S. Census Bureau and discoverarkansas.net
(1) Information is not available.

104
(This page intentionally left blank)

105
Operating Information

Central Arkansas Water
TEN YEAR SUMMARY OF NEW CONNECTIONS 2006 – 2015 (Unaudited)
106
Fire New Pipe
Year
2006 2,507 316 29.00
2007 2,598 376 65.20
2008 1,753 336 37.30
2009 1,686 321 35.50
2010 1,144 160 19.70
2011 1,187 86 11.90
2012 1,442 61 28.50
2013 2,158 137 15.30
2014 1,205 150 16.90
2015 1,233 165 11.80
Source: Central Arkansas Water Engineering Department
Meters Hydrants (in Miles)

Central Arkansas Water
TEN YEAR SUMMARY OF SYSTEM HIGHLIGHTS 2006 – 2015 (Unaudited)
107
2006 2007 2008 2009 2010 2011 2012 2013 2014 2015
Miles of public water
distribution pipe 2,145 2,198 2,229 2,255 2,276 2,280 2,295 2,358 2,366 2,372
Number of treatment
plants 2 2 2 2 2 2 2 2 2 2
Maximum treatment
capacity (MGD) 124.0 124.0 157.0 157.0 157.0 157.0 157.0 157.0 157.0 157.0
Maximum day
consumption (MG) 120.3 119.6 109.4 103.3 108.4 119.4 126.0 106.0 88.3 98.9
Percentage of maximum
capacity utilized 97% 96% 70% 66% 69% 76% 80% 68% 56% 63%
MGD = Millions of Gallons per Day
MG = Million Gallons
Source: Central Arkansas Water Engineering and Source and Treatment Departments

Central Arkansas Water
TEN YEAR SUMMARY OF CAPITAL ASSETS 2006 – 2015 (Unaudited)
108
2006 2007 2008 2009
Land and land use rights 20,934,589$ 24,817,358$ 28,147,590$ 40,550,430$
Building and grounds 37,004,974 37,493,939 39,037,397 39,719,805
Land improvements ‐ ‐ ‐ ‐
Water source 32,309,610 32,549,548 32,621,672 32,621,672
Purification 24,575,320 24,824,032 25,176,369 25,176,369
Pumping 12,756,729 15,959,091 15,956,236 15,956,236
Distribution 226,235,752 236,865,670 249,181,501 257,532,685
Other equipment 23,109,970 24,256,523 25,762,336 25,933,787
Construction in progress 20,934,029 27,706,013 30,887,428 36,626,465
397,860,973 424,472,174 446,770,529 474,117,449
Less accumulated depreciation 114,372,648 120,973,768 129,122,942 136,877,016
Net Capital Assets 283,488,325$ 303,498,406$ 317,647,587$ 337,240,433$
Source: Central Arkansas Water Finance Department

Central Arkansas Water
TEN YEAR SUMMARY OF CAPITAL ASSETS (Continued) 2006 – 2015 (Unaudited)
109
2010 2011 2012 2013 2014 2015
40,544,764$ 43,779,013$ 45,521,648$ 46,032,162$ 46,192,915$ 47,488,299$
40,917,775 41,954,807 44,160,573 49,154,620 60,806,083 60,916,771
‐ ‐ ‐ 1,478,894 2,253,459 2,259,083
32,778,582 32,778,582 32,920,887 32,927,318 33,211,941 33,211,941
29,512,295 36,299,049 37,261,755 37,518,831 42,180,124 42,449,597
22,254,975 22,323,783 25,740,465 25,796,891 26,233,796 26,410,016
272,131,704 279,106,680 318,974,140 323,590,447 335,078,600 339,621,061
26,463,728 27,362,197 27,875,369 27,139,956 28,573,745 29,123,839
34,450,027 42,187,758 11,868,158 21,527,876 2,150,054 8,880,044
499,053,850 525,791,869 544,322,995 565,166,995 576,680,717 590,360,651
145,172,084 153,522,735 163,299,356 173,414,469 183,412,270 193,915,770
353,881,766$ 372,269,134$ 381,023,639$ 391,752,526$ 393,268,447$ 396,444,881$

Central Arkansas Water
TEN YEAR SUMMARY OF FILLED POSITIONS BY DEPARTMENT 2006 – 2015 (Unaudited)
110
2006 2007 2008 2009 2010 2011 2012 2013 2014 2015
Administration 14 14 15 17 14 14 11 11 12 11
Distribution 115 125 114 111 102 104 106 109 108 110
Engineering 21 21 22 22 23 22 23 23 22 21
Finance and
customer service 78 78 77 75 78 75 79 79 ‐ ‐
Finance ‐ ‐ ‐ ‐ ‐ ‐ ‐ ‐ 17 20
Customer relations
and public affairs ‐ ‐ ‐ ‐ ‐ ‐ ‐ ‐ 61 63
Information services 18 18 16 17 17 17 17 17 17 17
Source and treatment 37 37 37 39 37 40 32 31 ‐ ‐
Water quality ‐ ‐ ‐ ‐ ‐ ‐ 10 9 ‐ ‐
Water quality and
operations ‐ ‐ ‐ ‐ ‐ ‐ ‐ ‐ 40 41
Total 283 293 281 281 271 272 278 279 277 283
Source: Central Arkansas Water Administration Department

Central Arkansas Water
111
SCHEDULE OF WATER RATES 2015 (Unaudited)
Inside Outside
Meter Size City City
5/8" 5.85$ 7.66$
3/4" 7.56$ 9.89$
1" 10.74$ 14.06$
1 1/2" 18.16$ 23.75$
2" 29.45$ 38.54$
3" 54.45$ 71.27$
4" 88.57$ 115.93$
6" 175.19$ 229.29$
8" 296.33$ 387.82$
10" 426.63$ 558.37$
12" 777.01$ 1,016.94$
Customer Inside OutsideClass City City On Peak Off Peak
Residential 1.61$ 2.58$ n/a n/a
Commercial 1.51$ 2.41$ n/a n/a
Large Volume 1.23$ 1.96$ n/a n/a
Sprinkler 1.61$ 2.58$ n/a n/a
Wholesale n/a n/a $ 1.31 $ 1.15
Raw Water 0.55$ n/a n/a n/a
Meter Size Fee
5/8" 0.45$
3/4" 0.45$
1" 0.68$
1 1/2" 1.13$
2" 2.25$
3" 3.60$
4" 6.75$
6" 11.25$
8" 22.50$
10" 36.00$
(1)
Charge
Charge
Minimum Monthly Charge (all customers):
Consumption Charge (per 100 cubic feet of usage in excess of 200 cubic feet per month):
or 300 cubic feet of monthly usage shall be given a Conservation Rate Discount of 15%. The
Watershed Protection Fee (all customers):
Inside City Residential accounts with a single house meter (no sprinkler meter) using 100, 200
discount shall not apply to zero consumption billings.

112
(This page intentionally left blank)

Other Required Report

Thomas & Thomas LLP
Certified Public Accountants
113
www.thomasthomasllp.com Little Rock Office 201 E. Markham, Suite 500, Little Rock, Arkansas 72201 Telephone (501) 375-2025 FAX (501) 375-8704
Texarkana Office 2900 St. Michael Drive, Suite 302, Texarkana, Texas 75503 Telephone (903) 831-3477 FAX (903) 831-3482
Members American Institute Certified Public Accountants Center for Public Company Audit Firms and PCPS
INDEPENDENT AUDITOR’S REPORT ON INTERNAL CONTROL OVER FINANCIAL REPORTING AND ON COMPLIANCE AND OTHER MATTERS BASED ON AN AUDIT OF FINANCIAL STATEMENTS PERFORMED
IN ACCORDANCE WITH GOVERNMENT AUDITING STANDARDS Board of Commissioners Central Arkansas Water Little Rock, Arkansas
We have audited, in accordance with the auditing standards generally accepted in the United States of America and the standards applicable to financial audits contained in Government Auditing Standards issued by the Comptroller General of the United States, the financial statements of Central Arkansas Water (the Utility) and its fiduciary funds, as of and for the year ended December 31, 2015, and the related notes to the financial statements, which collectively comprise the Utility’s basic financial statements, and have issued our report thereon dated April 14, 2016. Internal Control over Financial Reporting
In planning and performing our audit of the financial statements, we considered the Utility's internal control over financial reporting (internal control) to determine the audit procedures that are appropriate in the circumstances for the purpose of expressing our opinion on the financial statements, but not for the purpose of expressing an opinion on the effectiveness of the Utility’s internal control. Accordingly, we do not express an opinion on the effectiveness of the Utility’s internal control. A deficiency in internal control exists when the design or operation of a control does not allow management or employees, in the normal course of performing their assigned functions, to prevent, or detect and correct, misstatements on a timely basis. A material weakness is a deficiency, or a combination of deficiencies, in internal control, such that there is a reasonable possibility that a material misstatement of the entity’s financial statements will not be prevented, or detected and corrected on a timely basis. A significant deficiency is a deficiency, or a combination of deficiencies, in internal control that is less severe than a material weakness, yet important enough to merit attention by those charged with governance. Our consideration of internal control was for the limited purpose described in the first paragraph of this section and was not designed to identify all deficiencies in internal control that might be material weaknesses or significant deficiencies. Given these limitations, during our audit we did not identify any deficiencies in internal control that we consider to be material weaknesses. However, material weaknesses may exist that have not been identified.

114
Board of Commissioners Central Arkansas Water Page Two
Compliance and Other Matters
As part of obtaining reasonable assurance about whether the Utility's financial statements are free from material misstatement, we performed tests of its compliance with certain provisions of laws, regulations, contracts and grant agreements, noncompliance with which could have a direct and material effect on the determination of financial statement amounts. However, providing an opinion on compliance with those provisions was not an objective of our audit, and accordingly, we do not express such an opinion. The results of our tests disclosed no instances of noncompliance or other matters that are required to be reported under Government Auditing Standards. Purpose of this Report
The purpose of this report is solely to describe the scope of our testing of internal control and compliance and the results of that testing, and not to provide an opinion on the effectiveness of the Utility’s internal control or on compliance. This report is an integral part of an audit performed in accordance with Government Auditing Standards in considering the entity’s internal control and compliance. Accordingly, this communication is not suitable for any other purpose.
Certified Public Accountants April 14, 2016 Little Rock, Arkansas