Embed Size (px)
Citation preview
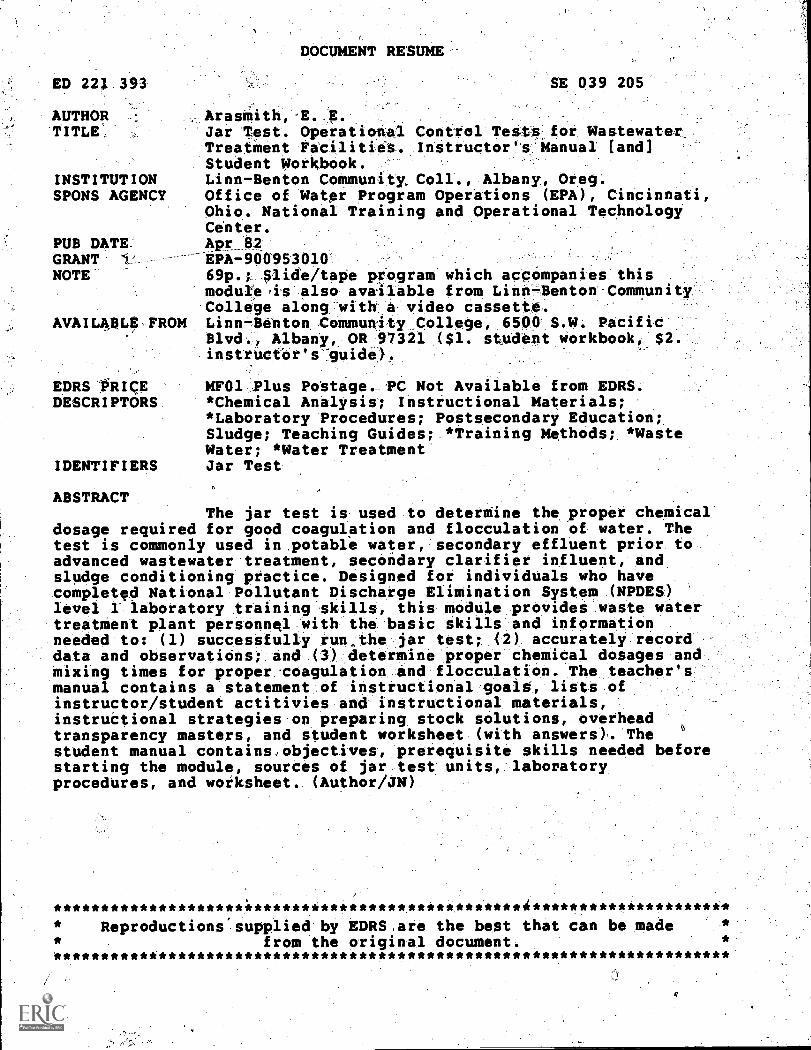
DOCUMENT11ESUME
ED 221 393
AUTHOR Arasmith, E. E.TITLE Jar Test. Operational Control Tests for Wastewater
Treatment Facilitiet. Instructor's Manual [and]Student Workbook.
INSTITUTION Linn-Benton Community, Coll., Albany, Oreg.SPONS AGENCY Office of Water Program Operations (EPA), Cincinnati,
Ohio. National Training and Operational TechnologyCenter.
PUB DATE APr 82GRANT 1 EPA-900953010NOTE 69p.; Slide/tape program which accompanies this
moduleis also available from Linn-Benton CommunityCollege along with a video cassette.
AVAILABLE FROM Linn-Benton Community College, 6500 S.W. PacificBlvd., Albany, OR 97321 ($1. student workbook, $2.instructor's'guide).
EDRS "FRICE MF01 Plus Pottage. PC Not Available from EDRS.DESCRIPTORS *Chemical Analysis; Instructional Materials;
*Laboratory Procedures; Postsecondary Education;Sludge; Teaching Guides; *Training Methods; *WasteWater; *Water Treatment
IDENTIFIERS Jar Test
ABSTRACT
SE 039205
The jar test is used to determine the proper chemicaldosage required for good coagulation and flocculation of water. Thetest is commonly used in potable water, secondary effluent prior toadvanced wastewater treatment, secondary clarifier influent, andsludge conditioning practice. Designed for individuals who havecompleted National Pollutant Discharge Elimination System, (NPDES)level 1 laboratory training skills, this module provides waste watertreatment plant personnel with the basic skills and informationneeded to: (1) successfully run,the jar test; (2) accurately recorddata and observations; and (3) determine proper chemical dosages andmixing times for proper coagulation and flocculation. The teacher'smanual contains a statement of instructional goals, lists ofinstructor/student actitivies and instructional materials,instructional strategies on preparing stock solutions, overheadtransparency masters, and student worksheet (with answers). Thestudent manual contains,objectives, prerequisite skills needed beforestarting the module, sources of jar test units, laboratoryprocedures, and worksheet. (Author/JN)
********************i****************************4*********************Reproductions supplied by EDRS,are the best that can be made
from the original document.***********************************************************************
/
peratiOnal Control Testsfor Wastewater-Treatment Facilities
U.S. DEPARTMENT OF EDUCATION
NATIONAL INSTITUTE OF EDUCATION
EDUCATIONAL RESOURCES INFORMAtION
CENTER (ERIC) . . .
V This document has been teproduced ;its
tecewed hem the penton 01 organgebon
onginatingMinor changes have been mane to improv&
fewoeueven quahlY
Points of view or opinepti tiimed in this docg
ment do not necessarily wpresent official NlE
position Pr policy
Instructor's Manual
"PERMISSION To REPRODUCE THISMATERIAL IN MICROFICHE ONLYHAS BEEN GRANTED BY
,t73-141cs,
TO THE EDUCATIONAL RESOURCESINFORMATION CENTER (ERIC)."
Linn-Benton Community CollegeAlbany, Oregon
2
JAR TEST
Written By:E. E. Arasmith
Linn-Benton Community CollegeAlbany, Oregon
Instructional Design:Priscilla HardinCorvallis, Oregon
ProjectJianagement.John:.W. Carnegie, Ph.D.'.
Linh7Benton Community CollegeAlbany, Oregon.
Project Officer:Lynn S. Marshall
United States Environmental Protection AgencyNational Training,and Operational Technology Center
Cincinnati, Ohio
Developed Under,EPA Grant #900953010
August, 1981
a
Subject
JAR TEST
CONTENTS
"Iv
Page
Instructional Goals1 Jt-1
In50^uctor Activity Jt-1
Student Activity Jt-1
Instructional Materials List Jt-2
Appendix Introduction Jt-3
Appendix A
Stock Solution From Dry Chemicals
Appendix B
'Stock From Concentration Solution
Appendix C
Stock Solution From Both Mix Dry Feeders
Appendix D
Stock Solution From A Liquid Batch Mix Jt-19
Answers to Worksheet W-Jt-2
Student Materials S-Jt-1 thru 27
SW-Jt-1 thru 2
Jt-i. 4/82,

INSTRUCTIONAL GOALS
Upon completion of this Tesson you should be able to successfully
'rup the jar test and accurately record the data and observations.
INSTRUCTOR AcTrviry -
For best results folloW this sequence:
Activity
1. Review the objectiVes with the students.
2. )-fave the students read-through the procedure.
3. View the video tape, "J'ar Test Procedure".
4, Demonstrate'the procedure.
5. Assign the worksheet.
6. Zorrect the worksheets.
7.. Perform the test.
OTKRACTIVITIESH
-
Time
5 minutes
10 minutes .
70 minutes
15 minutes
15 mintues
5 minutes
120 minutes
, If time permits, have tile students experiment with various
tompinations.(pf,pritary coagulant lime and ,polyelectrolytes.
. ..:EachcOMbinetfon t'Oul,d.itake from 30 minutes to an hour.
2. AlSo,-tfiMe allows haVe the: stUderits perform:the test on
several different types of semPles.
3. If you haVe time, practice-calculating dosage reouirements.
.(See Student MateHalt - 'Supplemeniary Materials', Part
and-Appndlxes Ai 8, C and D:)
STUDENT ACTIVITIES
1. Read the objectives.
2. Read the procedure.
3. View the video tape "Jar Test Procedure".
4. Complete the worksheet.
5. Perform the test.
6. Record the data.
Jt-1 of 24
5
4/82
INSTRUCTIONAL MATERIALS LIST
1. Instructor's Guide "Jar Test"
2. Student Workbook "Jar Test"
3. 3/4" cassette video tape player
4. Color television set
5. _Overhead projector
6. Projector screen
7. Visa-Visa pens and acetate for overhead projector_
8. Blackboard and chalk
9. Equipment 'listed in the lab procedures
6
Jt-2 of 24 4/82
APPENDIX INTRODUCTION
The preparation of stock solutions continues to be a
difficult task even for those individuals with some background
in solution preparation. Therefore, we have developed the
following procedures to help you in teaching the procedures.
These_ four appendixes will follow the Supplementary
Materials in the Student Workbook. You may not need to go
through all,four procedures. Poll the students to find their
needs; then cover only the needed procedures.,
Jt -3 of 24
"S
4/82

APPEND! X A
STOCK SOLUTION FROM DRY CHEMICALS - used with page S-Jt-7, Student'Work-
book (Supplementary Materials).
This is a straightforward procedure and only requires the weighing
of the reagent and then dissolving the reagent in distilled water
in a volumetric flask. The flask is then filled with distilled411,
water until you reach the full mark. The reagent must be taken
from the chemicals that are being fed at the plant. New stock
should be made each time a new batch of chemicals is used.
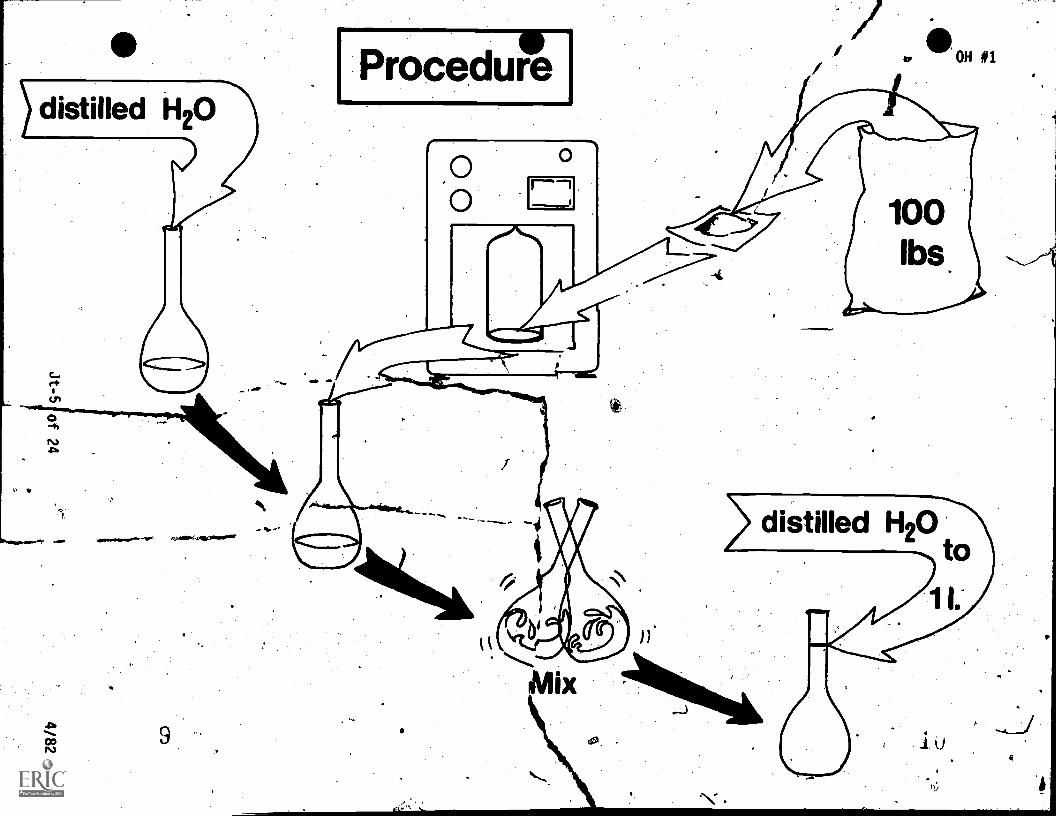
OH#1 -.This overhead shows the step by step procedure for making
the reagent.
The procedure is- as follows:
1. Assume a dosage requirement.
2. Select the amount of chemical needed (column 2, table
on OH#2)0
3: Obtain a sample of chemical being fed.
4. Weigh to the nearest 0.1 g.
5. Place,Z00 ml of distilled H20 in the volumetric flask.
6. Transfer dry chemical to volumetric flask.
7. Mix until dissolved7,
8. Dilute to 1 liter with Aistilled water.
9. Transfer'to storage bottle.
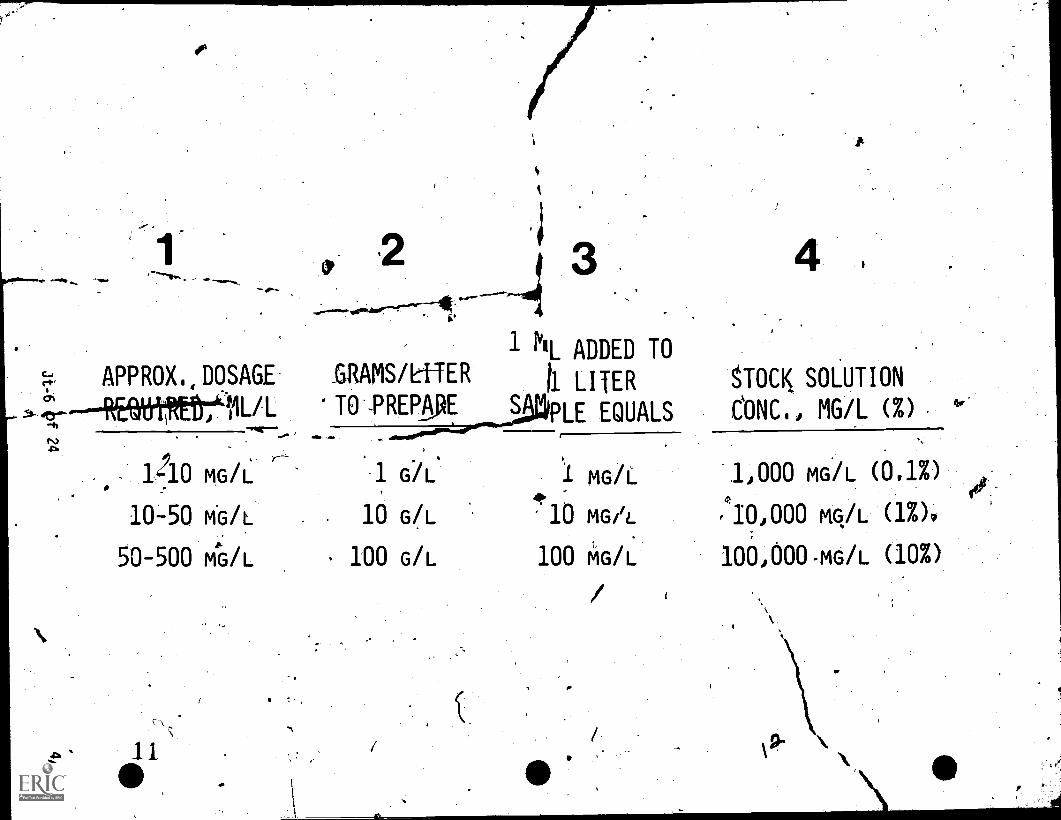
OH#2 - This is an overhead of die amount of chemical-s needed to
obtain a set dosage.
Notice that the lab technigian.must start by assuming a dosage
-range. Next, the amount of chemical to make one. liter is found.
The final data is the concentration of the stock solution.
Column 3 gives the dosage received from each 1 ml of stock when
it is placed in 1 liter of sample.
jt-/4 of.24 4/82
2 3
N. ADDED TOAPPROX.,DOSAGE LRAMS& ER k LITER
%IL 'TO -PREPAPE iPLE EQUALS
00 MG/L.
10-50 Wt.
50-500 A/L
1 OL
16 G/L
. 100 G/L
MG/L
'10 MG/L
100 tiG/L
8JOCK SOLUTION
CONC., MG/L (%)
1,000 MG/L. (0.1%)
:i0,000 mq/L (1%)0
IOOJ 000-MG/L (10%)
9-

spizzpix 6
STOCK FROM CONCENTRATED SOLUTION
,Solutions of-Alum, Ferric Chloride, Ferric Sulfate, nd other
concentrated solutions require the use cif the spec.fic gravity
of the solution in order to determine the exact'concentration.
When specific gravity '(Sg). is notknown it can be found be weighing41, .
a known volune,,of the s011ution and -cOMparipg it to the weight
of water\ (See Student Supplementaryfor more_details..)
Although there are other more scientific methods of dealing With
this type of problem we find this to be one of-the two most
acceptable methods. Pie other that is a gross measurement will
yield acceptable results but will not give absolute data about
concentration. This rough 'method uses a straight dilution. That
is if you want 1 liter of 1% solution, simply use a pipet to
obtain-10 ml (0.01 X 1000 m1 = 10 ml ) of the stock. Place this in a
1 liter volumetric flask and dilute with distilled H20.
Remember that 1% is equal to.10,000 mg/l.
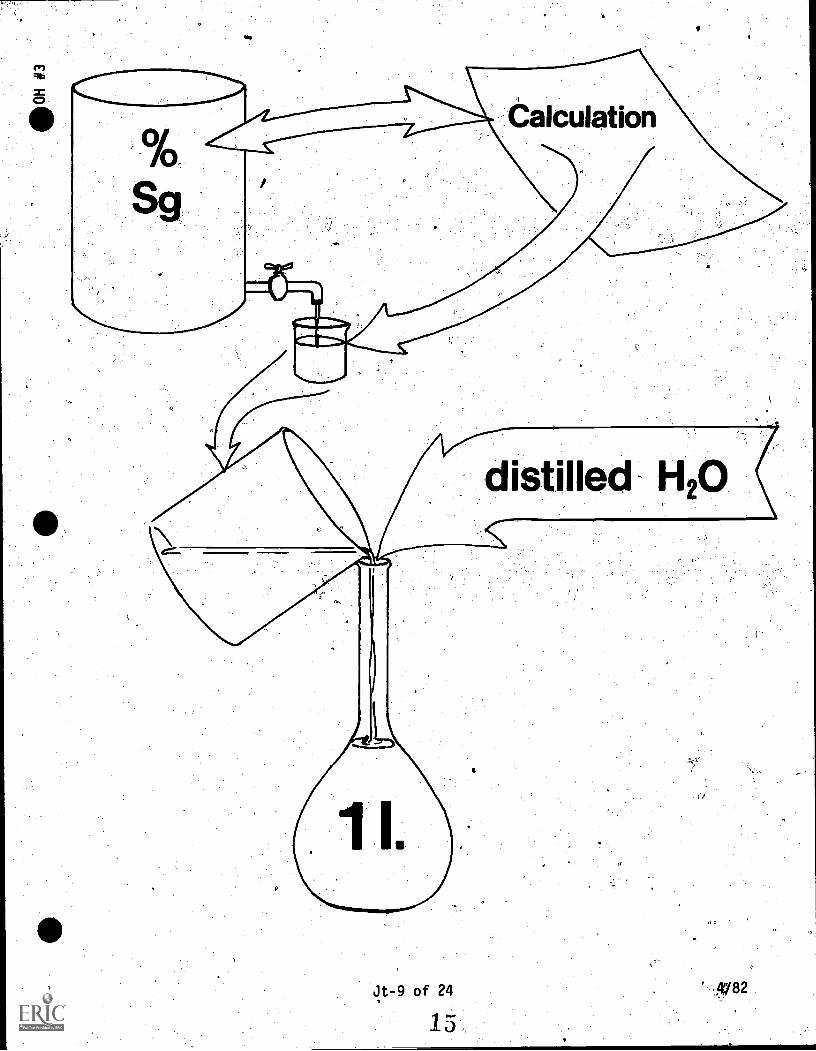
OH#3 - The procedure for using Sg and percent concentration
to make a stock solution.
The Procedure
,l. Determine the specific gravity of the feed solution--
OH#4.
-Determine the needed concentration of stock solution.
This may be done by using the table on OH#2. The key
element is making an estimation of the approximate
dosage required.
3. Calculate the volume of feed solution necessary. Use
OH#5.
4. Obtain the required volume'of feed solution.
5. Transfer this volume to a one litdr volumetric flask.
6. Dilute to one liter with distilled water.
Jt4 of 24, 1 3 4/82
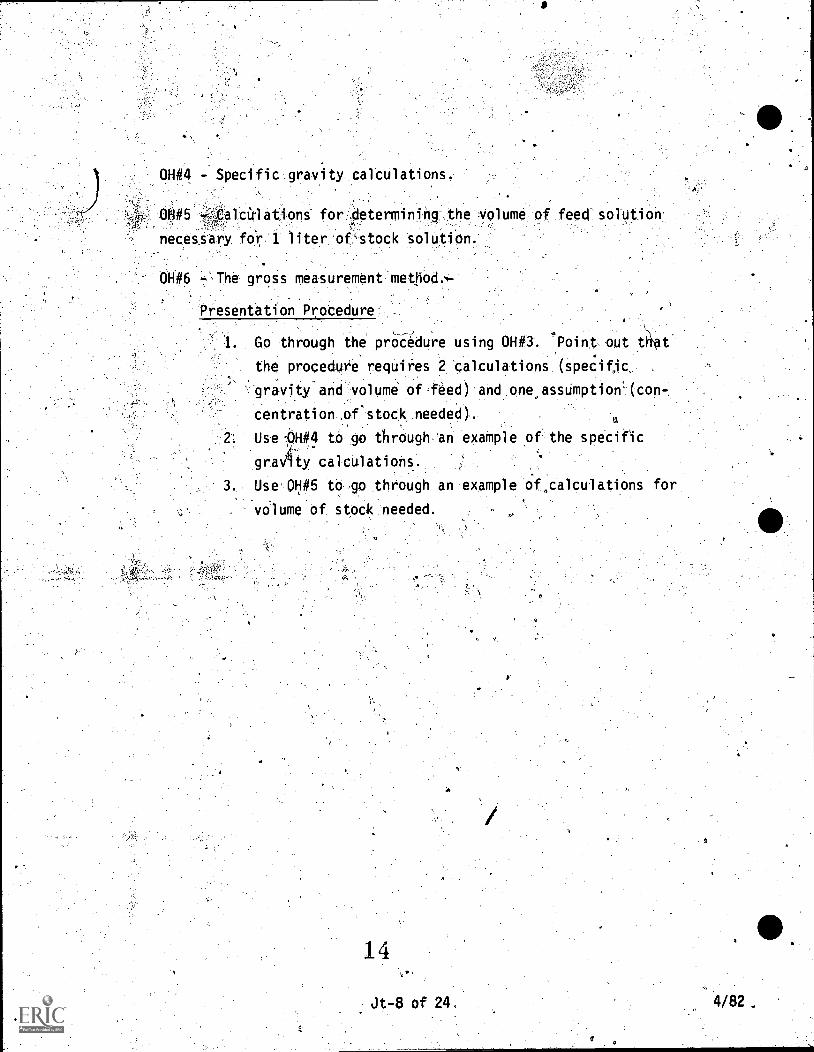
OH#4 - Specific gravity calculations.
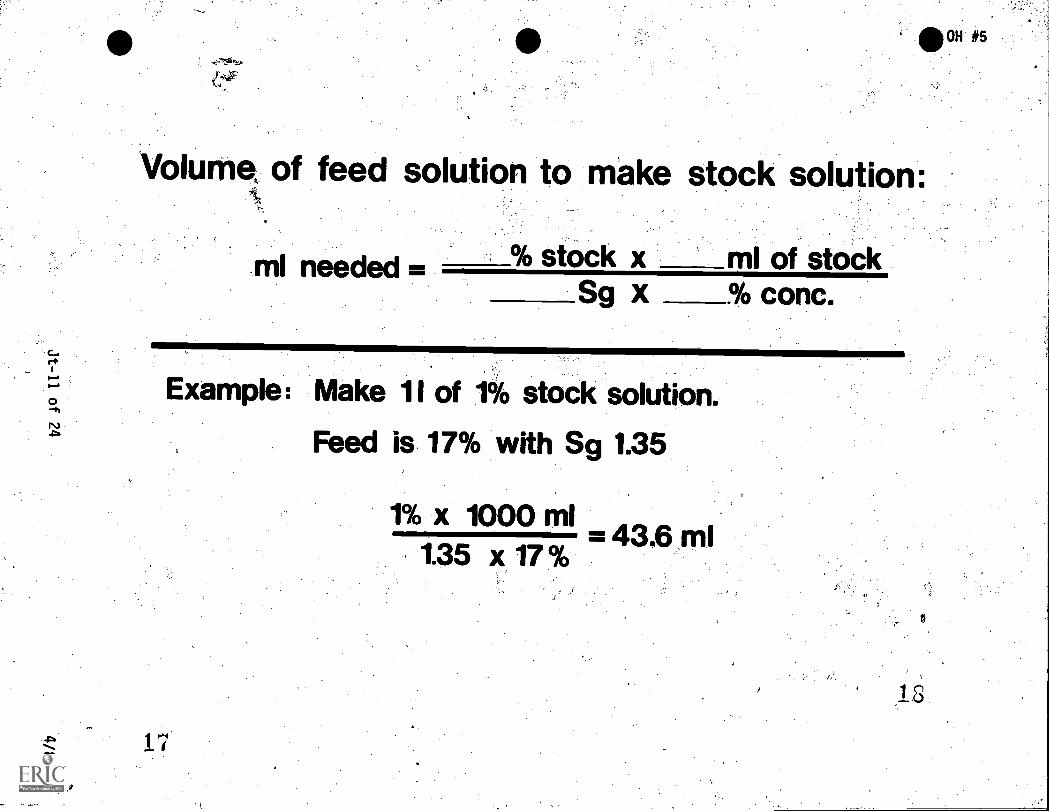
H#5 Calcirlations fordetermining the Nolume of feed solution
necessary f6r 1 liter of'stock solutiOn.
The gross measurement- method.*-
resentation Protedure
Go '.through the' prOcedure using OH#3. 'Point,-out
the procedure requires 2 CAlCulations (specifjc,'.
Aravity*andvolume of,feed)-and.one assUmpticw(con7
centration:.of stock,.needed), %
Use-OH#4 to go through an example of the specific
grav4ty-calculations.
Use'OH#5 to go through an example ofcalculations.
volume of stock needed.1
for
14
Jt-8 of 24, 4/82 .
Jt-9 of 24
15_
;4182

pecific Gravity Calculation
of known volume Qr.w of equal volume H20 `2Fw
Examp e: 10 mi alum weighs 13.5grams
3.5 grams alum 13.5gwt. of 10 ml H20 = 10g
R-10 of 24
'
4/82
OH #5
Vo ume of feed solution to make s ock solution:
ml needed - /0 stock x ml of stockSg x % conc.
Example: Make 11 of 1% stock solution.
Feed is 17% with Sg 1.35
17
1% x 1000 ml - 43.6 ml135 x 17%
1 s
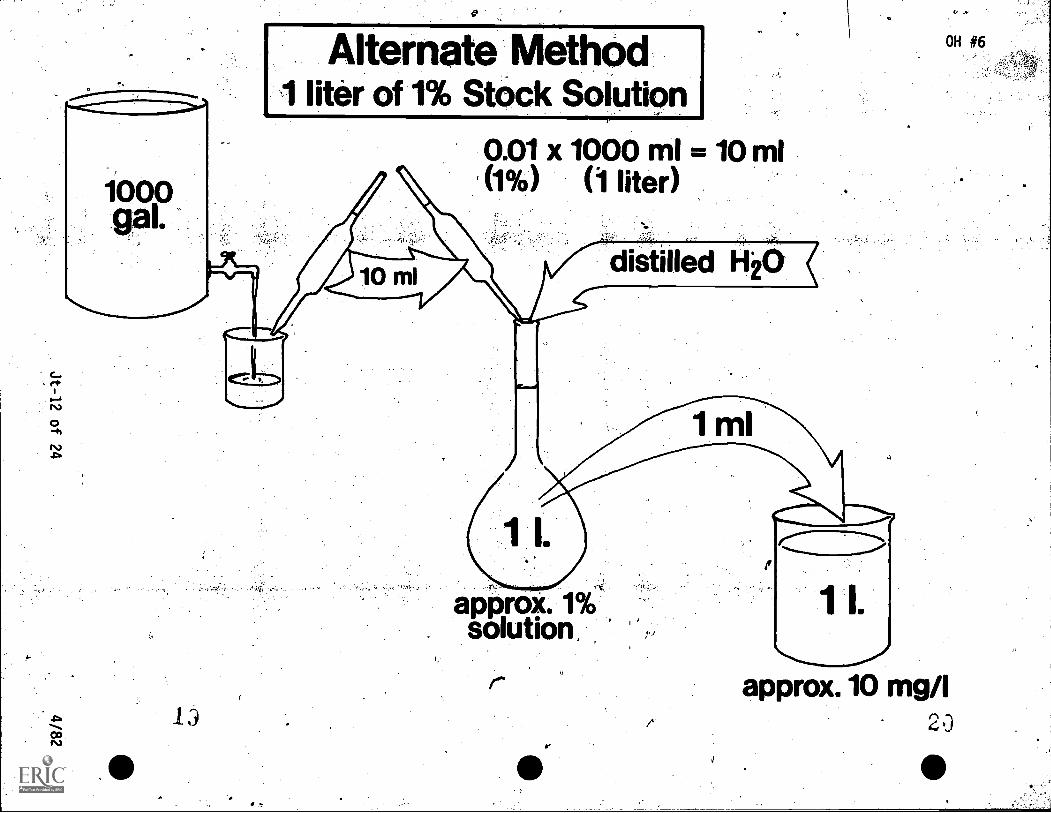
Alternate Method1 liter of 1% Stock Solution
0.01 x 1000 ml = 10 ml(1%) (l liter)
13
approx. 1%solution,
approx. 10 mg/I20
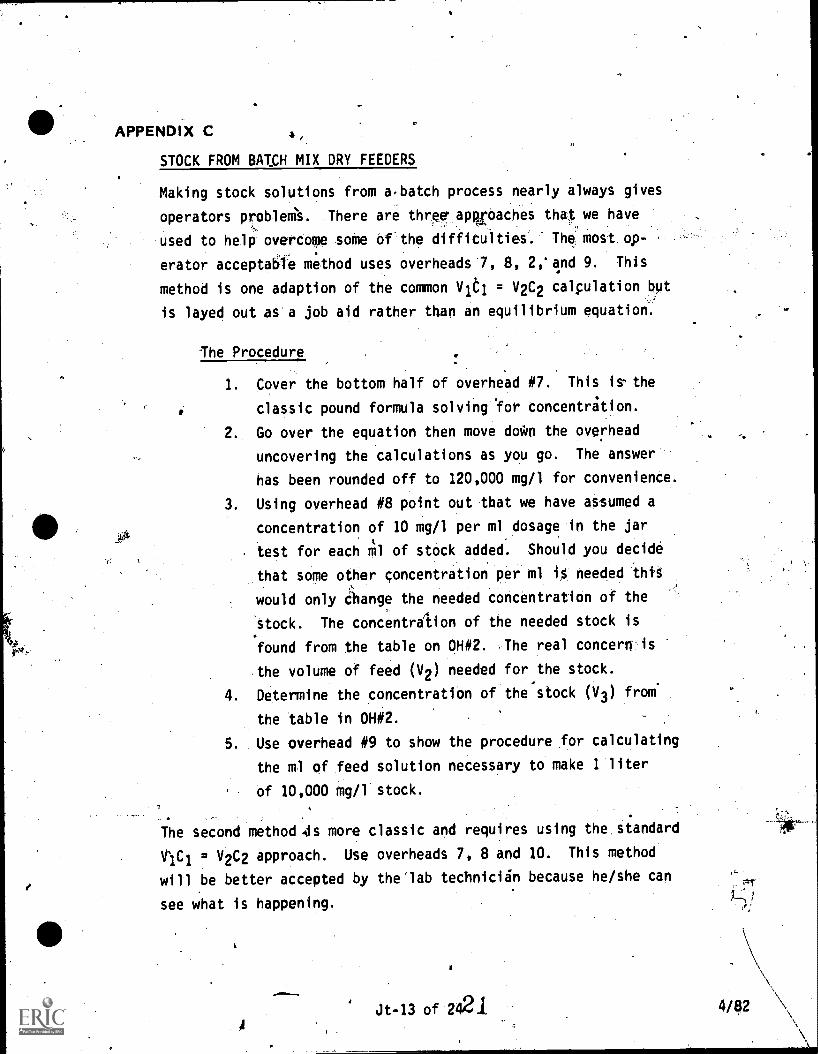
APPENDIX C
STOCK FROM BATCH MIX DRY FEEDERS
Making stock solutions from a,batch process nearly always gives
operators problem. There are three enroaches that we have
used to help overcome some of the difficulties. The most op-
erator acceptable method uses overheads 7, 8, 2,*and 9. This
method is one adaption of the common Vit1 = V2C2 calculation bpt
is layed out as a job aid rather than an equilibrium equation.
The Procedure
1. Cover the bottom half of overhead #7.. This 1s the
classic pound formula solving "for concentrition.
2.. Go over the equation then move doOn the overhead
uncovering the calculations as you go. The answer'
has been rounded off to 120,000 mg/1 for convenience.
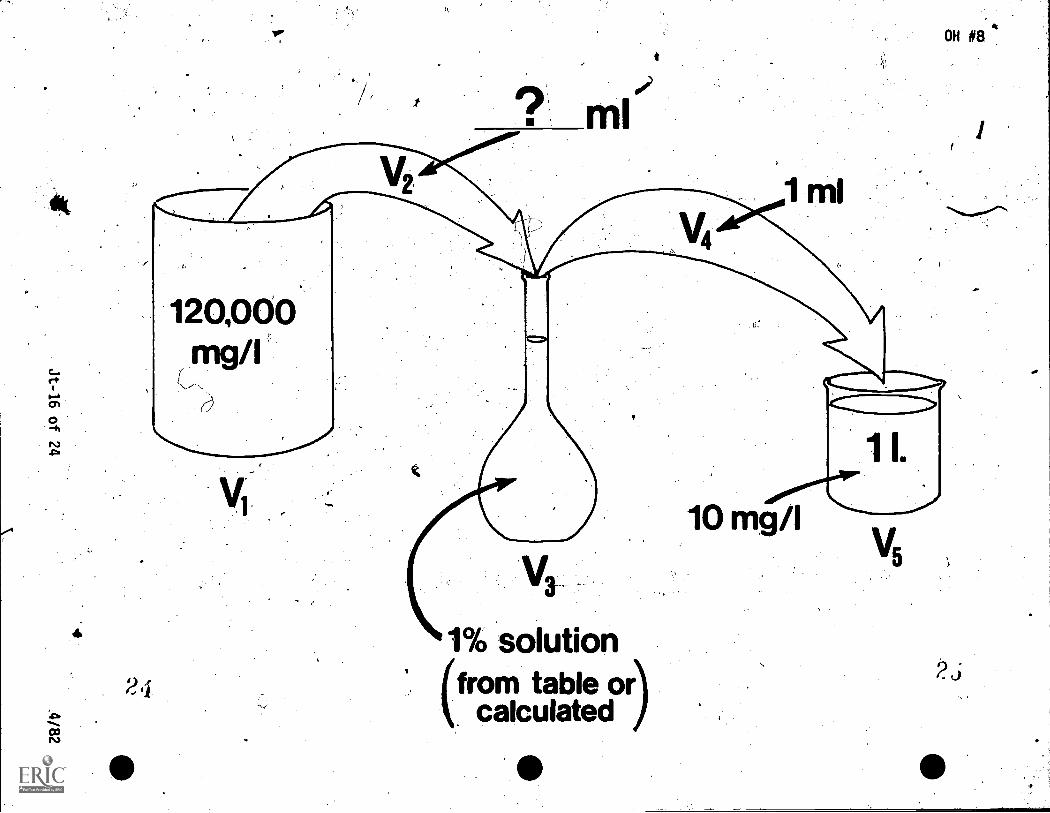
3. Using overhead #8 point out tbat we have assumed a
concentration of 10 mg/1 per myosage in the jar
test for each M1 of stock. added. Should you decide
that some other concentration per ml t needed thtt
would only Change the needed concentratiOn of the
stock. The concentration of the needed stock is
found from the table on 0H#2. ,The real concerOs
,the volume of feed (V2) needed for the stock.
4. Determine the concentration of the stock (V3) from
the table in 042.
5. Use overhead #9 to show the procedure for calculating
the ml of feed solution necessary to make 1 liter
of 10,000 mg/1 stock.
% 'o
The second method Ais more classic and requires using the.standard
TIC1 211 V2C2 approach. Use overheads 7, 8 and 10. This method
will be better accepted by the'lab technician because he/she can
see what is happening.
....Jt-13 of 2421

The Procedure
1. The first portion of the procedure is the same4as
above. Use OH#7 to determine the concentration of
the feed solution.
2. USe OH#8 to show the values needed. The trick here
is again'to assume a concentration in the jar test.
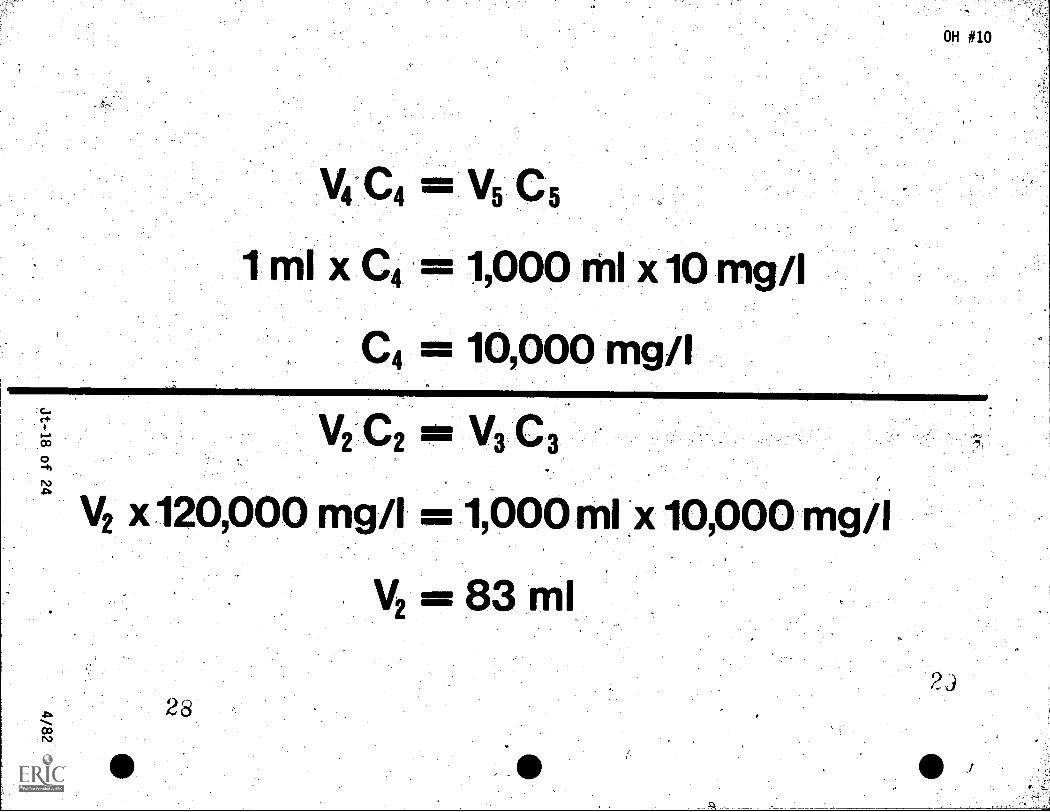
3. Use OH#10 (top half) to show the procedure for cal-
culating the needed concentration of stock.
(10,000 mg/1)
4. Finally, using .010100(bottom half) calculate the
volume of 6ed necessary to produce a 10,000 mg/1
- stock.
0H#7'- Calculations for concentration of batch olution. Con-
centration expressed in mg/l. /
\OH#8 - A flow chart showing the steps required ih\making the stock.
OH#9 - Calculations for determining the amount of b4ch solution
necessary to make'a given concentration of stock.
0 , ,
OH#10 - Calculation for yolume of batch needed, using th,
f
V2C2 approach. ,
ty't
22
Jt-14 of 24 14/82

Feed300 gaL
Conc. mg/I lbs. Fhemical x 11000,000gal H20 x 8.34 lbs/gal.
300 lbs. x 1,000,000300 gal. x 8.34 lbs./gal.
= 119,000 mg/OR
120,000 mg/I.
OH #8
24
1% solution(from table or)calculated

conc. of stock, nig/t x 1000 rniconc. of batch, mg/I
27
C5
1,000 ml xiO g/I
105000 mg/I
V2C2 V3C3
2 X120P00 mg/I 1000
V2=83m
OH #10
x10,000 m9/1
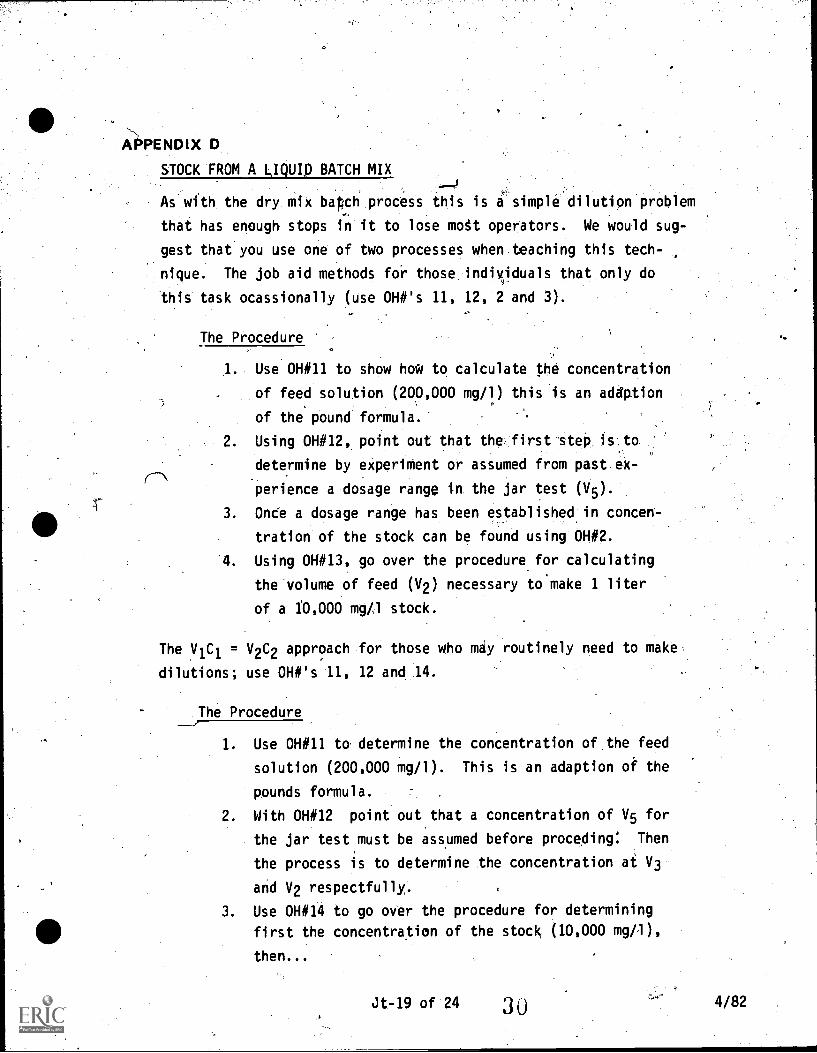
A43PENDIX D.
STOCKTROM A LIQUID BATCH MIX
As with the dry mix bapch process this is i simple dilution problem
that has enough stops in it to lose mott operators. We would sug-
gest that you use one of two processes when teaching this tech-
nique. The job aid methods fdr those indiOduals that only do
this task ocassionally (use OH#'s 11, 12, 2 and 3).
The Procedure
1. Use OH#11 to show hoW to calculate the concentration
of feed solution (200,000 mg/1) this is an addption
of the pound formula.
2. Using OH#12, point out that the first step is.to
determine by experiment or assumed from past ex-
perience a dosage range in the jar test (V5).
3. Onte a dosage range has been established in concen-
tration of the stock can be found using OH#2.
4. Using 0E1413, go over the procedure for calculating
the volume of feed (V2) necessary to'make 1 liter
of a f0,000 mg/1 stock.
The ylci = V2C2 approach-for those who miy routinely peed to make
dilutions; use OH#'s 11, 12 and:..14.
,The Procedure
1. Use OH#11 to determine the concentration of.the feed
solution (200,000 mg/1). This is an adaption of the
pounds formula.
2. With OH#12 point out that a concentration of V5 for
the jar test,must be asspmed before proceding: Then
the process is to determine the concentration ai V3
and V2 respectfully.
3. Use OH#14 to go over the procedure for determining
first the concentration of the stock (10,000 mg/1),
then...
Jt-19 of 24 30 4/82
4. using the newly calculated concentration fcit,the
stock, determine the volume of feed (50 mg/1),r
needed.
OH#11 --Calculattons for determining the concentration of liqOA
in the batch.'
,--
OH#12 - rlow diagram of Rrocedure.
OH#13 - Calculations for determining the volume of batch feed
needed to make 1 liter of 10,000 mg/1 stock..
'OH1114 - Ca.lculations for making a 1.0,000 mg/1 sibck usfng the
VISA = V2C approffh.
N
31
Jt720 of 24 4/82
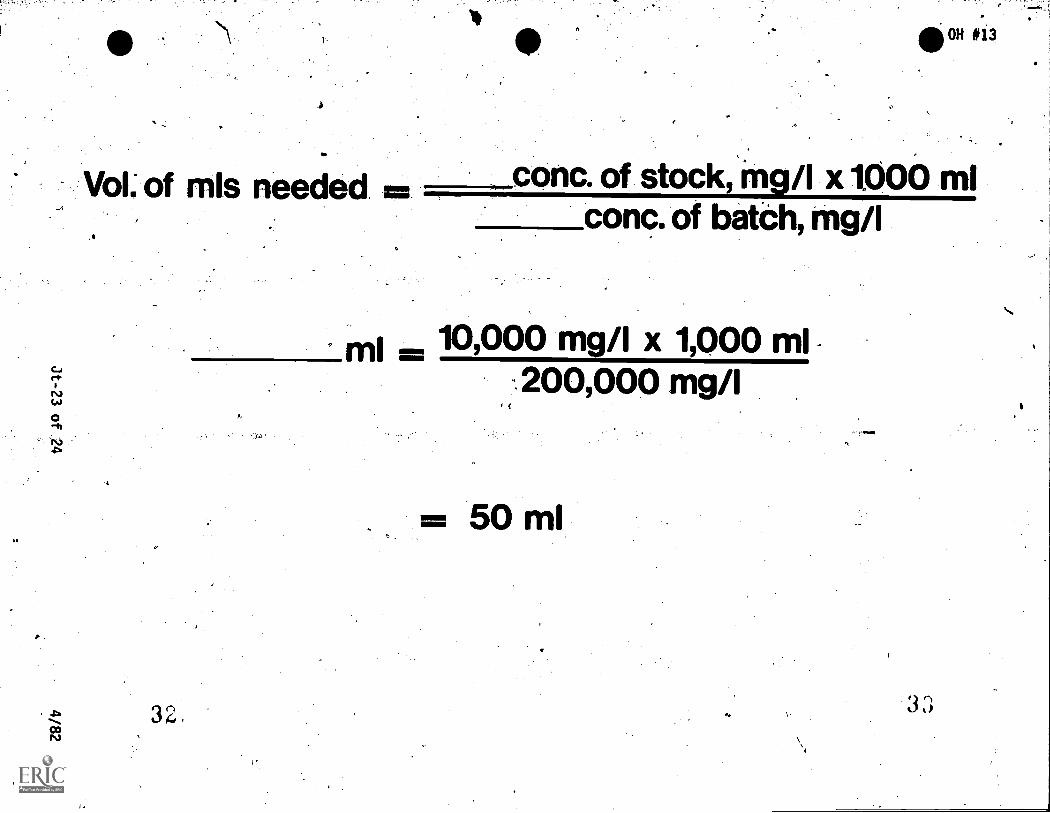
,...Vo -'of Mils needed
'
conc of stock, mg/I x 1000 mlconc. of batch, mg/I
10,000 mg/I x 1,000 m-200,000 mg/I
50 ml
:3 3

Concentration of Stock NeededV4 C4 V5 C5
V4 x 1 IT11 a- 1,000 MI X 10 mi/i
V4 = 10,000 mg/I
Volume of Batch for 1 Liter StockV2 C2 = V3 C3
V2 X 200,000 mg/I = 1,000 ml x10,000 mg/I
V2 = 50 mi

JAR TEST
WORKSHEET
DirectiOns: Place an "X" by the best answ.ot. Therg is only onebest answer for each question.
1. In order to perform the jar test you shou44 collect a samplevolume of:
a) 2 1/2 gallons._
b) X 5 gallons.
c) 2 1/2 liters.
d) 5 liters.
e) All of the above.
2. When the actual plant data is not available, ash mix in thejar tett should be for how much time?
a) X- 5 minutes
b) 10 30 seconds
c) 5 - 30 minutes
d) 1 - 8 minutes
e) 4 None of the above.
3. Which, qne4A the following is in correct sequen,he?-
a) X Turn on the flash mix, thdh add chem4calS.
b) Add the chemicali then turn on the klash mix.
c) Slow siir then flash mix. /
d) Flash mix then slow stir.
e) All of the above.
4. When plant data is not available, the slow stir time should beapproximately:
a) 10 - 30 seconds.
b) 30 - 60 minutes.
c) i0 - 40 minutes.
d) X 15 - 30 minutes.
All of the above.
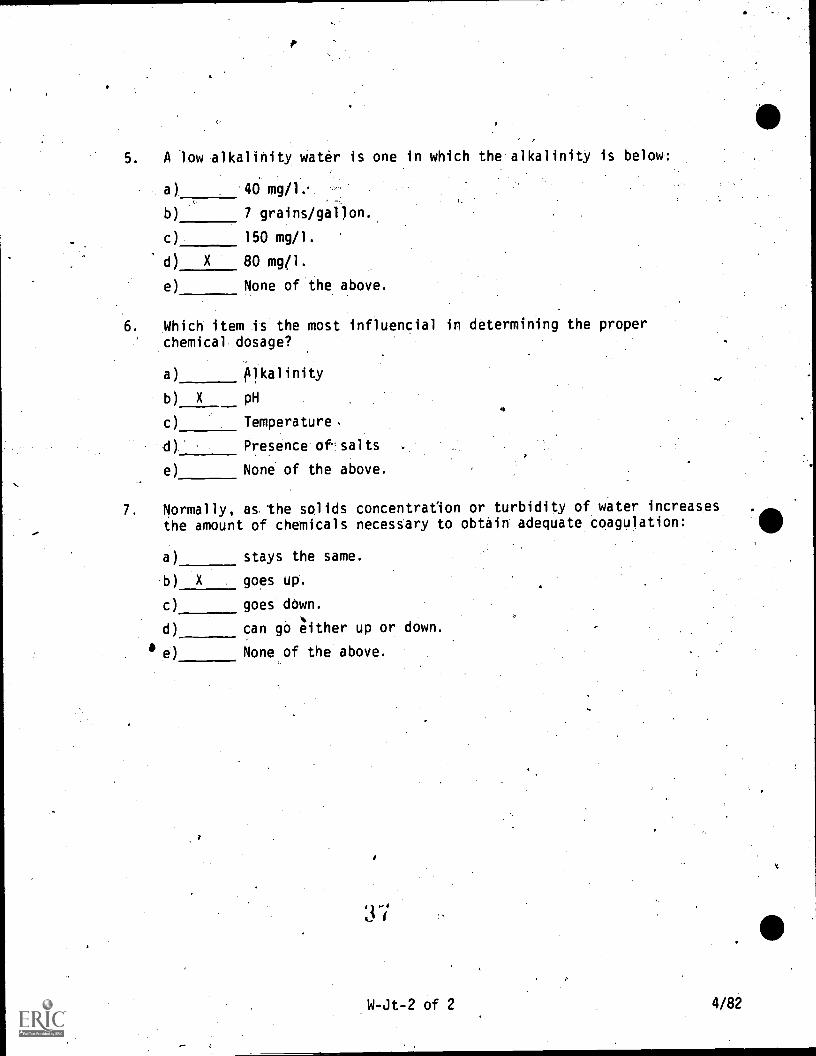
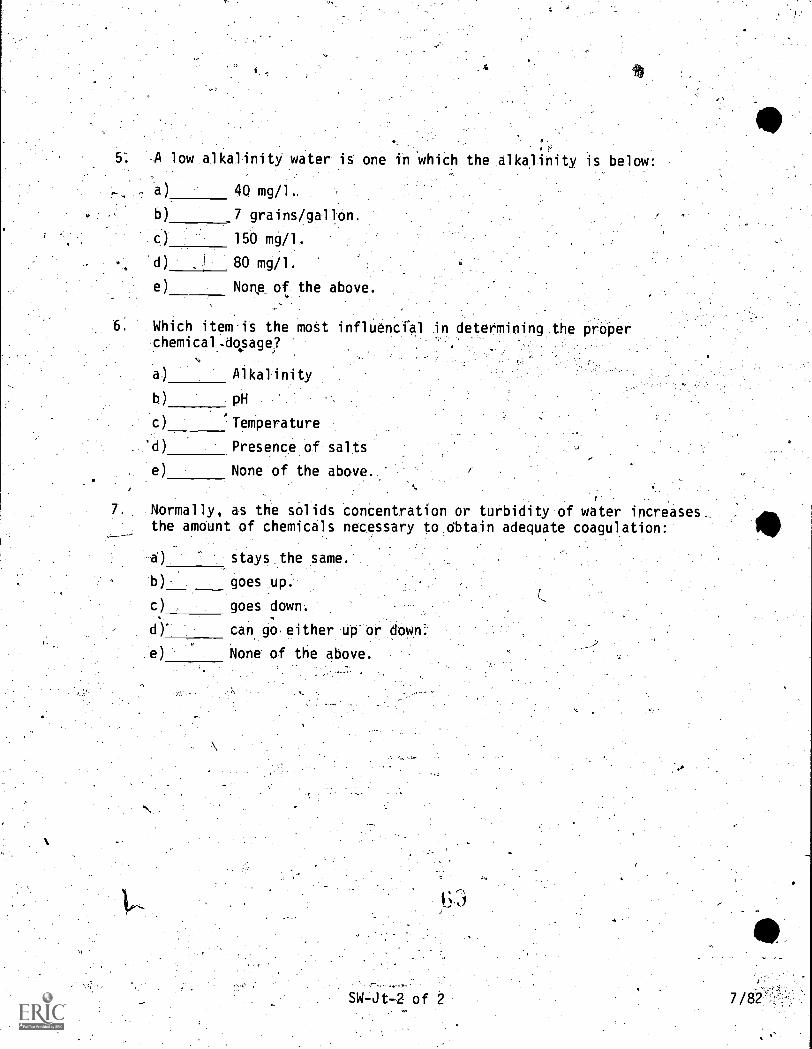
5. A low alkalinity water is one in which the alkalinity is below:
a) 40 mg/1..
b) 7 grains/gal)on.
c) 150 mg/l.
d) X 80 mg/l.
e) None of the above.
6. Which item is the most influencial in determining the properchemical dosage?
a) Alkalinity
b)X pH
c) Temperature.
d) Presence of=salts
e) None of the above.
7. Normally, as the solids concentratlon or turbidity of water increasesthe amount of chemicals neces5ary to obtain adequate coagulation:
a) stays the same.
.b) X goes up.
c) goes (limn.
d) can go fther up or down.
None of the'above.
:3 7
Operational Control Testsfor Wastewater Treatment Facilities
e
Jar TestStudent Workbook

JAR TEST
Written By:E. E. Arasmith
Linn-Benton Community CollegeAlbany, Oregon
Instructional Design:-.Priscilla _Hardin
Corva 1 l ts , Oregon
Project Managrnentohn W. Carnegje, Ph.D.Benton Community CollegeAlbany, Oregon
dro
Project Officer:Lynn S. Marshall
United States Environmental Protection AgencyNational Training and Operational Technology Center
Cin(inhati, Ohio .
.
Devetoped UnderEPA Grant 0900953010 411r
Auguit, 1981
)3;,)
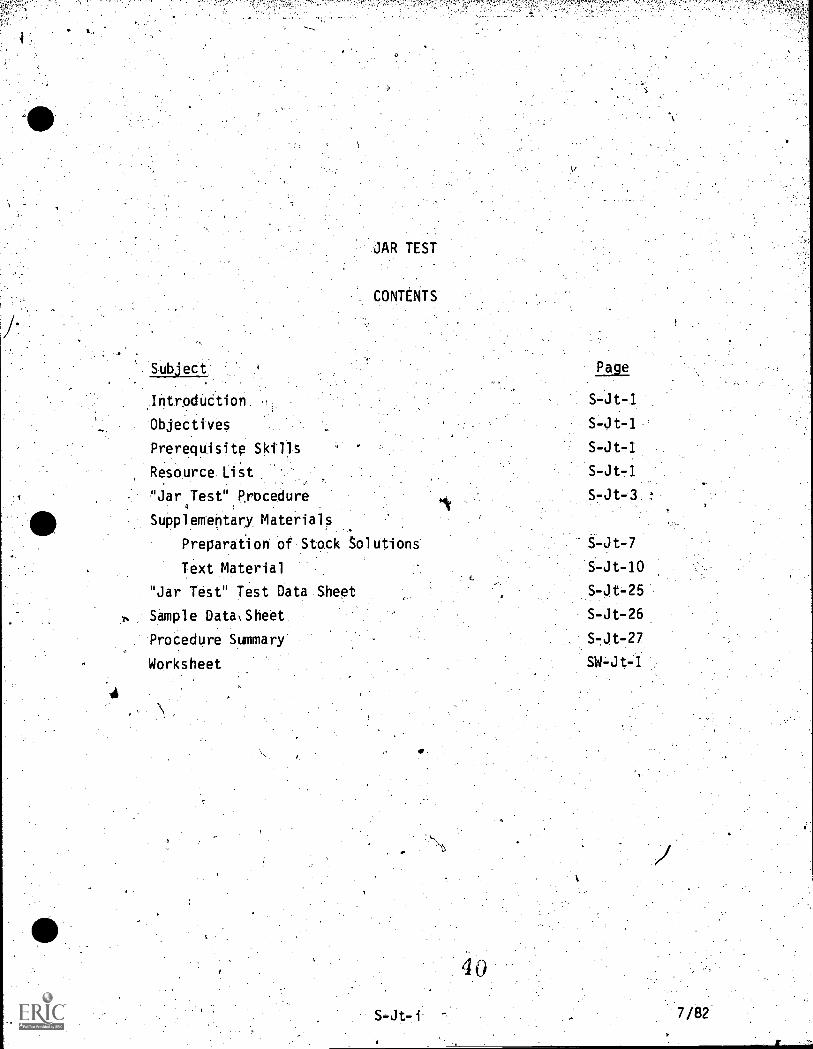
Subject:
IntroduCtion
Objectives.
Prerequisite Skills
Resource Li St
"Jar 4.Test",Procedure
SuPplementary Material
Prepara0o6 of Stock Solutions
Te)ct Material
"Jar Test" Test Data Sheet
Sampl e Data \ Sheet
-Procedure Summary'
Worksheet
S-Jt4
S-Jt-10
S-Jt-26
SW-Jt-1
S-Jt- i 7/82
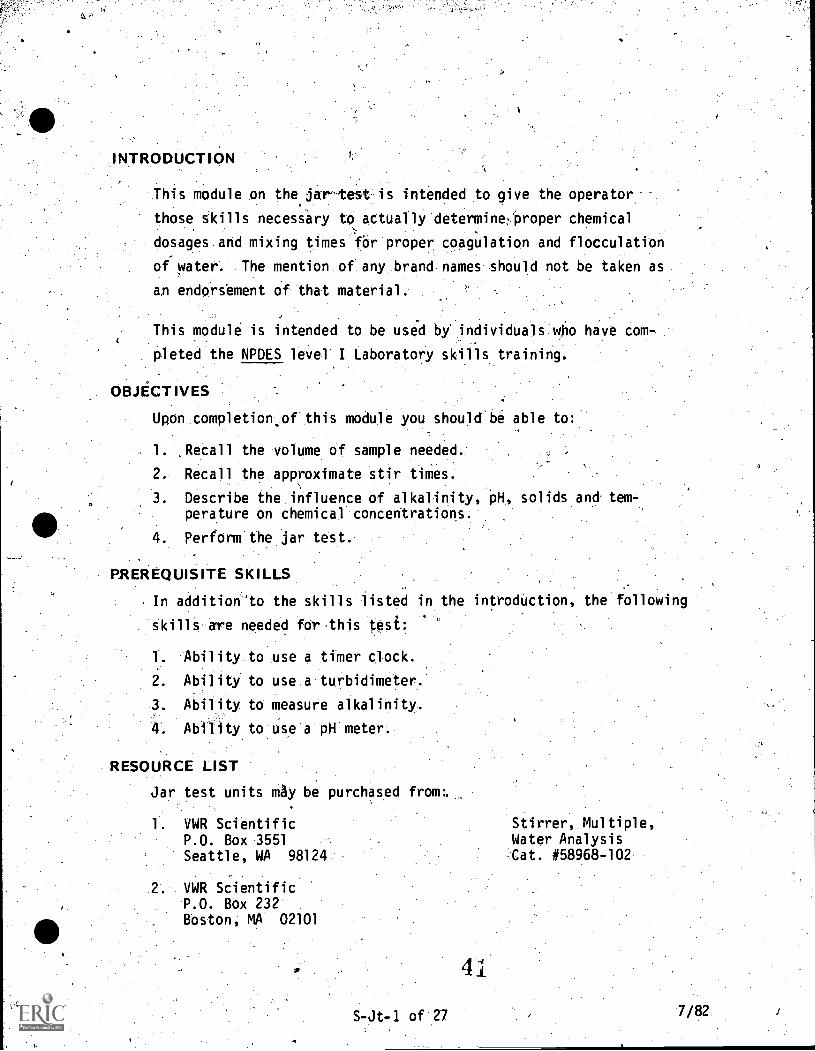
INTRODUCTION
This module on the,jar test is intended to give the operatorthose skills necessary to actually determineroper chemicaldosages and mixing times for proper coagulation and flocculationof water. The mention of any brand names should not be taken asan endorsement of that material.
This module is intended to be used by individuals w,ho have com-.
pleted the NPDES level I Laboratory skills training.
OBJECTIVES
Upon comp1etion.of this module you should be able to:
1. Recall the volume of sample needed.2. Recall the approximate stir times.3. Describe the influence of alkalinity, pH, solids and tem-,
perature on chemical concentrations.4. Perform the jar test.
PREREQUISITE SKILLS
In addition'to the skills listed in the introduction, the followingskills aare needed fo'r this test:
1. Ability to use a timer clock.2. Abi1ity to use a turbidimeter.
Abil ity to measure al kal inity.. Ability to use a pH meter.
RESOURCE LIST
Jar test units Ay be purchased from:.
1. VWR ScientificP.O. Box 3551Seattle, WA 98124
2. VWR ScientificP.O. Box 232Boston, MA 02101
S-Jt-1 of.27
Stirrer, Multiple,Water Analysis
Cat. #58968-102
7/82
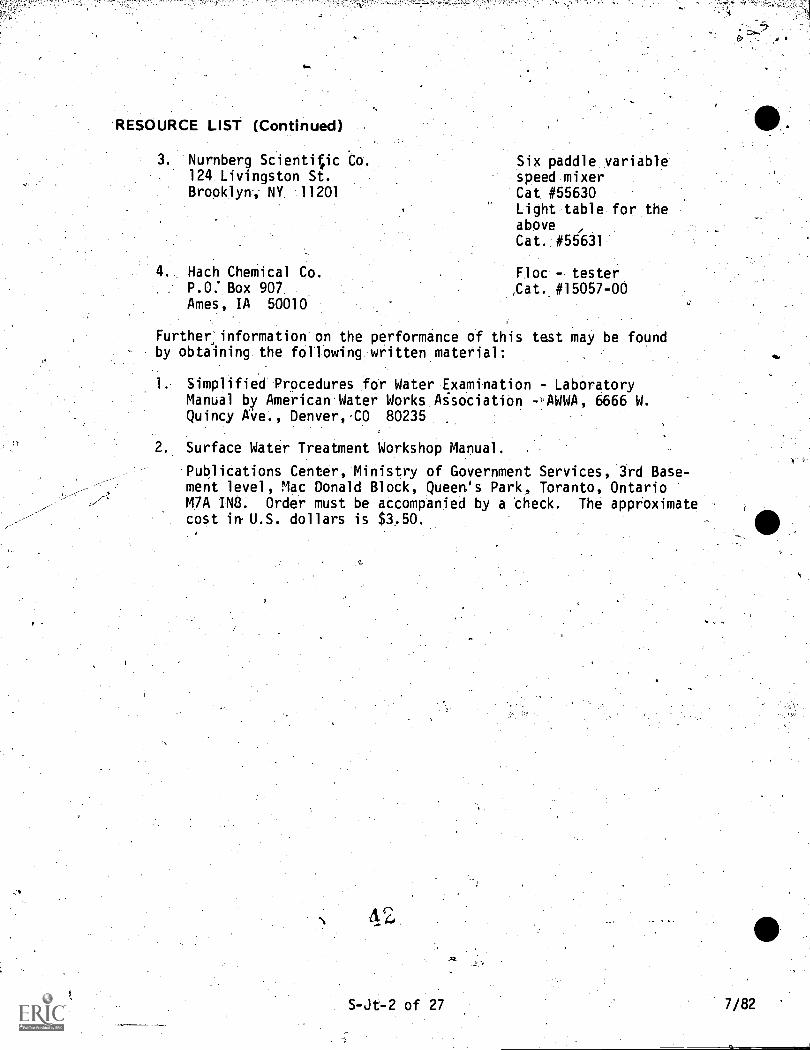
RESOURCE LIST (Continued)
3. Nurnberg Scientifeic C124 Livingston St.Brooklyn', NY 11201
Hach Chemical CP.O: Box 907Ames, IA 50010
Six paddle variablespeed mixerCat #55630Light table for theaboveCat. #5431
Floc - tester(Cat. #15057-00
Furtherinformation on the performance of this test may be foundby obtaining the following written material:
1. Simplified Procedures for Water Examination - LaboratoryManual by American Water Works Aisociation -,AWWA, 6666 W.Quincy Ave., Denver,,C0 80235
2. Surface Water Treatment Workshop Manual.
Publications Center, Ministry of Government Services, 3rd Base-ment level, Mac Donald Block, Queen's Park, Toranto, OntarioM7A IN8. Order must be accompanied by a 'check. The approximatecost in-U.S. dollars is $3.50.
S-Jt-2 of 27 7/82
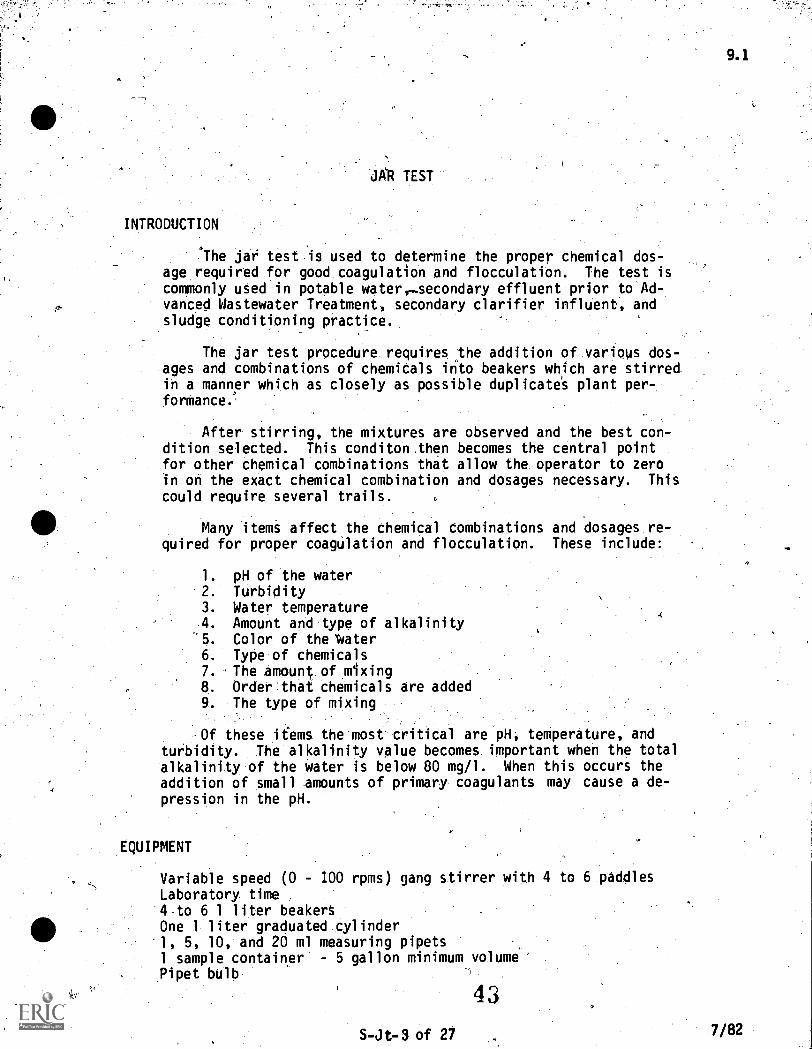
JO TEST
INTRODUCTION
The jar test is used to determine the proper chemical dos-age required for good coagulation and flocculation. The test iscommonly used in potable waterr-secondary effluent prior to Ad-vanced Wastewater Treatment, secondary clarifier influent, andsludge conditioning practice.
The jar test procedure requires the addition of various dos-ages and combinations of chemicals irito beakers which are stirredin a manner which as closely as possible duplicate's plant per-formance.
After stirring, the mixtures are observed and the best con-dition selected. This conditon then becomes the central pointfor other chemical combinations that allow the operator to zeroin on the exact chemical combination and dosages necessary. This
could require several trails.
Many items affect the chemical combinations and dosages re-quired for proper coagulation and flocculation. These include:
1. pH of the water-2. Turbidity3. Water temperature4. Amount and type of alkalinity5. Color of the Water6. Type of chemicals7. The amount of mixing8. Order that chemicals are added9. The type of mixing
Of these items the most critical are pH, temperature, andturbidity. The alkalinity value becomes important when the totalalkalinity of the water is below 80 mg/l. When this occurs theaddition of small amounts of primary coagulants may cause a de-pression in the pH.
4
EQUIPMENT
Variable speed (0 - 100 rpms) gang stirrer with 4 to 6 paddlesLaboratony time4 to 6 1 liter beakersOne 1 liter graduated cylinder1, 5, 10, and 20 ml measuring pipets1 sample container - 5 gallon minimum volumePipet bulb
43
5-Jt-3 of 21
9
9.1
7/82
9.2
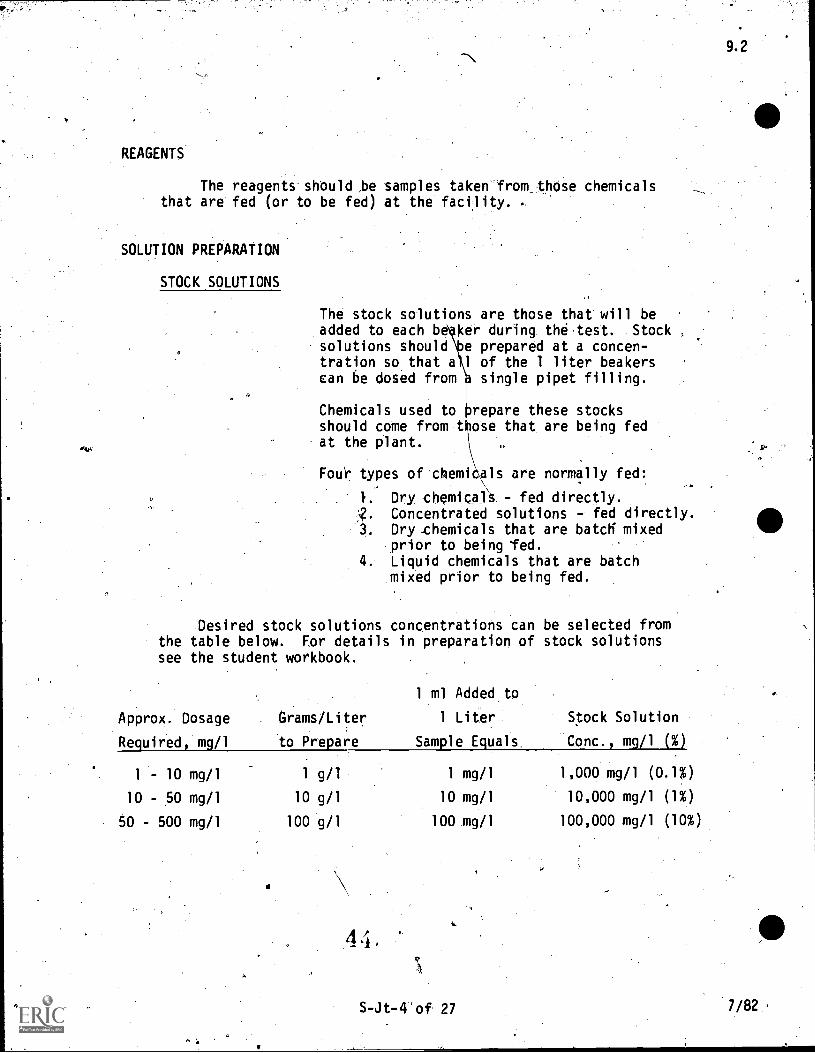
REAGENTS
The reagents should ,be samples taken from_those chemicalsthat are fed (or to be fed) at the facility. .
SOLUTION PREPARATION
STOCK SOLUTIONS
The stock solutions are those that will beadded to each be ker during thé test. Stock ,
solutions should e prepared at a concen-tration so that a 1 of the 1 liter beakerscan be dosed from single pipet filling.
Chemicals used to repare these stocksshould come from t ose that are being fedat the plant.
Fou'r types of chew als are normally fed:
_ 1. Dry chemicals - fed directly.Concentrated solutions - fed directly.
3. Dry zhemicals that are batcli mixedprior to being led.
4. Liquid chemicals that are batchmixed prior to being fed.
Desired stock solutions concentrations can be selected fromthe table below. For details in preparation of stock solutionssee the student workbook.
Approx. Dosage
'Required, mg/1
Grams/Liter
to Prepare
ml Added to
1 Liter
Sample Equals.
Stock Solution
Conc., mg/1 (%)
1 - 10 mg/1 1 g/1 1 mg/1 1,000 mg/1 (0.1%)
10 - 50 mg/1 10 g/1 10 mg/1 10,000 mg/1 (1%)
60 - 500 mg/1 100 g/1 100 mg/1 100,000 mg/1 (10%)
44,
S-Jt-4'of 27 7/82,
9.3
PROCEDURE
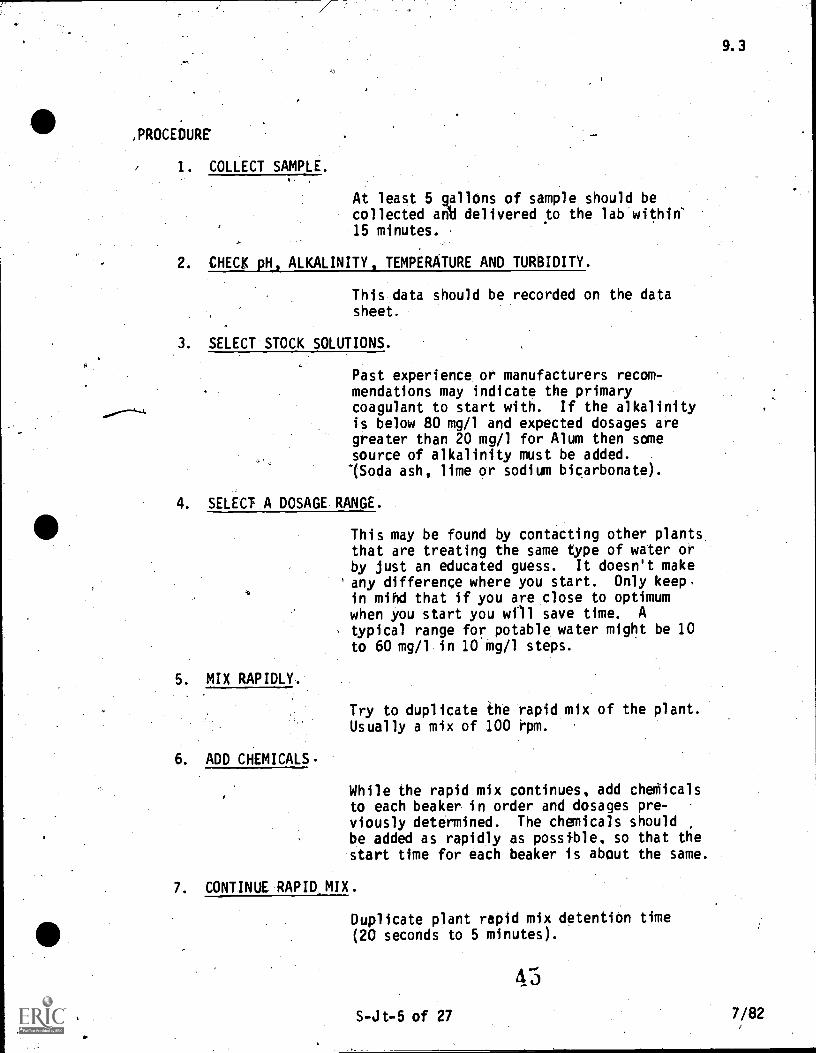
, 1. COLLECT SAMPLE.
At least 5 gallens of sample should becollected anti delivered to the lab'within'15 minutes.
24 CHECK pH, ALKALINITY, TEMPERATURE AND TURBIDITY.
This data should be recorded on the datasheet.
3. SELECT STOCK SOLUTIONS.
Past experience or manufacturers recom-mendations may indicate the primarycoagulant to start with. If the alkalinityis below 80 mg/1 and expected dosages aregreater than 20 mg/1 for Alum then somesource of alkalinity must be added."(Soda ash, lime or sodium bicarbonate).
4. SELECT A DOSAGE RANGE.
This may be found by contacting other plantsthat are treating the same type of water orby just an educated guess. It doesn't make
' any difference where you start. Only keep.in mind that if you are close to optimumwhen you start you wfll save time. A
, typical range for potable water might be 10to 60 mg/1 in 10 mg/1 steps.
5. MIX RAPIDLY.
6. ADD CHEMICALS.
Try to duplicate the 'rapid mix of the plant.Usually a mix of 100 rOM.
While the rapid mix continues, add chealicalsto each beaker in order and dosages pre-viously determined. The chemicals shouldbe added as rapidly as posstble, so that thestart time for each beaker is about the same.
7. CONTINUE RAPID,M1X.
Duplicate plant rapid mix detentiOn time(20 seconds to 5 minutes).
S-Jt-5 of 27 7/82
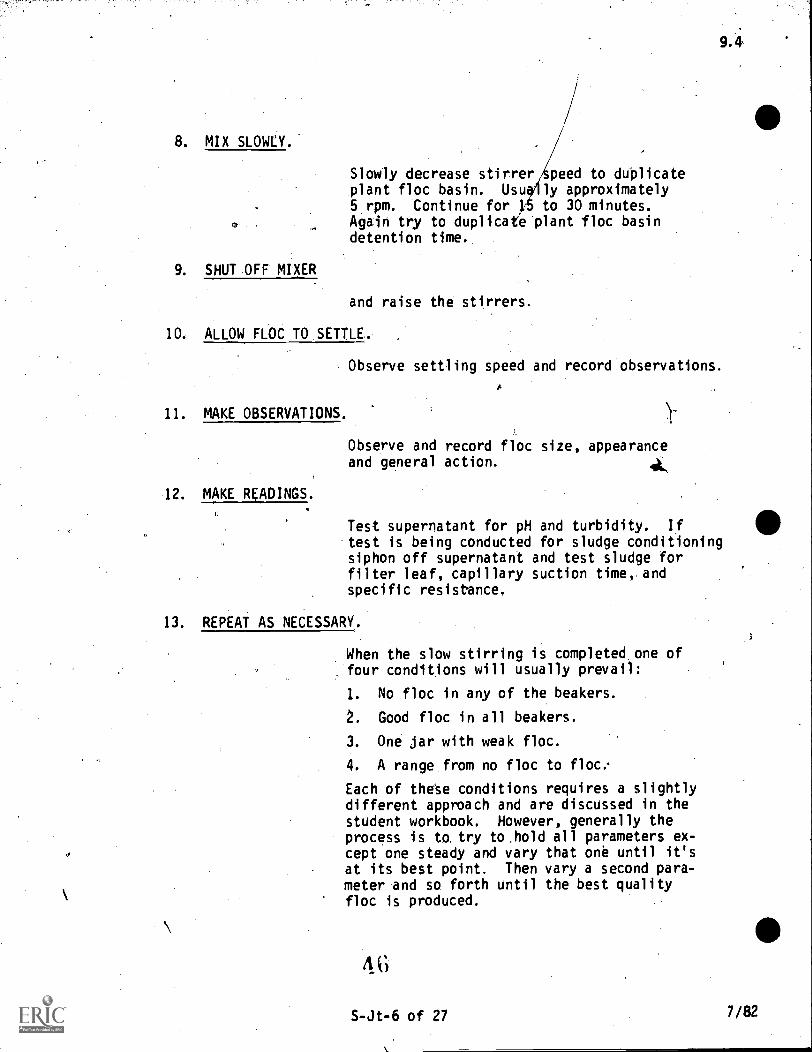
8. MIX SLOWLY.
Slowly decrease stirrer speed to duOlicateplant floc basin. Usu ly approximately5 rpm. Continue for to 30 minutes.Again try to duplicate plant floc basindetention time.
9. SHUT OFF MIXER
and raise the stirrers.
10. ALLOW FLOC TO SETTLE. ,
Observe settling speed and record observations.
11. MAKE OBSERVATIONS.
12. MAKE READINGS.
Observe and record floc size, appearanceand general action.
Test supernatant for pH and turbidity. If
.test is being conducted for sludge conditioningsiphon off supernatant and test sludge forfilter leaf, capillary suction time,, andspecific resistance.
13. REPEAT AS NECESSARY.
When the slow stirring is completed one of, four conditions will usually prevail:
1. No floc in any of the beakers.
2. Good floc in all beakers.
3. One jar with weak floc.
4. A range from no floc to floc.-
Each of thete conditions requires a slightlydifferent approach and are discussed in thestudent workbook. However, generally theprocess is to try to hold all parameters ex-cept one steady and vary that one until it'sat its best point. Then vary a second para-meter and so forth until the best qualityfloc is produced.
S-Jt-6 of 27 7/82

SUPPLEMENTARY MATERIALS
PREPARATION OF STOCK SOLUTIONS
Chemicals are feed in any one of these ways:
1. Dry chemical feed - fed directly.2. Concentrated liquid solutions - fed directly.3. Dry or liquid chemicals that are mixed in a
batch and then fed from the batch.
In order to have the jar test be reliable it is important that the
chemicals that are being used in the test be representative of
the chemicals that are being fed: To do so requires making stock-
solutions.directly from the feed chemicals. Each time a new batch
of chemicals ire received a jar test should be'performed with
these chemicals. This will allow you to make adjustments for
slight changes in 'chemical concentrations.
This process often requires the application of simple dilution
techniques; however, these simple techniques' are not all that
simple when you try to apply them: Therefore, we have devised
the following work aids to simplify the procedure. If you wish
to obtain more information regarding exactly what is happening
at each dilution step refer to Appendixes A, B, and D of the
instructor's guide.
STOCK SOLUTION FROM DRY CHEMICALS
This is the most'straight forward and requiresmaking a stock-based on anticipated dosageneeds. The following table can be used tohelp determine the proper concentrations.
Approx. Dosage Grams/Liter
1 ml Added to'
1 Liter Stock Solution
Begufr_ss6 _s_glij to Pre wnE ual s Conc. rn
1 - 10 mg/1 1 g/1 1 mg/1 1,000 mg/1 (0.1%)
10 - 50 mg/1 lo g/1 10 mg/1 10,000 mg/1 (1%)
50.- 5p0 mg/1 100 g/1 100 mg/1 100,000 mg/1 (10%)
S-Jt-7 of 27 7/82
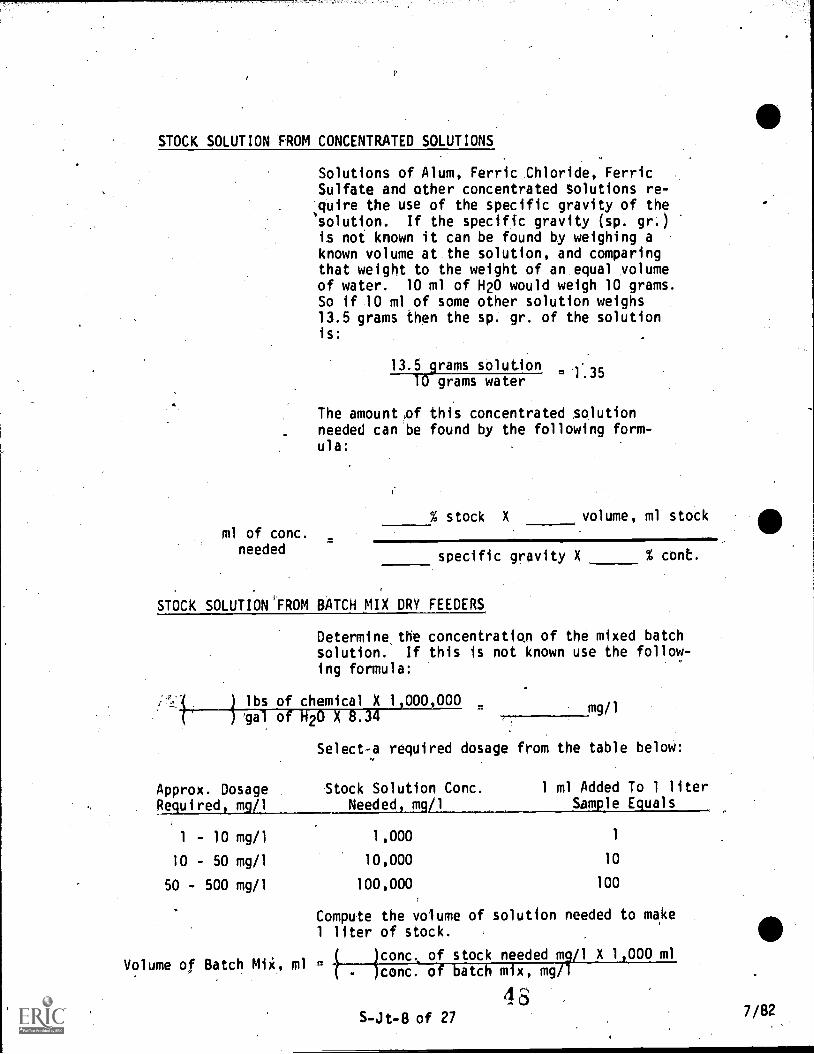
STOCK SOLUTION FROM CONCENTRATED SOLUTIONS
Solutions of Alum, Ferric Chloride, FerricSulfate and other concentrated Solutions re-quire the use of the specific gravity of thesolution. If the specific gravity (sp. gr.)is not known it can be found by weighing aknown volume at the solution, and comparingthat weight to the weight of an equal volumeof water. 10 ml of H20 would weigh 10 grams.So if 10 ml of some other solution weighs13.5 grams then the sp. gr. of the solutionis:
ml of conc.needed
13.5_grams solution. 1 35
TO grams water
The amount,of this concentrated solutionneeded can be found by the following form-ula:
% stock X volume, ml stock
specific gravity X % cont.
STOCK SOLUTIOOROM BATCH MIX DRY FEEDERS
Determine,the concentration of the mixed batchsolution. If this is not known use the follow-ing formula:
/ ) lbs of chemical X 1,000,000) 'gal of H20 X 8.34
Select-a required dosage from the table below:
Approx. DosageRe uired m 1
1 - 10 mg/1
10 - 50 mg/1
50 - 500 mg/1
mg/1
Stock Solution Conc.Needed m 1 Sam le E uals
1 ml Added To 1 liter
Volume of Batch Mii, ml
1,000
10,000
100,000
10
100
Compute the volume of solution needed to make1 liter of stock.
conc. of stock needed m 1 X 1 000 ml
conc. o atc m x, mg
S-Jt-8 of 27
4 37/82
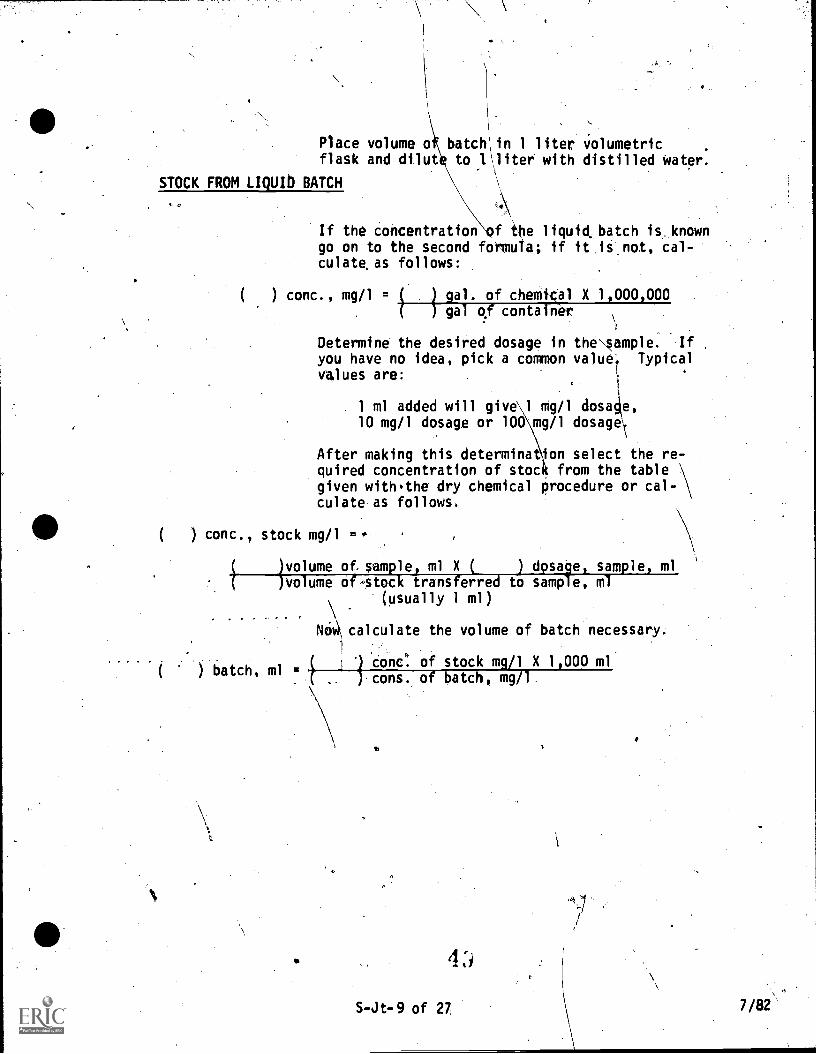
Place volume o batch in 1 liter volumetric .
flask and dilut to 1 liter with distilled Water.
STOCK FROM LIQUID BATCH
) conc.
If the concentration f the liquid.batch is knowngo on to the second foemuta; if it is,not, cal-culate.as follows:
) conc., mg/1 = () gal. of chemi,W X 1,000,000
, ( ) gal of container.. \
Determine the desired dosage in the\s mole. If
you have no idea, pick a common value Typicalvalues are:
;.
1
1 ml added will give.1 Mg/1 dos4e,10 mg/1 dosage or 100 mg/1 dosage\
After making this determina ion select the re-quired concentration of stoc, from the table \given with.the dry chemical procedure or cal-culate,as follows.
, stock mg/1 =.
)volume of sample, ml X ( ) dosage, sample, ml)volume of-stock transferred to sample, ml
(usually 1 ml)_
) batch,
calculate the volume of batch necessary.
Cone of stock mg/1 X 1,000 ml).cons. of batch, mg/I.
S-Jt-9 of 27 7/82'

HE THEORY OF COAGULATION AND ,FLOCCULATION
At vatious points..in the treatment of, water and wastewater we find
that there is smell particulate matter that we would like to remove
but cannot do so by normal physical meats. Whenever we run into
this circumstance it usually calls for the addition ot chemicals
that cause coagulation and flocculation.
Why would we want to remove these solids and wider what circumstances?
In Water iteatment we are often faced with the situation of the re-
moval of turbidity and color. With wastewater, there is the need,
at times, to reduce the suspended solids level in secondary effluents.
We can'use this process to reduce phosphorus levels. We can also
use the process to enhance the settling of activated sludge in the
secondary clarifier. And when we're dealing with sewage sludges we
can use the process to enhance dewatering. In this case it is called
conditioning.
One of the basic questions that we come up to, then, is "Why won't
these materials (that is, the materials that form turbidity, color
and the solid and that sort of thing), settle normally using gravi-
tational forces?" In order to get a basic understanding of that,
we need to take a look ats first of all, the forces that tend to
keep the stuff from settling. At the same time, there are some
forces that,tend'to help things settle. The forces that cause things
to settle are called instability forces. The forces that keep them
from settling.are called stability forces.
'00
S-Jt-10 of 27 7/82
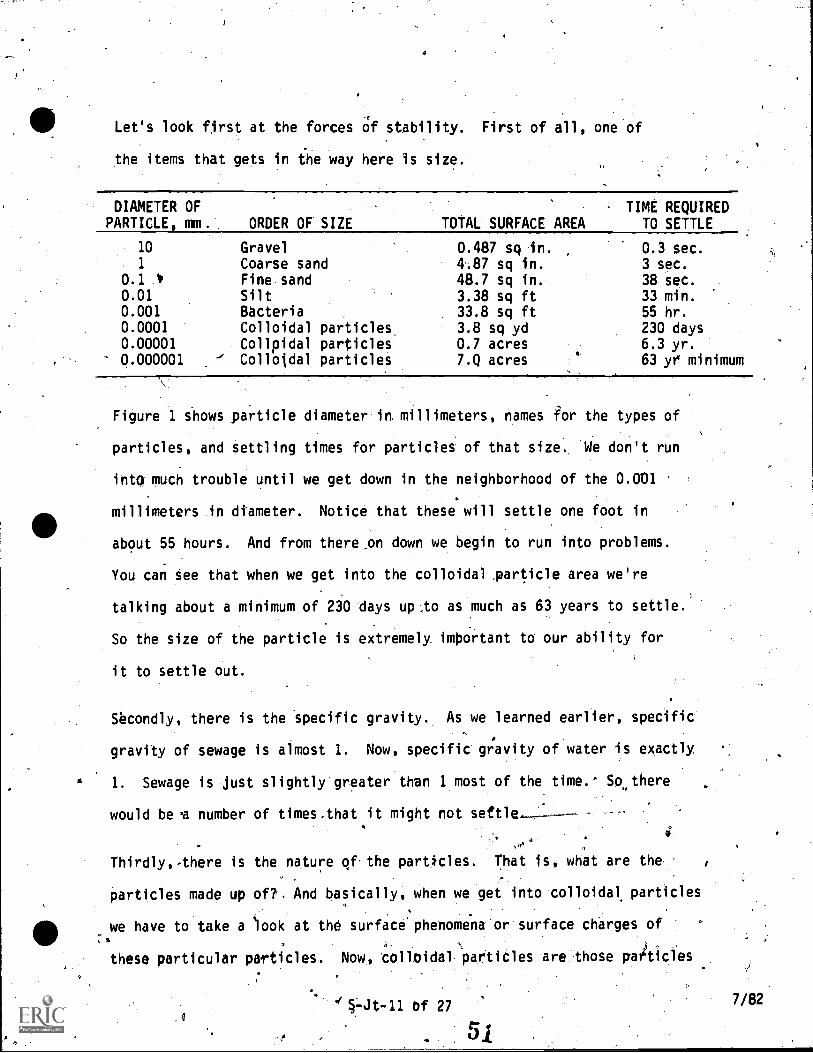
Let's look first at the forces Of stability. First of all, one of
the items that gets in the way here is size.'
DIAMETER OFPARTICLE, mmi. ORDER OF SIZE TOTAL SURFACE AREA
TIME REQUIREDTO SETTLE
10 Gravel 0.487 sq in. 0.3 sec.1 Coarse sand 4.87 sq in. 3 sec.
0.1 * Fine sand 48.7 sq in. 38 sec.0.01 Silt 3.38 sq ft 33 min.0.001 Bacteria 33.8 sq ft 55 hr.0.0001 Colloidal particles, 3.8 sq yd 230 days0.00001 Collpidal particles 0.7 acres 6.3 yr.0.000001 Colloidal particles 7.0 acres 63 ye minimum
Figure 1 shows particle diameter in millimeters, names for the types of
particles, and settling times for particles of that size. *We don't run
into much trouble until we get down in the neighborhood of the 0.001
millimeters in dtameter. Notice that these will settle one foot in
about 55 hours. And from there_on down we begin to run into problems.
You can see that when we get into the colloidal particle area we're
talking about a minimum of 230 days up,to as much as 63 years to settle.
So the size of the particle is extremely important to our ability for
it to settle out.
Secondly, there is the specific gravity. As we learned earlier, specific'
gravity of sewage is almost 1. Now, specific gt:avity of water is exactly.
1. Sewage is just slightly greater than 1 most of the time.' So,there
would be s number of times,that it might not settlet.H.,,
Thirdly,-there is the nature of the particles. That is, what are the^
Particles made up of?. And basically, when we get into colloidal particles
we have to take a 'look at the surfaciphenoMena'or'surface charges of%
%
these particular particles. Now, tollpidal particles are those pdticles
5:-Jt-11 Of 277/82'
that are less than 0.001 millimeters (1 micron) in size. The kinds
of phenomena we're looking at here fall into two areas - a group of
phenomena called hydrophobic and then a phenomena called hydrophilic.
Hydrophobic particle , are mostly inorganic. They're basically clay
particles and they sua.11y contribute to turbidity. On the other
end of the spectrum is a group of particles we call hydrophilic, that
are basically organic particles and contribute to color. The hydro-
phobic particles usually remain in solution or don't settle because
of an electrical charge on their surfaces. This electrical .charge
is mostly negative. It's interesting, also, to note that most micro-
!Organisms also have a negative electrical charge on their sUrface.
The lvdrophilic partkles, (hydrophilic stands for water-loving) are
basically organic material. Because.they are organic, they also-can r
have some surface charges. The Surface charges are relative to the
type of material. So, just as a result of the compound that makee
the organic material, such as carboxyl or hydroxyl ions in thpt com-.
pound, an electric surface charge results. The charge could beyos-.
itive or it could be negative. But most of the time the charge is
negative.
There i% another phen. ena fiere, atsu part of this hydrophilic group/1
of Materials, and that's where a particle is covered with a layer ofR
water. We,call that layer water hydration. The water may already be
chemically combined with,ions wtiich produce positive or negative
charges. Also, if the parttcle itself were charged, remember that
water molecules are polar and they, could arrange themselves on the
.52 S-)t-12 of 27 7/82
I1
particle to create an electrical charge.'4,
Why are those important to keeping materiVs in solution? First of
all, the hydrophobic particles, beCause they are all netatively
charged, tend to repel one another. As a result, you can t get
those two particles to come togehter. If we can get them to come to-
*gether and touch agd stick, they might be able to get lar enough to
settle out.
By the same token the hydrophilic particles will not come together
for a couple of reasons. It could.be because of electrical Charges
but it also could be just because Of Om layer of water. The layer of
watqr around the two particles won't let the two particles come close
enough together to touch and stick and settle out. These are basically
the forcet that tend to keep small particles suspended in solution-,
,
We have size, specific gravity'and le nature of the material, whet
it's hydrophobic or hydrophilic.
We've already mentioned to some of the instability factors. One of those
is that when particles are extremely small in diameter they'are kwmped
into by.water molecules and that xauses them to continually move around.
As water temperature increases the particles in the water mOve faster
and, therefore, the material is more likely to remain indispersed.
This action is called the Brownian movement.
There is another phenomena called the Van der Waal's forces. Anytimr
we're dealing with atomicsarticles, they have some attraaion to one
another. If we could get too small particles to get.close enough to-
gether, thii-attracttve force would continue to pull them together
S-Jt-13 of 27 7/82

and they would-stick forming larger and larger particles and when
we get enough of them together they would actually settle. So, one
of the reasons that the Brownian movement is Amportant is that We can
get these particles moving around and if they bump into one another .
hard enough to overcome those force of stability they'll stick to-
gether and get large enough to settle out.
Most of the time we find-.6 waters that we really don't have hydrophobic
and hydrophilic particles, as such. What we'have is a-heterogeneous
mixture of these things. $its and pieces of clay attached to some
organic material and some microorganisms. In wastewater we've got a
group of organic flocs. We would like to reduCe the stability forces
and enhance the instability forces. The reduction of the stability
forces is called coagulation. And basically-that-can take place by
the addition of chemicals called primary coagulants.
The most common primary coagulants are saslts of aluminum and iron.
Aluminum sulfate, commonly called alum, is probably the most common
primary coagulant. There's also one called sodium aluminate. And
then there are three very common iron salts, ferric sulfate, ferrOus
sulfate and ferric chloride.
When we add these coagulants to water, insoluble alUminum or ferric
hydroxide results. Aluminum and iron coagulants act similarily. Let's
deal with aluminum. .The aluminum hydroxide is made by the addition of
the aluminum sulfate which combines with the alkalinity that's in water.
54
The result is twofold. First of all, we've formed, a weak acid in
aluminum hydroxide. Secondly, we have used some alkalinity.
Typically, one milligram per liter ,of alum will use about 0.5
grams pe liter of natural- alkalinity in forming the aluminumshydroxide.
The combination of those two items can, ln low alkalinity waters,
(less than 80 milligrams per liter) tend to lower the pH of the
solution. The resulting reaction of the forming of aluminum hydroxide'
is that the aluminUm hydroxide is extremely positively charged.
Those positive charges can be absorbed on the surface of hydrophobic
particles and, thus, have a tendency to reduce their overall electrical
charge: They don't even have to be absorbed: If they're just in the
solution close to ,the hydrophobic particles they will have a tendency
to reduce the overall elecirical. charge. This would allow,thOte
hydrophobic particles to be brought together by the Brownian move-
0
ment. If they contact each other they'll stick and wecp
an get a num-
,/ber of them stuck.together 'as a result of the Van.der.Waal's forces.
They will probably be large enough to settle; It's noi reOir d that we
totally overcome the electrical negative charge that's on the hydro-
phobic particles, just that we reduce it enough so that the s uff can
stick together.
With the hydrophilic particles; there are some other things that happen.
First of all, we might get the material 'to combine, chemically with
hydroxyl and carboxyl or phosphate groups that are in the water around
the particle. This would have a tendency to reduce the eTecirical
charge, alio. There also can be some chemical combinations of aluminumlb
S4t-15 'of 27 55 7/82
hydroxide with other substances that are in the water, specifically,
the alkalinity. And this can form a sticky substance which-might-
happen right on the surface of the hydrophobic or hydrophilic particles.
That, in itself, is called coagulation.
Because by reducing those electrical charges and forming the sticky
maerial we have now overcome some,,of the major stability forces. So
the chemical process of overcoming those stability forces is called
coagulation.
We talked about alum and iron salts as being primary coagulahts. Often-
times, we use polyelectrolytes, which are just long-chain, organic
molecules that can either be positively or negatively charged or have
enough charges of equal size that they are basically neutral/ We can
use these, in some instances,'as primary coagulants.
Once we'have overcome the stability forces, if we stir the solution and
cause these particles to bump together, we can causenthe formation ofA
floc and,increese its size tO the Point that it will settle. That
physigal.phenomena of mixing andbumping topether and sticking of
these particles is called flocculation.
-
There are_e number of factors that influence our ability to coagulate.
-.One of them is the order in which chemicals are combined in a solution.
For instance, we may be having to add chlorine andea polyelectrolyte
and a primary coagulant. The order in which,they go in may affect or-
influence coagulatiOn. Probably the singlemost impor,tant item is pH. .
We'll come back to that in a moment.
5 6
S-Jt-16 of 27 7/82

Temperature influences coagulation. As the temperature goes dbwn and
it doesn't have_to drop very much, like 5 to 10 degree, then we'.
change the amount of chemicals that are needed in order to get Coagulation.
N,
The presence of salts of sodium, calcium and magnesium also can'affect
our ability to coagulate. The kinds of things that,they do are alter
the pH range that we toagulate in, alter,the time it takes.to get floc-
culation to take place, ind alter the amount of coagulant that it takes
to get the job done.
The amount of turbidity or the amount of solids that are present also
affect the amount of chemical that is added and, therefore, affect
coagulation. Usually, as the solids concentration goes up we also need
to increase the amount of coagulant that we feed.
The type of chemical we feed is important. Aluminum salts have a nar-
row pH range. Iron salts have a wide pH range.
Let's take a closer look at pH because it is the single most important
factor. Wilat we ant is for-the addition ,of our primary coagulants to
be such that th y are fnsoluble. We do-not want them to be soluble be-
cause if they are soluble they are going to just pass right on through
the facility and not form a floc. The pH range in which they are sol-
uble is relatively narrow. So, if we do things to aff ct the pH that
will .affect our ability to have insoluble aluminum ydroxide. It will
also affect the amount of coagulant that it tak to get the job done.'
B des the primary coagulants there are a fe other items of importance.
Usually we,taTk about these as aids. We may want to add some oxidants
like thlbrine or potassium permanganate. Basically, these things
S-Jt-17 of 27 5 7'7/82
would change the nature of organic compounds. They are usually applied
prior to coagulation. With some waters it's nearly impossible to get
coagulation without the addition of some oxidant. We don't really un-
derstand exactly what the oxidant does but we know that it does alter
the organic compounds.
We may want to add weight tothe floc to get.it to settle.- We can do
that'with such things as bentonite clay, silica and activated carbon
and some of the polyelectrolytes. We may want to use polyelectrolytes
to add strength to the floc, to add weight, to increase the urate in
which the floc is formed. As was mentioned earlier,,there are three
kinds of polyelectrolytes: anionic, cationic and'nonionic. That is,
there is negatively charged, positively charged and neutral charged
polyelectrolytes.
(P
The last item thaf we need to consider is the alkalinity. In most pat.-ts
of the country a consideration of alkalinity is hot really important.
But there are some areas of the United States, particularly in the
Northwest and the Northeastern Coast,-where a lot of the waters have
extremely low alkalinity. By low, I mean they Tay beas low as 20 to
30 milligrams pee liter. -Often we find that when tte alkalinity of
water is below 80 milligrams per,liter, the addition of any of the
primary coagulants will tend to cause the pH to drop. Often the result
is to move the solution out of the optimum pH range for coagulation.
When you have these low alkalinity waters you're probably going to need
to add some alkalinity to the water in order to get coagulation to
take place.
S-Jt-18 of 27 7/82
There are basically fourdifferent types of alkalinity that we can add.,
We can add quick lime (Ca0). 85% quick lime will add about 0.33 milli-
gran" per liter of alkalinity for each 1 milligram per liter of primary
coagulant. We can add hydrated lime or we could add soda ash.
THE JAR TEST
-Whenever there is a need to feed chemicals in a water/wastewater facility
in order to promote coagulation and flocculation there is always the
frustration of how much chemical to feed and where to feed it. Prob-
ably'the most classic means of determining proper chemical -dosages is.
the jar test. With the jar test we try to duplicate, as closely as
.possible, actual plant conditions of the amount,of chemicals, the type
of chemicals, and the order in which they-are added.
We need to keep in mind that there are many factors, that affect chemical
combinations'and dosages that are required for coagulations and floc.;
culation. Amoung these-would. be pH of the water, the turbidity, the
temperature. of the water, the amount and.type of alkalinity present,
the color of-the waterthe types of themitalS or saitthat are
present, the amount and degree of mixing that takes place, and the order
in which chemicals are added. Probably, of all these items, the most
critical of course is pH, temperature, ind;turbidity. Alkalinity, as
you remember, only becomes' important when we're dealing with low
alkalinity waters; that is, waters below 80 mg per liter.
5S-Jt-19.of 2/ 7/82
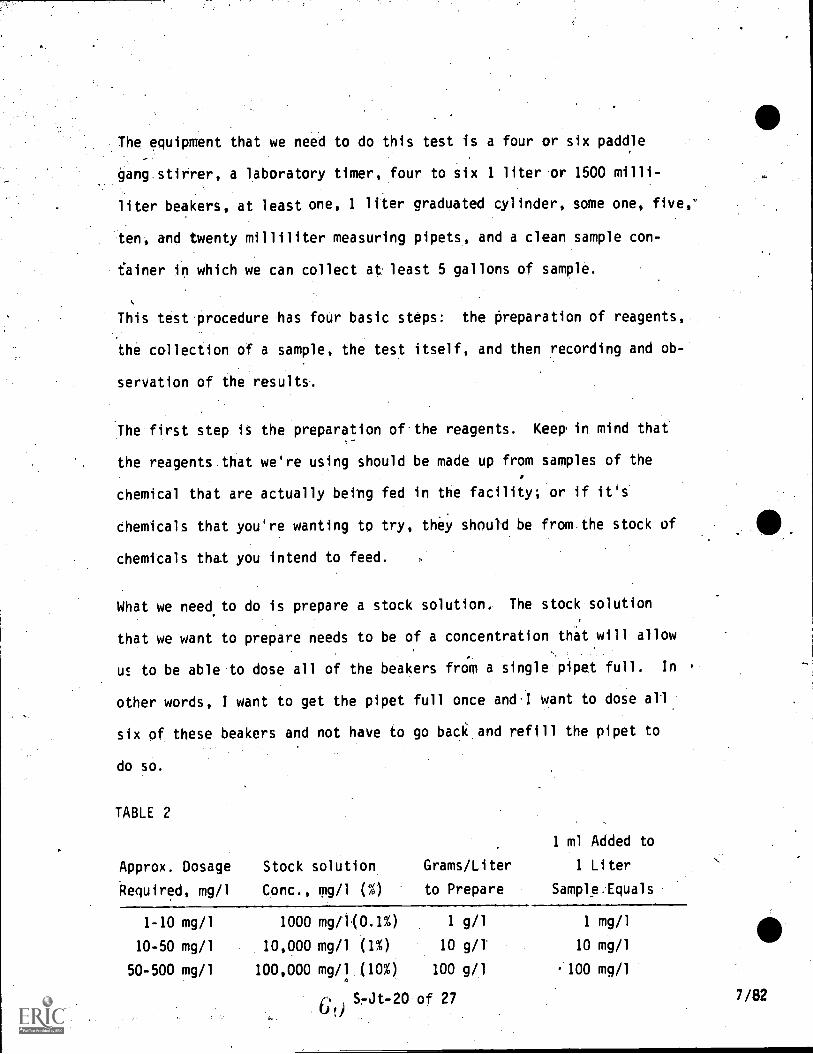
The equipment that we need to do this test is a four or six paddle
gang.stierer, a laboratory timer, four to six 1 liter.or 1500
liter beakers, at least one, 1 liter graduated cylinder, some one, five,'
ten, and twenty milliliter measuring pipets, and a clean sample con-
fainer in which we can collect at. least 5 gallons of sample.
This test.Orocedure bas foUr basic steps: the Preparation of reagents, .
the collection of a sample, the test itself, an-d then recording and ob-
servation of the results-.
The first step is the preparation of the reagents. Keep in mind that
the reagents that we're using should be made up from samOles of the
chemical that are actually beim fed in the facility; or if it's
Chemicals that you're wanting to try, they should be from-the stock of
chemitals that you intend to feed. ,
What we need.to do is prepare a stock solution. The stock solution1'
that we want to prepare needs to be of a concentration that will allow
us to be able to dose all of the beakers from a single pipet full. In .
other words, I want to get the pipet full once and.I want to dose all
six of these beakers and not have to go back and refill the pipet to
do so.
TABLE 2
1 ml Added to
Approx. Dosage Stock solution Grams/Liter 1 Liter
Required, mg/1 Conc., Mg/1 (%) to Prepare Samplelquals
1-10 mg/1 1000 mg/1(0.1%) 1 g/1 1 mg/1
10-50 mg/1 10,000 mg/1 (1%) 10 g/1 10 mg/1
50-500 mg/1 100,000 mg/1 (10%) 100 9/1 . 100 mq/1
Gc) SJt-20 of 27 7/82

Table 2 gives us an indication of the kinds of cokentrations that
we need. For instance, if we feel that our test dosages need to be
in the 10 to 50 mg/1 range then we need to make up a solution that is
10,000 mg/1 concentration or about',1%. What that really means is
that if I add one milliliter,of that stdtk solution to a one liter
beaker that concentra6on is ten mg/l.
Now, keep in mind that there are four types of chemicals that we nor-,
mally feed. There are dry chemical feeders that just feed the dry
chemicals directly. There are concentrated solutions we cah buy such
at alum and ferric.s,ulfate and juit "feed the solution, There are
dry chemicals that we miX'up into_a batch container and feed out of
that batch container with a chemical -. feed pump.. And there are liquid
chemicals that we purchase and mix up into a batch and feed with a
chemical feed pump. Refer to the supplementary materials for details
on stock sdlution preparation.
The next item is,to collect the sample. Now, we need to collect the
sample from the point at which we intend to inject chemicals. Collect
at least 5.gallons of sample. Try to maintain the sample at the same
temperature, in the lab as' it was in the facility: If if is cool out-
side then we may want to set the excess amount of sample outside while
we're doing the first portion of the test.
41
Now, let's take a look at the test procedure. The first thing that we
want to do is take a portion of the sample and dieck for pH, alkalinity,
temperature and turbidity, then record these on the data sheet.
S-Jt-21 of 27 7/82
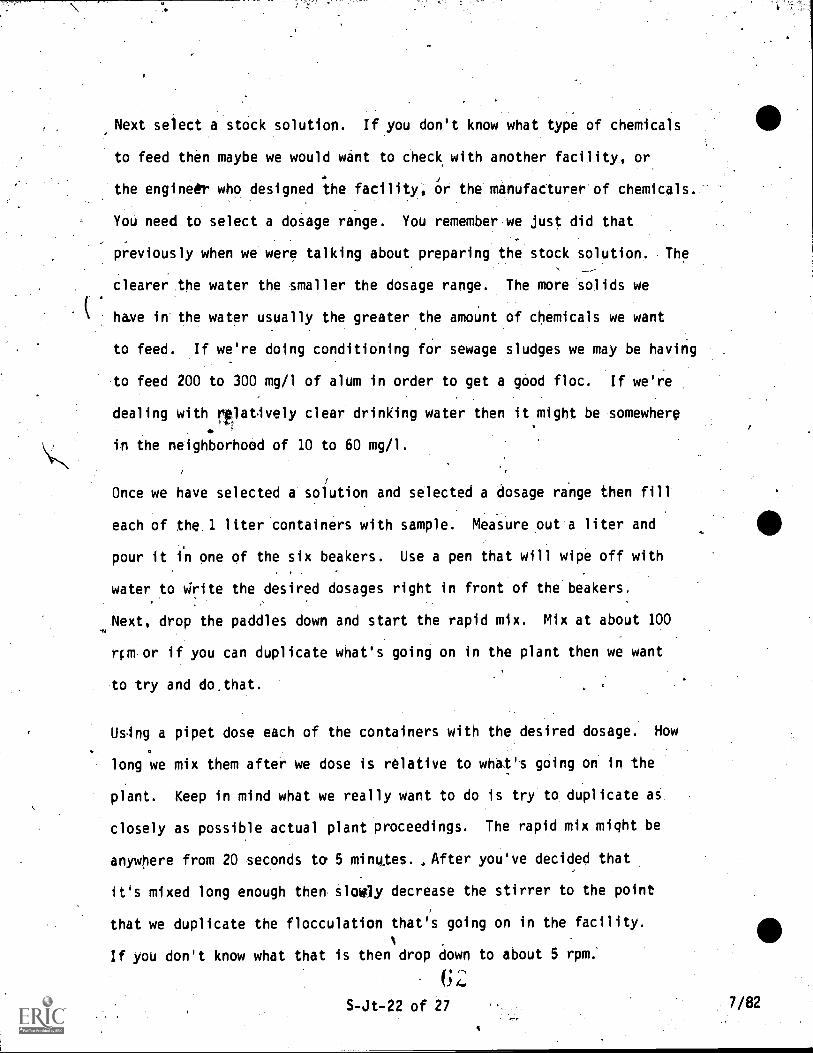
Next select a stock solution. If.you don't know what type of chemicals
to feed then maybe we would want to check with another facility, or
the engineft who designed ihe facility, Or the manufacturer of chemicals.
You need to select a dosage range. You remember we just did that
previously when we were talking about preparing the stock solution. The
clearer the water the smaller the dosage range. The more solids we
hue in the water usually the greater the amount of chemicals we want
to feed. If we're doing conditioning for sewage sludges we may be having
to feed 200 to 300 mg/1 of alum in order to get a good floc. If we're
dealing with rtlatively clear drinking water then it might be somewhere
in the neighborhood of 10 to 60 mg/l.
Once we have selected a solution and selected a dosage ringe then fill
each of the 1 liter containers with sample. Measure out a liter and
pour it in one of the six beakers. Use a pen that will wipe off with
water to Write the desired dosages right in front of the beakers.
Next, drop the paddles down and start the rapid mix. Mix at about 100
roil or if you can duplicate what's going on in the plant then we want
to try and do,that.
Uslng a pipet dose each of the containers with the desired dosage. How
long we mix them after we dose is relative to what's going on in the
plant. Keep in mind what we really want to do is try to duplicate a
closely as possible actual plant proceedings. The rapid mix might be
anywhere from 20 seconds to 5 minutes. .After you've decided that
it's mixed long enough then. SloWly decrease the stirrer to the point
that we duplicate the flocculation that's going on in the facility.
If you don't know what that is then drop down to about 5 rpm;
S-Jt722 of 27 7/82

Keep the stirrer going anywhere from 15 to 30 minutes but gain how
long-it stirs is relative to what's happening in the plan
As the floc begins to form we want to record when we fir t see floc and
in which container. Continue observing the floc as th stirring
period proceeds. After the stirring or floctulation seriod, shUt off
the stirrers and carefully raise them out of the be kers'. The floc
will start to settle duplicating the sedimentatio basin in the plant.
During this period observe and record the size/of the floc, the settling,
rate, and the general appearance of the floc,' Observe the supernatant
(clear liquid above the floc) as the flOc settles. Is it clear or
turbid? Are small pieces of floc left suspended in the supernatant?
Carefully remove some of the supernAte and-run pH, turbidity, and
alkalinity. It is also a good idea to filter some supernatant through
eoarse filter paper and run these three tests. These observations
and tests, run on all beakers, will help you determine which dosage
gives the best results.
6If we're dealing with sludge conditioning siphon ff( the supernatant
and test the sludge with the filter leaf test, for capillary kuction
time,,and for specific reiistance. You,may also want to test the super-
natant for sOspended solids. If the conditioned sludge is to be de-
watered by centrifugation you may want to take some of the sludge and
spin it down in a clinical centrifuge.
Part of the problem 'associated with this particular test procedure is
what to do.at the end of the first run. In the first run we might have
S-Jt-23 of 27 7/82
gotten one jar that's good but-its bad on either side. We've gpt one
that's.-gotTa 'pretty good floc but we don't knoW if that's the ideal',
situation. Now we need to dump all the jars out and refill them and
'add chemicals to close in on the optimum dosage and conditions.
Aftdr we've determined optimum primary coagulant dosage we may want to
adjust tife pH to find the -optimum for it.
\
Let's looklat some'other things that might have happened in the first
run. If you had no floc-in any of the beakers then again you'd want
to test for pH. If the pH was why down oe way up it should be ad-
justed to about 6.8,to 7.2 (with the exception of trying to get out color,
then we need to-drive clear down into -sOme acid ranges ltke around pH
4 or 5). If pH is varied all over the place with these beakers'then
we need ta, add some alkalinity to buffee the pH in all the beakers
and dose them-again. Or t may require a higher dosage in each one of
them or a lower dosage. If we ve got a good.floc in All the beakers,
what do we do? Again check for pH, let'them settler/theck for turbidity,
find the ones that are best and do a little bit of adjustment on them.
We've got one jar with a weak floc: What do we do? Well, take that one
jar and, again"check the pH of everything and adjust the chemicalvone
at a time holdfng everything steady and making one adjustment at a time
until we zero in. It could take you all day on one water supply or one
sludge sample 'to get thelbest.combinatipn of chemicals.
4.
f ;
S4Jt-24 of 27.
a
7/82
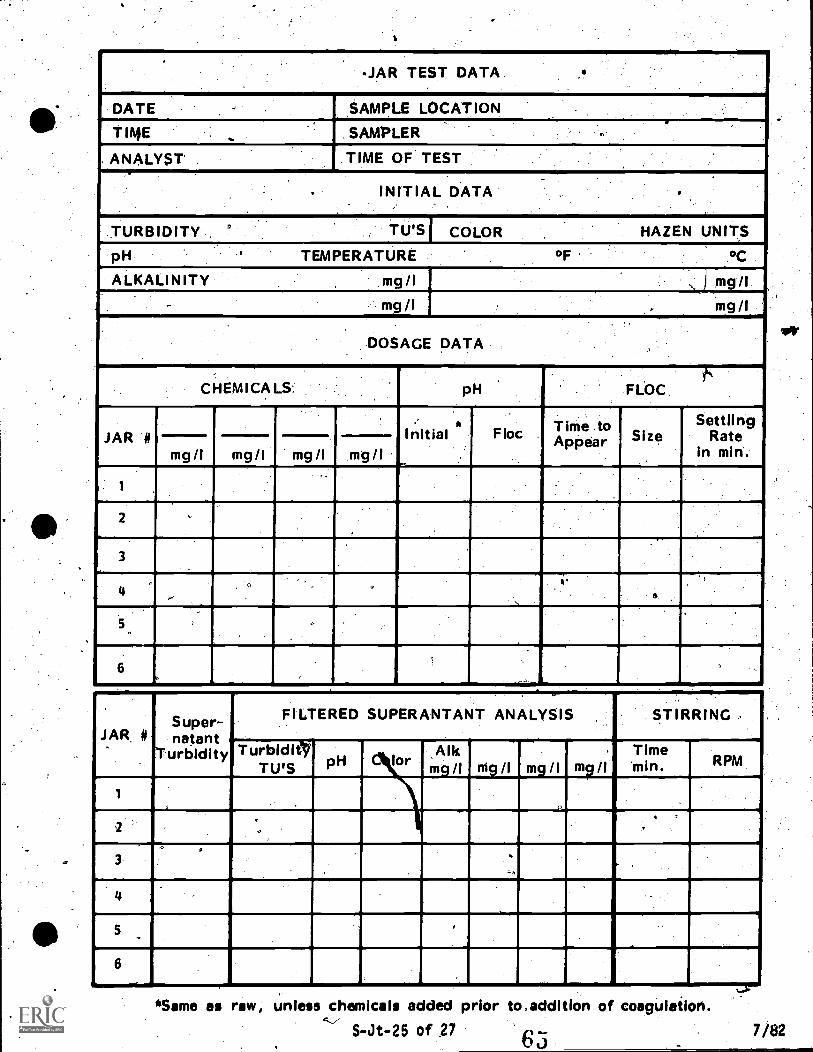
DATE
T114E
SAMPLE LOCATION
SAMPLER
. ANALYST' TIME OF TEST
INITIAL DATA
.TURBID1TY.. TU'S COLOR
pH
HAZEN UNITS
TEMPERATURE °C
ALKALINITY mg/1
mg/1
mg/1
mg/I
DOSAGE DATA
CHEMICALS; pH FLOC
JAR #mg/1 mg/I mg/I mg/I
4
initial Floc .
Time AoApPear Si z
SettlingRate
in min'.
4
1r
JAR #Super-natant
Turbidity
FILTERED SUPERANTANT ANALYSIS
TurbidiefTU'S pH
1
lor
3
,Alkmg/1
STIRRING
Mg /1 mg/I m9/ITimemin. RPM
6
*Same as raw, unless chemicals added prior toaddition of coagulaiion.S-Jt-25 of 27 65 7/82
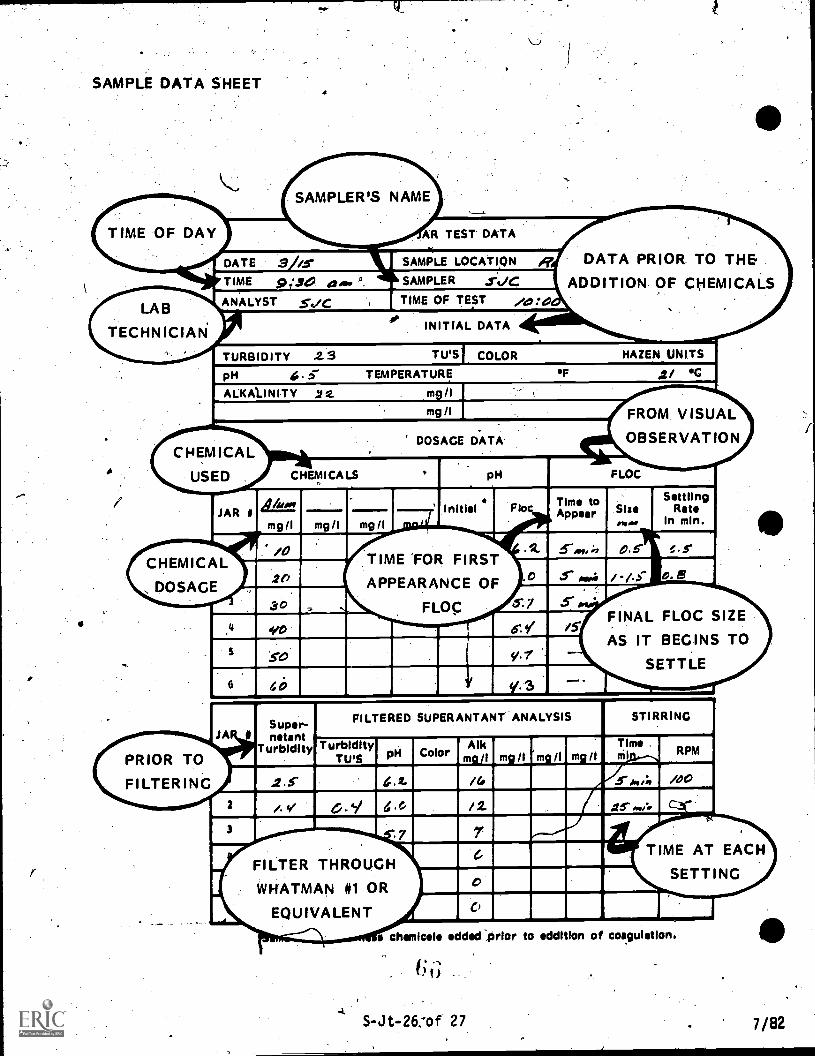
SAMPLE DATA SHEET
TIME OF DAY AR TEST DATA
SAMPLE LOCATION #r DATA PRIOR TO THESAMPLER sac ADDITION OF CHEMICALS
ANALYST t/C TIME OF TEST Ao:p
PH
0
2. 3
INITIAL DATA
TU'S1 COLOR HAZEN UNITS
C TEMPERATURE
ALKALINITY 22. mg/I
mg /I
.2/ G
CHEMICALDOSAGE DATA
USED CHEMICALS PH FLOC
JAR a Initial Floc Time toAppear
TIME 'FOR FIRST
APPEARANCE OF
FLOC
.5-
3:1 .5-
400
.50
46
V.1
FINAL FLOC SIZEAS IT BEGINS TO
SETTLE
V.s _
PRIOR TO
FILTERING
JA 11
Super-natant
Turbidity
FILTERED SUPERANTANT ANALYSIS
Turbidity"TU'S pH Color
Alkmg/I _mg/1
STIRRING
mg/I mg/ITimeml RPM
/4/2.
/.00
.15-/".
7
FILTER THROUGHWHATMAN #1 OR
EQUIVALENT
A
0
TIME AT EACHSETTING
a chemicals added -Orlor to addition of coagulation.
C; ;
S-Jt-26:of 27 7/82
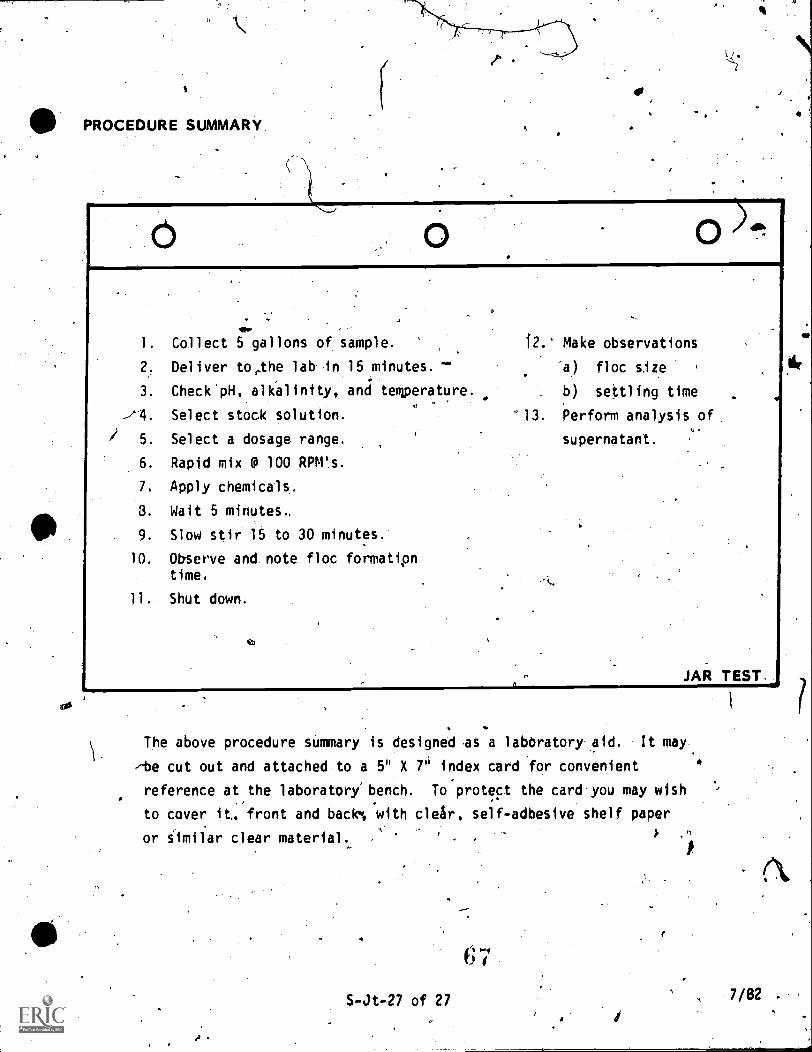
PROCEDURE SUMMARY
1.
2.
3.
,11.
5.
6.
7.
3.
9.
10.
11.
Collect 5 gallons of sample.
Deliver toethe lab in 15 minutes.
Check'0, alkalinity, and temperature.
Select stock solution.
Select a dosage range.
Rapid mix el 100 RPM's.
Apply chemicals.
Wait 5 minutes"
Slow stir 15 to 30 minutes
Observe and note floc formatipntime.
Shut down.
12.' Make observations
-a) floc size
b) settling time
13. Perform analySis of
supernatant.
JAR TEST
The above procedure summary is designed as a laboratory aid. It may.
-t:)e cut out and attached to a 5" X7 index card for convenient
reference at the laboratory bench. To protect the card'you may wish
to cover it, front and back% with clear, self-adbesive shelf paper
or Omilar clear material. f
S-R-27 of 27
674.
7/82

JAR TEST
WORKSHEET
Directions: -Place an "X" by the best answer.best answer for each question.
1. In order to perform the jarvolume of:
a) 2 1/2 gallons.
b) 5 gallons.
c) 2 1/2 liters.
d) 6 liters.
e) All of the above.
There is only one
test you shputd colleCt a sample
When _the actual plant data is not available, flash mix in thejar test should be for how much time?
a) 5 minutes
b) 10, - 30 seconds
c) 5 - 30 minutes
d) 1 - 8 minutes
None of the above.
3. Which one of the follow,ing is in correct sequence?
-a) Turn on the flash mix, then add chemidals.
b) Add the chemicals then turn on the flash mix.
c) Slow stir then flash mix.
d) Flash mix then slow stir.
e) All of the above.
4. When plant data is not available, the slow, stir time should beapproximately:
a)' 10 - 30 seconds.
b) 30 - 60 minutes.
c) 20 - 40 minutes.
d) 15 - 30 mtnutes.
e) All of the above.
./
low alkalinity water is one
a) 40 mg/l.
b) 7 grains/gallon.
c) 150 mg/l.
d) j 80 mg/l.
e) None. of the above.
in which the alkalinity
Which item.is the mottchemical-dosage?,
a) Alkalinity
b) pH
c) 'Temperature
'd) Presence of salts
e) None of the above.
in determining
s below:
the proper
Normally, as the solids concentration or turbidity of water increases .
the amount of chemicals necessary to dbtain adequate coagulation:
') stays the same.
b)- goes up.
c) goes down.
dr can go.either up-or down:
e) None of the above.