Embed Size (px)
Citation preview
Center for the Management of Information Technology March 9, 2012
University of Virginia - McIntire School of Commerce 1
Turning Billions of Rows into Market Insight Big Data @ comScore
Michael Brown March 9th, 2012
2 © comScore, Inc. Proprietary.
NASDAQ SCOR Clients 1860+ worldwide Employees 1000+ Headquarters Reston, VA
Global Coverage 170+ countries under measurement; 43 markets reported
Local Presence 32 locations in 23 countries
comScore is a Global Leader in Measuring the Digital World
V1011
Center for the Management of Information Technology March 9, 2012
University of Virginia - McIntire School of Commerce 2
3 © comScore, Inc. Proprietary.
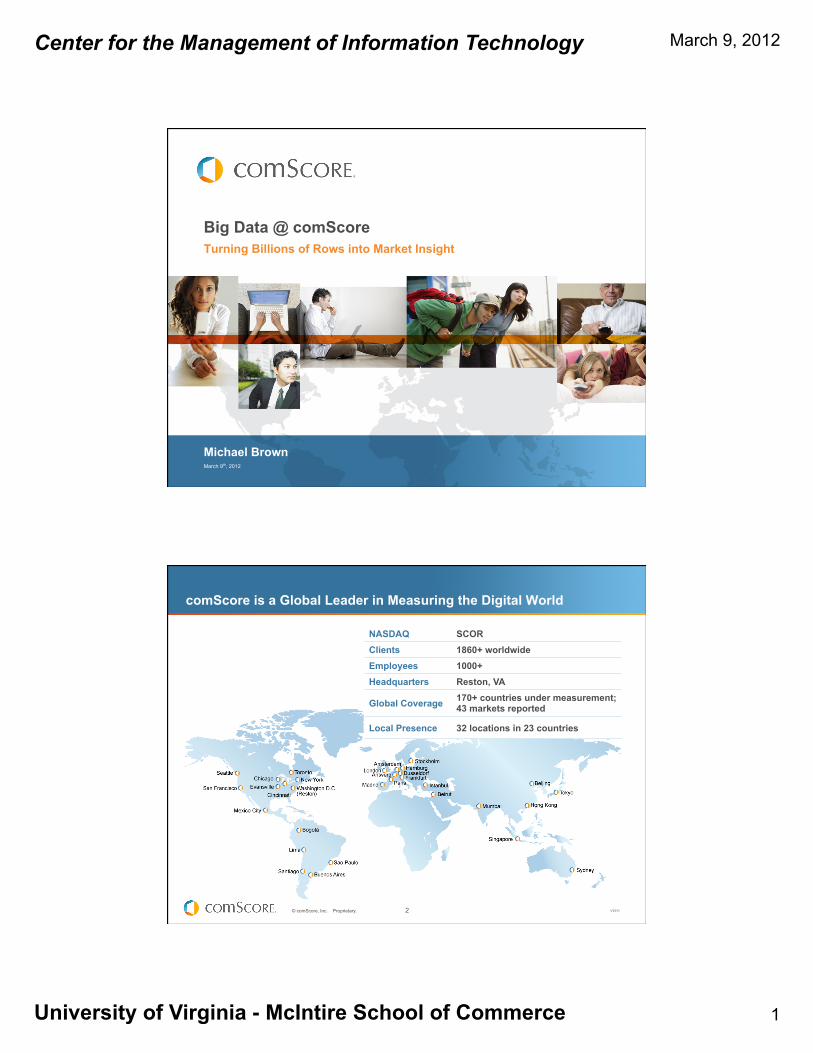
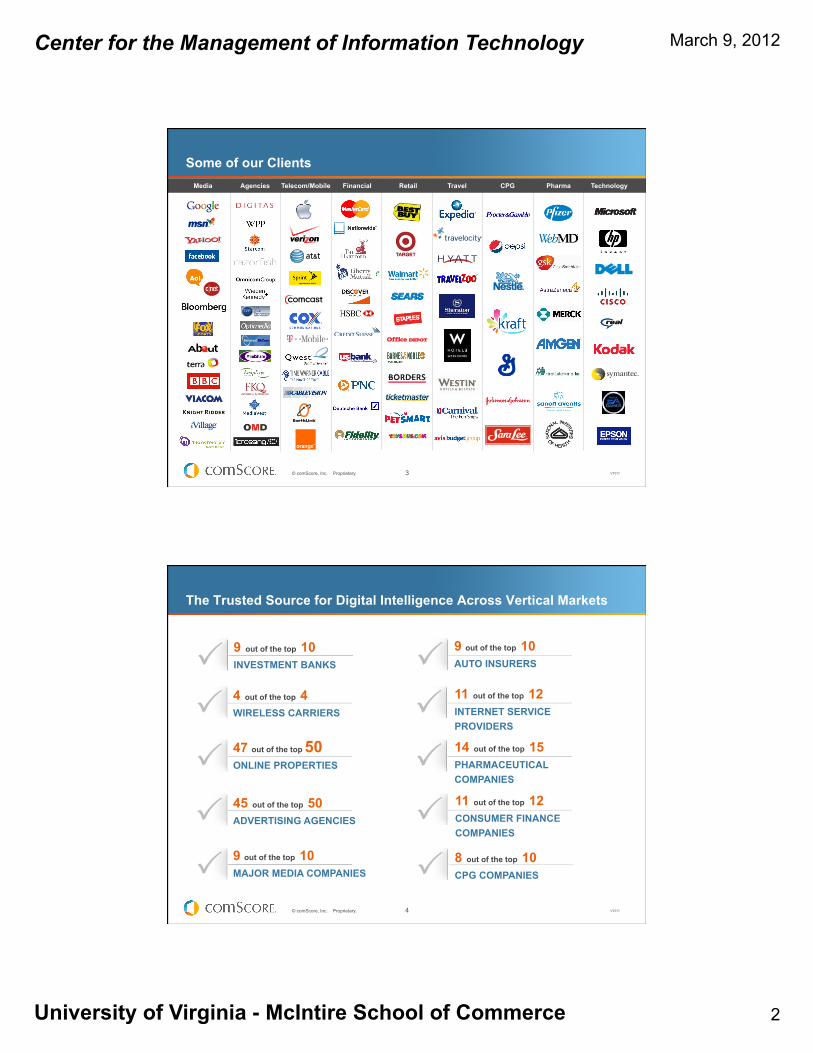
Some of our Clients
Media Agencies Telecom/Mobile Financial Retail Travel CPG Pharma Technology
V1011
4 © comScore, Inc. Proprietary.
The Trusted Source for Digital Intelligence Across Vertical Markets
47 out of the top 50 ONLINE PROPERTIES
45 out of the top 50 ADVERTISING AGENCIES
4 out of the top 4 WIRELESS CARRIERS
9 out of the top 10 INVESTMENT BANKS
9 out of the top 10 MAJOR MEDIA COMPANIES
14 out of the top 15 PHARMACEUTICAL COMPANIES 11 out of the top 12 CONSUMER FINANCE COMPANIES
11 out of the top 12 INTERNET SERVICE PROVIDERS
8 out of the top 10 CPG COMPANIES
9 out of the top 10 AUTO INSURERS
V1011
Center for the Management of Information Technology March 9, 2012
University of Virginia - McIntire School of Commerce 3
5 © comScore, Inc. Proprietary.
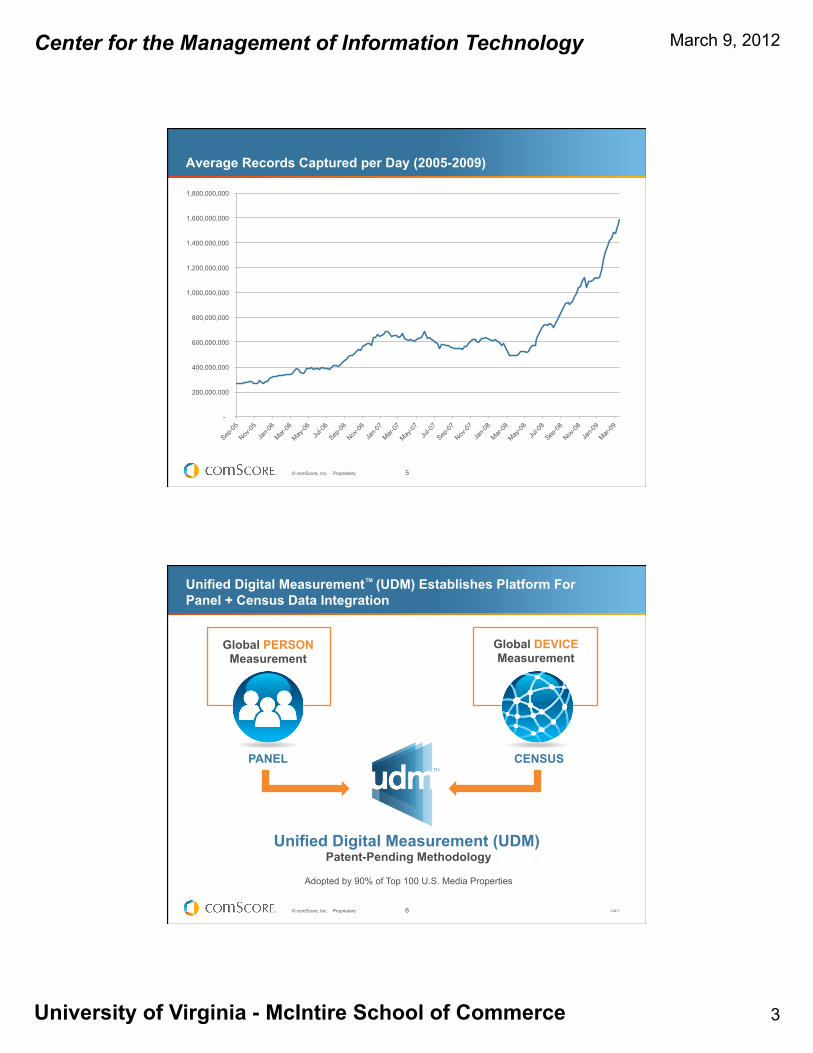
Average Records Captured per Day (2005-2009)
-
200,000,000
400,000,000
600,000,000
800,000,000
1,000,000,000
1,200,000,000
1,400,000,000
1,600,000,000
1,800,000,000
6 © comScore, Inc. Proprietary.
CENSUS
Unified Digital Measurement™ (UDM) Establishes Platform For Panel + Census Data Integration
PANEL
Unified Digital Measurement (UDM) Patent-Pending Methodology
Adopted by 90% of Top 100 U.S. Media Properties
Global PERSON Measurement
Global DEVICE Measurement
V0411
Center for the Management of Information Technology March 9, 2012
University of Virginia - McIntire School of Commerce 4
7 © comScore, Inc. Proprietary.
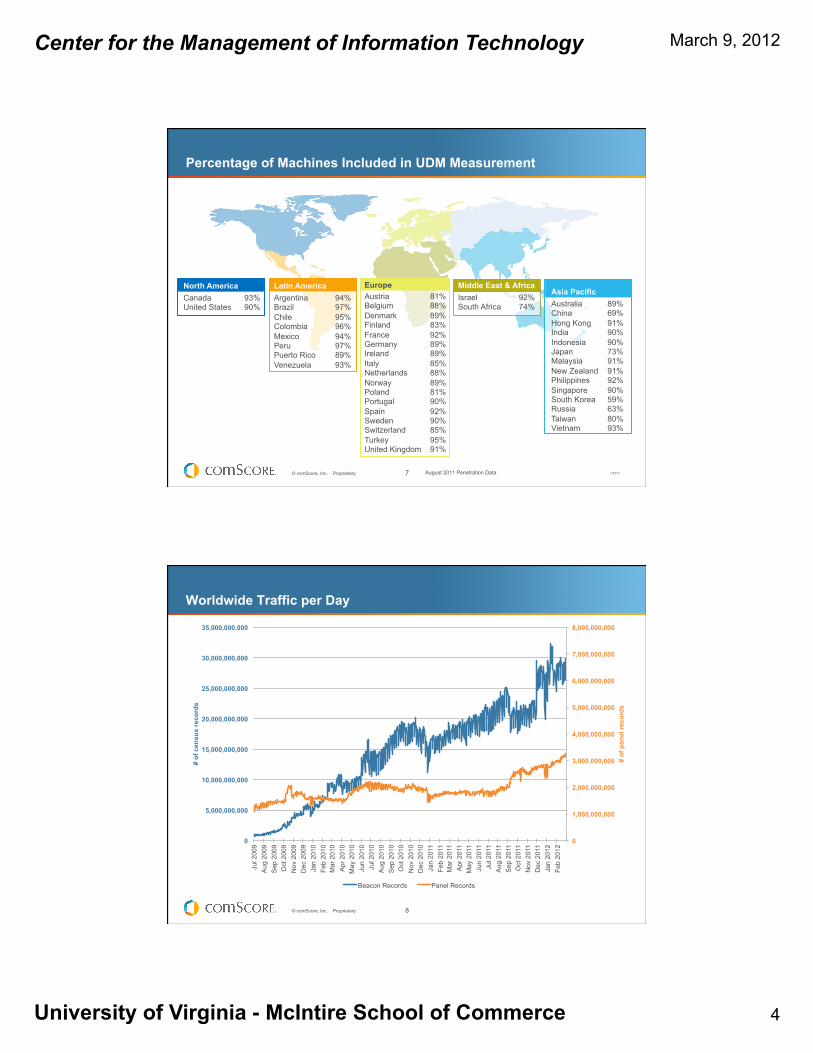
Percentage of Machines Included in UDM Measurement
August 2011 Penetration Data
Europe Austria 81% Belgium 88% Denmark 89% Finland 83% France 92% Germany 89% Ireland 89% Italy 85% Netherlands 88% Norway 89% Poland 81% Portugal 90% Spain 92% Sweden 90% Switzerland 85% Turkey 95% United Kingdom 91%
Asia Pacific Australia 89% China 69% Hong Kong 91% India 90% Indonesia 90% Japan 73% Malaysia 91% New Zealand 91% Philippines 92% Singapore 90% South Korea 59% Russia 63% Taiwan 80% Vietnam 93%
North America Canada 93% United States 90%
Latin America Argentina 94% Brazil 97% Chile 95% Colombia 96% Mexico 94% Peru 97% Puerto Rico 89% Venezuela 93%
Middle East & Africa Israel 92% South Africa 74%
V1011
8 © comScore, Inc. Proprietary.
Worldwide Traffic per Day
0
1,000,000,000
2,000,000,000
3,000,000,000
4,000,000,000
5,000,000,000
6,000,000,000
7,000,000,000
8,000,000,000
0
5,000,000,000
10,000,000,000
15,000,000,000
20,000,000,000
25,000,000,000
30,000,000,000
35,000,000,000
Jul 2
009
Aug
200
9 S
ep 2
009
Oct
200
9 N
ov 2
009
Dec
200
9 Ja
n 20
10
Feb
2010
M
ar 2
010
Apr
201
0 M
ay 2
010
Jun
2010
Ju
l 201
0 A
ug 2
010
Sep
201
0 O
ct 2
010
Nov
201
0 D
ec 2
010
Jan
2011
Fe
b 20
11
Mar
201
1 A
pr 2
011
May
201
1 Ju
n 20
11
Jul 2
011
Aug
201
1 S
ep 2
011
Oct
201
1 N
ov 2
011
Dec
201
1 Ja
n 20
12
Feb
2012
# of
pan
el re
cord
s
# of
cen
sus
reco
rds
Beacon Records Panel Records
Center for the Management of Information Technology March 9, 2012
University of Virginia - McIntire School of Commerce 5
9 © comScore, Inc. Proprietary.
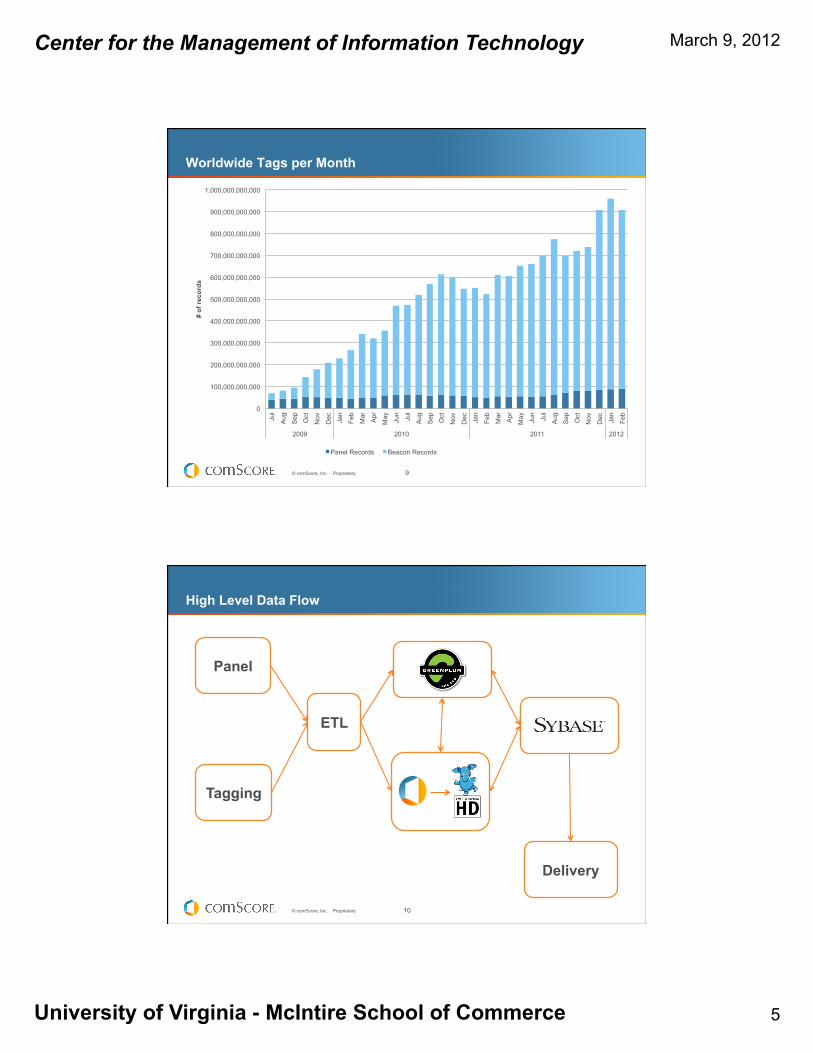
Worldwide Tags per Month
0
100,000,000,000
200,000,000,000
300,000,000,000
400,000,000,000
500,000,000,000
600,000,000,000
700,000,000,000
800,000,000,000
900,000,000,000
1,000,000,000,000
Jul
Aug
Sep
Oct
Nov
Dec
Jan
Feb
Mar
Apr
May
Jun
Jul
Aug
Sep
Oct
Nov
Dec
Jan
Feb
Mar
Apr
May
Jun
Jul
Aug
Sep
Oct
Nov
Dec
Jan
Feb
2009 2010 2011 2012
# of
reco
rds
Panel Records Beacon Records
10 © comScore, Inc. Proprietary.
High Level Data Flow
Panel
Tagging
ETL
Delivery
Center for the Management of Information Technology March 9, 2012
University of Virginia - McIntire School of Commerce 6
11 © comScore, Inc. Proprietary.
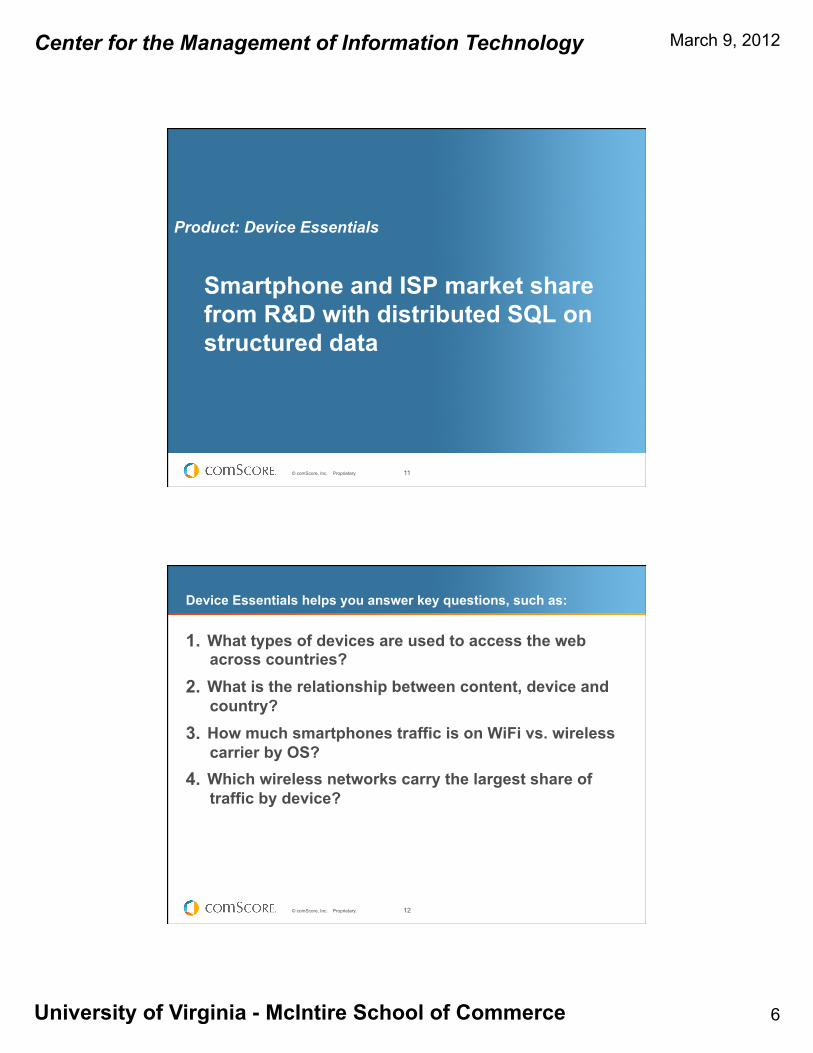
Smartphone and ISP market share from R&D with distributed SQL on structured data
Product: Device Essentials
12 © comScore, Inc. Proprietary.
Device Essentials helps you answer key questions, such as:
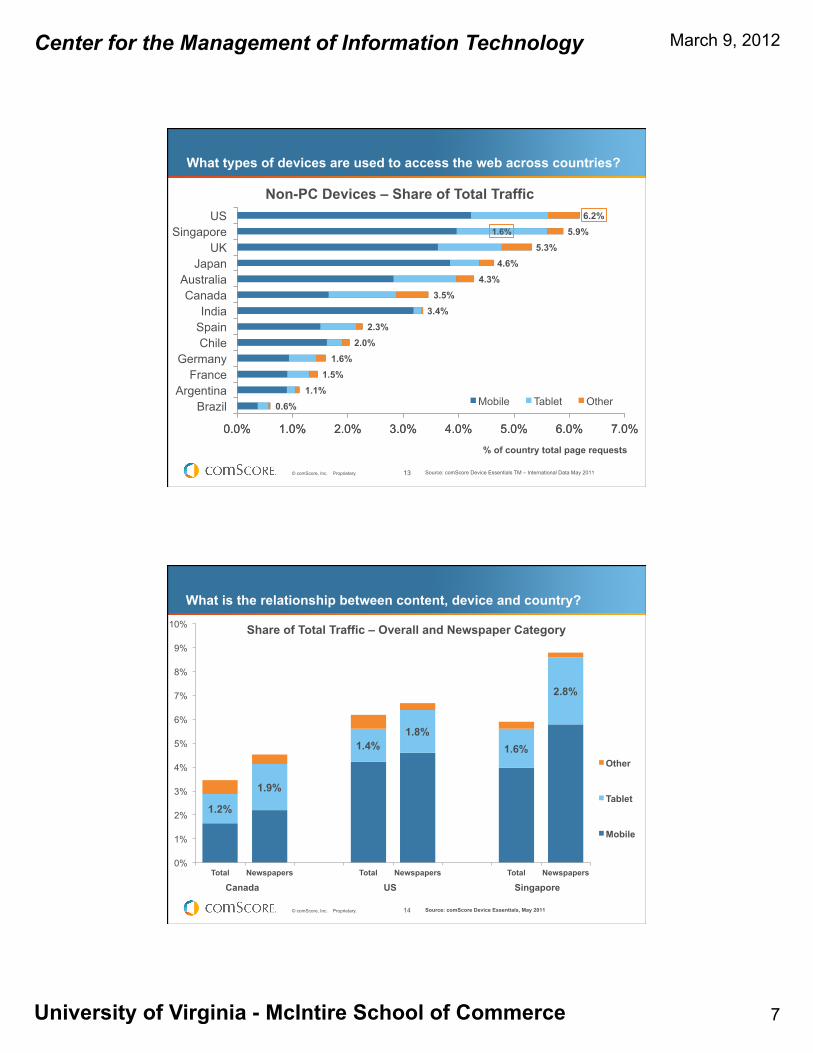
1. What types of devices are used to access the web across countries?
2. What is the relationship between content, device and country?
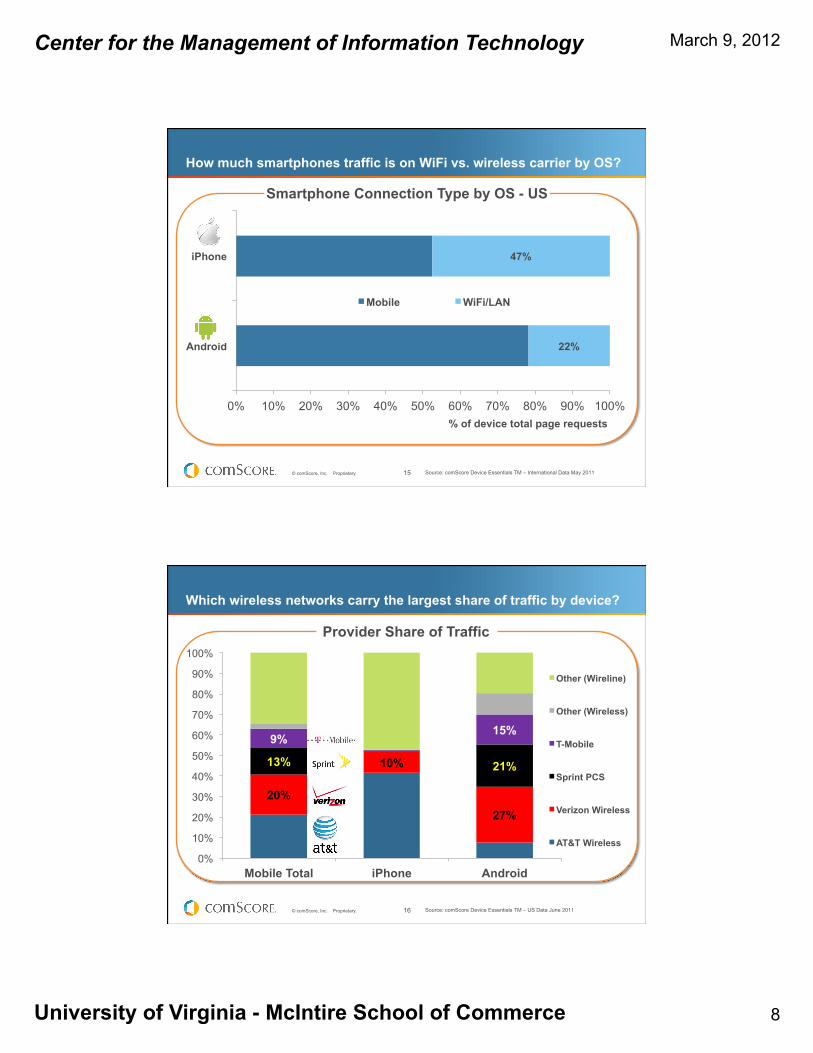
3. How much smartphones traffic is on WiFi vs. wireless carrier by OS?
4. Which wireless networks carry the largest share of traffic by device?
Center for the Management of Information Technology March 9, 2012
University of Virginia - McIntire School of Commerce 7
13 © comScore, Inc. Proprietary.
0.6% 1.1%
1.5% 1.6%
2.0% 2.3%
3.4% 3.5%
4.3% 4.6%
5.3% 5.9%
6.2%
0.0% 1.0% 2.0% 3.0% 4.0% 5.0% 6.0% 7.0%
Brazil Argentina
France Germany
Chile Spain India
Canada Australia
Japan UK
Singapore US
% of country total page requests
Connected Devices – Share of Total Traffic
1.6%
0.0% 1.0% 2.0% 3.0% 4.0% 5.0% 6.0% 7.0%
Brazil Argentina
France Germany
Chile Spain India
Canada Australia
Japan UK
Singapore US
% of country total page requests
Non-PC Devices – Share of Total Traffic
Mobile Tablet Other
What types of devices are used to access the web across countries?
Source: comScore Device Essentials TM – International Data May 2011
14 © comScore, Inc. Proprietary.
What is the relationship between content, device and country?
Source: comScore Device Essentials, May 2011
1.2%
1.9%
1.4% 1.8%
1.6%
2.8%
0%
1%
2%
3%
4%
5%
6%
7%
8%
9%
10%
Total Newspapers Total Newspapers Total Newspapers
Share of Total Traffic – Overall and Newspaper Category
Other
Tablet
Mobile
Canada US Singapore
Center for the Management of Information Technology March 9, 2012
University of Virginia - McIntire School of Commerce 8
15 © comScore, Inc. Proprietary.
How much smartphones traffic is on WiFi vs. wireless carrier by OS?
Source: comScore Device Essentials TM – International Data May 2011
22%
47%
0% 10% 20% 30% 40% 50% 60% 70% 80% 90% 100%
Android
iPhone
% of device total page requests
Smartphone Connection Type by OS - US
Mobile WiFi/LAN
16 © comScore, Inc. Proprietary.
Which wireless networks carry the largest share of traffic by device?
Source: comScore Device Essentials TM – US Data June 2011
Provider Share of Traffic
20%
10%
27%
13% 21%
9% 15%
0%
10%
20%
30%
40%
50%
60%
70%
80%
90%
100%
Mobile Total iPhone Android
Other (Wireline)
Other (Wireless)
T-Mobile
Sprint PCS
Verizon Wireless
AT&T Wireless
Center for the Management of Information Technology March 9, 2012
University of Virginia - McIntire School of Commerce 9
17 © comScore, Inc. Proprietary.
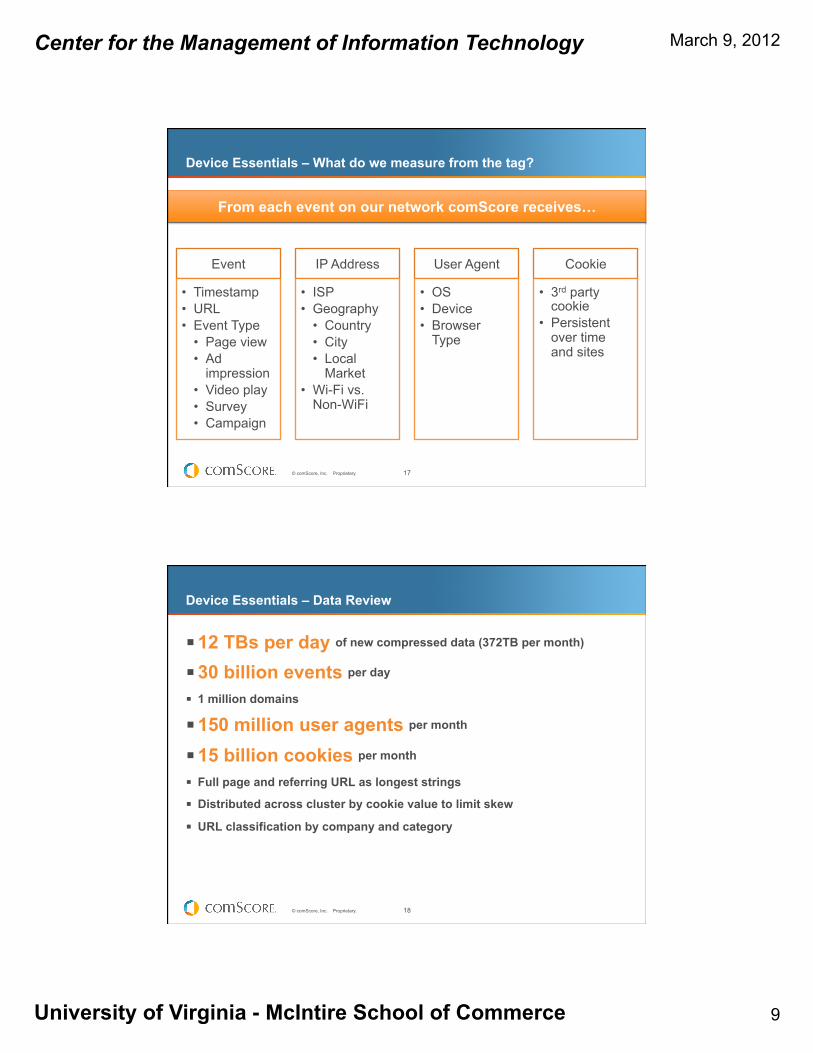
Device Essentials – What do we measure from the tag?
From each event on our network comScore receives…
Event
• Timestamp • URL • Event Type
• Page view • Ad
impression • Video play • Survey • Campaign
IP Address
• ISP • Geography
• Country • City • Local
Market • Wi-Fi vs.
Non-WiFi
User Agent
• OS • Device • Browser
Type
Cookie
• 3rd party cookie
• Persistent over time and sites
18 © comScore, Inc. Proprietary.
Device Essentials – Data Review
§ 12 TBs per day of new compressed data (372TB per month)
§ 30 billion events per day
§ 1 million domains
§ 150 million user agents per month
§ 15 billion cookies per month
§ Full page and referring URL as longest strings
§ Distributed across cluster by cookie value to limit skew
§ URL classification by company and category
Center for the Management of Information Technology March 9, 2012
University of Virginia - McIntire School of Commerce 10
19 © comScore, Inc. Proprietary.
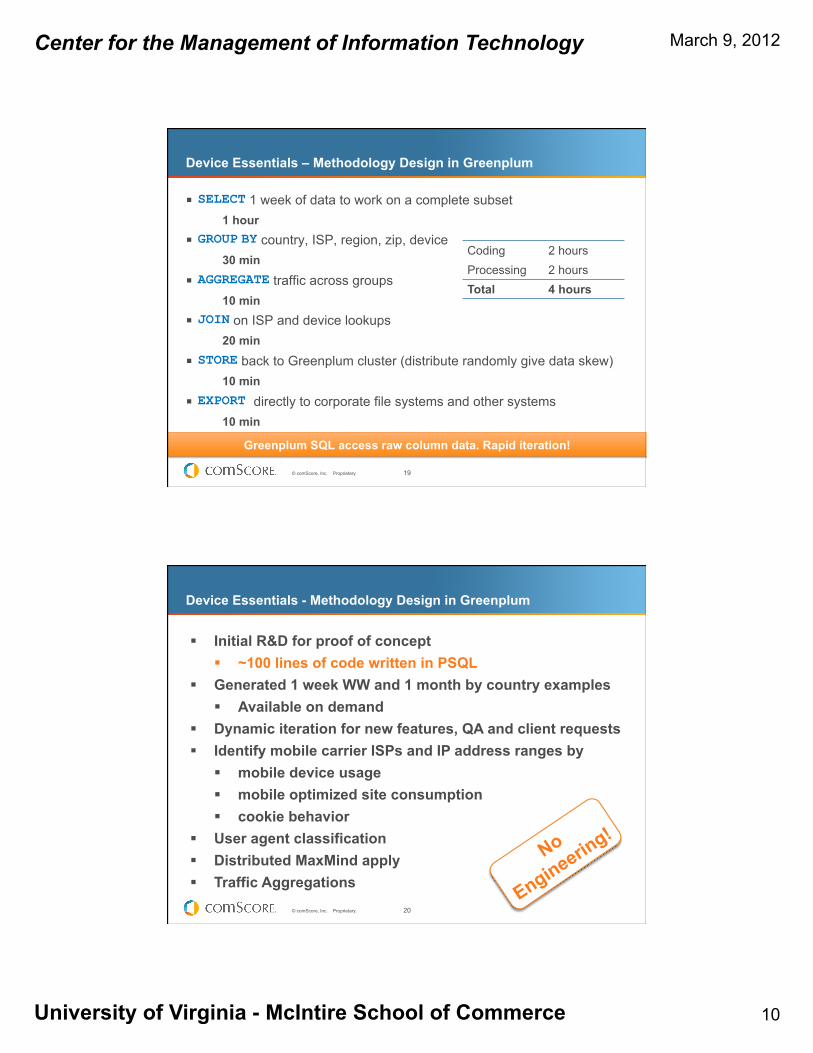
Device Essentials – Methodology Design in Greenplum
§ SELECT 1 week of data to work on a complete subset 1 hour § GROUP BY country, ISP, region, zip, device 30 min
§ AGGREGATE traffic across groups 10 min § JOIN on ISP and device lookups 20 min
§ STORE back to Greenplum cluster (distribute randomly give data skew) 10 min
§ EXPORT directly to corporate file systems and other systems 10 min Greenplum SQL access raw column data. Rapid iteration!
Coding 2 hours Processing 2 hours Total 4 hours
20 © comScore, Inc. Proprietary.
Device Essentials - Methodology Design in Greenplum
§ Initial R&D for proof of concept § ~100 lines of code written in PSQL
§ Generated 1 week WW and 1 month by country examples § Available on demand
§ Dynamic iteration for new features, QA and client requests § Identify mobile carrier ISPs and IP address ranges by
§ mobile device usage § mobile optimized site consumption § cookie behavior
§ User agent classification § Distributed MaxMind apply § Traffic Aggregations
No
Engineering!
Center for the Management of Information Technology March 9, 2012
University of Virginia - McIntire School of Commerce 11
21 © comScore, Inc. Proprietary.
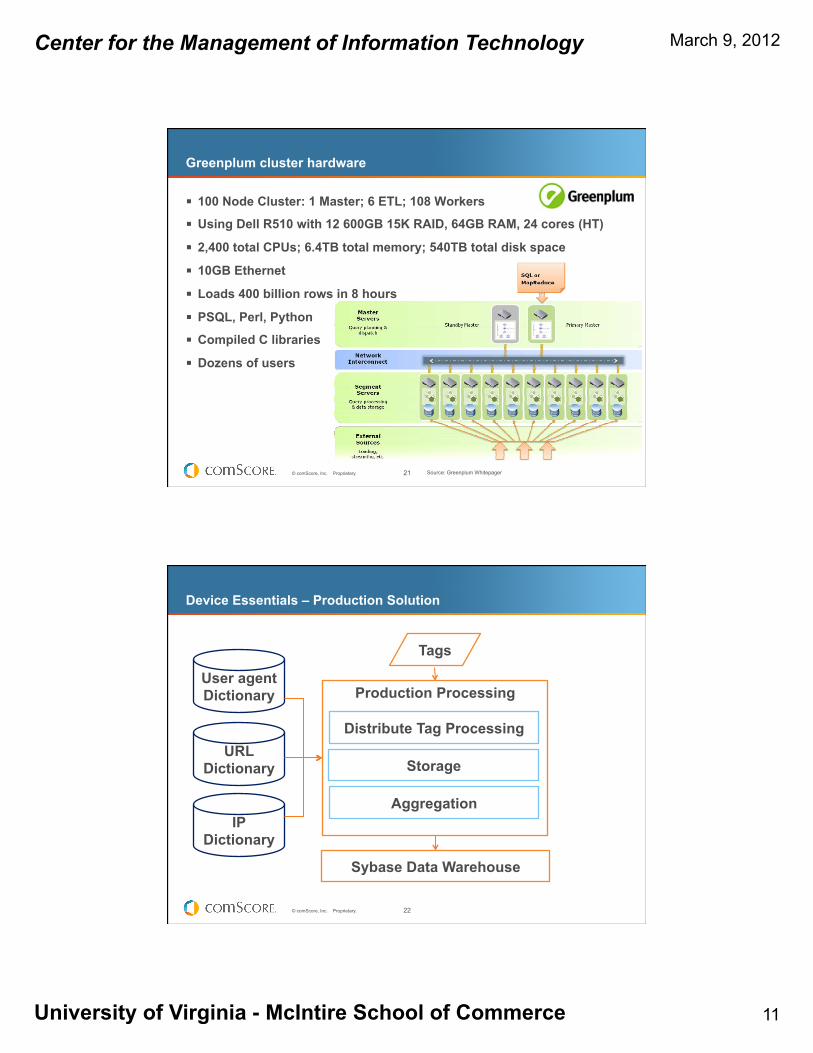
Greenplum cluster hardware
§ 100 Node Cluster: 1 Master; 6 ETL; 108 Workers
§ Using Dell R510 with 12 600GB 15K RAID, 64GB RAM, 24 cores (HT)
§ 2,400 total CPUs; 6.4TB total memory; 540TB total disk space
§ 10GB Ethernet
§ Loads 400 billion rows in 8 hours
§ PSQL, Perl, Python
§ Compiled C libraries
§ Dozens of users
Source: Greenplum Whitepager
22 © comScore, Inc. Proprietary.
Device Essentials – Production Solution
User agent Dictionary
URL Dictionary
IP Dictionary
Tags
Production Processing
Sybase Data Warehouse
Distribute Tag Processing
Storage
Aggregation
Center for the Management of Information Technology March 9, 2012
University of Virginia - McIntire School of Commerce 12
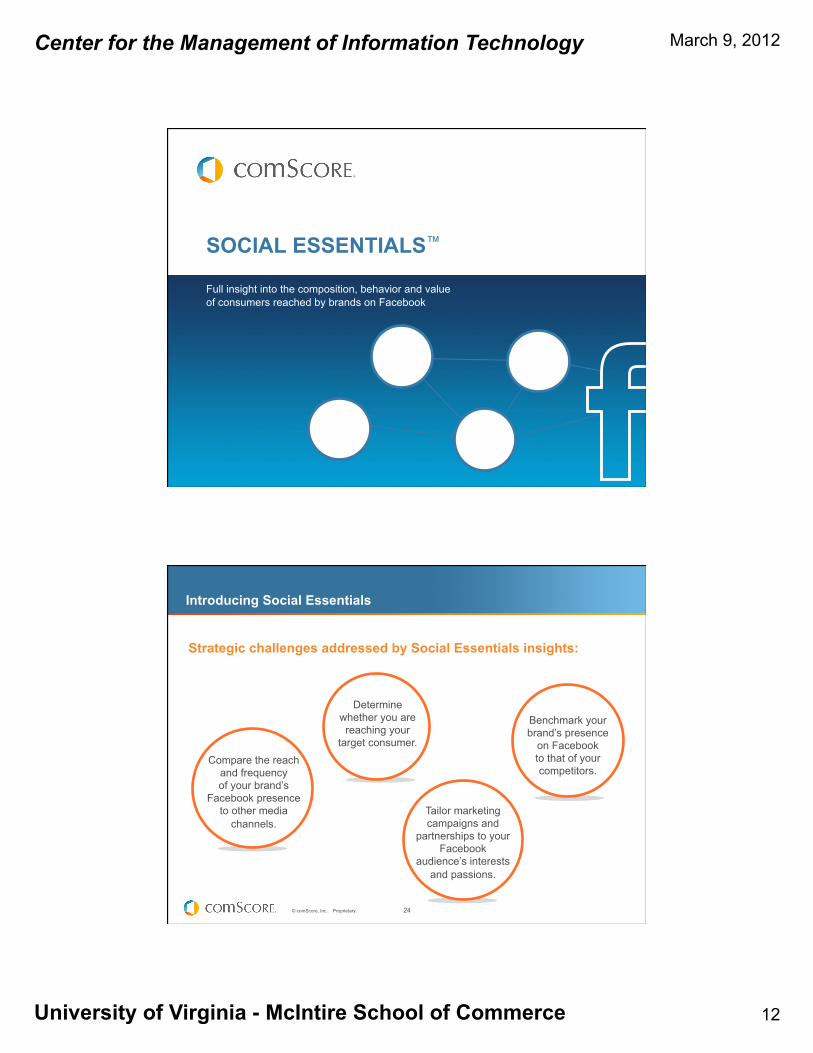
SOCIAL ESSENTIALS™ Full insight into the composition, behavior and value of consumers reached by brands on Facebook
24 © comScore, Inc. Proprietary.
Introducing Social Essentials
Strategic challenges addressed by Social Essentials insights:
Compare the reach and frequency of your brand’s
Facebook presence to other media
channels.
Determine whether you are reaching your
target consumer.
Tailor marketing campaigns and
partnerships to your Facebook
audience’s interests and passions.
Benchmark your brand’s presence
on Facebook to that of your competitors.
Center for the Management of Information Technology March 9, 2012
University of Virginia - McIntire School of Commerce 13
25 © comScore, Inc. Proprietary.
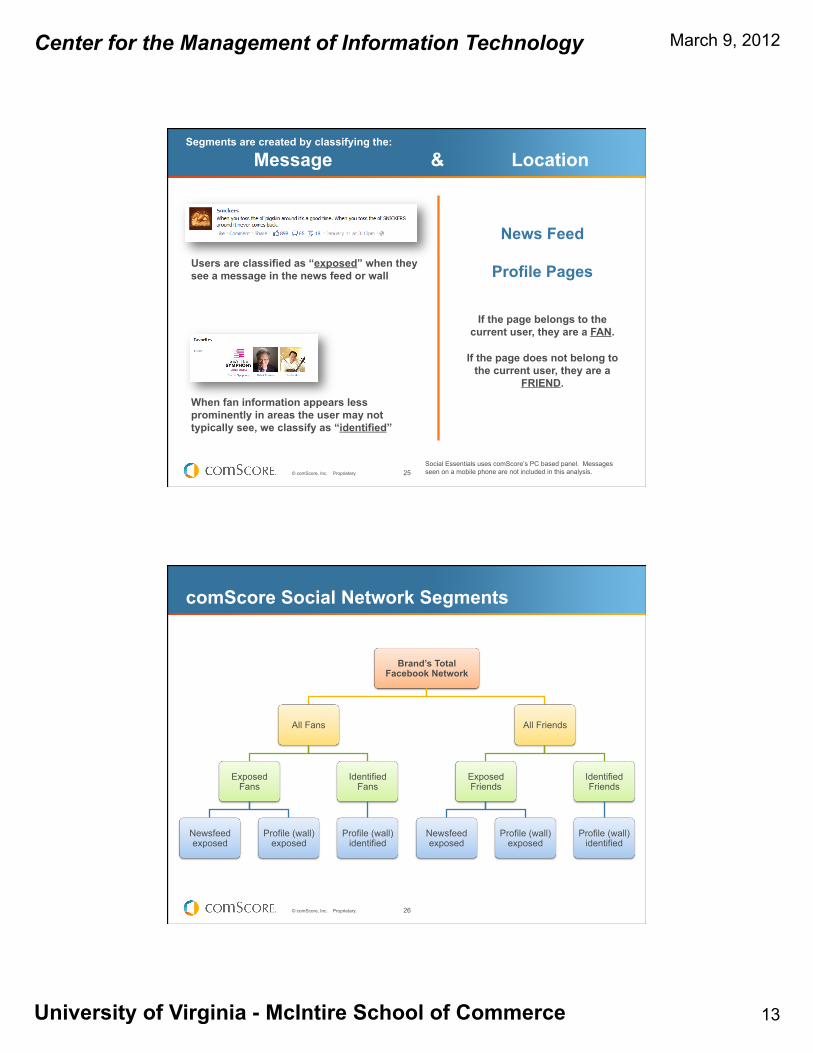
Segments are created by classifying the:
Message & Location
Social Essentials uses comScore’s PC based panel. Messages seen on a mobile phone are not included in this analysis.
Users are classified as “exposed” when they see a message in the news feed or wall
When fan information appears less prominently in areas the user may not typically see, we classify as “identified”
News Feed
Profile Pages
If the page belongs to the current user, they are a FAN.
If the page does not belong to
the current user, they are a FRIEND.
26 © comScore, Inc. Proprietary.
comScore Social Network Segments
Brand’s Total Facebook Network
All Fans
Exposed Fans
Newsfeed exposed
Profile (wall) exposed
Identified Fans
Profile (wall) identified
All Friends
Exposed Friends
Newsfeed exposed
Profile (wall) exposed
Identified Friends
Profile (wall) identified
Center for the Management of Information Technology March 9, 2012
University of Virginia - McIntire School of Commerce 14
27 © comScore, Inc. Proprietary.
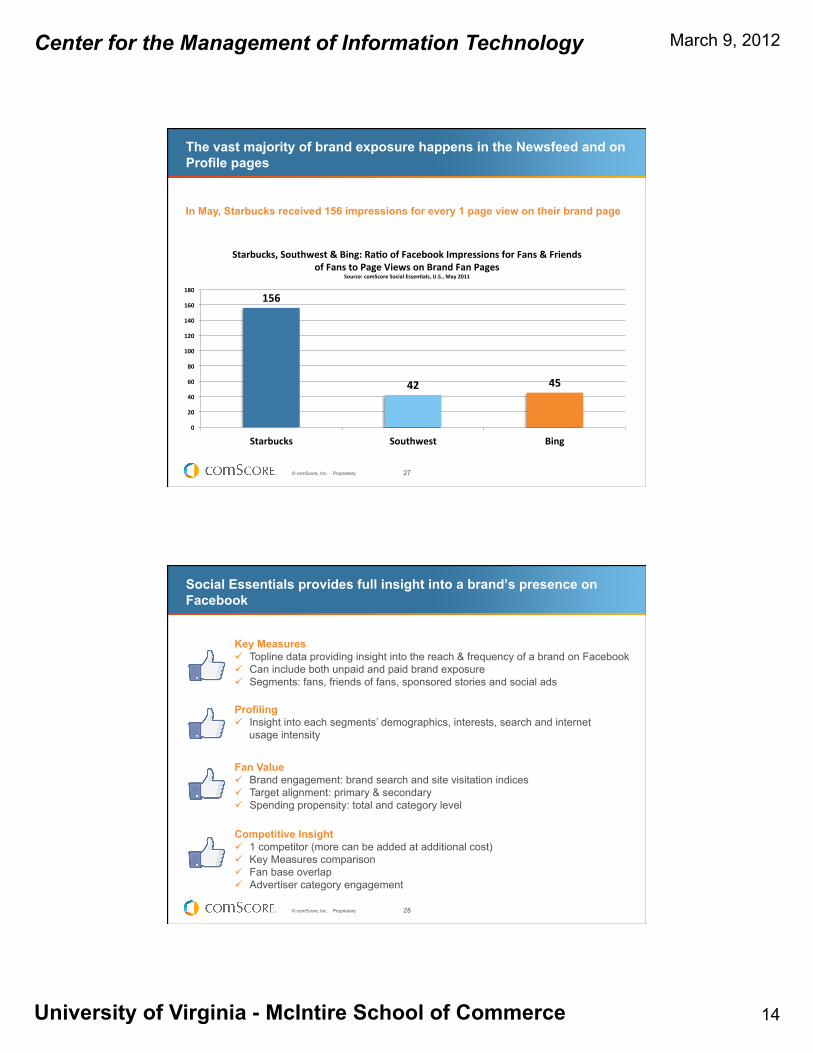
The vast majority of brand exposure happens in the Newsfeed and on Profile pages
156
42 45
0
20
40
60
80
100
120
140
160
180
Starbucks Southwest Bing
Starbucks, Southwest & Bing: Ra>o of Facebook Impressions for Fans & Friends of Fans to Page Views on Brand Fan Pages
Source: comScore Social Essen>als, U.S., May 2011
In May, Starbucks received 156 impressions for every 1 page view on their brand page
28 © comScore, Inc. Proprietary.
Social Essentials provides full insight into a brand’s presence on Facebook
Key Measures ü Topline data providing insight into the reach & frequency of a brand on Facebook ü Can include both unpaid and paid brand exposure ü Segments: fans, friends of fans, sponsored stories and social ads
Profiling ü Insight into each segments’ demographics, interests, search and internet
usage intensity
Fan Value ü Brand engagement: brand search and site visitation indices ü Target alignment: primary & secondary ü Spending propensity: total and category level
Competitive Insight ü 1 competitor (more can be added at additional cost) ü Key Measures comparison ü Fan base overlap ü Advertiser category engagement
Center for the Management of Information Technology March 9, 2012
University of Virginia - McIntire School of Commerce 15
29 © comScore, Inc. Proprietary.
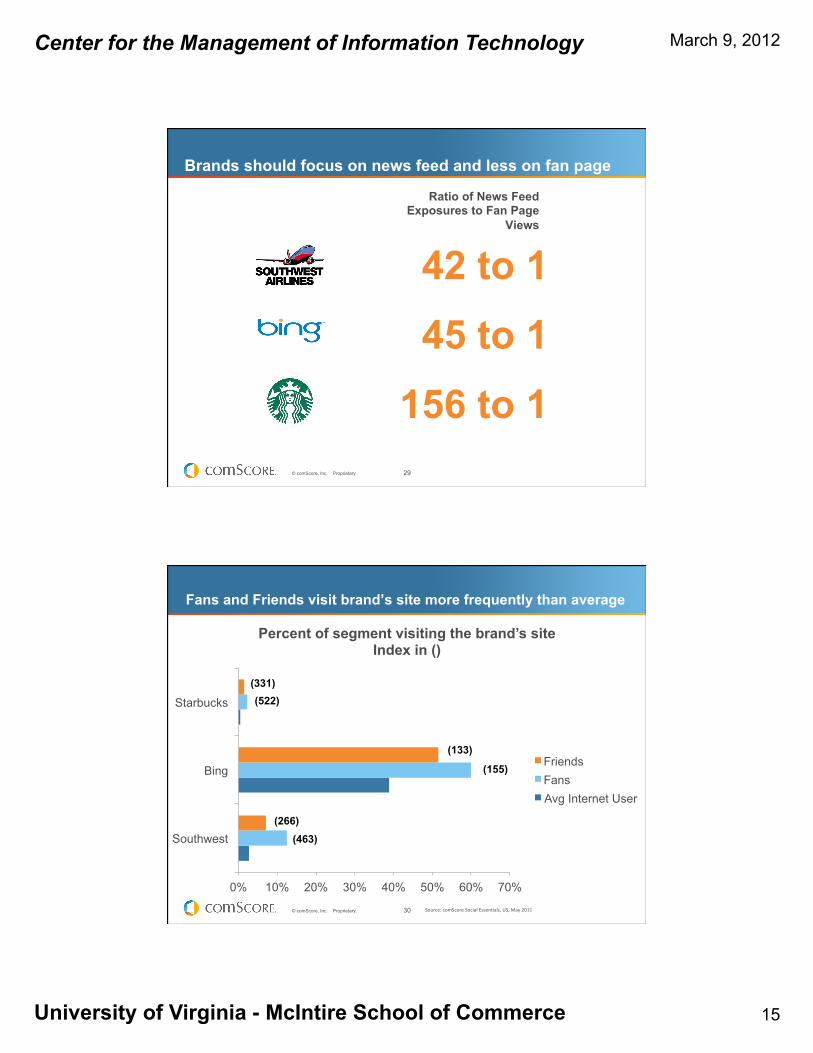
Brands should focus on news feed and less on fan page
Ratio of News Feed Exposures to Fan Page
Views
42 to 1 45 to 1
156 to 1
30 © comScore, Inc. Proprietary.
Fans and Friends visit brand’s site more frequently than average
Source: comScore Social Essen0als, US, May 2011
0% 10% 20% 30% 40% 50% 60% 70%
Southwest
Bing
Starbucks
Percent of segment visiting the brand’s site Index in ()
Friends Fans Avg Internet User
(463) (266)
(155)
(133)
(522) (331)
Center for the Management of Information Technology March 9, 2012
University of Virginia - McIntire School of Commerce 16
31 © comScore, Inc. Proprietary.
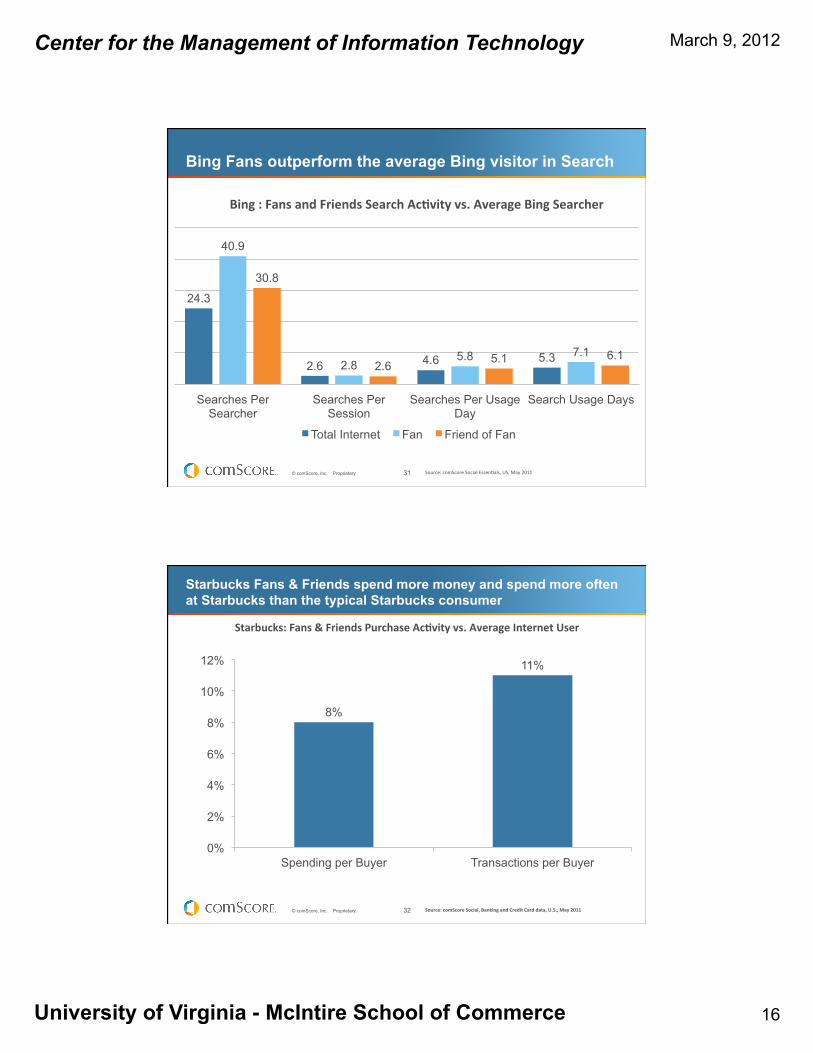
Bing Fans outperform the average Bing visitor in Search
Source: comScore Social Essen0als, US, May 2011
24.3
2.6 4.6 5.3
40.9
2.8 5.8 7.1
30.8
2.6 5.1 6.1
Searches Per Searcher
Searches Per Session
Searches Per Usage Day
Search Usage Days
Bing : Fans and Friends Search Ac>vity vs. Average Bing Searcher
Total Internet Fan Friend of Fan
32 © comScore, Inc. Proprietary.
Starbucks Fans & Friends spend more money and spend more often at Starbucks than the typical Starbucks consumer
Source: comScore Social, Banking and Credit Card data, U.S., May 2011
8%
11%
0%
2%
4%
6%
8%
10%
12%
Spending per Buyer Transactions per Buyer
Starbucks: Fans & Friends Purchase Ac>vity vs. Average Internet User
Center for the Management of Information Technology March 9, 2012
University of Virginia - McIntire School of Commerce 17
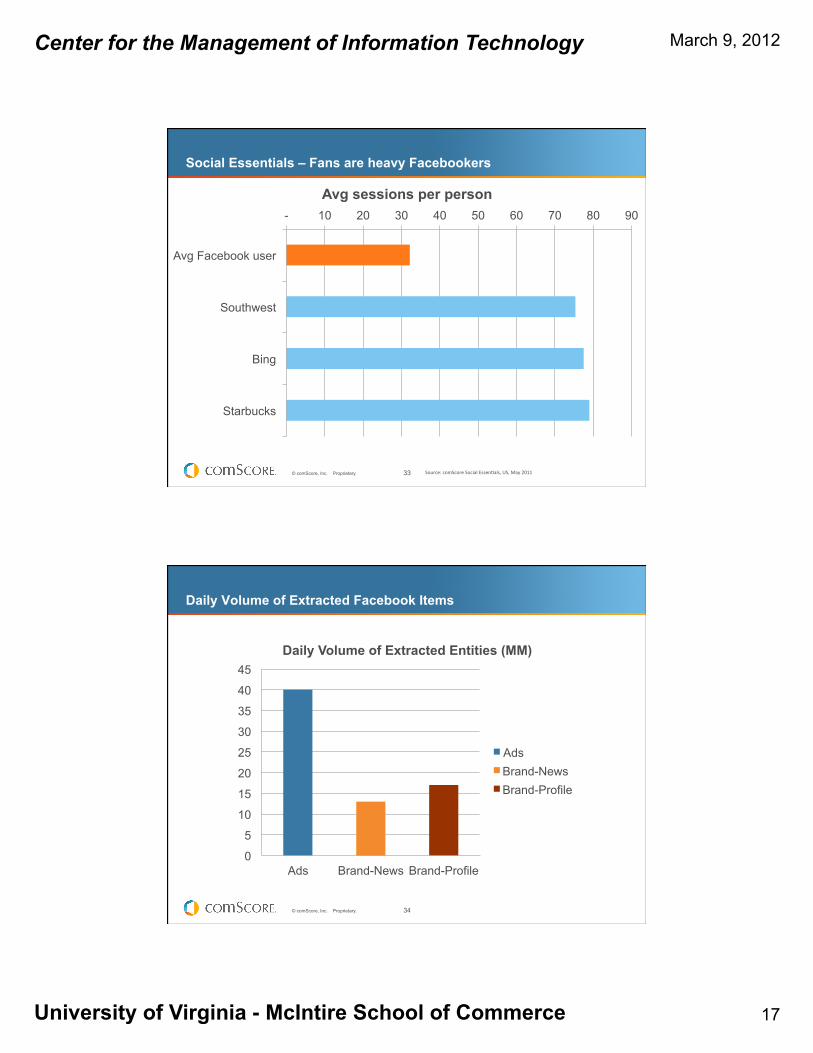
33 © comScore, Inc. Proprietary.
Social Essentials – Fans are heavy Facebookers
Source: comScore Social Essen0als, US, May 2011
- 10 20 30 40 50 60 70 80 90
Avg Facebook user
Southwest
Bing
Starbucks
Avg sessions per person
34 © comScore, Inc. Proprietary.
Daily Volume of Extracted Facebook Items
0
5
10
15
20
25
30
35
40
45
Ads Brand-News Brand-Profile
Daily Volume of Extracted Entities (MM)
Ads Brand-News Brand-Profile
Center for the Management of Information Technology March 9, 2012
University of Virginia - McIntire School of Commerce 18
35 © comScore, Inc. Proprietary.
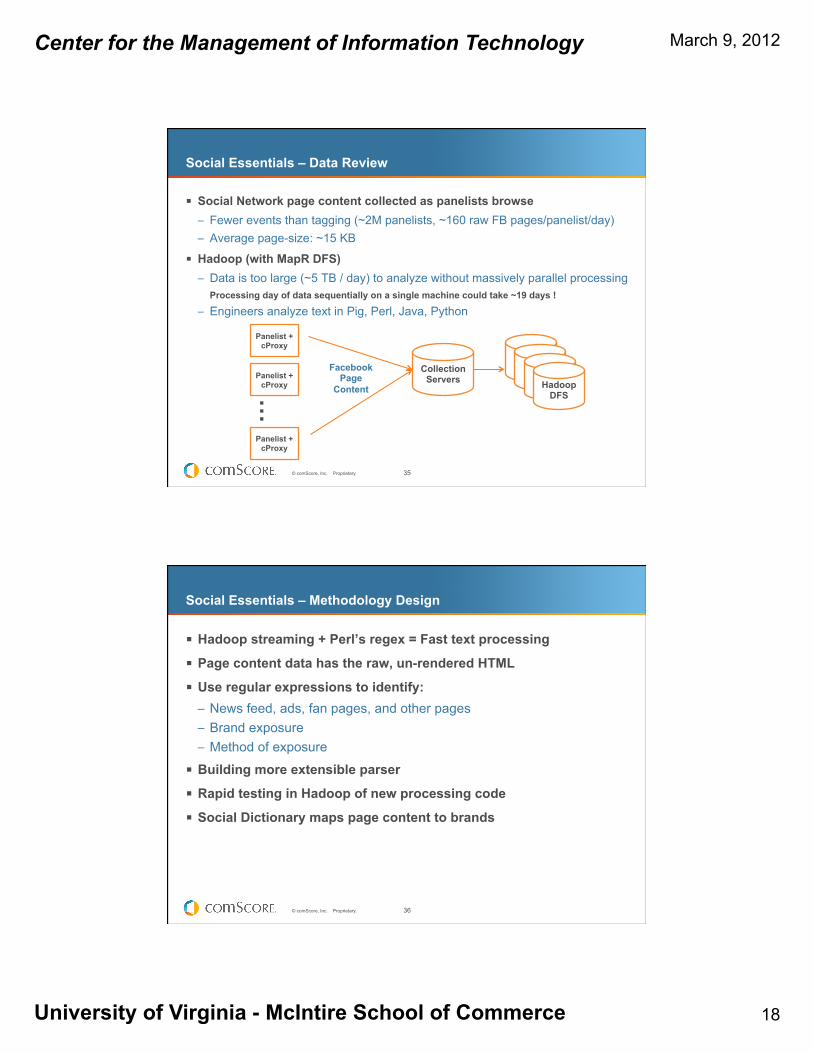
Social Essentials – Data Review
§ Social Network page content collected as panelists browse – Fewer events than tagging (~2M panelists, ~160 raw FB pages/panelist/day) – Average page-size: ~15 KB
§ Hadoop (with MapR DFS) – Data is too large (~5 TB / day) to analyze without massively parallel processing
Processing day of data sequentially on a single machine could take ~19 days !
– Engineers analyze text in Pig, Perl, Java, Python
Hadoop DFS
Panelist + cProxy
Collection Servers
Facebook Page
Content
Panelist + cProxy
…
Panelist + cProxy
36 © comScore, Inc. Proprietary.
Social Essentials – Methodology Design
§ Hadoop streaming + Perl’s regex = Fast text processing
§ Page content data has the raw, un-rendered HTML
§ Use regular expressions to identify: – News feed, ads, fan pages, and other pages – Brand exposure – Method of exposure
§ Building more extensible parser
§ Rapid testing in Hadoop of new processing code
§ Social Dictionary maps page content to brands
Center for the Management of Information Technology March 9, 2012
University of Virginia - McIntire School of Commerce 19
37 © comScore, Inc. Proprietary.
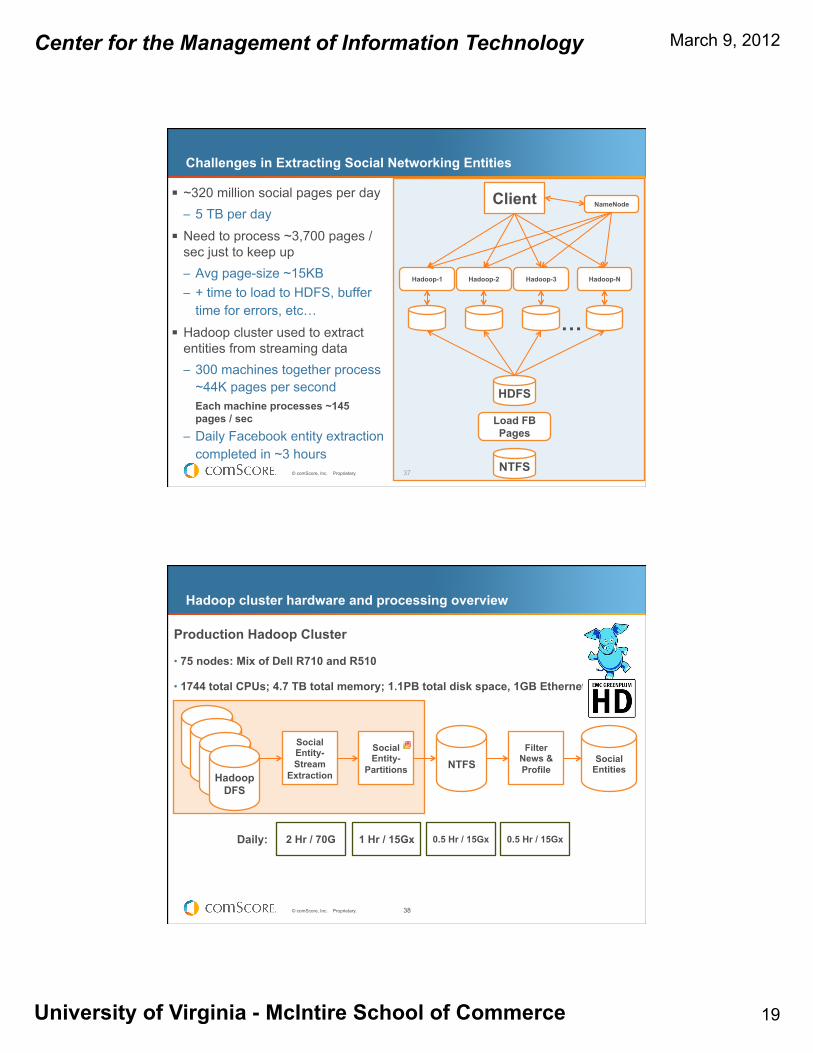
Challenges in Extracting Social Networking Entities
§ ~320 million social pages per day – 5 TB per day
§ Need to process ~3,700 pages / sec just to keep up – Avg page-size ~15KB – + time to load to HDFS, buffer
time for errors, etc…
§ Hadoop cluster used to extract entities from streaming data – 300 machines together process
~44K pages per second Each machine processes ~145 pages / sec
– Daily Facebook entity extraction completed in ~3 hours
Client
Hadoop-1 Hadoop-2 Hadoop-3 Hadoop-N
…
NameNode
Load FB Pages
NTFS
HDFS
38 © comScore, Inc. Proprietary.
Hadoop cluster hardware and processing overview
Hadoop DFS
Social Entity-Stream
Extraction NTFS
Social Entity-
Partitions
Filter News & Profile
Social Entities
2 Hr / 70G 1 Hr / 15Gx 0.5 Hr / 15Gx 0.5 Hr / 15Gx Daily:
Production Hadoop Cluster
• 75 nodes: Mix of Dell R710 and R510
• 1744 total CPUs; 4.7 TB total memory; 1.1PB total disk space, 1GB Ethernet
Center for the Management of Information Technology March 9, 2012
University of Virginia - McIntire School of Commerce 20
39 © comScore, Inc. Proprietary.
Some Tips & Tricks
40 © comScore, Inc. Proprietary.
Compression w/Sorting
§ Compress Log Files when processing large volumes of log data
§ Several advantages to Sorting Data First: – Reduces the size of the data – Improves application performance
§ Examples: – 1 Hour of our data (313 GB raw, 815 million rows) – Standard compression of time ordered data is 93GB (30% of original) – Standard compression on a 2 key sorted set is 56GB (18% of original) – For one day it saves 800GB – For one month it saves 25 TB – For 90 days it saves 75TB
Center for the Management of Information Technology March 9, 2012
University of Virginia - McIntire School of Commerce 21
41 © comScore, Inc. Proprietary.
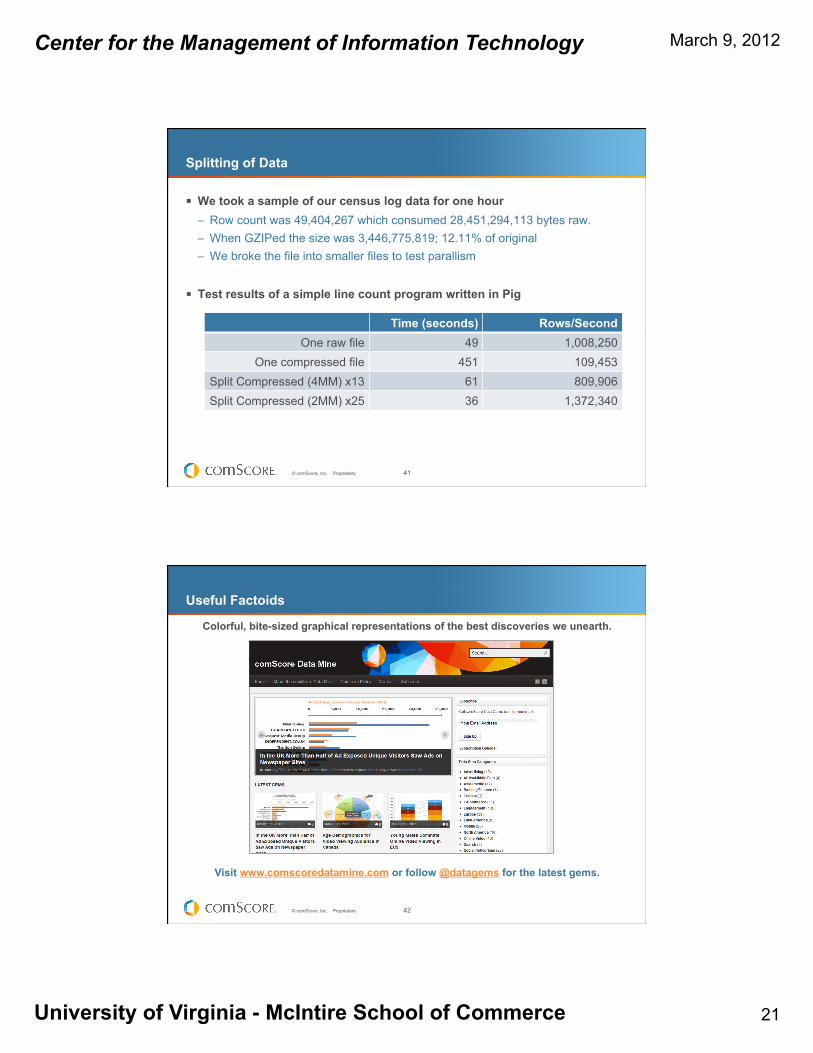
Splitting of Data
§ We took a sample of our census log data for one hour – Row count was 49,404,267 which consumed 28,451,294,113 bytes raw. – When GZIPed the size was 3,446,775,819; 12.11% of original – We broke the file into smaller files to test parallism
§ Test results of a simple line count program written in Pig
Time (seconds) Rows/Second One raw file 49 1,008,250
One compressed file 451 109,453 Split Compressed (4MM) x13 61 809,906 Split Compressed (2MM) x25 36 1,372,340
42 © comScore, Inc. Proprietary.
Useful Factoids
Visit www.comscoredatamine.com or follow @datagems for the latest gems.
Colorful, bite-sized graphical representations of the best discoveries we unearth.
Center for the Management of Information Technology March 9, 2012
University of Virginia - McIntire School of Commerce 22
43 © comScore, Inc. Proprietary.
Thank You!
Michael Brown CTO comScore, Inc. [email protected]