Embed Size (px)
Citation preview

CENTENNIAL COLLEGE SCHOOL OF ENGINEERING & APPLIED SCIENCE
VS 361 Introduction to GIS
• Map Coordinate Systems and Georeferecing
• COURSE NOTES
1
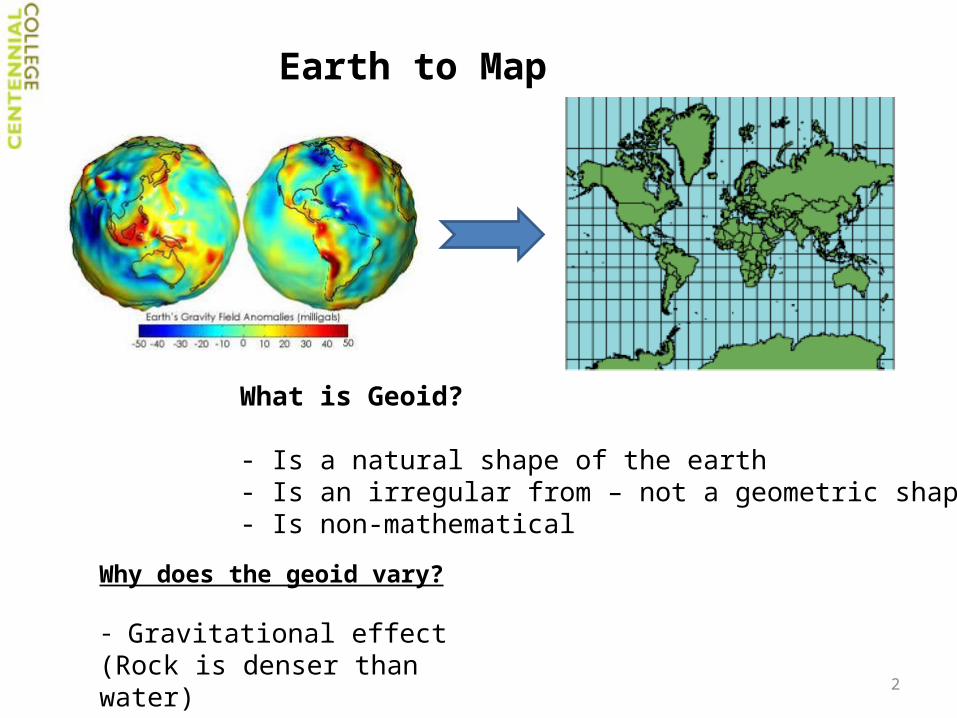
Earth to Map
What is Geoid?
- Is a natural shape of the earth- Is an irregular from – not a geometric shape- Is non-mathematical
Why does the geoid vary?
- Gravitational effect(Rock is denser than water)- Centrifical force of rotation
2
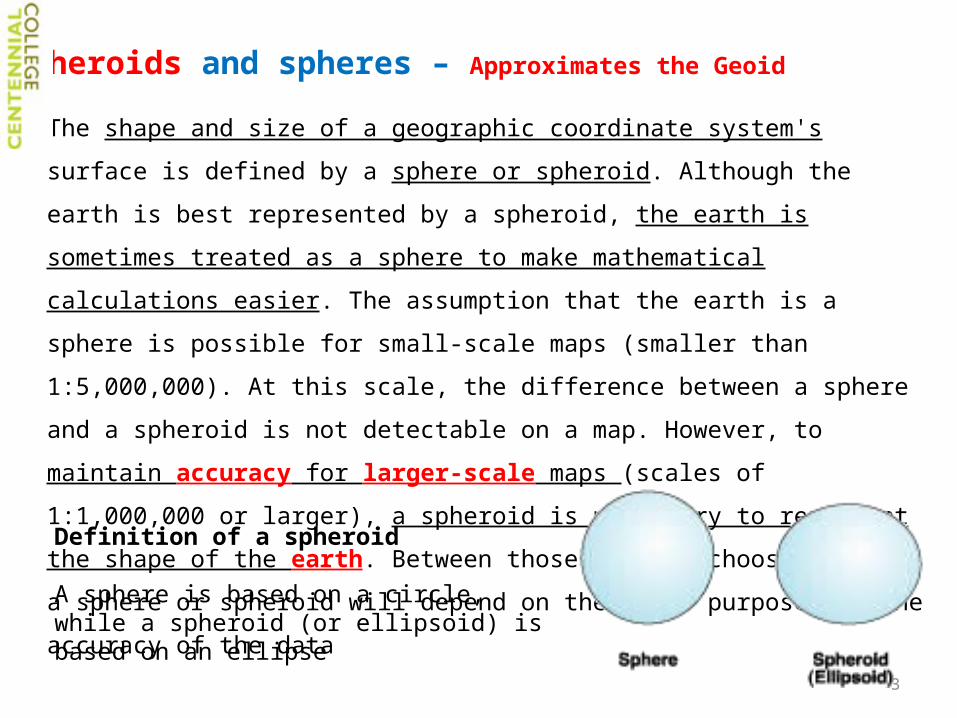
The shape and size of a geographic coordinate system's surface is defined by a
sphere or spheroid. Although the earth is best represented by a spheroid, the earth
is sometimes treated as a sphere to make mathematical calculations easier. The
assumption that the earth is a sphere is possible for small-scale maps (smaller
than 1:5,000,000). At this scale, the difference between a sphere and a spheroid is
not detectable on a map. However, to maintain accuracy for larger-scale maps
(scales of 1:1,000,000 or larger), a spheroid is necessary to represent the shape of
the earth. Between those scales, choosing to use a sphere or spheroid will depend
on the map's purpose and the accuracy of the data
Spheroids and spheres – Approximates the Geoid
Definition of a spheroid A sphere is based on a circle, while a spheroid (or ellipsoid) is based on an ellipse.
Definition of a spheroid
A sphere is based on a circle, while a spheroid (or ellipsoid) is based on an ellipse
3
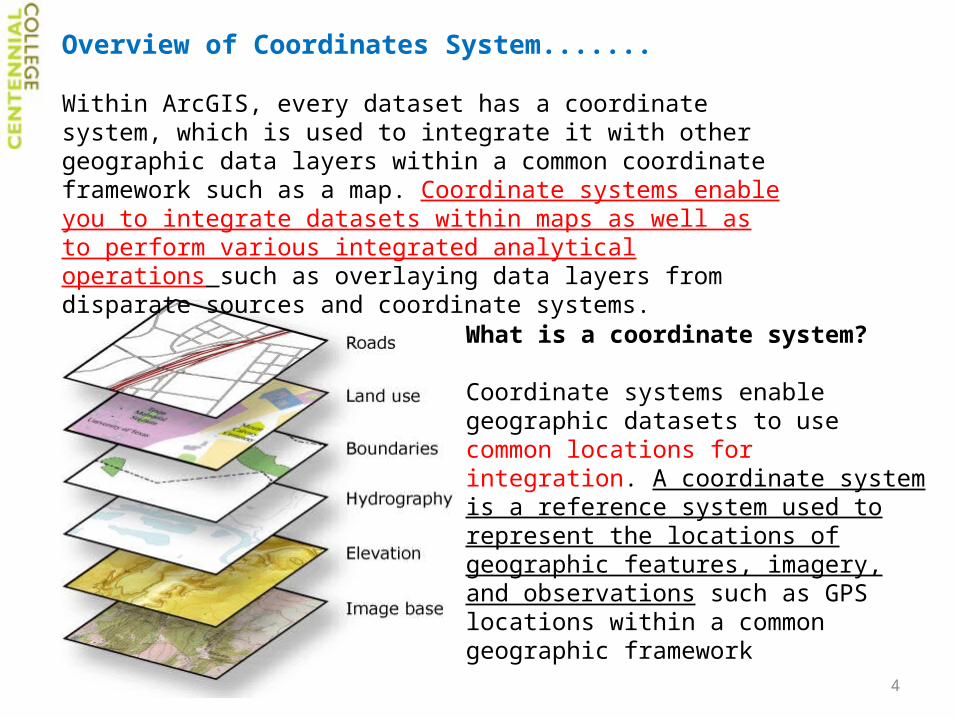
Overview of Coordinates System.......
Within ArcGIS, every dataset has a coordinate system, which is used to integrate it with other geographic data layers within a common coordinate framework such as a map. Coordinate systems enable you to integrate datasets within maps as well as to perform various integrated analytical operations such as overlaying data layers from disparate sources and coordinate systems.
What is a coordinate system?
Coordinate systems enable geographic datasets to use common locations for integration. A coordinate system is a reference system used to represent the locations of geographic features, imagery, and observations such as GPS locations within a common geographic framework
4

Each coordinate system is defined by:
Its measurement framework which is either geographic (in which spherical coordinates are measured from the earth's center) or planimetric (in which the earth's coordinates are projected onto a two-dimensional planar surface).
Unit of measurement (typically feet or meters for projected coordinate systems or decimal degrees for latitude-longitude).
The definition of the map projection for projected coordinate systems.
Other measurement system properties such as a spheroid of reference, a datum, and projection parameters like one or more standard parallels, a central meridian, and possible shifts in the x- and y-directions.
5
6
1. Global or spherical coordinate system such as latitude-longitude. These are often referred to as geographic coordinate systems.
2. Projected coordinate system based on a map projection such as transverse Mercator, Albers equal area, or Robinson, all of which (along with numerous other map projection models) provide various mechanisms to project maps of the earth's spherical surface onto a two-dimensional Cartesian coordinate plane.
There are two common types of coordinate systems used in GIS:

geographic coordinate system
A reference system that uses latitude and longitude to define the
locations of points on the surface of a sphere or spheroid. A geographic
coordinate system definition includes a datum, prime meridian, and
angular unit.
The origin of the Graticule (0,0) is defined by where the equator and prime meridian intersect. The globe is then divided into four geographical quadrants that are based on compass bearings from the origin. North and south are above and below the equator, and west and east are to the left and right of the prime meridian.
7

Latitude and longitude
One method for describing the position of a geographic location on the earth's surface is using spherical measures of latitude and longitude. They are measures of the angles (in degrees) from the center of the earth to a point on the earth's surface. This reference system is often referred to as a geographic coordinate system.
Latitude angles are measured in a north-south direction. The equator is at an angle of 0. Often, the northern hemisphere has positive measures of latitude and the southern hemisphere has negative measures of latitude. These latitude lines call Parallels
Longitude measures angles in an east-west direction. Longitude measures are traditionally based on the Prime Meridian, which is an imaginary line running from the North Pole through Greenwich, England to the South Pole. This angle is Longitude 0. West of the Prime Meridian is often recorded as negative Longitude and east is recorded as positiveThese vertical lines call meridians 8

Latitude and longitude
One method for describing the position of a geographic location on the earth's surface is using spherical measures of latitude and longitude. They are measures of the angles (in degrees) from the center of the earth to a point on the earth's surface.
This reference system is often referred to as a geographic coordinate system.
9

Latitude
angles are measured in a north-south direction. The equator is at an angle of 0. Often, the northern hemisphere has positive measures of latitude and the southern hemisphere has negative measures of latitude.
These latitude lines call Parallels
10

Longitude
measures angles in an east-west direction. Longitude measures are traditionally based on the Prime Meridian, which is an imaginary line running from the North Pole through Greenwich, England to the South Pole.
This angle is Longitude 0. West of the Prime Meridian is often recorded as negative Longitude and east is recorded as positive
These vertical lines call meridians
11

Latitude and longitude values are traditionally measured either in decimal
degrees or in degrees, minutes, and seconds (DMS). Latitude values are
measured relative to the Equator and range from -90° at the South Pole to +90°
at the North Pole.
Longitude values are measured relative to the Prime Meridian. They range from -
180° when traveling West to 180° when traveling East.
If the prime meridian is at Greenwich, then Australia, which is south of the equator
and east of Greenwich, has positive longitude values and negative latitude values.
(It may be helpful to equate longitude values with X and latitude values with Y. Data defined
on a geographic coordinate system is displayed as if a degree is a linear unit of measure)
E(+)
N
(-)W
S
+
- -
+
12

- Latitude
Has positive longitude values and negative latitude values
13

While a spheroid approximates the shape of the earth, a datum defines
the position of the spheroid relative to the center of the earth. A datum
provides a frame of reference for measuring locations on the surface of
the earth. It defines the origin and orientation of latitude and longitude
lines
Datums
Whenever you change the datum, or more correctly, the geographic
coordinate system, the coordinate values of your data will change
14
Learn more about Latitude and Longitude........http://en.wikipedia.org/wiki/Latitudehttp://olc.spsd.sk.ca/DE/k9mod/mapskill/mod3fl5.swf

Here are the coordinates in DMS of a control point in Redlands, California, on the North American Datum of 1983 (NAD 1983 or NAD83)………...
-117 12 57.75961 34 01 43.77884
Here's the same point on the North American Datum of 1927 (NAD 1927 or NAD27).
-117 12 54.6153934 01 43.72995
The longitude value differs by approximately three seconds, while the latitude value differs by about 0.05 seconds.
NAD 1983 and the World Geodetic System of 1984 (WGS 1984) are identical for Most applications. Here are the coordinates for the same control point based upon WGS 1984.
-117 12 57.75961 34 01 43.778837 15
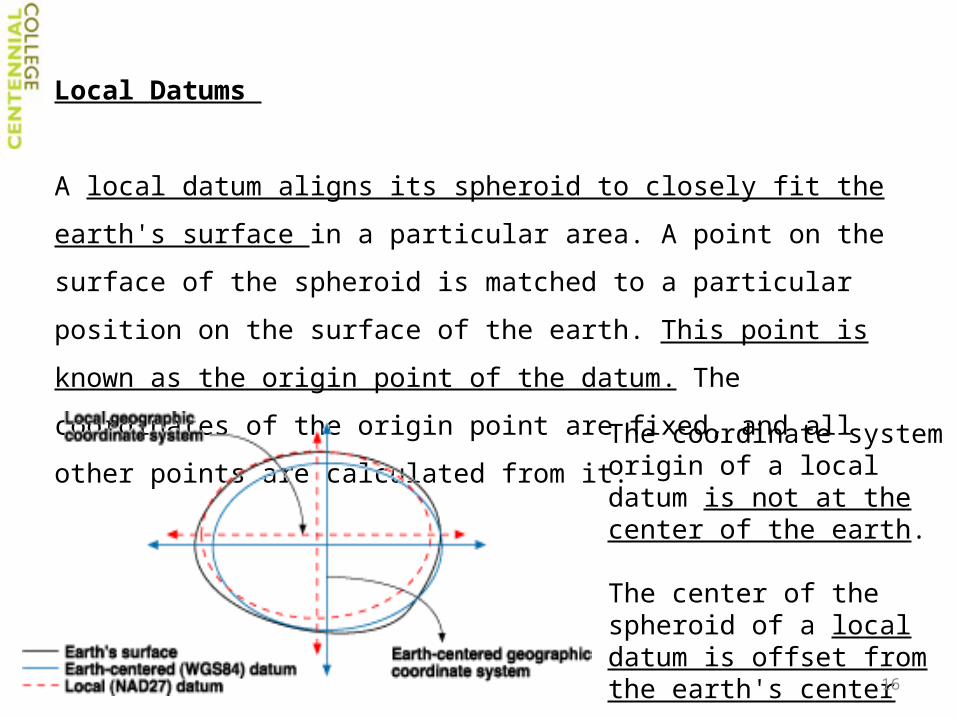
Local Datums
A local datum aligns its spheroid to closely fit the earth's surface in a
particular area. A point on the surface of the spheroid is matched to a
particular position on the surface of the earth. This point is known as the
origin point of the datum. The coordinates of the origin point are fixed,
and all other points are calculated from it.
The coordinate system origin of a local datum is not at the center of the earth.
The center of the spheroid of a local datum is offset from the earth's center
16

North American Datum 1927
NAD 1927 uses the Clarke 1866 spheroid to represent the shape of the earth. The
origin of this datum is a point on the earth referred to as Meades Ranch in Kansas.
Many NAD 1927 control points were calculated from observations taken in the
1800s. These calculations were done manually and in sections over many years.
Therefore, errors varied from station to station.
The North American Datum 1983
The North American Datum of 1983 is based on both earth and satellite observations,
using the GRS 1980 spheroid. The origin for this datum is the earth's center of mass.
This affects the surface location of all longitude–latitude values enough to cause
locations of previous control points in North America to shift, sometimes as much as 500
feet
WGS 1984 (World Geodetic System)
The GRS 1980 spheroid is almost identical to the WGS 1984 spheroid. The WGS
1984 and NAD 1983 coordinate systems are both earth centered. Because both are
so close, NAD 1983 is compatible with GPS data. The raw GPS data is actually
reported in the WGS 1984 coordinate system17

A projected coordinate system is defined on a flat, two-dimensional
surface. Unlike a geographic coordinate system, a projected coordinate
system has constant lengths, angles, and areas across the two dimensions.
A projected coordinate system is always based on a geographic coordinate
system that is based on a sphere or spheroid.
In a projected coordinate system, locations are identified by x,y coordinates
on a grid, with the origin at the center of the grid. Each position has two
values that reference it to that central location. One specifies its horizontal
position and the other its vertical position.
Projected Coordinate System
The two values are called the x-coordinate and y-coordinate. Using this
notation, the coordinates at the origin are x = 0 and y = 0.18

Projection defines..............
Whether you treat the earth as a sphere or a spheroid, you must transform its
three-dimensional surface to create a flat map sheet. This mathematical
transformation is commonly referred to as a map projection
A spheroid can't be flattened to a plane any more easily than a piece of orange
peel can be flattened—it will rip. Representing the earth's surface in two
dimensions causes distortion in the shape, area, distance, or direction of the
data
A map projection uses mathematical formulas to relate spherical coordinates on the
globe to flat, planar coordinates.
Different projections cause different types of distortions. Some projections are
designed to minimize the distortion of one or two of the data's characteristics. A
projection could maintain the area of a feature but alter its shape. 19

All (!) plane maps have a distortion.
When one property is true more than one other properties must sacrifice
3 important properties:1. Conformality • all angles are preserved• shapes are preserved (but NOT size/area)• Example: Mercator2. equivalence (equal area)• Shapes are distorted, but areas are preserved Example: Albers Equal Area, Lambert Equal Area3. Equidistance (Scale)• distance in ONE direction is preserved• compromise between angular and area deformation Example: Cassini, Equidistant Conic
Properties of Map Projections
Distances CANNOT be constant!
20

1. Planar projections ....
Planar projections project map data onto a flat surface touching the globe. A Planar
projection is also known as an Azimuthal projection or a Zenithal projection.
This type of projection is usually tangent to the globe at one point but may be
secant, also. The point of contact may be the North Pole, the South Pole, a point on
the equator, or any point in between. This point specifies the aspect and is the focus
of the projection. The focus is identified by a central longitude and a central latitude.
Possible aspects are polar, equatorial, and oblique
21

2. Conic projection ....
The most simple Conic projection is tangent to the globe along a line of latitude.
This line is called the standard parallel. The meridians are projected onto the
conical surface, meeting at the apex, or point, of the cone. Parallel lines of
latitude are projected onto the cone as rings. The cone is then "cut" along any
meridian to produce the final conic projection, which has straight converging lines
for meridians and concentric circular arcs for parallels. The meridian opposite the
cut line becomes the central meridian.
22

3. Cylindrical projections
Cylindrical projections can also have tangent or secant cases. The Mercator projection is one of the most common cylindrical projections, and the equator is usually its line of tangency.
Meridians are geometrically projected onto the cylindrical surface, and parallels are mathematically projected
23

a. Mercator Projection
Originally created to display accurate compass bearings for sea travel. An additional feature of this projection is that all local shapes are accurate and clearly defined.
Projection method Cylindrical projection. Meridians are parallel to each other and equally spaced. The lines of latitude are also parallel but become farther apart toward the poles. The poles cannot be shown.Lines of contact The equator or two latitudes symmetrical around the equator.Linear graticules All meridians and all parallels.
Popular Projections.........
24

Properties
Shape Conformal. Small shapes are well represented because this projection maintains the local angular relationships.
AreaAny straight line drawn on this projection represents an actual compass bearing. These true direction lines are rhumb lines and generally do not describe the shortest distance between points.
DistanceScale is true along the equator or along the secant latitudes.
Limitations The poles cannot be represented on the Mercator projection. All meridians can be projected, but the upper and lower limits of latitude are approximately 80° N and S. Large area distortion makes the Mercator projection unsuitable for general geographic world maps. Uses and applications -Standard sea navigation charts (direction) -Other directional uses: air travel, wind direction, ocean currents. -Conformal world maps.
The best use of this projection's conformal properties applies to regions near the equator such as Indonesia and parts of the Pacific Ocean.
25

b. Universal Transverse Mercator (UTM)Also known as Gauss–Krüger, and similar to the Mercator, except that the cylinder is longitudinal along a meridian instead of the equator. The result is a conformal projection (conformal projection, meaning that angles and small shapes on the globe project as the same angles or shapes on the map) that does not maintain true directions. The central meridian is placed in the center of the region of interest. This centering minimizes distortion of all properties in that region. This projection is best suited for north–south areas. For UTM, the lines are about 180 km from the central meridian.
ShapeConformal. Small shapes are maintained. Larger shapes are increasingly distorted away from the central meridian. AreaDistortion increases with distance from the central meridian. DirectionLocal angles are accurate everywhere.DistanceAccurate scale along the central meridian if the scale factor is 1.0. If it is less than 1.0, there are two straight lines with accurate scale equidistant from and on each side of the central meridian
26

UTM Cont......
Here, the world is divided into 60 north and south zones and each zone is six degrees wide. Each zone has a scale factor of 0.9996 and a false easting of 500,000 meters. Zones south of the equator have a false northing of 10,000,000 meters to ensure that all y values are positive. Zone 1 is at 177° W
False Easting (meters)False Northing (meters
• Valid for areas between 84E N and 80E S• Units are meters• Origin is the intercept of the equator with the central meridian of the zone• To avoid negative numbers, the central meridian is assigned a value of 500,000 m• Each zone has its own coordinate system!
“Very Important when work with large scale Map” Eg: Toronto, GTA or Any municipality”
27
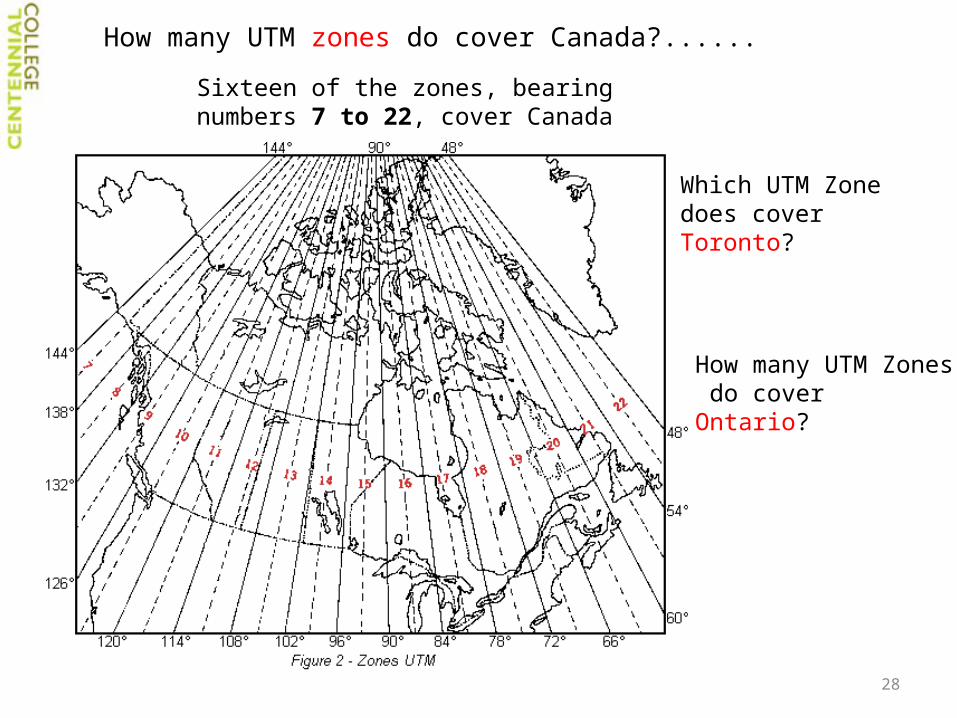
How many UTM zones do cover Canada?......
Sixteen of the zones, bearing numbers 7 to 22, cover Canada
Which UTM Zone does coverToronto?
How many UTM Zones do coverOntario?
28

Summary
A position on the Earth is referenced in the UTM system by the UTM zone, and the
easting and northing coordinate pair. The easting is the projected distance of the
position from the central meridian, while the northing is the projected distance of the
point from the equator. Eastings and northings are measured in meters. The point of
origin of each UTM zone is the intersection of the equator and the zone's central
meridian. In order to avoid dealing with negative numbers, the central meridian of
each zone is given a "false easting" value of 500,000 meters
Lattitude and Longitude43°38′33.24″N 79°23′13.7″W 43.6425667°N 79.387139°W 43.6425667; -79.387139.
17 630084m E (east), 4833438m N (north)
Full UTM Grid reference location must include;Zone, Easting and Northing.For example: The location of CN tower is
Same location by LL
29

c. Cylindrical Equal Area
Description Lambert first described this equal area projection in 1772. It has been used infrequently.
ShapeShape is true along the standard parallels of the normal aspect. Distortion is severe near the poles of the normal aspect.
AreaThere is no area distortion.
DirectionLocal angles are correct along standard parallels or standard lines. Direction is distorted elsewhere.
DistanceScale is true along the equator. Scale distortion is severe near the poles.
30

Description This conic projection uses two standard parallels to reduce some of the distortion of a projection with one standard parallel. Although neither shape nor linear scale is truly correct, the distortion of these properties is minimized in the region between the standard parallels. This projection is best suited for land masses extending in an east-to-west orientation rather than those lying north to south.
This conic projection uses two standard parallels to reduce some of the distortion of a projection with one standard parallel. Although neither shape nor linear scale is truly correct, the distortion of these properties is minimized in the region between the standard parallels. This projection is best suited for land masses extending in an east-to-west orientation rather than those lying north to south.
Albers Equal Area Conic ShapeShape along the standard parallels is accurate and minimally distorted in the region between the standard parallels and those regions just beyond. The 90° angles between meridians and parallels are preserved, but because the scale along the lines of longitude does not match the scale along the lines of latitude, the final projection is not conformal.
AreaAll areas are proportional to the same areas on the earth.
Direction Locally true along the standard parallels.
Distance Distances are most accurate in the middle latitudes. Along parallels, scale is reduced between the standard parallels and increased beyond them. Along meridians, scale follows an opposite pattern
31

This projection is one of the best for middle latitudes. It is similar to the Albers Conic Equal Area projection except that Lambert Conformal Conic portrays shape more accurately than area. The State Plane Coordinate System uses this projection for all zones that have a greater east–west extent
ShapeAll graticular intersections are 90°. Small shapes are maintained.
AreaMinimal distortion near the standard parallels. Areal scale is reduced between standard parallels and increased beyond them.
DirectionLocal angles are accurate throughout because of conformality.
DistanceCorrect scale along the standard parallels. The scale is reduced between the parallels and increased beyond them.
Use For National Atlas of Canada & US
Lambert Conformal Conic
32
Georeferencing: Assigning map coordinates and spatial location
All the elements in a map layer have a specific geographic location and extent that enables them to be located on or near the earth's surface. The ability to accurately describe geographic locations in both mapping and GIS or the process of scaling, rotating, translating and de-skewing the image to match a particular size and position call
georeferencing.
Describing the correct location and shape of features requires a framework for defining real-world locations. A geographic coordinate system is used to assign geographic locations to objects. A global coordinate system of latitude-longitude is one such framework. Another is a planar or Cartesian coordinate system derived from the global framework.
Further more ........
Aligning geographic data to a known coordinate system so it can be viewed, queried, and analyzed with other geographic data. Georeferencing may involve shifting, rotating, scaling, skewing, and in some cases warping, rubber sheeting, or orthorectifying the data
33
When you georeference your raster dataset, you define its location
using map coordinates and assign the coordinate system of the data
frame. Georeferencing raster data allows it to be viewed, queried, and
analyzed with other geographic data
Georeferencing a raster dataset
Raster data is commonly obtained by scanning maps or collecting aerial
photographs and satellite images. Scanned map datasets don't normally contain
spatial reference information (either embedded in the file or as a separate file).
With aerial photography and satellite imagery, sometimes the location information
delivered with them is inadequate and the data does not align properly with other
data you have. Thus, to use some raster datasets in conjunction with your
other spatial data, you may need to align, or georeference, to a map
coordinate system.
34

Transforming the raster
1. Polynomial
The polynomial transformation uses a polynomial built on control points and a least squares fitting (LSF) algorithm. It is optimized for global accuracy but does not guarantee local accuracy
2. Spline
The spline transformation is a true rubber sheeting method and optimizes for local accuracy but not global accuracy. It is based on a spline function
3. Adjust transformation
The adjust transformation optimizes for both global LSF and local accuracy. It is built on an algorithm that combines a polynomial transformation and triangulated irregular network (TIN) interpolation techniques
Adjust requires a minimum of three control points.
There are three raster Transforming methods
35