Embed Size (px)
Citation preview
Census Update
Making Connections! ALMIS Database Seminar
August 17, 2005
Presented by: Pamela SchenkerFlorida Agency for Workforce Innovation
Labor Market Statistics
2
Census DataCensus Data
What surveys does the Census administer?
What Census data are used in ALMIS?How to access these data
What’s new at Census?
How does it impact ALMIS?
Ov
erv
iew
3
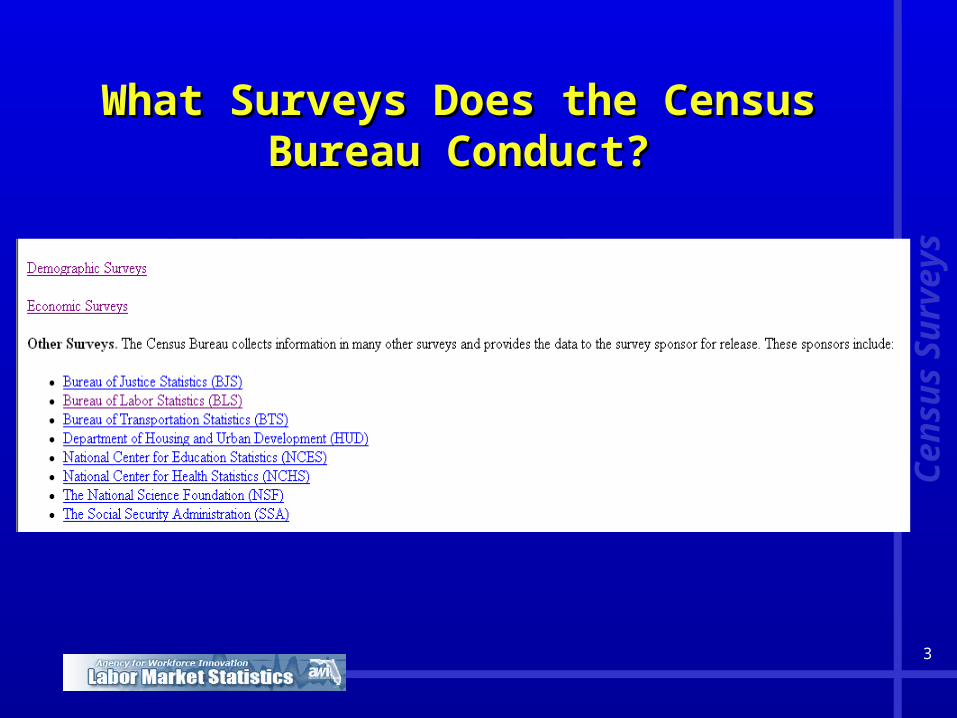
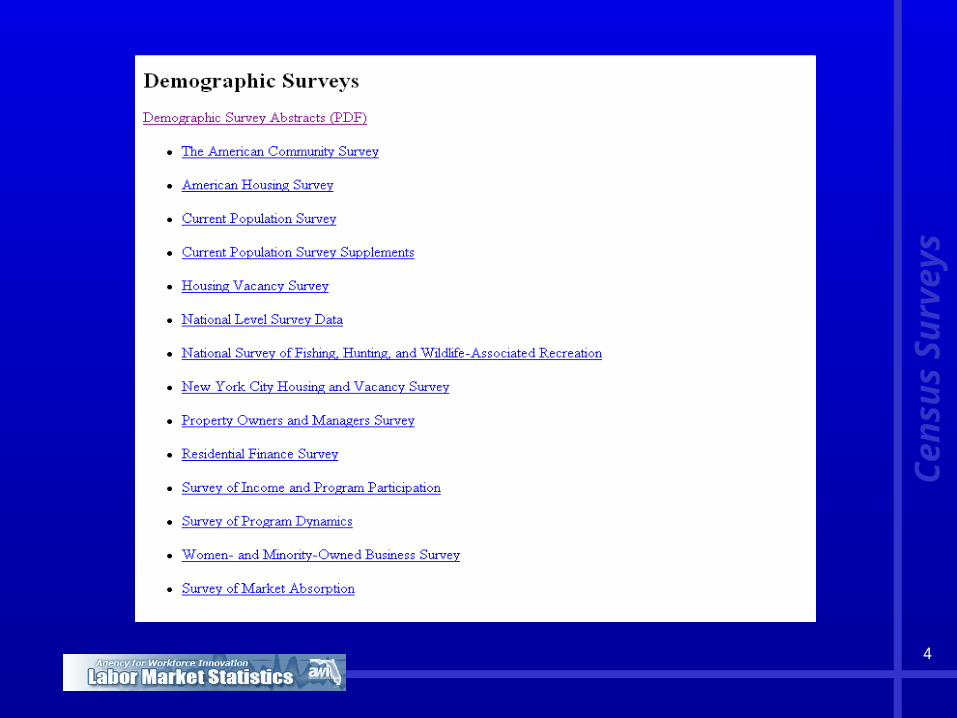
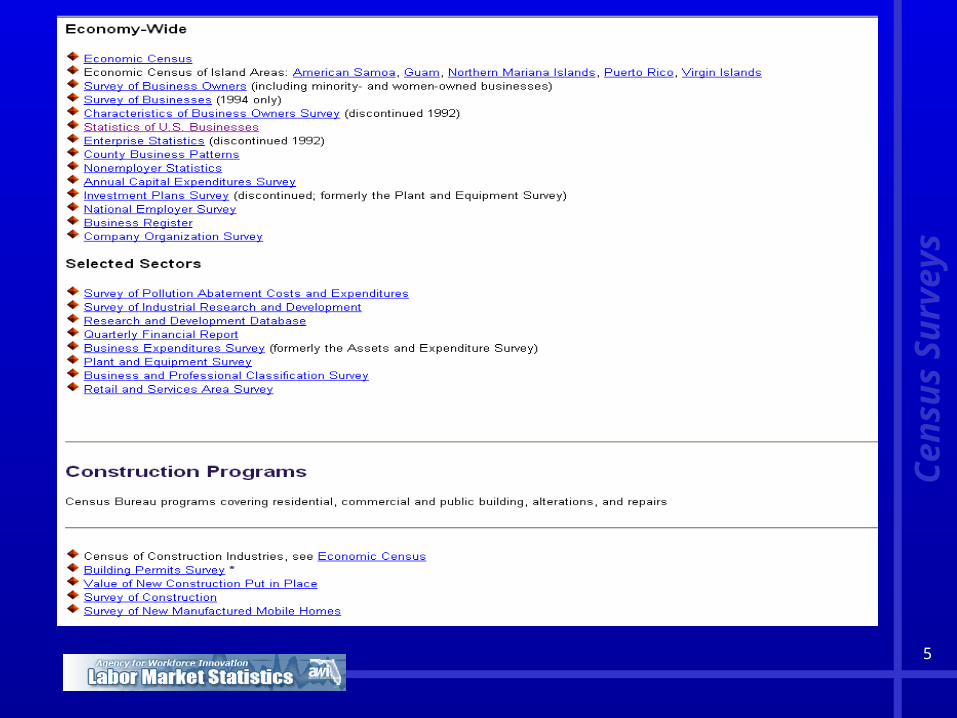
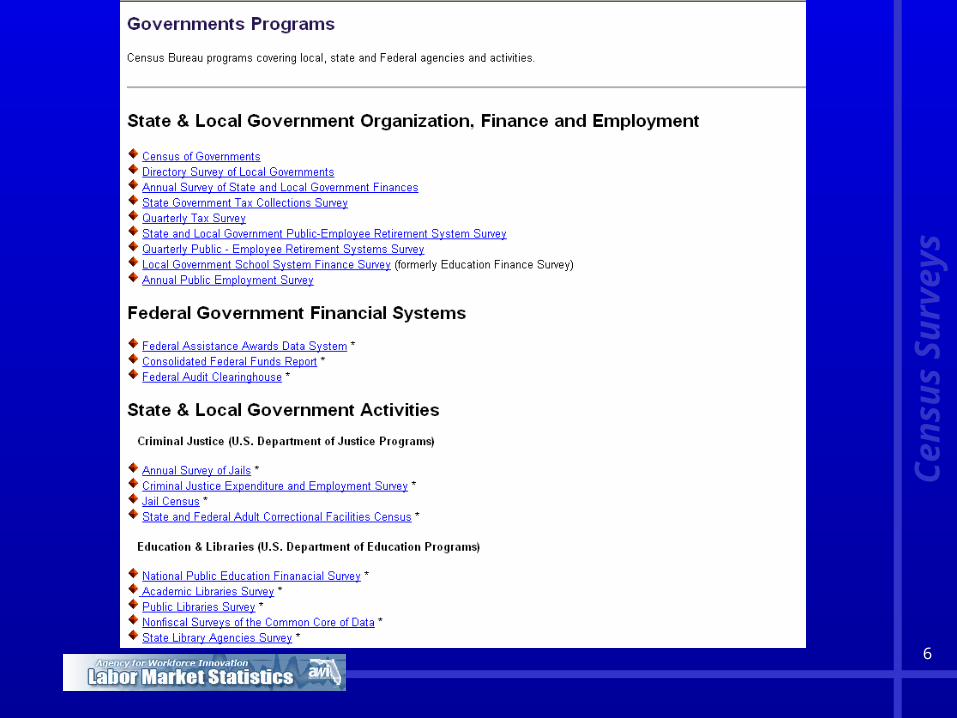
What Surveys Does the Census What Surveys Does the Census Bureau Conduct?Bureau Conduct?
Ce
ns
us
Su
rve
ys
4
Ce
ns
us
Su
rve
ys
5
Ce
ns
us
Su
rve
ys
6
Ce
ns
us
Su
rve
ys
7
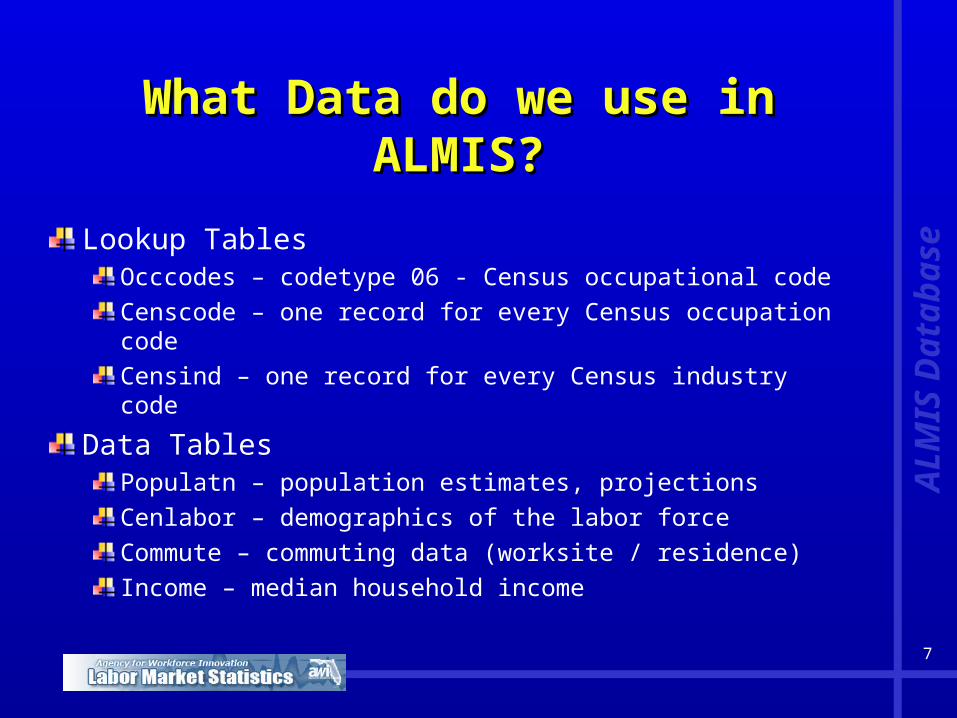
What Data do we use in ALMIS?What Data do we use in ALMIS?
Lookup TablesOcccodes – codetype 06 - Census occupational code
Censcode – one record for every Census occupation code
Censind – one record for every Census industry code
Data TablesPopulatn – population estimates, projections
Cenlabor – demographics of the labor force
Commute – commuting data (worksite / residence)
Income – median household income
AL
MIS
Da
tab
as
e
8
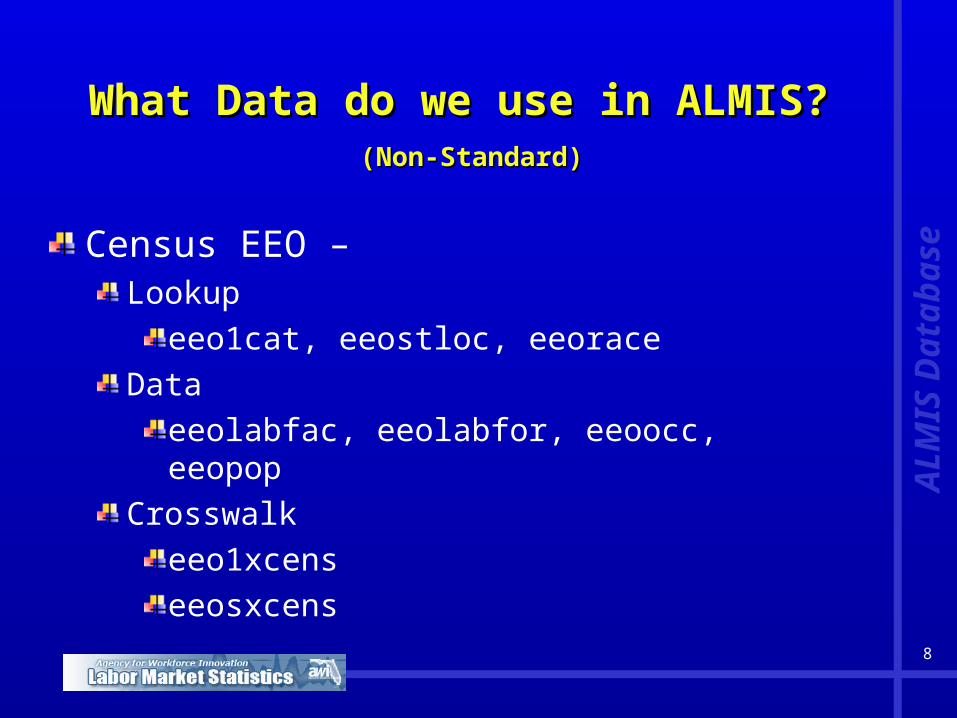
What Data do we use in ALMIS?What Data do we use in ALMIS? (Non-Standard)(Non-Standard)
Census EEO – Lookup
eeo1cat, eeostloc, eeorace
Data
eeolabfac, eeolabfor, eeoocc, eeopop
Crosswalk
eeo1xcens
eeosxcens
AL
MIS
Da
tab
as
e
9
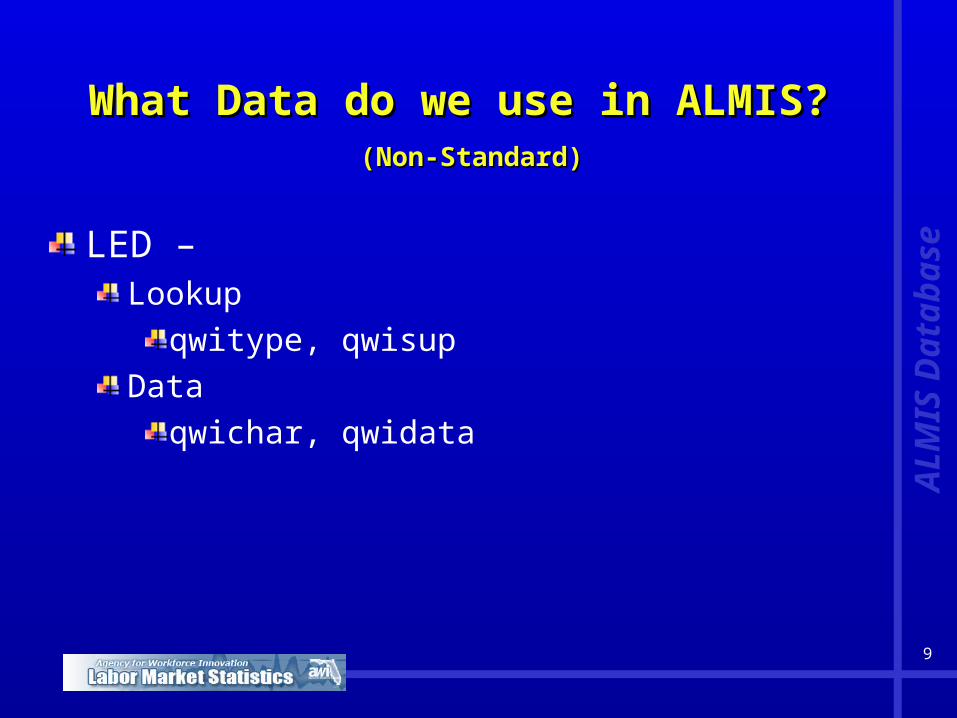
What Data do we use in ALMIS?What Data do we use in ALMIS? (Non-Standard)(Non-Standard)
LED – Lookup
qwitype, qwisup
Data
qwichar, qwidata
AL
MIS
Da
tab
as
e
10
Where Can I find the Data?Where Can I find the Data?
Summary File 3Results from the 2000 Census Long Form
Sample-Based
Population, Income, Labor Force, and Commuting Data
www.census.gov
CDs
National Crosswalk Center
AL
MIS
Da
tab
as
e
11
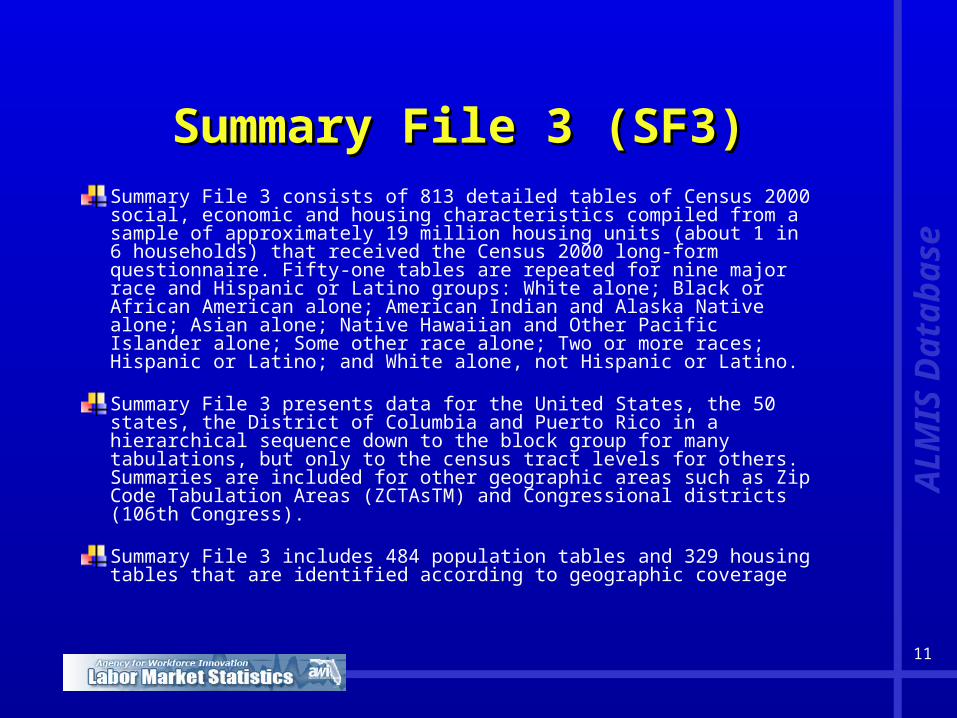
Summary File 3 (SF3)Summary File 3 (SF3)Summary File 3 consists of 813 detailed tables of Census 2000 social, economic and housing characteristics compiled from a sample of approximately 19 million housing units (about 1 in 6 households) that received the Census 2000 long-form questionnaire. Fifty-one tables are repeated for nine major race and Hispanic or Latino groups: White alone; Black or African American alone; American Indian and Alaska Native alone; Asian alone; Native Hawaiian and Other Pacific Islander alone; Some other race alone; Two or more races; Hispanic or Latino; and White alone, not Hispanic or Latino.
Summary File 3 presents data for the United States, the 50 states, the District of Columbia and Puerto Rico in a hierarchical sequence down to the block group for many tabulations, but only to the census tract levels for others. Summaries are included for other geographic areas such as Zip Code Tabulation Areas (ZCTAsTM) and Congressional districts (106th Congress).
Summary File 3 includes 484 population tables and 329 housing tables that are identified according to geographic coverage
AL
MIS
Da
tab
as
e
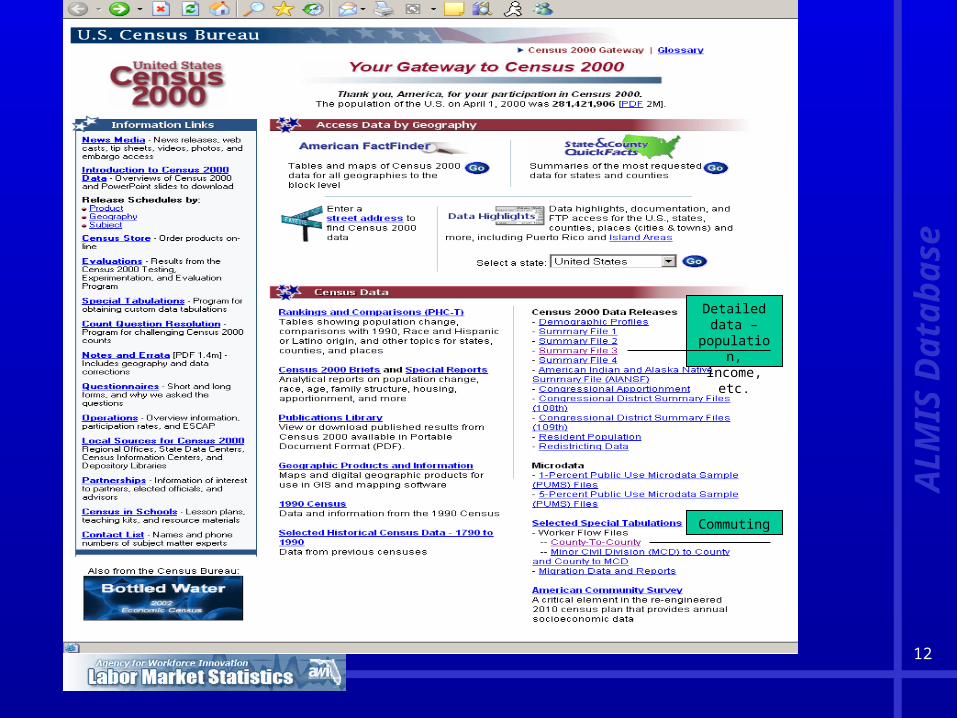
12
Detailed data – population, income, etc.
Commuting
AL
MIS
Da
tab
as
e
13
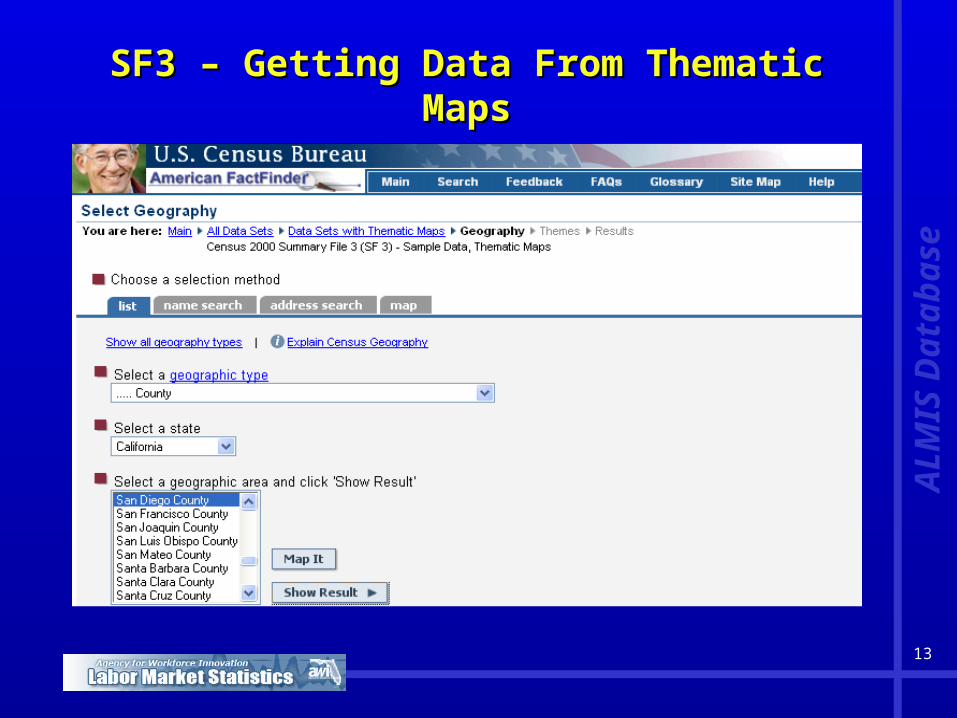
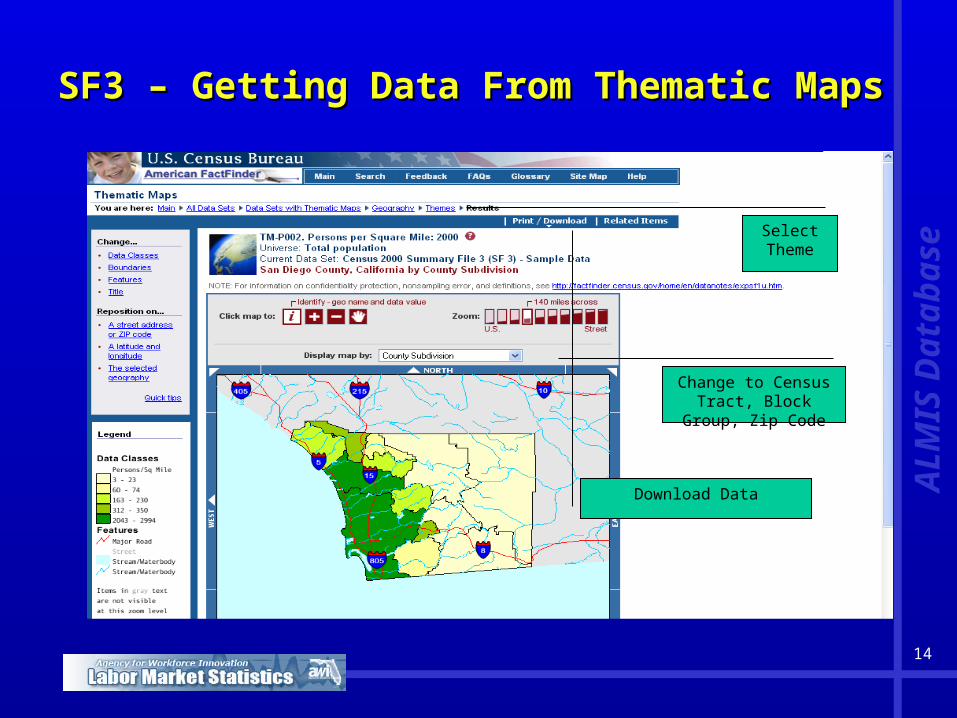
SF3 – Getting Data From Thematic MapsSF3 – Getting Data From Thematic Maps
AL
MIS
Da
tab
as
e
14
SF3 – Getting Data From Thematic MapsSF3 – Getting Data From Thematic Maps
Change to Census Tract, Block Group, Zip Code
Select Theme
Download Data AL
MIS
Da
tab
as
e
15
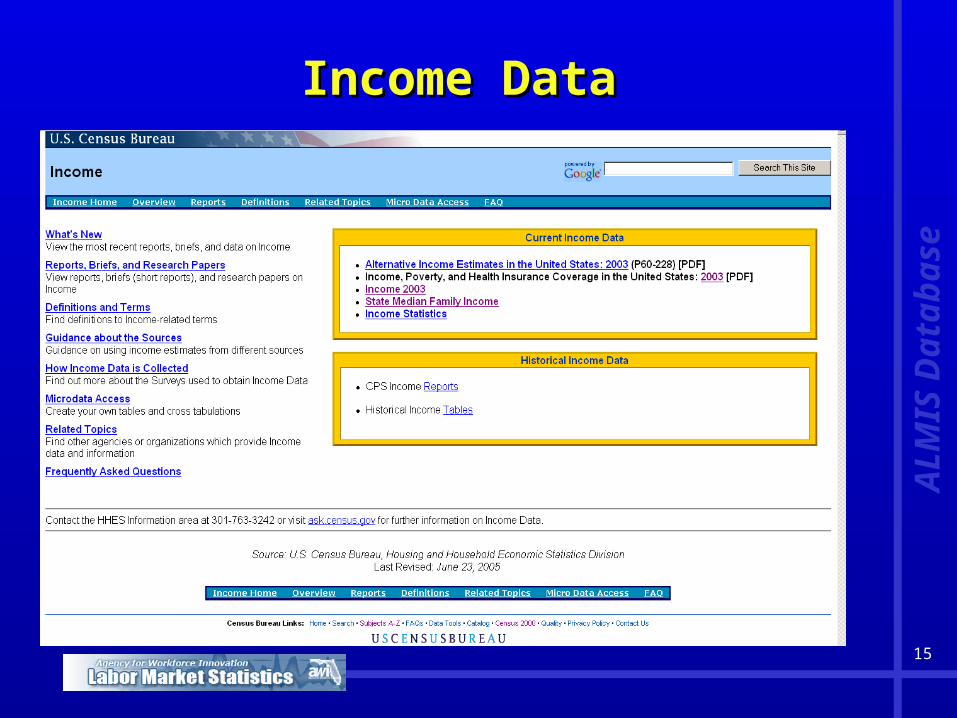
Income DataIncome Data
AL
MIS
Da
tab
as
e
16
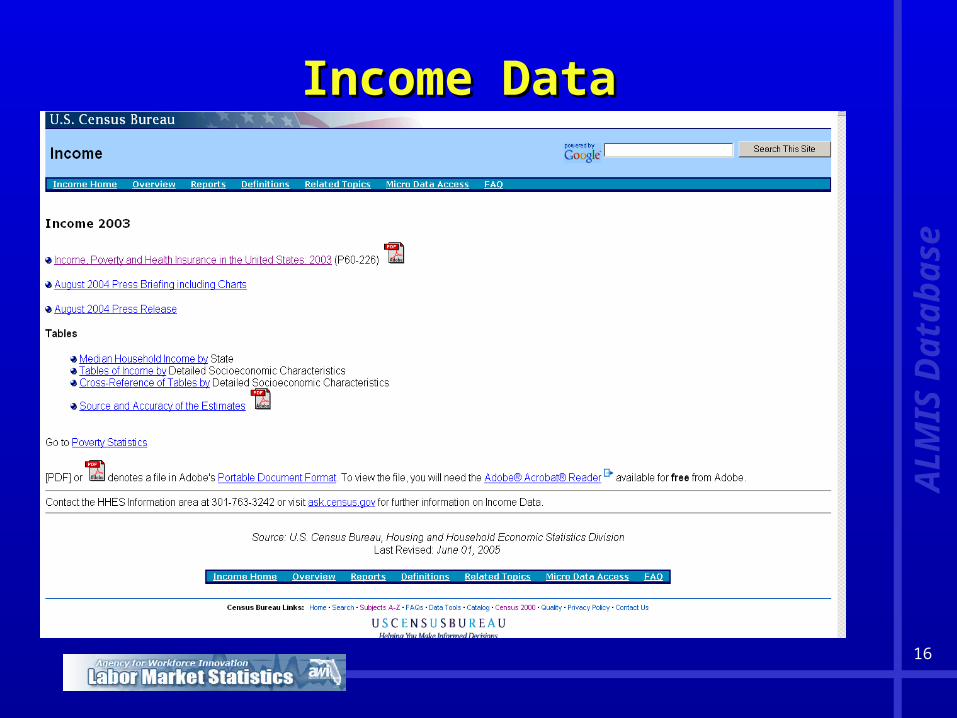
Income DataIncome Data
AL
MIS
Da
tab
as
e
17
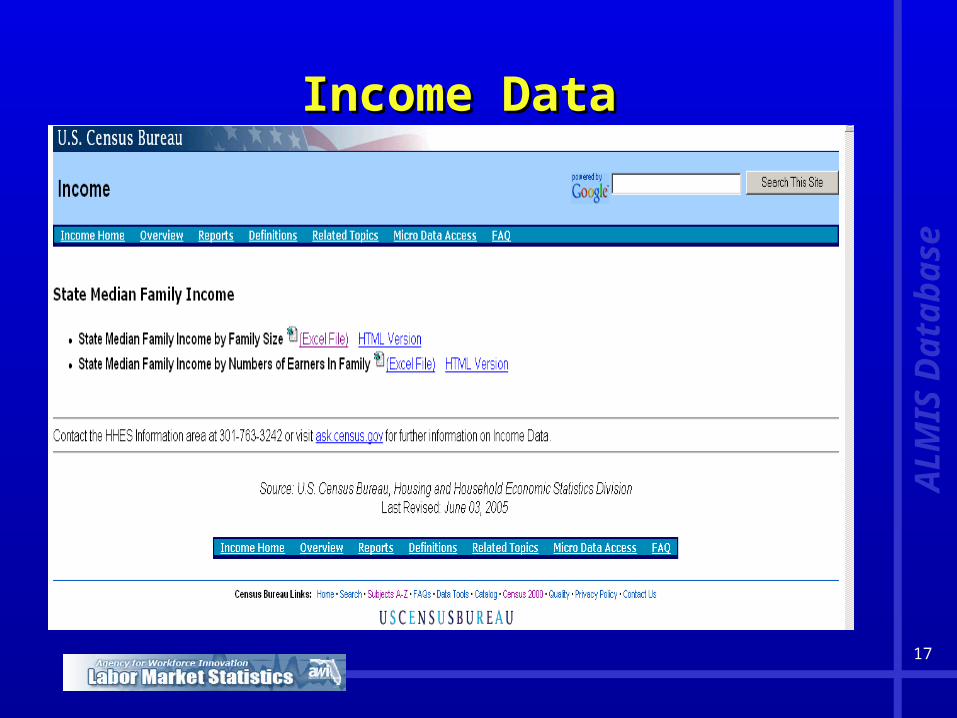
Income DataIncome Data
AL
MIS
Da
tab
as
e
18
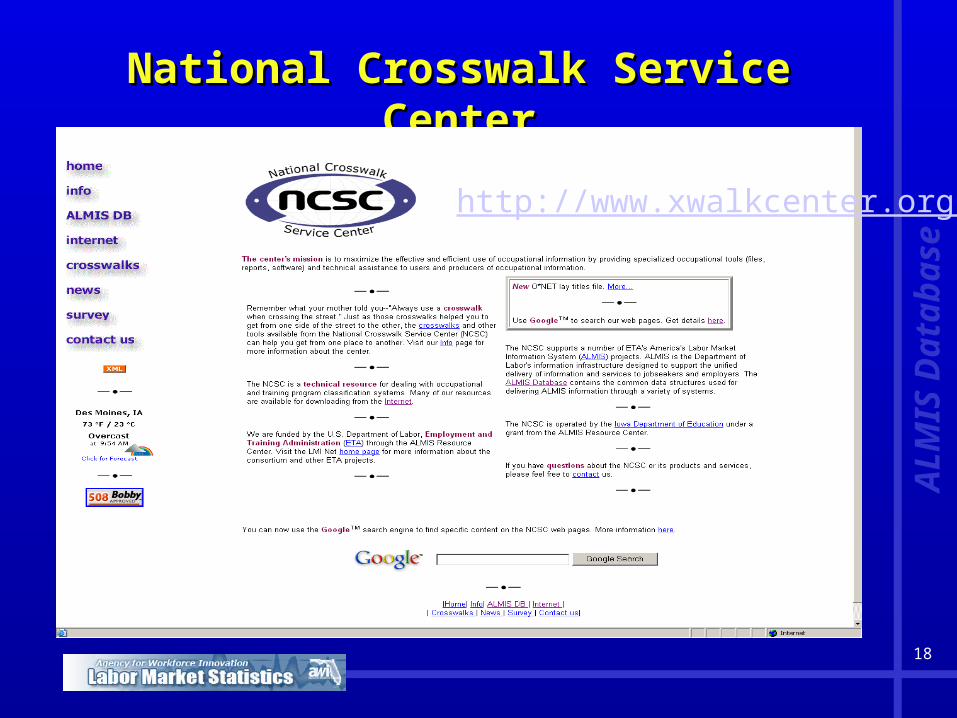
National Crosswalk Service CenterNational Crosswalk Service Center
http://www.xwalkcenter.org/
AL
MIS
Da
tab
as
e
19
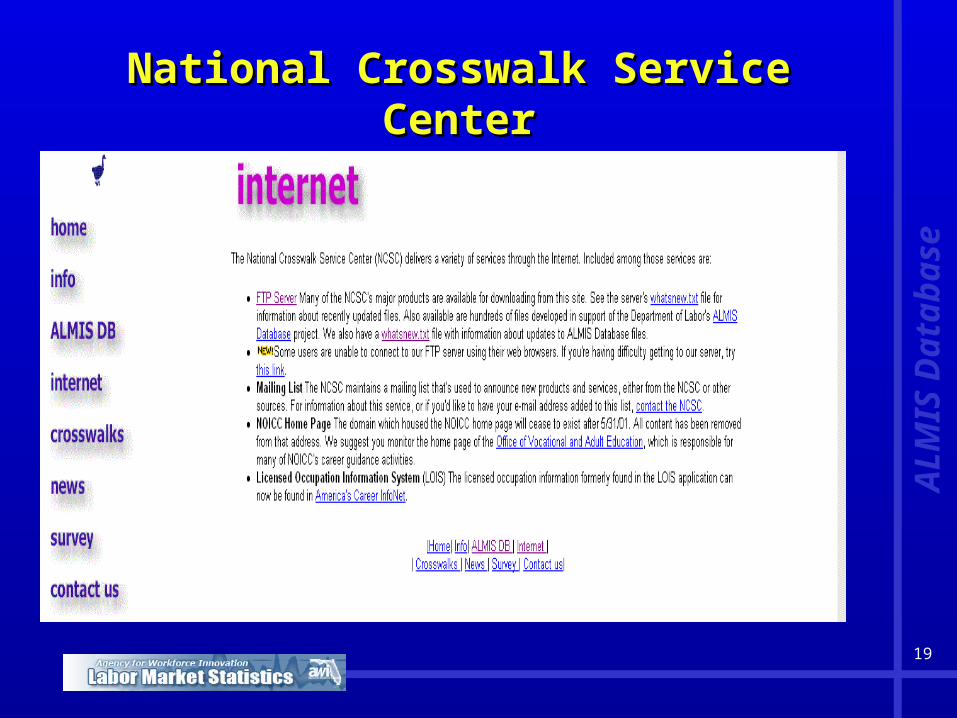
National Crosswalk Service CenterNational Crosswalk Service Center
AL
MIS
Da
tab
as
e
20
EEO DataEEO DataCensus Long Form
Census 2000 Special EEO Tabulation
24 EEO Data Sets
Files 1 through 7 are residence tabulations
Files 8 through 19 are workflow tabulations
From a central worksite (county or place of 50,000 or more population)
Show the flow to that worksite of workers from up to nine individual counties, places, or balance of counties
Files 20 through 24 are worksite tabulations
Download from: (SAS or ASCII)
http://www.eeoc.gov/stats/census/availability.html Eq
ua
l Op
po
rtu
nit
y E
mp
loy
me
nt
21
LED DataLED Data
Local Employment Dynamics (LED) or Longitudinal Employer-Household Dynamics (LEHD)
Quarterly Workforce Indicators
8 QWIs: http://lehd.dsd.census.gov/led/datatools/qwiapp.html
Total Employment
Net Job Flows
Job Creation
New Hires
Separations
Turnover
Avg Monthly Earnings
Avg New Hire Earnings
Lo
ca
l Em
plo
ym
en
t D
yn
am
ics

22
LED DataLED Data
Local Employment Dynamics (LED) or Longitudinal Employer-Household Dynamics (LEHD)
Quarterly Workforce Indicators
8 QWIs: http://lehd.dsd.census.gov/led/datatools/qwiapp.html
Total Employment
Net Job Flows
Job Creation
New Hires
Separations
Turnover
Avg Monthly Earnings
Avg New Hire Earnings
Lo
ca
l Em
plo
ym
en
t D
yn
am
ics
23
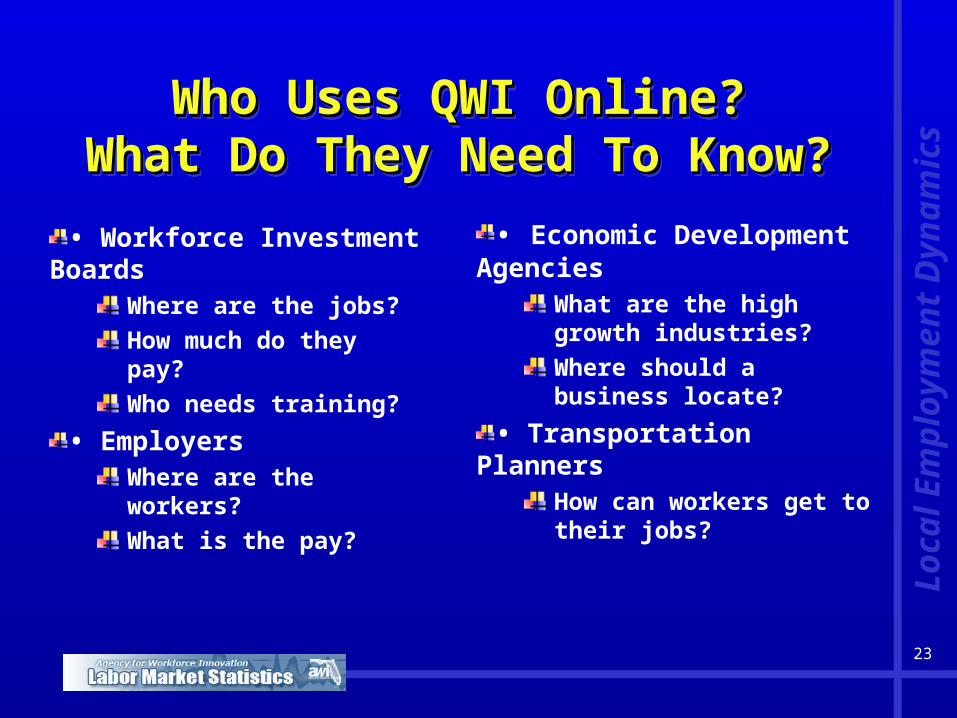
Who Uses QWI Online?Who Uses QWI Online?What Do They Need To Know?What Do They Need To Know?
Who Uses QWI Online?Who Uses QWI Online?What Do They Need To Know?What Do They Need To Know?
• Workforce Investment Boards
Where are the jobs?
How much do they pay?
Who needs training?
• EmployersWhere are the workers?
What is the pay?
• Economic Development Agencies
What are the high growth industries?
Where should a business locate?
• Transportation PlannersHow can workers get to their jobs?
Lo
ca
l Em
plo
ym
en
t D
yn
am
ics
24
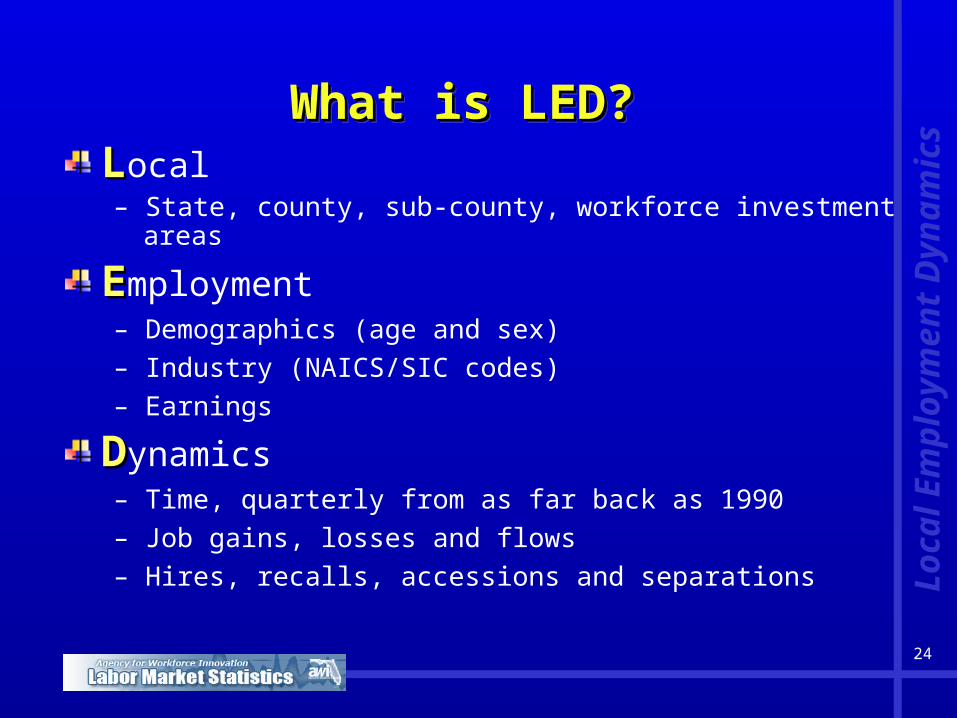
What is LED?What is LED?What is LED?What is LED?LLocal– State, county, sub-county, workforce investment areas
EEmployment– Demographics (age and sex)
– Industry (NAICS/SIC codes)
– Earnings
DDynamics– Time, quarterly from as far back as 1990
– Job gains, losses and flows
– Hires, recalls, accessions and separations
Lo
ca
l Em
plo
ym
en
t D
yn
am
ics
25
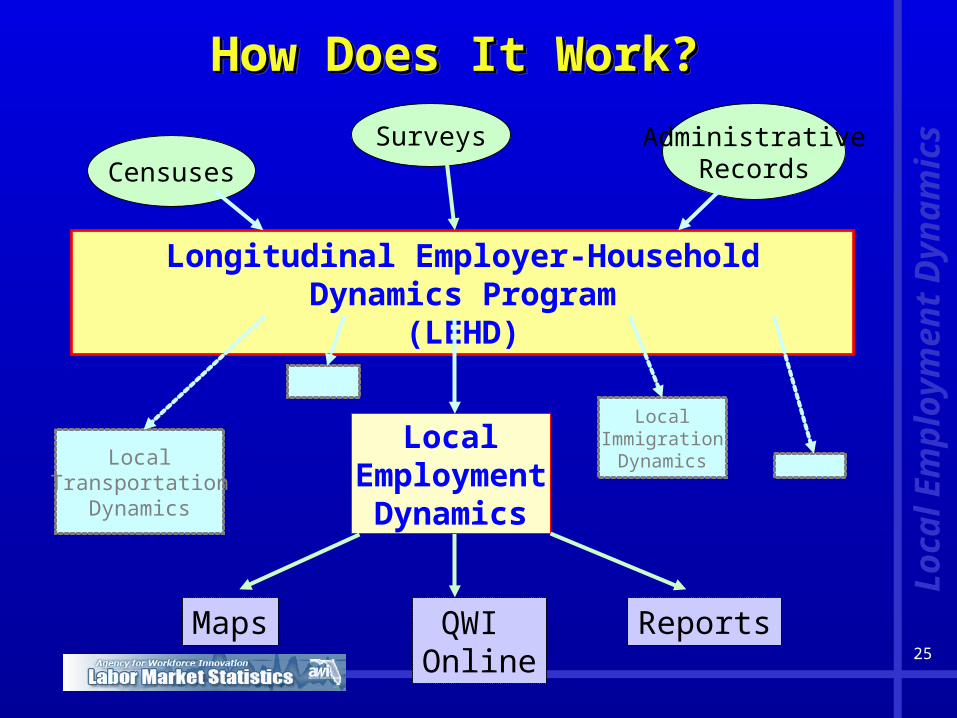
Longitudinal Employer-Household Dynamics Program(LEHD)
Surveys AdministrativeRecordsCensuses
LocalEmployment
Dynamics
LocalTransportation
Dynamics
LocalImmigrationDynamics
Maps QWI Online
Reports
How Does It Work?How Does It Work?How Does It Work?How Does It Work?
Lo
ca
l Em
plo
ym
en
t D
yn
am
ics
26
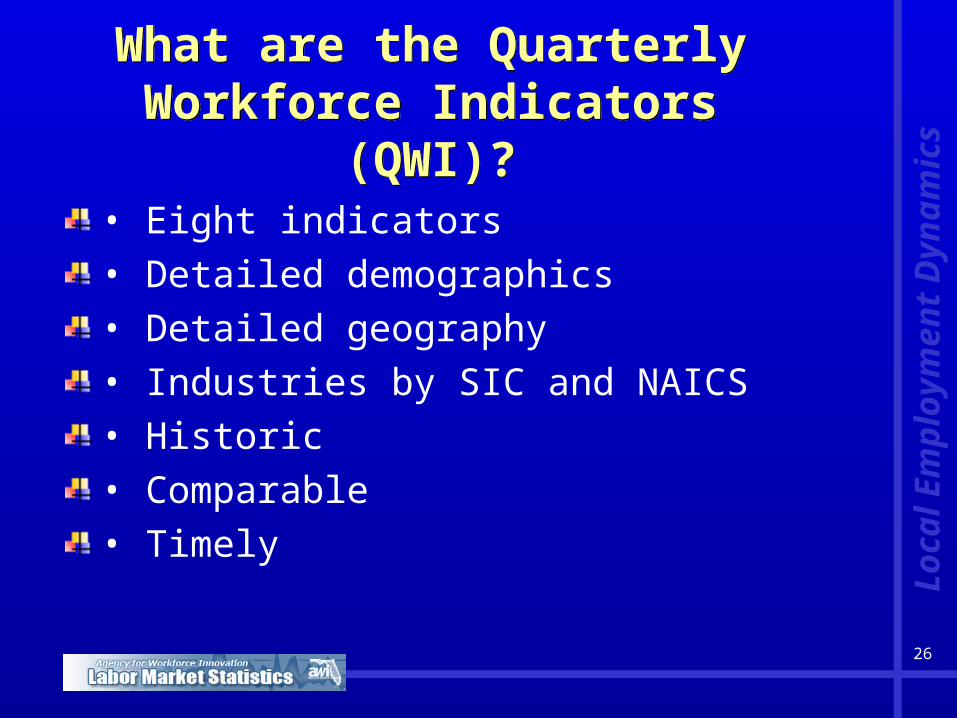
What are the Quarterly Workforce Indicators (QWI)?
What are the Quarterly Workforce Indicators (QWI)?
• Eight indicators
• Detailed demographics
• Detailed geography
• Industries by SIC and NAICS
• Historic
• Comparable
• Timely
Lo
ca
l Em
plo
ym
en
t D
yn
am
ics
27
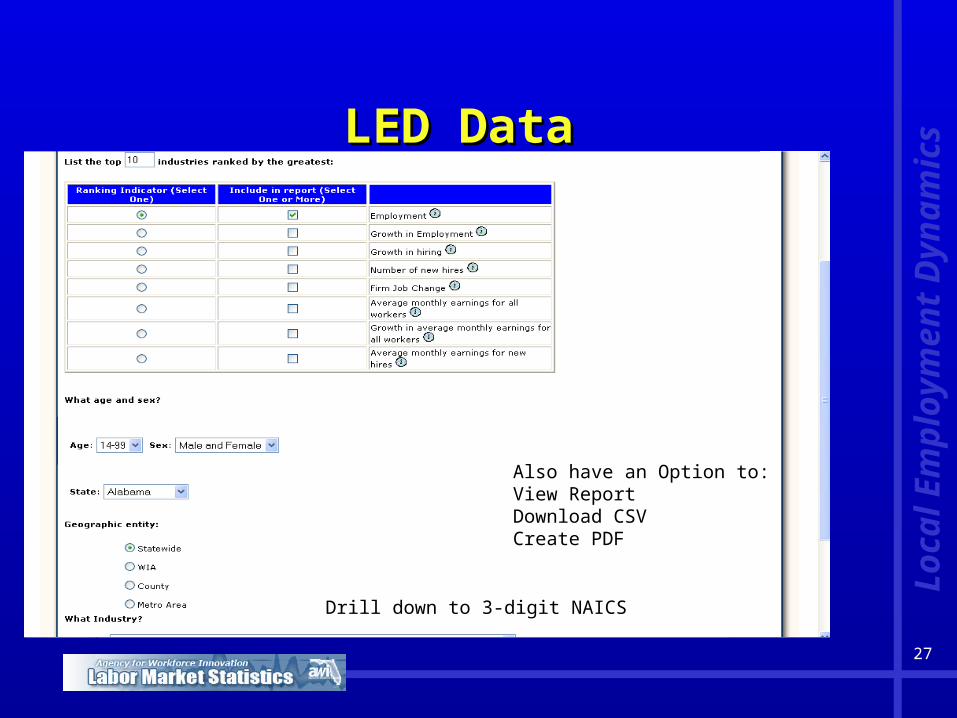
LED DataLED Data
Drill down to 3-digit NAICS
Also have an Option to:View ReportDownload CSVCreate PDF
Lo
ca
l Em
plo
ym
en
t D
yn
am
ics
28
What Changes are Coming?What Changes are Coming?
American Community Survey (ACS)Census Long Form Data – every year?
Demographics
Commuting
EEO
Am
eri
ca
n C
om
mu
nit
y S
urv
ey
29
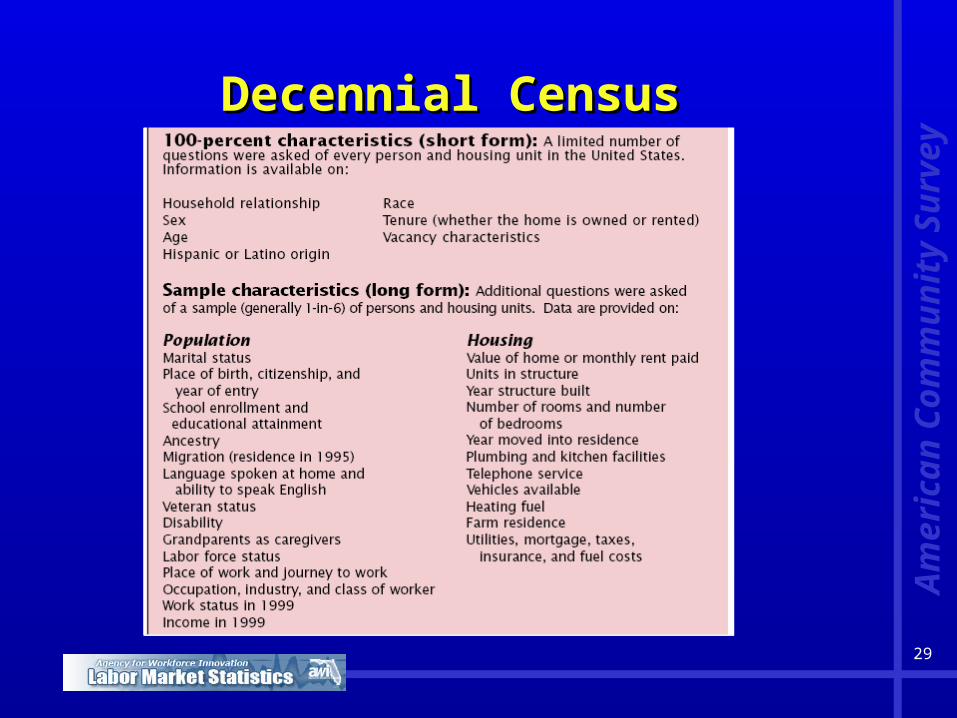
Decennial CensusDecennial Census
Am
eri
ca
n C
om
mu
nit
y S
urv
ey
30
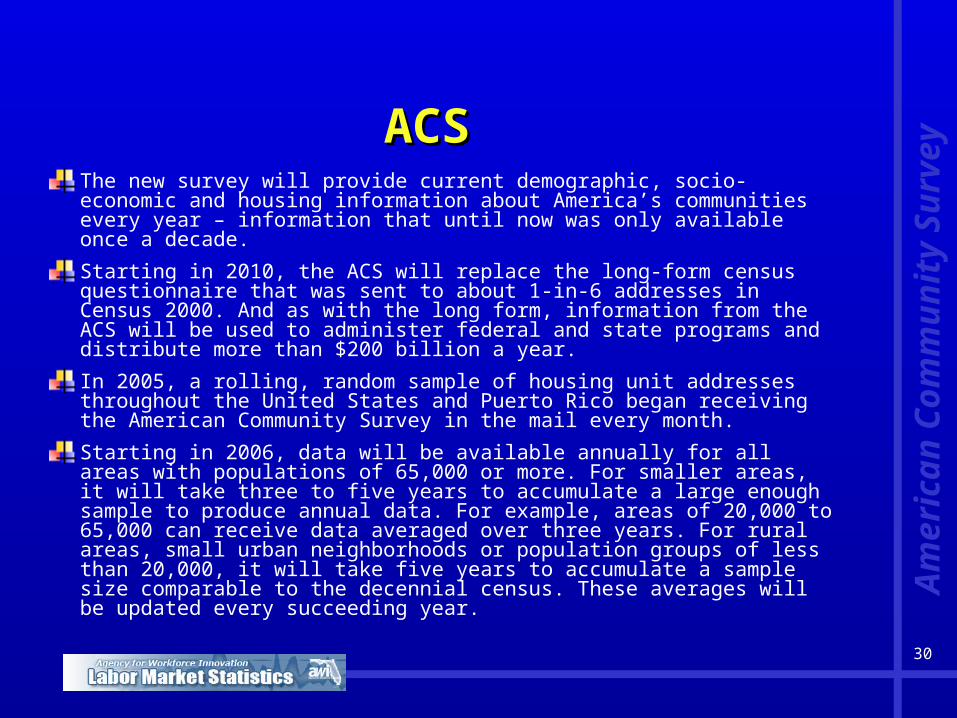
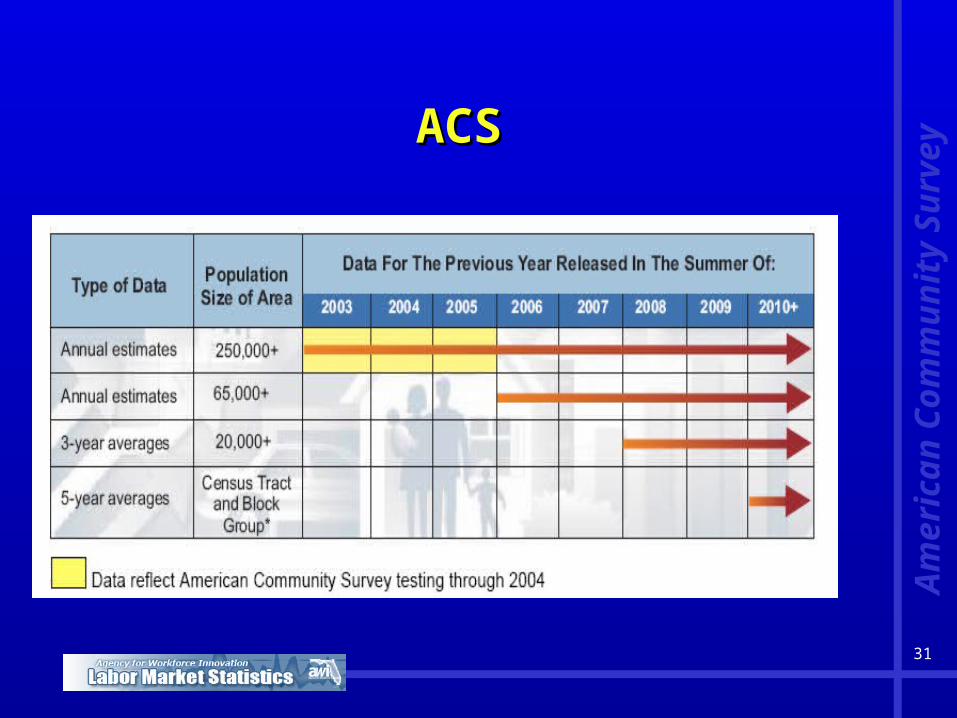
ACSACSThe new survey will provide current demographic, socio-economic and housing information about America’s communities every year – information that until now was only available once a decade.
Starting in 2010, the ACS will replace the long-form census questionnaire that was sent to about 1-in-6 addresses in Census 2000. And as with the long form, information from the ACS will be used to administer federal and state programs and distribute more than $200 billion a year.
In 2005, a rolling, random sample of housing unit addresses throughout the United States and Puerto Rico began receiving the American Community Survey in the mail every month.
Starting in 2006, data will be available annually for all areas with populations of 65,000 or more. For smaller areas, it will take three to five years to accumulate a large enough sample to produce annual data. For example, areas of 20,000 to 65,000 can receive data averaged over three years. For rural areas, small urban neighborhoods or population groups of less than 20,000, it will take five years to accumulate a sample size comparable to the decennial census. These averages will be updated every succeeding year. A
me
ric
an
Co
mm
un
ity
Su
rve
y
31
ACSACS
Am
eri
ca
n C
om
mu
nit
y S
urv
ey
32
What’s Going on Now?What’s Going on Now?
Preparation for the 2010 Census
To prepare for the 2010 Census, the Census Bureau will conduct a series of tests.
In late 2005, they will conduct the National Census Test (NCT). 2
01
0 C
en
su
s
33
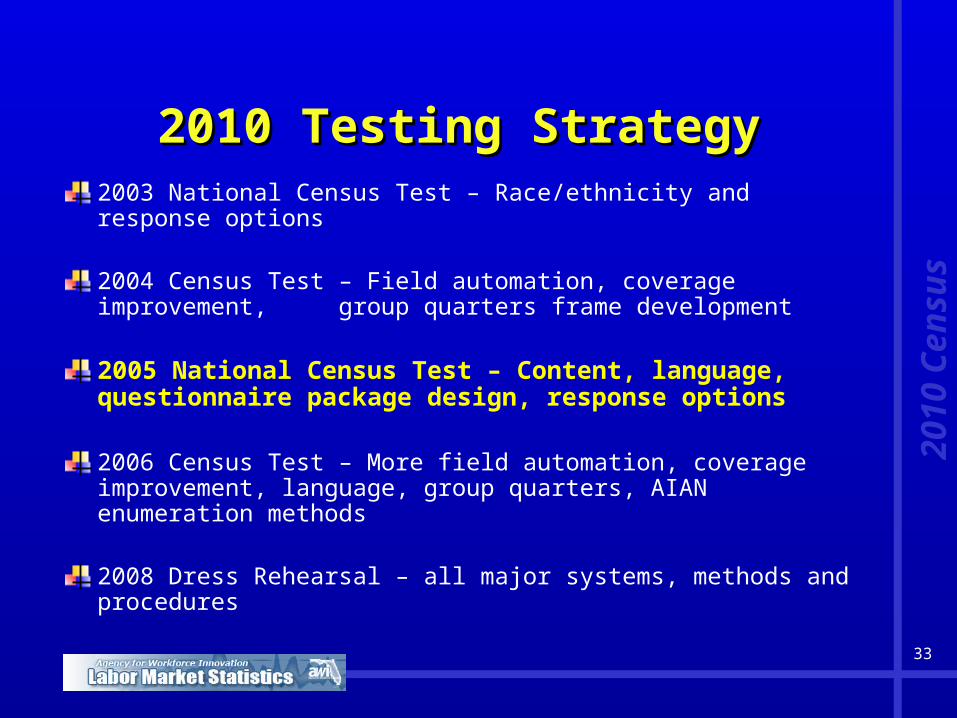
2010 Testing Strategy2010 Testing Strategy2003 National Census Test – Race/ethnicity and response options
2004 Census Test – Field automation, coverage improvement, group quarters frame development
2005 National Census Test – Content, language, questionnaire package design, response options
2006 Census Test – More field automation, coverage improvement, language, group quarters, AIAN enumeration methods
2008 Dress Rehearsal – all major systems, methods and procedures
20
10
Ce
ns
us
34
2005 National Census Test2005 National Census Test
Objectives
Improve reporting completeness and accuracy
Improve coverage accuracy
Enhance feasibility for targeted mailing of replacement questionnaires
Improve self response while maintaining data quality through the use of bilingual questionnaires
Reduce respondent and data capture errors
20
10
Ce
ns
us
35
Scope/MethodologyScope/Methodology
Mailout/MailbackApproximately 420,000 households
Approximately 20 Questionnaire panels
Evaluation Followup Data Collection
20
10
Ce
ns
us
36
MethodologyMethodology
Use of variations of proposed questionnaire content
Use of various methods to increase response, including:
Replacement questionnaire methods
Follow-ups
Use of the Internet as an optional mode for completing a census form
20
10
Ce
ns
us
37
MethodologyMethodology
Short form only
Each housing unit will receive:An Advance Letter
A paper questionnaire, with a cover letter
A postcard (Reminder/Thank You)
20
10
Ce
ns
us
38
Questionnaires/PanelsQuestionnaires/Panels
The 2005 NCT consists of a data collection strategy involving a multi-part control panel and 19 experimental panels.
Each panel has been designed to test more than one experimental objective, so the number of treatments is not the same as the number of panels.
20
10
Ce
ns
us
39
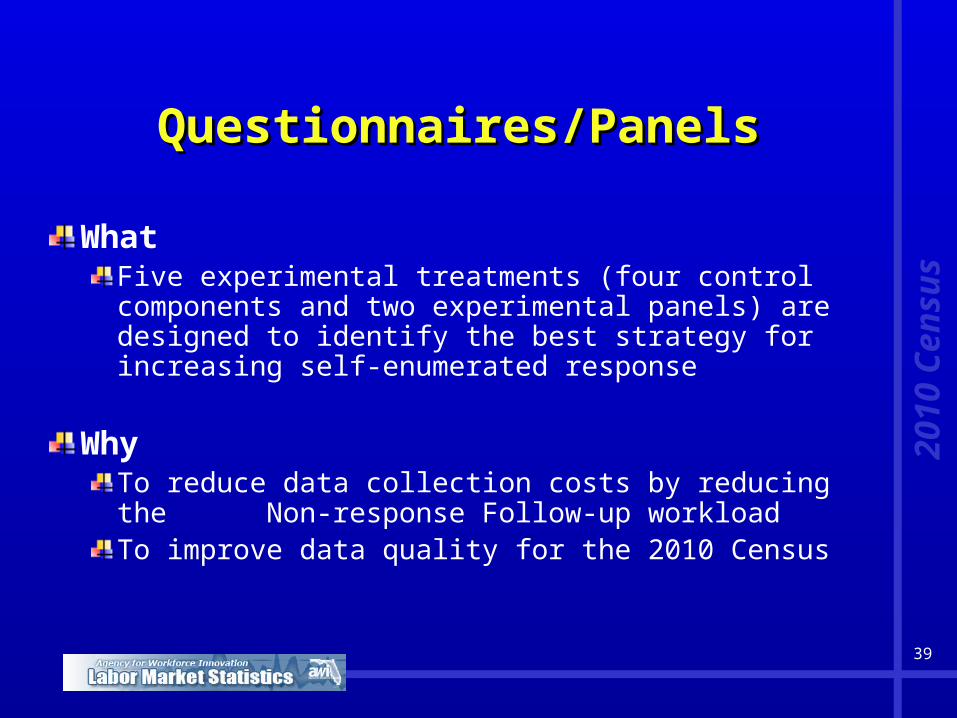
Questionnaires/PanelsQuestionnaires/Panels
WhatFive experimental treatments (four control components and two experimental panels) are designed to identify the best strategy for increasing self-enumerated response
WhyTo reduce data collection costs by reducing the Non-response Follow-up workloadTo improve data quality for the 2010 Census
20
10
Ce
ns
us
40
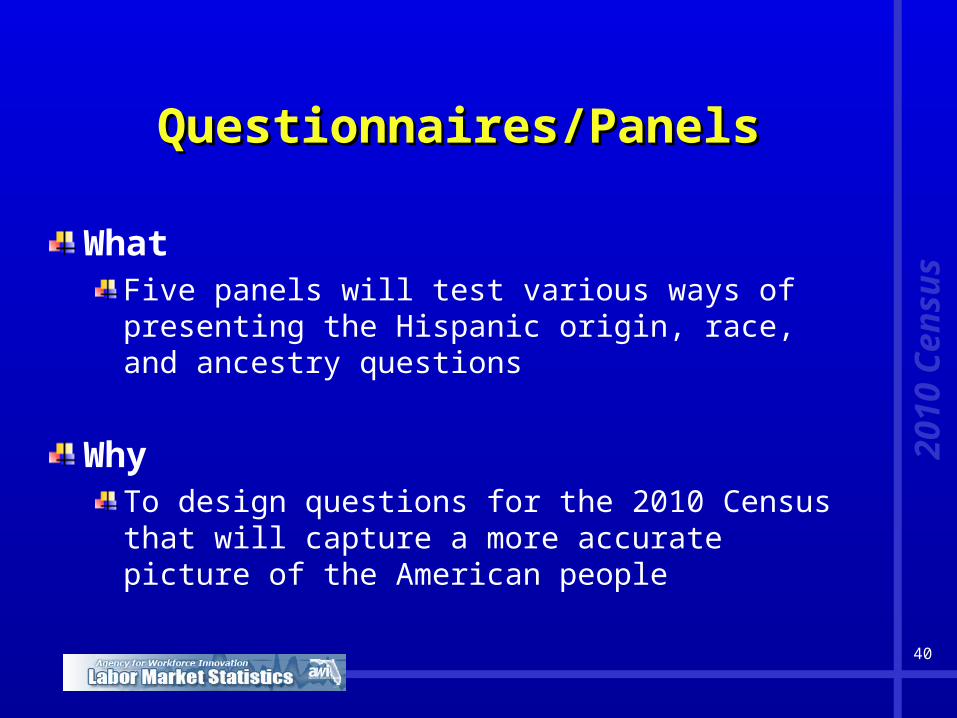
Questionnaires/PanelsQuestionnaires/Panels
WhatFive panels will test various ways of presenting the Hispanic origin, race, and ancestry questions
WhyTo design questions for the 2010 Census that will capture a more accurate picture of the American people
20
10
Ce
ns
us
41
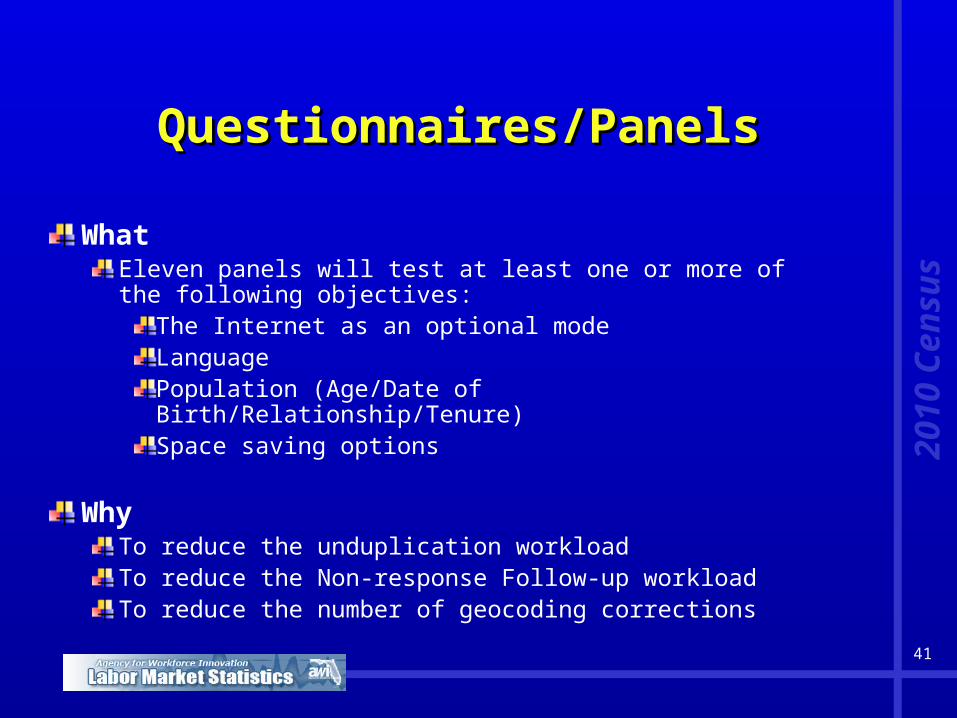
Questionnaires/PanelsQuestionnaires/Panels
WhatEleven panels will test at least one or more of the following objectives:
The Internet as an optional modeLanguagePopulation (Age/Date of Birth/Relationship/Tenure)Space saving options
WhyTo reduce the unduplication workloadTo reduce the Non-response Follow-up workloadTo reduce the number of geocoding corrections
20
10
Ce
ns
us
42
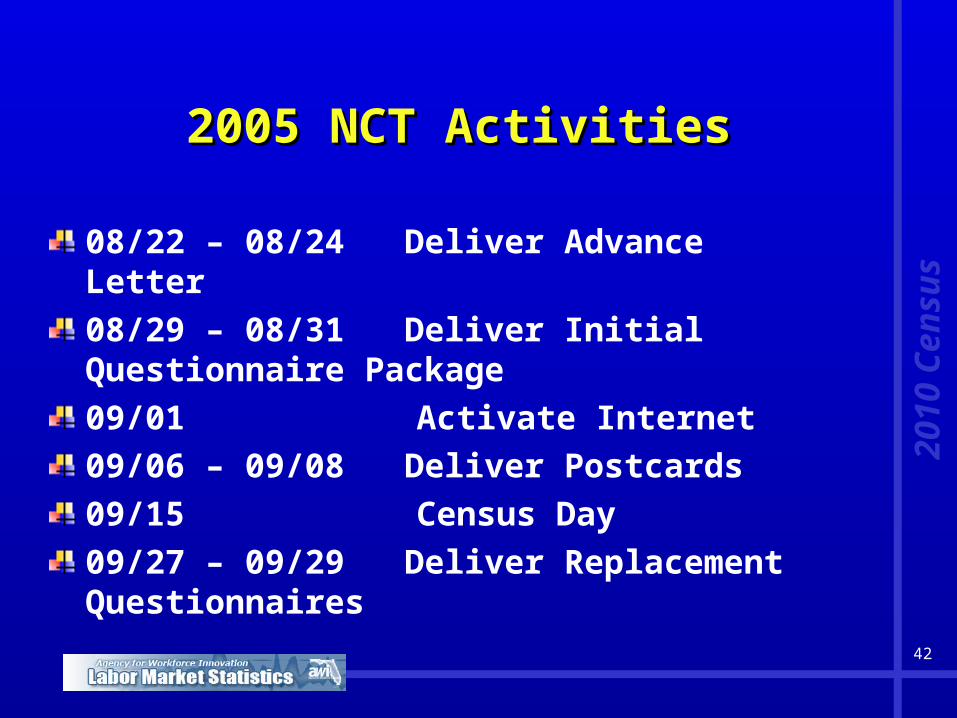
2005 NCT Activities2005 NCT Activities
08/22 – 08/24 Deliver Advance Letter
08/29 – 08/31 Deliver Initial Questionnaire Package
09/01 Activate Internet
09/06 – 09/08 Deliver Postcards
09/15 Census Day
09/27 – 09/29 Deliver Replacement Questionnaires
20
10
Ce
ns
us
43
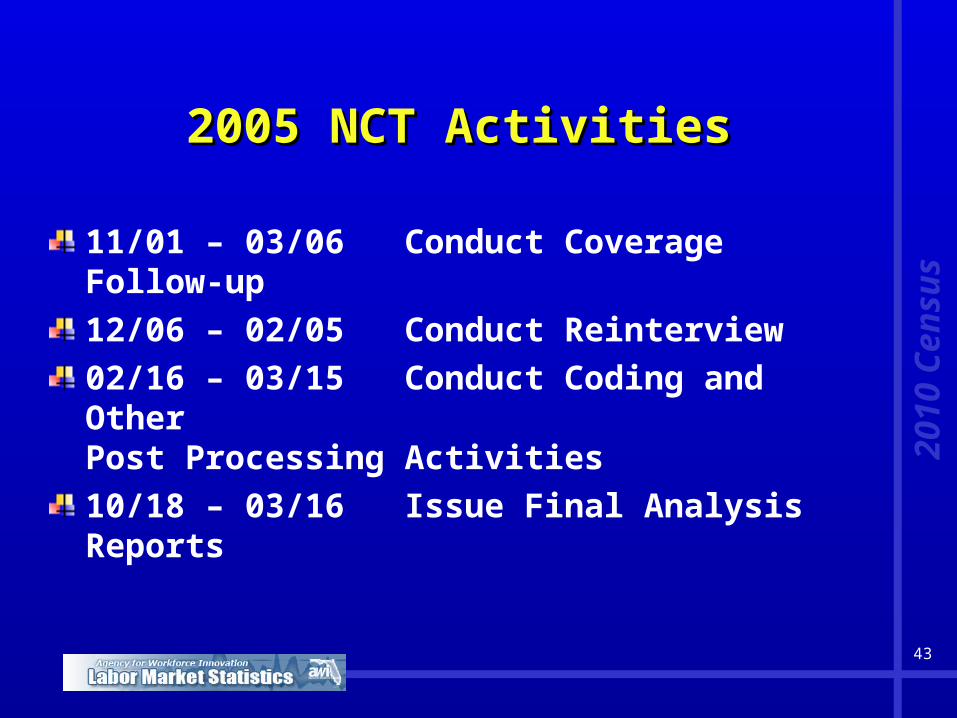
2005 NCT Activities2005 NCT Activities
11/01 – 03/06 Conduct Coverage Follow-up
12/06 – 02/05 Conduct Reinterview
02/16 – 03/15 Conduct Coding and Other Post Processing Activities
10/18 – 03/16 Issue Final Analysis Reports
20
10
Ce
ns
us
44
Results of 2005 NCTResults of 2005 NCT
Used to evaluate the degree to which respondents are able to understand and apply the residence rules instructions that are designed to insure that everyone is counted only once and in the right place
20
10
Ce
ns
us
45
Results of 2005 NCTResults of 2005 NCT
Used in conjunction with the results of cognitive tests and focus groups, the 2003 National Census Test, and the 2004 Census Test to develop the optimal questionnaire and mailing strategy for the 2010 Census 2
01
0 C
en
su
s
46
Future TestsFuture Tests
2006 Census Test (site test)
2010 Dress Rehearsal in 2008
20
10
Ce
ns
us
47
How Does this Impact ALMIS?How Does this Impact ALMIS?
Any ideas?More data more often….
Will ACS mean any changes to structure?
AL
MIS
Da
tab
as
e