Embed Size (px)
Citation preview
Bureau of Justice StatisticsOctober 2008, NCJ 222182
U.S. Department of JusticeOffice of Justice Programs
National Prisoner Statistics Program
Census of State and Federal Correctional Facilities, 2005
by James J. StephanBJS Statistician
The Bureau of Justice Statistics (BJS) conducted a national census—Census of State and Federal Correctional Facili-ties (CSFCF)—of adult correctional facilities operating under state or federal authority as of December 2005. The census also included private and local facilities operating under contract to house inmates for federal or state correc-tional authorities.
Facilities that housed primarily state or federal prisoners and that were operational on the day of the census and physically, functionally, and administratively separate from other facilities were included in the 2005 CSFCF. The types of facilities included were prisons and prison farms; prison hospitals; centers for medical treatment and psychiatric confinement; boot camps; centers for reception; diagnosis; classification; alcohol and drug treatment; community cor-rectional facilities; facilities for parole violators and other persons returned to custody; institutions for youthful offend-ers; and institutions for geriatric inmates.
The 2005 CSFCF excluded city, county, and regional jails and private facilities that did not house primarily state or federal inmates. It also excluded facilities for the military, U.S. Immigration and Customs Enforcement (ICE), Bureau of Indian Affairs (BIA), U.S. Marshals Service (USMS), and correctional hospital wards not operated by correctional authorities.
Selected findings from the Census of State and Federal Correctional Facilities, 2005
• From June 30, 2000, to December 30, 2005, the number of state and federal correctional facilities increased by 9%, from 1,668 to 1,821. The number of prisoners held in custody increased by 10%, from 1,305,253 to 1,430,208.
• Private correctional facilities (up 151) accounted for nearly all of the increase in the number of adult correc-tional facilities between June 30, 2000, and December 30, 2005. Most of the growth in private correctional facil-ities during this period was in facilities under contract to the Federal Bureau of Prisons.
• From 2000 to 2005, the number of private facilities increased from 16% (264) to 23% (415) of all institu-tions. About two-thirds of all private facilities were under contract to state authorities and a third were under con-tract to the Federal Bureau of Prisons.
• Inmates housed in private facilities increased from 91,184 in 2000 to 105,451 in 2005. In both years, inmates housed in private facilities made up about 7% of the nation’s average daily prisoner population.
• Between 2000 and 2005, facilities housing fewer than 500 inmates as an average daily population increased by 86. Facilities housing 500 to 999 inmates was rela-tively unchanged between 2000 (305) and 2005 (304). Facilities housing 1,000 to 2,499 inmates increased by 57 and the number of facilities housing 2,500 inmates or more rose by 11.
• The number of minimum (up 155) and maximum (up 40) security facilities increased between 2000 and 2005. The number of medium-security facilities declined (down 42) during this period.
• The number of facilities under court order or consent decree to limit the size of their inmate population declined from 145 in 2000 to 44 in 2005. Facilities under court order or consent decree for specific conditions also declined, from 320 to 218.

2 Census of State and Federal Correctional Facilities, 2005
• The overall inmate population in adult correctional facili-ties operating under state or federal authority increased by 10% between the 2000 and 2005 CSFCF. The num-ber of correctional staff rose by 3% during this period.
• More than 4 in 5 adult correctional facilities offered inmate work programs and about half of all prisoners had work assignments in 2005.
• About 9 in 10 public correctional facilities and about 6 in 10 private correctional facilities offered academic and vocational training programs in 2005.
• In 2005, counseling programs—such as life skills and community adjustment, drug and alcohol dependence and awareness, and HIV/AIDS counseling—were offered in nearly all public facilities and in about 3 in 4 private facilities.
Facility characteristics
The number of adult correctional facilities in the United States rose by 153 (or 9%) between June 30, 2000, and December 30, 2005. Private facilities increased by 151 (from 264 to 415) and accounted for nearly all the growth during this period. The number of public facilities was nearly unchanged between 2000 (1,404) and 2005 (1,406).
Growth in private facilities included the addition of six con-finement facilities and 145 community-based correctional facilities between 2000 and 2005 (table 1). The number of confinement institutions in the public sector increased by 78 from 1,107 to 1,185 between 2000 and 2005. Commu-nity-based facilities declined by 76. (See Methodology for definitions of confinement and community-based facilities.)
Federally operated facilities increased by 21%, from 84 in 2000 to 102 in 2005. State operated facilities grew by 9%, from 1,584 to 1,719 during this period.
Thirty states operated a larger number of adult correctional facilities in 2005 than in 2000; 14 states and the District of Columbia operated fewer facilities. Seven states had the same number of public and private correctional facilities in 2000 and 2005.
Facility size and rated capacity
The number of small facilities with an average daily popula-tion (ADP) of fewer than 500 inmates rose by 10% between 2000 and 2005. Large facilities with an ADP of 1,000 to 2,499 inmates grew by 13% during this period and facilities with an ADP of 2,500 or more inmates increased by 17%. In comparison, the number of medium-size facilities with an ADP of 500 to 999 inmates remained essentially unchanged, up 2 in the public sector and down 3 in the private sector between 2000 and 2005.
The number of prisoners housed in state and federal cor-rectional facilities rose faster than facility capacity expanded. The overall occupancy rate of adult correctional facilities nationwide increased from 2% above capacity in 2000 to 11% above capacity in 2005. The occupancy rate is defined as the number of inmates divided by rated capacity multiplied by 100.
Table 1. Total number of correctional facilities by characteristic, June 30, 2000, and December 30, 2005
2000 2005 Percent change
Publica
Confinement 1,107 1,185 7%Community-based 297 221 -26
Privatea
Confinement 101 107 6%Community-based 163 308 89
Jurisdictiona
State 1,584 1,719 9%Federal 84 102 21
Sizeb
Fewer than 500 inmates 860 946 10%500-999 305 304 01,000-2,499 438 495 132,500 inmates or more 65 76 17
Security levelcMaximum 332 372 12%Medium 522 480 -8Minimum 814 969 19
Under court order or consent decreed
For any reason 357 239 -33%To limit population 145 44 -70For specific conditions 320 218 -32
Note: For data on design and rated capacity, see appendix table 4.aFor federal, state, and regional data, see appendix tables 1 and 2.bFor federal, state, and regional data, see appendix table 3.cFor federal, state, and regional data, see appendix table 5.dFor federal, state, and regional data, see appendix tables 6 and 7.

Census of State and Federal Correctional Facilities, 2005 3
State public facilities accounted for most of the overall increase in the occupancy rate from 2000 to 2005. In 2005, public facilities were operating at 12% above rated capac-ity, compared to 3% above rated capacity in 2000. Private facilities were operating at 5% under rated capacity in 2005, down from 11% under rated capacity in 2000.
Federal facilities were operating at 37% above their rated capacity in 2005, up from 34% above capacity in 2000. State facilities were operating at 8% above rated capacity, up from operating at 100% of rated capacity in 2000.
Facility security level
More than half of the nation's correctional facilities in 2005 were rated as minimum security, more than a quarter as medium security, and more than a fifth were rated as maxi-mum security. (See Methodology for definitions.)
Between 2000 and 2005, the number of maximum-security facilities increased by 12%. Nearly all of the increase in facilities rated as maximum security occurred in the public sector. The Federal Bureau of Prisons (up 6), Tennessee (up 5), and Virginia (up 5) accounted for most of the growth in the number of maximum-security facilities. The number of medium-security facilities declined by 8% during this period.
The number of minimum-security facilities increased by 19% between 2000 and 2005. Private facilities operating under contract to house state or federal inmates accounted for all of the growth in minimum-security facilities (up by 169 facilities or 87%) between the 2000 and 2005 cen-suses. More than half of the growth in the number of mini-mum-security facilities occurred in three states: Connecti-cut (up 32), Texas (up 28), and Ohio (up 27).
Court orders and consent decrees
Fewer facilities in both the public and private sectors were under court directives in 2005 than in 2000. About 1 in 8 adult correctional facilities were operating under a court order or consent decree in 2005, compared to 1 in 5 in 2000.
Approximately 1% of public facilities were under a court order to limit the size of their inmate population in 2005 due to crowding, compared to 8% in 2000. Six percent of pri-vate contract facilities were under court order to limit the size of their inmate population in 2005, compared to 10% in 2000. Twenty-seven of the 44 institutions that were under court order to limit the size of their inmate population in 2005 were restricted to housing fewer than 250 inmates. In 2005, no federal facilities were under a court order to limit the size of their inmate population.
Fourteen percent of all public facilities were under court order for specific conditions of confinement in 2005, com-pared to 22% in 2000. For privately-operated facilities, 7% were under court order in 2005 for specific conditions of confinement, up from 6% in 2000. One federal facility was under a court order for specific conditions in 2005.
The Midwest (94%) had the largest percentage of facilities that were not under court order for any reason; the South (82%) had the smallest percentage. Seventeen states and the District of Columbia, or about 35% of all jurisdictions, reported that all facilities in their jurisdictions were free of judicial sanctions at yearend 2005.
Private facilities
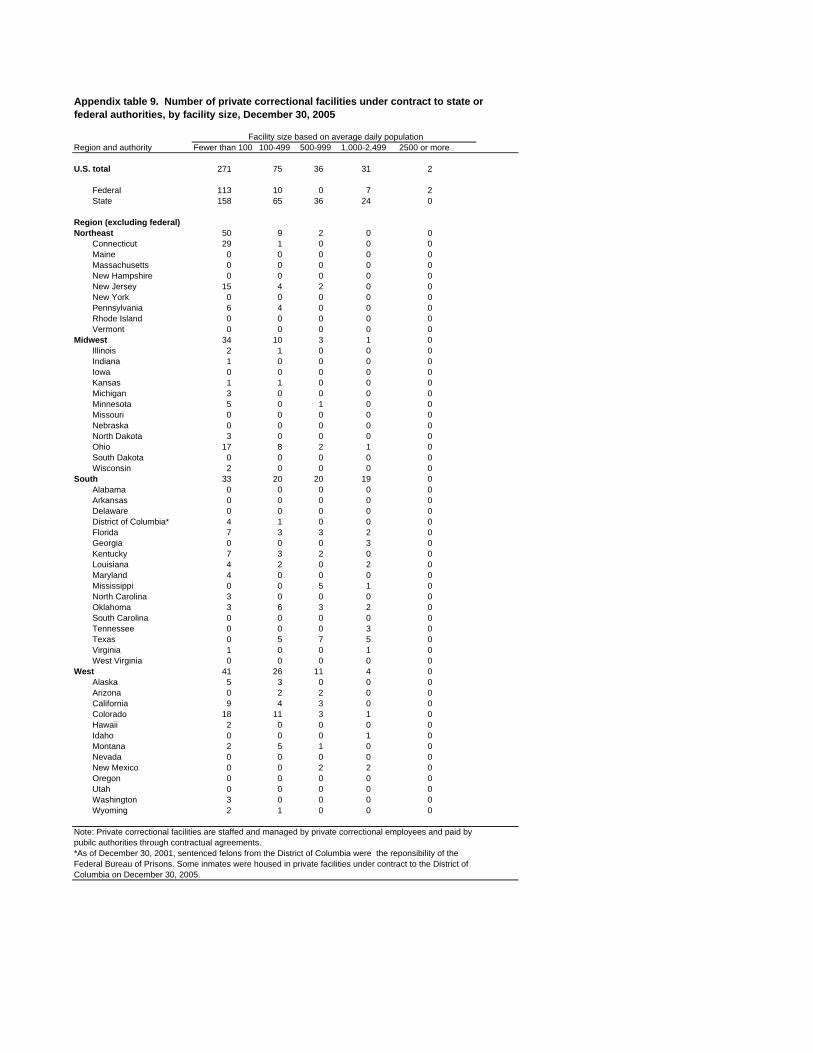
The number of private facilities operating under contract to state or federal correctional authorities increased by 57%, from 264 in 2000 to 415 in 2005 (table 2). The number of private facilities under federal contract rose by 106, nearly two and a half times as fast as private facilities under state contract (up 45) during this period.
From midyear 2000 to yearend 2005, the number of inmates held in private facilities rose by 16%, from 91,184 to 105,451. The percentage of federal inmates held in pri-vate facilities increased by 54% to 22,801 inmates. State inmates held in private facilities rose by 8% to 82,650 inmates during this period.
Eighteen states and the District of Columbia had more pri-vate institutions in operation in 2005 than in 2000. Connect-icut (up 30) and Ohio (up 25) had the largest increases in the number of private institutions during this period. Thir-teen states had fewer private institutions in 2005 than in 2000. California (down 27) and Texas (down 16) reported the largest declines in the number of private institutions under contract to house inmates in their jurisdictions.
Approximately 2 in 3 inmates held in private facilities were held in six states—Texas (15,131), Oklahoma (7,802), Colo-rado (6,195), Florida (5,739), Mississippi (5,683) and Ten-nessee (5,087)—or in private facilities under contract with the Federal Bureau of Prisons (22,801).
Most private facilities were small. About 2 in 3 private facili-ties had an average daily population of less than 100 inmates. About 1 in 6 held between 100 and 499 inmates and about 1 in 6 held 500 or more inmates.
Table 2. Number of private correctional facilities operating under contract to state or federal authorities and average daily population, 2000 and 2005
2000 2005 Percent change
Number of facilities* 264 415 57%Average daily population 91,184 105,451 16*For federal, state, and regional data, see appendix tables 8 and 9.

4 Census of State and Federal Correctional Facilities, 2005
Private facilities operating under contract to federal authori-ties were some of the smallest and largest private facilities. More than 4 in 5 private facilities operating under contract to federal authorities had an average daily population of less than 100 inmates. The two largest private facilities with an average daily population of 2,500 or more inmates were also federal contract institutions.
Inmates
Ninety-two percent of inmates held in custody for state or federal authorities on December 30, 2005, were men and 7% were women. The gender of 1% of inmates in custody was not reported (table 3).
Male inmates outnumbered female inmates by more than 9 to 1 in every region and in most states. This pattern varied only among community-based facilities, which were defined as institutions that permitted half or more of all inmates to leave the facility, unaccompanied, on a regular basis. Women accounted for slightly more than 10% of the nation's prisoner population housed in community-based facilities. In New Hampshire, Hawaii, and Idaho, women accounted for more than a quarter of inmates housed in community-based facilities.
Facility security level
Slightly more than a third of state and federal inmates were housed in maximum-security prisons, two-fifths in medium security, and a fifth in minimum-security facilities at yearend 2005.
Between 2000 and 2005, inmates held in minimum-security facilities increased by 22% and inmates held in maximum- security facilities increased by 16%. Inmates held in medium-security facilities declined by less than 1% during the period.
Nearly all inmates classified for a maximum-security facility were held in public institutions, with private contract facili-ties housing less than 2% of the total in both 2000 and 2005. Nearly 2 in 5 state inmates were held in maximum-security prisons, compared to 1 in 7 federal inmates.
Although 8% fewer medium-security facilities were in oper-ation in 2005 than in 2000, in both years more than two-fifths of all inmates were housed in medium-security facili-ties. The distribution of inmates in medium-security housing was relatively consistent—43% in public versus 37% in pri-vate facilities and 41% in federal versus 43% in state facili-ties—across sectors.
Less than a fifth of all inmates held by public authorities were housed in minimum- or low-security facilities, com-pared to more than half of all inmates housed in private facilities.
Staff
An estimated 445,000 employees were working in state and federal correctional facilities at yearend 2005 (table 4). Male employees outnumbered female employees by a ratio of 2 to 1. Among correctional officers and custody staff working in direct contact with inmates, men outnumbered women by a ratio of 3 to 1.
The largest difference in staff by gender was among correc-tional officers in federal facilities. In federal facilities, 87% of correctional officers were men and 13% were women. The smallest difference—52% men and 48% women—was among the total workforce in private facilities. In state oper-ated facilities, about 74% of correctional officers were men and 26% were women.
About 66% of all employees were correctional officers, line staff, or supervisors who worked in direct contact with inmates and were involved in their daily custody or monitor-ing. Correctional officers accounted for more than 80% of all employees in Massachusetts, Rhode Island, and Dela-ware—states which operated combined jail/prison systems. Correctional officers accounted for less than 50% of employees in direct contact with inmates in the District of Columbia and the Federal Bureau of Prisons.
Table 4. Number of employees in correctional facilities under state or federal authority, by gender and occupational category
Number Percent
Gendera
Male 296,852 67%Female 148,203 33
Occupational categoryb
Administrators 10,769 2%Correctional officers 295,261 66Clerical/maintenance 51,993 12Educational 11,526 3Professional/technical 46,016 10Other/not available 29,489 7
aFor federal, state, and regional data, see appendix table 12.bFor federal, state, and regional data, see appendix table 13.
Table 3. Number of inmates in correctional facilities under state or federal authority, by gender and type of facility, and ratio of male to female inmates, 2005
Total Male FemaleNot reported
Number of male inmates per female inmate
All facilities* 1,430,208 1,317,492 97,205 15,511 14
Confinement 1,375,975 1,273,594 91,697 10,684 14Community-
based 54,233 43,881 5,525 4,827 8*For federal, state, and regional data, see appendix tables 10 and 11.

Census of State and Federal Correctional Facilities, 2005 5
About 2% of all staff were wardens, superintendents, or other chiefs or lead administrators. Administrators accounted for more than 6% of correctional staff in Mon-tana, Wyoming, and the District of Columbia. Administra-tors made up about 1% of correctional staff in Pennsylva-nia, Rhode Island, Michigan, Florida, Maryland, Virginia, and Hawaii.
Clerical and maintenance employees, including typists, secretaries, record clerks, janitors, cooks, and groundskeepers accounted for about 12% of the correc-tional workforce. Federal prisons (21%) had the highest percentage of clerical and maintenance employees; facili-ties in Florida (3%) had the lowest percentage.
Academic and technical education employees made up about 3% of all staff. The percentage of academic and technical education employees ranged from 8% in West Virginia to less than 1% in Alabama, Arkansas, Washington state, and the District of Columbia.
Professional and technical staff, including doctors, dentists, nurses, counselors, chaplains, psychiatrists, psychologists, social workers, and classification officers, accounted for approximately 10% of employees. The percentage of pro-fessional and technical staff ranged from 24% in South Dakota to 3% in Arkansas.
The remaining 7% of employees were either classified in other occupational categories or their occupations were not reported.
Inmate-to-staff ratios
Between 2000 and 2005, the number of inmates incarcer-ated in state and federal facilities rose 10%, nearly 3 times faster than the number of employees (up 3%) working in state and federal facilities. The largest increase in inmate-to-staff ratios occurred among federal facilities, from 3.4 to 1 in 2000 to 4.9 in 2005 (table 5). The largest increases in inmate-to-staff ratios among facilities under state authority occurred in Oklahoma, Arizona, and South Carolina (appendix table 14). Among the few jurisdictions that reported a decrease in their inmate-to-staff ratio during this period, North Dakota reported the largest decrease, from 3.1 in 2000 to 2.3 in 2005.
Nationwide, the ratio of inmates-to-correctional officers increased from 4.8 to 1 in 2000 to 5.1 in 2005. In both fed-eral prisons (10.3) and in facilities in Alabama (9.3), the ratio of inmates-to-correctional officers was about twice the national average.
The ratio of inmates-to-staff in community-based facilities was 3.5 to 1 in 2005, down from 3.8 five years earlier. Facil-ities in Alabama (8.1) had the highest ratio of inmates-to-staff; South Dakota (1.6) had the lowest.
Facility programs
Most correctional facilities had inmate work activities and offered inmates educational and counseling programs. Education, counseling, and work programs were available in a higher percentage of public institutions. Work release activities were more common in private facilities.
Institutional work programs and work release
More than half (54%) of all inmates held in facilities (88%) that operated work programs had work assignments at yearend 2005 (table 6). Work assignments were available to inmates in 97% of public facilities and 56% of private facilities. They were also available in 98% of federal facili-ties and 87% of state institutions.
Table 6. Number of correctional facilities under state or federal authority that provided work, educational, and counseling programs to inmates, December 30, 2005
Number of facilities
Percent of all facilities
Inmate work programsa 1,594 88%Facility support services 1,347 74Public works 798 44Prison industries 562 31Work release 502 28
Educational programsb 1,550 85%Secondary education or GED 1,399 77Literacy or 1st - 4th grade 1,229 675th - 8th grade 1,203 66Vocational training 956 52Special education 667 37College courses 642 35English as a second language 632 35
Counseling programsc 1,676 92%Life skills and community adjustment 1,421 78Drug/alcohol dependency 1,344 74Employment 1,332 73Psychological or psychiatric 1,054 58HIV/AIDS 996 55Parenting 873 48Sex offender 662 36
aFor federal, state, and regional data, see appendix tables 16 and 17.bFor federal, state, and regional data, see appendix table 18.cFor federal, state, and regional data, see appendix table 19.
Table 5. Number of inmates per staff and per correctional officer, by jurisdiction and sector, June 30, 2000, and December 30, 2005
Number of inmates per staffNumber of inmates per correctional officer
2000 2005 2000 2005
Federal 3.4 4.9 9.0 10.3State 3.0 3.3 4.6 4.9Public 3.0 3.4 4.7 5.0Private 3.8 4.2 6.4 6.9Note: For federal, state, and regional data, see appendix tables 14 and 15.
6 Census of State and Federal Correctional Facilities, 2005
Facility support—such as office administration, food service and building maintenance—was the most common work activity in 74% of facilities. Public works (44%) assign-ments, including road and park maintenance, was the second most common work activity, followed by prison industries (31%).
Among correctional facilities, 298 or 16% of facilities employed inmates in farming or related activities. Correc-tional facilities that employed inmates in farming or related activities included 51 institutions in Texas, 29 in Florida, and 29 in Virginia.
Work assignments were not offered to inmates in 2% of public facilities and in 21% of private facilities.
More than a quarter (28%) of correctional facilities had a work release program, which allowed inmates to work in the community unsupervised by facility staff during the day and to return to the facility in the evening. Approximately 25,000 inmates, or 2% of the total custody population, par-ticipated in the program.
Educational programs
Formal educational programs were available to inmates in more than 9 in 10 public institutions and about 6 in 10 pri-vate facilities.
The most common educational program offered among all facilities was a secondary education or GED program (77%), followed by literacy training and lower basic adult education (67%), upper basic adult education (66%), and vocational training (52%). More than a third (37%) of all facilities offered special education programs for inmates with learning disabilities.
More than a third (35%) of all facilities offered college courses, including 98% of all institutions operated by the Federal Bureau of Prisons, 86% of facilities in Rhode Island, and 80% in Hawaii. No college courses were reported to be offered at facilities in Pennsylvania or South Carolina.
English as a second language was taught in about 35% of all facilities, including 93% of institutions in Virginia and 90% in Hawaii.
Study-release, a program that allows inmates to study in the community, was one of the least common educational programs. It was offered in 135 institutions or by 7% of all institutions nationwide, including 13 facilities in New Jersey and 11 in North Carolina.
Nine percent of all facilities overall reported offering no for-mal educational programs to inmates, including 29% of institutions in Pennsylvania and 25% of institutions in Dela-ware.
Counseling programs
Counseling and special programs were available to inmates in nearly all (97%) public institutions and in about three-quarters (74%) of private facilities.
Life skills and community adjustment counseling—including personal finance and conflict resolution—were the most common counseling programs offered in more than three quarters (78%) of all facilities, followed by drug and alcohol dependence and awareness counseling (74%) and job seeking, interviewing, and related employment counseling (73%).
Psychological or psychiatric counseling was available in 58% of facilities, HIV and AIDS programs in 55%, parenting and child rearing training in 48%, and sex offender counsel-ing in 36%.
Drug and alcohol dependence and awareness counseling was offered in all facilities in Hawaii and Wyoming, com-pared to 8% of institutions in Florida and 13% in Washing-ton state.
No counseling or special programs were available in 29 public and 11 private facilities.
Census of State and Federal Correctional Facilities, 2005 7
Methodology
The 2005 Census of State and Federal Correctional Facili-ties (CSFCF) was the seventh enumeration of state institu-tions and the fourth enumeration of federal institutions sponsored by the Bureau of Justice Statistics and its prede-cessors. Earlier censuses were conducted in 1974, 1979, 1984, 1990, 1995, and 2000.
The facility universe was developed from the census con-ducted in 2000. Each state's department of corrections was contacted to identify new facilities and facilities that had closed since June 2000.
Telephone follow-ups were carried out during 2006. All but one respondent—Illinois Department of Correc-tions—participated in the 2005 CSFCF.
Scope
Facilities were included in the enumeration if they were staffed with federal, state, local, or private employees; held inmates primarily for state or federal authorities; were phys-ically, functionally, and administratively separate from other facilities; and were operational on December 30, 2005.
The census included the following types of adult correc-tional facilities: prisons and prison farms; reception, diag-nostic, and classification centers; facilities primarily for parole violators and other persons returned to custody; road camps; forestry and conservation camps; facilities for youthful offenders except in California; vocational training facilities; drug and alcohol treatment facilities; and state-operated local detention facilities in Alaska, Connecticut, Delaware, Hawaii, Rhode Island, and Vermont.
Jails and other local and regional detention facilities, including those housing state prisoners, were specifically excluded from the census, as were private facilities not pre-dominantly for state or federal inmates. Also excluded were facilities for the military, Immigration and Customs Enforce-ment, Bureau of Indian Affairs, U.S. Marshals Service, and correctional hospital wards not operated by correctional authorities.
Data reporting and estimation
Because the census was a complete enumeration, the results were not subject to sampling error. The census counted prisoners held in the facilities, a custody count. Some inmates in custody in one jurisdiction may be held for a different jurisdiction. The custody count is distinct from a count of inmates under a correctional authority's jurisdic-tion, which includes all inmates over whom a correctional authority exercises control, regardless of where the inmate is housed. A jurisdictional count is more inclusive than a prison custody count and includes state and federal prison-ers housed in local jails.
The number of correctional employees in 2005 was not available for 104 facilities or 5.7% of all institutions. To esti-mate the total number of employees, the total number of facilities nationwide was divided by the number of facilities that reported employees and multiplied by the number of employees reported. A similar formula was used to calcu-late the total number of correctional officers.
Detailed information for each Illinois facility as of June 30, 2000, was reported during the 2000 census. For the 2005 census, data for Illinois were based on the number of facili-ties and inmates reported on the Illinois Department of Cor-rections Website as of June 30, 2005.
The 48 institutions and 44,150 inmates recorded in the 2000 census for Illinois were used as a base to calculate the 2005 data. Between 2000 and 2005, seven Illinois facil-ities closed, two new facilities opened, and two facilities merged for a total count of 44 institutions holding 41,777 inmates in 2005. For the 2005 census, 2,892 inmates were added to the count to bring the number of inmates housed in Illinois (44,669 prisoners) into agreement with the num-ber of inmates reported on the Illinois Department of Cor-rections Website as of June 30, 2005. Because information was not available to make this final adjustment by individ-ual facility, the 2,892 prisoners are not reflected in the data file.
Facility-level data on correctional employees in California was not available in 2005. State-wide data on employees by gender and by occupational category other than correc-tional officers were estimated based on the percentages reported by the California Department of Corrections and Rehabilitation in the 2000 census.
Additional data, which was requested in the census but not discussed in this report, will be available from the Univer-sity of Michigan’s Criminal Justice Archive in the public use data set—Census of State and Federal Correctional Facili-ties, 2005. The additional data includes year of original facility construction; plans to add to, close, or renovate the facility; facilities by gender of inmates authorized to house; inmates by gender under and over age 18; inmates by race and ethnicity; inmates by custody level; inmates by sen-tence status; non-U.S. citizen inmates; geriatric unit inmates; U.S. military veteran inmates; inmates in protec-tive custody, disciplinary action, administrative segregation, death row, and other restricted population units; inmates held for federal, state, local, and tribal authorities; per diem fees charged to house inmates for other correctional authorities; employees by race and ethnicity; disciplinary/misconduct reports; major and other disturbances during 2005; assaults on staff and resulting staff deaths; assaults on other inmates; escapes from secure custody; and walk-aways from community facilities.

8 Census of State and Federal Correctional Facilities, 2005
Definitions
Community-based facilities—Correctional facilities were classified as community-based if 50% or more of the resi-dents were regularly permitted to leave, unaccompanied by facility staff, to work or study in the community. Community-based facilities included entities such as halfway houses, residential treatment centers, restitution centers, and prere-lease centers.
Confinement facilities—Correctional facilities in which less than 50% of the inmates left the facility unaccompanied on a regular basis. Confinement facilities included prisons, prison farms, penitentiaries, correctional centers, work camps, and reformatories.
Design capacity—Design capacity is the number of inmates that the facility planners or architects intended for the facil-ity.
High-security facilities—High-security facilities were described as supermax, maximum, close, or high-security facilities and were characterized by a wall or double-fenced perimeter and armed correctional officers stationed in a tower or on patrol. Cell housing was isolated from the perimeter in one of two ways: within a cell block so that a prisoner who had escaped from a cell was confined within the building or by double security using bars, steel doors, or other hardware to isolate the prisoner from the perime-ter. All entry to or exit from the cell block was via trap gate or sallyport.
Medium-security facilities—Medium-security facilities were characterized by a single- or double-fenced perimeter with armed correctional officers stationed in a tower or on patrol. Housing units included cells, rooms, or dormitories. Dormi-tories were living units designed or modified to accommo-date 12 or more persons. All entry to or exit from the cell housing unit was via trap gate or sallyport.
Minimum- or low-security facilities—Medium- or low-security facilities were characterized by a fenced or posted perimeter. Cell housing units were rooms or dormitories. Normal entry to and exit from the cell housing units were conducted under visual surveillance.
Rated capacity—Rated capacity is the maximum number of beds or inmates allocated by a rating official to institutions within the jurisdiction.

2000 2005 2000 2005 2000 2005
U.S. total 1,668 1,821 1,305,253 1,430,208 9.6 % 464 480
Public/a 1,404 1,406 1,212,176 1,321,685 9 431 444Private 264 415 93,077 108,523 16.6 33 36
Federal 84 102 110,974 145,780 31.4 39 49State/b 1,584 1,719 1,194,279 1,284,428 7.5 424 431
Region (excluding federal)Northeast 236 268 171,999 171,465 -0.3 % 321 314
Connecticut 20 49 16,984 19,019 12 499 541Maine 8 7 1,629 1,968 20.8 128 149Massachusetts 25 17 10,500 10,262 -2.3 165 161New Hampshire 8 8 2,277 2,373 4.2 184 180New Jersey 43 42 27,118 25,724 -5.1 322 294New York 72 77 71,938 63,855 -11.2 379 332Pennsylvania 44 52 36,895 43,254 17.2 300 348Rhode Island 7 7 3,347 3,414 2 319 318Vermont 9 9 1,311 1,596 21.7 215 256
Midwest 301 342 233,993 255,134 9 % 363 386Illinois/c 48 44 44,150 44,669 1.2 355 349Indiana 25 23 18,195 23,205 27.5 299 369Iowa 30 31 9,086 10,145 11.7 310 341Kansas 11 13 8,992 9,474 5.4 334 344Michigan 70 62 47,639 50,082 5.1 479 495Minnesota 9 18 7,451 9,680 29.9 151 188Missouri 28 28 27,963 31,748 13.5 500 545Nebraska 9 9 3,508 4,371 24.6 205 248North Dakota 3 8 992 1,411 42.2 154 221Ohio 34 59 47,915 44,717 -6.7 422 390South Dakota 4 6 2,591 3,451 33.2 343 443Wisconsin 30 41 15,511 22,181 43 289 400
South 743 779 518,912 561,927 8.3 % 518 519Alabama 36 33 22,422 23,174 3.4 504 507Arkansas 15 26 10,465 13,921 33 391 499Delaware 9 12 6,023 6,781 12.6 769 798District of Columbia/d 8 5 3,767 300 -92 658 55Florida 106 109 71,616 86,705 21.1 448 482Georgia 84 87 44,299 51,822 17 541 567Kentucky 25 25 12,378 14,932 20.6 306 357Louisiana 17 23 19,167 20,344 6.1 429 449Maryland 26 29 22,821 22,613 -0.9 431 402Mississippi 28 31 14,823 16,967 14.5 521 579North Carolina 80 88 30,708 38,233 24.5 381 437Oklahoma 52 53 23,858 25,149 5.4 691 705South Carolina 34 33 21,277 22,537 5.9 530 526Tennessee 15 19 18,368 19,484 6.1 323 325Texas 136 132 162,440 163,556 0.7 779 709Virginia 61 59 31,412 31,478 0.2 444 413West Virginia 11 15 3,068 3,931 28.1 170 216
West 304 330 269,375 295,902 9.8 % 426 430Alaska 24 21 3,248 4,146 27.6 518 618Arizona 18 21 30,832 32,855 6.6 601 545California 92 100 163,383 169,988 4 482 468Colorado 48 58 15,695 20,842 32.8 365 444Hawaii 10 10 3,761 3,951 5.1 310 304Idaho 13 15 3,961 5,975 50.8 306 413Montana 8 11 2,368 3,160 33.4 262 336Nevada 20 22 9,296 11,726 26.1 465 477New Mexico 10 11 5,158 7183 39.3 284 369Oregon 13 15 9,933 13049 31.4 290 356Utah 9 7 4,872 5461 12.1 218 219Washington 30 32 14,682 16146 10 249 255Wyoming 9 7 2,186 1420 -35 443 278
Note: Unless stated otherwise, numbers for 2000 are as of June 30, and numbers for 2005 are as of December 30.a/Includes facilities operated by both federal and state authorities.b/Includes private facilities.c/2005 data are as of June 30.d/As of December 30, 2001, sentenced felons from the District of Columbia were the reponsibility of the Federal Bureau of Prisons. Some inmates were housed in private facilities under contract to the District of Columbia on December 30, 2005.
Appendix table 1. Number of correctional facilities and inmates under state or federal authority, population change, and number of inmates per 100,000 U.S. residents, June 30, 2000, and December 30, 2005
Population change, 2000-2005
Number of facilities Inmates per 100,000 U.S. residents Number of inmates held
Region and authority

2000 2005 2000 2005 2000 2005
1,668 1,821 1,208 1,292 460 529
Public/a 1,404 1,406 1,107 1,185 297 221Private 264 415 101 107 163 308
Federal 84 102 84 102 0 0State/b 1,584 1,719 1,124 1,190 460 529
Region (excluding federal)236 268 175 173 61 95
Connecticut 20 49 20 21 0 28Maine 8 7 6 5 2 2Massachusetts/c 25 17 18 13 7 4New Hampshire 8 8 5 5 3 3New Jersey 43 42 25 23 18 19New York 72 77 63 63 9 14Pennsylvania 44 52 25 28 19 24Rhode Island 7 7 6 7 1 0Vermont 9 9 7 8 2 1
301 342 238 234 63 108Illinois/d 48 44 36 34 12 10Indiana 25 23 21 18 4 5Iowa 30 31 8 9 22 22Kansas 11 13 10 10 1 3Michigan 70 62 61 52 9 10Minnesota 9 18 9 13 0 5Missouri 28 28 25 22 3 6Nebraska 9 9 7 7 2 2North Dakota 3 8 3 4 0 4Ohio 34 59 34 34 0 25South Dakota 4 6 3 3 1 3Wisconsin 30 41 21 28 9 13
743 779 528 560 215 219Alabama 36 33 19 18 17 15Arkansas 15 26 8 21 7 5Delaware 9 12 5 8 4 4District of Columbia/e 8 5 3 0 5 5Florida 106 109 69 69 37 40Georgia 84 87 57 60 27 27Kentucky 25 25 15 15 10 10Louisiana 17 23 10 14 7 9Maryland 26 29 18 22 8 7Mississippi 28 31 9 29 19 2North Carolina 80 88 68 73 12 15Oklahoma 52 53 28 26 24 27South Carolina 34 33 24 22 10 11Tennessee 15 19 15 15 0 4Texas 136 132 121 111 15 21Virginia 61 59 50 47 11 12West Virginia 11 15 9 10 2 5
304 330 183 223 121 107Alaska 24 21 14 15 10 6Arizona 18 21 15 15 3 6California 92 100 50 87 42 13Colorado 48 58 27 31 21 27Hawaii 10 10 8 8 2 2Idaho 13 15 8 9 5 6Montana 8 11 4 6 4 5Nevada 20 22 12 16 8 6New Mexico 10 11 10 8 0 3Oregon 13 15 13 9 0 6Utah 9 7 4 2 5 5Washington 30 32 13 14 17 18Wyoming 9 7 5 3 4 4
West
South
Region and authority
a/Includes facilities operated by both federal and state authorities.
Appendix table 2. Number of correctional facilities under state or federal authority, by type, June 30, 2000, and December 30, 2005
Northeast
Midwest
U.S. total
All facilities Confinement facilitiesCommunity- based facilities
d/The total number of facilities in 2005 were reported by the Illinois Department of Corrections as of June 30. Confinement and community-based facilities are estimated based on the total number of facilities reported by the Department of Corrections and their proportionate distributions on June 30, 2000.
b/Includes private facilities.c/The total number of facilities in 2005 are as of June 30.
e/As of December 30, 2001, sentenced felons from the District of Columbia were the reponsibility of the Federal Bureau of Prisons. Some inmates were housed in private facilities under contract to the District of Columbia on December 30, 2005.

Region and authority 2000 2005 2000 2005 2000 2005 2000 2005US total 860 946 305 304 438 495 65 76
Public/a 665 600 266 268 408 464 65 74Private 195 346 39 36 30 31 0 2
Federal 4 6 19 18 60 75 1 3State/b 856 940 286 286 378 420 64 73
Region (excluding federal)Northeast 115 145 53 50 63 69 5 4
Connecticut 3 34 12 8 5 7 0 0Maine 7 5 1 2 0 0 0 0Massachusetts/c 16 8 6 5 3 4 0 0New Hampshire 7 6 0 1 1 1 0 0New Jersey 27 25 5 6 9 10 2 1New York 20 27 21 20 30 29 1 1Pennsylvania 22 27 5 5 15 18 2 2Rhode Island 4 4 3 3 0 0 0 0Vermont 9 9 0 . 0 0 0 0
Midwest 145 178 56 47 97 111 3 6Illinois/d 23 18 4 4 19 20 2 2Indiana 14 12 4 1 6 8 1 2Iowa 23 23 5 4 2 4 0 0Kansas 4 6 4 4 3 3 0 0Michigan 31 21 20 17 19 24 0 0Minnesota 3 11 3 2 3 5 0 0Missouri 11 8 4 4 13 14 0 2Nebraska 6 6 2 2 1 1 0 0North Dakota 2 8 1 0 0 0 0 0Ohio 7 35 2 4 25 20 0 0South Dakota 2 4 1 0 1 2 0 0Wisconsin 19 26 6 5 5 10 0 0
South 389 395 145 155 190 205 19 24Alabama 22 19 3 2 11 12 0 0Arkansas 6 15 5 7 4 4 0 0Delaware 6 9 0 0 3 3 0 0District of Columbia/e 5 5 2 0 1 0 0 0Florida 56 54 14 11 36 41 0 3Georgia 51 50 13 9 20 28 0 0Kentucky 13 12 9 9 3 4 0 0Louisiana 7 12 2 2 7 8 1 1Maryland 12 13 5 8 7 6 2 2Mississippi 22 22 3 5 2 2 1 2North Carolina 54 54 24 32 2 2 0 0Oklahoma 32 33 13 13 7 7 0 0South Carolina 18 15 6 7 10 11 0 0Tennessee 3 6 3 4 9 9 0 0Texas 36 28 28 32 58 57 14 15Virginia 37 36 13 11 10 11 1 1West Virginia 9 12 2 3 0 0 0 0
West 207 222 32 34 28 35 37 39Alaska 24 19 0 2 0 0 0 0Arizona 4 8 2 3 9 5 3 5California 53 62 5 4 3 2 31 32Colorado 37 45 9 9 2 4 0 0Hawaii 8 8 1 0 1 2 0 0Idaho 10 10 2 3 1 2 0 0Montana 7 9 0 1 1 1 0 0Nevada 13 15 3 2 4 5 0 0New Mexico 5 4 4 4 1 3 0 0Oregon 9 8 1 2 2 4 1 1Utah 7 5 1 0 0 1 1 1Washington 23 23 2 3 4 6 1 0Wyoming 7 6 2 1 0 0 0 0
a/Includes facilities operated by both federal and state authorities.b/Includes private facilities.
e/ As of December 30, 2001, sentenced felons from the District of Columbia were the reponsibility of theFederal Bureau of Prisons. Some inmates were housed in private facilities under contract to the District of Columbia on December 30, 2005.
2,500 or more
Appendix table 3. Number of correctional facilities under state or federal authority, by facility size, June 30, 2000, and December 30, 2005
Fewer than 500 500-999 1,000-2,499Facility size based on average daily population
c/The total number of facilities in 2005 are as of June 30. d/ The total number of facilities in 2005 were reported by the Illinois Department of Corrections as of June 30. Confinement and community-based facilities are estimated based on the total number of facilities reported by the Department of Corrections and their proportionate distributions on June 30, 2000.

Region and authority 2000/a 2005/a 2000 2005 2000 2005 2000 2005
U.S. total ... ... : % : % 1,278,471 1,289,681 102 % 111 %
Public/b 904,767 ... 122 : 1,173,338 1,174,810 103 112Private 104,790 ... 89 : 105,133 114,706 89 95
Federal ... ... : : 83,113 106,732 134 137State/c 1,009,557 963,404 118 114 1,195,358 1,182,784 100 108
Region (excluding federal)Northeast 137,753 132,838 125 % 115 % 160,700 168,788 107 % 102 %
Connecticut 16,869 ... 101 0 17,600 18,688 97 102Maine 1,462 1,801 111 109 1,545 1,837 105 107Massachusetts/d 9,611 8,610 109 119 12,096 10,980 87 93New Hampshire 2,203 2,402 103 99 2,000 2,177 114 109New Jersey 20,861 18,131 130 142 26,979 26,024 101 99New York 55,299 57,705 130 111 69,014 63,458 104 101Pennsylvania 26,357 38,518 140 112 26,402 40,098 140 108Rhode Island 3,857 4,054 87 84 3,719 3,861 90 88Vermont 1,234 1,617 106 99 1,345 1,665 97 96
Midwest 186,371 105,887 126 % 109 % 214,817 229,382 109 % 110 %Illinois/e 28,978 ... 152 0 33,761 30,797 131 136Indiana 9,932 18,708 183 124 15,215 25,108 120 92Iowa 8,234 8,520 110 119 8,484 8,719 107 116Kansas 8,996 9,823 100 96 9,094 9,655 99 98Michigan 49,341 ... 97 0 48,190 50,674 99 99Minnesota 8,175 9,184 91 105 8,175 9,979 91 97Missouri 25,370 26,153 110 121 29,815 32,401 94 98Nebraska 2,303 3,115 152 140 3,419 ... 103 0North Dakota 390 1,455 254 97 907 1,455 109 97Ohio 30,506 ... 157 0 40,707 36,561 118 122South Dakota 2,372 2,605 109 132 2,633 3,653 98 94Wisconsin 11,774 16,324 132 136 14,417 20,380 108 109
South 482,762 514,461 107 % 103 % 545,080 537,896 95 % 104 %Alabama 17,693 12,918 127 179 22,158 ... 101 0Arkansas 10,026 13,913 104 100 10,026 14,673 104 95Delaware 4,567 5,419 132 125 5,716 6,845 105 99District of Columbia/f 4,104 503 92 60 4,138 503 91 60Florida 56,402 87,861 127 99 75,619 67,915 95 128Georgia 44,289 51,380 100 101 45,552 53,162 97 97Kentucky 11,349 14,255 109 105 13,010 15,451 95 97Louisiana 18,792 19,395 102 105 19,704 19,415 97 105Maryland 17,517 16,063 130 141 24,466 24,265 93 93Mississippi 17,690 18,222 84 93 17,238 18,229 86 93North Carolina 31,810 36,832 97 104 33,759 40,084 91 95Oklahoma 22,656 23,399 105 107 25,062 26,163 95 96South Carolina 19,385 23,163 110 97 23,327 23,310 91 97Tennessee 18,724 17,930 98 109 19,120 20,168 96 97Texas 169,773 170,232 96 96 170,328 171,362 95 95Virginia 14,792 ... 212 0 32,759 32,469 96 97West Virginia 3,193 2,976 96 132 3,098 4,047 99 97
West 202,671 210,218 133 % 141 % 274,761 246,553 98 % 120 %Alaska 3,490 3,101 93 134 3,622 4,129 90 100Arizona 30,426 30,591 101 107 29,482 34,013 105 97California 97,740 95,562 167 178 167,367 120,625 98 141Colorado 16,543 19,388 95 107 17,882 22,451 88 93Hawaii 2,535 2,625 148 151 3,460 3,581 109 110Idaho 4,431 5,351 89 112 5,233 5,948 76 100Montana 1,930 2,332 123 136 2,436 3,118 97 101Nevada 9,055 11,082 103 106 9,683 12,191 96 96New Mexico 5,905 6,035 87 119 6,071 7,357 85 98Oregon 10,193 12,302 97 106 11,381 13,562 87 96Utah 4,463 5,382 109 101 5,283 5,513 92 99Washington 13,165 14,731 112 110 9,947 12,293 148 131Wyoming 2,795 1,736 78 82 2,914 1,772 75 80
Note: See Methodology for definition of design and rated capacities.
e/2005 population reported by the Illinois Department of Corrections as of June 30. Rated capacity is estimated based on data reported by facilities in 2000 that were in operation in 2005.f/As of December 30, 2001, sentenced felons from the District of Columbia were the reponsibility of the Federal Bureau of Prisons. Some inmates were housed in private facilities under contract to the District of Columbia on December 30, 2005.
b/Includes facilities operated by both federal and state authorities.c/Includes private facilities.d/The total number of facilities in 2005 are as of June 30.
a/Design capacity data was not available for federal facilities in 2000 and 2005, or for public facilities in Connecticut, Illinois, Michigan, Ohio and Virginia in 2005. Summary statistics on design capacity were not available for public vs. private or for federal vs. state facilities in 2005 because federal private design capacity data could not be separated from state private data.
… Not available.: Not calculated.
Appendix table 4. Design and rated capacities of correctional facilities under state or federal authority, June 30, 2000, and December 30, 2005
Design capacity Rated capacity Percent of design capacity occupied
Percent of rated capacity occupied

2000 2005 2000 2005 2000 2005 2000 2005
U.S. total 1,668 1,821 332 372 522 480 814 969
Public/c 1,404 1,406 328 364 457 437 619 605Private 264 415 4 8 65 43 195 364
Federal 84 102 11 17 29 42 44 43State/d 1,584 1,719 321 355 493 438 770 926
Region (excluding federal)Northeast 236 268 50 52 88 85 98 131
Connecticut 20 49 11 10 5 3 4 36Maine 8 7 2 1 2 2 4 4Massachusetts/e 25 17 3 3 10 8 12 6New Hampshire 8 8 2 2 3 2 3 4New Jersey 43 42 5 5 11 11 27 26New York 72 77 16 17 36 39 20 21Pennsylvania 44 52 8 10 11 12 25 30Rhode Island 7 7 3 4 3 2 1 1Vermont 9 9 / / 7 6 2 3
Midwest 301 342 72 81 83 83 146 178Illinois/f 48 44 7 5 11 15 30 24Indiana 25 23 2 4 11 9 12 10Iowa 30 31 2 2 6 6 22 23Kansas 11 13 6 6 1 1 4 6Michigan 70 62 19 21 12 12 39 29Minnesota 9 18 5 4 4 5 / 9Missouri 28 28 9 12 8 5 11 11Nebraska 9 9 4 6 1 1 4 2North Dakota 3 8 1 1 1 1 1 6Ohio 34 59 11 11 17 15 6 33South Dakota 4 6 / 2 3 1 1 3Wisconsin 30 41 6 7 8 12 16 22
South 743 779 155 169 245 203 343 407Alabama 36 33 5 5 10 9 21 19Arkansas 15 26 2 2 8 14 5 10Delaware 9 12 2 3 2 2 5 7District of Columbia/g 8 5 1 0 2 0 5 5Florida 106 109 50 53 12 10 44 46Georgia 84 87 18 19 29 25 37 43Kentucky 25 25 2 4 9 8 14 13Louisiana 17 23 4 4 6 8 7 11Maryland 26 29 6 5 5 6 15 18Mississippi 28 31 1 2 8 7 19 22North Carolina 80 88 12 13 24 25 44 50Oklahoma 52 53 4 2 13 11 35 40South Carolina 34 33 7 8 9 9 18 16Tennessee 15 19 2 7 12 7 1 5Texas 136 132 26 25 76 45 34 62Virginia 61 59 9 14 18 16 34 29West Virginia 11 15 4 3 2 1 5 11
West 304 330 44 53 77 67 183 210Alaska 24 21 5 7 6 5 13 9Arizona 18 21 5 8 5 2 8 11California 92 100 12 7 24 21 56 72Colorado 48 58 8 11 10 11 30 36Hawaii 10 10 / 2 5 4 5 4Idaho 13 15 2 2 2 3 9 10Montana 8 11 2 2 1 2 5 7Nevada 20 22 1 1 7 6 12 15New Mexico 10 11 1 3 5 4 4 4Oregon 13 15 1 2 6 4 6 9Utah 9 7 / 1 3 1 6 5Washington 30 32 5 5 2 4 23 23Wyoming 9 7 2 2 1 / 6 5
g/As of December 30, 2001, sentenced felons from the District of Columbia were the reponsibility of the Federal Bureau of Prisons. Some inmates were housed in private facilities under contract to the District of Columbia on December 30, 2005.
/No one facility under state authority was reported to operate predominately at one (maximum, medium, or minimum) security level.
Note: Security level refers to the overall security rating of the facility, rather than to the custody classification of the inmates housed in them. See Methodology for facility security level definitions.
a/Includes facilities classified as super maximum, close, or high.b/Includes facilities classified as low, or with no security level designated. c/Includes facilities operated by both federal and state authorities.
f/The total number of facilities in 2005 were reported by the Illinois Department of Corrections as of June 30.
Appendix table 5. Number of correctional facilities under state or federal authority, by facility security level, June 30, 2000, and December 30, 2005
Facility security level
d/Includes private facilities.e/Facilitiy security levels are estimated based on information reported as of June 30, 2000.
Maximum/a Medium Minimum/bTotalRegion and authority

U.S. total 357 239 145 44 320 218
Public/a 324 199 119 21 303 190Private 33 40 26 23 17 28
Federal 0 1 0 0 0 1State/b 357 238 145 44 320 217
Region (excluding federal)Northeast 109 39 12 4 104 37
Connecticut 20 20 0 3 20 18Maine 0 0 0 0 0 0Massachusetts/c 2 1 0 0 2 1New Hampshire 0 0 0 0 0 0New Jersey 10 14 5 0 6 14New York 69 3 0 0 69 3Pennsylvania 0 0 0 0 0 0Rhode Island 7 0 6 0 7 0Vermont 1 1 1 1 0 1
Midwest 54 19 11 8 50 16Illinois/d 1 1 0 0 1 1Indiana 6 1 3 1 6 1Iowa 3 0 1 0 2 0Kansas 1 1 1 1 0 1Michigan 7 6 4 2 5 5Minnesota 0 3 0 1 0 2Missouri 4 1 2 1 4 1Nebraska 0 0 0 0 0 0North Dakota 0 0 0 0 0 0Ohio 32 4 0 2 32 3South Dakota 0 0 0 0 0 0Wisconsin 0 2 0 0 0 2
South 129 139 92 21 112 127Alabama 1 5 0 3 1 2Arkansas 0 0 0 0 0 0Delaware 1 1 0 0 1 1District of Columbia/e 4 0 2 0 4 0Florida 0 4 0 0 0 4Georgia 9 2 5 2 6 0Kentucky 0 1 0 0 0 1Louisiana 0 0 0 0 0 0Maryland 1 0 0 0 1 0Mississippi 6 3 5 3 3 3North Carolina 11 8 10 7 9 5Oklahoma 15 2 5 2 12 0South Carolina 3 0 2 0 1 0Tennessee 14 1 0 1 14 0Texas 64 111 63 2 60 111Virginia 0 0 0 0 0 0West Virginia 0 1 0 1 0 0
West 65 41 30 11 54 37Alaska 12 3 12 2 11 2Arizona 10 1 0 1 10 1California 33 1 12 1 27 0Colorado 4 29 4 4 1 28Hawaii 0 0 0 0 0 0Idaho 1 1 1 1 0 1Montana 1 1 0 0 1 1Nevada 1 2 1 1 1 1New Mexico 2 0 0 0 2 0Oregon 0 0 0 0 0 0Utah 0 0 0 0 0 0Washington 1 2 0 1 1 2Wyoming 0 1 0 0 0 1
a/Includes facilities operated by both federal and state authorities.b/Includes private facilities.
2005For any reason To limit population
d/The total number of facilities in 2005 were reported by the Illinois Department of Corrections as of June 30.
Appendix table 6. Number of correctional facilities under state or federal authority, under court order or consent decree, June 30, 2000, and December 30, 2005
c/The total number of facilities in 2005 are as of June 30.
Region and authority
e/As of December 30, 2001, sentenced felons from the District of Columbia were the reponsibility of the Federal Bureau of Prisons. Some inmates were housed in private facilities under contract to the District of Columbia on December 30, 2005.
2000 2005For specific conditions
2005 20002000

Region and authority100-249
250-499
500-999
1,000-1,499
1,500 or more
Not available
U.S. total 19 8 6 2 1 7 1
Public 1 4 6 2 1 6 1Private 18 4 0 0 0 1 0
State* 19 8 6 2 1 7 1
Region (excluding federal)Northeast 3 1 0 0 0 0 0
Connecticut 3 0 0 0 0 0 0Vermont 0 1 0 0 0 0 0
Midwest 3 2 0 0 0 3 0Indiana 0 0 0 0 0 1 0Kansas 0 0 0 0 0 1 0Michigan 2 0 0 0 0 0Minnesota 1 0 0 0 0 0 0Missouri 0 0 0 0 0 1 0Ohio 0 2 0 0 0 0 0
South 5 4 6 2 0 4 0Alabama 0 0 3 0 0 0 0Georgia 1 0 0 0 0 1 0Mississippi 0 0 0 0 0 3 0North Carolina 0 2 3 2 0 0 0Oklahoma 0 2 0 0 0 0 0Tennessee 1 0 0 0 0 0 0Texas 2 0 0 0 0 0 0West Virginia 1 0 0 0 0 0 0
West 8 1 0 0 1 0 1Alaska 2 0 0 0 0 0 0Arizona 1 0 0 0 0 0 0California 0 0 0 0 0 0 1Colorado 4 0 0 0 0 0 0Idaho 0 0 0 0 1 0 0Nevada 0 1 0 0 0 0 0Washington 1 0 0 0 0 0 0
Appendix table 7. Number of correctional facilities under state or federal authority under court order or consent decree to limit population, by facility size, December 30, 2005
*Includes private facilities.
Fewer than 100
Facility size based on average daily population

2005
U.S. total 264 415 91,184 105,451Federal 26 132 14,841 22,801State 238 283 76,343 82,650
Region (excluding federal)Northeast 28 61 3,130 4,619
Connecticut 0 30 0 1,029Maine 0 0 0 0Massachusetts 2 0 21 0New Hampshire 0 0 0 0New Jersey 21 21 2,608 2,577New York 0 0 0 0Pennsylvania 5 10 501 1,013Rhode Island 0 0 0 0Vermont 0 0 0 0
Midwest 10 48 4,240 6,468Illinois 1 3 293 197Indiana 1 1 108 19Iowa 1 0 48 0Kansas 2 2 171 192Michigan 0 3 0 99Minnesota 1 6 1,078 1,070Missouri 0 0 0 0Nebraska 0 0 0 0North Dakota 0 3 0 155Ohio 3 28 2,470 4,709South Dakota 1 0 72 0Wisconsin 0 2 0 27
South 98 92 51,176 53,000Alabama 1 0 60 0Arkansas 1 0 1,246 0Delaware 0 0 0 0District of Columbia* 4 5 405 300Florida 8 15 3,819 5,739Georgia 5 3 3,059 4,644Kentucky 12 12 2,301 2,785Louisiana 7 8 3,487 3,580Maryland 3 4 120 167Mississippi 5 6 3,625 5,683North Carolina 1 3 20 207Oklahoma 14 14 8,502 7,802South Carolina 0 0 0 0Tennessee 3 3 4,974 5,087Texas 33 17 18,009 15,131Virginia 1 2 1,549 1,875West Virginia 0 0 0 0
West 102 82 17,797 18,563Alaska 11 8 641 653Arizona 6 4 2,119 2,391California 43 16 5,895 2,658Colorado 24 33 4,290 6,195Hawaii 2 2 40 100Idaho 1 1 70 1,250Montana 5 8 672 1,367Nevada 1 0 546 0New Mexico 3 4 1,920 3,566Utah 1 0 325 0Washington 0 3 0 149Wyoming 5 3 1,279 234
Appendix table 8. Number of private correctional facilities under contract to state or federal authorities and average daily population, June 30, 2000, and December 30, 2005
Average daily population
Note: Private correctional facilities are staffed and managed by private correctional employees and paid by pubilc authorities through contractual agreements.*As of December 30, 2001, sentenced felons from the District of Columbia were the reponsibility of the Federal Bureau of Prisons. Some inmates were housed in private facilities under contract to the District of Columbia on December 30, 2005.
Number of facilities2000 2000 2005Region and authority
U.S. total 271 75 36 31 2
Federal 113 10 0 7 2State 158 65 36 24 0
Region (excluding federal)Northeast 50 9 2 0 0
Connecticut 29 1 0 0 0Maine 0 0 0 0 0Massachusetts 0 0 0 0 0New Hampshire 0 0 0 0 0New Jersey 15 4 2 0 0New York 0 0 0 0 0Pennsylvania 6 4 0 0 0Rhode Island 0 0 0 0 0Vermont 0 0 0 0 0
Midwest 34 10 3 1 0Illinois 2 1 0 0 0Indiana 1 0 0 0 0Iowa 0 0 0 0 0Kansas 1 1 0 0 0Michigan 3 0 0 0 0Minnesota 5 0 1 0 0Missouri 0 0 0 0 0Nebraska 0 0 0 0 0North Dakota 3 0 0 0 0Ohio 17 8 2 1 0South Dakota 0 0 0 0 0Wisconsin 2 0 0 0 0
South 33 20 20 19 0Alabama 0 0 0 0 0Arkansas 0 0 0 0 0Delaware 0 0 0 0 0District of Columbia* 4 1 0 0 0Florida 7 3 3 2 0Georgia 0 0 0 3 0Kentucky 7 3 2 0 0Louisiana 4 2 0 2 0Maryland 4 0 0 0 0Mississippi 0 0 5 1 0North Carolina 3 0 0 0 0Oklahoma 3 6 3 2 0South Carolina 0 0 0 0 0Tennessee 0 0 0 3 0Texas 0 5 7 5 0Virginia 1 0 0 1 0West Virginia 0 0 0 0 0
West 41 26 11 4 0Alaska 5 3 0 0 0Arizona 0 2 2 0 0California 9 4 3 0 0Colorado 18 11 3 1 0Hawaii 2 0 0 0 0Idaho 0 0 0 1 0Montana 2 5 1 0 0Nevada 0 0 0 0 0New Mexico 0 0 2 2 0Oregon 0 0 0 0 0Utah 0 0 0 0 0Washington 3 0 0 0 0Wyoming 2 1 0 0 0
Appendix table 9. Number of private correctional facilities under contract to state or federal authorities, by facility size, December 30, 2005
Facility size based on average daily population
*As of December 30, 2001, sentenced felons from the District of Columbia were the reponsibility of the Federal Bureau of Prisons. Some inmates were housed in private facilities under contract to the District of Columbia on December 30, 2005.
Note: Private correctional facilities are staffed and managed by private correctional employees and paid by pubilc authorities through contractual agreements.
2500 or more1,000-2,499500-999100-499Fewer than 100Region and authority

Total Total
U.S. total 1,430,208 1,317,492 97,205 15,511 1,375,975 1,273,594 91,697 10,684 54,233 43,881 5,525 4,827
Public/a 1,321,757 1,225,190 90,283 6,284 1,290,371 1,196,922 87,453 5,996 31,386 28,251 2,847 288Private 108,451 92,302 6,922 9,227 85,604 76,672 4,244 4,688 22,847 15,630 2,678 4,539
Federal 145,780 137,436 8,344 0 145,780 137,436 8,344 0 0 0 0 0State/b 1,284,428 1,180,056 88,861 15,511 1,230,195 1,136,158 83,353 10,684 54,233 43,881 5,525 4,827
Region (excluding federal)Northeast 171,465 159,517 8,984 2,964 164,271 154,660 8,569 1,042 7,194 4,947 424 1,823
Connecticut 19,019 17,249 1,402 368 18,008 16,693 1,297 18 1,011 556 105 350Maine 1,968 1,843 125 0 1,900 1,777 123 0 68 66 2 0Massachusetts/c 10,262 9,398 782 82 9,692 8,910 782 0 570 488 0 82New Hampshire 2,373 2,235 138 0 2,223 2,123 100 0 150 112 38 0New Jersey 25,724 23,387 1,332 1,005 23,714 22,087 1,127 500 2,010 1,300 205 505New York 63,855 60,803 2,873 179 62,011 59,156 2,855 0 1,844 1,647 18 179Pennsylvania 43,254 40,280 1,994 980 41,812 39,691 1,947 174 1,442 589 47 806Rhode Island 3,414 3,226 188 0 3,414 3,226 188 0 0 0 0 0Vermont 1,596 1,096 150 350 1,497 997 150 350 99 99 0 0
Midwest 255,134 232,976 17,462 4,696 247,020 226,882 16,127 4,011 8,114 6,077 1,352 685Illinois/d 44,669 41,848 2,821 0 43,859 41,162 2,697 0 810 669 141 0Indiana 23,205 21,282 1,923 0 22,807 20,970 1,837 0 398 312 86 0Iowa 10,145 8,946 1,002 197 8,721 7,921 800 0 1,424 1,025 202 197Kansas 9,474 8,693 742 39 9,231 8,521 710 0 243 172 32 39Michigan 50,082 47,440 2,128 514 49,766 47,231 2,076 459 316 209 52 55Minnesota 9,680 9,061 552 67 9,535 8,950 518 67 145 111 34 0Missouri 31,748 29,075 2,560 113 31,025 28,535 2,490 0 723 540 70 113Nebraska 4,371 3,961 410 0 3,921 3,598 323 0 450 363 87 0North Dakota 1,411 1,196 143 72 1,178 1,064 114 0 233 132 29 72Ohio 44,717 39,165 3,470 2,082 42,816 37,667 3,190 1,959 1,901 1,498 280 123South Dakota 3,451 3,041 336 74 3,321 2,997 324 0 130 44 12 74Wisconsin 22,181 19,268 1,375 1,538 20,840 18,266 1,048 1,526 1,341 1,002 327 12
South 561,927 517,213 39,599 5,115 533,833 493,213 36,837 3,783 28,094 24,000 2,762 1,332Alabama 23,174 21,871 1,178 125 20,126 19,224 902 0 3,048 2,647 276 125Arkansas 13,921 12,849 1,072 0 13,267 12,204 1,063 0 654 645 9 0Delaware 6,781 6,212 488 81 5,932 5,433 418 81 849 779 70 0District of Columbia/e 300 238 … 62 0 0 0 0 300 238 … 62Florida 86,705 80,775 5,930 0 83,126 77,715 5,411 0 3,579 3,060 519 0Georgia 51,822 47,668 3,568 586 48,729 45,093 3,219 417 3,093 2,575 349 169Kentucky 14,932 13,508 1,424 0 13,962 12,719 1,243 0 970 789 181 0Louisiana 20,344 19,109 1,235 0 19,828 18,666 1,162 0 516 443 73 0Maryland 22,613 21,055 1,031 527 21,846 20,431 1,031 384 767 624 0 143Mississippi 16,967 15,330 1,591 46 16,921 15,330 1,591 0 46 0 0 46North Carolina 38,233 35,469 2,644 120 36,998 34,422 2,576 0 1,235 1,047 68 120Oklahoma 25,149 22,785 2,364 0 22,186 20,459 1,727 0 2,963 2,326 637 0South Carolina 22,537 20,945 1,497 95 21,127 19,630 1,497 0 1,410 1,315 0 95Tennessee 19,484 16,189 1,176 2,119 19,247 16,115 1,162 1,970 237 74 14 149Texas 163,556 151,594 11,673 289 156,325 144,998 11,327 0 7,231 6,596 346 289Virginia 31,478 29,124 2,292 62 30,544 28,439 2,105 0 934 685 187 62West Virginia 3,931 2,492 436 1,003 3,669 2,335 403 931 262 157 33 72
West 295,902 270,350 22,816 2,736 285,071 261,403 21,820 1,848 10,831 8,947 996 888Alaska 4,146 2,456 376 1,314 3,753 2,100 339 1,314 393 356 37 0Arizona 32,855 29,850 2,919 86 32,596 29,699 2,897 0 259 151 22 86California 169,988 158,603 11,367 18 168,518 157,252 11,266 0 1,470 1,351 101 18Colorado 20,842 18,270 1,952 620 18,236 16,589 1,647 0 2,606 1,681 305 620Hawaii 3,951 3,383 568 0 3,837 3,329 508 0 114 54 60 0Idaho 5,975 5,450 514 11 5,609 5,193 416 0 366 257 98 11Montana 3,160 2,743 417 0 2,482 2,196 286 0 678 547 131 0Nevada 11,726 10,772 939 15 11,132 10,198 934 0 594 574 5 15New Mexico 7,183 6,458 672 53 6,733 6,072 661 0 450 386 11 53Oregon 13,049 11,506 1,009 534 11,119 9,596 989 534 1,930 1,910 20 0Utah 5,461 4,872 504 85 5,057 4,610 447 0 404 262 57 85Washington 16,146 14,712 1,434 0 15,045 13,731 1,314 0 1,101 981 120 0Wyoming 1,420 1,275 145 0 954 838 116 0 466 437 29 0
… Not available.
b/Includes private facilities.c/Excludes inmates with sentences greater than one year held in local jails and houses of correction.d/Confinement and community-based figures are estimated based on total population reported by the Department of Corrections as of June 30, 2005 and proportions of inmates housed in confinement and community-based facilities on June 30, 2000.e/As of December 30, 2001, sentenced felons from the District of Columbia were the reponsibility of the Federal Bureau of Prisons. Some inmates were housed in private facilities under contract to the District of Columbia on December 30, 2005.
a/Includes facilities operated by both federal and state authorities.
WomenMen MenWomenMenTotal
Appendix table 10. Number of inmates in correctional facilities under state or federal authority, by gender and type of facility, December 30, 2005
Region and authority
Community-based facilitiesConfinement facilitiesAll facilitiesNot reported
Not reported
Not reportedWomen

2000 2005 2000 2005 2000 2005 2000 2005
U.S. total 1,305,253 1,427,316 442,970 513,095 608,116 605,202 254,167 309,019
Public/c 1,212,176 1,318,816 438,506 506,190 554,846 565,230 218,824 247,396Private 93,077 108,500 4,464 6,905 53,270 39,972 35,343 61,623
Federal 110,974 145,780 16,181 21,855 39,534 59,171 55,259 64,754State/d 1,194,279 1,281,536 426,789 491,240 568,582 546,031 198,908 244,265
Region (excluding federal)Northeast 171,999 171,465 58,818 64,419 91,087 85,817 22,094 21,229
Connecticut 16,984 19,019 8,997 10,313 4,859 3,801 3,128 4,905Maine 1,629 1,968 508 879 676 722 445 367Massachusetts/e 10,500 10,262 2,404 2,395 6,888 6,902 1,208 965New Hampshire 2,277 2,373 1,476 1,334 660 628 141 411New Jersey 27,118 25,724 5,595 5,686 16,945 16,071 4,578 3,967New York 71,938 63,855 23,596 24,021 41,387 36,033 6,955 3,801Pennsylvania 36,895 43,254 14,814 18,142 17,145 19,141 4,936 5,971Rhode Island 3,347 3,414 1,428 1,649 1,405 1,171 514 594Vermont 1,311 1,596 / / 1,122 1,348 189 248
Midwest 233,993 252,242 75,724 98,565 102,902 106,508 55,367 47,169Illinois/f 44,150 41,777 13,063 9,576 18,127 22,441 12,960 9,760Indiana 18,195 23,205 2,048 6,726 12,828 15,267 3,319 1,212Iowa 9,086 10,145 2,086 2,317 5,068 5,905 1,932 1,923Kansas 8,992 9,474 7,256 7,487 842 779 894 1,208Michigan 47,639 50,082 14,674 22,017 11,552 12,918 21,413 15,147Minnesota 7,451 9,680 3,083 3,764 4,368 5,140 / 776Missouri 27,963 31,748 10,392 20,345 11,747 6,701 5,824 4,702Nebraska 3,508 4,371 2,200 3,389 679 532 629 450North Dakota 992 1,411 628 536 216 384 148 491Ohio 47,915 44,717 14,840 14,549 27,154 22,207 5,921 7,961South Dakota 2,591 3,451 / 1,836 2,517 1,485 74 130Wisconsin 15,511 22,181 5,454 6,023 7,804 12,749 2,253 3,409
South 518,912 561,927 212,144 241,408 227,710 209,127 79,058 111,392Alabama 22,422 23,174 5,736 5,541 10,655 12,729 6,031 4,904Arkansas 10,465 13,921 2,123 982 7,363 10,867 979 2,072Delaware 6,023 6,781 2,283 4,332 2,814 1,246 926 1,203District of Columbia/g 3,767 300 416 0 2,758 0 593 300Florida 71,616 86,705 62,876 77,210 4,103 5,405 4,637 4,090Georgia 44,299 51,822 21,762 23,462 17,604 20,506 4,933 7,854Kentucky 12,378 14,932 1,477 3,093 8,793 9,215 2,108 2,624Louisiana 19,167 20,344 9,818 10,108 8,246 9,078 1,103 1,158Maryland 22,821 22,613 7,346 3,630 9,773 12,376 5,702 6,607Mississippi 14,823 16,967 2,767 5,364 10,692 9,784 1,364 1,819North Carolina 30,708 38,233 8,714 11,089 12,329 15,145 9,665 11,999Oklahoma 23,858 25,149 3,707 2,436 12,308 13,018 7,843 9,695South Carolina 21,277 22,537 6,932 9,408 8,671 9,740 5,674 3,389Tennessee 18,368 19,484 3,075 10,242 14,911 8,617 382 625Texas 162,440 163,556 60,711 60,395 82,871 55,930 18,858 47,231Virginia 31,412 31,478 10,353 12,717 13,369 14,961 7,690 3,800West Virginia 3,068 3,931 2,048 1,399 450 510 570 2,022
West 269,375 295,902 80,103 86,848 146,883 144,579 42,389 64,475Alaska 3,248 4,146 1,302 2,075 891 1,344 1,055 727Arizona 30,832 32,855 13,572 24,649 10,626 3,896 6,634 4,310California 163,383 169,988 44,939 30,539 101,376 99,424 17,068 40,025Colorado 15,695 20,842 5,474 6,517 5,993 8,685 4,228 5,640Hawaii 3,761 3,951 / 1,453 3,054 1,880 707 618Idaho 3,961 5,975 856 854 1,363 3,167 1,742 1,954Montana 2,368 3,160 1,376 1,729 422 595 570 836Nevada 9,296 11,726 1,022 1,082 6,435 8,226 1,839 2,418New Mexico 5,158 7,183 680 1,976 3,347 3,715 1,131 1,492Oregon 9,933 13,049 1,926 3,596 6,127 7,167 1,880 2,286Utah 4,872 5,461 / 3,922 4,170 1,135 702 404Washington 14,682 16,146 7,985 7,749 2,462 5,345 4,235 3,052Wyoming 2,186 1,420 971 707 617 / 598 713
c/Includes facilities operated by both federal and state authorities.d/Includes private facilities.
Appendix table 11. Number of inmates in correctional facilities under state or federal authority, by facility security level, June 30, 2000, and December 30, 2005
All inmates Maximum/a Medium Minimum/bNumber of inmates in facilities with the security level of --
Region and authority
e/Security level is estimated based on information reported as of June 30, 2000.
g/As of December 30, 2001, sentenced felons from the District of Columbia were the reponsibility of the Federal Bureau of Prisons. Some inmates were housed in private facilities under contract to the District of Columbia on December 30, 2005.
/No one facility under state authority was reported to operate predominately at one (maximum, medium, or minimum) security level.Note: Security level refers to the overall physical security rating of the facility, rather than the custody classification of the inmates housed in them.
a/Includes facilities classified as super maximum, close, or high security.b/Includes facilities classified as low or no security level designated.
f/Excludes 2,892 inmates in Illinois in 2005 for whom facility security information could not be estimated.

Correctional officers
Total facilities Female
U.S. total (estimated)/a 445,055 296,852 148,203 295,261 221,446 73,815U.S. total (reported) 1,821 1,717 419,637 280,011 139,626 278,398 209,099 69,299
Public/b 1,406 1,317 393,699 266,453 127,246 262,718 200,025 62,693Private 415 400 25,938 13,558 12,380 15,680 9,074 6,606
Federal 102 97 29,755 21,985 7,770 14,165 12,346 1,819State/c 1,719 1,620 389,882 258,026 131,856 264,233 196,753 67,480
Region (excluding federal)Northeast 268 262 70,215 54,050 16,165 47,544 42,086 5,458
Connecticut 49 49 6,402 4,828 1,574 4,516 3,750 766Maine 7 7 834 673 161 572 530 42Massachusetts/d 17 17 4,057 3,402 655 3,309 2,944 365New Hampshire 8 8 876 642 234 545 462 83New Jersey 42 36 9,277 6,880 2,397 6,650 5,621 1,029New York 77 77 31,573 24,430 7,143 21,331 19,237 2,094Pennsylvania 52 52 15,195 11,597 3,598 9,083 8,182 901Rhode Island 7 7 1,161 979 182 947 863 84Vermont 9 9 840 619 221 591 497 94
Midwest 342 338 85,256 58,403 26,853 55,322 43,305 12,017Illinois/e 44 40 14,167 10,284 3,883 8,771 7,424 1,347Indiana 23 23 6,310 4,223 2,087 4,264 3,091 1,173Iowa 31 31 3,399 2,310 1,089 2,107 1,673 434Kansas 13 13 2,984 2,085 899 1,944 1,544 400Michigan 62 62 21,202 15,038 6,164 15,235 12,024 3,211Minnesota 18 18 3,611 2,280 1,331 2,131 1,572 559Missouri 28 28 9,439 6,047 3,392 5,625 4,123 1,502Nebraska 9 9 1,812 1,279 533 1,261 983 278North Dakota 8 8 625 411 214 394 284 110Ohio 59 59 13,318 9,009 4,309 8,167 6,337 1,830South Dakota 6 6 804 517 287 473 360 113Wisconsin 41 41 7,585 4,920 2,665 4,950 3,890 1,060
South 779 775 148,923 88,100 60,823 108,036 69,807 38,229Alabama 33 33 3,250 2,372 878 2,489 2,061 428Arkansas 26 26 3,559 2,019 1,540 2,713 1,706 1,007Delaware 12 12 1,639 1,208 431 1,363 1,085 278District of Columbia/f 5 5 123 69 54 51 33 18Florida 109 107 23,038 14,105 8,933 17,827 12,065 5,762Georgia 87 87 14,301 7,751 6,550 9,670 5,648 4,022Kentucky 25 25 3,946 2,536 1,410 2,474 1,833 641Louisiana 23 23 5,921 3,281 2,640 4,710 2,866 1,844Maryland 29 29 7,160 4,421 2,739 5,384 3,498 1,886Mississippi 31 31 3,934 1,464 2,470 2,932 1,076 1,856North Carolina 88 88 15,106 9,328 5,778 11,388 7,793 3,595Oklahoma 53 53 5,075 3,198 1,877 2,871 2,162 709South Carolina 33 33 5,051 2,741 2,310 3,698 2,180 1,518Tennessee 19 19 6,279 3,969 2,310 4,205 2,960 1,245Texas 132 132 38,097 22,218 15,879 27,737 17,135 10,602Virginia 59 57 10,697 6,262 4,435 7,599 4,947 2,652West Virginia 15 15 1,747 1,158 589 925 759 166
West 330 245 85,488 57,473 28,015 53,331 41,555 11,776Alaska 21 21 1,339 959 380 896 713 183Arizona 21 21 8,235 5,612 2,623 6,519 4,812 1,707California/g 100 100 47,881 31,610 16,271 27,803 21,637 6,166Colorado 58 58 6,902 4,479 2,423 4,394 3,160 1,234Hawaii 10 10 1,724 1,287 437 1,251 1,051 200Idaho 15 15 1,473 976 497 971 732 239Montana 11 11 1,211 829 382 700 547 153Nevada 22 22 2,313 1,682 631 1,589 1,334 255New Mexico 11 11 2,632 1,851 781 1,848 1,467 381Oregon 15 15 3,739 2,621 1,118 2,318 1,954 364Utah 7 7 1,380 1,073 307 1,073 952 121Washington 32 32 6,064 4,139 1,925 3,599 2,944 655Wyoming 7 7 595 355 240 370 252 118
g/Includes employees from the Califiornia Department of Corrections, 4th quarter 2005; and private employees as reported in the BJS 2005 Census of State and Federal Correctional Facilities. Numbers of men and women are based on the proportionate weighting of the number of male and female employees in the 2000 Census.
f/As of December 30, 2001, sentenced felons from the District of Columbia were the reponsibility of the Federal Bureau of Prisons. Some inmates were housed in private facilities under contract to the District of Columbia on December 30, 2005.
e/Includes public staff from the Illinois Department of Corrections, June 30, 2005 and private staff figures as reported in the BJS 2005 Census of State and Federal Correctional Facilities. Numbers of men and women are based on the proportionate weighting of the number of male and female employees in the 2000 Census.
Male Total Facilities reporting employees by gender
c/Includes private facilities.b/Includes facilities operated by both federal and state authorities.
Region and authority
a/To estimate the total number of employees, the total number of facilities nationwide was divided by the number of facilities reporting employees and multiplied by the reported number of employees.
d/The total number of facilities in 2005 are as of June 30.
Female
Note: Includes all full-time, parttime, payroll, nonpayroll, and contract staff. Excludes community volunteers.
Appendix table 12. All employees and correctional officers in correctional facilities under state or federal authority, by gender, December 30, 2005
Male Total
Employees

Other/Not available
U.S. total (estimated)/a 445055 10769 295261 51993 11526 46016 29489U.S. total (reported) 1,821 1,717 419,637 10,154 278,398 49,024 10,868 43,388 27,805
Public/b 1,406 1,317 393,699 8,290 262,718 46,481 9,827 39,618 26,765Private 415 400 25,938 1,864 15,680 2,543 1,041 3,770 1,040
Federal 102 97 29,755 900 14,165 6,216 922 4,855 2,697State/c 1,719 1,620 389,882 9,254 264,233 42,808 9,946 38,533 25,108
Region (excluding federal)Northeast 268 262 70,215 1,381 47,544 9,621 2,754 7,715 1,200
Connecticut 49 49 6,402 118 4,516 708 239 652 169Maine 7 7 834 41 572 96 42 83 0Massachusetts/d 17 17 4,057 131 3,309 297 32 246 42New Hampshire 8 8 876 54 545 60 32 145 40New Jersey 42 36 9,277 232 6,650 686 550 942 217New York 77 77 31,573 565 21,331 4,820 1,140 3,272 445Pennsylvania 52 52 15,195 175 9,083 2,845 664 2,169 259Rhode Island 7 7 1,161 17 947 70 14 109 4Vermont 9 9 840 48 591 39 41 97 24
Midwest 342 338 85,256 2,702 55,322 12,567 2,580 10,496 1,589Illinois/e 44 40 14,167 582 8,771 2,169 658 1,606 381Indiana 23 23 6,310 227 4,264 912 177 678 52Iowa 31 31 3,399 131 2,107 547 37 551 26Kansas 13 13 2,984 108 1,944 438 32 427 35Michigan 62 62 21,202 191 15,235 2,839 423 2,503 11Minnesota 18 18 3,611 110 2,131 545 130 648 47Missouri 28 28 9,439 156 5,625 1,791 300 987 580Nebraska 9 9 1,812 89 1,261 229 25 155 53North Dakota 8 8 625 40 394 86 15 88 2Ohio 59 59 13,318 702 8,167 1,934 447 1,749 319South Dakota 6 6 804 19 473 82 31 195 4Wisconsin 41 41 7,585 347 4,950 995 305 909 79
South 779 775 148,923 3,753 108,036 15,893 3,703 15,385 2,153Alabama 33 33 3,250 184 2,489 386 0 179 12Arkansas 26 26 3,559 66 2,713 677 3 94 6Delaware 12 12 1,639 33 1,363 120 22 89 12District of Columbia/f 5 5 123 14 51 23 . 24 11Florida 109 107 23,038 294 17,827 692 408 3,589 228Georgia 87 87 14,301 553 9,670 1,993 293 1,331 461Kentucky 25 25 3,946 237 2,474 424 129 586 96Louisiana 23 23 5,921 142 4,710 324 59 480 206Maryland 29 29 7,160 85 5,384 809 133 522 227Mississippi 31 31 3,934 167 2,932 262 97 339 137North Carolina 88 88 15,106 412 11,388 1,056 215 1,742 293Oklahoma 53 53 5,075 273 2,871 804 154 895 78South Carolina 33 33 5,051 236 3,698 607 98 412 0Tennessee 19 19 6,279 232 4,205 674 241 723 204Texas 132 132 38,097 627 27,737 5,065 1,333 3,250 85Virginia 59 57 10,697 118 7,599 1,691 374 876 39West Virginia 15 15 1,747 80 925 286 144 254 58
West 330 245 85,488 1,418 53,331 4,727 909 4,937 20,166Alaska 21 21 1,339 68 896 152 30 174 19Arizona 21 21 8,235 161 6,519 524 167 859 5California/g 100 100 47,881 47 27,803 128 40 230 19,633Colorado 58 58 6,902 362 4,394 885 242 776 243Hawaii 10 10 1,724 18 1,251 245 25 164 21Idaho 15 15 1,473 58 971 146 51 209 38Montana 11 11 1,211 96 700 192 33 183 7Nevada 22 22 2,313 47 1,589 221 35 398 23New Mexico 11 11 2,632 147 1,848 269 123 211 34Oregon 15 15 3,739 144 2,318 630 103 478 66Utah 7 7 1,380 28 1,073 141 23 83 32Washington 32 32 6,064 201 3,599 1,094 16 1,114 40Wyoming 7 7 595 41 370 100 21 58 5
a/To estimate the total number of employees, the total number of facilities nationwide was divided by the number of facilities reporting employees and multiplied by the reported number of employees.
c/Includes private facilities.
Appendix table 13. Number of employees in correctional facilities under state or federal authority, by occupational category, December 30, 2005
Educational
b/Includes facilities operated by both federal and state authorities.
Note: Includes all full-time, part time, payroll, nonpayroll, and contract employees. Excludes community volunteers.
Correctional employeesFacilities reporting staff
Total facilities
Professional/technicalRegion and authority
Clerical/maintenance/food service
Correctional officersAdministratorsAll employees
d/The total number of facilities in 2005 are as of June 30.
f/As of December 30, 2001, sentenced felons from the District of Columbia were the reponsibility of the Federal Bureau of Prisons. Some inmates were housed in private facilities under contract to the District of Columbia on December 30, 2005.
e/Includes public staff from the Illinois Department of Corrections, June 30, 2005 and private staff figures as reported in the BJS 2005 Census of State and Federal Correctional Facilities. Numbers of men and women are based on the proportionate weighting of the number of male and female employees in the 2000 Census.
g/Includes employees from the California Department of Corrections, 4th quarter 2005; and private employees as reported in the BJS 2005 Census of State and Federal Correctional Facilities. Numbers of men and women are based on the proportionate weighting of the number of male and female employees in the 2000 Census.

Inmates per employee 2000 2005 2000 2005 2000 2005 2000 2005 2000 2005
U.S. total (estimated)/a 445,055 295,261U.S. total (reported) 1,305,253 1,430,208 430,033 419,637 270,317 278,398 3.0 3.4 4.8 5.1
Public/b 1,212,176 1,321,685 405,676 393,699 255,728 262,718 3.0 3.4 4.7 5.0Private 93,077 108,523 24,357 25,938 14,589 15,680 3.8 4.2 6.4 6.9
Federal 110,974 145,780 32,700 29,755 12,376 14,165 3.4 4.9 9.0 10.3State/c 1,194,279 1,284,428 397,333 389,882 257,941 264,233 3.0 3.3 4.6 4.9
Region (excluding federal)Northeast 171,999 171,465 72,758 70,215 47,496 47,544 2.4 2.4 3.6 3.6
Connecticut 16,984 19,019 6,670 6,402 4,488 4,516 2.5 3.0 3.8 4.2Maine 1,629 1,968 960 834 571 572 1.7 2.4 2.9 3.4Massachusetts/d 10,500 10,262 5,834 4,057 3,875 3,309 1.8 2.5 2.7 3.1New Hampshire 2,277 2,373 1,103 876 612 545 2.1 2.7 3.7 4.4New Jersey 27,118 25,724 9,722 9,277 6,626 6,650 2.8 2.8 4.1 3.9New York 71,938 63,855 33,050 31,573 22,108 21,331 2.2 2.0 3.3 3.0Pennsylvania 36,895 43,254 13,493 15,195 7,800 9,083 2.7 2.8 4.7 4.8Rhode Island 3,347 3,414 1,214 1,161 960 947 2.8 2.9 3.5 3.6Vermont 1,311 1,596 712 840 456 591 1.8 1.9 2.9 2.7
Midwest 233,993 255,134 82,808 85,256 50,580 55,322 2.8 3.0 4.6 4.6Illinois/e 44,150 44,669 15,127 14,167 9,346 8,771 2.9 3.2 4.7 5.1Indiana 18,195 23,205 6,745 6,310 4,040 4,264 2.7 3.7 4.5 5.4Iowa 9,086 10,145 3,675 3,399 2,145 2,107 2.5 3.0 4.2 4.8Kansas 8,992 9,474 3,731 2,984 1,960 1,944 2.4 3.2 4.6 4.9Michigan 47,639 50,082 17,530 21,202 11,721 15,235 2.7 2.4 4.1 3.3Minnesota 7,451 9,680 3,478 3,611 1,957 2,131 2.1 2.7 3.8 4.5Missouri 27,963 31,748 9,297 9,439 5,448 5,625 3.0 3.4 5.1 5.6Nebraska 3,508 4,371 1,252 1,812 709 1,261 2.8 2.4 4.9 3.5North Dakota 992 1,411 321 625 257 394 3.1 2.3 3.9 3.6Ohio 47,915 44,717 15,762 13,318 9,372 8,167 3.0 3.4 5.1 5.5South Dakota 2,591 3,451 567 804 338 473 4.6 4.3 7.7 7.3Wisconsin 15,511 22,181 5,323 7,585 3,287 4,950 2.9 2.9 4.7 4.5
South 518,912 561,927 160,580 148,923 109,443 108,036 3.2 3.8 4.7 5.2Alabama 22,422 23,174 3,295 3,250 2,367 2,489 6.8 7.1 9.5 9.3Arkansas 10,465 13,921 2,626 3,559 2,195 2,713 4.0 3.9 4.8 5.1Delaware 6,023 6,781 1,863 1,639 1,429 1,363 3.2 4.1 4.2 5.0District of Columbia/f 3,767 300 1,562 123 1,238 51 2.4 2.4 3.0 5.9Florida 71,616 86,705 24,891 23,038 19,133 17,827 2.9 3.8 3.7 4.9Georgia 44,299 51,822 14,270 14,301 9,084 9,670 3.1 3.6 4.9 5.4Kentucky 12,378 14,932 3,746 3,946 2,377 2,474 3.3 3.8 5.2 6.0Louisiana 19,167 20,344 6,065 5,921 4,782 4,710 3.2 3.4 4.0 4.3Maryland 22,821 22,613 8,181 7,160 5,765 5,384 2.8 3.2 4.0 4.2Mississippi 14,823 16,967 4,403 3,934 3,143 2,932 3.4 4.3 4.7 5.8North Carolina 30,708 38,233 13,959 15,106 10,162 11,388 2.2 2.5 3.0 3.4Oklahoma 23,858 25,149 6,274 5,075 3,453 2,871 3.8 5.0 6.9 8.8South Carolina 21,277 22,537 6,222 5,051 4,142 3,698 3.4 4.5 5.1 6.1Tennessee 18,368 19,484 5,876 6,279 3,697 4,205 3.1 3.1 5.0 4.6Texas 162,440 163,556 43,678 38,097 27,424 27,737 3.7 4.3 5.9 5.9Virginia 31,412 31,478 12,133 10,697 8,246 7,599 2.6 2.9 3.8 4.1West Virginia 3,068 3,931 1,536 1,747 806 925 2.0 2.3 3.8 4.2
West 269,375 295,902 81,187 85,488 50,422 53,331 3.3 3.5 5.3 5.5Alaska 3,248 4,146 1,310 1,339 821 896 2.5 3.1 4.0 4.6Arizona 30,832 32,855 10,513 8,235 7,436 6,519 2.9 4.0 4.1 5.0California/g 163,383 169,988 43,494 47,881 25,270 27,803 3.8 3.6 6.5 6.1Colorado 15,695 20,842 6,057 6,902 4,406 4,394 2.6 3.0 3.6 4.7Hawaii 3,761 3,951 1,805 1,724 1,229 1,251 2.1 2.3 3.1 3.2Idaho 3,961 5,975 1,290 1,473 795 971 3.1 4.1 5.0 6.2Montana 2,368 3,160 1,086 1,211 583 700 2.2 2.6 4.1 4.5Nevada 9,296 11,726 1,937 2,313 1,293 1,589 4.8 5.1 7.2 7.4New Mexico 5,158 7,183 2,356 2,632 1,469 1,848 2.2 2.7 3.5 3.9Oregon 9,933 13,049 3,262 3,739 1,993 2,318 3.0 3.5 5.0 5.6Utah 4,872 5,461 1,576 1,380 893 1,073 3.1 4.0 5.5 5.1Washington 14,682 16,146 5,678 6,064 3,757 3,599 2.6 2.7 3.9 4.5Wyoming 2,186 1,420 823 595 477 370 2.7 2.4 4.6 3.8
Appendix table 14. Number of inmates, employees, and inmate-to-staff ratios in correctional facilities under state or federal authority, June 30, 2000, and December 30, 2005
Correctional officersTotal employees Inmates per correctional officerNumber of inmates
Correctional facility employees
g/Includes employees from the Califiornia Department of Corrections, 4th quarter 2005; and private employees as reported in the BJS 2005 Census of State and Federal Correctional Facilities. Numbers of men and women are based on the proportionate weighting of the number of male and female employees in the 2000 Census.
f/As of December 30, 2001, sentenced felons from the District of Columbia were the reponsibility of the Federal Bureau of Prisons. Some inmates were housed in private facilities under contract to the District of Columbia on December 30, 2005.
b/Includes facilities operated by both federal and state authorities.
e/Includes public staff from the Illinois Department of Corrections, June 30, 2005 and private staff figures as reported in the BJS 2005 Census of State and Federal Correctional Facilities. Numbers of men and women are based on the proportionate weighting of the number of male and female employees in the 2000 Census.
Note: Includes all full-time, part time, payroll, nonpayroll, and contract employees. Excludes community volunteers.
Region and authority
c/Includes private facilities.d/The total number of facilities in 2005 are as of June 30.
a/To estimate the total number of employees, the total number of facilities nationwide was divided by the number of facilities reporting employees and multiplied by the reported number of employees.

U.S. total 1,373,182 357,391 3.8 242,387 5.7 54,134 15,487 3.5
Public/a 1,287,601 339,030 3.8 230,381 5.6 31,215 7,910 3.9Private 85,581 18,361 4.7 12,006 7.1 22,919 7,577 3.0
Federal 145,780 29,755 4.9 14,165 10.3 0 0 0State/b 1,227,402 327,636 3.7 228,222 5.4 54,134 15,487 3.5
Region (excluding federal)Northeast 164,271 67,228 2.4 46,118 3.6 7,194 2,987 2.4
Connecticut 18,008 5,937 3.0 4,423 4.1 1,011 465 2.2Maine 1,900 801 2.4 546 3.5 68 33 2.1Massachusetts/c 9,692 3,860 2.5 3,178 3.0 570 197 2.9New Hampshire 2,223 839 2.6 522 4.3 150 37 4.1New Jersey 23,714 8,613 2.8 6,399 3.7 2,010 664 3.0New York 62,011 30,514 2.0 20,697 3.0 1,844 1,059 1.7Pennsylvania 41,812 14,703 2.8 8,843 4.7 1,442 492 2.9Rhode Island 3,414 1,161 2.9 947 3.6 0 0 0Vermont 1,497 800 1.9 563 2.7 99 40 2.5
Midwest 244,227 82,296 3.0 53,725 4.5 8,015 2,960 2.7Illinois/d 41,066 13,871 3.0 8,635 4.8 711 296 2.4Indiana 22,807 6,170 3.7 4,171 5.5 398 140 2.8Iowa 8,721 2,882 3.0 1,791 4.9 1,424 517 2.8Kansas 9,231 2,907 3.2 1,906 4.8 243 77 3.2Michigan 49,766 21,028 2.4 15,142 3.3 316 174 1.8Minnesota 9,535 3,534 2.7 2,087 4.6 145 77 1.9Missouri 31,025 9,209 3.4 5,525 5.6 723 230 3.1Nebraska 3,921 1,724 2.3 1,218 3.2 450 88 5.1North Dakota 1,178 484 2.4 309 3.8 233 141 1.7Ohio 42,816 12,527 3.4 7,774 5.5 1,901 791 2.4South Dakota 3,321 721 4.6 432 7.7 130 83 1.6Wisconsin 20,840 7,239 2.9 4,735 4.4 1,341 346 3.9
South 533,833 142,541 3.7 104,004 5.1 28,094 6,382 4.4Alabama 20,126 2,874 7.0 2,235 9.0 3,048 376 8.1Arkansas 13,267 3,404 3.9 2,607 5.1 654 155 4.2Delaware 5,932 1,482 4.0 1,250 4.7 849 157 5.4District of Columbia/e 0 0 0.0 0 0 300 123 2.4Florida 83,126 22,299 3.7 17,306 4.8 3,579 739 4.8Georgia 48,729 13,435 3.6 9,174 5.3 3,093 866 3.6Kentucky 13,962 3,731 3.7 2,364 5.9 970 215 4.5Louisiana 19,828 5,741 3.5 4,594 4.3 516 180 2.9Maryland 21,846 6,936 3.1 5,238 4.2 767 224 3.4Mississippi 16,921 3,909 4.3 2,920 5.8 46 25 1.8North Carolina 36,998 14,712 2.5 11,107 3.3 1,235 394 3.1Oklahoma 22,186 4,570 4.9 2,546 8.7 2,963 505 5.9South Carolina 21,127 4,719 4.5 3,464 6.1 1,410 332 4.2Tennessee 19,247 6,197 3.1 4,165 4.6 237 82 2.9Texas 156,325 36,550 4.3 26,809 5.8 7,231 1,547 4.7Virginia 30,544 10,312 3.0 7,348 4.2 934 385 2.4West Virginia 3,669 1,670 2.2 877 4.2 262 77 3.4
West 285,071 35,571 : 24,375 : 10,831 3,158 :Alaska 3,753 1,186 3.2 804 4.7 393 153 2.6Arizona 32,596 8,096 4.0 6,458 5.0 259 139 5.4California/f 168,518 851 : 494 : 1,470 271 :Colorado 18,236 6,181 3.0 4,007 4.6 2,606 721 3.6Hawaii 3,837 1,677 2.3 1,227 3.1 114 47 2.4Idaho 5,609 1,359 4.1 921 6.1 366 114 3.2Montana 2,482 966 2.6 575 4.3 678 245 2.8Nevada 11,132 2,220 5.0 1,528 7.3 594 93 6.4New Mexico 6,733 2,515 2.7 1,783 3.8 450 117 3.8Oregon 11,119 3,209 3.5 1,999 5.6 1,930 530 3.6Utah 5,057 1,260 4.0 975 5.2 404 120 3.4Washington 15,045 5,617 2.7 3,328 4.5 1,101 447 2.5Wyoming 954 434 2.2 276 3.5 466 161 2.9
f/Excludes public employees. Includes private employees reported in the BJS 2005 Census of State and Federal Correctional Facilities.
c/Number of inmates and employees as of June 30.d/Includes employees from the Illinois Department of Corrections, June 30, 2005 and private employees reported in the BJS 2005 Census. Excludes employees who supervised 2,892 inmates for who information was not available by facility type.e/As of December 30, 2001, sentenced felons from the District of Columbia were the reponsibility of the Federal Bureau of Prisons. Some inmates were housed in private facilities under contract to the District of Columbia on December 30, 2005.
b/Includes private facilities.
Number of inmates
Number of inmates per employee
Total employees
Number of inmates
Number of inmates per correctional officer
Appendix table 15. Number of inmates, employees, and inmate-to-staff ratios in correctional facilities under state or federal authority, by type of facility, December 30, 2005
Note: Includes all full-time, part time, payroll, nonpayroll, and contract employees. Excludes community volunteers.:Not calculated.a/Includes facilities operated by both federal and state authorities.
Number of correctional officers
Total employeesRegion and authority
Confinement facilities
Number of inmates per employee
Community-based facilities

U.S. total 1,821 1,594 775,469 562 1,347 298 798 344 124
Public/a 1,406 1,362 713,199 551 1,213 284 738 227 35Private 415 232 62,270 11 134 14 60 117 89
Federal 102 100 … 88 100 2 0 0 0State/b 1,719 1,494 775,469 474 1,247 296 798 344 124
Region (excluding federal)Northeast 268 210 86,845 79 181 33 98 43 29
Connecticut 49 32 322 4 22 2 4 9 9Maine 7 7 1,921 5 5 4 4 1 0Massachusetts/c 17 16 2,987 10 16 1 8 2 0New Hampshire 8 8 1,402 2 5 3 6 5 0New Jersey 42 33 20,823 13 23 8 16 15 3New York 77 72 30,738 20 69 13 31 7 1Pennsylvania 52 26 26,476 19 26 0 26 0 16Rhode Island 7 7 1,663 3 7 0 2 2 0Vermont 9 9 513 3 8 2 1 2 0
Midwest 342 296 163,531 109 255 41 133 94 28Illinois/d 44 43 29,544 5 43 0 10 8 1Indiana 23 21 17,185 9 19 5 16 6 2Iowa 31 27 5,944 6 10 6 8 22 2Kansas 13 12 5,975 6 9 2 9 2 0Michigan 62 56 28,519 15 51 7 22 11 2Minnesota 18 13 6,608 8 12 1 6 3 4Missouri 28 23 23,769 13 21 2 16 7 3Nebraska 9 9 870 6 8 1 3 2 0North Dakota 8 6 796 4 5 0 0 1 2Ohio 59 44 34,510 17 36 9 22 18 10South Dakota 6 3 831 3 3 0 3 0 1Wisconsin 41 39 8,980 17 38 8 18 14 1
South 779 720 385,142 188 621 185 447 108 27Alabama 33 24 28 7 10 6 9 5 7Arkansas 26 25 10,739 0 24 2 7 2 1Delaware 12 12 1,781 2 11 2 3 1 0District of Columbia/e 5 4 141 0 0 0 0 4 0Florida 109 105 68,175 14 101 29 66 4 3Georgia 87 83 36,774 14 62 14 55 20 2Kentucky 25 25 9,862 11 23 4 16 6 0Louisiana 23 21 16,469 8 14 13 12 8 2Maryland 29 24 13,825 11 23 0 12 4 2Mississippi 31 29 10,723 3 13 3 19 0 0North Carolina 88 82 20,502 21 77 4 56 13 1Oklahoma 53 52 18,201 13 42 14 35 10 1South Carolina 33 29 17,053 16 29 6 20 6 0Tennessee 19 17 14,287 8 14 4 12 7 1Texas 132 119 123,419 34 114 51 89 4 6Virginia 59 58 21,089 20 53 29 28 13 0West Virginia 15 11 2,074 6 11 4 8 1 1
West 330 268 139,951 98 190 37 120 99 40Alaska 21 18 1,334 3 17 4 9 3 1Arizona 21 17 20,194 10 15 5 12 4 2California 100 82 77,199 28 44 7 34 29 15Colorado 58 36 13,369 15 28 4 12 9 12Hawaii 10 8 1,718 3 7 3 5 1 2Idaho 15 13 2,286 4 12 0 6 4 1Montana 11 9 1,669 1 5 1 1 6 2Nevada 22 21 6,126 10 16 2 11 11 0New Mexico 11 9 3,131 6 8 0 5 1 0Oregon 15 14 4,954 7 13 3 10 2 1Utah 7 5 595 2 5 1 2 2 1Washington 32 29 6,375 9 15 5 10 23 3Wyoming 7 7 1,001 0 5 2 3 4 0
… Not available.
Note: Some facilities provided more than one work program. Information on work programs was not reported in 103 state facilities.
Appendix table 16. Number of correctional facilities under state or federal authority that provided work programs and number of inmates with work assignments, December 30, 2005
Other work programs
No work programs
Total number of facilities
Facilities operating one or more work programs
Inmates participating in one or more work programs
Facilities with --
d/The total number of facilities in 2005 were reported by the Illinois Department of Corrections as of June 30.e/As of December 30, 2001, sentenced felons from the District of Columbia were the reponsibility of the Federal Bureau of Prisons. Some inmates were housed in private facilities under contract to the District of Columbia on December 30, 2005.
Farming Public worksRegion and authority
Prison industries
Support services
c/The total number of facilities are as of June 30.
a/Includes facilities operated by both federal and state authorities.b/Includes private facilities.
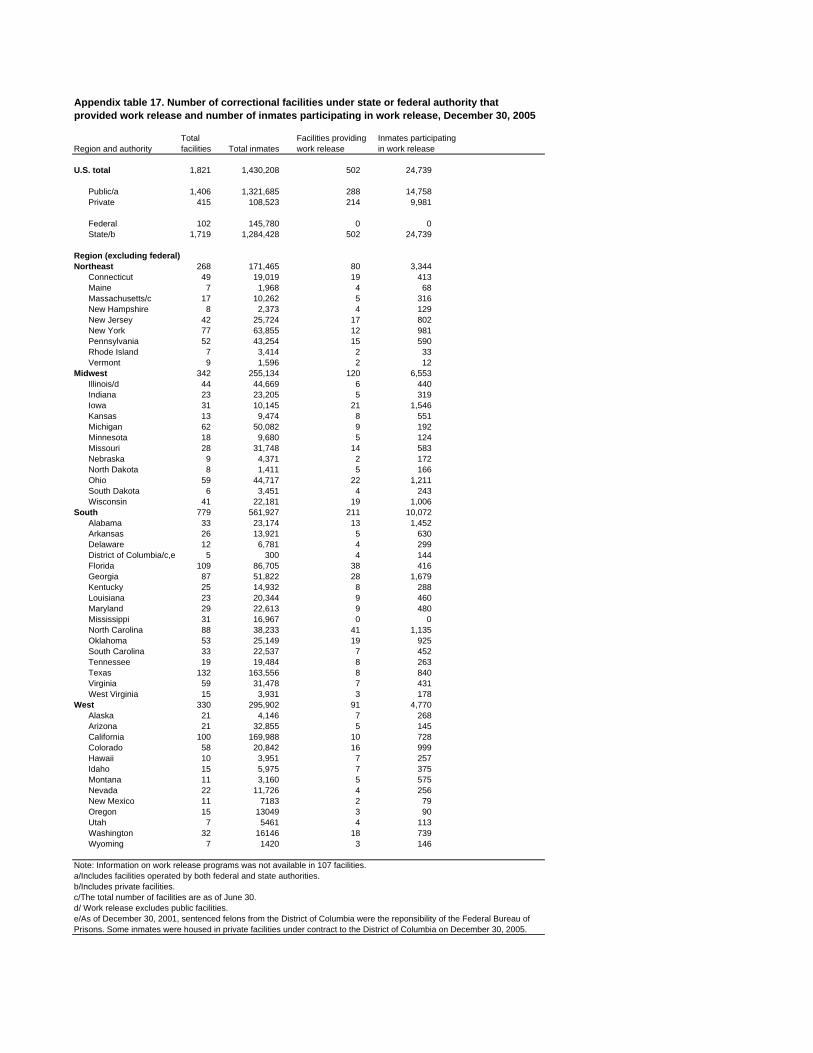
U.S. total 1,821 1,430,208 502 24,739
Public/a 1,406 1,321,685 288 14,758Private 415 108,523 214 9,981
Federal 102 145,780 0 0State/b 1,719 1,284,428 502 24,739
Region (excluding federal)Northeast 268 171,465 80 3,344
Connecticut 49 19,019 19 413Maine 7 1,968 4 68Massachusetts/c 17 10,262 5 316New Hampshire 8 2,373 4 129New Jersey 42 25,724 17 802New York 77 63,855 12 981Pennsylvania 52 43,254 15 590Rhode Island 7 3,414 2 33Vermont 9 1,596 2 12
Midwest 342 255,134 120 6,553Illinois/d 44 44,669 6 440Indiana 23 23,205 5 319Iowa 31 10,145 21 1,546Kansas 13 9,474 8 551Michigan 62 50,082 9 192Minnesota 18 9,680 5 124Missouri 28 31,748 14 583Nebraska 9 4,371 2 172North Dakota 8 1,411 5 166Ohio 59 44,717 22 1,211South Dakota 6 3,451 4 243Wisconsin 41 22,181 19 1,006
South 779 561,927 211 10,072Alabama 33 23,174 13 1,452Arkansas 26 13,921 5 630Delaware 12 6,781 4 299District of Columbia/c,e 5 300 4 144Florida 109 86,705 38 416Georgia 87 51,822 28 1,679Kentucky 25 14,932 8 288Louisiana 23 20,344 9 460Maryland 29 22,613 9 480Mississippi 31 16,967 0 0North Carolina 88 38,233 41 1,135Oklahoma 53 25,149 19 925South Carolina 33 22,537 7 452Tennessee 19 19,484 8 263Texas 132 163,556 8 840Virginia 59 31,478 7 431West Virginia 15 3,931 3 178
West 330 295,902 91 4,770Alaska 21 4,146 7 268Arizona 21 32,855 5 145California 100 169,988 10 728Colorado 58 20,842 16 999Hawaii 10 3,951 7 257Idaho 15 5,975 7 375Montana 11 3,160 5 575Nevada 22 11,726 4 256New Mexico 11 7183 2 79Oregon 15 13049 3 90Utah 7 5461 4 113Washington 32 16146 18 739Wyoming 7 1420 3 146
Note: Information on work release programs was not available in 107 facilities.a/Includes facilities operated by both federal and state authorities.
c/The total number of facilities are as of June 30.d/ Work release excludes public facilities.e/As of December 30, 2001, sentenced felons from the District of Columbia were the reponsibility of the Federal Bureau of Prisons. Some inmates were housed in private facilities under contract to the District of Columbia on December 30, 2005.
Appendix table 17. Number of correctional facilities under state or federal authority that provided work release and number of inmates participating in work release, December 30, 2005
Total facilities Total inmates
Facilities providing work release
Inmates participating in work releaseRegion and authority
b/Includes private facilities.

Region and authority
U.S. total 1,821 1,550 1,229 1,203 1,399 667 632 956 642 135 241 165
Public/e 1406 1,303 1089 1062 1215 608 567 847 563 64 202 94Private 415 247 140 141 184 59 65 109 79 71 39 71
Federal 102 100 100 100 100 100 100 100 100 0 0 0State/f 1719 1450 1129 1103 1299 567 532 856 542 135 241 165
Region (excluding federal)Northeast 268 208 170 169 189 81 118 151 53 29 48 31
Connecticut 49 34 23 22 27 20 20 17 2 7 4 7Maine 7 6 5 5 5 1 0 5 5 1 0 1Massachusetts/g 17 16 13 11 16 2 12 13 5 2 1 0New Hampshire 8 8 3 4 4 3 2 4 2 3 1 0New Jersey 42 35 26 27 31 14 16 23 17 13 6 1New York 77 68 59 59 63 17 42 55 15 2 10 7Pennsylvania 52 27 26 26 27 8 23 26 0 0 26 15Rhode Island 7 7 7 7 7 7 3 3 6 1 0 0Vermont 9 9 8 8 9 9 0 5 1 0 0 0
Midwest 342 290 228 207 261 103 66 170 123 37 54 31Illinois 44 39 35 23 38 5 2 32 20 1 0 2Indiana 23 22 19 14 18 9 5 12 13 4 4 1Iowa 31 29 15 17 26 5 9 11 19 4 2 0Kansas 13 11 9 8 11 5 1 8 7 1 1 1Michigan 62 65 48 46 51 15 13 37 7 8 15 3Minnesota 18 14 13 13 13 5 7 7 5 1 2 3Missouri 28 22 16 16 20 12 3 9 9 1 6 4Nebraska 9 8 6 6 8 3 5 4 6 4 0 1North Dakota 8 6 4 4 4 2 1 2 2 4 0 1Ohio 59 48 37 36 41 27 4 29 25 6 14 7South Dakota 6 4 2 3 4 3 3 3 2 2 2 0Wisconsin 41 32 24 21 27 12 13 16 8 1 8 8
South 779 687 527 531 618 254 197 364 208 27 107 60Alabama 33 29 16 15 25 5 1 12 1 0 4 2Arkansas 26 25 25 25 23 15 21 5 4 1 0 1Delaware 12 9 5 5 7 4 1 3 5 1 1 3District of Columbia/h 5 4 4 3 4 2 3 3 1 1 0 1Florida 109 87 45 45 46 55 34 37 1 1 27 22Georgia 87 85 62 60 82 12 5 29 5 0 6 0Kentucky 25 24 20 21 24 3 3 15 18 2 0 1Louisiana 23 20 18 18 19 9 3 12 12 1 4 3Maryland 29 25 15 16 23 8 1 11 6 0 3 1Mississippi 31 29 18 16 29 7 3 10 7 0 1 0North Carolina 88 81 54 55 77 11 19 53 43 11 7 1Oklahoma 53 49 42 41 49 11 6 24 21 1 5 4South Carolina 33 29 29 29 28 6 0 18 0 0 1 0Tennessee 19 16 13 12 13 6 0 11 4 2 2 2Texas 132 105 94 103 102 45 38 84 51 2 3 19Virginia 59 58 57 57 56 47 55 29 23 0 42 0West Virginia 15 12 10 10 11 8 4 8 6 4 1 0
West 330 265 204 196 231 129 151 171 158 42 32 43Alaska 21 16 13 13 15 7 5 9 9 4 4 3Arizona 21 17 16 15 15 10 5 13 11 0 2 2California 100 80 68 66 74 62 67 65 63 9 7 17Colorado 58 39 32 33 38 12 19 25 24 5 3 9Hawaii 10 10 8 8 8 8 9 9 8 1 0 0Idaho 15 13 11 10 11 5 4 6 1 0 1 1Montana 11 11 8 6 8 1 2 2 4 1 0Nevada 22 18 9 9 16 6 10 9 10 3 3 3New Mexico 11 9 8 7 8 8 7 7 6 3 2 0Oregon 15 13 8 7 10 4 8 4 2 3 2 2Utah 7 6 3 3 4 2 2 2 2 2 3 0Washington 32 27 15 15 18 0 14 16 16 6 4 5Wyoming 7 6 5 4 6 4 1 4 4 2 0 1
Note: Information on education programs was not reported in 42 state facilities.a/Includes literacy training and first- to fourth-grade level education.b/Includes fifth- to eighth-grade level education.c/Includes GED.d/Includes programs for inmates with learning disabilities.e/Includes facilities operated by both federal and state authorities.f/Includes private facilities.g/The total number of facilities are as of June 30.
Upper Basic adult education\b
Secondary education/c
Special education/d
No educational programs
Study release
Facilities providing programs in --
h/As of December 30, 2001, sentenced felons from the District of Columbia were the reponsibility of the Federal Bureau of Prisons. Some inmates were housed in private facilities under contract to the District of Columbia on December 30, 2005.
Other
Appendix table 18. Number of facilities under state or federal authority that provided educational programs to inmates, December 30, 2005
English as a second language (ESL)
Vocational training
College courses
Lower Basic adult education/aAny education
Total number of facilities

U.S. total 1,821 1,676 1,345 1,344 1,054 996 662 1,332 1,421 873 279 40
Public/b 1,406 1,368 1,081 1,087 912 814 596 1,077 1141 676 212 29Private 415 308 264 257 142 182 66 255 280 197 67 11
Federal 102 100 100 100 100 100 100 100 100 99 0 0State/c 1,719 1,576 1,245 1,244 954 896 562 1,232 1321 774 279 40
Region (excluding federal)Northeast 268 238 221 221 172 197 104 197 211 161 78 1
Connecticut 49 41 40 38 27 35 17 34 38 27 5 0Maine 7 7 6 7 5 5 5 6 7 6 1 0Massachusetts/d 17 16 14 15 13 13 4 8 13 10 1 0New Hampshire 8 8 6 6 6 6 3 6 6 3 0 0New Jersey 42 36 33 34 22 25 6 26 31 21 13 0New York 77 72 69 68 46 57 24 65 66 40 16 1Pennsylvania 52 42 42 42 39 42 39 42 42 42 40 0Rhode Island 7 7 5 5 7 7 3 3 2 5 1 0Vermont 9 9 6 6 7 7 3 7 6 7 1 0
Midwest 342 319 283 282 233 168 137 271 268 200 67 2Illinois/e 44 40 33 33 22 7 12 32 32 17 1 1Indiana 23 23 22 22 13 17 4 19 17 16 5 0Iowa 31 29 24 25 21 12 22 24 25 26 1 0Kansas 13 12 11 11 9 7 6 10 11 7 2 0Michigan 62 58 57 55 49 33 39 49 45 26 14 0Minnesota 18 17 13 13 12 5 5 11 15 12 4 0Missouri 28 26 22 23 24 23 9 19 22 18 2 0Nebraska 9 9 8 8 6 5 4 9 6 4 2 0North Dakota 8 7 7 7 4 3 4 7 5 3 0Ohio 59 55 54 54 42 41 18 55 51 43 19 0South Dakota 6 4 4 4 4 2 4 4 4 4 1 0Wisconsin 41 39 28 27 27 16 11 35 33 22 13 1
South 779 731 506 506 371 386 194 525 593 250 97 17Alabama 33 30 29 28 8 2 2 2 11 3 2 1Arkansas 26 25 25 25 25 25 11 11 24 10 1 1Delaware 12 12 11 12 10 11 5 8 6 7 0 0District of Columbia/f 5 4 4 4 3 4 1 4 4 3 0 0Florida 109 109 9 9 60 107 53 107 108 10 3 0Georgia 87 85 79 75 41 38 16 59 62 14 21 0Kentucky 25 25 24 24 14 15 6 19 23 17 6 0Louisiana 23 22 21 21 11 18 11 21 18 17 6 1Maryland 29 26 19 21 16 13 3 16 14 5 2 0Mississippi 31 28 25 26 10 12 3 11 13 8 6 1North Carolina 88 83 76 77 57 41 15 54 59 35 12 0Oklahoma 53 46 35 33 27 21 10 28 35 23 13 7South Carolina 33 29 27 27 16 4 12 20 25 8 1 0Tennessee 19 18 18 18 16 11 13 18 17 13 3 0Texas 132 119 37 38 11 19 7 90 109 39 1 6Virginia 59 58 55 56 36 38 18 49 56 31 16 0West Virginia 15 12 12 12 10 7 8 8 9 7 4 0
West 330 288 235 235 178 145 127 239 249 163 37 20Alaska 21 14 8 10 7 6 4 10 13 11 1 5Arizona 21 19 19 19 14 12 9 17 17 15 2 0California 100 85 80 80 64 68 61 77 77 23 8 12Colorado 58 46 42 41 32 13 10 31 46 22 7 2Hawaii 10 10 10 10 9 10 8 10 10 10 1 0Idaho 15 14 13 14 9 4 5 13 11 7 5 0Montana 11 11 10 9 6 6 3 9 11 10 3 0Nevada 22 21 19 18 12 5 6 13 13 13 3 0New Mexico 11 9 9 9 7 7 8 8 8 9 1 0Oregon 15 14 11 11 7 6 10 12 12 2 1Utah 7 6 3 3 3 3 5 4 5 4 2 0Washington 32 32 4 4 2 1 1 31 19 23 2 0Wyoming 7 7 7 7 6 4 7 6 7 4 0 0
b/Includes facilities operated by both federal and state authorities.c/Includes private facilities.
Drug dependency counseling or awareness
Total number of facilities
Any counseling
Psychological or psychiatric counseling
HIV/AIDS counseling
Alcohol dependency counseling or awareness
Appendix table 19. Number of facilities under state or federal authority that provided counseling programs to inmates, December 30, 2005
Region and authority
Note: Information on counseling programs was not reported in 41 facilities.a/Includes personal finance and conflict resolution counseling.
Facilities providing programs in --
e/ The total number of facilities in 2005 were reported by the Illinois Department of Corrections as of June 30.d/The total number of facilities in 2005 are as of June 30.
Other counseling
No counseling provided
Sex offender counseling
Job-seeking counseling
Life skills and community adjustment counseling/a
Parenting and child rearing counseling
f/As of December 30, 2001, sentenced felons from the District of Columbia were the reponsibility of the Federal Bureau of Prisons. Some inmates were housed in private facilities under contract to the District of Columbia on December 30, 2005.

U.S. Department of JusticeOffice of Justice ProgramsBureau of Justice Statistics
Washington, DC 20531
*NCJ~222182*
The Bureau of Justice Statistics is the statistical agency of the U.S. Department of Justice. Jeffrey L. Sedgwick is director.
This Web Report was written by James J. Stephan. William J. Sabol, Ph.D., Tracey L. Snell, and Elizabeth Collins-Wildman provided statistical verification.
Data collection and processing for this report were carried out by Garry L. Smith with the assistance of Patricia Torreyson and Pamela H. Butler, under the supervision of Charlene M. Sebold, Governments Division, U.S. Census Bureau.
Georgette Walsh edited the report, Tina Dorsey produced the report, and Jayne Robinson prepared the report for final printing, under the supervision of Doris J. James.
October 2008, NCJ 222182
This report in portable document format and in ASCII and its related statistical data and tables (includes 19 appendix tables) are available at the BJS World Wide Web Internet site <http://www.ojp.usdoj.gov/bjs/abstract/csfcf05.htm>.
Office of Justice Programs
Innovation • Partnerships • Safer Neighborhoodshttp://www.ojp.usdoj.gov
Census of State and Federal Correctional Facilities, 2005