Embed Size (px)
Citation preview

-------~-~--. ~ -- ------- -
U.S. Department of Justice Office of Justice Programs Bureau of Justice Statj~tics
Compendium of Federal Justice Statistics, 1988
.. ' S ~1 ~~ . ~. . . . ' , .
If you have issues viewing or accessing this file, please contact us at NCJRS.gov.

ill a
Bureau of Justice Statistics reports (Revised December 1991)
Call loll,free 800,732.3277 (local 301· 251·5500) to order BJS reports. to be added to one of the BJS mailmg listS. or 10 speak to a reference specialist in statistics at the Justice Statistics Clearinghouse. National Crimmal Justice Reference Service, Box 6000. A~\\vll!e, MD 20850 BJS maintains Ihe following mailing IIsls: • Law en(orcemt nt reports (new) • Drugs and cr',ne dala (new) • Justice spending & employmenl • While·collar crime • National Crime Survey (annual) • Corrections (annual) • Courts (annual) • Privacy and security of criminal
histOry information and information policy
• Federal statistics (annual) • BJS bulletins and special reports
(appro)(imately twice a month) • Sourcebook of Criminal Justice
Statistics (annual) Single copies of reports are free; use NCJ number to order. Postage and handling are charged for bulk orders of single reports. For single copies o( multiple titles. up to 10 titles are free; 11·40 IIties $10; more than 40. 520; libraries call (or speCial rates.
Public·use tc:pes o( BJS data sets and other criminal justice data are available from the National Archive of Criminal Justice Data (formerly CJAIN). P.O. Box 1248. Ann Arbor, MI 48106 (toll·free 1-800·999·0960).
National Crime Victimization SU!1ley The Nation's two crimo meusures: Unilo""
Crime Reports and the National Crime Survey, NCJ·122705. 4/90
Crlmlnat vlctlmlzallon in the U.S.: 1973·88 trends, NCJ129392. 7191 1989 (fmall, NCJ·129391. 6/91 1988 (final). NCJ·122024. 10/90
BJS specIal reports Handgun crime victims, NCJ·123559. 7190 Black victims, NCJ 122562. 4/90 Hispanic victims, NCJ·120507. 1/90 The redesignej Natlonai Crime Survey:
Selected new data, NCJ-114746. 1189 Motor vehicle theft, NCJ 109978. 3!88 Elderly victims, NCJ·l07676. 11187 Violent crime trends, NCJ-l07217. 11'87 ~obbery victims, NCJ·104638. 4;87 Violent crime by sfrangers and non·
strangers, NCJ·l03702. 1187 Preventing domestic violence against
women, NCJ-l02037. 8186 Crime prevent/on measures, NCJ·l00438.
3/86 The use 01 weapONS In committing crimes,
NCJ·99643. 1186 Reporting crimes to the pOlice, NCJ·99432.
12185 The economic cost of crime to victims,
NCJ·93450. 4184
BJS bulletins Criminal victimization 1990, NCJ 130234
10191 Crime and the Natlon's households, 1990.
NCJ·130302.8/91 The crime 01 rape, NCJ·96777. 3185 Househald burglary, NCJ-96021. 1165 Measuring crime, NCJ-75710. 2181
BJS tech meal reports New directions for the NCS, NCJ 115571.
3/69 Serlos crimes: Report 01 a field test.
NCJ·l04615. 4/87
School crime, NCJ 131645. 9191 Teenaga vlct/ms, NCJ·128129. 5191 Female victims of Violent crime,
NCJ·126826. 1/91
-Reden/gn ot the National Crime Survey,
NCJ 1114~,1 .l1H9 The soasonality 01 trims Ylctimlzalloo,
NGJ IlIOH GIUS ~,ime ~"d older Anterlcnns Inlormallon
package, NC·j 104r,W. ~,·Ul. $1(1 VIWmizaliM and fear 01 clime: World
perspectil'Cs. NCJ 93012 leU', S'll', The Nallon)1 Crime Survey: Working papers,
Currem and Illstorical pcrspectlvcs. vol. t, NCJ 7f,314 8IB?
Methodology studies. vot II. N(;J 90101 12,U4
Corrections BJS b,dlNms dnd ~pC"'JI report;
Capital punishment 1990. Nr.J 131640 9;;)1 Prisoners in 1990. N(;J 129198. ,,191 Women in prison, NCJ 127991. 4'91 Violent Slate prison inmates and their
Victims, NCJ 124133. 7!90 Prison rule violators, NCJ-120344. 1289 Recidivism of prisoners released In 1963,
NCJ116261 4189 Drug use and crime; Slate prison lnmale
survey, 1986. NCJ-111940. 1188 Time served In prison anti Iln parole, 1984.
NCJ108544. 12,87 Profile 01 Slate prison Inmates. 1966,
NCJ 109926 liS8 Imprisonment In four counlrles.
NCJ-l03961. 2187 Population density In State prisons,
NCJ·l03204. 12·86 State and Federal prisoners, 192585.
NCJ·l02494. 11186 Prison admissions and releases, 1983.
NCJ·l00582. 3186 The prevalence 01 Imprisonment,
NCJ 93£57.7'85
Prisoners at midyear 1991 Ipress lolc)SCI NCJ 133281 10191
Correctional populal/ons In the Unilod States: 1989. NCJ 130445. 10191 1988, NCJ 124280. 3191
Race of prisoners admillad to State snd Fcderallnstllullons, 1926-86. NCJ-125618 6191
National corrections reporting program, 1985, NCJ·123522. 12.'90
Historical statlsllcs on prisoners In State and Federal Inslltutions, yearend 1925·86. NCJ·l11098. $88
1984 census of State adutt correctional facilities. NCJ 105585. 7.'87
Census 01 falls and survey ollal' mmate::; BJS bulietms and speCial repOits
Drugs and jail Inmates. NCJ 130836 8:91 Jail inmates, 1990, NCJ·129756. 6191 Profile of jail Inmates, 1989, NCJ 129097.
4191 Jail Inmates. 1989, NCJ·123264 6:90 Populallon density in local jails, 1988,
NCJ-I22299. 31DO Census of local jails. 1988 ,BJS tJUllei<n1
NCJ·121101. 2190 Jail Inmates, 1987. NCJ-114319. 12'8B Prunk drMng, NCJ-l09945 288 Jail inmates, 1986. NCJ·l07123. iO,87
Census of local Jails 1988: Summary and methodology, vol. I.
NCJ·127992 3/91 Data for Individual/ails in the Northeast.
Midwest, South, West, vol5. liN. NCJ 130759·130762 9.'91
Census 01 local jails, 1983: Data lor Individual Jails. Northeast, Midwest. South,
Wesl, vols. l·tV, NCJ 1127969. Well Selected findings, methodology, summary
,abIes. vol. V. NC~-112796. l11il8
Parole and probation BJS /Jul/elms
Prcbatlon and parote: 1990, NCJ-125833, 11!91 1989, NCJ 125833. 11:90 19M, NGJ 11997!, 11.~<J
BJS speCIal repo.ts Recidivism 01 young parolees. NCJ·l0491b
SiBl
Children in custody Census of public and pri •• te Juvonile
detenlion. correctlonat. and shelter facllihes, IS7585, NeJ 11401,', ".!n
Survey 01 youth In custo;ly. 1981 (~pf'(fal rr'p(Jrll NGJ 1 HJ!-~ 'l!ill
Law enforcement management UJ,'; b/1/idl.'l'. df1!j :./J('f {.It f/lp~Jf("
Stale and local poi ice departmentG. 1990. NC.J nWJ.' 1;'!')1
Shcrilfs' departme~ls. 1990, N(~J 1.lJ~lB:\ 1241
Profile of stale and local law cnlorcemcnt ageneioo. 1987, N('J 11l'l49 :1'd0
Expenditure and employment f:JJ,~; tJuNeltn:.,
Justice expenditure and omployment: 1988. NCJ 1241\<. 1i911
Anti drug abuse 10lmula grants: Justice variable pass· through dala, 1988 I!lJS tectullcJI re~',,(!. N(,J-120070. 3.'90
Justice oxpendlluru nnd employment 1988 Ilull rep,,'I!. NCJ 125619 8m 1985 Ifull rr,porl/ NtrJ 10fiJ~G. !!'8J Extracls, 1984, 1985. 19B6, NCJ 124139. 8191
Courts BJS bui{(o/InG
Pretrial (otease of felony defendants. 1988, NCJ 127202 2191
J'elony sentences In Stale courts. 1988, NCJ 126923 12:90
Criminal defense for the poor. 1986. NCJ112919 9:88
State felony courts and felony laws. NCJ·l0627:~. 8187
The growth of appeals: 1973·83 Irends, NCJ9G3S1. 2·85
Case lilings in State courts 1S83, NCJ95111 10,84
6JS cP<J"J; tllPorts felony case procossing In State courts.
1986, NCJ 121753 2'90 Felony case'processing lime, NCJ 101985.
a:Vb Felony senlenclng In 18 local jUrisdictions,
NCJ 976B 1 6;85
Felons sentenced to proballon in Slale courts, 1986, NCJ·124944. 11.g0
Felony defendants In largo urban counlies, 1988. NCJ 122385. 4'90
Profile 01 folons convicted In Statn courts, 1986, NCJ·120021 1190
SentenCing outcomes In 28 felony courts. NCJ 105743. 8:87
The prosecution of felony arrests: 1987. NCJ 124140. 9'90
Fetony laws 01 the 50 States and the District of Columbia, 1986, NCJ 105066 2'88. $1460
State court model slal1sllcal dictionary: Supplement, NCJ 98326 9:85 1st edillon, NCJ 62320 9:80
Privacy and security Compendium of Slate privacy and security
legislation: 1989 overview. NCJ·121157. 5/90 1987 oveNiew, NGJ l11Q97. 9.88 1989 full report it 500 pages
inJcrolirho $2. hard COpy $145) NCJ 121158.9:90
Criminal jUl'tlce Inform.llon poliCy: Forensic DNA analysis: Issues. NCJ 128567
6:91 Slatutes requiring use of crlmmal his lory
record Information, NCJ 129890. 6191 Survey of criminal history information
systems. NCJ125C20 ;1'91 Original records of bntry, NCJ-125620
12180 BJSISEARCH conterence proceedings:
Criminal justice in the 1990's: The future ot Information management. NCJ 1::1697. 5'90
Juv~nlle and adull records; One system. one record?, NCJ 114~41. 1190
Open vs, confidential records. NCJ l1Jf:W I,B8
SI'stl.'gle5 lor improving data quality, NCJ 11')319. f)~9
Public access 10 crlmmai history ",cord informalion. NCJ 1114511. 11188
Juvenile records and recordkeeplO9 svstems. m:J 112!llb 11!1o(1
Automaled tingerprint idenlificalion syslems Technology and policy Issues. Nf' J hl,1i.1 .. ' .1 1\1"
CllmlOat lust,ce "hoi" hies. NCJ 10111'>\1 l. .. 'm.
Drugs & crime data Catalog 01 Delected FedCr~1 publicoliono
on Illegal drug and alco":! ~~use, NCJ U2"tJ2 10!')'
•
Drugs and crime locls. 1990. NCJ 1211t",2. lJJ!l1 State drug resourcos: A national directory.
NCJ 122,102 ~'90 Fedoral drug Jata lor national policy.
NGJ 122!1') 4190 Drugs and crime facts, 1989. NCJ 121022
1190
Computer crime [J,..IS fPVC'I.1t f(lPorlfi
Electronic fund transfer: fraud. NGJ 966&6. jill:' and crimu. I CJ 92650 2.B4
Electronic lund transfer systems Iraud, NCJ100461.4186
Expert witness manual, NCJ 77927. 9/81. $1150
Federal Justice statlsllcs Compondlum !If Federal justice stallslics:
1988, NCJ·130474. 12/91 1986, NCJ 125617. 1191 1985, NCJ 123560. 8/90
J'e'delal criminal case processing, 1980·89, wilh preliminary data for 1990, NCJ 130526. lW91
The Federal civil Jusilce system iBJS bullelm) NCJ 104769. 6i87
Federilt o(/enses and ol/enders BJ$ specl8/ rep orIS
tmmigrallon offenses, NCJ·124546. 8190 J'ederal criminal cases, 1980·87,
NCJ·118311 7.'69 Drug law violators, 1960·66, NCJlt1763.
6i88 Pretrial release and detenllon: The Ball
Reform Act 01 1984, NCJ·109929. 2188 Whlte·collar crima, NCJ 106876. 9181
General BJS bulletms and spec.al reports
BJS telephone contacts, '91, NCJ·130133. 7/91
Tracking ollenders, 1986, NCJ-I298&1 6191 Tracking ollenders, 1987, NCJ 125315. 10190 Criminal cases In live Stales, 1983·86,
NCJ 118798. ~:89 Inlamalional crime rates, NCJ·l10776. 5i88
BJS not/onal update: Jan. '92, NCJ·133097. 12191 Oct. '91, NCJ·13177B. 10:01 July '91, NCJ·129S63. 7191
Sourcebook 01 criminal Justice stallslics, 1990, NCJ-130580,9i91
BJS program application kil. IIscat19S1. NCJ 128413 Ji91
ViQlent crime In the United States, NCJ 127855. 31lH
Allorney General's program for Improving the Nation's criminal history records and Idenlilying leions who altempt to purchase IIreMms. NC''')·128131. 3191
BJS data report. 1989, NCJ-121514. 1191 Puhlicalions of BJS, 1985·89:
Microfiche library. PR03OO14. 5J1l0. $190 Bibliography, TB0030013 5190. $1750
Publications 01 BJS, 1971·84: Microfiche library. PR030012. 10/86. $201 Bibliography, TB03OO12. 10186. $1750
1990 diroctory of automated criminal justice inlormallon syslems. Vol. 1. Correcllons, $1060. 2, Courts, $11 50. 3, Law enforcement, free. 4. Proballon and parole, $11.50.5, Prosecution, S1150. NCJ-1222630.5190
BJS annual report. IIsca11988, NCJ·115749. 4;8S
Report to the Nation on crime and Justice: Second edition. NCJ 105506. 6;88 Technical appendix, NCJ 112011. 8i88
Criminal lustice microcon,puler guide and software catal~g, NCJ-11217B. BiBB
National survey of crime severity, NCJ·96017 10.80
See order form on last page

U.S. Department of Justice Office of Justice Programs Bureau of Justice Statistics
Compendium of Federal ~ustice Statistics, 1988
December 1991 NCJ-130474
U.S. Department r,f Justice National Institute of Justice
130474
This document has beon reproduced exactly as received from the person or organization originating It. Points of view or opinions stated In this document are those of the authors and do not necessarily repr~sent the official position or policies of the National Institute of Justice.
Permission to reprodlJce this "PPiliP. material has been granted by
--E.uhli..c~...D.JP /BJ:~_ IT. S. Department of ,Jus.tic...e
to the National Criminal Justice Reference Service (NCJRS).
~urther reproduc.tion outside of the NCJRS system requires permission of the~ owner.
-

U.S. Department of Justice Office of Justice Programs Bureau of Justice Statistics
Steven D. Dillingham, Ph.D. Director
This Bureau of Justice Statistics report was prepared by Abt Associates Inc. under the supervision of Carol Kaplan, chief, BJS federal statistical and Information policy branch. The project Is supported by BJS grant number 87·BJCX-K063. Principal staff for the project at Abt Associates were Kenneth Carlson, Jan Chaiken, Rick Defrless8, Irma Rivera, Mila Ghosh, and Andrew Bllckenderier. Layout and design were by Pearl Jusem. . The contents of this document do not necessarily reflect the views or policies of the Bureau of Justice Statistics or the U.S. Department of Justice.
BJS authorizes any person to reproduce, publish, translate or otherwise use all or any part of the copyrighted material In this publication.
The Assistant Attorney Generalis responsible for matters of administration and mangement with respect to the OJP agencies: the Bureau of Justice Assistance, Bureau of Justice Statistics, Natlonallnstltute of Justice, Office of JuVenile Justice and Delinquency Prevention, and the Office of Victims of Crime. The Assistant Attorney General further establishes policies and priorities consistent with the statutory purposes of the OJP agencies and the priorities of the Department of Justice.
ii Compendium of Federal Justice Statistics, 1988

Preface
This compendium Is the fourth In a series of BJS publications which describe the processing of criminal suspects through all phases of the Federal criminal justice system during a given year. Data are presented In text and tabular form and describe activity at both the national level and In Individual Federal districts. Uniform crime categories are used In order to permit the reader to trace Federal justice processing from case screenIng through ball release, prosecution, adjudication, sentencing, and corrections.
Comparisons between selected statIstics for 1988 and those for other years are presented In the BJS publication Federal Criminal Case Processing, 1980-89, which currently Includes updates through part of 1990.1 This compendium contains more complete and up-to-date Information for 1988 than Is found In Federal Criminal Case Processing, 1980-89.
The compendium presents only factual information, without analyses of trends or explanatory factors underlyIng the statistics. Analyses of Federal justice statistics may be found In Special Reports and other publications, some of which are cited In the compendium. Assessment of changIng patterns In the compendium's tabulations may depend on detailed examination of subcategories not shown In the tabulations or may
1 Federal CrimInal Case Processing, 1980-89, with Preliminary Data for 1990, Bureau of Justice Statistics, October 1991 (NCJ-130526)
require other sources of Information, such as knowledge of legislation or Federal agency procedures.
The compendium Is prepared under the BJS Federal Justice Statistics program. The BJS Federal justice database, maintained under the program, Includes data supplied by operational agencies Involved In prosecution, adjudication and corrections and describes activity dating back to 1979.
BJS hopes that the material In this compendium will assist pollcymakers and criminal justice practitioners In addressing the pressing Issues currently facing the Federal justice system.
Preface iii

Contents
Introduction, 1
Organization of the compendium
Note to reader
System overview, 3
Chapter 1: Prosecution, 7
Matters received
Disposition of matters concluded
Basis for declination
Processing time
Tables, 11
Chapter 2: Pretrial release, 17
Reiease procedures
Types of pretrial release
Factors relating to release or detention
Rates of release and detention
Types of detention
I ncidence of pretriai violations
Defendant characteristics
Tables, 22
-Chapt~r 3: AdJudication, 27 Methodology, 57
Defendants In cases terminated Data notes, 59
Case-processing time
Characteristics of convicted offenders District tables, 61
Matters concluded by U,S, Magistrates
Tables, 31
Chapter 4: Sentencing, 35
Offenders convicted and sentences imposed
Relationship between sentence and method of case disposition
Characteristics of offenders sentenced to incarceration
Average prison sentence length
Relationship of prison term to offender characteristics
Tables, 39
Chapter 5: Corrections, 45
Probation outcomes
Parole outcomes
Comparison of parole and probation populations
Violation rate
Time served In prison
Tables, 49
Glossary, 113
iv Compendium of Federallustice Statistics, 1988

---------------,---
Tables
Chapter 1: Prosecution, 11
1.1 Suspects In matters received by U.S. Attorneys, by offense, 1988
1.2 Disposition of suspects In matters concluded, by offense, 1988
1.3 Basis for declination of prosecution by U.S. Attorneys, 1988
1.4 Disposition of matters declined for prosecution by U.S. Attorneys, by offense, 1988
1.5 Average processing time from receipt to filing or declination, by offense, 1988
Chapter 2: Pretrial release, 22
2.1 Form of pretrial release or detention, by offense, 1988
2.2 Pretrial detention hearing outcomes, by offense, 1988
2.3 Pretrial detention hearings, by offender characteristics, 1988
2.4 Behavior of defendants released prior to trial, by offense, 1988
2.5 Behavior of defendants released prior to trial, by type of release, 1988
2.6 Pretrial release and detention status, by defendant characteristics, 1988
Chapter 3: Adjudication, 31
3.1 DispOSition of cases terminated in 1988, by offense
3.2 Time from filing to disposition of cases terminated in 1988
3.3 Characteristics of convicted offenders, 1988
3.4 Dispositions by U.S. Magistrates, by offense, 1988
Chapter 4: Sentencing, 39
4.1 Sentence types In cases terminated, by offense, 1 988
4.2 Type and length of sentences Imposed, by offense, 19118
4.3 Sentences Imposed on convicted offenders, by offense of conviction and method of disposition, 1988 .
4.4 Convicted offenders sentenced to incarceration, by offense and offender characteristics, 1988
4.5 Aver3ge incarceration sentence lengths Imposed, by offense and offender characteristics, 1988
Chapter 5: Corrections, 49
5.1 Outcome of probation supervision, by offense, 1988
15.2 Characteristics of offenders terminating probation supervision, 1988
5.3 Outcome of parole supervision, by offense, 1988
5.4 Characteristics of offenders terminating parole supervision, 1988
5.5 Parole and probation outcomes, by type of release, 1988
5.6 Average time to first release, and percent of sentence served, prisoners released in 1988
5.7 Average time served to first release, prisoners released in 1988
Tables v

District tables
Prosecution, 62
0-1.1 Suspects in criminal matters received by U.S. Attorneys, by offense, 1988
0-1.2 Suspects In criminal cases prosecuted, by offense, 1988
0-1.3 Suspects in matters declined, by offense, 1988
Pretrial release, 68
0-2.1 Form of pretrial release or detention, 1988
0-2.2 Behavior of defendants released prior to trial, 1988
AdJudication, 72
0-3.1 Conviction rate, by most serious offense charged, 1988
0-3.2 Convicted offenders, by most serious offense charged, 1988
0-3.3 Characteristics of convicted offenders, 1988
Sentencing, 78
0-4.1 Incarceration rate, by offense, 1988
0-4.2 Incarceration rate, by offender characteristics, 1988
0-4.3 Average Incarceration sentence length Imposed, by o~fense, 1988
0-4.4 Probation rate, by offense, 1988
Corrections, 88
0-5.1 Offenders tc~rmlnatlng proof.!. tlor! with a new crime, by original offen,'i\';) 1988
0-5.2 Offenders termiMtlng probation with a new crime or technical violation, by orlglno.l offense, 1988
0-5.3 Offenders terminating probation with a new crime, by offender characteristics, 1988
0-5.4 Offenders terminating probation with a new crime or technical violation, by offender characteristics, 1988
0-5.5 Offenders terminating parole with a new crime, by original offense, 1988
0-5.6 Offenders terminating parole with a new crime or technical violation, by original offense, 1988
0-5.7 Offenders terminating parole with a new crime, by offender characteristics, 1988
0-5.8 Offenders terminating parole with a new crime or technical violation, by offender characteristics, 1988
vi Compendium of FI~deral Justice Statistics, 1988

Introduction
The 1988 Compendium rf Federal Justice Statistics Is a comprehensive Bureau of Justice Statistics report presenting an overview of Federal criminal case processing. The data In the compendium are extracted from the BJS Federal Justice database, which links data describing each component of Federal processing. Data are presently InclUded from the Executive Office for the U.S. Attorneys, the Pretrial Services Agency (PSA), the Administrative Office of the U.S. Courts, and the U.S. Bureau of Prisons. Future editions of the compendium will Incorporate data from additional Federal agencies.
The compendium describes the progress of Federal criminal suspects through prosecution (Chapter 1), pretrial release (Cnaptsr 2), adjudication (Chapter 3), sentencing (Chapter 4), and corrections (Chapter 5). Tables follow the text of each chapter.
Both Individual and corporate cases are Included In the tables, and both felonies and misdemeanors, unless otherwise Indicated. Corporations are not represented In tables based on data collected during pretrial Interviews or in tables showing offenders sentenced to incarceration.
The 1988 compendium, fourth in a series which also Includes 1984, 1985, and 1986, describes each aspect of processing In relation to suspects or defendants who comp:c;*ed a pertinent stage of processing during calendar year 1988. For example, the tables In Chapter 1 describe suspects whose criminal matters were Initiated In 1988 or those whose matters were concluded during 1988. Chapter 3 describes defendants whose cases were terminated or disposed In the Federal courts dUring calendar year 1988; these are not necessarily the same as the suspects whose criminal matters are tabUlated in Chapter 1.
I n text discussions of tables, any comments about changes between 1986 and 1988 are based on comparisons with the corresponding table In the Compendium of Federal Justice Stat/st/cs, 1986. Comments about changes between 1987 and 1988 are based on Federal Criminal Case Processing, 1980-89.
In the Federal justice database, individuals and corporations are tracked from one stage of processing to the next. Flies are linked on the basis of names, demographic characteristics, and key events to permit a system-wide view of the Federal justice process. Consistent with Federal statute, Identifiable data In the database may not be revealed or used for any purposes other than research or statistics.
Incomplete linkages do not affect any of the tables in this publication that are derived from a single data source, since records are included In the tabulated statistics whether or not they have been linked to other records In the database. However, some tables In this compendium provide greater richness and detail by drawing on more than one data source for each case; these tables are necessarily based upon linked records only.
Organization of the compendium
Each chapter of the compendium. describes a major stage In the processing of criminal suspects and defendants and combines data from all U.S. judicial districts. Geographically detailed data appear In the district tables at the end of this compendium. The contents of the compendium include:
System overview. This section provides a graphic overview of the Federal system. Figure 1 is a flow chart of Federal processing in 1988. This figure differs from previous
editions to reflect pretrial procedures under the Ball Reform Act of 1986. Figure 2 describes the attrition of suspects from prosecutorlal review to sentencing, Incarceration, and release.
Chapter 1. This chapter describes decisions taken by Federal prosecutors In screening criminal matters and the characteristics of cases prosecuted or declined.
Chapter 2. This chapter provides Information on pretrial release, detention, and defendant conduct while awaiting trial.
Chapter 3. This chapter describes actions of U,S, district courts In adjudicating guilt or Innocence. Characteristics of offenses and convicted offenders are described.
Chapter 4. This chapter describes sentencing decisions and offense and offender characteristics.
Chapter 6. This chapter addresses corrections. Data describe the time served In Incarceration and the results of supervision under probation or parole.
Methodology. This section describes the procedures followed In analyzing data and developing tables.
Data notes. This section contains Information relevant to the Interpretation of Individual tables.
Glossary. This section contains definitions for terms used In the compendium. Since many terms used In the text or tables have specialized meanings (either because they refer to Federal law or because of reporting procedures In the Federal agencies supplyln9 the source data) readers are encouraged to check the glossary fer exact definitions of tabulated data.
Introduction 1

-Note to reader
The tables In the compendium were constructed to permit valid comparisons within each table and to allow the reader to compare percentages (but not raw totals) across tables. It should be understood, however, that the total number of subjects shown In a particular table may not equal the number of subjects Involved In a particular stage of processing, since some records could not be linked and some data sources did not Include Information on particular data elements classified In a particular table. Data notes Indicate the exact universe for Individual tables. Numbers cited In the text are based on exact calculations and may vary slightly from totals derived from tables.
2 Compelldium ofFederalJustice Statistics, 1988

System overview
Federal Criminal Case Processing
Criminal investigation
Figure 1
MaHers reFerred to U.S. AHorneys
Chapter 1
PROSECUTION
Other prosecution or resolution
r Prosecution declined
Release
Prosecution ~ First Cases Filed in appearance
--.--- District Court
Referred to -,.. -mogrstrotes
Suspects arrested at the lime of offense
.J , .
Chapter 2
PRETRIAL RELEASE
Release
Deportation Exclusion
No vlolalion
Violation of conditions
Revocal'ion hearing
Detained
Detention
System overview
C re

ed in olJrt
.; a
to les
Release ~
First appearonce
...
Chapter 2
PRETRIAL RELEASE
No violation
J i Violation of conditions
L.-; Revocation ContinlJed hearing release
Release
Detained
!~ Deten,Hon _~ , heanng
Detention ~
.--..f Temporary ~ detention
~ Deportation
ExcllJsion
System overview 3
, Preliminary
hearing
Chapter 3
ADJUDICATION
GlJilty pleas
r A~"i~ Federal District
r Court trial Cases (iury or to trfal bench)
~
GlJilty verdicts
..
Chapter 4
SENTENCING
r-~ Feder priso
Sentencing Supervi relea'
r-~ AcqlJitted ~ Fines and costs
.. Magistrate Convicted
hearing
.

.-
I
-".
.., I Preliminary
hearing
Chapter 3
ADJUDICATION
Guilty pleas
," Acquilted
Federal District
Chapter 4
SENTENCING
,.. ,
Chapter 5
CORRECTIONS
f /, I
Federal S~ Expiration a sentence re ease
prisons ~ Reincarceratian
• po.
Mixed
,j, sentence Violation
Court trial ~ Sentencing .. ,. Supervised ~ Discharge hearing Continuation on
release ...: supervision Cases (jury or Guilty to verdicts trio/ bench)
iAcqUilted
Magistrate Convicted
hearing
4 Fines and costs
V,o/af,on
Discharge

Federal criminal case procesl .\"I~1, 1988
In mo.«er. opened by U.S. Attorney.:
All offenses
Suspects Investigated tmm::::::::::W:::::::::::m:tItttW:::::m:@@::::::t::W:ffIim:tm::::m::::m:tmttmr:1100%
Defendants prosecuted"ll:m:::::m::lmmrm::::mm:::m::i.i:::l!::i:i::tf::fi{::m::::::i::::::::170%
Offenders convlctedlli::rmmm::::i::::::::Ili::m:::::i:j::m:::::m:m:::{::1 54%
Offenders sentenced to prlsonb 1::t:;:iii?;%::tm:m::1 25%
Offenders sentenced to prObatlonbf~_m::,,"::~;.;,;:::: .. :mi ... : _1_6% ____ -,-1 _______ -,1
Violent offenses
Investigated Ittm::m:m::m:::?i:::i::li::;:m:tm::::::ti::::;:::m:m::i::::::m:m::m:::;:@W::::;:mMI:I:1100%
Prosecuted Immm:m::::::t::::::::MlWW:n;:;i:Wm::W;;:mliil 73%
Convicted 1::::;:::m:t:r:rtm::J:::::::::m:iffltttm::ml 56%
Prison 1:::;tf::::;::@::::m:::::::::::::::::::::!%i::::j:1:::!46%
Probation fMN 10% o
I 50
Property offenses-fraudulent
I 100%
Investigated 1m::::t::m:;::::m::jtt:M::m::::::::::;:::::ttmm::::::::t:::::::::t:::::::::::::mm::::::::r::::::::r:r::::1100%
Prosecuted 1:::::::tt:::::rl:::m:rrmt::tt::w:mt:::::r::1 57%
Convicted m::m:::t::::::::m:::It;::::m:::::rtt:r:1 48%
Prison Rill 19%
Probation Il:t;:;:::}:::;;::::::::::1 24% o
I 50
Other property offenses
---, 100%
Investigated I::::::::::!:m:.::::l}@mtm:ml::::::::t@:l;::;:::!:m:if:;:::::::tm1:m:mmmt:::::r::::::{:::{:::11oo%
Prosecuted li:{:::;:::::::;::::::m::::i:::::i{::{:;:ijt;::::::\:i:i::::m::::.:@:::::::;::::::169%
Convicted 11@:;fm:::itiit{:::r:{:}::mmmrttJ 53%
prISOn~20%
Probation I:::::::.:::::::}:::::::::;}:I 26% o
I 50 I 100%
o 50 100%
Drug offenses
Investigated I::t::::::::::::::::r::::::::::m;::::;:::::::::mmmi;:f:::::mf:::::::m::::::::m:m::::i::::;::mt:.::::mmfn::::11 00%
Prosecuted 1~~~l~~~t~.lt~tl~~\[email protected]~i~~tlk.1 82%
Convicted Imm:::;::;:::::r:/tmr:;m,:m:rmm::{::t:::::::i:j:!ii:ft:tl 65%
Prison I::i:::j:j:j::it::::::mm::::i:::i:i:::j:m;j:::i:t:i:j::::::mi:1 50%
Probation JRl13% o
I 50 Property offenses-regulatory
I 100%
Investigated l:t::::::::::::::m::::::::::::::::m::::iIM;::::jjij:::::@:t::::::::::::::::;::::::::m:::fiii:lI:im;:::::::@::::::;::::::J 100%
Prosecuted Itt:::tt:t::rt::.::;::::t:m:mt:rrl 45%
Convicted IIlIIiIJ 32%
Prison a 9%
Probation ~ 15% o
I 50
Other public-order offenses
I 100%
Investigated l:j::::::m::ll:;1i:i:t::;i{::::::::;:::::;:;::::::t::::jmmi::;mmf,j':@Wt:::;:mt:::im:;:::I:::::;::':;:::!100%
Prosecuted 1.:::tT:t::f:mtl1::::!~W::ml~:::::i@:::::::::::::::j::::::\::iii:1 78%
Convicted Itmmrt:tfm:::::tm::::tr:::::mmm:fi::ttI56%
Prison h:w:rtH 14%
Probation ,.j::::::::] 12% ____ .,.1 ________ ."
o 50 100%
Note. See data note 1. sentenced to prison or probatlon were sentenced by maglstrattls or received a fine-only sentence In Federal court Probation eXCludes persons sentenced to prison
"In~: ... des magistrate proceedings. t Prison Includes split, life, Indeterminate, regular, and youth sentences. Offenders not shown as
FIgIIM2
System overview 5

Chapter 1
Prosecution
Criminal investigation
... .. Matters referred to U.S. Attorneys
.. ,..
~
Other secution pro
or resolution
Prosecution declined
Prosecution --.. .. Cases filed in District Court
... Referred to " magistrates
Suspects arrested at the time of offense
First appearance
.4f'.
Chapter 1: Prosecution 7

Federal criminal cases may be Matters received U.S. Attorneys prose::uted 58% of brought by the U.S. Attorney's Office, (table 1.1) the suspects in U.S. district court, de-by the Criminal Division of the U.S. clined to prosecute 30%, and referred Department of Justice, or by other Over 1 00,000 suspects were in- 12% for disposition by U.S. Magis-authorized agencies. volved in matters received by the trates. Of the 54,746 suspects in
U.S. Attorneys In 1988 (table 1.1), matters filed as cases for prosecution Most commonly, Investigations are approximately the same number as In in U.S. district court, 36% (19,725
referred to the U.S. Attorney by the 1986. About a fourth of these sus- suspects) were investigated in con-Criminal Division of the U.S. Depart- pects (24,870) were investigated for nection with drug offenses (an ment of Justice, by a Federallnvesti- fraudulent property offenses, which increase from 33% in 1987); 22% gative agency (primarily the Drug include fraud (except tax fraud), for- (12,273 suspects) with fraudulent Enforcement Administration; Federal gery, embezzlement, and counterfelt- property offenses; and 7% (3,746 Bureau of Investigation; Postal In- Ing. Of these, 16,857 persons (17% suspects) with conspiracy, aiding and spection Service; Bureau of Alcohol, of all suspects in matters received) abetting, and jurisdictional offenses. Tobacco and Firearms; or Secret were Investigated for frauds other Service), 0" by a State or locallnves- than tax fraud. Prosecution rates, by offense. tigative agency. Investigations may
Drug offenses as a group accounted Among matters concluded In 1988,
also be Initiated and cases brought U.S. Attorneys prosecuted 76% of ali directly by U.S. Attorneys or by the for 28% of all suspects in matters suspects in drug offense matters, and Criminal Division of the U.S. Depart- received, compared to 18% In 1984, 78% of suspects in robbery matters ment of Justice. This chapter reports and 21 % In 1986. Drug offenses In- (table 1.2). Sixty-eight percent of only on suspects Investigated by U.S. clude possession, manufacturing, im- suspects in tax law vioiations were Attorneys. porting, and trafficking In narcotics, prosecuted, but oniy 48% of suspects
controlled substances, and marijuana, in fraud matters other than tax fraud. Investigations referred to the U.S. as well as any unspecified drug- Fewer than 40% of suspects in reg-
Attorneys may be Immediately de- related offense other than conspiracy. ulatory matters were prosecuted, clined for prosecution or pursued although antitrust and food and drug further. In the latter case, additional Regulatory offenses accounted for matters had prosecution rates ap-investigation may be conducted in 8% of all suspects In matters re- proximately twice this high. order to determine whether the mat- celved; 7% of all suspects were in-ter should be flied as a case In the vestlgated for Immigration offenses; Magistrates. Some criminai cases Federal courts, referred to a U.S. and 4% were investigated for weap- are referred to U.S. Magistrates for Magistrate for disposition, or declined ons offenses. processing. Most U.S. Magistrates' for prosecution. Matters that are caseloads are primarily misdemean-declined may be referred to another Violent offenses accounted for 5% of ors, but referral practices vary among authority for prosecution or settled all suspects. Half of these were in- U.S. district courts. Overall, 12% of through alternative resolution proce- vestigated for robbery (2% of all sus- suspects in matters concluded in dures. pects). Four percent of the suspects 1988 were disposed by U.S. Magis-
Declination policies frequently limit were Investigated for non-fraudulent trates (table 1.2). However, 64% of property offenses, mostly larceny (3% all immigration suspects were dis-
the types of matters that will be flied of all suspects). posed by U.S. Magistrates. Magis-as cases or stipulate the level of trate proceedings played a significant Investigation that must be GOI"1pleted Six percent of suspects could not be role in the disposition of escape sus-before a presentation can be ac- classified by substantive offense pects (30%) and persons suspected cepted as a matter. Individual pol- because the recorded United States of violating migratory bird laws (23%). Icles vary widely across Federal Code citations referred to offenses districts and may be Influenced by a such as conspiracy and aiding and Basis for declination variety of factors, including Federal abetting. (tables 1.3 and 1,4) prosecutorlal policies, regional needs, and Individual U.S. Attorneys' prior- Disposition of matters concluded A variety of factors influence the Itles and staff resources. (table 1.2) determination to decline prosecution
For purposes of statistical calcula-of a case (table 1.3).
Matters Involving 94,548 suspects tlons, only those Investigations and were concluded by U.S. Attorneys in Twenty-two percent of suspects in other actiVities requiring over one calendar year 1988 (table 1.2), an matters declined were not prosecuted hour's attention are classified as mat- Increase of 3.5 percent since 1987.1
ters by the U.S. Attorneys.
, Federal Criminal Case Processing, 1980-89, with Preliminary Data for 1990, Bureau ... of Justice Statistics, October 1 !)91, (NCJ-130526).
Chapter 1: Prosecution 9

because the evidence was too weak. Sixteen percent were not prosecuted due to the lack of a prosecutable offense. The majority of these were declined either because U.S. Attorneys ascertained that no Federal law was Involved (8%) or because they found no proof of criminal Intent (7%).
Another 5% of all suspects In matters declined were not prosecuted due to minimal Federal Interest.
The U.S. Attorneys' decisions not to prosecute, however, do not automatically relieve suspects of all further action: 24% of the 28,825 suspects In matters declined by U.S. Attorneys were referred for criminal prosecution elsewhere or prosecuted In other actions; 7% were subject to some noncriminal proceedings, such as pretrial diversion (4%) or civil or administrative alternative actions (3%).
Among matters declined, those Involving escape, drug offenses, robbery, kidnapping, burglary, and transportation of stolen property were more often referred to other authorities for prosecution than were other declined offense types (table 1.4). Combining the 2,040 drug suspects referred to other prosecution with the 21,096 drug suspects prosecuted In Federal courts or heard by U.S. magistrates, shows that 90% of drug suspects in matters concluded in 1988 were either prosecuted or referred for prosecution In another jurisdiction.
Noncriminal resolutions were widely used in forgery and embezzlement matters (20% and 19%, respectively) .. Civil proceedings were also commonly used in immigration matters.
Processing time (table 1.5)
Processing time for matters is measured in months from the time a matter is received by the U.S. Attorney to the time of declination, filing as a case, or disposition by a U.S. Magistrate.
The average processing time for all matters concluded gradually Increased to 9 months In 1988 (table 1.5) from 7 months In 1984. Average processIng time was higher where prosecution was declined (16 months) than where a matter was filed as a case (6 months).
The average processing time for declination was also longer than for any actions by U.S. Magistrates (1 month where suspects were convicted by a U.S. Magistrate; 9 months where suspects were acquitted).
Across all offenses, average processing time for cases filed In court was longest for suspects charged with fraudulent property offenses (9 months if the matter was flied as a case; 18 months if the matter was declined). Suspects In fraudulent property crimes who were disposed by U.S. Magistrates had an average processing time of 2 months If convicted and 9 months If acquitted.
10 Compendium of Federal Justice Statistics, 1988

Table 1.1 SusJ)octs In matters recolved by U.S. Attorneys, by offense, 1988
Suspects in criminal matterls
Most serious received by U.S. AttorneYfl
offense investigated Number Percent
All offense.a 100,948 100.0%
Violent offenses 4,843 4.8% Murder/manslaughter 464 .5 Assault 1,089 1.1 Robbery 2,386 2.4 Rape 282 .3 Other sex offensesb 324 .3 Kidnapping 178 .2 Threats against the President 119 .1
Property offenses 28,827 28.6%
Fraudulent offen ... 24,870 24.6% Embezzlement 5,474 5.4 Fraud (excluding tax fraud) 16,857 16.7 Forgery 2,419 2.4 Counterfeiting 120 .1
Other offense. 3,957 3.9% Burglary 93 .1 Larcenl 2,535 2.5 Motor vehicle theft 785 .8 Arson 28 --Transportation of stolencProperty 80 .1 Other property offenses 436 .4
Drug offenses 28,750 28.5%
Public order offenses 37,280 36.9%
Regulatory offenses 8,371 8.3% Agriculture 653 .6 Antitrust 99 .1 Labor law 49 ---Food and drug 720 .7 Motor carrier 154 .2 Other regulatory offenses 6,696 6.6
Other offenses 28,909 28.6% Weapons 3,982 3.9 Immigration offenses 7,255 7.2 Tax law violations
including tax fmud 1,704 1.7 Bribery 673 .7 Perjury 257 .3 National defense 604 .6 Escape 4,020 4.0 Racketeering and extortione 1,768 1.8 Gambling offenses 337 .3 Uquor offenses 31 --Mail or transport of
obscene material 191 .2 Migratory birds 1,094 1.1 Conspiracy, aiding and
abetting, traffic, and jurisdictional offenses 6,010 6.0
Other 983 1.0
- - Less than .05% dExcluding fraudulent property
B'ncludes suspects for whom offense offen!>es; including destruction of
category could not be determined. property, trespass.
bMay include some non-violent I}Predominantly prosecution under the Racketeer Influenced and offenses. Corrupt Organization Act.
cExcluding transportation of stolen See data notes 2 & 3. property.
Chapter 1: Prosecution 11

Table 1.2 Disposition of suspects.ln motters concluded, by offense, 1988
Suspects In criminal matters concluded
Number Percent
Prosecuted Prosecuted Most serious in U.S. dis- Disposed by in U.S. dis- Disposed by offense investigated Total triet court Declined magistrate Total triet court Declined magistrate
All offensesB 94,548 54,764 28,825 10,959 100.0% 57.9% 30.5% 11.6%
Violent offenses 4,480 3,064 1,206 210 100.0% 68.4% 26.9% 4.7% Murder/manslaughter 335 213 117 5 100.0 63.6 34.9 1.5 Assault 1,OOS 600 291 117 100.0 59.5 28.9 11.6 Robbery 2,257 1,765 433 59 100.0 78.2 19.2 2.6 Rape 247 152 94 1 100.0 61.5 38.1 .4 Other sex offensesb 355 197 151 7 100.0 55.5 42.5 2.0 Kidnupping 169 91 72 6 100.0 53.8 42.6 3.6 Threats against
the President 108 46 47 15 100.0 42.6 43.5 13.9
Property offenses 27,468 14,612 11,277 1,579 100.0% 53.2% 41.1% 5.7%
Fraudulent offenses 23,675 12,273 10,090 1,312 100.0% 51.8% 42.6% 5.5% Embezzlement 5,339 3,191 1,805 343 100.0 59.8 33.8 6.4 Fraud
(excluding tax fraud) 15,633 7,481 7,379 773 100.0 47.9 47.2 4.9 Forgery 2,631 1,548 896 187 100.0 58.8 34.1 7.1 Counterfeiting 72 53 10 9 100.0 73.6 13.9 12.5
Other offenses 3,793 2,339 1,187 267 100.0% 61.7% 31.3% 7.00/0 Burglary 99 71 25 3 100.0 71.7 25.3 3.0 Larcenl 2,442 1,545 724 173 100.0 63.3 29.6 7.1 Motor vehicle theft 810 493 309 8 100.0 60.9 38.1 1.0 Arson 16 8 8 0 100.0 50.0 50.0 0 Transportation of
stolen property 71 25 45 1 100.0 35.2 63.4 1.4 Other property offensesd 355 197 76 82 100.0 55.5 21.4 23.1
Drug offenses 25,801 19,725 4,705 1,371 100.0% 76.5% 18.2% 5.3%
Public c.rder offenses 35,783 16,921 11,146 7,716 100.0% 47.3% 31.1% 21.6%
Regulatory offenses 7,824 3,064 4,301 459 100.0% 39.2% 55.0% 5.9% Agriculture 615 418 167 30 100.0 68.0 27.2 4.9 Antitrust 122 100 22 0 100.0 82.0 18.0 0 Labor law 40 19 21 0 100.0 47.5 52.5 0 Food and drug 624 494 59 71 100.0 79.2 9.5 11.4 Motor carrier 190 86 102 2 100.0 45.3 53.7 1.1 Other regulatory offenses 6,233 1,947 3,930 356 100.0 31.2 63.1 5.7
Other offenses 27,959 13,857 6,845 7,257 100.0% 49.6% 24.5% 26.00/0 Weapons 3,627 2,479 1,069 79 100.0 68.3 29.5 2.2 Immigration offenses 7,058 2,289 240 4,529 100.0 32.4 3.4 64.2 Tax law violations
including tax fraud 2,098 1,436 649 13 100.0 68.4 30.9 .6 Bribery 567 209 325 33 100.0 36.9 57.3 5.8 Perjury 255 144 110 1 100.0 56.5 43.1 .4 National defense 620 198 307 115 100.0 31.9 49.5 18.5 Escape 3,466 1,002 1,160 1,304 100.0 28.9 33.5 37.6 Racketeering and
extortione 1,896 926 941 29 100.0 48.8 49.6 1.5 Gambling offenses 330 246 82 2 100.0 74.5 24.8 .6 Uquor offenses 34 21 13 0 100.0 61.8 .38.2 0 Mail or Iranspo rt of
obscene material 134 78 54 2 100.0 58.2 40.3 1.5 Migratory birds 950 657 67 216 100.0 70.2 7.1 22.7 Conspiracy, aiding and
abetting, traffic, and jurisdictional offenses 6,1OS 3,746 1,587 775 100.0 61.3 26.0 12.7
Othqr 816 416 241 159 100.0 51.0 29.5 19.5
alncludes suspects for whom offense category could not be dExcluding fraudulent properly offenses; including destruction of determined. property, trespass.
bMay include some non-violent offenses. epredominantly prosecution under the Racketeer Innuanced and cExcluding transportation of stolen property. Corrupt Organization Act.
See data notes 2 & 3.
12 Compendium of Federal Justice Statistics, 1988

Tabkl1.3 Basis for declination of prosecution by U.s. Attorneys, 1988 Suspects in criminal matters declined by U.S. Attorneys
Basis tor declination Number Percent
Total declinations 28,825 100.0%
No crime 4,492 15.6% No true bill returned 47 .2 No tederal offonse 2,308 8.0 Lack of criminal intent 2,137 7.4
Referred or handled In other prosecution 7,045 24.4%
Removed 2,599 9.0 Prosecuted on other charges 1,305 4.5 Prosecuted by other authority 2,769 9.6 Complaint combined with
other indictment 326 1.1 Youthful offender transfer to
state o!1uthority 46 .2
Alternative resolution 2,158 7.5% Restitution 165 .6 Civil or administrative altemative 820 2.8 Pretrial diversion 1,173 4.1
Suspect-related reasons 753 2.6% Suspect serving sentenco 185 .6 No known suspect 273 ,9 Suspect a fugitive 105 .4 Suspect deceased 167 .6 Suspect deported 23 .1
Case-reiated reasons 7,638 26.5% Stale case 436 1.5 Weak evidence 6,358 22.1 Statute of limitations exceeded 262 .9 Jurisdiction or venue problems 289 1.0 Witness problems 293 1.0
All other roasons 6,739 23.4% Minimal Federal interest 1,5n 5.5 Petite policy 78 .3 Lack of resources 1,884 6.5 Financial Privacy Act 0 0 Tax Reform Act 1 --Court policy 25 .1 DOJ policy 532 1.8 U.S. Attorney policy 1,275 4.4 Speedy Trial Act 12 --Agency request 948 3.3 Juvenile suspect 33 .1 Offender's health, age, prior record
or other personal circumstances 164 .6 Suspect's cooperation 210 .7
- - Less than .05% See data note 2.
Chapter 1: Prosecution 13

-
Table 1.4 Disposition of matters declined for prosecution by U.S. Attorneys, by offense, 1988
Number of suspects In declined matters: Percent of suspects in declined matters: Resolved w~h Resolved wfth
Referred rest~ution, civiV Referred restftution, civiV or handled administrative or handled administrative
Most serious In other procedure, pre- In other procedure, pre-offense Investigated Total prosecutionS trial diversion Other Total prosecutions trial diversion Other
All offonsesb 28,825 7,045 2,158 19,622 100.0% 24.4% 7.5% 68.1%
Violent offenses 1,206 331 28 847 100.0% 27.4% 2.3% 70.2% Murder/manslaughter 117 21 0 96 100.0 17.9 0 82.1 Assault 291 42 20 229 100.0 14.4 6.9 78.7 Robbery 433 180 1 252 100.0 41.S .2 58.2 Rape 94 19 2 73 100.0 20.2 2.1 77.7 Other sex offensesc 151 28 2 121 100.0 18.5 1.3 GO.1 Kidnapping 72 31 2 39 100.0 43.1 2.8 54.2 Threats against the President 47 9 1 37 100.0 19.1 2.1 78.7
Proporty offenses 11,277 1,936 1,346 7,995 100.0% 17.2% 11.9% 70.9%
Fraudulent offen88s 10,090 1,597 1,249 7,244 100.0% 15.8% 12.4% 71.8% Embezzlement 1805 203 339 1,263 100.0 11.2 18.8 70.0 Fraud
(excluding tax fraud) 7,379 1,251 727 5,401 100.0 17.0 9.9 73.2 Forgery 896 143 182 571 100.0 16.0 20.3 63.7 Counterfeiting 10 0 1 9 - - - -
Other offenses 1,187 339 97 751 100.0% 28.6% 8.2% 63.3% Burglaryd 25 12 1 12 100.0 48.0 4.0 48.0 Larceny 724 198 7S 453 100.0 27.3 10.1 62.6 Motor vehicle theft 309 96 11 202 100.0 31.1 3.6 65.4 Arson 8 4 2 2 - - - -Transportation of
stolen property 45 17 1 27 100.0 37.8 2.2 60.0 Other property offensese 76 12 9 55 100.0 15.8 11.8 72.4
Drug offenses 4,705 2,040 224 2,441 100.0% 43.4% 4.8% 51.9%
Public ordor offenses 11,146 2,521 525 8,100 100.0% 22.6% 4.7% 72.7%
Regutstory offenses 4,301 361 247 3,693 100.0% 8.4% 5.7% 85.9% Agriculture 167 53 19 95 100.0 31.7 11.4 56.9 Antitrust 22 6 0 16 100.0 27.3 0 72.7 Labor I ... w 21 1 8 12 100.0 4.8 38.1 57.1 Food and drug 59 17 3 39 100.0 28.8 5.1 66.1 Motor carrier 102 8 2 92 100.0 7.8 2.0 90.2 Other regulatory offenses 3,930 276 215 3,439 10o.G 7.0 5.5 87.5
Other offenses 6,845 2,160 278 4,407 100.0% 31.6% 4.1% 64.4% Weapons 1,069 307 28 734 100.0 28.7 2.6 68.7 Immigration offenses 240 57 35 148 100.0 23.8 14.6 61.7 Tax law violations
including tax fraud 649 121 16 512 100.0 18.6 2.5 78.9 Bribery 325 24 16 285 100.0 7.4 4.9 87.7 Perjury 110 17 5 88 100.0 15.5 4.5 80.0 National defense 307 22 11 274 100.0 7.2 3.6 89.3 Escape 1,160 815 19 326 100.0 70.3 1.6 28.1 Racketeering and extortion' 941 152 23 766 100.0 16.2 2.4 81.4 Gambling offenses 82 38 0 44 100.0 46.3 0 53.7 Uquor offenses 13 4 1 8 - - - -Mail or transport of
obscene material 54 11 2 41 100.0 20.4 3.7 75.9 Migratory birds 67 15 18 34 100.0 22.4 26.9 50.7 Conspiracy, aiding and
abetting, traffic, and jurisdictional offenses 1,587 393 98 1,096 100.0 24.8 6.2 69.1
Other 241 184 6 51 100.0 76.3 2.5 21.2
- Teo few cases to obtain statistically reliable data. dExcluding transportation of stolen property. Blnclucles suspects in matters removed, prosecuted on other eExcluding fraudulent property offenses; including destruction of charges, prosecuted by other authorities, complaints filed with property, trespass. other indictments and those transferred to State authority (youthful , Predominantly prosecution under the Racketeer Influenced and offender). Corrupt Organization Act.
blncludes suspects for whom offense category could not be determined. See data notes 2 & 3.
~ay include some non-violent offenses.
14 Compendium of Federal Justice Statistics, 1988

Tabla 1.5 Average processing time from receipt to filing or declination, by offense, 1988
Average time per suspect from receipt of matter to decision
Disposed by magistrate Concluded by U.S. Attorney Prosecuted in
Most serious Not U.S. district offense Investigated Total Total Convicted convicted Total court Declined
All offoneesa B.B moe. 3.7 mos. .9 mos. S.6 mos. 9.5 mos. 6.1 mos. 15.9 mos.
Vlolont offooses 7.8 4.2 2.3 5.0 6.6 3.8 13.5
Property otfen8G8 6.5 5.0 2.6 8.9 12.8 8.6 18.1
Fraudulent off(,nsesb 12.9 4.8 2.4 9.1 13.3 9.2 18.3 Other offenses 9.2 6.3 3.8 8.6 9.4 5.8 16.4
Drug otfon808 12.3 4.3 1.4 5.5 5.8 4.0 13.2
Public order offooses 5.3 3.3 .6 10.3 10.1 6.6 15.3
Regulatory offenses 9.9 3.7 2.8 4.5 10.3 6.1 13.2 Other offensesc 8.2 3.3 0 11.0 10.0 6.7 16.5
Number of suspectsd 92,882 10,878 6,946 3,932 82,004 53,344 28,660
alncludes suspects for whom offense category could not be dExcludes suspects with insufficient data to determine determined. processing time.
bExcluding tax fraud. See data note 2. clncluding tax fraud.
Chapter 1: Prosecution 15

--------- ---
Chapter 2
Pretrial release
Release .... ,n
No violation
Violation of conditions
.
... II"" Revocation hearing
Continued ... I--r~e/r-Iease ...
Release
Detained
Detention -. hearing ~
First Detention
appearance --110. Temporary u.. --., detention I II""~----.....
Deportation Exclusion
... Preliminary hearing
Chapter 2: Pretrial release 17
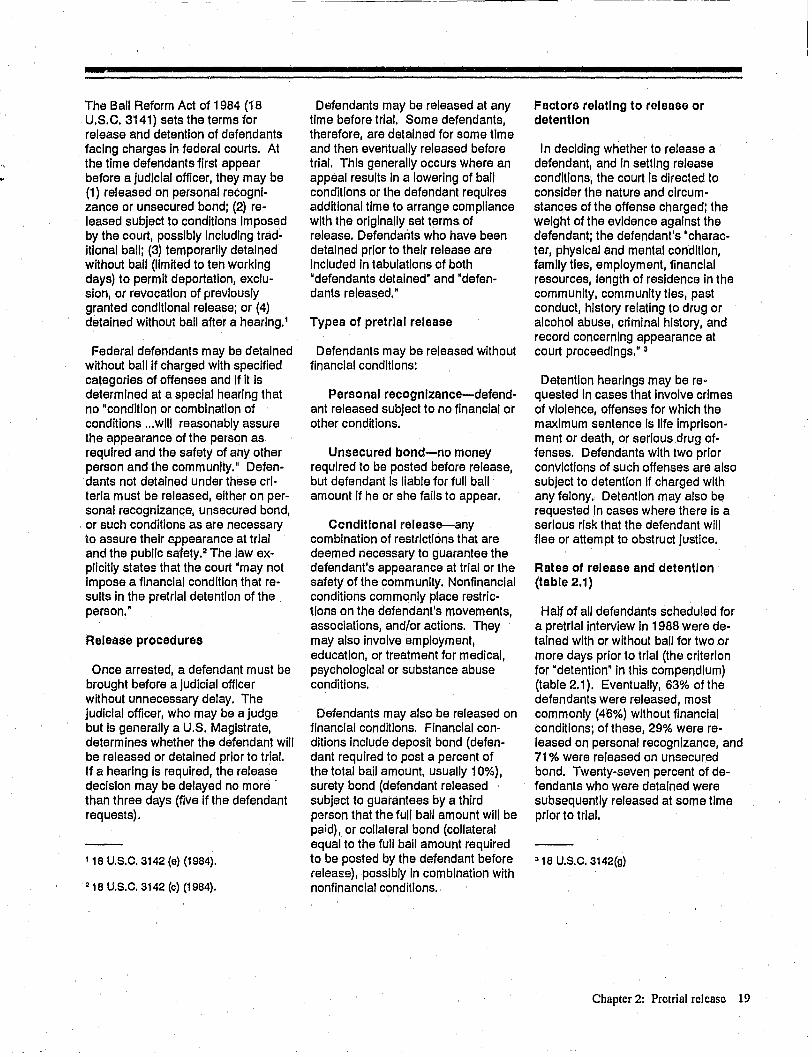
The Ball Reform Act of 1984 (18 U.S.C. 3141) sets the terms for release and detention of defendants facing charges In federal courts. At the time defendants first appear before a judicial officer, they may be (1) released on personal recognizance or unsecured bond; (2) released subject to conditions Imposed by the court, possibly Including tradItional ball; (3) temporarily detained without ball (limited to ten working days) to permit deportation, exclusion, or revocation of previously granted conditional release; or (4) detained without ball after a hearlng.1
Federal defendants may be detained without ball If charged with specified categories of offenses and If It Is determined at a special hearing that no "condition or combination of conditions ... wlll reasonably assure the appearance of the person as required and the safety of any other person and the community." Defendants not detained under these criteria must be released, either on personal recognlzancs, unsecured bond, or such conditions as are necessary to assure their appearance at trial and the public sa1ety.2 The law explicitly states that the court "may not Impose a financial condition that results In the pretrial detention of the person."
Release procedures
Once arrested, a defendant must be brought before a judicial officer without unnecessary delay. The judicial officer, who may be a judge but Is generally a U.S. Magistrate, determines whether the defendant will be released or detained prior to trial. If a hearing Is required, the release decision may be delayed no more' than three days (five if the defendant requests).
118 U.S.C. 3142 (El) (1984).
218 U.S.C. 3142 (c) (1984).
Defendants may be released at any time before trial. Some defendants, therefore, are detained for some time and then eventual/y released before trial. This generally occurs where an appeal results In a lowering of ball conditions or the defendant requires additional time to arrange compl/ance with the originally set terms of release. Defendants who have been detained prior to their release are included In tabulations of both "defendants detained" and "defendants released."
Types of pretrial release
Defendants may be released without financial conditions:
Personal recognizance-defendant released subject to no financial or other conditions.
Unsecured bond-no money required to be posted before release, but defendant Is liable for full ball amount If he or she falls to appear.
Ccnditlonal release-any combination of restrictions that are deemed necessary to guarantee the defendant's appearance at trial or the safety of the community. Nonfinancial conditions commonly place restrictions on the defendant's movements, associations, and/or actions. They may also involve employment, education, or treatment for medical, psychological or SUbstance abuse conditions.
Defendants may also be released on financial conditions. Financial conditions Include deposit bond (defendant required to post a percent of the total bail amount, usually 10%), surety bond (defendant released subject to guarantees by a third person that the full ball amount will be paid), or collateral bond (collateral equal to the full bail amount required to be posted by the defendant before release), possibly In combination with nonfinancial conditions.
Factors relating to release or detention
In deciding whether to release a defendant, and In setting release conditions, the court Is directed to consider the nature and cirCUmstances of the offense charged; the weight of the evidence against the defendant; the defendant's "character, physical and mental condition, famlfy ties, employment, financial resources, length of residence In the community, community ties, past conduct, history relating to drug or alcohol abuse, criminal history, and record concerning appearance at court proceedings." 3
Detention hearings may be requested In cases that Involve crimes of violence, offenses for which the maximum sentence Is life Imprisonment or death, or serious drug offenses. Defendants with two prior convictions of such offenses are also subject to detention If charged with any felony. Detention may also be requested In cases where there Is a serious risk that the defendant will flee or attempt to obstruct Justice.
Rates of release and detention (table 2.1)
Half of aI/ defendants scheduled for a pretrial Interview In 1988 were detained with or without ball for two or more days prior to trial (the criterion for "detention" In thIs compendium) (table 2.1). Eventual/y, 63% of the defendants were released, most commonly (46%) without financial conditions; of these, 29% were released on personal recognizance, and 71 % were released on unsecured bond. Twenty-seven percent of defendants who were detained were subsequently released at some time prior to trial.
318 U.S.C. 3142(g)
Chapter 2: Pretrial release 19

AX
suspects charged with offenses specifically cited In the Ball Reform Act were more likely to be detained than others. OVer 70% of all alleged violent offenders were detained, Including approximately 80% of those charged with murder or kidnapping, and 90% of those charged with robbery or threats against the President.
More than half of defendants In weapons cases were detained. Burglary may also be treated as a violent offense for some purposes: two thirds of defendants accused of burglary were detained.
More than half of pretrial detainees were accused of drug offenses. The detention rate for defendants accused of drug trafficking was three times as high as that for those accused of possession (69% and 23%, respectively).
The high detention rate for Immigration offenses (58%) may be attributable to the nature of the offense: defendants accused of Immigration offenses may be detained to permit their transfer to Immigration and Naturalization Service (INS) custody or to facilitate their deportation. ~ Suspects In immigration offenses also often lack the community ties which would assure their appearance In court. Similarly, defendants charged with escape were often detained (80%).
Defendants charged with white collar offenses were unlikely to be detained while awaiting trial. Only 26% of those charged with fraudulent property offenses, 25% of those charged with regulatory offenses, and 9% of those accused of tax law violations were detained. Among released defendants charged with fraudulent property offenses, 27% were released on personal recognizance, 60% on unsecured bond, and 13% on financial conditions.
418 U.S.C. 3142 (d) (1984).
Types of detention (tables 2.1, 2.2, and 2.3)
Of the 19,168 persons detained for at least two days prior to trial, 60% were held without ball, and the remaining 40% were held because they could not meet the finaMlal conditions Imposed by the court (table 2.1). Seventy-six percent of those who were held without ball were ordered detained after a hearing to determine whether they posed a danger to the community (table 2.2). The remainder of those held without ball were temporarily detained to allow deportation, exclusion, or revocation of previously granted conditional release.
Hearings to determine dangerousness were held for 31 % of all defendants scheduled for pretrial Interviews In 1988 (table 2.3). Cases Involving violent offenses, drug offenses, and escape were more likely than others to result In a detention hearing (51 %, 46%, and 52%, respectively).
Seventy-four percent of the hearings resulted In a detention order. Alleged drug offenders made up 62% of all persons detained by this procedure. Defendants detained as a result of these hearings were held an average of 94 days while awaiting trial. Defendants who were temporarily detained or held on financial conditions averaged less than half as many days in detention (tables 2.2 and 2.3).
Men were more than twice as likely as women to be detained as a result of these hearings (table 2.3). Detention was also ordered with more than average frequency for Hispanic defendants (31 %), black and other minority races (24% and 29%, respectively), the unemployed (28%) or poorly educated (27% of those who did not finish high school), and those with a history of felony conviction (33%) or drug abuse (28%).
20 Compendium of Federal Justice Statistics, 1988
Incidence of pretrial violations (tables 2.4 and 2.5)
Pretrial misconduct Includes failure to appear at court, arrest for a new crime (either a felony or a misdemeanor), and any technical violation of the defendants' ball conditions. Overall, 10% of all defendants who completed a period of pretrial supervision In 1988 violated the terms of their pretrial release; 4% failed to appear; 3% were charged with a new offense (2% with felonies and 1 % with misdemeanors); and 5% committed technical violations of their ball conditions (table 2.4).
Released defendants charged with violent crimes were more likely to commit a pretrial Violation than other classes of defendants. Persons charged with drug offenses or violent crimes were significantly more likely than others to commit at least one pretrial violation (15% and 13%, respectively). Defendants accused of fraudulent property offenses or regulatory offenses committed fewer violations than other:> (6% and 5%, respectively) .
Violations were more likely for defendants released on financial conditions (15%) than for those released on personal recognizance (8%) or unsecured bond (9%) (table 2.5).
Revocation. Release was revoked for one third of the defendants who violated the conditions of their pretrial release. Alleged violent offenders who violated release conditions were returned to detention about half the time.
Because defendants on financial release were more likely than other released defendants to commit a violation of their release conditions, they were also more likely to have their release revoked: 4 percent of

all defendants released on financial defendants were more likely than talned at a significantly higher rate conditions were subsequently de- others to be released on unsecured than those who were employed at the tal ned, In contrast to 3% of defen- bond (38% vs. 31 % of whites and time of their arrest (60% vs. 44%, dants released on unsecured bond or 22% of ·others"). A quarter of defen- respectively). 5
on personal recognizance (table 2.5) dants who were of non-black minority . groups were released on their own Prior criminal record. Records on Defendant characteristics (table recognizance, compared to 12% of 24% of defendants showed one or 2.6) blacks and 13% of whites. more felony convictions; 14% had at
least one prior misdemeanor convlc-Sex. More than half of male defen- Age. In 1988 only 6% of Federal tlon but no felony convictions; and no
dants were detained for at least 2 criminal defendants were 20 years old criminal record was found for 62% of days, while approximately one third of or younger. Defendants aged 30 or defendants. Defendants with prior women were so held. Men were also under were more likely to be detained felony convictions were most likely to detained an average of 21 days long- (56%) than tho~g II) their thirties be detained at least 2 days (68%) er than women (68 days vs. 47 days, (52%) or older (39%). However, the and least likely to be released on per-respectively) (table 2.6). These fig- length of the detention period Is sonal recognizance (9%) or unse-ures may partially reflect the fact that shortest for the youngest defendants cured bond (24%). male defendants more frequently (52 days) and Increases steadily with commit those crimes that are likely to age to 72 days for those over 40 Drug use. In 1988, 21 % of defen-result In pretrial detention, such as years of age. dants admitted a history of drug violent offenses. abuse In their pretrial services Inter-
Educatlcln. The majority of defen- view. Defendants with a history of Women were more likely than men dants had either a high school drug abuse had a higher probability
to be released on personal recognl- education (33%) or less (37%), while of pretrial detention than other de-zance (19% vs. 12%, respectively) or only 9% of all defendants had com- fend ants (60% vs. 47%, respectively). on unsecured bond (46% vs. 30%, pleted college. College graduates respectively) . were detained at a significantly lower
rate than defendants with less edu-Ethnlclty. Overall, 29% of the cation. While 32% of the college
defendants Identified !l'Jemselves as graduates were detained before trial, ethnically Hispanic. In 1988 71 % of and 80% were eventually released, Hispanic defendants were detained 63% of defendants with less than a for 2 days or more before trial, com- high school education were detained pared to 42% of non-Hispanic defen- before trial, and only 57% were ever ~
dants. The high rate of detention released. among Hispanics probably refiects the fact that 84% of defendants In Marital and employment status. Immigration offenses are detained In 1988, 40% of defendants were (table 2.1) and that provisions of the married, 21 % were separated or Ball Reform Act speCifically permit the divorced, and 30% had never been temporary detention of defendants married. Married defendants were charged with Immigration offenses somewhat less likely to be detained pending deportation or transfer to the (43%) than defendants who were INS. divorced or separated (50%) or single
(56%). The higher rate of release Race. Twenty-nine percent of all may be attributable to the perception
defendants were described as either that married defendants have more black (25%) or ·other" (4%). In 1988 ties to the community and are there-whites were detained at a slightly fore presumed less likely to flee than lower rate than blacks (49% vs. 53%, single defendants. respectively) or other minority defen-
D In previous yoars, defendants' Income was dants (54%). White defendants were Employment status may also be more likely than others to be released regarded as Indicative of community strongly related to their chance of release.
on financial conditions (19% vs. 14% ties that would prevent flight. In 1988 These data are no longer reported by the
of blacks and 17% of ·others"). Black unemployed defendants were de-Pretrial Services Agency.
Chapter 2: Pretrial release 21

Table 2.1 Form of pretrial release or detention, by offense, 1988
Percent of defendants who at any tIme aftor InltialappearMce were:8 Number of defendants
Released on DetalnedC who at any tilV:'a after
Most serlolls Pers-,"lOal Unsecured Financial WI~out Financial appearance were:
offense charged recognIzance bond condlUonsb ball condlUonsb Total Released DetalnedC
All offenses 13,3% 32.4% 17.3% 30.1% 2Q.3% 37,999 23,955 19,168
VIolent offenses 15.9% 18.5% 8.0% 56.2% 15.1% 2,227 947 1,588 Murder/nonnegllgent
manslaughter 10.0 15.3 12.4 67.1 14.1 170 64 138 Manslaughter 77.4 12.9 6.5 9.7 3.2 31 30 4 Assault 26.7 32.3 8.3 38.4 9.5 529 356 253 Robbery 5.8 9.0 6.6 70.6 19.0 1,054 226 944 Rape 44.5 17.8 6.r 41.8 11.0 146 101 77 Other sex offenseso 20.9 42.9 13.5 25.8 12.9 163 126 63 KIdnappIng 12.2 17.8 8.9 60.0 17.8 90 35 70 Threats against the PresIdent 4.5 11.4 4.5 70.5 18.2 44 9 39
Property offenaea 21.4% 49.1% 10.5% 15.9% 11.3% 11,112 8,995 3,024 Fraudulent oHenaes 22.1 49.5 10.6 14.7 10.8 8,315 6,837 2,127
Embezzlement 33.0 56.5 3.6 3.4 3.4 1,511 1,406 102 Fraud (excluding tax fraud) 20.7 46.2 12.1 17.2 12.1 5,261 4,158 1,540 Forgery 16.5 54.9 11.1 18.1 12.9 1,100 907 341 Counterfeiting 16.0 50.1 16.5 15.8 16.7 443 366 144
Other offenses 19.1% 47.9% 10.1% 19.5% 12.5% 2,797 2,158 897 Burglaryf 14.2 21.6 10.1 51.4 15.5 148 68 99 Larceny 20.6 50.0 9.0 16.2 12.8 1,956 1,557 567 Motor vehicle theft 14.1 52.6 11.8 22.1 8.5 340 267 104 Arson 33.3 14.3 28.6 23.8 19.0 21 16 9 TransportatIon of stolen froperty 14.8 45.3 16.5 20.3 16.9 236 181 88 Other property offenses 22.9 42.7 6.3 26.f) 5.2 96 69 30
D~ug offenses 7.1% 23.8% 25.8% 39.0% 28.6% 15,933 9,014 10,781 Trafficking 5.9 23.7 26.2 40.1 29.3 15,351 8,580 10,650 Possession and other 36.8 24.6 13.2 11.5 11.0 582 434 131
Public order offenaes 13.7% 30.6% 13.0% 25.2% 18.1% 8,726 4,998 3,775 Regulatory offenses 19.1% 45.9% 16.1% 13.1% 11.6% 1,352 1,096 334
Agriculture 22.9 54.2 15.1 2.4 5.4 166 153 13 Antitrust 41.0 59.0 0 0 0 39 39 0 Labor law - - - - - 11 10 0 Food and drug 30.8 53.8 12.8 2.6 7.7 39 38 4 Molor carrier 21.9 62.5 12.5 3.1 3.1 32 31 2 Other regulatory offenses 16.9 43.3 17'.3 16.1 13.5 1,065 825 315
Other offenses 12.7% 27.7% 12.5% 27.4% 19.3% 7,374 3,902 3,441 Weapons 12.3 35.3 15.9 33.7 19.3 1,720 1,091 912 Immigration offenses 5.0 11.2 11.5 29.4 28.4 3,014 837 1,742 Tax law violations
including tax fraud 34.3 51.0 6.8 4.3 4.3 651 599 56 Bribery 13.2 58.6 19.0 2.9 18.4 174 168 37 Perjury 23.1 55.6 11.1 11.1 3.7 108 97 16 National defense 13.6 25.5 24.5 25.5 27.3 110 70 58 Escape 8.2 11.2 4.8 69.1 10.8 463 112 370 Racketeering and extorUonh 9.4 46.8 18.4 26.2 10.8 489 365 181 Gambling offenses 13.8 74.9 6.7 2.6 2.1 195 186 9 Uquor offenses - - - - - 19 18 2 Mail or transport of
obscene material 32.3 51.6 12.9 0 3.2 31 30 1 Traffic offenses 43.7 30.1 12.0 4.7 6.0 316 271 34 Migratory birds 10.0 50.0 35.0 0 15.0 20 19 3 Other 32.8 29.7 14.1 20.3 10.9 64 49 20
Note: The sum of the defendants released a Data describe number of defendants f Excluding transportation of stolen and delained exceeds 100% because some scheduled to be Interviewed. property. defendants who were initially detained even- b Includes deposit bond, surety bond, and 9 Excluding fraudulent property offensesj tually raised bail or had the conditions of their collateral bond. including destruction of property, tres-ball changed ~ rehearing or Bhpeal. Total
C Initially held two or more days. pass. also InclUdes efendants for w om release
h PredominantiK prosecution under the slatus data were unavailable. d Includes temporary detention and detention ordered after a pretrial detentlon hearing. Racketeer In! uenced and Corrupt
- Too few cases to obtain statistically reliable ° May Include some non-violent offenses. Organization Act.
data. See data notes 4 & 5.
22 Compelldium of Federal Justice Statistics, 1988

Table 2.2 PretrIal detention hearIng outcomes, by offense, 1908 Defendants with pretrial detention hearings
Number of defendants Percent of defendants
Most serious All Hearings Ordered Hearings Ordered Average days offense charged defendants held d&tcllned held detained detained
All offenaes8 37,999 11,809 8,729 31.1% 23.0% 94.2
Violent offenses 2,227 1,127 955 50.6% 42.9% 95.7 Murder/nonnegligent
manslaughter 170 112 96 65.9 56.5 104.9 Negligent manslaughter 31 3 1 9.7 3.2 -Assault 529 165 122 31.2 23.1 72.7 Robbery 1,054 659 602 62.5 57.1 95.8 Rape 146 57 39 39.0 26.7 99.8 Other seX offensesb 163 42 26 25.8 16.0 113.4 Kidnapping 90 63 44 70.0 48.9 114.8 Threats against the President 4' 26 25 59.1 56.8 107.8
Property offenses 11,112 1,403 980 12.6% 8.8% 74.6
Fraudulent offenses 8,315 947 630 11.4% 7.6% 69.8 Embezzlement 1,511 33 18 2.2 1.2 98.1 Fraud (excluding tax fraud) 5,261 700 477 13.3 9.1 71.2 Forgery 1,100 144 97 13.1 8.8 60.3 Counterfeiting 443 70 38 15.8 8.6 65.8
Other offenses 2,797 456 350 16.3% 12.5% 83.8 Burglary 148 59 55 39.9 37.2 131.9 Larcenl 1,956 270 198 13.8 10.1 69.9 Motor vehicle theft 340 44 38 12.9 11.2 62.2 Arson 21 7 5 33.3 23.8 -Transportation of stolen j'0perty 236 59 42 25.0 17.8 92.0 Other property offense:; 96 17 12 17.7 12.5 -
Drug offenses 15,933 7,377 5,370 46.3% 33.7% 106.2 Trnfflcklng 15,351 7,321 5,336 47.7 34.8 106.3 Possession and other 582 56 34 9.6 5.8 91.2
Public order offenses 8,726 1,902 1,424 21.8% 16.3% 65.4
Regulatory offenses 1,352 195 136 14.4% 10.1% 92.8 Agriculture 166 2 0 1.2 0 -Antitrust 39 0 0 0 0 -Labor law 11 0 0 - - -Food and drug 39 1 0 2.6 0 -Motor carrier 32 0 0 0 0 -Other regulatory offenses 1,065 192 136 18.0 12.8 92.8
Other offenses 7,374 1,707 1,288 23.1% 17.5% 63.0 Weapons 1,720 506 381 29.4 22.2 72.3 Immigration offenses 3,014 725 538 24.1 17.9 49.2 Tax law violations
including tax fraud 651 30 19 4.6 2.9 49.1 Bribery 174 6 4 3.4 2.3 -Perjury 108 11 5 10.2 4.6 -National defense 110 34 20 30.9 18.2 145.8 Es.cape 463 240 214 51.8 46.2 58.5 Racketeering and extortione 489 130 93 26.6 19.0 122.7 Gambling offenses 195 4 2 2.1 1.0 -Uquor offenses 19 0 0 0 0 -Mail or transport of
obscene material 31 1 1 3.2 3.2 -Traffic offenses 316 11 7 3.5 2.2 -Migratory birds 20 0 0 0 0 -Other 64 9 4 14.1 6.3 -
- Too few cases to obtain statistically reliable data. d Excluding fraudulent property offenses; inclucJing destruc-
Note: Defendants may also be detained for failure to meet bail conditions, or tion of property, trespass.
temporarily detained pending action of other agencies. e Predominantly prosecution under the Racketeer Influenced
a Total includes offenders whose offense category could not be determined. and Corrupt Organization Act.
b May include some non-violent offenses. See data notes 4 & 5.
c Excluding transportation qf stolen property.
Chapter 2: Pretrial release 23

Table 2.3 Pretrial detention hearings, by "lffender characteristics, 1988
Number of defendants Percent of defendants
Most serious All Hearings Ordered Hås Ordered Average days offense charged defendants held detained held detained detained
All defendants* 37,999 11,809 8,729 31.1% 23.0% 94.2 days
Sex Male 31,685 10,610 7,960 33.5% 25.1% 95.7 days Female 6,307 1,198 768 19.0 12.2 78.2
Race White 26,893 7,989 5,792 29.7% 21.5% 94.2 days Black 9,381 3,144 2,429 33.5 25.9 94.0 Other 1,574 626 466 39.8 29.6 95.9
Ethnlclty Hispanic 10,976 4,438 3,308 40.4% 30.1% 94.5 days Non-Hispanic 26,872 7,321 5,379 27.2 20.0 94.0
Age 16-18 years 575 177 130 30.8% 22.6% 68.7 days 19-20 years 1,574 517 390 32.8 24.8 85.2 21-30 years 13,773 4,629 3,472 33.6 25.2 88.9 31-40 years 12,221 4,003 2,947 32.8 24.1 95.9 Over 40 years 9,514 2,406 1,719 25.3 18.1 106.1
Education Less than high
school graduate 12,~84 4,716 3,573 36.3% 27.5% 94.5 days High school graduate 11,588 3,336 2,391 28.8 20.6 92.6 Some college 7,180 1,946 1,296 27.1 18.1 100.0 College graduate 3,019 641 425 21.2 14.1 99.7
Marital status Never married 10,675 3,687 2,814 34.5% 26.4% 90.7 days Divorced/separated 7,560 2,416 1,742 32.0 23.0 95.4 Married 14,260 3,756 2,608 26.3 18.3 97.6 Common law 2,532 1,024 736 40.4 29.t 100.2
Other 447 108 84 24.2 18.8 102.2
Employment statua at arrest Unemployed 13,990 5,210 4,045 37.2% 28.9% 90.4 days Employed 20,950 5,535 3,750 26.4 17.9 99.5
Criminal record No convictions 17,332 4,362 3,061 25.2% 17.7% 97.9 days Prior conviction
Misdemeanor only 5,430 1,542 1,078 28.4 19.9 87.2 Felony 8,981 3,876 3,118 43.2 34.7 92.4
Drug abuse No known abuse 26,765 7,682 5,467 28.7% 20.4% 97.5 days Drug history 6,918 2,599 1,962 37.6 2M 86.5
* Includes defendants for whom these characteristics are unknown. See data notes 4 & 5.
24 Compendiwn of Federal Justice StaJistics.1988

Tabls 2.4 Behavior of defendants released prior to trial, by offense, 1988
Percent of released defendants who had:
Violations while on release
New offense Technical violations Number of
Most serious No Failed to charned of bail Release released offense charged violation Total awear Felony Misdemeanor conditions revoked defendantsa
All offenses 89.60/0 10.4% 3.5% 1.70/0 .9% 5.1 % 3.5% 18,185
Violent offenseo 86.7% 13.3% 2.8% 2.1% 1.3% 7.9% 7.0% 776
Property offenses 112.7% 7.3% 1.9% 1.4% .9% 3.9% 2.7% 7,034 Fraudulent offensesb 93.9 6.1 1.7 .9 .7 3.5 2.2 5,340 Other offenses 81'-1.1 10.9 2.4 3.0 1.5 5.1 4.3 1,694
Drug offenses 84.8% 15.20/0 5.5% 2.4% 1.0% 7.4% 4.4% 6,488
Public ordor offenses 92.4% 7.60/0 3.4% 1.1% .6% 2.8% 2.7% 3,886 Regulatory offenses 94.8 5.2 1.3 1.1 .8 2.4 1.5 972 Other offensesc 91.7 8.3 4.1 1.1 .6 3.0 3.1 2,914
Note: Data describe defendants whose cases were disposed in BExcludes defendants who were released but whose records did 1988. A defendant with more than one tyfl!l of violation appears not contain sufficient information to determine type of release or in more than one column. A defendant WIth more than one of violation behavior. the same type of violation af,pears only once in that column. bExcluding tax fraud. Therefore, sum of individua violations exceeds the total. Not all violations resulted in revocation. c'ncluding tax fraud.
See data notes 4 & 6.
Table 2.5 Behavior of defendants released prior to trial, by type of release, 1988
Percent of released defendants who had:
Violations while on release
New offense Technical violations Number of
No Failed to charged of bail Release released * Type of release violation Tolal awear Felony Misdemeanor conditions revoked defendants
All types 89.60/0 10.4% 3.5% 1.7% .9% 5.1% 3.5% 18,185
Personal recognizance 91.7 8.3 2.1 1.4 .9 4.7 3.3 3,815 Unsecured bond 91.2 8.8 2.6 1.6 .8 4.5 3.1 9,378 Financial release 85.0 15.0 6.3 2.2 1.0 6.5 4.3 4,992
Note: Data describe defendants whose cases were disposed in *Excludes defendants who were released but whose records did 1988. A defendant with more than one typ's of violation appears not contain sufficient information to determine type of release or in more than one column. A defendant WIth more than one of vioiaiiofi behavior. the same type of violation af,pears only once in that column.
See data notes 4 & 6. Therefore, sum of individua violations exceeds the total. Not all violations resulted in revocation.
Chapter 2: Pretrial release 25

Table 2.6 Pretrial release and detention status, by defendant characteristics, 1988
Percent of defendants released at any time after Defendants detained two initial bail hearing or more days
Personal Percent Average Number Defendant Total reeagnl- Unsecured Financial of all days of defen-characteristics released zance bond conditions defendants detained dants
All defendants8 64.3% 13.3% 32.4% 17.3% 50.4% 65.3 days 37,999
Sex Male 61.1% 12.1% 29.8% 18.1% 53.8% 67.6 days 31,685 Female 80.6 19.3 45.6 13.7 33.5 46.6 6,307
Race White 64.4% 13.1% 31.3% 18.7% 49.3% 64.8 days 26,893 Black 63.9 11.7 37.5 13.7 52.9 66.9 9,381 Other 67.3 25.0 22.1 17.2 54.1 62.5 1,574
Ethnlclty Hispanic 42.6% 6.0% 15.9% 19.4% 71.0% 66.0 days 10,976 Non·Hispanic 73.3 16.3 39.2 16.5 42.0 64.8 26,872
Age 16-18 years 55.0% 17.9% 20.2% 12.9% 56.5% 52.2 days 575 19-20 years 57.1 13.2 27.8 14.4 56.2 56.7 1,574 21·30 years 59.2 11.7 29.4 16.8 56.3 61.8 13,773 31-40 years 64.5 12.4 32.1 18.8 51.8 67.8 12,221 OVer 40 years 74.4 16.4 39.2 17.6 39.1 71.7 9,514
Education Less than high
school graduate 56.8% 10.5% 27.3% 17.5% 62.7% 65.4 days 12,984 High school graduate 72.1 15.3 37.7 17.9 45.0 63.0 11,588 Some college 75.4 16.2 38.4 19.7 41.7 64.5 7,180 College graduate 80.0 17.4 42.3 19.3 32.4 63.6 3,019
Marital status Never married 61.9% 13.0% 31.3% 16.1% 56.3% 64.3 days 10,675 Divorced/separated 67.9 13.5 35.7 17.4 50.4 64.7 7,560 Married 72.9 14.9 36.4 20.5 43.3 64.6 14,260 Common law 57.0 11.5 26.6 17.5 65.6 66.3 2,532 Widowed 73.6 18.8 41.8 11.9 38.5 72.2 447
Employment status !It arrest Unemployed 58.0% 11.9% 30.2% 14.4% 59.8% 65.3 days 13,990 Employed 73.8 15.1 36.9 20.7 43.6 63.2 20,950
CrImInal recordb No convictions i58.1% 14.7% 34.7% 17.3% 44.3% 63.2 days 23,551
Prior conviction Misdemeanor only 71.S 14.9 36.0 19.4 48.3 56.5 5,430 Prior felony 50.2 8.6 24.2 16.2 67.9 72.5 8,981
Drug abuse No known abuse 69.8% 14.3% 35.8% 18.5% 46.9% 64.9 days 26,765 Drug history 60.7 12.7 29.6 17.0 60.1 62.1 6,918
Note: Data describe defendents interviewed during 1988 by the 81ncludes defendants for whom release status data were Pretrial Services Agencies. The sum of the defendants released and unavailable. detained exceeds 100% because some defendants who were
blncludes only those defendants whose PSA records explicitly initially detained eventually raised bail or had the conditions of their baii changed by rehearing or appeal. showed no prior convictions.
See data notes 4 & 5.
26 Compendiwn of Federal Justice Statistics, 1988

Chapter 3
Adjudication
Preliminary hearing
Referred fo
magistrates
.. ~
Cases fo frial
GUilty pleas
~ Acquitted
Federal ~ .. District
Court trial .... Sentencing . ~
(jury or GUilty verdicts t bench)
Acquitted
Magistrate hearing
Convicted
Chapter 3: Adjudication 27

Federal criminal cases may result in conviction of the defendant following either a plea or trial, acquittal of the defendant after trial, or dismissal of the case. Unless otherwise noted, data describe cases In F'sderal court and do not Include matters disposed by U.S. Magistrates.
Defendants In cases terminated (table 3.1)
Defendants convicted. Cases were terminated against 54,198 defendants In 1988 (table 3.1), about the same as In 1987. Of these, 43,550 (80%) were convicted. Of those defendants who were convicted, 37,033 (85%) pleaded guilty, and another 649 (1 %) pleaded nolo contendere.1 The remaining 5,868 (13%) were convicted at trials, most of which (77%) involved juries.
A total of 10,646 defendants were not convicted. Most of these (82%) had cases against them dismissed. Another 12% were acquitted by a jury, and 6% were acquitted In trials without juries. Of the 7,781 defendants who went to trial, 75% were convicted.
Defendants charged with embezzlement, forgery, tax law violations including tax fraud, burglary, robbery, and labor law violations were convicted at the highest rate (88% or higher). Conviction rates for the major categories of public order offenses were below the average rate (74% for regulatory offenses, and 75% for other public order offenses).
Trial vs, guilty pleas. Overall, 85% of all defendants convicted in 1988 pleaded guilty (table 3.1). Defendants charged with all types of fraudulent property offenses, immi-
1 A plea of nolo contendere does not concede guilt; therefore, it cannot be used in a civil action as an admission. Fed. R. Crim. P. 11 (e) (6).
gration offenses, and drug possession pleaded guilty significantly more often than average (90% or more). Defendants charged with drug trafffcking, or racketeering and extortion pleaded guilty less often than average (80% and 71 %, respectively).
Case-processing time (table 3.2)
Title I of the Speedy Trial Act of 1974, as amended, stipulates time reqUirements for processing criminal cases in Federal courts. Except for certain listed exclusions, Indictment must occur within 30 days of arrest; defendants are guaranteed at least 30 days to prepare for trial; and the Government must be ready for trial within 70 days. The Speedy Trial Act does not specify a time Interval from trial to sentencing, and the time limits set by the act exclude several enumerated periods of pretrial procedure such as time spent awaiting ruling on motions.2 As a result, the actual processing time for most defendants can be longer than these limits without violating the prOVisions of the act.
Overall, defendants in cases terminated in 1988 had their cases processed in an average of 10.1 months when cases were dismissed, 7.3 months when cases went to trial, and 5.4 months when convictions were by plea (table 3.2). Drug possession and trafffc offenses, which are relatively speedily settled, substantially reduced these average times. Excluding them, guilty pleas to other types of offenses required more than 6 months, trials averaged more than 8 months, and dismissals took over a year from filing to final disposition.
218 U.S.C.3161 etseq.
In addition, trials of defendants charged with Immigration offenses, assault, and weapons violations were faster than the average time for trials for other kinds of offenses. Guilty pleas were obtained with more than average speed from defendants charged with embezzlement, larceny, Immigration, and a few categories of regulatory offenses.
When charges of rape, assault, other sex offenses, embezzlement, bribery, gambling, and certain regulatory offenses were dismissed, the decision came substantially faster than dismissals for the average of other types of cases.
Drug trafficking, escape, and racketeering generally took longer than average time to dispose. In addition, fraud cases which went to trial took significantly longer than the average of other kinds of offenses, although pleas and dismissals were not significantly faster or slower than non-fraud cases.
Characteristics of convicted offenders (table' 3.3)
Data on offender characteristlcs are obtained from various sources, Including presentence investigations and pretrial interview records, which are available only for a subset of offenders. (See Methodology.) Some characteristics of offenders have changed since the first edition of this Compendium, covering cases terminated in 1984. The number of older offenders (over 40) increased from 25% in 1984 to 29% in 1988, with particularly large increases among those convicted of fraudulent property or public order offenses.
The number of Hispanic drug offenders increased from 19% of all drug offenders in 1984 to 27% in 1988. Over the same period oftime, the education level of convicted drug offenders fell. In 1984, 58% had completed high school, but by 1988 that proportion had fallen to 41 %.
Chapter 3: Adjudication 29

Those convicted of non-fraudulent property offenses also appear to be less well educated than In the past.
Sex. Across all offense categories, 83% of all offenders convicted In 1988 were male. The proportion of male offenders varied, however, by offense type: 94% of offenders convicted of violent offenses, 89% of those convicted of public order offenses, and 87% of those convicted of drug offenses were men.
Race. Overall, 72% of convicted offenders were described as white, 25% as black, and 3% as other, such as American Indian, Alaskan Native, Asian or Pacific Islander. Although the majority of convicted defendants were white, the percent varied by offense category: regulatory offenses, 82%; other public order offenses, 79%; drug offenses, 75%; violent offenses, 61 %; and non-fraudulent property crimes, 57% . Although nonblack minority offenders were only 3% of convicted offenders, they represented 12% of offenders convicted of a violent crime.
Age. More than one-third of convicted offenders {39%} were under 31 years of age. Thirty-two percent of offenders were 31-40 years of age, and 29% were over 40.
Offenders convicted of public order offenses were substantially older than other offenders; 43% of regulatory offenders and 39% of pther public order offenders were over 40. Offenders convicted of violent offenses were disproportionately young; 49% of them were 30 or younger, and 7% were under 21.
Education. F~iiy-one percent of all convicted ofiJenders had less than a high school education. Another 14% had completed high school, 26% had some college, and 11 % were college graduates.
Offenders convicted of violent or drug offenses were less educated than other categories of offenders.
Only 6% and 7%, respectively, held college degrees. Among property offenders, those convicted of fraudulent crimes were more than twice as likely to have finished college {17%} as others {8%}.
Marital status. Overall, 42% of convicted offenders were married, 28% had never married, 22% were divorced, and 7% had common law marriages. Offenders convicted of violent offenses departed substantially from this pattern; 43% of them had never married, and only 25% were married.
Employment. Overall, 40% of convicted offenders were unemployed at the time of arrest. An even higher percent of offenders convicted of violent crimes {63%} were unemployed at the time of arrest. The highest employment rate was found among offenders convicted of regulatory offenses, where the offenders' employment m1ght have been Involved In the offense. Even here, however, 31 % were unemployed.
Prior record. Thirty-one percent of convicted offenders had been convicted of at least one prior State or Federal felony offense. Another 18% had been convicted of misdemeanors only. For more than half of the offenders {51 %}, the present conviction was the first.
Offenders convicted of violent offenses, non-fraudulent property offenses, or non-regulatory publlcorder offenses had more serious criminal records than other offenders: 45% of offenders convicted of violent offenses, 35% of those convicted of non-fraudulent property offenses, and 41 %. of those convicted of nonregulatory public order offenses had previously been convicted of at least one felony offense.
Drug use. Twenty-two percent of convicted offenders had known histories of drug abuse. The history of drug abuse varied by offense
30 Compendium of Federa/Justice Statistics, 1988
category: Offenders convicted of violent or drug offenses were more likely to have drug histories {35% and 33%, respectively} than those charged with regulatory offenses {12%}, fraudulent property crimes {12%}, or non-regulatory public order offenses {17%}.
Matters concluded by U.S. Magistrates (table 3.4)
In addition to cases terminated In district courts, another 10,959 persons were brought before U.S. Magistrates In 1988 {table 3.4}. The largest group of these matters {41 %} Involved Immigration law violations. Another 12% were accused of escape.
Overall, 64% of these persons were convicted, a slight reduction from the rates for 1986 and 1987 {70% and 65%, respectively}. The conviction rate in matters disposed by magistrates was lower than the average rate of conviction for defendants in cases terminated by the district courts {81 %}. However, 95% of defendants who appeared before a U.S. Magistrate charged with Immigration offenses were convicted. Persons who appeared before U.S. Magistrates charged with violent offenses or drug offenses were acquitted approximately 70 percent of the time.

Table 3.1 Disposition of cases terminated In 1988, by offense
Number of defendants in terminated cases who were:
Percent Convicted Not convicted
of all Trial Trial Most serious defendants Guilty Nolo Non-
Juryb Non-
offense charged convicted Total plea contendere Jury Jury Total Dismisseda jury
All offensesc 80,4% 43,550 37,033 649 4,539 1,329 10,646 8,733 1,292 621
Violent offenses 83.0% 2,238 1,852 13 325 48 458 350 98 10 Murder/nonnegligent
manslaughter 76.3 103 72 0 31 0 32 16 16 0 Negligent
manslaughter 75.0 24 18 0 6 0 8 4 4 0 Assault 68.9 435 330 4 78 23 196 146 44 6 Robbery 90.0 1,194 1,038 5 145 6 132 111 21 0 Rape 77.9 127 103 3 20 1 36 28 8 0 Other sex offensesd 90.6 271 231 1 23 16 28 22 2 4 Kidnapping 81.4 57 38 0 18 1 13 11 2 0 Threats against
the President 65.9 27 22 0 4 1 13 12 1 0
Property offensos 83.7% 13,606 12,320 94 967 225 2,654 2,201 352 101
Fraudulent offenaes 85.20/0 9,840 8,976 61 727 76 1,713 1,403 270 40 Embezzlement 88.2 1,885 1,781 15 80 9 252 204 44 4 Fraud (excluding
tax fraud) 83.6 6,101 5,478 42 533 48 1,196 967 195 34 Forgery 89.4 1,176 1,103 3 57 13 140 126 13 1 Counterfeiting 84.4 678 614 1 57 6 125 106 18 1
Otl1Gr offenses 80.0% 3,766 3,344 33 240 149 941 798 82 61 Burglary 91.5 108 99 1 8 0 10 10 0 0 Larcenye 80.2 2,797 2,523 29 130 115 690 584 53 53 Motor vehicle theft 78.9 411 374 1 34 2 110 98 12 0 Arson - 9 7 0 1 1 0 0 0 0 Transportation of
stolen property 84.1 292 233 0 58 1 55 40 14 1 Other pro~rty
offenses 66.2 149 108 2 9 30 76 66 3 7
Drug offenses 82.9% 13,848 11,359 40 2,275 174 2,862 2,360 454 48 Trafficking 83.8 12,384 9,965 34 2,250 135 2,391 1,914 443 34 Possession and other 75.7 1,464 1,394 6 25 39 471 446 11 14
Public order offenses 74.8% 13,852 11,497 502 971 882 4,672 3,822 388 462
Regulatory offenses 74.1% 1,671 1,424 25 190 32 583 411 149 23 Agriculture 73.8 245 215 4 13 13 87 60 14 13 Antitrust 76.7 161 115 16 30 0 49 5 44 0 Labor law 93.3 28 28 0 0 0 2 1 1 0 Food and drug 73.8 45 41 0 4 0 16 13 3 0 Motor carrier 86.1 62 60 0 2 0 10 10 0 0 Other regulatory offenses 73.0 1,130 965 5 141 19 419 322 87 10
Other offenses 74.9% 12,181 10,073 477 781 850 4,089 3,411 239 439 Weapons 81.5 1,733 1,472 4 209 48 394 322 59 13 Immigration offenses 84.5 1,755 1,667 4 69 15 322 291 26 5 Tax law violations
including tax fraud 90.9 1,333 1,127 21 171 14 134 99 34 1 Bribery 80.8 198 159 1 38 0 47 28 19 0 Perjury 77.0 94 70 0 22 2 28 19 9 0 National defense 71.2 116 66 0 11 39 47 36 11 0 Escape 82.3 633 579 1 43 10 136 124 8 4 Racketeering and
extortiong 78.4 508 361 3 144 0 140 90 48 2 Gambling offenses 82.2 176 149 0 26 1 38 31 7 0 Uquor offenses - 6 6 0 0 0 4 4 0 0 Mail or transport of
obscene material 78.2 43 39 0 3 1 12 12 0 0 Traffic offenses 67.0 5,479 4,296 441 37 705 2,697 2,279 17 401 Migratory birds 63.5 33 24 1 4 4 19 15 0 4 Other 51.0 74 58 1 4 11 71 61 1 9
-Too feW cases to obtain statistically reliable data. clncludes defendants for whom offense f Excluding fraudulent property offenses;
81ncludes nolle prosequi, deferred prosecution, category could not be determined. Excludes including destruction of property, trespass. defendants for whom disposition could not gPredominanul prosecution under the I Jarcotics AddiCts Rehabilitation Act (NARA) be determined.
Titles I and II, and all dismissals. dMay include some non-violent offenses.
Racketeer In uenced and Corrupt Organiza-
blncludes mistrials. tionsAct.
eExcluding transportation of stolen property. See data note 7.
Chapter 3: Adjudication 31

Table 3.2 TIme from filing to disposition of cases terminated In 1988
Most serious Average time from filing to disposition for defendants in cases resulting in:
offense charged All outcomes Dismissal8 Guilty pleall Trialc
All off.., ... 6.4 mos. 10.1 mos. 5.4 mos. 7.3 mos. Violent off.., ... 6.5 mos. 8.9 mos. 5.8 mos. 7.6 mos.
Murder/nonnegligent manslaughter 7.1 - 6.8 7.3
Negligent manslaughter 6.2 - - -Assault 5.4 6.2 6.1 5.5 Robbery 6.9 13.4 5.8 9.2 Rape 5.3 3.1 5.3 7.8 Other sex offensesd 6.3 4.9 6.1 8.0 Kidnapping 10.9 - 7.5 8.5 Threats against the President 7.5 - 7.1 -
Property offen ... 6.0 mos. 9.3 mos. 5.1 mos. 8.3 mos. Fraudulent offen ... 6.2 moo. 10.0 mos. 5.3 mos. 8.9 mos.
Embezzlement 4.9 7.6 4.3 9.2 Fraud (excluding tax fraud) 6.6 10.4 5.5 9.1 Forgery 6.3 13.5 5.3 8.3 Counterfeiting 6.3 7.3 6.0 7.1
OtllGf offen ... 5.5 mos. 8.0 mos. 4.7 mos. 6.9 mos. Burglarv. 5.3 - 5.0 -Larcenye 5.1 8.1 4.2 6.0 Molor vehicle theft 7.0 7.7 6.9 7.1 Arson - - - -Tmnsportation of
stolen property 8.7 13.2 7.4 10.6 Other property offenses' 4.4 4.7 3.0 7.2
Drug offenHS 8.1 mos. 13.2 mos. 6.9 mos. 8.3 mos. Trafficking 8.7 15.2 7.6 8.3 Possession and other 3.1 4.6 2.3 7.5
Public order offense. 5.4 mos. 8.8 mos. 4.2 mos. 5.7 mos. Regulatory offense. 6.3 mos. 7.8 mos. 5.3 mos. 8.6 mos.
Agriculture 4.9 6.9 4.5 4.6 Antitrust 6.9 - 6.6 7.7 Labor law 3.5 - 2.9 -Food and drug 9.6 - 10.6 -Molor carrier 3.9 - 3.7 -Other regulatory offenses 6.6 8.2 5.3 9.6
Other offense. 5.2 mos. 9.0 mos. 4.0 mos. 5.2 mos. Weapons 7.2 12.6 6.3 6.2 Immigration offenses 5.3 13.0 3.9 5.6 Tax law violations
including tax fraud 7.1 17.6 5.9 8.6 Bribery 7.2 5.1 6.4 10.6 Perjury 7.4 - 6.8 7.7 National defense 8.5 12.2 6.9 8.1 Escape 14.5 36.8 10.6 7.3 Racketeering and extortiong 11.8 20.7 8.3 14.0 Gambling offenses 7.0 7.0 6.7 8.2 Uquor offenses - - - -Mail or transport of
obscene material 8.6 - 6.9 -Traffic offenses 2.8 5.7 1.5 2.1 Migratory birds 4.6 - 4.0 -Other 2.7 2.6 3.3 1.8
-Too few cases to obtain statistically reliable data. eExcluding transportation of stolen property. 81ncludes nolle prosequi; deferred prosecution; , Excluding fraudulent property offenses; including Narcotic Addicts Rehabilitation Act (NARA), litle I destruction of property. trespass. and II; and all dismissals. gPredominantly prosecution under the Racketeer
blncludes nolo contendere. Influenced and Corrupt Organizations Act. clncludes mistrials. See data note 7. dMay include some non-violent offenses.
32 Compendium of Federal Justice Statistics, 1988

Table 3.3 Characteristics of convicted offenders, 1988
Total Percent of offenders convicted of:
Offender number of All Violent Property offenses Drug Public order offenses characteristics offenders offenses offenses Fraudulent Other offenses Regulatory Other
Sox Male 27,370 82.9% 94.1% 71.6% 74.0% 87.1% 85.6% 90.2% Female 5,626 17.1 5.9 28.4 26.0 12.9 14.4 9.8
Raco White 23,091 71.6% 60.60/ .. 67.6% 57.20/ .. 74.8% 81.9% 79.0% Black 8,183 25.4 27.5 29.7 39.0 23.4 14.8 18.6 Other 971 3.0 11.9 2.7 3.7 1.9 3.4 2.4
Ethnlclty Hispanic 5,331 16.5% 6.1% 7.9% 5.3% 26.7% 10.0% 20.3% Non·Hlspanic 26,910 83.5 93.9 92.1 94.7 73.3 90.0 79.7
Age 16-18 years 433 1.3% 1.9% .5% 3.0% 1.5% .5% 1.2% 19·20 years 1,203 3.6 4.8 2.0 6.5 3.8 3.6 3.7 21-30 years 11,122 33.6 42.6 29.3 36.6 38.9 26.0 28.9 31-40 years 10,661 32.2 32.2 33.3 29.8 36.2 26.5 27.4 Over 40 years 9,664 29.2 18.4 34.8 24.1 19.7 43.3 38.8
Education Less than high
school graduate 12,130 49.5% 51.5% 36.1% 51.6% 56.8% 42.3% 53.20/ .. High school graduate 3,368 13.7 21.8 12.0 15.8 13.1 11.9 13.9 Some college 6,305 25.7 21.0 34.7 24.9 23.2 28.1 20.4 College graduate 2,724 11.1 5.7 17.2 7.6 6.8 17.7 12.4
Marital smtus Never married 9,005 28.1% 43.3% 23.5% 34.1% 29.6% 20.1% 26.0% Divorced/separated 7,165 22.4 25.1 ~~,8 23.6 22.0 17.6 20.8 Married 13,412 41.8 25.0 46.8 35.5 38.4 57.2 45.5 Common law 2,103 6.6 5.4 4.2 5.2 9.1 3.9 6.8 Other 364 1.1 1.2 1.6 1.5 .9 1.2 .8
Emplovment status at arrest Unemployed 4,731 40.3% 62.6% 35.3% 45.4% 41.2% 31.3% 39.20/0 Employed 7,021 59.7 37.4 64.7 54.6 58.8 68.8 60.8
Criminal record No convictions 7,545 59.8% 43.3% 69.5% 54.2% 57.5% 70.3% 54.0% Prior conviction
Misdemeanor only 1,573 31.0 29.8 28.3 30.5 30.7 29.7 35.6 Felony 3,489 68.9 70.2 71.5 69.0 69.3 70.3 64.4
Drug abuse No known abuse 8,844 78.0% 65.00/0 88.20/0 77.2% 66.6% 87.9% 83.4% Drug history 2,497 22.0 35.0 11.8 22.8 33.4 12.1 16.6
See data note 8.
Chapter 3: Adjudication 33

Table 3.4 Dispositions by U.S. Magistrates, by offense, 1988
Number of defendants In matters concluded
Not Percent Most serious offense investigated Total Convicted convicted convicted
All offenses8 10,959 6,994 3,965 63.8%
Violent offenses 210 64 146 30.5% Murder/manslaughter 5 1 4 -Assault 117 54 63 46.2 Robbery 59 5 54 8.5 Rape 1 1 0 -Other sex offensesb 7 1 6 -Kidnapping 6 0 6 -Threats against the President 15 2 13 -
Property offenses 1,579. 975 604 61.7%
Fraudulent offenses 1,312 848 464 64.6% Embezzlement 343 205 138 59.8 Fraud (excluding tax fraud) 773 548 225 70.9 Forgery 187 93 94 49.7 Counterfeiting 9 2 7 -
otheroffense8 267 127 140 47.6% Burglary 3 0 3 -LarcenyC 173 75 98 43.4 Motor vehicle theft 8 0 8 -Arson 0 0 0 -Transportation of stolen d'roperty 1 0 1 -Other property offenses 82 52 30 63.4
Drug offenses ',371 387 984 28.2%
Public order offenses 7,716 5,524 2,192 71.6%
Regulatory offenses 459 223 236 48.6% Agriculture 30 22 8 73.3 Antitrust Labor law 0 0 0 -Food and drug 71 4 67 5.6 Motor carrier 2 2 0 -Other regulatory offenses 356 195 161 54.8
other .offense8 7,257 5,301 1,956 73.0% Weapons 79 5 74 6.3 Immigration offenses 4,529 4,304 225 95.0 Tax law violations
including tax fraud 13 9 4 -Bribery 33 6 27 18.2 Perjury 115 91 24 79.1 Escape 1,304 17 1,287 1.3 Racketeering and extortione 29 1 28 3.4 Gambling offenses 2 2 0 -Uquor offenses 0 0 0 -Mail or transport of obscene material 2 0 2 -Migratory birds 216 194 22 89.8 Conspiracy, aiding and abetting, traffic
and jurisdictional offenses 775 532 243 68.6 Other 159 140 19 88.1
-Too few cases to obtain statistically reliable data. dExcluding fraudulent property offenses; including alncludes suspects for whom offense category could not be destruction of property, trespass. determined. epredominantly prosecution under the Racketeer
bMay include some non-violent offenses. Innuanced and Corrupt Organizations Act.
cE.'(cluding tram;portation of stolen property. See data note 2.
34 Compendium of Federal Justice StaJistics, 1988

Chapter 4
Sentencing
Sentencing
Federal prisons
,j~
Mix ad ence
~Ir sent
Supervised release
Fines and costs
Chapter 4: Sentencing 35

DependIng on the offense, convIcted offenders may be sentenced to Incarcerat/on, probat/on, a fine, or a comblnat/on of sanctions such as a split or mIxed sentence (ImprIsonment followed by a perIod of probat/on1). The court's sentencIng decIsIon Is Influenced by a number of factors IncludIng statutory penalties for the convIction offense, the serIousness of the offender's conduct In the offense, the offender's prIor record, the judge's assessment of an offender's prospects for rehabilitation, and any plea-bargainIng agreements that may have been made.
For offenses committed after November 1, 1987, explicIt guidelines prescribe a range of sentences for each combination of offense and offender characteristics. Most of the offenders convicted In 1988 were not subject to these guidelines because their offenses preceded the effective date of the guidelines.
Plea bargaining may reduce the offender's sentence by reducing the seriousness of the offense charged, reducing the number of counts In the IndIctment agaInst the defendant, or negotiating a lesser sentence for a given charge. Except where otherwise noted, tables In this chapter are based on the most serious offense of conviction and are not directly comparable with tables In earlier chapters that are based on most serious offense Investigated or most serious offense charged.
Offenders convicted and sentences Imposed (tables 4.1, 4.2)
Eighty percent of all offenders In cases terminated In 1988 were convicted (see Chapter 3). Of these, 39% were sentenced to Incarceration only,2 35% were sentenced to pro-
1 See Glossary for the distinction between split sentences and mixed sentences.
2 In this chapter, fines are not mentioned if snother sanction Is also Imposed. Statistics for numbers cf fined offenders refer only to tho,se with no other penalty.
batlon only, 15% were sentenced to both Incarceration and probat/on, and 10% were fined (table 4.1). (In most tables, the convIcted offenders who received split or mixed sentences are Included In both the probation and the Incarceration data.)
Overall, 54% of convicted offenders were sentenced to Incarceration, either alone or accompanied by probation or a fine. Offenders convicted of violent offenses-especially murder and robbery-were most likely to be Incarcerated (81%). Drug offenders were also frequently sentenced to prison (79%), Offenders convicted of public order offense charges were It:;ast likely to be Incarcerated (averaging 37%) (table 4.1). If traffic offenses are excluded, however, 56% of the remaining offenders convicted of public order offenses were Incarcerated.
Offenders convicted of property offenses (71 %) and regulatory offenses (65%) were most likely to be sentenced to some term of probation, eIther alone or as part of a sentence that Included Incarceration. Sentences combinIng probation wIth a term of Incarceration were frequently used with white collar and similar crimes such as fraud, violations of motor carrIer regulations, tax offenses, bribery, perjury, gambling, and racketeering or extortion (all over 20% of convicted offenders). These sentences were also frequently used to punish burglary and transportation of stolen propery.
Sixty-two percent of all offenders conVicted of traffic offenses were sentenced only to pay fines, as were 20% or more of offenders convicted of agriCUlture, antitrust, national defense, migratory birds, or food and drug violations. Except for 27 persons convicted of assault and two persons convicted of ·other" (possibly non- Violent) sex offenses, fines were never the sole punishment for violent offenses, burglary, or escape. Only 13 of the 11,561 convicted drug traffickers received no punishment other than a fine.
Relationship between sentence and method of case dispOSition (table 4.3)
Likelihood of Incarceration. Defendants who were convicted at trial received more severe sentences than defendants who pleaded guilty. Overall, 74% of offenders convicted at trIal were Incarcerated (with a prison sentence alone or a sentence that Included probation as well as prison), com pared to 51 % of offenders convicted by plea. Drug offenders who pleaded guilty were about six times as likely to avoid incarceration as those convicted at trial (24% vs 4%). Offenders who pleaded guilty to fraudulent property offenses were more than twice as likely to avoid Incarceration as those convicted at trial.
Length of sentence. Offenders sentenced to Incarceration as a result of a guilty plea received sentences averaging less than half as long as offenders convicted at trial. Offenders convicted at trial received sentences averaging 8.5 years; the average sentence for offenders convicted by plea was 3.7 years.
Characteristics of offenders sentenced to Incarceration (ta(;:)16 4.4)
The majority of offenders sentenced to Incarceration in 1988 were white (72%) and male (83%). The data Indicate that the percentage sentenced to Incarceration was not uniform across all categories of age, race, sex, and Hispanic status. However, no conclUsions can be drawn from the data about the Influence of these characteristics on sentencing. Such an assessment would require detailed Information for each category showing the presence or absence of factors that are legally intended to affect sentencing, such as weapon use, victim Injury, dollar loss, etc.
Women were substantiallY less likely to be confined than men who were convicted of similar offenses. In all, 67% of men and 40% of women were
Chapter 4: Sentencing 37

sentenced to be Incarcerated. The relationship between offenders' race and Incarceration Is not uniform across offense categories: black offenders convicted of violent and drug offenses were more likely to be Incarcerated than white offenders In the same categories, while white fraudulent property offenders had a higher Incarceration rate than black offenders convicted of offenses In the same category. Hispanic offenders convicted of public order, drug, and fraudulent property violations were more likely to be Incarcerated than were non-Hispanic offenders with the same category of charges.
OffEJnders with a history of convictions of prior offenses were sUbstantially more likely to be sentenced to Incarceration than were first offenders.
For every major offense category except drug offenders, a sentence of Incarceration was more likely to be given to offenders who had a history of drug abuse.
Information on prior histories of drug abuse Is obtained during Pretrial Services Agency (PSA) Interviews and Is not available for 70% of the offenders. Some Interviewees may lie, and offenders who are Indicted but not arrested and those who obtain release before a PSA Interview can take place are not necessarily Included In these data, which are, therefore, not necessarily representative of the total population of offenders sentenced to probation.
The few Federal offenders under the age of 21 were less likely to be incarcerated than older persons convicted of similar offenses.
Average prison sentence length (tables 4.2, 4.3 and 4.5)
The average prison sentence term Imposed for all offenders convicted in 1988 was 55 months. Offenders convicted of violent crimes received the longest prison sentences (111
= months average sentence for all violent offenses), Sentences for drug offenders were also much longer than average (71 months). For most other types of offenses, prison sentences averaged between two and three years. Notable exceptions were burglary (56 months), transportation of stolen property (51 months), weapons offenses (52 months), and racketeerIng or extortion (72 months). Short periods of Incarceration were Imposed for gambling (13 months), drug possession (14 months), some traffic offenses (4 months), some regulatory offenses (agriculture-7 months; antitrust-8 months), and immigration offenses (12 months).
Relationship of prison term to off(',nder characteristics (table 4.5)
For most offenses, younger persons were sentenced to shorter tGrms than older offenders. Similarly, women received sentences ranging from 26% to 45% shorter than those imposed on men Incarcerated for similar offense types.
The relaticl1shlp of sentence length to drug abuse was more complex. Offenders with a history of drug abuse received generally longer sentences (on average, 59 months) than those with no known drug involvement convicted of similar offenses (51 months). The average sentence Imposed on violent offenders with drug histories was 20% longer than that for violent offenders with no known drug abuse. For nonregulatory public order offenders, the sentences Imposed on drug offenders averaged 49% longer than those for offenders with no known drug history. On the other hand, for offenders convicted of a drug offense, those known to have previously been users themselves were given sentences averagIng 11 % shorter than those Imposed
. on non-drug offenders.
Convicted offenders with a prior felony conviction received sentences averaging 49% longer than first offenders convicted of similar offenses.
38 Compendium o!FederalJusticeStatisticsJ 1988

---=~------------------------------------------------------------~ Table 4.1 Sentence types In cases terminated, by offense, 1988
Percent of offenders convicted and sentenced to:
Most serious offense of conviction
Total offenders sentenced Incarcerations Probationb Split or
mixed sentencsc Fine
All offenses
Violent offonHs Murder/nonnegllgent
manslaughter Negligent manslaughter Assault Robbery Rape Other sex offensesd
Kidnapping Threats against the ?resident
Property offenses
Fraudulent offenaos Embezzlement Fraud (excluding tax fraud) Forgery Counterfeiting
Other offenses Burglary Larcenye Motor vehicle theft Arson Transportation of stolen,property Other property offenses
Drug offenses Trafficking Possession and other
Public ordor offen8Os
Regulatory offenses Agriculture Antitrust Labor law Food and drug Motor carrier Other regulatory offenstls
Other offenses Weapons Immigration offenses Tax law violations
including tax fraud Bribery Perjury National defense Escape Racketeering and extortiong
Gambling offenses Uquor offenses Mail or transport of
obscene material Traffic offenses Migratory birds Other
43,552
2,140
93 27
448 1,127
116 252
48 29
13,437
9,583 1,775 6,193 1,007
608
3,854 100
2,965 409
7 213 160
13,376 11,561
1,815
14,593
1,965 261 178
34 50 66
1,376
12,628 1,803 1,851
1,429 184 104 203 651 561 164
10
56 5,479
33 100
Note: Total includes convicted defendants whose sentence could not be determined.
-Too few cases to obtain statistically reliable data. aAiI sentences to incarceration, including split, mixed, life, indeterminate, and youth sentences.
blncludes offenders with split and mixed sentences. cSentences to probation combined with incarceration.
53.8%
81.0%
94.6 92.6 63.8 94.0 83.6 44.4 91.7 75.9
42.6%
43.6% 27.6 47.1 45.6 52.3
40.0"/0 84.0 33.0 71.6
1;2.0 32.5
79.20/0 88.2 22.1
37.0"/0
32.6% 19.9 24.2 17.6 16.0 40.9 36.6
37.7% 70.0 69.5
44.0 44.0 70.2 24.1 86.9 74.5 40.9
25.0 5.1
24.2 19:0
49.9%
31.4%
12.9 22.2 41.5 21.5 25.0 71.0 18.8 31.0
71.1%
73.5% 88.7 71.0 69.9 61.3
65.2% 39.0 69.7 39.9
70.0 56.3
35.2% 28.2 79.5
46.5%
65.2% 69.0 43.3 97.1 68.0 72.7 66.1
43.6% 44.6 37.4
78.6 75.0 55.8 55.2 19.2 46.9 79.3
73.2 35.4 66.7 54.0
14.7%
14.0"/0
7.5 14.8 12.1 15.4
9.5 16.3 10.4 10.3
18.0%
19.9% 17.5 21.B 16.1 15.0
13.2% 25.0 11.8 12.7
32.4 8.1
15.3% 16.8 6.2
11.1%
12.8% 11.5 19.1 14.7 8.0
24.2 11.8
10.9% 16.4 12.3
25.9 21.7 27.9 8.9 7.5
22.1 22.6
8.9 2.9
21.2 9.0
10.2%
1.4%
o o 6.0 o o
.8 o o 3.4%
1.8% 1.0 2.3
.5 1.0
7.4% o 8.7
.5
.5 16.3
.6%
.1 3.9
26.6%
14.1% 20.7 50.6 o
24.0 10.6 8.3
28.5% 1.6 1.5
3.1 2.7 1.9
22.2 o
.5 2.4
10.7 61.8 30.3 34.0
dMay include some non-violent offenses. eExcluding transportation of stolen property.
'Excludin~ fraudulent property offenses; including destruction of property, trespass.
gPrp.dominantly prosecution under the Racketeer Influenced and Corrupt Organizations Act
See data note 7.
Chapter 4: Sentencing 39
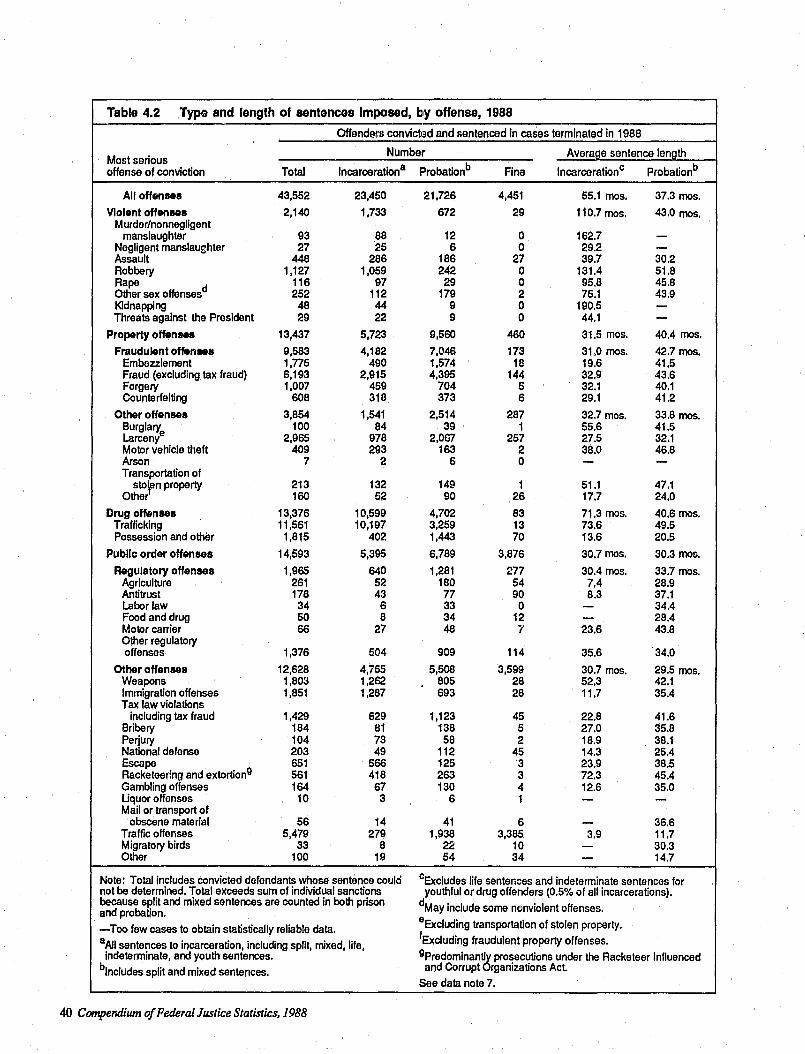
Table 4.2 Typo and length of sentencos Imposed, by offense, 1988
Offend~'s convicted and sentenced in cases terminated in 1988
Most serious Number Average sentence length
offense of conviction Total Incarcemtion8 Probationb Fine Incarceration C Probationb
All offen .. s 43,552 23,450 21,726 4,451 55.1 mos. 37.3 mos. Violent offenllOs 2,140 1,733 672 29 110.7 mos. 43.0 mos.
Murder/nonnegligent manslaughter 93 88 12 0 162.7 -
Negligent manslaughter 27 25 6 0 29.2 -Assault 448 286 186 27 39.7 30.2 Robbery 1,127 1,059 242 0 131.4 51.8 Rape 116 97 29 0 95.8 45.8 Other sex olfensesd 252 112 179 2 75.1 43.9 Kidnapping 48 44 9 0 190.5 -Threats against the President 29 22 9 0 44.1 -
Property offenMS 13,437 5,723 9,560 460 31.5 mos. 40.4 mos.
Fraudulent offen .. a 9,583 4,182 7,046 173 31.0 mos. 42.7 mos. Embezzlement 1,775 490 1,574 18 19.6 41.5 Fraud (excluding tax fraud) 6,193 2,915 4,395 144 32.9 43.6 Forgery 1,007 459 704 5 32.1 40.1 Counterfeiting 608 318 373 6 29.1 41.2
Other offenses 3,854 1,541 2,514 287 32.7 mos. 33.8 mos. Burglarye 100 84 39 1 55.6 41.5 Larceny 2,965 978 2,067 257 27.5 32.1 Motor vehicle theft 409 293 163 2 38.0 46.8 Arson 7 2 6 0 - -Transportation of
storn property 213 132 149 1 51.1 47.1 Other 160 52 90 26 17.7 24.0
Drug offanaea 13,376 10,599 4,702 83 71.3 mos. 40.6 mos. Trafficking 11,561 10,197 3,259 13 73.6 49.5 Possession and other 1,815 402 1,443 70 13.6 20.5
Public ordor offenses 14,593 5,395 6,789 3,876 30.7 mos. 30.3 mos.
Regulatory offenses 1,965 640 1,281 277 30.4 mos. 33.7 mos. Agriculture 261 52 180 54 7.4 28.9 Antitrust 178 43 77 90 8.3 37.1 Labor law 34 6 33 0 - 34.4 Food and drug 50 8 34 12 - 28.4 Motor carrier 66 27 48 ;' 23.6 43.8 Other regulatory offenses 1,376 504 909 114 35.6 34.0
Other offenses 12,628 4,755 5,508 3,599 30.7 mos. 29.5 mos. Weapons 1,803 1,262 . 805 28 52.3 42.1 Immigration offenses 1,851 1,287 693 28 11.7 35.4 Tax law violations
including tax fraud 1,429 629 1,123 45 22.8 41.6 Bribery 184 81 138 5 27.0 35.8 Perjury 104 73 58 2 18.9 38.1 National defense 203 49 112 45 14.3 25.4 Escape 651 566 125 3 23.9 38.5 Racketeering and extortionQ 561 418 263 3 72.3 45.4 Gambling offenses 164 67 130 4 12.6 35.0 Uquor offenses 10 3 6 1 - -Mail or transport of
obscene material 56 14 41 6 - 36.6 Traffic offenses 5,479 279 1,938 3,385 3.9 11.7 Migratory birds 33 8 22 10 - 30.3 Other 100 19 54 34 - 14.7
Note: Total includes convicted defendants whose sentence could cExcludes life sentences and indeterminate sentences for not be determined. Total exceeds sum of individual sanctions youthful or drug offenders (0.5% of all incarcerations). because split and mixed sentences are counted in both prison dMay include some nonviolent offenses. and probation. -Too few cases to obtain statistically reliable data. eExcluding transportation of stolen property.
aAiI sentences to incarceration, including split, mixed, life, fExcluding fraudulent property offenses. indeterminate, and youth sentences. gPredominan~ prosecutions under the Racketeer Influenced
blncludes split and mixed sentences. and Corrupt rganizations Act. See data note 7.
40 Compendium of Federal Justice Statistics. 1988

Table 4.3 Sentences Imposed on convicted offenders, by offense of conviction and method of disposition, 1988
Defendants sentenced to
Number of defendants in terminated some incarceration Number of cases convicted and sentenced to: Percent of all Average
Offense of conviction convicted Probationb defendants sentence
and method ot disposition defendants Incarceration8 Fine convicted lengthc
AU offen80s 43,552 23,450 21,726 4,451 53.8% 55.1 mos.
Guilty plead 37,682 19,103 19,600 3,933 50.7 44.6 Trial and other dispositionse 5,868 4,347 2,126 518 74.1 101.7
Violent offenses 2,'40 1,733 672 29 81.0% 110.7 mos. Guilty plea 1,776 1,427 578 22 80.3 100.5 Trial and other dispositions 363 306 94 7 84.3 16M
Property offenses
Fraudulent offen8G8 9,583 4,182 7,046 173 43.6% 31.0 mos. Guilty plea 8,748 3,557 6,541 160 40.7 25.4 Trial and other dispositions 835 625 505 13 74.9 63.2
Othor offenses 3,854 1,541 2,514 287 40.0% 32.7 mos. Guilty plea 3,487 1,332 2,307 249 38.2 29.4 Trial and other dispositions 366 209 207 38 57.1 54.1
Drug offenses 13,376 10,599 4,702 83 79.2% 71.3 mos. Guilty plea 10,972 8,292 4,234 77 75.6 56.9 Trial and other dispositions 2,404 2,307 468 6 96.0 123.6
Public order offenses
Regulatory offenses 1,965 640 1,281 277 32.6% 30.4 mos. Guilty plea 1,756 515 1,172 256 29.3 24.1 Trial and other dispositions 209 125 109 21 59.8 56.9
Othor offensec 12,628 4,755 5,508 3,599 37.7% 30.7 mos. Guilty plea 10,938 3,980 4,766 3,166 36.4 23.9 Trial and other dispositions 1,690 775 742 433 45.9 66.0
Note: Total inclUdes convicted defendants cExciudes offenders sentenced to life 81nciudes nolle f/osequi, deferred prosecu-whose sentence could not be determined. sentences and indeterminate sentences tion, Narcotic ddicts Rehabilitation Act aAIi sentences to incarceration, including for youthful or drug offenders. Includes (NARA) Titles I and II, and all dismissals. split, mixed, life, indeterminate, and youth prison portion of split or mixed sentences. See data note 7. sentences. dlncludes nolo contendere.
blncludes split and mixed sentences.
Chapter 4: Sentencing 41

Table 4.4 Convicted offenders sentenced to Incarceration, by offense and offender characteristics, 1988
Of all offenders convicted in cases terminated in 1988, the percent who were incarcerated
Property offenses Public order offenses Total Offender All Violent Drug number of characteristics offenses offenses Fraudulent Other offenses Regulatory Other offenders
All offenders * 53.8% 81.0% 43.6% 40.0% 79.2% 32.6% 37.7% 43,550
Sex Male 66.6% 83.70/0 51.4% 50.9% 87.6% 42.7% 55.8% 27,370 Female 39.6 67.9 28.5 23.4 71.7 18.0 34.7 5,626
Race White 64.0% 78.7% 47.5% 45.7% 84.3% 39.8% 58.9% 23,091 Black 61.6 89.4 40.6 41.6 89.8 37.6 58.1 8,183 Other 59.4 88.2 37.8 41.0 80.6 37.5 43.2 971
Ethnlclty Hispanic 78.4% 85.8% 53.3% 49.7% 89.1% 50.3% 73.8% 5,331 Non-Hispanic 60.2 82.S 44.5 43.6 84.2 38.2 54.5 26,910
Age 16-18 years 55.0% 83.3% 31.1% 18.9% 77.4% 12.5% 57.8% 433 19-20 years 56.7 83.1 33.1 32.4 81.7 27.8 49.3 1,203 21·30 years 64.8 88.5 40.5 47.1 84.2 41.2 59.7 11,122 31-40 years 66.1 83.8 45.9 49.6 86.5 37.7 62.8 10,661 OVer 40 years 53.8 67.7 47.2 36.8 87.9 35.1 42.5 9,664
Education Less than high
school graduate 71.6% 88.9% 47.2% 54.1% 89.0% 40.6% 69.0% 12,130 High school graduate 67.7 90.2 49.9 54.9 82.7 38.2 64.8 3,368 Some college 57.6 76.7 43.9 38.7 82.3 35.6 50.9 6,305 College graduate 55.5 42.2 53.9 36.4 76.5 49.2 48.3 2,724
Marital statU8 Never married 64.5% 84.3% 43.5% 45.8% 84.5% 37.2% 58.1 % 9,005 Divorced/separated 65.9 86.0 49.6 49.0 85.5 41.6 62.3 7,165 Married 59.4 75.4 43.2 37.8 85.9 39.4 54.5 13,412 Common law 77.0 90.0 56.3 58.6 88.8 44.6 75.2 2,103 Other 47.5 81.8 26.6 21.3 84.0 29.4 48.2 364
Employment status at arrest Unemployed 68.5% 88.6% 47.9% 56.1% 84.5% 48.5% 69.4% 4,731 Employed 57.4 67.2 40.9 38.8 82.3 36.9 54.3 7,021
Criminal record No convictions 54.3% 62.5% 38.1% 34.4% 79.9% 35.5% 50.9% 7,545 Prior conviction
Misdemeanor only 80.0 97.4 66.7 70.7 91.8 63.3 75.1 1,573 Felony 72.7 89,1 55.9 59.5 87.6 51.7 69.9 3,489
Drug abuse No known abuse 57.6% 73.9% 41.6% 41.7% 83.5% 38.7% 57.1% 8,844 Drug history 74.0 90.2 54.2 59.0 82.3 49.2 72.1 2,497
Note: Excludes corporations. Offenders are ciassified by the most *Includes offenders for whom these characteristics are unknown. serious offense of conviction. See data note 8.
42 Compendium of Federal Justice Statistics, 1988

Table 4.5 Average Incarceration sentence lengths Imposed, by offense and offender characteristics, 1988
Average sentence length for offenders convicted of:
OHender All VIOlent Property offenses Drug Public order offenses characteristics offenses offenses Fraudulent Other offenses Regulatory Other
All offenders * 55.1 moll. 110.7 mos. 31.0 mos. 32.7 mos. 71.3 mos. 30.4 mos. 30.1 mos.
Sex Male 58.6 mos. 112.3 mos. 33.0 mos. 35.0 mos. 74.8 mos. 32.8 mos. 34.1 mos. Female 36.6 82.6 22.7 20.9 50.5 17.9 19.8
Race White 54.2 mos. 115.1 mos. 33.4 mos. 34.8 mos. 68.8 mos. 34.3 mos. 31.3 mos. Black 63.2 123.7 26.0 31.6 82.8 20.8 42.3 Other 46.8 59.4 18.5 18.3 68.2 - 24.1
Ethnlclty Hispanic 56.8 mos. 114.5 mos. 24.8 mos. 35.3 mos. 74.6 mos. 23.7 mos. 21.2 mos. "Ion· Hispanic 56.1 110.5 31.7 32.9 71.3 33.0 37.3
Age 16-18 years 38.0 mos. 65.7 mos. - - 49.9 mos. - 9.9 mos. 19·20 years 44.2 70.4 12.4 27.2 59.3 - 17.9 21·30 years 52.6 107.8 23.2 29.6 64.1 25.8 27.1 31-40 years 60.6 124.9 30.2 37.6 74.8 39.5 39.5 Over 40 years 57.6 109.0 38.8 33.5 86.6 32.4 35.5
Education Less than high
school graduate 57.7 mos. 108.5 mos. 28.8 mos. 31.3 mos. 73.9 mos. 32.1 mos. 31.6 mos. High school graduate 65.9 132.1 41.0 36.7 72.8 30.6 48.0 Some college 55.2 111.1 33.0 33.9 70.8 37.0 35.6 College graduate 43.5 79.7 33.7 42.8 68.0 25.9 28.6
Marital status Never married 55.2 mos. 100.6 mos. 28.4 mos. 31.0 mos. 67.3 mos. 19.2 mos. 30.9 mos. Divorced/separated 59.8 128.1 35.4 31.7 72.7 38.3 40.1 Married 54.8 109.8 31.0 38.0 75.1 33.2 32.5 Common law 56.4 99.6 26.5 26.2 75.1 22.6 26.0 Other 69.8 - 27.2 - 19.8 - 46.9
Employment status at arRlst Unemployed 59.3 mos. 105.3 mos. 36.9 mos. 30.7 mos. 71.3 mos. 42.6 mos. 41.7 mos. Employed 50.0 122.1 32.2 52.8 89.5 - 45.7
Criminal record No convictions 47.8 mos. 11.9 mos. 28.6 mos, 25.5 mos. 64.9 mos. 32.3 mos. 28.6 mos. Prior conviction
Misdemeanor only 73.7 147.7 50.3 38.5 90.1 44.1 50.7 Felony 58.7 100.4 37.9 31.5 73.2 31.9 40.2
Drug abu!e No known abuse 50.8 mos. 87.6 mos. 032.3 mos. 29.6 mos. 70.6 mos. 33.2 mos. 32.5 mos. Drug history 58.8 105.5 36.1 28.4 62.7 25.3 48.4
Note: Excludes corporations. *Includes offenders for whom thase characteristics are unknown. -Too few cases to obtain statistically reliable data. See data note 8.
Chapter 4: Sentencing 43

Chapter 5
Corrections
Federal W Expirafi10n of sentence/release
. I~ Reincarceration prisons ~
~~
Mixed sentence
~Ir Violation Supervised ~ Discharge hearing
release • Violation
... Continuation on
,.. Discharge
supervision
Chapter 5: Corrections 45

The year 1988 marked the beginning of a period of transition for Federal sentencing and corrections policy. The Sentencing Reform Act of 1988 changed procedures for sentencing, releasing, and supervising convicted offenders. The act applies to offenses committed on or after November 1, 1987. A few offenders convicted under these provisions appear In data for calendar year 1988, but the vast majority of the persons described In this chapter were serving sentences Imposed under prior law, which made them eligible for release to parole supervision after completing a third or less of their prison terms. Offenders who remained In prison until their mandatory release date were possibly subject to a period of post-release community supervision.
In general, offenders released under probation or parole supervision were required to report for further counselIng sessions, remain In a specified area, receive drug or alcohol treatment, or fulfill other conditions determined by the judge or supervision agency. The violation of these special conditions or the commission of a new offense could result in reincarceration or In the imposition of additional restrictions.
The rate at which offenders successfully complete (or violate) a period of parole or probation supervision depends upon the length of the supervision term (which may reflect characteristics of the offense or offender), the stringency of supervision conditions, and the strictness of supervisory review. Statistics on violation rates, therefore, reflect a combination of the behavior of the offender, the supervision system, and the time under supervision.
Probation outcomes (tables 5.1 and 5.2)
Seventy-eight percent of all offenders sentenced to probation completed the full term of supervision with no
violation; 6% had supervision revoked for a new crime and 16% for a technical violation (table 5.1).
Violations by offense. Probation Is Infrequently used for violent offenses (see Chapter 4). Tho.se persons convicted of violent offenses who were granted probation were less likely than average to complete probation successfully (71 %) and more likely than average to have probation revoked for a new crime (10%) or a technical violation (19%). Robbers were particularly likely to have probation revoked for a new crime (14%) or a technical violation (28%).
Persons convicted of burglary and forgery were also likely to have probation revoked for a new crime (15% and 10%, respectively) or a technical violation (29% and 28%).
Offender characteristics. Only 4% of first offenders had probation revoked for committing a new offense (table 5.2), compared to 17% of those who had previously served prison terms of a year or more and 13% of those Incarcerated as a Juvenile. Among offenders whose drug history is known, drug abusers were three times as likely to have probation revoked for a technical violation as offenders believed not to be drug abusers. In many of these cases, the violation Involved a condition requiring some form of drug treatment or testing.
Information on prior histories of drug abuse Is obtained during Pretrial Services Agency (PSA) Interviews and is not available for 21 % of the offenders. Some interviewees may lie, and offenders who are indicted but not arrested and those who obtain release before a PSA interview can take place are not necessarily included in these data, which are, therefore, not necessarily represEmtatlve of the total population of offenders sentenced to probation.
Parole outcomes (tables 5.3 and 5.4)
Eighteen percent of all offenders who were released on parole and completed parole supervision In 1988 had parole revoked for a new crime. Another 23% were revoked for a technical Violation (table 5.3).
The violation rate for parolees In each major offense category was substantially higher than the corresponding rate for offenders released on probation. The higher parole violation rate may reflect the fact that parolees were Initially sentenced to prlson-a determination that probably reflected the seriousness of thA offenses and the offenders' prior record (see Chapter 4).
Violations by offense. Offenders convicted of violent offenses were least IIkeiy to complete parole with no violation (35%) and most likely to have parole revoked for a new crime (34%) or a technical violation (31 %). Only offenders convicted of burglary and escape approached the violation rates of violent offenders.
Persons convicted of drug crimes had lower-than-average rates of parole vlolatlons-35% overall, 13% for new crimes, and 22% for technical violations. The low revocation rate may reflect the fact that 97% of federally convicted drug offenders completing parole In 1988 had been convicted of seiling or Importing drugs or engaging In other forms of drug traffic and may not themselves have been drug users, and accordingly may have been less likely to fail drug tests.
Offender characteristics. In contrast to persons convicted of drug offenses, 60% of offenders known to have a history of drug abuse violated parole terms (table 5.4), compared to 30% of parolees with no known drug use. However, about two-thirds of the violations by drug users were tech-
Chapter 5: Corrections 47

nlcal violations of release conditions rather than new offenses. Because drug testing and treatment are often Included In the parole conditions of known drug users, It may be that many of these violations were drug related. However, parolees with drug histories also appear more likely to have parole revoked for committing new crimes than other parolees (21 % vs. 16%, respectively).
The rate of parole revocations also varied according to the offenders' prior criminal records. Twenty-one percent of offenders with no prior convictions had parole revoked, compared to about 60% of offenders with either juvenile delinquency records or records of a prior conviction with more than a 1-year sentence.
More specifically, 8% of parolees with no prior recorded sentences had parole revoked for committing a new crime, compared to 26% of the parolees with prior juvenile incarceration and 27% of parolees with a prior adult Incarceration.
Comparison of parole and probation populations (tables 5.2 and 5.4)
The violation rate for every major group of parolees Is substantially higher than the corresponding rate for offenders sentenced to probation. This reflects substantial differences between the types of offenders In the two populations.
Overall, 65% of offenders completIng terms of probation were identified as first offenders; only 32% of parolees showed no previous convictions. Similarly, 18% of offenders completing probation were Identified as drug abusers; 40% of parolees terminating supervision In the same year were Identified as drug abusers. These findings reflect the fact that parolees, on the basis of their prior record or offense characteristics, were Initially found unsuitable for probation and sentenced to prison (see Chapter 4).
Violation rate (table 5.5)
The likelihood that an offender wlli be cited for a violation during the first year of supervision varies according to the type of release (table 5.5). Twenty percent of persons on mandatory release (for example, prisoners not previously found qualified for parole release) violated terms during the first year; this compared to 15% of parolees and 12% of probationers. Among offenders on mandatory release, 6% had violations for major offenses during the 1-year period, compared to 2% of probationers and 4% of parolees. For every class of offender, technical violations outnumbered new crimes by margins ranging from 57% (for offenders supervised after mandatory release) to 244% (for offenders serving sentences of probation imposed by a U.S. magistrate).
Because the likelihood of a violation increases as the period of supervision Increases, the annual violation rate, which more clearly reflects differences among offender groups, Is generally lower than the overall violation rate for similar groups during the total period of supervision.
Time served In prison (tables 5.6 and 5.7)
In 1988, a total of 21 ,802 prisoners were released from the custody of the U.S. Bureau of Prisons after serving sentences Imposed by U.S. district courts for violations of the U.S. Code (table 5.6).1 Including credits for time spent In jail prior to final disposition, these Inmates were first released after serving an average of 19 months-80% of their sentences-In confinement.
1 U.S. Bureau of Prisons facilities hold many other kinds of inmates, such as material witnesses, probation and parole violators, prisoners held for other jurisdictions, offenders convicted of violating the D.C. Code, or sentenced by D.C. Superior Court or the courts martial. All these inmates are excluded from this discussion.
48 Compendium of FetieraiJustice Statistics, 1988
Violent offenders served terms three times as long as the average (4.5 years), while terms for public order offenders were less than half the average (9 months). Because more provisions for early releae~, such as parole and time credited rQr good behavior, are available to Inmates serving longer sentences, violent offenders served an average of 65% of their sentences, while Inmates convicted of public-order offenses served 95% of their sentences.
Prisoners released In 1988 who were convicted of drug trafficking offenses (Including sales, importation, and manufacture) served an average of more than two years, 19% longer than the average time served by the cohort of similar offenders released In 1985.2 Public-order offenders also served significantly longer terms In 1988 than they had In 1985 (9 months compared to 7 months).
Prisoners released In 1988 who were sentenced to five year terms actually served an average of two years and nine months (table 5.7). Those with ten year terms actually served 4 years and 7 months, and those sentenced to twenty years actually served less than 8 years In prison.
At each level of imposed sentence, violent offenders remained in prison for a substantially longer time than average, ranging from one month for one-year sentences to more than a year for ten-year sentences.
2 Federal Criminal Cases Processing 1980-89, with Preliminary Data for 1990, Bureau of Justice Statistics, October 1991 (NCJ-130526). Offender popUlations described in tables showing time served in previous editions of the Compendium are not comparable to these data because they Included only prisoners eligible for parole release.

Table 5.1 Outcome of probation supervision, by offense, 1988
Number of Percent of probationers terminating supervision with:
probationers Revocations for
Most serious offense terminating No Technical New of conviction probation Total violation violations crimeb
All offenses 24,757 100% 77.6% 16.0% 6.4%
Violent offensos 680 100% 71.3% 19.0% 9.7%
Murder/nonnegligent mar.slaughter 7 100 - - -
Negligent manslaughter 11 100 - - -Assault 331 100 78.5 13.3 8.2 Robbery 232 100 58.2 28.0 13.8 Rape 14 100 - - -Other sex offensesc 70 100 75.7 15.7 8.6 Kidnapping 5 100 - - -Threats against the President 10 100 - - -
Property offonses 10,301 100% 76.8% 16.9% 6.3%
Fraudulent OffOO80B 7,417 100% 78.9% 15.1% 6.0% Embezzlement 1,928 100 84.2 12.1 3.7 Fraud (excluding tax fraud) 3,845 100 82.5 12.0 5.5 Forgery 1,351 100 62.0 28.1 9.9 Counterfeiting 293 100 73.7 16.7 9.6
other otfensos 2,884 100% 71.4% 21.4% 7.2% Burglaryd 86 100 55.8 29.1 15.1 Larceny 2,213 100 69.9 23.2 6.9 Motor vehicle theft 179 100 76.0 14.0 10.1 Arson 6 100 - - -Transportation of
stolen property 247 100 83.8 11.3 4.9 Other property offensese 153 100 76.5 15.7 7.8
Drug offenses 4,253 100% 74.9% 18.3% 6.9% Trafficking 2,694 100 76.4 15.8 7.8 Possession and other 1,559 100 72.2 22.6 5.3
Public order offenses 9,523 100% 80.1% 13.9% 6.0%
Fktgulatory otfensos 1,616 100% 82.7% 12.3% 5.0% Agriculture 181 100 89.0 7.7 3.3 Antitrust 30 100 96.7 3.3 a Labor law 38 100 92.1 2.6 5.3 Food and drug 40 100 100.0 a a Motor carrier 46 100 97.8 a 2.2 Other regulatory offenses 1,281 100 80.2 14.3 5.5
Other offenses 7,907 100% 79.6% 14.2% 6.2% Weapons 948 100 68.6 18.5 12.8 Immigration offenses 1,532 100 73.6 19.1 7.3 Tax law violations
including tax fraud 1,006 100 91.7 6.0 2.4 Bribery 138 100 92.0 3.6 4.3 Perjury 78 100 85.9 5.1 9.0 National defense 254 100 76.8 17.7 5.5 Escape 152 100 57.2 29.6 13.2 Racketeering and extortior.' 231 100 87.9 7.4 4.8 Gambling offenses 101 100 92.1 5.9 2.0 Uquor offenses 13 100 - - -Mail or transport of
obscene material 27 100 92.6 3.7 3.7 Traffic (lffenses 2,951 100 80.7 14.1 5.3 Migratory birds 169 100 94.7 4.1 1.2 Other 307 100 79.5 15.6 4.9
Note: Total includes offenders for whom supervision dExcludes transportation of stolen property. category could not be determined.
eExcluding fraudulent property offenses; including -Too few cases to obtain statistically reliable data. destr.Jction of property, trespass. aViolation of supervision conditions other than charges f Predominately prosecution under the Racketeer for new offenses. Innuenced and Corrupt Organizations Act.
blncludes both "major· and "minor· offenses. See data note 9. ~ay include some non-violent offenses.
Chapter 5: Corrections 49

Table 5.2 Characteristics of offendors terminating probation supervision, 1988
Number of Percent of probationers terminating supervision with:
probationers Revocation
Offender terminating No Technical New characteristics probation Total violation violationa crimeb
All offenderac 24,757 100% 77.6% 16.0% 6.4%
Sox Male 19,185 100% 76.6% 16.3% 7.1% Female 5,561 100 80.9 15.1 4.0
Race White 17,695 100% 81.7% 12.7% 5.7% Black 6,208 100 65.9 25.5 8.7 Other 774 100 78.3 16.3 5.4
Ethnlclty Hispanic 2,865 100% 72.5% 19.3% 8.3% Non-Hispanic 21,722 100 78.3 15.6 6.~
Age 16-18 years 94 100% 66.0% 25.5% 8.5% 19-20 years 599 100 64.3 23.4 12.4 21-30 years 7,883 100 68.5 22.6 8.9 31-40 years 1,423 100 75.3 17.8 6.9 Over 40 years 7,081 100 88.8 7.9 3.3
Education , Less than high
school graduate 8,698 100% 70.5% 21.2% 8.4% High school graduate 8,838 100 78.8 15.3 6.0 Some college 4,859 100 82.7 12.2 5.1 College graduate 2,037 100 91.8 5.5 2.7,
Marital stotul! Never married 7,438 '100% 69.5% 22.1% 8.4% Divorcedlseparated 5,220 100 74.8 18.4 6.7 Married 10,520 100 85.7 9.6 4.7 Common law 1,111 100 68.6 22.9 8.6 Other 280 100 83.9 14.3 1.8
Employment status at arrest Unemployed 3,971 100% 66.0% 24.3% 9.7% Employed 15,472 100 79.1 14.6 6.3
Annual Income $0 3,732 100% 63.6% 26.2% 10.2% Less than $10,000 6,912 100 72.6 19.2 8.3 $10,000 - $20,000 5,323 100 81.7 12.6 5.7 Over $20,000 3,476 100 89.7 7.2 3.1
Criminal record None 15,951 100% 84.0% 12.0% 4.0% Prior record ot only
juvenile delinquency 915 100 56.9 30.3 12.8 Prior adult conviction
Never incarcerated 5,119 100 72.6 19.3 8.0 Incarcerated
1 year or less 1,087 100 58.4 28.2 13.4 More than 1 year 1,582 100 54.0 29.0 17.1
Drug abuse No known abuse 15,868 100% 81.7% 12.2% 6.2% Drug history 3,577 100 53.1 36.0 10.9
Note:Tota/ includes offenders tor whom supervision blncludes both "major" and "minor" offenses. ca!egory could not be determined. clncludes offenders with unknown characteristics. aViolation of supervision conditions other than charges See data note 9. tor new offenses. ..-
50 Compendiwn of Federal Justice Statistics, 1988
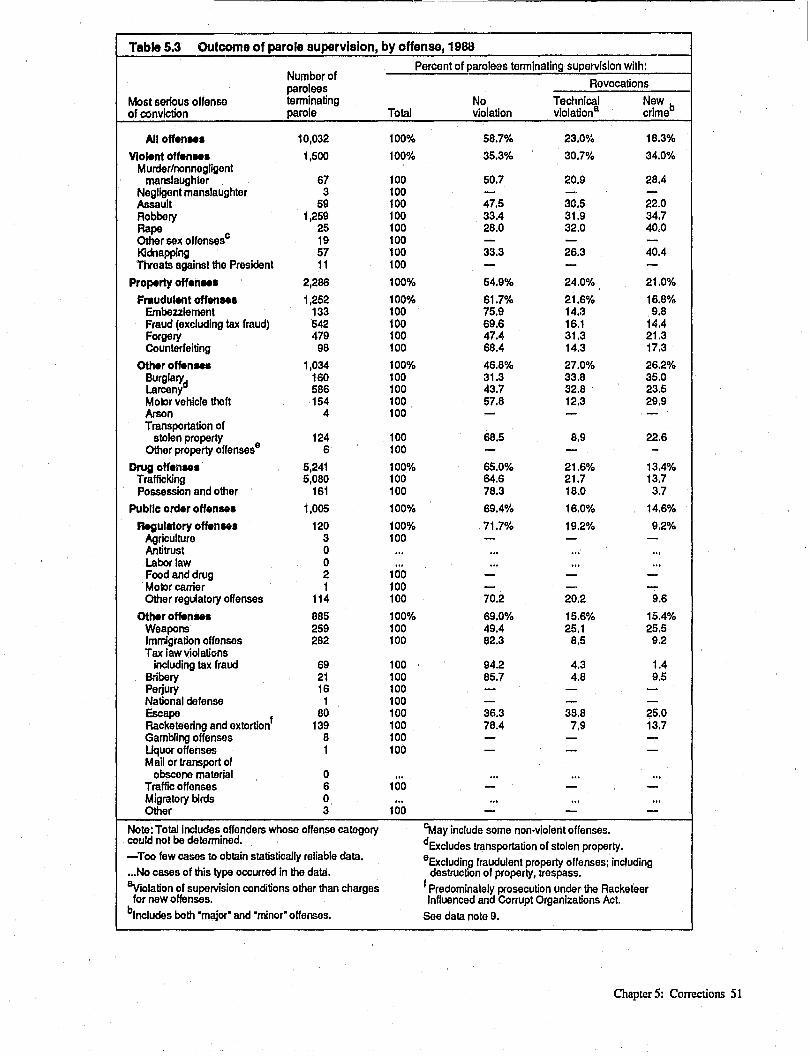
Table 5.3 OUtcome of parole supervision, by offense, 19813
Number of Percent of parolees terminating supervision with:
parolees Revocations
Most serious offense terminating No Technical New of conviction parole Total violation vlolation8 crimeb
All offen ... 10,032 100% 58.7% 23.0% 18.3%
V101en1 offen ... 1,500 100% 35.3% 30.7% 34.0% Murder/nonnegligent
manslaughier 67 100 50.7 20.9 28.4 NeQligent manslaughter 3 100 - - -Assault 59 100 47.5 30.5 22.0 Robbery 1,259 100 33.4 31.9 34.7 Rape 25 100 28.0 32.0 40,0 Other sex offensesc 19 100 - - -Kidnapping 57 100 33.3 26.3 40.4 Threats against the President 11 100 - - -
Property offen ... 2,286 100% 54.9% 24.0% 21.0%
Fraudulent offen ... 1,252 100% 61.7% 21.6% 16.8% Embezzlement 133 100 75.9 14.3 9.8 Fraud (excluding tax fraud) 542 100 69.6 16.1 14.4 Forgery 479 100 47.4 31.3 21.3 Counterfeiting 98 100 68.4 14.3 17.3
Other offen ... 1,034 100% 46.8% 27.0% 26.2% Burglaryd 160 100 31.3 33.8 35.0 Larceny 586 100 43.7 32.8 23.5 Motor vehicle theft 154 100 57.8 12.3 29.9 Arson 4 100 - - -Transportation of
stolen property 124 100 68.5 8.9 22.6 Other property offensese 6 100 - - -
Drug offen ... 5,241 100% 65.0% 21.6% 13.4% Trafficking 5,080 100 64.S 21.7 13.7 Possession and other 161 100 78.3 18.0 3.7
PubliC order offen ... 1,005 100% 69.4% 16.0% 14.6%
Regulatory offen ... 120 100% 71.7% 19.2% 9.2% Agriculture 3 100 - - -Antitrust 0 ... ... '" ... Labor law 0 ... ... .. . ... Food and drug 2 100 - - -Motor carrier 1 100 - - -Other regulatory offenses 114 100 70.2 20.2 9.6
Other offen ... a85 100% 69.0% 15.6% 15.4% Weapons 259 100 49.4 25.1 25.5 Immigration offenses 282 100 82.3 8.5 9.2 Tax law violations
including tax fraud 69 100 94.2 4.3 1.4 Bribery 21 100 85.7 4.8 9.5 Perjury 16 100 - - -National defense 1 100 - - -Escape 80 100 36.3 36.8 25.0 Racketeering and extortion' 139 100 78.4 7.9 13.7 Gambling offenses 8 100 - - -Uquor offenses 1 100 - - -Mail or transport of
obscene material 0 ... ... ... .. . Traffic offenses 6 100 - - -Migratory birds 0 ... ... ... .. . Other 3 100 - - -
Note: Total includes offenders whose offense category ~ay include some non-violent offenses. could not be determined. dExcludes transportation of stolen property. -Too few cases to obtain statistically reliable data. eExcluding rraudulent property offenses: including ... No cases of this type occurred in the data. destruction of property, trespass. &violation of supervision conditions other than charges ' Predominately prosecution under the Racketeer for new offenses. Influenced and Corrupt Organizations Act.
blncludes both "major" and "minor" offenses. See data note 9.
Chapter 5: Corrections 51

- --------------
Table 5.4 Characteristics of offenders terminating parole supervision, 1988
Percent of parolees terminating supervision with: Number of Revocations
Offender parolees
No Technical New terminating characteristics parole Total violation violations crimeb
All offenderac 10,032 100% 58.7% 23.0% 18.3%
Sex Male 9,266 100% 58.1% 22.8% 19.1% Female 766 100 66.2 24.4 9.4
Rsi'» White 6,430 100% 67.8% 17.0% 15.1% Black 3,439 100 41.8 34.1 24.1 Other 156 100 54.5 21.8 23.7
Ethnlclty Hispanic 1,740 100% 63.7% 22.5% 13.8% Non·Hispanic 8,244 100 57.6 23.1 19.3
Age 16·18 years 8 100% - - -19·20 yearn 21 100 66.7 9.5 23.8 21·30 years 2,144 100 52.0 27.6 20.5 31-40 years 4,086 100 57.0 24.3 18.7 Over 40 years 3,241 100 64.9 19.7 15.4
Education Less than high
school graduate 5,032 100% 54.0% 25.6% 20.4% High school graduate 2,960 100 57.8 22.9 19.3 Some college 1,449 '100 67.1 19.3 13.5 College graduate 529 100 83.9 9.5 6.6
Marital status Never married 3,234 100% 47.8% 29.5% 22.7% Divorced/separated 2,460 100 66.0 24.7 19.3 l.1arried 3,583 100 69.5 16.3 14.2 Common law 643 100 63.3 19.6 17.1 Other 89 100 58.4 31.5 10.1
Employment status at arrest Unemployed 3,701 100% 47.0% 31.7% 21.2% Employed 5,586 100 65.6 18.5 15.9
Annual Income $0 3,817 100% 46.3% 32.1% 21.5% Less than $10,000 3,036 100 59.9 22.2 17.9 $10,000· $20,000 1,664 100 71.8 14.1 14.1 Over $20,000 768 100 81.0 9.2 9.8
Criminal record None 3,168 100% 79.1% 12.8% 8.0% Prior record of only
juvenile delinquency 612 100 43.3 30.2 26.5 Prior adult conviction
Never incarcerated 2,242 100 63.0 21.4 15.7 Incarcerated
1 year or less 760 100 53.4 29.5 17.1 More than 1 year 3,215 100 39.7 31.1 29.1
Drug abuse No known abuse 5,605 100% 69.9% 13.9% 16.2% Drug history 3,683 100 40.3 38.9 20.8
-Too few cases to obtain statistically reliable data. blncludos both "major" and "minor" offenses. aViolation of supervision ccmditions other than clncludes offenders with unknown characteristics. charges for new offenses. See data 110te 9.
52 Compendium of Federal Justice StaJistics, 1988

Table 5.5 Parole and probatIon outcomes, by type of re/e8oo, 1988
Percent of offenders entering supervision in 1988 who had
Total violations during the first year of supervision -
Type of offenders All Major Minor Technical r(llease supervised violations offenseB olfenseb vlolationc
Parole 9,902 15.5% 3.7% .7% 11.5% Mandatory release 1,297 20.2% 6.4% 1.7% 12.7% Probation Imposed
by Judge 15,635 10.0% 2.1% .8% 7.7% by magistrate 7,333 15.5 1.7 1.9 12.4
aAJI~atiOn, arrest, or conviction of crime with 1 year or less probation or fine of $500 or min mum sentence of over 90 days Incarcera· less. tion or over one year probation. 'Violation of supervision conditions other than
bConvlcted of minor offense with maximum new conviction. sentence of 90 days or less Imprisonment or See data notll 9.
Chapter 5: Corrections S3

.. -TableS.6 Average tIme to first release, and percent of sentence served, prIsoners released In 1988
Most serious offense Percent of of conviction Time served sentence served Prisoners released
All offenses 18.7 mos 79.7% 21,802
Violent offensea 54.2mos 65.3% 1,253 Murder/manslaughter 65.5 68.6 51 Assault 43.8 7'4.2 414 Robbery 59.5 59.2 670 Rape - - 19 other sex offensesll 32.4 70.0 43 Kidnapping 103.5 48.6 35 Other violent offenses 30.3 91.8 21
Property offenaea 16.7 mos 74.7% 4,965
Fraudulent offenses 14.8 mos 75.2% 3,424 Embezzlement 10.8 73.5 438 Fraud (excluding tax fraud) 14.5 75.2 2,297 Forgery 16.9 73.4 376 Counterfeiting 19.8 80.1 313
Other offenses 21.0 mos 73.4% 1,541 Burglal'Y, 24.9 76.4 91 Larcenyb 17.6 75.5 910 Motor vehicle theft 28.2 67.1 204 Arson 28,2 68.6 51 Transportation of stolen cProperty 28.6 63.8 215 Other property offenses 9.a 92.8 70
Drug offenaea 25.2mos 67.7% 7,213 Trafficking 26.0 6&.1 6,844 Possession and other 10.4 97.7 369
Public order offenses 9.1 mos 95.2% 8,371
Regulatory offenses 18.3 mos 80.0% 488
Other offenses 8.5 mos 96.1 % 7,883 Weapons 20.6 79.5 833 Immigration offenses 4.9 104.1 5,310 Tax law violations
Including tax fraud 11.0 72.6 558 Bribery 12.6 72.6 69 Perjury 11.5 78.5 61 National defense 16.6 89.0 20 Escape 16.0 90.5 114 Racketeering and extortlond 28.3 64.1 38~ Gambling offenses - - 3 Uquor offenses - - 4 Mail or transport of
obscene me.teria! 13.2 75.4 53 Traffic offenses 2.2 100.0 350 Migratory birds 4.7 89.9 30 Other 17.2 ~)6.1 97
- Too few cases to obtain statistically reliable data. d Predominantly rrosecution under the Racketeer a May Include some non·violent offenses. Influenced and Corrupt Organization Act.
b Excluding transportation of stolen property. See data note 10.
c Excluding fraudulent property offenses; including destruction of property, trespass.
54 Compendium o/FederaIJusticeStatistics, 1988

Table 5.7 Average time served to first release I prlsonars released In 1988
Sentence All Violent Property offenses
Drug Public order offenses ..
imposed offenses offenses Fraudulent Other offenses Regulatory Other
12 mos. 10 mos. 11 mos. 9 mos. 10mos. 11 mos. 11 mos. 11 mos. 24 17 20 16 17 17 17 19 36 23 27 21 23 23 23 22 48 29 34 26 29 29 - 30 60 33 40 31 34 32 37 36 72 38 46 33 36 38 - 37 84 42 53 39 - 40 - 43 96 47 62 39 47 45 - 44
108 49 - - - 46 - -120 55 68 45 57 50 - 57 144 61 72 - - 52 ... -180 72 80 - .- 66 - -240 94 98 - - 84 ... ... 300 120 126 ... - - - ...
- Too few cases to obtain statistically reliable data. See data note 10 • ... No cases of this type occured in the data.
Chapter 5: Corrections 55

Methodology
The source of data for all tables In this compendium is the BJS Federai justice database maintained by Abt Associates Inc. The database Is presently constructed from source files provided by the Execut/ve Office for U.S. Attorneys, the Admlnlstrat/ve Office of the U.S. Courts, the Pretrial Services Agency (PSA) , and the U.S. Bureau of Prisons. Federal law prohibits the use of these fifes for any purposes other than research or statlstl cs.
Records In the Federal Justlce database are matched according to a statistically weighted combination of names, other personal Identifiers, dates of court appearances, types of offenses, and other relevant Information contained in the flies. Using the matched data files, it is possible to combine Information about all stages of the processing of a criminal matter or case, from the prosecutor's decision of whether to file a criminal case, through adJudication, and, if the defendant Is convicted, through prison and/or supervised release.
The unit of analysis In all tables is a combination of a person (or corporation) and a matter or case. For example, if a single person Is involved in three diffe.ent criminal cases during the time period specified in the table, he or she is counted three times In the tabulat/on. Similarly, If a single criminal case Involves a corporate defendant and four Individual defendants, It counts five times In the tabUlation.
Wherever possible, matters or cases have been selected according to some event which occurred during calendar year 1988 (January 1, 1988 through December 31, 1988). Some data files provided by source agencies are organized according to different time frames (fiscal years or stat/st/cal years); these have been
combined and extracted Into calendar years for purposes of this compendium. Further, files which are organized by their source agencies according to calendar years nonetheless Include some pertinent records In later years' fl!es. For example, tabulations of cases terminated during calendar year 1988 In this compendium have been assembled from source tiles containing records of 1988 terminations which were entered Into the data system during 1988 or 1989. Unless otherwise noted, data tables describe the calendar year 1988.
The avalfabllity of particular Items of Information is affected by the data source. Data on prosecutors' decisions prior to court filing are provided for cases investigated by U.S. Attorneys, but not for those handled by the Criminal Division of the U.S. Department of Justice. Criminal Division cases enter the data base once they are filed in U.S. district court, however. Many Items of social and demographic Information come from presentence Investigation records or supervision records, and are available only for arrested defendants who were convicted and/ or began serving a sentence Involving supervised release. (This particularly affects ethniclty and occupational Information.)
The offense classl1ication procedure used In this compendium Is based on the classification system followed by the Administrative Office of the U.S. Courts. SpeCifiC offenses In the Administrative Office classification are combined to form the BJS categories shown In the compendium tables.*
• These categories correspond to the BJS crime definitions and, to the extent possible, are organized and presented consistent with BJS publications on State criminal justice systems.
For data sources that include United St<ltes Code citations, but do not Include the Administrative Office offense classifications, United States Code titles and sections are translated Into the AdministratiVe Office classification system and then aggregated Into the offense categories used In the tables. Offense categories for prisoners In Chapter 5 are based on combinations of offense designations used by the Bureau of Prisons. They are similar to the categories in other chapters and other tables In Chapter 5, but may not be directly comparable.
Where more than one offense is charged or adjudicated, the most serious offense (the one that mayor did result In the most severe sentence) Is used In ciasslfication. Prisoners are classified according to the offense which actually bears the longest Incarce.ration sentence. The offense description may change as the criminal justice process proceeds. Tables Indicate whether investigated, charged or adjudicated offenses are used.
Tables concerning prisoners in Chapter 5 Include only prisoners committed by U.S, district courts for violations of the U.S. Code. Other prisoners, such as probation and parole violators, and other types of offenses, such as military, D.C., or state offenses, are excluded. Unlike BJS publications concerning State prisoners, which exclude prisoners serving sentences under one year, compendium tables include Federal prisoners who received sentences of any length.
Time served in prison is the number of months from the prisoner's arrival into custody of the Bureau of Prisons until first release from prison, plus any Jail time served and credited. The calculation Is the same as that
Methodology 57

currently used by the Bureau of Prisons. Because other publications may Include different groups of prisoners, calculate time served differently, or use a different offense classification, compendium tables may differ from estimates of time served In previous publications by the Bureau of Prisons or In publications based on other data sources.
The tables In the compendium are constructed to permit the user to make valid compClrlsons of numbers within each table and to compare percentage rates across tables. The total numbers of subjects In compendium tables that are based on records linked between two flies are generally less than the total number of records either source file. Accordingly, comparisons of absolute numbers across two or more tables, or between tables In this volume and other data sources, are not necessarily valid.
58 Compelldium of Feder a I Justice Statistics, 1988

Data notes
1) Figure 2 refers to 94,548 suspects Investigated by U.S. attorneys In matters terminated In 1988 (table 1.2). 70% percent at these suspects were prosecuted either In U.S. district court (54,764 = 58%) or before a U.S. magistrate (10,959 = 12%). Since conviction data refer to a different cohort of defendants (those whose cases were terminated), and are classified by different offenses, statistical estimates are used for determining the length of the remaining horizontal bars In the figure. Judges convicted 80% of defendants in cases terminated in 1988. (54,764 x 80% = 44,006) (table 3.1). Magistrates convicted 64% of defendants (10,959 x 64% = 6,994) (table 3.4). The combined conviction rate Is 54% of suspects Investigated [(44,006 + 6,994) / 94,548 ].
Of offenders convicted In U.S, district court, 54% were sentenced to Incarceration (44,006 x 54% = 23,695) and 35% were sentenced to probation without Incarceration (table 4.1) (44,006 x 35% = 15,490). These are, respectively, 25% (23,695/94,548) and 16% (15,490/94,548) of the suspects InVestigated. Sentences Imposed after magistrate convictions are not included, but magistrates normally Impose fines rather than sentences of probation or Incarceration.
2) In Chapter 1 tables 1.1, 1.2, 1.3, 1.4, and 1.5 and in Chapter 3 table 3,4 were created from the docket and reporting data flies of the Executive Office for U.S. Attorneys. Only records which showed a matter received in 1988 were selected for table 1.1. Only records which showed a matter
terminated or filed as a case In 1988 were selected for tables 1.2-1.5 and 3,4. The statistics In these tables differ slightly from statistics published for 1988 In Federal Criminal Case ProcessIng, 1980-87: Addendum for 1988 and Preliminary 1989. The statistics In the present compendium are based on later updates, corrections, and additions of a small number of docket and reporting data records.
3) Offenses In the docket and reportIng data flies are classified by the Title and Section of the United States Code for the most serious offense Investigated. For tables in this compendium, these citations were translated into the corresponding 4-dlglt offense codes used by the Administrative Office of the United States Courts. These 4 digit codes were then aggregated into the categories shown in the tables. U.S. Code citations often do not permit detailed classification of drug offenses by type of actfon Involved. A person charged with conspiracy Is classified under the substantive offense alleged (for example, conspiracy to defraud is classified as a fraud) unless the type of conspiracy cannot be determined from the U.S. Code citation. Such conspiracies are inclUded among ·consplracy, aiding and abetting, traffic, and Jurisdictlona! offenses· in tables 1.1, 1.2, and 1.4, and in the corresponding District tables.
4) A total of 37,999 defendants were scheduled to be interviewed in 1988. Approximately 10% of these refused the interview, and another 5% were not interviewed for other reasons. Tables include these
non-interviewed defendants if data are available from sources other than Interviews.
5) In Chapter 2 tables 2.1, 2.2, 2.3, and 2.6 were created from the Pretrial Services Agency data flies. Only records with an interview date In 1988 were selected. Some defendants were arrested in 1988 but not Interviewed; their PSA records were completed from informatlon In other fifes.
6) ; abies 2.4 and 2.5 In Chapter 2 were created from the Pretrial Services Agency data flies. Data describe defendants whose pretrial services were terminated in 1988. These tables are not comparable with tables published in 1984-86 editions of the compendium.
7) Tables 3.1 and 3.2 In Chapter 3 and tables 4.1, 4.2, and 4.3 In Chapter 4 were derived from the Administrative Office master data flies. Only records with cases terminated In 1988 were selected.
8) Table 3.3 In Chapter 3 and table 4.4 in Chapter 4 were created by matching the Administrative Office master data flies with the Pretrial Services Agency data files and probation and parole data files. Records were included In the table If the relevant Information was available from any source. Some Items are available only from one of the files, The number of records for these items is lower than those for items which might have come from two or three flies. Moreover, many records omit data on certain Items, such as ethnicity. Tables indicate the number of records on which relevant data were available.
Data notes 59

-9) In Chapter 5 tables 5.1-5.5 were
created from the probation and parole data files. Only records with supervision terminated in 1988 were selected.
-
10) Prisoners are classified according to the offense associated with the longest sentence actually imposed. (Classifications in other tables are based on the longest potential sentence allowed by law.) Offense categories are based on combinations of offense designations used by the Bureau of Prisons. They are similar to the categories in other tables, but may not be directly comparable. The table includes only prisoners committed by U.S. district courts for violations of the U.S. Code. Other prisoners, such as probation and parole violators, and other types of offenses, such as military, D.C., or State offenses, are excluded. Unlike BJS publications concerning State prisoners, which exclude prisoners serving sentences under one year, tables 5.6 and 5.7 include Federal prisoners who received sentences of any length. Offenses for a few offenders Gould not be classified; these offenders are excluded from the table. Time served is the number of months from the prisoner's arrival into custody of the Bureau of Prisons until first release from prison, plus any jail time served and credited. The calculation is the same as that currently used by the Bureau of Prisons. Other publications may include different groups of prisoners, calculate time served differently, or use a different offense classification, and consequently their estimates of timo served may differ from those In tables 5.6 and 5.7.
60 Compendium ofFederalJustice Statistics, 1988

District tables
Geographical Boundaries of United States Courts of Appeals and United States District Courts
, HsWlilQ~
\ North«n Marianna a ,.Jand.
()Guam
<>
WY
®
NO
® so
NE
'00 Virgin
Islands
~
District tables 61

Table D-1.1 Suspects In criminal matters received by U.S. Attorneys, by offense, 1988
Most serious offense investigated
Total All Pro[!erty Drug Public order offenses
District suspects· offenses Violent Fraudulent Other offenses Regulatory Other
All districts 100,948 100.0% 4.8% 24.6% 3.9% 28.5% 8.3% 28.6%
Alabama, Middle 958 100.0% 4.4% 27.20/0 9.9% 24.6% 13.5% 19.6% Alabama, Northern 519 100.0 2.5 30.6 6.6 21.0 3.3 35.1 Alabama, Southern 496 100.0 3.2 40.5 5.4 24.6 8.3 17.7 Alaska 323 100.0 4.3 21.1 3.1 29.1 11.1 31.0 Arizona 2,774 100.0 8.7 16.2 2.8 31.7 2.9 36.1
Arkansas, Eastern 427 100.0% 4.0% 38.6% 5.20/0 28.6% 5.6% 17.1% Arkansas, Western 203 100.0 6.4 39.9 14.8 10.3 5.4 23.2 California, Central 3,313 100.0 9.4 29.4 5.4 23.3 5.1 26.4 California, Eastern 1,466 100.0 8.0 18.7 5.6 27.4 4.6 34.6 California, Northern 1,855 100.0 5.8 31.5 2.9 19.9 5.7 32.3
California, Southern 8,124 100.0% 2.1% 10.1% 1.1% 22.20/0 3.7% GO.3% Colorado 1,161 100.0 5.4 31.2 8.1 23.9 5.9 24.5 Connecticut 506 100.0 4.0 30.0 4.5 19.2 5.5 35.8 Delaware 193 100.0 3.6 21.2 1.0 38.9 8.3 25.9 District 01 Columbia 472 100.0 11.7 20.3 7.6 18.4 31.4 7.0
Florida, Middle 2,731 100.0% 5.3% 28.6% 1.9% 41.1% 4.3% 14.9% Florida, Northern 978 100.0 4.9 19.2 1.7 43.5 4.5 24.2 Florida, Southern 4,307 100.0 3.7 13.4 1.4 49.4 5.9 24.7 Georgia, Middle 366 100.0 4.4 35.5 3.0 25.7 8.2 22.4 Georgia, Northern 1,414 100.0 5.4 27.7 6.6 27.7 5.4 26.3
Georgia, Southern 560 100.0% 5.4% 20.9%. 5.4% 36.6% 7.5% 22.9% Guam 44 100.0 6.8 29.5 9.1 29.5 4.5 20.5 Hawaii 513 100.0 10.9 29.0 4.9 27.1 2.3 25.1 Idaho 455 100.0 5.1 34.7 9.2 6.2 9.7 33.0 Illinois, Central 563 100.0 2.7 30.4 1.2 37.8 6.9 19.9
Illinois, Northern 2,535 100.0% 3.5% 37.7% 4.2% 22.6"/0 8.4% 23.0% Illinois, Southern 483 100.0 5.0 25.1 6.4 21.1 17.6 23.0 Indiana, Northern 759 100.0 2.2 23.1 2.9 38.2 4.0 29.1 Indiana, Southern 499 100.0 7.0 38.5 3.2 ~2.0 7.2 29.1 Iowa, Northern 378 100.0 4.2 23.5 .8 51.9 4.5 13.8
Iowa, Southern 193 100.0% 3.6% 34.7% 6.2% 22.3% 3.1% 29.5% Kansas 559 100.0 8.6 39.4 3.2 16.6 3.6 27.5 Kentucky, Eastern 517 100.0 7.0 19.3 13.9 37.1 5.4 17.2 Kentucky, Western 808 100.0 7.3 27.5 7.2 22.6 4.0 30.3 Louisiana, Eastern 1,923 100.0 2.4 16.1 4.1 17.3 30.3 28.3
Louisiana, Middle 403 100.0% 1.2% 39.0% 3.2% 5.0% 19.1% 2e.O% Louisiana, Western 1,189 100.0 1.2 17.0 3.5 4.4 12.1 GO.1 Maine 395 100.0 6.3 12.4 5.3 52.9 6.6 15.9 Maryland 1,220 100.0 7.5 33.1 2.1 24.9 3.0 28.6 Massachusetts 1,092 100.0 8.2 33.1 2.8 16.2 11.6 26.8
Michigan, Eastern 2,119 100.0% 3.6% 29.2% 5.4% 30.9% 4.4% 25.8% Michigan, Western 345 100.0 7.2 27.8 5.2 34.2 3.8 21.4 Minnesota 749 100.0 6.3 20.7 3.5 42.3 7.1 19.4 Mississippi, Northern 549 100.0 2.6 21.3 3.1 9.8 33.5 29.5 Mississippi, Southern 592 100.0 5.1 43.9 2.5 19.6 6.4 2Q.4
Missouri, Eastern 986 100.0% 4.2% 31.9% 4.5% 25.3% 7.5% 25.2% Missouri, Western 837 100.0 4.5 34.2 9.3 33.5 2.7 15.2 Montana 484 100.0 9.3 28.1 3.3 19.6 8.1 31.0
62 Compendiwn of Federal Justice Statistics, 1988

Table 0-1.1 Continued
Most serious offense Investigated
Totai All Proeerty Drug Public order offenses
District suspects * offenses Violent Fraudulent Other offenses Regulatory Other
Nebraska 391 100.0% 4.9% 35.0% 5.1% 19.2% 8.20/0 26.1% "Ievada 841 100.0 6.4 36.0 2.6 14.4 6.1 31.4 New Hampshire 225 100.0 7.6 21.8 1.8 31.1 5.3 30.2 New Jersey 1,657 100.0 3.3 30.8 4.4 15.4 15.0 29.9 New Mexico 1,194 100.0 4.2 23.5 5.0 31.6 3.9 30.8
New York, Eastern 2,951 100.0% 2.7% 20.0% 3.7% 45.1% 9.0% 18.4% New York, Northern 703 100.0 2.3 32.6 1.1 20.2 7.4 35.0 New York, Southern 2,960 100.0 3.2 28.9 3.4 21.4 21.S 20.9 New York, Western 911 100.0 3.3 35.1 2.3 23.6 7.1 26.5 North Carolina, Eastern 347 100.0 22.2 31.4 6.6 14.4 5.2 19.3
North Carolina, Middle 568 100.0 9.0% 23.20/0 7.7% 32.4% 6.20/0 21.3% North Carolina, Western 536 100.0 6.3 22.8 3.9 26.1 3.5 37.1 North Dakota 802 100.0 6.4 33.7 4.4 24.4 9.2 21.7 Northern Mariana Islands 6 100.0 0 0 0 0 0 100.0 Ohio, Northern 1,740 100.0 6.6 35.5 4.5 21.1 9.2 22.1
Ohio, Southern 1,404 100.0% 5.3% 33.4% 5.6% 31.7% 4.7% 17.6% Oklahoma, Eastern 171 100.0 8.2 35.1 11.1 10.5 12.9 19.9 Oklahoma, Northern 320 100.0 4.7 37.5 1.6 33.1 2.8 19.7 Oklahoma, Western 674 100.0 5.2 32.5 5.0 32.9 3.6 19.4 Oregon 908 100.0 14.4 17.5 2.8 39.1 4.3 21.4
Pennsylvania, Eastern 1,249 100.0% 4.20/0 33.9% 3.8% 31.1% 6.6% 19.4% Pennsylvania, Middle 518 100.0 5.4 25.7 1.9 22.8 10.6 31.5 Pennsylvania, Western 841 100.0 7.3 41.4 8.9 19.6 10.8 11.3 Puerto Rico 1,145 100.0 3.4 32.2 7.6 33.0 7.1 15.5 Rhode Island 326 100.0 1.5 28.5 1.5 21.2 27.6 18.7
South Carolina 1,762 100.0% 5.60/0 32.20/0 5.5% 15.3% 15.9% 24.7% South Dakota 389 100.0 29.0 15.9 8.0 30.8 2.8 12.1 Tennessee, Ea-,tern 595 100.0 5.5 25.0 8.6 29.4 11.6 18.2 Tennessee, Middle 654 100.0 3.5 37.6 5.8 13.9 10.7 26.3 Tennessee, Western 1,070 100.0 3.6 28.1 5.5 38.0 3.2 21.1
Texas, Eastern 719 100.0% 2.4% 26.7% 2.60/0 16.6% 22.3% 28.0% Texas, Northern 1,723 100.0 3.9 28.7 3.4 25.8 7.7 28.2 Texas, Southern 4,663 100.0 1.6 10.5 2.5 45.1 13.2 26.7 Texas, Western 2,543 100.0 1.5 19.3 2.2 42.8 3.1 30.0 Utah 825 100.0 4.4 32.6 4.6 22.9 7.8 26.7
Vermont 306 100.0% 3.3% 21.golo 2.0% 21.20/0 11.4% 37.9% Virgin Islands 403 100.0 .5 4.7 0 7.9 62.0 8.4 Virginia, Eastern 2,283 100.0 7.5 18.8 2.9 19.9 4.0 45.5 Virginia, Western 419 100.0 4.8 20.8 2.6 12.9 12.6 45.3 Washington, Eastern 554 100.0 4.2 15.3 5.2 32.7 5.8 35.4
Washington, Western 1,642 100.0% 5.7% 20.3% 2.3% 42.0% 6.7% 20.8% West Virginia, Northern 396 100.0 1.0 18.4 3.5 46.2 4.0 26.5 West Virginia, Southern 1,243 100.0 1.7 21.6 6.4 37.7 5.9 26.0 Wisconsin, Eastern 465 100.0 8.0 36.1 6,0 29.0 2.4 16.3 Wisconsin, Western 300 100.0 2.3 35.0 5.7 21.3 4.3 29.7 Wyoming 271 100.0 6.3 30.6 8.1 16.2 8.1 29.5
*Data describe suspects in criminal matters received by U.S. See Text Table 1.1. Attorneys in 1988. Includes suspects for whom offense category could not be determined.
District tables 63

Table 0-1.2 Suspects In criminal cases prosecuted, by offense, 1988
Total Most serious offense investigated
suspects i!l, All Property Drug Public order offenses
District cases filed offenses Violent Fraudulent Other offenses Regulatory Other
All districts 54,764 100.0% 5.6% 22.4% 4.3% 36.0% 5.6% 25.3%
Alabama, Middle 226 100.0% 3.1% 27.9% 7.1% 34.5% 4.4% 22.6% Alabama, Northern 429 100.0 5.1 22.8 21.2 28.4 5.1 16.8 Alabama, Southern 359 100.0 2.8 30.6 7.5 36.5 4.7 17.3 Alaska 280 100.0 4.3 18.6 3.6 30.4 11.8 31.1 Arizona 1,362 100.0 10.2 15.6 3.2 43.5 2.7 23.4
Arkansas, Eastern 243 100.0% 4.5% 30.9% 7.4% 33.3% 6.6% 17.3% Arkansas, Western 108 100.0 11.1 40.7 14.8 18.5 2.8 11.1 California, Central 1,882 100.0 13.3 25.8 5.7 26.8 3.3 24.5 California, Eastern 995 100.0 9.7 17.9 6.4 25.3 3.0 36.9 california, Northern 1,472 100.0 6.4 34.5 2.4 18.7 4.3 32.3
California, Southern 1,751 100.0% 5.6% 13.2% 3.1% 42.20/0 6.3% 29.5% Colorado 516 100.0 6.0 21.7 5.4 35.1 5.8 25.6 Connecticut 293 100.0 4.1 31.7 2.0 28.0 4.1 29.4 Delaware 124 100.0 3.2 25.8 1.6 41.9 7.3 20.2 District of Columbia 315 100.0 14.3 7.9 11.4 9.8 42.5 9.5
Florida, Middle 1,428 100.0% 5.7% 22.3% 1.8% 52.3% 3.8% 13.9% Florida, Northern 493 100.0 6.5 14.2 2.4 57.8 5.5 13.4 Florida, Southern 2,819 100.0 4.1 14.3 1.1 57.8 3.3 19.1 Georgia, Middle 176 100.0 4.0 21.6 2.3 42.0 6.3 22.7 Georgia, Northern 917 100.0 6.8 30.4 5.8 34.4 4.5 17.1
Georgia, Southern 305 100.0% 5.6% 28.5% 6.20/0 36.4% 6.9% 14.8% Guam 48 100.0 6.3 27.1 8.3 29.2 4.2 25.0 Hawaii 264 100.0 9.5 20.8 4.2 37.5 .8 27.3 Idaho 175 100.0 6.9 21.1 9.1 10.9 12.0 39.4 Illinois, Central 394 100.0 3.6 20.6 2.0 50.8 3.0 20.1
Illinois, Northern 1,435 100.0% 2.9% 37.4% 5.20/0 27.20/0 2.7% 24.4% Illinois, Southern 210 100.0 6.7 35.2 5.7 22.9 4.3 22.9 Indiana, Northern 451 100.0 1.1 14.0 .9 52.5 2.4 28.4 Indiana, Southern 242 100.0 8.7 35.5 2.9 21.5 3.7 26.4 Iowa, Northern 203 100.0 3.4 7.4 .5 65.5 6.9 15.8
Iowa, Southern 149 100.0% 2.0% 27.5% 4.7% 32.2010 4.0% 28.9% Kansas 374 100.0 10.2 39.3 4.0 17.9 2.9 24.6 Kentucky, Eastern 337 100.0 10.1 16.6 15.1 41.5 5.9 10.7 Kentucky, Western 368 100.0 9.6 24.3 4.6 30.9 1.9 27.6 Louisiana, Eastern 1,023 100.0 2.6 15.6 5.4 27.0 7.9 39.7
Louisiana, Middle 70 100.0% 0% 44.3% 5.7% 1.4% 2.9% 45.7% Louisiana, Western 718 100.0 1.1 20.2 7.5 8.2 17.7 44.6 Maine 171 100.0 5.3 9.9 7.0 49.1 2.3 26.3 Maryland 715 100.0 6.9 26.4 2.0 39.2 4.1 21.1 Massachusetts 511 100.0 7.0 31.3 2.7 23.9 5.9 29.0
Michigan, Eastern 1,128 100.0% 4.2% 28.7% 3.5% 40.1% 3.5% 19.6% Michigan, Western 273 100.0 3.3 28.6 4.8 43.6 2.9 16.8 Minnesota 490 100.0 7.6 24.1 4.1 42.0 4.3 17.6 Mississippi, Northern 159 100.0 6.3 30.8 6.3 25.8 2.5 27.7 Mississippi, Southern 259 100.0 3.1 31.7 5.8 16.9 8.1 29.3
Missouri, Eastern 527 100.0% 4.20/0 33.20/0 3.6% 29.20/0 3.20/0 25.00/0 Missouri, Western 517 100.0 7.4 30.8 3.9 42.6 1.2 13.9 Montana 331 < JO.O 12.1 22.4 3.6 25.4 9.4 26.9
64 Compendivm of Federal Justice Statistics, 1988

~~~~~---I
Table 0-1.2 Continued
Total Most serious offense Investigated
suspects in* All Property Drug Public order offenses
District cases filed offenses Violent Fraudulent Other offenses Regulato!! Other
Nebraska 197 100.0% 6.6% 34.0% 2.0% 25.4% 5.6% 24.4% Nevada 443 100.0 7.4 27.1 2.3 20.3 4.3 34.3 New Hampshire 89 100.0 0 16.9 0 55.1 1.1 27.0 New Jersey 695 100.0 4.5 31.1 6.5 19.4 8.3 29.4 New Mexico 771 100.0 4.0 19.7 5.4 40.7 1.2 28.9
New York, Eastern 1,442 100.0% 2.7% 17.1% 3.7% 50.9% 6.9% 18.3% New York, Northem 299 100.0 2.0 22.4 1.0 21.4 8.4 44.5 New York, Southern 1,766 100.0 3.7 26.6 2.2 24.3 25.7 17.3 New York, Western 326 100.0 6.1 23.6 2.1 41.4 1.8 22.7 North Carolina, Eastern 186 100.0 31.2 25.3 7.0 13.4 2.7 19.4
North Carolina, Middle 424 100.0% 9.2% 18.60/0 9.9% 39.6% 5.0% 17.0% North Carolina, Western 376 100.0 7.4 18.9 3.2 37.0 2.7 30.9 North Dakota 638 100.0 6.7 31.3 4.2 23.4 10.0 23.8 Northern Mariana Islands 6 100.0 0 0 0 0 0 100.0 Ohio, Northem 698 100.0 8.6 33.2 7.3 19.3 4.2 26.4
Ohio, Southern 622 100.0% 5.9% 30.5% 8.4% 37.8% 1.4% 15.3% Oklahoma, Eastern 102 100.0 8.8 25.5 13.7 14.7 7.8 26.5 Oklahoma, Northern 261 100.0 5.4 29.9 2.3 38.7 1.1 21.8 Oklahoma, Western 463 100.0 6.7 28.1 3.5 36.3 1.5 23.5 Oregon 624 100.0 15.7 13.1 2.4 44.6 1.8 22.0
Pennsylvania, Eastern 820 100.0% 4.3% 32.3% 3.7% 32.1% 4.3% 22.9% Pennsylvania, Middle 280 100.0 6.4 21.4 1.4 31.4 8.2 28.9 Pennsylvania, Western 434 100.0 6.5 34.3 11.5 27.9 3.0 16.8 Puerto Rico 719 100.0 2.4 30.9 7.5 40.8 4.0 13.2 Rhode Island 153 100.0 1.3 26.1 2.0 41.2 5.9 23.5
South Carolina 741 100.0% 4.2% 30.8% 6.5% 20.1% 6.9% 31.3% South Dakota 304 100.0 32.2 10.5 6.6 38.8 1.6 9.5 Tennessee, Eastern 322 100.0 5.3 27.3 6.5 36.3 6.5 15.5 Tennesseo, Middle 351 100.0 5.4 33.0 11.7 16.0 2.3 30.2 Tennessee, Western 702 100.0 2.1 21.8 7.5 45.4 1.7 21.1
Texas, Eastern 313 100.0% 2.2% 28.1% 2.2% 21.4% 2.9% 41.5% Texas, Northern 1,003 100.0 3.6 25.4 4.4 29.9 3.7 32.4 Texas, Southern 3,336 100.0 1.6 11.4 2.7 53.2 3.0 27.8 Texas, Western 1,562 100.0 2.2 15.1 1.9 46.0 1.9 32.3 Utah 407 100.0 6.1 25.1 3.9 33.2 5.7 24.8
Vermont 157 100.0% 1.9% 22.3% .6% 30.6% 4.5% 38.2"":' Virgin Islands 330 100.0 .3 5.5 0 7.3 63.0 9.7 Virginia, Eastern 1,406 100.0 5.8 13.8 2.3 34.4 3.1 39.8 Virginia, Western 269 100.0 5.6 23.4 2.6 14.1 16.4 37.9 Washington, Eastern 479 100.0 4.2 13.4 5.4 36.3 1.7 37.4
Washington, Westem 792 100.0% 6.4% 13.5% 1.6% 40.2% 5.1% 32.4% West Virginia, Northern 257 100.0 .8 11.3 3.9 54.9 1.2 27.2 West Virginia, Southern 588 100.0 1.0 12.9 4.3 37.6 2.4 41.3 Wisconsin, Eastem 293 100.0 8.2 24.6 3.8 39.6 4.1 15.7 Wisconsin, Western 153 100.0 2.6 30.7 7.2 26.8 2.0 28.8 Wyoming 132 100.0 9.fi 16.7 9.8 23.5 5.3 34.1
*Oata describe suspects in cases filed by U.S. Attorneys in 1988. Includes suspects for whom offense category could not be determined.
See Text Table 1.2.
District tables 65

Table 0-1.3 Suspects In matters declined, by offense, 1988
Total Most 6"lrious offense Investigated suspects Property Public order offenses In matter,f All Drug
District declined offenses Violent FraUdulent Other offenses Regulatory Other
All districts 28,fl25 100.0% 4.2% 35.0% 4.1% 16.3% 14.9% 23.7%
Alabama, Middle 122 100.0% 3.3% 41.0% 9.8% 9.8% 11.5% 23.8% Alabama, Northern 535 100.0 2.4 23.0 7.7 15.1 36.4 14.2 Alabama, Southem 82 100.0 4.9 61.0 0 7.3 11.0 14.6 Alaska 45 100.0 2.2 42.2 2.2 6.7 17.8 28.9 Arizona 624 100.0 11.5 21.8 3.7 7.2 5.4 49.4
Arkansas, Eastern 195 100.0% 2.1% 52.8% 5.1% 16.90/0 7.7% 14.9% Arkansas, Western 117 100.0 1.7 58.1 10.3 7.7 6.8 12.8 Califomia, Central 903 100.0 4.1 29.0 3.8 22.7 4.9 34.3 Califomia, Eastern 334 100.0 4.2 34.7 1.2 19.8 5.4 31.1 Califomia, Norlhern 736 100.0 3.5 41.4 3.1 9.6 9.1 30.3
Califomia, Southem 516 100.0% 2.7% 21.3% 3.7% 49.6% 5.4% 16.7% Colorado 356 100.0 4.5 46.1 3.7 6.7 9.3 28.7 Connecticut 206 100.0 1.5 35.4 5.8 13.6 9.7 33.0 Delaware 70 100.0 4.3 38.6 5.7 14.3 2.9 34.3 District of Columbia 11 100.0 18.2 45.5 0 0 0 27.3
Florida, Middle 1,095 100.0% 3.3% 34.9% 3.6% 23.3% 9.2% 17.6% Florida, Northem 220 100.0 3.2 27.7 .9 38.6 15.0 11.4 Florida, Southern 1,553 100.0 1.9 18.3 2.2 34.9 7.5 33.1 Georgia, Middle 99 100.0 8.1 47.5 4.0 13.1 3.0 24.2 Georgia, Northem 292 100.0 1.0 31.2 6.8 8.9 20.9 30.1
Georgia, Southern 143 100.0% 2.1% 39.9% 3.5% 19.6% 7.7% 26.6% Hawaii 125 100.0 2.4 33.6 7.2 17.6 8.8 28.0 Idaho 152 100.0 4.6 44.7 6.6 5.3 7.9 26.3 Illinois, Central 169 100.0 4.1 56.2 3.0 10.7 7.1 18.9 Illinois, Northem 563 100.0 3.0 35.0 5.0 14.6 15.3 27.0
Illinois, Southern 134 100.0% 3.7% 32.8% 6.7% 16.4% 22.4% 17.2% Indiana, Northam 273 100.0 2.9 31.1 2.9 27.5 3.7 31.1 Indiana, Southern 164 100.0 4.9 43.9 4.3 10.4 8.5 26.8 Iowa, Northem 93 100.0 4.3 53.8 1.1 21.5 3.2 12.9 Iowa, Southern 62 100.0 4.8 71.0 3.2 0 0 21.0
Kansas 142 100.0% 2.8% 54.2% 4.2% 14.1% 4.2% 17.6% Kentucky, Eastern 126 100.0 2.4 42.9 2.4 17.5 9.5 24.6 Kentucky, Western 340 100.0 2.9 44.4 5.0 11.2 5.0 30.3 Louisiana, Eastem 888 100.0 1.0 11.4 1.9 6.5 62.0 16.6 louisiana, Middle 164 100.0 .6 42.7 1.8 7.3 36.0 7.9
Louisiana, Westem 442 100.0% 5.9% 41.9% 7.0% 4.3% 12.2% 27.6% Maine 155 100.0 8.4 18.7 4.5 49.7 12.3 5.8 Maryland 552 100.0 7.8 32.2 3.6 30.4 7.1 18.7 Massachusetts 476 100.0 6.5 31.5 3.6 16.8 9.5 29.2 Michigan, Eastem 552 100.0 1.4 41.7 3.8 20.8 4.9 27.0 Michigan, Westem 97 100.0 3.1 50.5 7.2 12.4 7.2 18.6
Minnesota 215 100.0% 5.1% 43.7% 2.3% 20.0% 7.4% 20.9% Mississippi, Northem 443 100.0 1.8 29.1 1.4 3.4 47.9 16.3 Mississippi, Southern 293 100.0 5.1 59.0 1.0 8.2 3.1 22.9 Missouri, Eastern 327 100.0 2.4 39.4 2.1 19.3 19.0 1~.2 Missouri, Westem 248 100.0 2.4 58.1 4.4 10.1 5.2 17.7 Montana 53 100.0 7.5 35.8 0 7.5 3.8 43.4
66 Compendiwn of Federal Justice StaJistics, 1988

Table 0-1.3 Continued Total Most serious offense Investigated suspects Property Public order offenses In matter., All Drug
District declined offenses Violent Fraudulent Other offenses Regulatory Other
Nebmska 162 100.0% 3.1% 59.9% 6.8% 8.6% 3.7% 15.4% Nevada 310 100.0 8.4 56.1 1.6 3.2 3.2 24.8 New Hampshire 98 100.0 14.3 44.9 6.1 2.0 10.2 20.4 New Jersey 643 100.0 2.0 28.6 1.9 14.0 26.1 25.2 New Mmdco 323 100.0 4.:'i 36.5 4.6 12.1 2.5 38.7
New York, Eastern 499 100.0% 4.0% 24.2% 4.0% 38.3% 8.6% 18.4% New York, Northern 250 100.0 3.2 38.0 2.4 13.6 12.0 28.0 New York, Southern 717 100.0 3.1 38.1 3.5 9.5 9.1 35.3 New York, Western 320 100.0 1.6 60.3 5.0 8.1 10.3 12.5 Norlh Carolina, Eastern 100 100.0 16.0 34.0 7.0 11.0 11.0 21.0
North Carolina, Middle 147 100.0% 1.4% 49.0% 2.0% 10.2"k 11.6% 25.2% N(lrth Carolina, Western 92 100.0 1.1 40.2 4.3 8.7 3.3 42.4 North Dakota 88 100.0 5.7 46.6 6.8 4.5 12.5 22;' C)hlo, Northern 701 100.0 10.4 27.5 8.6 10.8 22.8 18.3 Ohio, Southern 392 100.0 3.3 36.5 9.2 13.0 17.6 18.9
Oklahoma, Eastern 38 100.0% 7.9% 44.7% 0% 15.8% 18.4% 13.2"/0 Oklahoma, Northern 7 100.0 14.3 14.3 0 28.6 0 42.9 Oklahoma, Western 162 100.0 2.5 49.4 1.9 21.0 4.9 17.9 Oregon 205 100.0 3.9 28.8 12.2 24.9 6.8 22.4 Pennsylvania, Eastern 732 100.0 3.6 41.4 2.9 20.6 8.2 22.8
Pennsylvania, Middle 140 100.0% 6.4% 45.7% 2.9% 8.6% 8.6% 23.6% Pennsylvania, Western 490 100.0 8.0 34.1 6.3 14.7 21.4 14.9 Puerto Rico 165 100.0 5.5 37.0 1.2 15.2 4.8 32.1 Rhode Island 140 100.0 2.9 30.7 9.3 5.7 25.7 23.6 South Carolina 957 100.0 5.4 34.2 4.6 8.7 23.0 23.0
South Dakota 98 100.0% 23.5% 33.7% 3.1% 9.2% 14.3% 14.3% Tennessee, Eastern 182 100.0 3.8 51.1 8.8 3.8 8.8 22.5 Tennessee, Middle 258 100.0 1.2 53.1 8.5 3.1 18.2 15.1 Tennessee, Western 279 100.0 8.2 60.2 4.3 5.0 3.2 17.9 Texas, Eastern 402 100.0 1.7 36.6 2.2 8.0 36.3 15.2
Texas, Northern 574 100.0% 3.0% 54.5% 4.4% 11.5% 4.5% 21.3% Texas, Southern 743 100.0 1.5 13.1 1.2 3.9 63.7 16.2 Texas, Western 287 100.0 1.0 44.9 1.0 15.3 3.1 32.1 Utah 258 100.0 3.5 38.0 7.0 11.6 13.6 23.3 Vermont 67 100.0 10.4 37.3 0 10.4 16.4 20.9
Virgin Islands 13 100.0% 0% 0% 0% 7.7% 84.6% 0% Virginia, Eastern 601 100.0 12.0 32.8 2.0 16.6 5.5 28.3 Virginia, Western 123 100.0 2.4 21.1 3.3 36.6 11.4 22.0 Washington, Eastern 85 100.0 0 14.1 3.5 4.7 57.6 20.0 Washington, Western 526 100.0 4.9 31.4 5.5 14.3 13.9 26.4
West Virginia, Northern 84 100.0% 6.0% 47.6% 4.8% 11.9% 8.3% 21.4% West Virginia, Southern 546 100.0 1.8 ~1.7 7.9 45.1 7.7 12.6 Wisconsin, Eastern 158 100.0 6.3 53.2 6.3 13.9 5.1 14.6 Wisconsin, Western 81 100.0 2.5 21.0 18.5 18.5 9.9 28.4 Wyoming 80 100.0 11.3 51.3 3.8 1.3 10.0 22.5
*Dala describe suspects in criminal matters declined by U.S. Attorneys See Text Table 1.2. in 1988. Includes suspects for whom offense category could not be
determined.
District tables 67

Table D-2.1 Form of protrlal roloaso or dotentlon, 1988
Percent of defe'ndants who were:
Released at an~ time on: Detalnedc
Total Personal Unsecured Financial Without Financial District defendants8 recognizance bond conditlonsb bail conditions
All districts 37,999 13.3% 32.4% 17.3% 30.1% 20.3%
Alabama, Middle 226 2.2% 77.0% 8.8% 8.0% 12.4% Alabama, Northern 388 2.6 67.3 12.1 18.8 7.7 Alabama, Southem 167 29.3 16.8 13.8 46.1 18.6 Alaska 102 20.6 29.4 26.5 21.6 19.6 Arizona 1,508 21.6 11.9 18.5 37.9 34.4
Arkansas, Eastern 193 66.3% 4.7% 14.5% 15.0% 9.8% Arkansas, Western 48 4.2 43.8 22.9 29.2 18.8 Califomla, Central 1,964 1.2 27.2 23.2 37.9 24.2 Callfomla, Eastern 617 1M 13.1 16.4 60.0 14.7 Califomia, Northern 292 13.0 15.4 33.2 43.5 29.5
Colorado 436 11.9% 36.5% 22.5% 29.60/0 18.3% Connecticut 141 2.1 46.8 29.8 22.7 14.2 Delaware 94 34.0 24.5 12.8 23.4 14.9 District of Columbia 1 100.0 0 0 0 0 Florida, Middle 1,113 10.2 36.3 14.7 37.5 19.0
Florida, Northem 220 34.1% 8.2"10 11.8% 42.7% 8.2"/0 Florida, Southern 2,606 .4 31.2 22.7 24.2 43.9 Georgia, Middle 127 10.2 40.9 18.1 26.0 18.1 Georgia, Nor\h'3m G06 2.6 41.0 23.0 24.9 25.3 Georgia, Southern 229 33.2 13.1 25.8 14.8 23.1
Guam 24 25.0% 8.3% 0% 8.3% 4.2",1.., Hawaii 168 6.5 28.0 16.7 50.6 14.9 Idaho 145 56.6 12.4 4.1 24.1 4.1 illinois, Central 79 7.6 26.6 36.7 35.4 24.1 "Ilnois, Northem 744 .5 55.8 18.0 32.0 13.4
Illinois, South9rn 155 1.3% 63.9% 11.6% 21.9% 10.3% Indiana, Northern 355 19.7 52.4 3.9 31.0 2.8 Indiana, Southern 225 34.7 16.0 13.8 34.7 6.7 Iowa, Northem 127 33.1 48.8 .8 17.3 1.6 Iowa, Southern 140 1.4 60.7 19.3 24.3 18.6
Kansas 271 16.2"/0 56.1% 5.5% 25.8% 3.7% Kentucky, Eastern 237 13.5 39.2 15.6 27.4 13.5 Kentucky, Western 257 0 62.3 9.7 32.3 5.B Louisiana, Eastem 591 .3 63.6 14.6 23.9 16.6 Louisiana, Middle 67 1.5 61.2 3.0 10.4 9.0
Louisiana, Westem 222 30.2% 37.8% 10.4% 12.6% 8.6% Maine 135 5.2 27.4 48.1 22.2 29.6 Maryland 890 46.3 9.0 10.6 28.0 7.2 Massachusetts 483 6.2 53.0 16.4 29.8 9.9 Michigan, Eastem 1,149 1.5 73.7 4.5 23.2 5.2
Michigan, Westem 202 3.5% 65.8% 14.4% 20.3% 10.9% Minnesota 420 11.2 36.9 19.3 31.9 13.1 Mississippi, Northem 82 1.2 41.5 39.0 7.3 25.6 Mississippi, Southern 219 67.1 4.6 7.8 20.1 5.5
Missouri, Eastern 464 1.7% 45.0% 25.4% 12.7% 26.9% Missouri, Westem 469 19.2 46.1 3.8 36.2 6.0 Montana 98 51.0 1.0 17.3 44.9 10.2
68 Compendium of FederalJuslice SlaJislics, 1988

Tabla 0-2.1 Continued Percent of defendants who were:
Released at an~ time on: Datainedc
Total Personal Unsecured Financial Without Financial District defendants8 recognizance bond conditionsb bail conditions
Nebraska 155 34.2% 32.3% 5.2% 19.4% 0% Nevada 408 43.6 17.4 7.6 39.0 9.8 New Hampshire 70 25.7 41.4 7.1 30.0 4.3 NewJElrsey 718 7.5 53.6 20.6 16.6 13.8 New Mexico 684 40.4 17.7 1.9 62.1 4.8
New York. Eastern 1.354 13.1% 31.5% 10.3% 49.8% 5.9% New York. Northern 30 13.3 13.3 23.3 46.7 20.0 New York. Southern 1,620 20.1 26.4· 18.8 32.6 18.9 New York, Western 240 17.9 31.3 17.1 6.7 26.7 North Carolina, Eastern 286 30.1 33.2 12.6 30.8 11.5
North Carolina, Middle 218 33.9% 26.1% 17.4% 26.6% 11.9% North Carolina, Western 516 1.6 63.2 12.8 26.2 6.2 North Dakota 169 48.5 16.6 3.0 37.9 1.8 Ohio, Northern 504 8.1 57.9 13.3 17.1 11.9 Ohio, Southern 232 38.8 12.9 19.8 27.6 9.9
Oklahoma. Eastern 72 0% 63.9% 12.5% 18.1% 23.6% Oklahoma, Northern 219 .9 50.7 21.5 17.8 13.7 Oklahoma, Western 261 8.8 34.9 17.2 35.2 17.6 Oregon 377 50.1 .5 4.2 76.9 3.7 Pennsylvania. Eastern 755 2.1 49.3 18.4 24.2 13.0
Pennsylvania, Middle 167 25.1% 35.3% 15.0% 17.4% 7.8% Pennsylvania, Western 303 1.3 53.5 17.8 2~.4 10.9 Puerto Ric.:l 646 14.1 3.9 18.0 60.1 17.2 Rhode Island 5 0 0 80.0 0 60.0 South Carolina 136 2.2 40.4 35.3 25.0 39.0
South Oakota 1\7 46.7% 31.7% 1.8% 44.9% . 1.2% Tennessee. Eastern 194 10.8 44.3 25.3 20.6 13.4 Tennessee. Middle 92 23.9 20.7 28.3 35.9 21.7 Tennessee. Western 150 2.7 4.0 48.0 40.7 34.7 Texas. Eastern 194 3.1 68.6 8.2 24.7 6.2
Texa$. Northern 771 25.6% 11.9% 27.9% 29.7% 3o.s% Texas. Southern 2.727 4.1 21.4 28.7 21.9 46.6 Texas. Western 2,240 2.9 18.0 16.4 16.0 30.3 Utah 206 34.0 8.7 6.8 49.0 2.4 Vermont 129 3.9 23.3 30.2 41.1 23.3
Vir',Jir. Islands 371 8.9% 35.0% 18.1% 25.9% 29.9% Virginia. Eastern 1 100.0 0 0 0 0 Virginia, Western 143 28.0 35.0 28.7 13.3 14.7 Washington, Eastern 53 5.7 0 0 35.8 28.3 Washingt.:Jn, Western 194 22.2 5.2 19.1 57.7 18.0
West Virginia. Northern 14 0% 85.7% 0% 50.0% 0% West Virginia. Southern 389 3.1 76.1 5.7 17.7 3.9 Wisconsin. Eastern 214 33.6 7.9 22.4 19.6 23.8 Wisconsin. Western 112 56.3 7.1 5.4 26.8 13.4 Wyoming 17 11.8 35.3 41.2 5.9 17.6
Note: Data describe detention or release at any time following the initial 8 Data describe defendants with reretrial interviews in 1988. Total bail hearing. includes defendants for whom re ease status data were unavailable. The sum of the defendants released and detained exceeds 1 QO% blncludes deposit bond, surety bond, and collateral bond. because some defendants who were initially detained eventually raised clnitially held two or more days. bail Of had the conditions of their bail changed by rehearing or appeal.
See Text Table 2.1.
District tables 69

Table D-2.2 Behavior of defendants released prior to trial, 1988
P'lrcent of released defendants who had:
Total No Violations while on release
defendB!}.ts violation Any Failed to New offense charged Technical Release District released recorded violation appear Felony Misdemeanor violations revoked
All district. 18,185 89.6".4 10.4% 3.5% 1.7% .9% 5.1% 3.5%
Alabama, Middle 181 97.2% 2.8% 1.70/0 1.1% 0% 0% 1.1% Alabama, Northern 270 93.7 6.3 1.5 1.9 .7 3.0 4.8 Alabama, Southern 99 89.9 10.1 8.1 0 0 2.0 3.0 Alaska 119 94.1 5.9 .8 1.7 .8 3.4 1.7 Arizona 625 79.0 21.0 lo<!.9 1.4 .2 4.8 3.0
Arkansas, Eastern 121 95.0% 5.0% .8% .8% 0% 3.3% 1.7% Arkansas, VVeswrn 36 97.2 2.8 2.8 0 0 0 2.8 California, Central 875 93.7 6.3 2.1 .7 .1 3.7 1.8 California, Easwrn 199 83.4 16.6 5.5 2.0 1.5 8.5 7.0 California, Northern 102 85.3 14.7 0 4.9 4.9 9.8 3.9
Colorado 233 95.3% 4.70/0 2.1% 1.7% 0% .9% 1.3% Connecticut 99 93.9 6.1 0 1.0 0 6.1 5.1 Delaware 46 93.5 6.5 6.5 0 0 0 2.2 Florida, Middla 557 91.4 8.6 3.6 1.6 .5 3.8 2.3 Florida, Northern 104 91.3 8.7 0 1.0 1.9 7.7 1.9
Florida, Southern 1,159 80.8% 19.2% 10.5% 2.3% .5% 7.8% 3.6".4 Georgia, Middle 82 92.7 7.3 0 6.1 0 1.2 4.9 Georgia, Northern 259 94.2 5.8 .8 1.9 .8 2.3 2.3 Georgia, Southern 113 92.9 7.1 0 .9 .9 5.3 5.3 Guam 13 100.0 0 0 0 0 0 0
Hawaii 89 83.1% 16.9% 4.5% 4.5% 2.2% 9.0% 7.9% Idaho 97 95.9 4.1 2.1 1.0 2.1 0 1.0 IIIir.ols. Central 14 100.0 0 0 0 0 0 0 Illinois, Northern 565 88.7 11.3 4.4 2.3 3.2 3.9 3.0 Illinois, Southern 12& 95.2 4.8 3.2 .8 0 .8 .8
Indiana, Northern 185 95.1% 4.9% .5% 2.2% 0% 2.2% 2.7% Indiana, Southern 146 98.6 1.4 0 0 0 1.4 0 Iowa, Northern 53 92.5 7.5 3.8 1.9 0 1.9 3.8 Iowa, Southern 66 78.8 21.2 3.0 3.0 0 16.7 3.0 Kansas 14i) 87.2 12.8 3.4 1.3 0 8.1 5.4
Kentucky, Easwrn 142 87.3% 12.7% ,;'*, 4.2% 2.8% 4.9% 2.1 % Kentucky, Western 177 93.2 6.8 .6 1.7 1.7 3.4 2.3 Louisiana, Eastern 395 90.4 9.6 .3 1.0 .8 7.8 3.0 Louisiana, Middle 50 98.0 2.0 2.0 0 0 0 2.0 Louisiana, VVeswm 104 100.0 0 0 0 0 0 0
Maine 72 95.8% 4.20/0 0% 1.4% 1.4% 1.4% 2.8% Maryland 46C 79.1 20.9 7.4 2.4 2.8 9,'1 4.1 Massachusetts 253 90.1 9.9 2.4 1.2 .4 6:1 2.0 Michigan, Easwm 896 94.4 5.6 1.6 .8 .3 3.2 2.6 Michigan, VVeswm 164 97.6 2.4 .6 .6 0 1.2 1.2
Mlnnasota 252 89.3% 10.7% 1.20/0 7.1% 2.0% .8% 8.3% Mississippi, Northern 62 85.5 14.5 3.2 6.5 8.1 0 '1.6 Mississippi, Southern 113 94.7 5.3 1.8 1/, 1.8 .9 3.5 Missouri, Eastern 199 90.5 9.5 .5 1.0 1.0 8.5 .5 Missouri, VVeswm 237 81.4 18.6 1.3 1.7 1.3 14.8 10.5 Montana 45 93.3 6.7 4.4 0 2.2 4.4 6.7
70 Compendiwn of Federal Jw tice Statistics, 1988

TablG D-2.2 Continued
Percent of released defendants who had:
Total No Violations while on release
defenda~ts violation Any Failed to New offense charged Technical Release District released reoorded violation appear Felony Misdemeanor violations revoked
Nebraska 75 97.3% 2.7% 0% 0% 0% 2.7% 0% Nevada 249 82.1 17.3 2.0 1.6 1.2 14.1 6.8 New Hampshire 29 93.1 6.9 3.4 0 0 6.9 3.4 New Jersey 219 89.5 10.5 3.7 2.3 2.3 4.6 1.4 New Mexico 398 91.5 8.5 4.0 1.5 .5 2.8 2.3
New York, Eastern 98 95.9% 4.1% 2.0% 0% 0% 2.0% 0% New York, Northem 21 95.2 4.8 0 4.8 0 0 4.8 New York, Southern 480 86.5 13.5 6.0 3.3 2.1 5.0 3.3 New York, Western 69 87.0 13.0 7.2 2.9 4.3 1.4 0 North Carolina, Eastern 151 94.7 5.3 .7 2.0 1.3 3.3 3.3
North Carolina, Middle 140 86.4% 13.6% 3.6% .7% 2.1% 8.6% 6.4% North Carolina, Western 303 93.1 6.9 .7 1.7 1.3 4.0 4.3 North Dakota 99 87.9 12.1 2.0 0 4.0 7.1 2.0 Ohio, Northern 385 96.9 3.1 1.0 1.6 0 .8 1.8 Ohio, Southern 191 99.5 .5 0 0 0 .5 .5
Oklahoma, Eastem 59 91.5% 8.5% 0% 1.7% 0% 6.8% 1.7% Oklahoma, Northem 127 96.1 3.9 0 .8 0 3.1 1.6 Oklahoma, Western 125 88.0 12.0 0 .8 .8 10.4 8.0 Oregon 168 80.4 19.6 5.4 1.2 0 13.1 10.7 Pennsylvania, Eastern 417 94.5 5.5 1.7 1.2 .2 2.9 2.2
Pennsylvania, Middle 82 97.6% 2.4% 0% 0% 0% 2.4% 1.2% Pennsylvania, Western 158 87.3 12.7 .6 3.8 1.9 8.2 4.4 Puerto Rico 257 84.4 15.6 .4 1.6 0 14.0 6.2 Rhode Island 8 1 ()O.O 0 0 0 Q 0 0 South Carolina 72 93.1 6.9 1.4 1.4 0 4.2 2.8
South Dakota 108 80.6% 19.4% .9% 5.6% 2.8% 11.1% 18.5% Tennessee, Eastern 143 94.4 5.6 2.8 0 Q 2.8 2.1 Tennessee, Middle 39 87.2 12.8 0 7.7 5.1 Q 12.8 Tennessee, Western 41 95.1 4.9 0 () 4.9 0 Q
Texas, Eastern 94 85.1 14.9 1.1 3.2 0 10.6 10.6
Texas, Northern 473 83.7% 16.3% 4.7% 2.5% ,6% 9.9% 5.7% Texas, Southem 954 92.7 7.3 5.3 .8 .3 1.2 1.2 Texas, Westem 589 86.6 13.4 5.4 1.7 .2 7.5 4.9 Utah 92 96.7 3.3 0 0 0 3.3 0 Vermont 58 86.2 13.8 10.3 1.7 0 3.4 3.4
Virgin Islands 231 78.8% 21.2% 3.5% 4.3% 1.3% 12.1% 10.4% Virginia, Eastern 1 0 100.0 0 100.0 0 0 100.0 Virginia, Western 89 85.4 14.6 7.9 2.2 3.4 2.2 4.5 Washington, Western 7 57.1 42.9 0 0 0 42.9 28.6 West Virginia, Northern 34 100.0 0 0 0 0 0 0
West Virginia, Southem 231 93.9% 6.1% 0% 1.3% 1.3% 3.5% 4.8% Wisconsin, Eastem 115 88.7 11.3 .9 1.7 2.6 7.8 3.5 Wisccmsin, Western 79 91.1 8.9 0 1.3 2.5 6.3 2.5 Wyoming 25 100.0 0 0 0 0 0 0
Nole: A defendant with more than one type. of violation appears in mora * Data describe defendants interviewed in 1988. Excluclas defendants than one column. A defendant with more than one of the same type of who were released but whose records did not contain suffICient violation appears only once in that column. Therefore the sum of information to determine type of release or violation behavior. individual types of violations may exceed the total. Not all violations See Text Table 2.4. resulted in revocation.
District tables 71

Table 0-3.1 Conviction rate, by most serious offense charged, 1988
Percent of defendants convicted
Total * All Property Drug Public order offenses
District defendants offenses Violent Fraudulent Other offenses Regulatory Other
All districts 54,198 80.4% 63.0"10 65.2% 60.0% 62.9% 74.1% 74.9%
Alabama, Middle 276 79.3% 63.3% 74.3% 61.3% 60.4% 64.3% 63.7% Alabama, Northern 466 67.1 84.2 67.1 86.9 62.9 66.2 91.0 Alabama, Southern 290 85.2 100.0 90.7 75.0 81.0 100.0 64.2 Alaska 231 64.4 100.0 56.3 66.7 97.5 69.7 63.0 Arizona 1,169 62.0 86.4 90.1 83.9 74.9 75.0 85.9
Arkansas, Eastern 193 86.1% 100.0% 90.2% 96.2% 91.8% 82.4% 72.7% Arkansas, Western 130 76.2 50.0 93.0 87.5 74.1 33.3 62.1 California, Central 1,190 89.4 94.3 90.1 88.9 86.6 79.6 90.7 California, Eastern 630 85.4 90.8 90.1 85.2 79.3 71.4 87.3 California, Northern 988 80.1 92.3 80.5 76.3 79.4 79.5 77.8
California, Southern 1,747 86.7% £18.6% 88.3% 92.8% 88.6% 84.7% 82.7% Colorado 469 83.4 83.9 86.4 78.4 82.4 64.0 84.0 Connecticut 380 83.2 92.3 71.4 88.9 90.6 88.9 85.5 Delaware 104 71.2 100.0 80.8 92.9 65.9 33.3 53.3 District of Columbia 739 86.5 77.3 93.3 87.4 81.8 61.5 89.7
Florida, Middle 1,014 88.1% 90.8% 85.4% 87.7% 89.7% 88.9% 85.0% Florida, Northern 365 77.8 91.3 74.5 71.4 84.9 31.3 82.6 Florida, Southern 2,371 80.1 75.8 90.1 92.5 81.9 71.8 63.0 Georgia, Middle 2,228 84.5 100.0 82.4 86.8 80.4 95.0 84.3 Georgia, Northern 845 86.7 92.4 89.4 84.6 84.7 80.5 86.3
Georgia, Southern 380 73.7% 76.9% 81.3% 71.0% 67.6% 50.0% 75.00/0 Guam 81 81.5 0 95.5 100.0 100.0 100.0 83.3 Hawaii 1,726 51.9 85.7 82.8 55.8 73.4 33.3 47.5 Idaho 162 84.0 '70.6 93.5 70.8 100.0 61.5 86.7 Illinois, Central 233 79.8 75.0 83.3 84.6 76.5 66.7 82.5
Illinois, Northern 1,102 93.0% 86.4% 95.2% 94.6% 94.1% 86.0% 88.3% Illinois, Southern 213 84.0 72.7 86.6 74.4 91.2 100.0 84.6 Indiana, Northern 299 84.6 100.0 88.1 85.0 82.2 84.6 77.8 Indiana, Southern 521 67.9 60.7 89.3 70.8 65.3 76.7 62.2 Iowa, Northern 101 84.2 50.0 73.3 50.0 93.0 73.7 94.4
Iowa, Southern 98 76.5% 100.0% 80.9% 100.0% 28.6% 50.0% 87.5% Kansas 451 70.5 63.6 75.8 53.6 76.9 66.7 71.0 Kentucky, Eastern 302 78.1 89.5 77.1 73.1 86.2 63.0 74.5 Kentucky, Western 580 80.2 70.0 75.7 83.6 83.2 65.6 75.0 Louisiana, Eastern 579 89.3 72.2 87.6 96.6 89.1 92.7 89.6
Louisiana, Middle 65 83.1% 75.6% 85.7% 100.0% 100.0% 69.5% Louisiana, Western 257 81.3 72.7 64.0 93.3 64.0 87.0 69.2 Maine 222 76.1 100.0 67.7 77.6 62.1 40.0 70.8 Maryland 976 76.9 61.5 90.7 77.5 76.2 85.1 66.4 Massachusetts 493 77.9 76.0 79.1 81.4 83.3 57.8 78.6
Michigan, Eastern 914 87.1% 63.3% 66.4% 93.5% 84.2% 90.3% 66.6% Michigan, Western 213 65.0 85.7 67.7 100.0 76.6 83.3 95.8 Minnesota 412 93.4 100.0 85.6 93.1 94.9 100.0 96.7 Mississippi, Northern 139 65.6 83.3 94.0 66.0 70.8 80.0 82.8 Mississippi, Southern 213 78.4 75.0 77.8 83.3 60.4 66.7 79.5
Missouri, Eastern 364 62.6% 65.7% 87.9% 95.5% 75.4% 72.7% 63.1% Missouri, Western 739 66.6 81.5 69.1 90.9 90.6 57.1 50.6 Montana 266 76.1 65.2 62.4 65.6 62.0 65.6 90.0
72 Compendium of Federal Justice Statistics, 1988

~~---I
Table 0-3.1 Continued
Percent of defendants convicted
Total * All Property Drug Public order offenses
District defendants offenses Violent Fraudulent Other offenses Regulatory Other
Nebraska 185 85.9% 93.3% 93.8% 78.9% 95.3% 75.0% 64.1% Nevada 491 80.7 94.1 80.6 77.8 79.8 85.7 76.8 New Hampshire 48 79.2 100.0 90.0 100.0 72.2 100.0 76.5 New Jersey 852 83.0 83.3 85.8 83.3 83.2 71.3 83.0 New Mexico 686 73.5 84.1 68.9 57.4 73.0 61.9 78.8
New York, Eastern 1,095 89.3% 81.4% 88.7% 90.00/0 90.20/0 84.4% 91.3% New York, Northem 364 85.2 66.7 92.7 77.4 72.4 82.1 93.9 New York, Southern 1,305 89.9 90.0 93.0 93.0 87.4 84.5 92.9 New York, Western 306 86.9 100.0 92.6 95.0 81.0 68.4 81.3 North Carolina, Eastern 1,317 40.9 72.2 84.1 69.6 55.7 41.3 30.0
North Carolina, Middle 306 87.60/0 94.3% 78.0% 97.2% 92.1% 66.7% 86.5% North Carolina, Western 507 79.7 93.6 83.9 89.7 72.2 54.1 91.4 North Dakota 135 84.4 59.4 85.2 87.5 100.0 60.0 100.0 Northern Mariana Islands 23 26.1 0 100.0 12.5 66.7 22.2 Ohio, Nor1hern 599 94.3 90.5 93.4 94.7 96.1 83.9 96.9
Ohio, Southern 509 91.6% 95.2% 94.00/0 90.9% 89.0% 100.0% 91.3% Oklahoma. Eastem 93 69.9 88.9 72.4 7.1 81.8 80.0 68.2 Oklahoma, Nor1hern 214 83.6 44.4 90.9 75.0 78.7 80.0 92.0 Oklahoma, Western 563 86.9 70.8 86.1 67.9 88.2 83.3 93.9 Or'lgon 487 83.4 89.9 93.2 85.7 79.6 41.7 81.6
Pennsylvania, Eastern 751 90.5% 90.9% 94.3% 89.7% 86.8% 88.0%. 91.4% Pennsylvania, Middle 296 85.1 75.0 92.2 90.9 81.4 63.0 90.9 Pennsylvania, Western 351 74.6 82.1 64.7 59.4 87.0 60.0 85.7 Puerto Rico 759 81.6 81.0 84.7 71.4 82.2 69.4 81.6 Rhode Island 88 94.3 100.0 100.0 100.0 94.4 100.0 88.9
South Carolina 456 84.60/0 94.70/0 81.3% 86.3% 75.8% 95.5% 88.0% South Dakota 259 82.2 81.8 72.4 89.2 85.7 70.0 77.8 Tennessee, Eastern 239 79.5 80.0 71.4 92.1 91.4 64.3 71.4 Tennessee, Middle 390 87.7 92.3 87.0 81.8 91.3 90.0 88.9 Tennessee, Western 469 82.5 71.4 91.4 94.9 74.2 70.0 81.0
Texas, Eastem 234 65.8% 71.4% 57.8% 50.00/0 68.00/0 66.7% 80.00/0 Texas, Northern 974 77.3 78.9 64.7 87.2 81.2 75.8 84.0 Texas, Southern 2,661 78.9 76.2 75.5 71.1 79.7 73.4 80.7 Texas, Western 1,334 88.1 94.6 86.9 84.7 88.8 90.5 88.4 Utah 335 74.6 69.0 83.5 91.3 67.3 66.7 75.0
Vermont 98 88.8% 75.0% 80.0% 100.0% 84.0"10 87.5% 97.4% Virgin Islands 370 70.3 77.3 81.8 77.9 59.1 100.0 54.1 Virginia, Eastern 2,638 72.9 65.1 85.9 56.2 79.8 65.9 73.9 Virginia, Western 235 80.9 93.8 70.9 80.0 90.5 82.6 76.2 Washington, Eastern 423 61.9 71.4 38.5 37.0 67.6 27.3 72.9
Washington, Westem 1,718 81.0% 92.3% 91.1% 70.1% 86.7% 77.8% 78.1% West Virginia, Northern 218 91.3 100.0 94.1 92.3 89.1 100.0 92.9 West Virginia, Southern 394 79.7 100.0 79.4 57.6 90.1 53.3 87.7 Wisconsin, Eastern 216 92.1 100.0 92.3 100.0 90.3 90.0 87.1 Wisconsin, Western 155 83.9 100.0 86.5 91.7 82.6 66.7 83.3 Wyoming 104 87.5 72.7 89.5 100.0 75.9 100.0 95.5
... No cases of this type occurred in the data. See Text Table 3.1. "Includes defendants for whom offense type could not be determined.
District tables 73

Table 0-3.2 Convicted offenders, by most serious offense charged, 1988
Total Percent of convicted offenders
convicted. All Pro~erty Drug Public order offenses
District offenders offenses Violent Fraudulent Other offenses Regulatory Other
All districts 43,550 100.0% 5.1% 22.6% 8.6% 31.8% 3.8% 28.0%
Alabama, Middle 219 100.0% 2.3% 23.7% 17.8% 16.9% 4.1% 35.20/0 Alabama, Northern 406 100.0 3.9 24.9 13.8 26.4 3.7 27.3 Alabama, Southern 247 100.0 .8 39.7 3.6 41.3 1.6 13.0 Alaska 195 100.0 2.6 9.2 7.2 40.5 17.9 22.6 Arizona 959 100.0 9.9 27.5 4.9 39.2 1.3 172
Arkansas, Eastern 170 100.0% 2.9% 27.1% 14.7% 32.9% 8.2% 14.1% Arkansas, Western 99 100.0 6.1 40.4 14.1 20.2 1.0 18.2 California, Central 1,064 100.0 15.5 28.3 9.0 23.8 4.0 19.4 California, Eastern 53P. 100.0 12.8 23.6 9.7 25.7 2.8 25.5 Califomia, Northern 791 100.0 7.6 32.4 7.3 28.8 3.9 20.0
Califomia, Southern 1,514 100.0% 4.6% 11.0% 4.2"10 44.3% 6.9% 29.0% Colorado 391 100.0 6.6 17.9 10.2 27.6 5.4 32.2 Connecticut 316 100.0 3.8 28.5 2.5 39.6 5.1 20.6 Delaware 74 100.0 2.7 28.4 17.6 39.2 1.4 10.8 District of Columbia 639 100.0 2.7 35.1 14.1 38.8 1.3 8.1
Florida, Middle 893 100.0% 6.6% 24.2"/0 5.6% 50.5% 3.6% 9.5% Florida, Northern 284 100.0 7.4 13.4 7.0 55.3 3.5 13.4 Florida, Southern 1,900 100.0 3.8 22.9 2.6 55.1 2.7 13.0 Georgia, Middle 1,882 100.0 .5 1.5 3.1 2.0 1.0 91.9 Georgia, North~m 733 100.0 8.3 29.9 12.0 27.3 4.5 18.0
Georgia, Southern 280 100.0% 3.6% 21.8% 7.9% 25.4% .7% 40.7% Guam 66 100.0 0 31.8 18.2 24.2 3.0 22.7 Hawaii 896 100.0 2.0 5.9 4.8 12.6 .3 74.3 Idaho 136 100.0 8.8 31.6 12.5 12.5 5.9 28.7 Illinois, Central 186 100.0 3.2 34.9 5.9 34.9 3.2 17.7
Illinois, Northern 1,025 100.0% 1.9% 40.7% 12.0% 23.4% 3.6% 18.4% Illinois, Southern 179 100.0 4.5 46.9 17.9 17.3 1.1 12.3 Indiana, Northern 253 100.0 1.2 43.9 6.7 32.8 4.3 11.1 Indiana, Southern 354 100.0 4.8 18.9 4.8 21.8 6.5 43.2 Iowa, Northern 85 100.0 2.4 12.9 1.2 47.1 16.5 20.0
Iowa, Southern 75 100.0% 5.3% 50.7% 9.3% 5.3% 1.3% 28.0% Kansas 318 100.0 6.6 30.5 9.4 18.9 3.8 30.8 Kentucky, Eastern 236 100.0 7.2 22.9 16.1 31.8 7.2 14.8 Kentucky, Western 465 100.0 4.5 12.0 50.5 21.3 4.5 7.1 Louisiana, Eastern 517 100.0 2.5 28.6 11.0 36.4 9.9 11.6
Louisiana, Middle 54 100.0% 0% 46.3% 11.1% 7.4% 3.7% 31.5% Louisiana, Western 209 100.0 3.8 42.6 6.7 20.1 9.6 17.2 Maine 169 100.0 3.6 12.4 4.1 51.5 1.2 272 Maryland 751 100.0 5.9 16.9 9.2 36.9 5.3 25.8 Massachusetts 384 100.0 4.9 32.6 9.1 19.5 6.8 27.1
Michigan, Eastern 796 100.0% 2.5% 30.8% 10.9% 32.0% 3.5% 20.2% Michigan, Western 181 100.0 3.3 39.2 2.8 36.5 5.5 12.7 Minnesota 385 100.0 6.0 20.0 7.0 48.1 3.6 15.3 Missi~ippl, Northern 119 100.0 4.2 39.5 18.5 14.3 3.4 20.2 Mississippi, Southern 167 100.0 3.6 41.9 3.0 26.9 3.6 21.0
Missouri, Eastern 317 100.0% 3.8% 34.4% 6.6% 30.9% 2.5% 21.8% Missouri, Western 507 100.0 4.3 22.7 3.9 29.2 .8 39.1 Montana 204 100.0 14.7 20.6 12.3 24.5 10.3 17.6
74 Compendium of Federal Justice Statistics, 1988

Table 0-3.2 ContInued
Percent of convicted offenders Total
ProEe!:& Public order offenses con~cted* All Drug District offenders offenses Violent Fraudulent Other offenses Regulatory Other
Nebraska 159 100.0% 8.8% 38.4% 9.4% 25.8% 1.9% 15.7% Nevada 396 100.0 8.1 40.9 8.8 16.9 6.1 19.2 New Hampshire 38 100.0 2.6 23.7 2.6 34.2 2.6 34.2 New Jarsey 707 100.0 4.2 35.9 10.6 21.8 8.1 19.4 New Mexico 504 100.0 11.5 16.7 5.4 35,9 2.6 28,0
New York, Eastern 978 100.0% 3 ,SOlo 20,9% 7.4% 50.9% 5.5% 11.8% New York, Northem 310 100.0 3.2 16.5 7.7 20.3 7.4 44.5 New York, Southern 1,173 100.0 3.8 25.1 5.6 43.6 5.1 16.7 New York, Western 266 1(lO,O 4.5 37.6 14,3 19.2 4.9 19.5 North Carolina. Eastern 538 100.0 4.8 12.8 10.2 15.4 9.3 47.4
North Carolina, Middle 268 100.0% 12.3% 26.5% 13.1% 34.7% 1.5% 11.9% North Carolina, Western 404 100.0 10.9 37.4 8.7 17.3 9.9 15.8 North Dakota 114 100.0 16.7 20.2 12.3 22.8 2.6 25.4 Northern Mariana Islands 6 100.0 0 16.7 0 16.7 33.3 33.3 Ohio, Northem 565 100.0 6.7 25.0 15.8 26.2 4.6 21.8
Ohio, Southern 466 100.0% 4.3% 30.0% 15.00":' 34.8% 2.4% 13.5% Oklahoma, Eastem 65 100.0 12.3 32.3 12.3 13.8 6.2 23.1 Oklahoma, Northern 179 100.0 2.2 44.7 5.0 33.0 2.2 12.8 Oklahoma, Western 489 100.0 3.5 25.4 7.8 24.5 0 37.8 Oregon 406 100.0 19.7 16.7 7.4 37.4 1.2 17.5
Pennsylvania, Eastern 680 100.0% 1.5% 36.8% 5.1% 32.9% 6.5% 17.2% Pennsylvania, Middle 252 100.0 4.8 32.9 7.9 27.8 6.7 19.8 Pennsylvania, Western 262 100.0 8.8 28.6 7.3 35.9 5.7 13.7 Puerto Rico 619 100.0 2.7 33.1 5.7 39.4 4.0 15.0 Rhode Island 83 100.0 2.4 19.3 4.8 41.0 3.6 28.9
South Carolina 386 100.0% 4.7% 32.6% 17.9% 13.0% 10.9% 21.0% South Dakota 213 100.0 33.8 9.9 15.5 31.0 3.3 6.6 Tennessee, Eastern 190 100.0 4.2 28.9 18.4 27.9 4.7 15.8 Tennessee, Middle 342 100.0 3.5 33.3 13.2 12.3 2.6 35.1 Tennessee, Western 387 100.0 1.3 35.7 9.S 34.1 1.8 17.6
Texas, Eastern 154 100.0% 3.2% 31.2% 3.9% 33.1% 5.2% 23.4% Texas, Northern 753 100.0 4.0 25.1 9.0 29.2 3.3 28.7 Texas, Southern 2,099 100.0 1.5 11.6 3.9 54.3 2.2 26.5 Texas, Western '1,175 100.0 3.0 19.7 10.4 38.0 1.6 27.3 Utah 250 100.0 8.0 26.4 8.4 28.8 5.6 22.8
Vermont 87 100.0% 3.4% 18.4% 3.4% 24.1% 8.0% 42.5% Virgin Islands 260 100.0 28.8 13.8 25.8 15.0 1.2 15.4 Virginia, Eastern 1,923 100.0 3.7 7.9 10.4 20.1 1.4 56.5 Virginia, Western 190 100.0 7.9 20.5 6.3 30.0 10.0 25.3 Washington, Eastem 262 100.0 3.8 9.5 3.8 44.7 1.1 37.0
Wa&;·,i.1gton, Westem 1,391 100.0% 3.5% 8.1% 7.3% 27.2% 1.5% 52.5% West Virginia, Northern 199 100.0 4.5 16.1 6.0 57.8 2.5 13.1 West Virginia, Southem 314 100.0 .6 15.9 15.6 49.4 2.5 15.9 Wisconsin, Eastern 199 100.0 10.1 30.2 9.0 32.7 4.5 13.6 Wisconsin, Western 130 100.0 .8 24.6 8.5 43.8 3.1 19.2 Wyoming 91 100.0 8.8 18.7 23.1 24.2 2.2 23.1
* See Text Table 3.1. Includes offenders for whom offense type could not be determined.
District tables 75

Table D-3.3 Characteristics of convicted offenders, 1988 ,.'
Percent of offenders with selected characteristics
Total Ethnicity Prior convictions Known convicted. Race
Non· Age
Employed Misde· drug District defendants Male Wh~o Black Other Hispanic Hispanic 16·18 19·20 21-:30 3140 40+ at arrost None meanor Felony history
All dllitrlcta 4.'3,550 82.9% 71.6% 25.4% 3.0% 16.5% 83.5% 1.3% 3.6% 33.6% 32.2% 29.2"k 59.7% 51.2% 17.9% 30.9% 22.0%
Alabama, Middle 219 70.6% 49.0% 49.5% 1.5% 1.5% 98.5% 1.0% 5.7% 39.4% 28.0% 25.9% 67.1% 66.7% 14.0% 19.4% e.l% Alabama, Northam 406 79.3 69.7 29.9 .3 0 100.0 .6 3.5 34.7 32.5 2B.7 61.4 43.1 21.3 35.6 26.5 Alabama, Solihem 247 12.6 68.2 31.B 0 22 97.B 1.8 I.B 30.0 31.8 34.5 66.0 25.0 37.5 37.5 23.6 Alaskc 195 B1.4 79.5 10.3 10.3 4.5 95.5 1.9 3.1 36.(' 33.5 25.5 50.0 74.5 19.6 5.9 31.5 Arizona 959 B5.6 87.1 4.3 B.6 45.B 54.2 2.4 5.B 43.3 30.B 17.7 61.1 67.5 14.4 18.1 12.3
Arkansas, Eastom 170 37.4% 70.3% 29.1% .8% 1.9% 98.1% .6% .6% 26.4% 38.4% 34.0% 74.7% 63.9% 15.3% 20.B% 17.6% Arkansas, Western 99 79.B 76.4 23.6 0 15.7 B4.3 2.3 3.4 38.6 30.7 25.0 37.5 47.4 21.1 31.6 18.2 CalHomla. Cenlral 1,064 84.3 73.9 21.2 n 27.4 12.6 .9 3.0 32.2 32.3 31.7 62.2 5B.2 16.7 25.1 20.1 CalHomla. Eastern 538 B5.6 B6.1 12.7 12 11.7 68.3 .7 2.0 3B.l 31.7 27.5 32.7 37.S 24.B 37.6 39.8 CalHomla. Nonhem 791 77.7 66.6 23.9 9.3 3.6 96.4 1.1 3.3 31.4 31.5 32.B 53.0 40.5 19.0 40.5 33.0
CalHamia, Southern 1,514 B4.2% 88.1% 10.0% 1.9% 38.7% 61.3% 2.4% 6.0% 41.6% 30.7% 19.3% 25.0% 11.1% 33.3% 55.6% 25.0% Colorado 391 86.3 83.4 15.0 1.6 13.1 86.9 1.0 3.5 29.8 39.4 26.3 64.0 65.5 12.6 21.8 23.6 Connecticut 316 B6.1 75.2 24.B 0 12.4 B7.6 .4 1.5 3B.5 33.B 25.B 55.6 62.5 6.3 31.3 38.0 Delaware 74 7B.6 60.7 39.3 0 10.7 B9.3 0 1.8 35.1 33.3 29.B 73.9 73.7 10.5 15.B 27.3 District 01 Columbia 639 73.5 21.2 77.6 12 4.4 95.6 3.0 6.9 40.4 31.3 lB.4 100.0 100.0 0 0 0
Florida, Middle 893 84.0% 65.2% 34.2% .6% 3.3% 96.7% 1.3% 3.4% 38.1% 2B.9% 28.4% 63.8% 36.1% 17.2"k 46.7% 23.6% Florida, Nonhem 264 87.7 66.B 32.B .4 1.6 9BA 2.0 4.9 32.B 34.4 25.9 47.B 43.5 11.B 44.7 24.2 Florida, Southern 1,900 83.3 79.0 20.4 .6 41.3 5B.7 .7 1.8 33.3 34.8 29.5 6B.9 58.7 6.6 32.7 7.8 Georgia, Middle 1,8e2 Bl.2 58.8 38.4 2.B 2.B 97.2 32 10.B 39.2 22.B 24.0 70.6 51.7 27.6 20.7 33.3 Georgia, Nonhem 733 BO.5 53.9 44.9 12 2.7 97.3 1.0 2.4 31.0 40.1 25.5 66.3 39.7 21.2 39.2 19.1
Georgia, Southern 280 77.4% 60.4% 39.6% 0% 3.7% 96.3% 0% 4.9% 27.0% 41.1% 27.0% 5B.6% 52.B% 24.5% 22.6% 23.7% Guam 66 67.3 4.1 2.0 93.9 0 100.0 4.1 2.0 4O.B 36.7 16.3 56.3 7B.6 7.1 14.3 25.0 Hawaii 896 82.8 45.4 10.9 43.7 5.7 94.3 .1 .7 B.7 7.9 B2.6 55.0 30.B 35.9 33.3 34.5 Idaho 136 B1.0 68.4 3.3 B.3 13.2 B5.8 0 2.5 27.3 45.3 24.0 55.0 52.6 23.1 24.4 27.8 illinois, Central 186 76.6 BO.2 lB.6 12 .6 99.4 12 2.4 32.3 40.1 24.0 42.9 16.7 0 B3.3 66.7
Illinois, Northern 1,025 BD.6% 50.0% 39.5% .4~~ 8.6% 91.4% 2% 1.1% 24.4% 37.8% 36.5% 64.5% 45.1% lB.l% 36.8% 13.4% Illinois, Southern 179 62.9 62.4 35.3 2.4 I.B 98.2 1.6 2.4 27.1 40.0 2B.8 51.5 6B.B 7.!', 23.7 9.6 Indiana. Northern 253 83.4 70.0 28.7 1.3 4.9 95.1 .4 .9 26.9 36.B 35.0 5B.B 64.5 9.9 25.6 20.2 Indiana. Southern 354 B9.4 83.3 16.7 0 2.4 97.6 12 2.0 30.7 32.4 33.6 76.5 B3.3 5.6 11.1 20.5 Iowa, Nonhem B5 B9.0 94.5 5.5 0 2.7 97.3 0 4.1 24.7 42.5 2B.8 63.4 6B.4 18.4 13.2 23.5
Iowa, Southern 75 B2.6% 81.2"-' lB.B% 0% 10.1% B9.9% 2.9% 2.9% 32.4% 29.4% 32.4% 61.5% 34.4% 28.1% 37.5% 30.6% Kansas 31B 82.0 72.7 26.2 12 3.1 96.9 12 1.5 34.7 32.4 30.1 51.8 43.4 20.2 38.4 2B.4 Kentucky, Eastom 236 B2.5 B4.3 15.3 .4 7.0 93.0 .9 3.5 29.4 3B.2 2B.l 49.8 51.6 21.0 27.4 19.6 Kentucky, Western 465 7B.B 71.0 27.B 12 2.0 9B.0 9.B 14.9 31.0 21.5 22.9 5B.B 48.4 29.5 22.1 16.B I.ouisiana, Eastern 517 BO.7 59.6 3B.4 2.0 5.4 94.6 .9 22 33.6 34.0 29.3 55.6 60.1 20.2 19.7 13.0
Louisiana, Middle 54 74.5% 42.6% 57.4% 0% 4.3% 95.7% 0% 2.1% 27.7% 31.9% 3B.3% 61.B% 37.0% 11.1% 51.11% 20.0% Louisiana, Western 209 B2.3 70.6 2B.9 .6 22 97.B 1.6 1.6 22.5 32.4 41.B 70.0 68.1 15.9 15.9 9.9 Maine 169 86.7 99.2 .B 0 1.6 98.4 .8 1.6 33.6 39.1 25.0 70.2 37.2 lB.6 44.2 37.8 Maryland 751 86.2 55.1 42.6 2.3 3.0 97.0 1.5 3.5 38.5 11.1 25.5 64.9 47.9 14.3 37.8 32.1 Massachusetts 384 92.7 88.7 10.7 .6 4.3 95.7 0 3.0 26.6 30.2 40.1 61.0 42.2 14.8 43.0 19.7
Michigan, Eastern 796 79.0% 50.2% 49.4% .4% 1.6% 98.4% .4% 32% 30.1% 35.4% 31.0% 56.6% 47.7% 12.2% 40.0% 19.6% MIchigan, Western 181 76.3 82.1 15.6 2.3 12 98.8 .6 2.9 26.2 41.9 28.5 68.7 66.1 13.4 20.5 B2 Minnesota 385 84.5 77.5 19.4 3.1 8.7 91.3 2.0 2.5 39.1 36.0 20.4 49.7 5B.9 10.3 30.9 27.7 Mississippi, Nonhem 119 85.7 70.5 29.5 0 .9 99.1 0 .9 15.2 33.0 50.9 74.5 60.0 26.7 13.3 4.3 Mississippi, Southern 167 B3.2 59.5 35.8 4.7 .7 99.3 .7 .7 28.6 34.0 36.1 63.7 69.3 12.5 18.2 7.8
Missouri, Eastern 317 82.0% 48.5% 50.8% .8% 2.6% 97.4% .4% .4% 33.0% 34.8% 31.5% n,2% 45.1% 12.7% 42.3% 20.9% Missouri, Western 507 81.2 57.2 42.2 .6 12 98.8 .6 2.9 35.9 32.9 27.7 51.4 41.4 23.8 34.8 38.7 Monlana 204
76 Compendiwn of Federal Justice Statistics, 1988

Table 0.3.3 Continued
Percent of offenders with selected characteristics
Total Ethnlcity Prior convictions Known convicted *
Race Age Employed Misde· drug ~on.
District defendants Mala Wh~e Black Other Hispanic ispanic 16-18 19·20 2HlO 31-40 40+ at arrest None meanor Felony history
Nebraska 159 88.3% 81.4% 16.6% 2.1% 3.4% 96.6% 1.4% 1.4% 29.9% 34.7% 32.6% 67.1% 52.7% 24.3% 23.0% 21.6% Nevada 396 84.5 86.9 10.7 2.4 5.1 94.9 6 1.5 24.4 29.1 44.4 67.2 46.3 20.7 32.9 17.5 New Hampshire 38 96.7 93.3 6.7 0 3.3 96.7 10.0 0 16.7 26.7 46.7 80.0 47.1 11.6 41.2 23.1 New Jorsey 707 85.9 73.3 25.7 1.0 92 90.8 .8 1.4 24.6 25.3 47.9 58.5 56.2 14.9 28.9 12.2 New Mexico 504 87.9 88.4 32 8.4 39.4 60.6 1.6 3.9 46.6 27.8 18.1 45.8 61.9 16.2 21.9 10.8
New York, Eastern 976 85.9% 74.0% 23.1% 2.8% 6.5% 93.5% .4% 32% 34.6% 31.8% 29.9% 70,4% 59.1% 18.2% 22.7% 7.4% New York, Northern 310 88.9 91.2 7.6 12 7.6 92.4 0 3.5 29.2 26.3 40.9 0 100.0 0 0 0 New York, Southern 1,173 86.9 63.6 33.4 3.0 35.2 64.8 1.0 3.1 29.8 32.4 33.8 52.4 33.3 15.2 51.5 14.6 New YOik, WOSlern 266 80.5 n4 22.6 0 1.8 98.2 0 2.6 27.2 29.7 40.5 48.3 51.7 24.1 24.1 30.5 North Carolina, EaS!I'!/O 538 80.0 63.1 33.1 3.8 2.3 97.7 1.9 3.4 37.8 31.3 25.8 66.4 52.4 25.7 21.9 17.8
North Carolina, Middle 268 80.5% 51.8% 42.6% 5.6% .4% 99.6% 1.6% 5.9% 41.7% 31.1% 19.7% 59.8% 41.3% 21.5% 37.2% 36.8% North Carolina, Western 404 82.3 59.5 33.3 7.1 2.6 97.4 1.7 2.9 27.7 32.3 35.4 69.6 51.4 25.4 23.2 26.3 North Da~.ota li4 84.3 62.7 2.0 35.3 0 100.0 5.1 7.1 38.8 31.6 17.3 37.7 42.9 25.0 32.1 16.4 Northern Mariana Island 6 100.0 0 0 100.0 0 100.0 0 0 50.0 0 50.0 0 100.0 0 0 0 Ohio, Northern 565 83.4 67.B 31.4 .8 5.4 94.6 .3 2.4 32.0 34.9 30,4 57.7 46.7 18.4 34.9 15.5
Ohio, Southern 466 80.7% 66.9% 32.6% .5% .7% 99.3% 1.9% 4.8% 34.2",(, 32.3% 26.7% 61.0% 52.5% 21.6% 25.9% 31.0% Oklahoma, Eastern 65 85.5 87.1 9.7 32 0 100.0 32 6.5 33.1.1 30.6 25.8 60.5 71.1 4.4 24.4 30.8 Oklahoma, Northern 179 79.1 73.4 26.6 0 1.3 98.7 1.3 3.8 29.1 30.4 35.4 56.4 52.4 11.9 35.7 28.2 Oklahoma, Western 489 75.9 75.4 19.0 5.6 3.8 96.2 2.0 1.4 28.7 32.8 35.1 46.1 46.8 9.2 44.0 28.7 Oregon 406 84.1 91.1 4.0 4.9 9.4 90.6 .3 1.3 35.6 41.5 21.3 36.6 29.8 12.4 57.9 59.0
Pennsylvania, Eastern GBO 87.8% 69.8% 29.4% .8% .8% 99.2% 2% 1.1% 23.5% 32.8% 42.4% 66.7% 57.0% 10,4% 32.6% 14.5% Pennsylvania, Middle 252 83.7 86.3 11.2 2.6 .9 99.1 0 4.7 23.3 34.7 37.3 79.2% 65.1 9.5 25.4 25.7 Pennsylvania, Western 262 86.1 80.4 19.6 0 .9 99.1 0 .8 25.4 36.0 37.7 55.9 60.4 8.8 30.8 12.6 Puerto Rico 819 75.7 71.5 28.2 .3 60.6 39.4 1.5 42 32.9 32.9 28.5 60.1 54.3 12.0 33.7 23.3 Rhode Island 83 86.1 84.7 15.3 0 27.8 72.2 0 1.4 31.5 26.0 41.1 80.0 80.0 0 20.0 0
South Carolina 386 78.6% 54.5% 44.9% .6% .6% 99.4% 12% 3.0% 32.1% 36.9% 26.7% 63.3% 22.2% 11.1% 66.7% 26.7% South Dakota 213 88.5 36.6 3.1 60.2 1.0 99.0 1.6 3.7 46.1 35.1 13.6 42.0 32.9 43.5 23.5 39.1 Tennessee, EOSlem 190 79.3 94.7 5.3 0 0 100.0 .6 2.4 23.1 43.2 30.8 74.0 63.4 19.7 16.9 18.8 Temessee, Middle 342 n7 75.7 23.3 1.0 .6 99.4 1.0 B.O 38.5 25.2 27.4 84.2 55.0 10.0 35.0 36.8 TaMossee, Western 387 70.2 39.6 59.1 1.4 .8 99.2 1.1 4.4 35.3 31.8 27.4 50.0 30.0 30.0 40.0 33.3
Texas, Eastern 154 73.7% n.4% 21.8% .8% 6.0% 94.0% 0% 2.2% 30.6% 33.6% 33.6% 47.9% 32.6% 20.0010 46.5% 34.8% Texas. Northern 753 85.0 75.7 23.2 1.1 17.0 83.0 .9 4.1 34.7 33.7 26.6 60.5 36.4 28.3 35.3 26.7 Texas, Southern 2,099 87.7 93.8 6.0 .3 71.8 28.2 1.9 5.4 42.4 31.0 19.3 57.9 50.5 26.5 23.0 18.4 Texas, Western 1,175 83.2 86.7 12.0 1.3 52.0 48.0 2.0 3.7 37.2 35.7 21.4 5t'.7 49.7 16.1 34.2 33.9 lhah 250 86.1 85.0 9.3 5.7 8.3 91.7 1.0 2.1 38.2 27.7 30.9 50,7 55.8 20.8 23.4 36.5
Vennant 87 82.9% 85.7% 8.6% 5.7% lA·A 96.6% 1.4% 0 % 57.1% 30.0% 11.4% 69.0% 55.2",(, 10.3% 34.5% 17.2% Virgin Islands 260 92.5 12.6 86.9 .5 17.2 82.8 4.0 15.2 56.1 17.7 7.1 41.7 70.0 10.0 20.0 24.2 Virginia, Eastern 1,923 83.6 54.0 43.8 2.2 42 95.8 2.4 8.5 41.2 26.2 19.6 69.2 3B.5 3B.5 23.1 28.6 Virginia, Western 190 83.9 91.9 7.5 .6 0 100.0 .6 12 33.3 34.6 30.2 53.2 35.6 26.7 37.8 39.1 Washlngton, Eastern 262 89.5 95.0 1.5 3.5 42.0 56.0 2.5 4.5 42.5 33.0 17.5 25.0 0 50.0 50.0 25.0
Washington, Western 1,391 84.2% 72.1% 16.2% 11.7% 10.2% 89.8% 1.8% 6.1% 38.5% 30.6% 23.1% 52.B% 43.8% 31.3% 25.0% 48.4% West Virginia, Northern 199 87.0 69.1 30.9 0 12 9B.8 0 2.5 40.9 37.1 19.5 74.1 71.9 12.5 15.6 14.3 West Virginia, Southern 314 85.3 84.9 15.1 0 0 100.0 1.1 5.3 30.5 37.5 25.6 55.9 47.8 27.3 24.B 41.4 WISCOnsin, Eastern 199 75.7 nB 20.1 2.1 3.7 96.3 1.6 5.3 31.7 32.B 28.6 65.7 43.9 30.6 25.5 14.6 Wisconsin, Western 130 82.5 88.6 10.5 .9 4.4 95.6 .9 1.8 41.6 38.1 17.7 61.5 41.7 50.0 8.3 15.4 Wyoming 91 68.5 96.2 a 3.8 5.8 94.2 1.9 1.9 30.8 40.4 25.0 50.0 60.0 10.0 30.0 22.2
Note: Percents for individual characteristics were calculated on the basis of *Oata describe of/enders in cases terminated in 1988. Total excludes available data. Some rE!C(lrds did not include complete data in all categories. offenders for whom these characteristics do not apply (e.g., corporations). ... No cases of this type occurred in the data. Includes offenders for whom these charaoteristics are unknown .
See Text Table 3.3.
District tables 77

Table 0-4.1 Incarceration rate, by offense, 1988 Percent of convicted offenders sentenced to IncarceratlonB
Total Property Public order offenses offenders b All Drug
District sentenced offenses Violent Fraudulent Other offenses Regulatory Other
All d!strlcts 43,550 53.8% 81.0% 43.6% 40.0% 79.2% 32.6% 37.7%
Alabama, Middle 219 40.6% 66.7% 35.0% 30.4% 83.8% 54.5% 25.3% Alabama, Northern 406 48.0 56.3 40.8 35.1 74.3 66.7 32.1 Alabama, Southem 2t,,7 59.5 100,0 42.::1 30.0 80.4 59.4 Alaska 195 42.6 80.0 61.5 35.0 34.2 31.4 60.5 Arizona 959 65.9 84.6 46.1 39.1 79.1 14.3 70.7
Arkansas, Eastern 170 69.4% 100.0% 61.4% 76.9% 80.8% 37.5% 66.7% Arkansas, Western 99 60.6 100.0 58.1 59.1 75.0 38.9 Califomla, Central 1,064 71.0 82.8 62.4 56,4 93.6 32.7 63.6 Califomla, Eastern 538 66.0 90.9 40.0 38.5 85.8 22.7 74.3 Califomia, Northern 791 47.7 75.8 31.0 30.6 79.1 22.0 34.7
Califomia, Southem 1,514 60.8% 83.9% 48.8% 65.2% 58.2% 37.9% 71.8% Colorado 391 58.3 72.0 61.6 43.8 81.2 46.7 42.3 Connecticut 316 56.3 63.6 25.6 66.7 79.5 26.1 61.5 Delaware 74 56.8 50.0 44.4 21.4 78.6 66.7 66.7 District of Columbia 639 59.6 68.8 38.7 37.1 85.7 30.0 74.5
Florida, Middle 893 70.4% 91.5% 38.2% 43.1% 89.8% 36.8% 66.7% Florida, Northem 284 78.9 81.8 59.5 50.0 91.6 80.0 60.0 Florida, Southern 1,900 75.7 82.9 54.9 29.0 88.9 57.9 72.6 Georgia, Middle 1,882 4.5 100.0 48.1 14.8 91.2 33.3 .9 Georgia, Northem 733 53.8 82.1 33.0 53.9 85.7 25.7 36.8
Georgia, Southern 280 51.4% 80.0% 64.3% 51.7% 88.4% 50.0% 20.2% Guam 6S 16.7 4.8 8.3 43.8 13.3 Hawaii 896 14.1 52.9 55.8 30.8 57.4 2.1 Idaho 136 43.4 75.0 23.1 33.3 76.5 22.2 48.8 Illinois, Central 186 59.1 60.0 44.6 60.0 74.6 57.1 58.3
Illinois, Northem 1,025 50.4% 61H% 37.5% 31.7% 83.7% 41.0% 50.2% Illinois, Southern 179 42.5 87.5 25.9 26.7 83.3 66.7 52.2 Indiana, Northern 253 52.2 60.0 40.2 33.3 70.7 55.6 53.1 Indiana, Southern 354 37.9 75.0 36.8 43.8 68.0 8.7 23.7 Iowa, Northem 85 75.3 100.0 50.0 100.0 92.5 53.8 61.1
Iowa, Southern 75 53.3% "75.0% 51.7% 22.2% 100.0% 50.0% 55.6% Kansas 318 53.5 d5.7 49.4 23.3 78.9 40.0 48.9 Kentucky, Eastern 236 85.6 93.8 72.0 92.3 94.4 66.7 85.7 Kentucky, Western 465 34.6 55.0 53.1 6.6 83.3 47.8 50.0 Louisiana, Eastem 517 52.4 100.0 22.5 51.0 84.6 38.9 31.1
Louisiana, Middle 54 59.3% 43.5% 50.0% 100.0% 50.0% 76.5% Louisiana, Westem 209 38.3 85.7 37.5 11.4 75.6 15.8 33.3 Maine 169 56.8 83.3 38.9 70.0 73.6 50.0 26.1 Maryland 751 52.6 81.8 45.1 35.6 66.2 35.6 42.9 Massachusetts 384 50.0 78.9 30.7 31.4 80.6 29.2 57.9
Michigan, Eastem 796 73.6% 60.0% 70.1% 56.8% 90.9% 44.1% 68.0% Michigan, Westem 181 61.-:: 83.3 35.9 33.3 89.2 30.0 75.0 Minnesota 385 87.3 95.8 74.4 84.0 95.6 33.3 902 Mississippi. North6m 119 71.4 66.7 69.0 83.3 82.4 33.3 69.6 Mississippi, Southern 167 62.9 100.0 50.7 14.3 90.7 14.3 66.7
Missouri. Eastern 317 73.2% 100.0% 50.9% 60.9% 97.9% 18.2"k 82.4% Missouri. Westem 507 48.1 90.0 51.8 52.2 85.4 28.6 15.4 Montana 204 49.0 78.6 27.0 50.0 80.0 8.3 32.4
78 Compendium of Federal Justice Statistics, 1988

Table D-4.1 Continued
Percent of convicted offenders sentenced to Incarcerationa Total Property Public order offenses offenders J! All Drug
District sentence offenses Violent Fraudulent Other offenses Regulatory Other
Nebraska 159 57.20/0 78.6% 51.7% 73.3% 65.9% 44.0% Nevada 396 43.2 96.8 41.1 26.7 52.4 9.7 38.6 New Hampshire 38 52.6 37.5 50.0 75.0 50.0 New Jersey 707 43.8 68.0 36.5 40.3 70.0 26.8 35.0 New Mexico 504 70.6 90.7 30.7 73.3 88.7 37.5 72.5
New York, Eastern 978 61.7% 70.6% 35.7% 33.3% 82.9% 31.5% 45.8% New York, Northern 310 35.5 37.5 27.3 27.8 84.9 32.0 22.7 New York, Southern 1.173 58.7 76.2 33.1 49.1 83.6 17.7 48.7 New York. Western 266 35.0 75.0 29.2 14.0 62.0 18.8 35.8 North Carolina. Eastern 538 29.2 53.8 31.9 32.0 66.2 11.5 18.2
North Carolina. Middle 268 75.00/0 90.3% 54.3% 65.7% 94.3% 50.00/0 70.3% North Carolina, Western 404 48.8 81.4 37.8 31.7 8:!-.8 14.6 47.6 North Dakota 114 78.1 86.4 47.6 61.5 96.2 50.0 89.3 Northern Mariana Islands 6 16.7 ... 50.0 Ohio, Northern 565 52.9 91.9 34.5 51.6 80.~ 11.1 39.3
Ohio, Southern 466 66.7% 84.20/0 47.6% 54.5% 91.3% 38.5% 66.7% Oklahoma, Eastern 65 66.2 100.0 40.9 75.0 100.0 73.3 Oklahoma, Northern 179 60.3 100.0 43.1 40.0 83.9 60.0 63.0 Oklahoma. Western 489 46.4 100.0 47.1 32.5 82.1 46.2 23.7 Oregon 406 76.6 91.0 52.3 44.1 89.2 50.0 74.7
Pennsylvania. E8!lwrn 680 55.4% 60.00/0 37.20/0 45.9% 82.4% 31.1% 54.00/0 Pennsylvania. Middle 252 65.5 58.3 50.6 72.0 84.1 11.8 78.8 Pennsylvania, Western 262 68.7 70.0 50.6 66.7 ~.2 18.2 68.3 Puerto Rico 619 50.7 86.7 15.5 28.9 94.3 17.4 26.6 Rhode Island 83 81.9 100.0 61.1 97.1 50.0 83.3
South Carolina 386 46.6% 62.5% 43.1% 52,9% 72.3% 14.6% 44.8% South Dakota 213 81.2 90.1 70.0 50.0 95.2 37.5 88.9 Tennessee, Eastern 190 65.8 100.0 63.6 17.6 96.1 20.0 78.8 Tennessee. Middle 342 42.7 90.0 49.0 42.6 90.5 26.7 20.0 Tennessee, Western 387 56.1 eo.O 29.4 40.0 88.0 85.7 55,4
Texas, Eastern 154 73.4% 75.00/0 51.00/0 80.00/0 92.20/0 62.5% 80.00/0 Texas. Northern 753 72.8 95.0 57,9 50.0 91.7 52.5 79.4 Texas, Southern 2,099 62.9 65.5 38.7 55.0 69.3 40.5 64.2 Texas. Western 1.175 68.7 93.5 52.5 35.0 87.8 22.7 67.6 Utah 250 44.0 73.7 32.8 4.5 69.4 33.3 32.8
Vermont 87 69.00/0 66.7% 60.0% 95.20/0 71.4% 61.5% Virgin Islands 260 71.2 82.2 48.7 55.2 94.4 50.0 80.5 Virginia, Eastern 1.923 30.4 61.0 56.9 29.5 53.7 32.0 17.6 Virginia, Western 190 46.3 46.2 31.4 46.7 66.7 14.3 48.1 Washington. Eastern 262 63.7 66.7 28.6 22.2 68.4 10.0 74.7
Washington. Western 1,391 26.6% 83.0% 53.0% 15.8% 42.3% 40.9% 12,1% West Virginia. Northern 199 63.8 100.0 28.1 75.0 70.5 25.0 66.7 West Virginia. Southern 314 65.9 50.0 55.1 62.5 74.7 50.0 59.6 Wisconsin, Eastern 199 69.8 94.7 43.8 62.5 95.3 37.5 67.9 Wisconsin, Western 130 86.9 100.0 78.8 100.0 98.2 100.0 67.9 Wyoming 91 42.9 87.5 47.1 9.5 5G.tI 52.4
Note: Offenses are classified by most serious offense of bDala describe offenders convicted and sentenced in cases conviction • terminated in 1988. ... No cases of this type occurred in the data. See Text Table 4.1. alncludes regular, split or mixed, life. Indeterminate, and youth sentences.
District tables 79

Table 0-4.2 Incarceration rate, by offender characteristics, 1988
Percent of convicted offenders sentenced to Incarcerationa
Total Ethnlcity
offenders b Sex Race Non- Age
District sentenced Male Female Wh~e Black Other Hispanic Hispanic 16-18 19-20 21-30 31-40 Over 40
All districts 43,550 06.6% 39.6% 64.0% 61.6% 59.4% 78.4% 60.2% 55.00k 56.7% 64.6% 66.1% 53.8%
Alabama, Middle 219 51.1% 24.6% 40.0".4 47.90/0 33.3% 43.5% 45.5% 43.4% 42.6% 44.00k Alabama, Northom 406 66.3 29.2 60.7 54.3 58.6 100.0 38.4 57.8 63.7 55.6 Alabama, Southern 247 67.9 34.4 63.8 47.9 100.0 57.8 75.0 25.0 58.7 59.2 61.0 Alaska 195 46.6 30.0 41.9 43.8 50.0 71.4 41.6 33.3 20.0 39.7 51.9 41.5 Arizona 959 74.2 32.5 68.8 42.9 74.3 78.2 59.9 89.5 74.5 71.1 66.7 58.0
Arkansas, Eastern 170 73.4% 60.0".4 73.90/0 67.4% 66.7% 71.6% 61.90/0 73.8% 79.6% Arkansas, Westom 99 71.8 44.4 69.1 57.1 78.6 64.0 50.0 66.7 64.7 59.3 n.3 Callomla. Cenlral 1,064 74.1 57.2 71.5 72.3 66.0 82.0 87.5 88.9 65.5 75.8 75.6 61.5 Cal~omla. Eastern 538 79.8 34.5 74.9 66.7 60.0 87.2 71.8 66.7 75.0 n.3 71.9 68.5 CalWomla, Northern 791 60.8 17.5 55.3 46.7 32.2 73.9 50.2 14.3 23.6 43.8 61.9 51.0
CaiWomla. Southern 1,514 72.5% 46.4% 69.4% 64.6% 44.4% 79.5% 61.4% 52.2% 73.7% 70.5% 65.9% 68.5% Colorado 391 65.9 48.8 62.8 70.2 40.0 78.0 61.4 66.7 38.4 58.5 69.4 62.7 Connecticut 316 61.0 33.3 57.7 56.3 87.5 53.1 100.0 50.0 61.0 60.2 48.3 Dolaware 74 81.8 25.0 73.5 63.6 100.0 66.0 50.0 78.9 76.5 District of Columbia 639 88.3 32.1 42.1 61.5 50.0 59.1 57.1 80.0 74.3 61.3 51.9 48.2
Florida, Middle 693 n.8% 49.6% 67.4% 64.1% 80.0% 64.6% 72.8% 80.0% 85.2% 80.9% n.OOk 55.8% Rorida, Northern 284 86.4 70.0 78.5 00.2 100.0 100.0 64.2 80.0 75.0 81.5 90.6 78.1 Aorida, Southern 1,900 60.2 59.3 n.2 75.0 n.8 85.8 70.3 100.0 76.7 72.5 80.2 75.6 Georgia, Middle 1,682 30.5 14.9 29.9 26.0 28.4 3.7 25.5 38.8 38.7 Georgia, Northern 733 67.2 39.5 63.8 61.1 75.0 61.4 50.0 50.0 61.7 63.7 57.6
Georgia, Southern 260 64.3% 67.6% n.8% 64.6% 100.0% 79.7% 75.0% 81.8% 85.1% 72.7% Guam 66 27.3 19.6 18.4 30.0 11.1 12.5 Hawaii 896 16.6 6.2 60.8 68.4 63.2 90.0 61.0 100.0 60.0 56.9 61.0 5.3 Idaho 136 49.0 26.1 42.1 100.0 50.0 81.3 39.0 66.7 69.7 37.5 27.6 illinois, Cenlral 186 69.5 48.2 65.7 58.1 50.0 100.0 63.9 50.0 75.0 70.4 55.2 70.0
illinois, Northern 1,025 55.8% 29.8% 5&.8% 41.7% 50.0% 83.5% 47.7% 10().0% 18.2% 51.5% 50.7% 50.7% Illinois, Southern 179 61.7 9.5 47.2 38.7 66.7 41.9 50.0 41.3 38.8 53.1 Indiana. Northern 253 57.0 18.9 54.5 42.2 33.3 63.6 50.0 le,O.O 100.0 45.0 51.2 52.6 Indiana, Southern 354 47.7 19.2 44.9 43.9 100.0 43.3 ~J3.3 48.0 54.4 34.1 Iowa, Northern 85 83.1 87.5 84.1 75.0 100.0 83.1 66.7 100.0 83.9 71.4
Iowa, Southom 75 57.9% 41.7% 58.9% 38.5% 61.3% 100.00k 31.8% 60.0% 72.7% Kansas 318 68.6 37.0 62.9 65.7 87.5 62.1 50.0 65.6 60.7 61.5 Kontucky, Eastem 236 88.4 80.0 86.5 9~.4 100.0 85.9 100.0 100.0 92.5 81.6 82.8 Kentucky, Western 465 39.9 23.0 41.2 24.6 20.0 37.1 10.0 8.2 28.3 63.6 51.1 Louisiana, Eastem 517 60.2 27.9 55.5 52.6 33.3 66.7 53.2 25.0 30.0 57.6 55.6 48.5
Louisiana, Middle 54 71.4% 33.3% 70.0% 55.6% 50.0% 62.2",(, 61.5% 53.3% 72.2% Louisiana, Westem 209 38.9 18.8 37.8 28.8 25.0 35.2 33.3 39.0 35.6 34.2' Maino 169 72.1 52.9 69.3 100.0 100.0 69.0 100.0 100.0 76.7 72.0 53.1 Maryland 751 61.9 38.1 58.1 58.8 57.1 61.1 58.3 33.3 52.4 56.8 63.0 54.2 Massachusetts 384 56.3 20.8 50.3 80.0 50.0 71.4 52.7 50.0 56.2 51.5 51.5
Michigan, Eastem 796 80.1% 55.7% 75.3% 74.9% 33.3 83.3% 74.8% 100.0% 83.3% n.OOk 72.6% 73.4% Michigan, Western 181 71.2 38.6 66.2 51.9 25.0 100.0 62.6 20.0 62.2 76.4 49.0 Minnosota 385 89.7 80.0 86.9 92.8 90.9 96.8 87.3 100.0 100.0 86.4 93.8 75.3 Mississippi, Northem 119 79.2 25.0 n.2 57.6 72.1 64.7 67.6 n.2 Mississippi, Southern 167 72.6 24.0 73.9 47.2 85.7 100.0 64.6 100.(' 73.8 64.0 56.6
Missouri, Eastern 317 79.8% 47.9% 81.4% 66.7% 100.00k 100.0% 73.4% 92.0% 74.2"k 56.0".4 Missouri, Wastem 507 74.7 48.4 63.1 79.9 100.0 69.4 100.0 90.0 73.2 68.1 63.2 Montana 204
80 Compendium of Federal Justice Statistics, 1988

Table 0-4.2 ContInued
Percent of convicted otrendars sentenced to Incarcerations
Total Ethnlclty
offenders b Sex Race Non- Age
District sentenced Male Female Wh~e Black Other Hispanic Hispanic 16-18 19-20 21-30 31-40 Over 40
Nebraska 159 59.4% 23.5% 50.8% 70.8% 100.0% 100.0% 53.6% 100.0% 100.0% 53.5% 64.0% 44.7% Nevada 396 49.3 28.8 44.0 63.9% 37.5 64.7 45.0 40.0 48.2 51.5 41.1 New Hampshire 38 55.2 53.6 SO.O 55.2 66.7 80.0 50.0 42.9 New Jersey 707 50.2 20.3 43.7 53.6 20.0 68.9 43.7 42.9 48.8 48.5 41.0 New Moxico 504 73.8 52.8 69.6 100.0 78.4 71.1 71.4 71.4 76.5 n.8 78.5 41.8
New York, Eastem 978 66.5% 50.0% 63.4% 71.A% 81.0% n.1% 65.2% 33.3% 70.8% 73.2"k 68.2% 53.6% New Yori<, Northem 310 55.9 26.3 51.3 69.2 50.0 64.6 50.0 50.0 66.0 64.4 35.7 New York, Southem 1,173 65.6 48.0 61.5 61.8 50.0 75.2 56.8 66.7 75.9 68.0 65.9 54.7 New York, Wastem 266 44.5 11.4 34.3 51.0 50.0 37.8 33.3 41.3 42.0 30.9 North Carolina, Eastem 538 51.9 30.8 53.0 39.5 30.0 83.3 48.9 40.0 44.4 49.5 48.8 43.3
North Carolina, Middle 268 81.7% 49.0% 78.5% 70.1% 85.7% 100.0% 75.2% 75.0% 40.0% 72.6% 82.3% 76.0% North Carolina, Wastem 404 53.3 32.3 4",.5 56.4 52.0 n.8 48.8 40.0 47.4 66.4 38.7 North Dakota 114 67.2 43.8 79.7 86.1 80.4 100.0 100.0 81.6 n.4 64.7 NMhem Mariana Island 6 0/110, Northem 565 42.6 17.5 33.2 46.6 33.3 60.0 36.1 100.0 44.4 45.5 42.4 25.2
Ohio, Southem 466 75.2% 48.7% 70.0% 70.4% 50.0% 100.0% 69.8% 62.5% 80.0% 73.9% 75.4% 60.4% Oklahoma, Eastem 65 71.7 33.3 68.5 33.3 100.0 66.1 SO.O 50.0 81.0 57.9 62.5 Ok~:Ihoma, Northem 179 65.6 33.3 56.9 64.3 50.0 59.0 SO.O 66.7 58.7 54.2 62.5 Ok1aooma, Westem 489 69.7 49.4 64.0 70.8 57.9 53.8 65.3 57.1 60.0 67.7 67.3 58.7 OrE1",Ci1 406 82.4 64.4 80.8 73.3 61.1 97.1 n.7 100.0 20.0 61.8 83.1 7o,g
Pe.rnwylvanla, Eastem 680 63.1% 16.0% 62.1% 46.1% 40.0% 20,\)% 57.5% 100.0% 71.4% 51.0% 56.6% 58.5% Pennsylvania, Middle 252 71.8 47.4 67.2 80.8 33.3 100.0 67.5 83.6 63.6 69.5 67.0 Ponnsylvania, Westem 262 74.7 43.8 70.8 68.9 100.0 70.2 100.0 78.3 71.8 58.4 Poorto Rico 619 60.6 40.0 68.'.\ 60.4 68.4 61.5 28.6 45.0 54.2 64.5 50.0 Rhode Island 83 83.9 70.0 85.2 63.6 100.0 75.0 100.0 82.6 78.9 80.0
South Carolt.t.l 386 58.2% 19.70/0 49.7% 50.3% 50.0% 50.3% 75.0% 30.0% 40.2"10 59.3% 48.3% South Daliota 213 89.9 50.0 84.3 68.7 87.0 100.0 85.2 100.0 100.0 87.5 80.6 80.8 Tennessea, Eastam 190 SO.4 74.3 63.7 55.6 63.3 100.0 100.0 61.5 60.3 65.4 TaMassee, Middla 342 48.0 28.6 39.7 56.2 66.7 44.1 33.3 16.0 28.9 51.9 65.1 Tennessee, Wastem 387 70.2 26.2 59.9 56.1 20.0 66.7 57.0 100.0 37.5 52.7 56.0 62.0
Texas, Eastern 154 82.7% 51.4% 73.8% 79.3% 100.0% 72.8% 33.3% 73.2"10 80.0% 71.1% Texas, Northem 753 75.0 57.6 71.9 73.2 85.7 86.6 69.5 100.0 74.1 72.9 73.9 66.3 Texas, Southem 2,099 74.0 44.1 71.4 54.9 40.0 76.5 54.5 56.3 83.4 73.3 73.3 61.9 Toxas, Westem 1,175 7S.7 51.8 713.0 57.5 4S.2 82.9 61.2 70.0 81.1 71.8 76.8 64.S Utah 250 53.3 29.6 48.2 66.7 54.5 68.8 48.6 50.0 SO.7 54.7 45.8
Vermont 87 74.1% 50.0% 70.0% 66.7% 75.0% 100.0% 69.S% 80.0% 52.4% 75.0% Virgin Islands 2S0 70.7 60.0 68.0 S9.8 100.0 79.4 67.7 87.5 60.0 71.2 71.4 64.3 Virginia, Eastem 1,923 55.9 38.1 50.5 57.4 33.3 44.1 53.5 SO.O 45.7 47.8 63.4 50.9 Virginia, Westem 190 54.8 23.1 50.0 41.7 100.0 49.7 100.0 50.0 53,7 44.6 49.0 Washington, Eastem 262 67.0 38.1 64.2 66.7 57.1 83.3 SO.O 60.0 66.7 70.6 66.7 42.9
Washington, Wastem 1,391 67.4% 40.3% 61.7% 75.0% 72.7% SO.4% 65.6% 66.7% 50.0% 62.1% 72.2"10 52.S% Wast Virginia, Northem 199 67.4 42.9 55.4 84.0 100.0 63.7 100.0 72.3 57.6 51.6 Wast Virginia, Southem 314 70.0 40.5 64.0 74.4 65.S 33.3 73.3 75.9 59.8 60,3 Wisconsin, Eastern 199 76.9 47.8 73.5 SO.5 25.0 85.7 S9.2 33.3 70.0 75.0 67.7 68.5 Wisconsin, Wastern 130 89.4 75.0 85.1 100.0 100.0 100.0 86.2 50.0 93.6 68.4 75.0 Wyoming 91 56.5 16.7 50.0 100.0 66.7 51.0 43.8 57.1 61.5
... No cases of this type occurred in the data. bOata describe offenders convicted and sentenced in cases terminated
B'ncludes regular, split or mixed, life, Indeterminate, and youth sentences. in 1988.
See Text Table 4.4.
District tables 81

Tablo 0-4.2 contlnuod. Incarceration ratD, by offondor charactorlstlcs, 198B Percent of convicted offenders sentenced to Incarceratlo~a
Total Employment at arrest Prior adult convictions Drug abuse
offenders cf Known drJg No known District sentence Employed Unemployed None Misdemeanor Felony history abuse
All dletrlcta 43,550 57.4% 68.6% 50.2"10 63.70/0 81.6% 74.0% 57.6%
Nabama, Middle 219 38.8% 45.8% 18.6% 77.8% 80.0% 91.7% 37.5% Nabama, Northern 406 51.1 60.5 36.6 45,7 80.5 72.9 44.5 Nabama, Southern 247 45.7 61.1 10.0 40.0 73.3 61.5 47.6 Naska 195 37.5 50.0 31.6 70.0 100.0 29.4 48.6 Arizona 959 54.4 74.0 60.1 63.6 75.4 78.9 62.1
Arkansas, Eastern 170 64.7% 65.2"10 58.7% 54.5% 73.3% 75.0% 62.7% Arkansas, Western 99 33.3 60.0 44.4 50.0 83.3 25.0 50.0 California, Central 1,064 51.8 64.7 45.5 63.8 82.8 77.8 51.0 California, Eastern 538 82.4 84.3 81.6 88.0 92.1 89.7 83.1 California. Northern 791 75.5 76.6 70.6 87.5 91.2 83.9 74.6
California. Southern 1,514 ... 50.0% 33.3% 40.0% 50.0% 33.3% Colorado 391 52.5 66.7 49.1 72.7 52.6 75.9 52.1 Connecticut 316 70.0 62.5 50.0 100.0 80.0 85.7 54.5 Delaware 74 52.9 50.0 50.0 50.0 66.7 50.0 56.3 District of Columbia 639 100.0 100.0 100.0
Florida, Middle 893 69.5% 67.0% 44.3% 64.3% 88.SO.4 81.2% 65.0% Florida, Northern 284 70.5 93.8 73.0 80.0 94.7 90.9 79.7 Florida, Southern 1,900 73.8 76.0 64.6 88.9 88,3 78.4 74,0 Georgia, Middle 1.882 50.0 80.0 53.3 62.5 83,3 80,0 40,0 Georgia, Northern 733 63.9 74.4 48.0 67.5 79.7 85,7 63.0
Georgia. Southern 280 79.4% 62.5% 67.90/0 76.9% 83.3% 71.4% 73.3% Guam 66 14,3 9.1 ... 8.3 Hawaii 896 92,3 71.4 75.0 71.4 100.0 80.0 84.2 Idaho 136 31.8 50.0 26.8 38.9 73.7 77.3 26.3 Illinois, Central 18S 100.0 100.0 100.0 100.0 100.0 100.0
Illinois, Northern 1,025 64.1% 66.0% 56.2".4 67.3% 73.6% 59.3% 64.6% Illinois, Southern 179 35.6 51.4 21.9 42.9 95.5 77.8 35.3 Indiana, Northern 253 37.5 62.5 29.5 33.3 87.1 46.2 45.(3 Indiana, Southern 354 38.7 47.4 35.6 66.7 66.7 53.3 29.3 Iowa, Northern 85 84.6 93.3 80.8 100.0 100.0 100.0 80.8
Iowa. Southern 75 41.7% 46.7% 45.5% 44.4% 75.0% 45.5% 40.0% Kansas 318 62.1 74.1 58.1 85.0 80.6 74.2 64.1 Kentucky, Eastern 236 72.9 91.5 68.8 92.3 94.1 92.9 80.0 Kentucky, Western 465 56.7 76.6 34.8 85.7 81.0 94.7 58.5 Louisiana, Eastern 517 28.8 38.7 30.2 35.9 65.8 71.9 32.7
louisiana, Middle 54 61.9% 53.8% 40.0% 78.6% 85.7% 53.6% louisiana. Western 209 26.8 58.3 27.7 54.5 63.6 37.5 37.0 Maine 169 69.7 78.6 87.5 62.5 68.4 76.5 67.9 Maryland 751 58.1 63.0 46.2 60.8 85.9 69.2 55.2 Massachusetts 384 54.6 66.1 56.1 40.0 63.8 45.2 61.1
Michigan, Eastern 796 67.6% 76.2".4 59.1% 74.SO.4 83.4% 77.1% 69.8% Michigan, Western 181 54.4 63.4 50.0 64.7 65.4 81.8 53.7 Minnesota 385 87.4 86.4 82.5 100.0 94.4 88.4 83.9 Mississippi, Northern 119 65.7 66.7 55.6 66.7 100.0 100.0 64.4 Mississippi. Southern 167 53.4 69.7 55.7 72.7 87.5 100.0 55.4
Missouri, Eastern 317 57.7% 71.4% 50.0% 66.7% 86.7% 78.9% 55.6% Missouri, Western 507 56.2 76.8 48.1 73.8 84.3 68.1 58.3 Montana 204
82 Compendium of Federal Justice Statistics. 1988

Tt.lb/e 0-4.2 Continued Percent of convicted offenders sentenced to incarcerationS
Total Employment at arrest Prior adult convictions Drug abuse
offenders b Known drug No known District sentence~ Employed Unemployed None Misdemeanor Felony history abuse
Nebraska 159 51.0% 44.()<'1o 30.8% 33.3% 76.5% 50.0% 48.3% Nevada 396 41.7 59.7 34.2 38.2 64.8 63.6 44.9 New Hampshire 38 50.0 66.7 25.0 50.0 71.4 100.0 40.0 New Jersey 707 31.9 46.9 33.8 27.8 54.3 35.7 36.6 New Mexico 504 65.1 74.5 66.7 75.0 85.2 80.0 139.5
New York, Eastern 978 42.1% 62.5% 30.8% 50.0% 80.()<'1o 50.()<'/o 48.()<'/o New York, Northem 310 ... 50.0 ... 50.0 New York, Soulhern 1,173 59.1 70.0 36.4 60.0 70.6 83.3 60.0 New York, Western 266 39.3 53.3 30.0 35.7 85.7 61.1 41.5 North Carolina, Eastern 538 47.9 51.4 34.5 51.9 73.9 68.4 43.2
North Carolina, Middle 268 65.8% 74.5% 58.0% 61.5% 88.9% 813.0% 56.8% North Carolina, Western 404 38.3 58.S 43.8 47.2 75.8 63.S 37.4 North Dakota 114 65.2 76.3 66.7 57.1 94.4 88.9 71.7 Northern Mariana Island 6 ... Ohio, Northern 565 35.7 58.1 23.8 43.8 65.9 66.7 39.4
Ohio, Southern 466 54.7% 72.9% 46.6% 53.3% 80.SOIo 77.1% 53.8% Oklahoma, Eastem 65 150.0 64.7 46.9 50.0 81.8 58.3 48.1 Oklahoma, Northern 179 43.9 63.6 40.9 20.0 80.0 58.6 50.0 Oklahoma, Western 489 78.5 78.9 74.5 80.0 77.1 90.3 70,1 Oregon 406 83.1 87.8 73.6 100.0 92.2 87.3 80,3
P;;'lnsylvania, Eastern 680 51.8% 58.()<,/~ 40.()<'1o 48.4% 81.4% 67.3% 52.2% Pennsylvania, Mic:fdle 252 59.6 66.7 46.3 66.7 93.8 66.7 61.5 Pennsylvania, Western 262 64.9 68.9 61.8 75.0 67.9 92.3 63.3 Puerto Rico 619 53.3 49.6 50.5 76.2 76.3 81.4 42.9 Rhode Island 83 100.0 100.0 100.0 100.0 100.0
South Carolina 386 57.9% 72.7% 16.7% 33.3% 83.3% 75.()<'1o 59.1% South Dakota 213 89.2 88.2 82.1 89.2 95.0 94.1 83.0 Tennessee, Eastern 190 38.9 78.9 24.4 71.4 100.0 100.0 36.5 Tennessee, Middle M2 81.3 100.0 72.7 100.0 100.0 100.0 75.0 TennesseG, Western ~187 100.0 83.3 100.0 100.0 75.0 75.0 100.0
Texas, Eastern 154 65.2% 88.0% 64.3% 55.6% 95.0% 87.5% 70.0% Texas, Northern 753 65.7 76.3 5S.6 71.4 33.3 7.?.4 67.7 Texas, SouthBrn 2,099 64.5 68.3 58.1 71.8 82.2 68.6 65.2 Texas, Western 1,175 59.5 73,6 53.8 58.7 88.1 76.5 58.4 Utah 2:50 21.6 63.9 27.9 50.0 55.6 55.6 38.3
Vermont 137 45.()<'1o 77.8% 31.3% 33.3% 100.0% 100.0% 45.8% Virgin Islane.:, 2(>0 66.7 71.4 61,9 100.0 100.0 62.5 68.0 Virginia, Eastern 1,923 ... 25.0 33.3 10.0 Virginia, Wes:ern 1$10 52.0 59.1 43.8 65.7 58.8 61.1 46.4 Washington, Eastern 2Ei2 100.0 66.7 50.0 100.0 100.0 66.7
Washington, Western 1,39'1 36.8% 35.3% 14.3% 40.()<'1o 62.5% 40.0% 37.5% West Virginia, North(lrn 199 65.0 100.0 73.9 75.0 80.0 100,0 50.0 West Virginia, Soulhern 314 53.2 67.4 51.9 54.5 87.5 75.7 43.4 Wisconsin, Eastern 199 53.5 83.8 46.5 70.0 96.0 80.0 60.2 Wisconsin, Western 130 37.5 60.0 20.0 50.0 100.0 50.0 45.5 Wyoming 91 80.0 40.0 50.0 100.0 85.7
... No cases of this type occurred in the data. bData describe offenders convicted and sentenced in alncludes regular, split or mixed, life, indeterminate, and youth cases terminated in 1988.Total includes offenders for sentences. whom these characteristics are unknown.
Sae TextTable 4.4.
District tables 83

Table 0-4.3 Average Incarceration :sentence length Imposed, by offense, 1988
Average sentence in months for offenders convicted 01:8
Total Property Public order offenses sentenced tO
b All Violent Drug
District Incarceration offenses offenses Fraudulent Other offenses Regulatory Other
All dlst.rlcts 23,450 !)5.1 mos. 110.7 mos. 31.0 mos. 32.7 mos. 71.3 mos. 30.4 mos. 30.7 mos.
Alabama, Mlddl'3 89 30.3 mos. 131.3 mos. 20.9 mos. 25.9 mos. 38.6 mos. 8.0 mos. 13.4 mos. Alabama, Northern 195 ·46.5 102.3 30.0 31.8 54.0 49.0 41.8 Alabama, Southern 147 57.2 95.5 29.6 25.v 72.8 50.4 Alaska 1$3 19.3 57.5 11.3 4.6 27.3 5.3 17.3 Arizona 632 36.1 89.1 12.6 22.1 43.2 17.0 16.0
Arkansas, Eastern 118 46.0 mos. 151.2 mos. 24.6 mos. 30.7 mos. 54.8 mos. 27.0 rnos. 51.6 mos. Arkansas,.Western 60 39.0 61.0 19.1 18.7 68.3 43.1 Califomia, Central 755 63.S 112.5 24.6 32.0 101.8 37.9 11).3 California, Eastern 355 55.9 105.3 24.9 30.0 84.7 42.8 17.4 California, Northern 377 66.0 133.3 26.9 15.8 82.0 54.2 35.5
California, Southern 920 33.8 mos. 93.2 mos. 29.9 mos. 24.1 mos. 44.5 mos. 18.5 mos. 17.7 mos. Colorado 228 40.6 91.1 36.1 32.6 44.4 22.8 28.9 Connecticut 178 38.7 72.9 21.1 '\8.0 48.2 13.3 26.3 Delaware 42 66.2 46.0 29.0 22.0 100.0 20.0 32.8 District of Columbia 381 59.0 100.7 19.4 19.8 88.0 5.0 25.4
Florida, Middle 629 76.6 mos. 148.2 mos. 44.9 mos. 36.4 mos. 84.0 mos. 13.2 mos. 33.5 mos. Florida, Northern 224 96.6 136.5 54.9 11.0 116.3 68.3 32.9 Florida, Southern 1,439 82.5 151.3 45.6 64.9 96.2 33.7 54.0 Georgia, Middle 84 72.0 142.1 60.5 26.2 104.5 40.5 20.6 Georgia, Northern 394 78.0 177.0 46.9 55.9 81.1 38.0 50.2
Georgia, Southern 144 62.3 mos. 129.8 mos. 35.9 mos. 32.6 mos. 91.7 mos. 10.0 mos. 23.6 mos. Guam 11 72.5 60.0 36.0 79.7 72.0 Hawaii 126 60.2 104.9 30.4 35.6 78.4 33.6 Idaho 59 52.4 126.0 45.6 24.7 74.7 4.0 20.9 illinois, Central 110 54.5 78.0 24.8 32.5 70.1 46.0 65.2
Illinois, Northern 517 49.5 mos. 44.3 mos. 23.7 mos. 38.6 mos. 71.8 mos. 50.4 mos. 50.3mos. Illinois, Southem 76 58.0 124.4 34.0 44.9 79.7 2.0 41.6 Indiana, Northern 132 86.9 34.0 132.3 34.0 72.1 88.8 50.3 Indiana, Southern 134 39,1 93.3 23.2 12.6 50.6 15.0 22.6 Iowa, Ncrlhern 54 53.4 18.5 14.0 79.0 59.7 80.1 34.5
Iowa, Southern 40 39.9 mos. 200.0 mos. 16.7 mos. 4.0 mos. 52.5 mos. 4.0 mos. 34.9 mos. Kansas 170 39.7 64.1 33.2 18.0 62.4 13.6 24.8 Kentucky, Eastern 202 73.4 196.3 28.0 55.2 74.7 172.7 50.1 Kentucky, Western 161 38.7 79.8 21.6 26.7 48.5 16.0 17.6 louisiana, Eastern 271 46.3 77.3 19.9 27.7 63.1 5.9 18.3
Louisiana, Middle 32 36.7 mos. 47.2 mos. 16.5 mos. 57.8 mos. 12.0 mos. 30.2 mos. Louisiana, Western 80 54.1 42.5 19.3 23.2 100.5 44.0 21.6 Maine 96 53.8 235.8 3.7 17.1 55.0 12.0 25.0 Maryland 395 53.9 109.6 30.7 41.7 61.2 11.2 43.8 Massachusetts 192 40.1 60.9 17.7 14.7 57.3 45.3 36.9
Michigan, Eastern 586 38.0 mos. 70.6 mos. 23.3 mos. 28.3 mos. 52.7 mos. 30.5 mos. 31.4 mos. Michigan, Western 111 54.4 91.8 33.8 84.8 61.6 41.0 42.8 Minnesota 336 48.3 148.4 16.8 20.5 55.4 12.0 31.3 Mississippi, Northern 85 40.9 90.0 39.6 52.6 42.2 6.0 25.5 Mississippi, Southern 105 43.6 146.0 20.4 12.0 60.3 33.0 26.0
Missouri, Eastern 232 65.9 mos. 92.9 mos. 28.7 mos. 25.6 mos. 93.5 mos. 48.0 mos. 61.8 mos. Missour!, Western 244 90.0 133.7 36.1 39.8 126.4 2.0 45.8 Montana 100 46.9 44.0 21.7 24.5 62.8 38.5 47.2
84 Compendium o/FederalJu.stice Statislics, 1988

Table 0-4.3 Continued Average sentence In months lor offenders convicted 01:8
Total Propgrty Public order offenses sentenced tO
b All Violent Doug
District incarceration offenses offenses Fraudulent Other offenses Regulatory Other
Nebraska 91 45.5 mos. 83.3 mos. 40.9 mos. 34.7 mos. 46.9 mos. 28.1 mos. Nevada 171 43.0 76.3 24.1 36.0 58.7 25.0 37.3 New Hampshire 20 50.1 32.0 12.0 65.7 43.4 New Jersey 310 47.1 92.4 28.4 34.6 75.1 6.5 30.6 New Mexico 356 42.8 60.5 20.1 31.1 67.7 17.3 12.4
New York, Eastern 603 57.7 mos. 67.6 mos. 25.1 mos. 25.8 mos. 69.5 mos. 20.2 mos. 33.1 mos. New York, Northem 110 28.8 40.3 14.6 78.0 41.8 7.3 14.8 New York, Southern 689 71.4 96.2 3!i.5 82.1 78.6 32.8 72.9 New York, Western 93 36.5 71.7 2~.4 36.0 51.0 31.0 20.4 North Carolina, Eastern 157 69.0 276.5 35.5 24.8 94.9 31.0 20.3
North Carolina, Middle 201 66.1 mos. 157.2 mos. 30.1 mos. 43.0 mos. 71.7 mos, 8.0 mos. 31.9 mos, North Carolina, Western 197 57.5 90.1 42.9 59.1 73.5 27.0 22.5 North Dakota 89 28.3 54.9 4.8 12.1 44.7 9.0 9.0 Northern Mariana Islands 1 12.0 ... 12.0 Ohio, Northe;-. 299 51.6 104.1 31.5 30.4 59.2 41.3 37.6
Ohio, Southern 311 49.6 mos. 56.1 mos. 25.6 mos. 32.7 mos. 70.2 mos. 7.8 mos. 41.5 mos. Oklahoma, Sastem 43 129.9 247.0 28.9 43.3 249.3 98.4 Oklahoma, Northem 108 51.6 100.3 35.2 24.2 52.2 52.0 17.9 Oklahoma, Western 227 54.0 148.8 19.6 29.4 74.0 16.5 36.6 Oregon 311 77.5 130.8 53.1 31.9 71.0 8.0 56.0
Pennsylvania, Eastern 377 52.2 mos. 26.0 mos. 40.4 mos. 36.2 mos. 67.6 mos. 32.2 mos. 36.7 mos. Pennsyhrania, Middle 165 31.2 58.3 22.5 34.3 35.2 18.0 29.0 PennsylVania, Western 180 73.3 119.6 25.4 17.6 110.5 2.0 40.8 Puerto Rico 314 94.4 107.0 58.2 58.3 105.4 12.0 59.7 Rhode Island 68 51.1 14.0 15.6 86.6 7.5 20.0
South Carolina 180 50.7 mos. 205.7 mos. 24.1 mos. 44.6 mos. 91.7 mos. 1.4.0 mos. 23.9 mos. South Dakota 173 53.4 74.3 12.7 13.2 62.2 34.0 20.3 Tennessee, Eastern 125 38.8 107.0 19.9 15.8 53.2 4.5 26.7 Tennessee, MiQdle 146 31.7 58.4 22.6 33.3 48.3 12.8 16.0 Tennessee, Western 217 40.4 204.0 25.6 17.3 44.4 78.2 37.0
Texa!;, Eastem 113 73.1 mos. 269.3 mos. 35.4 mos. 37.5 mos. 105.8 mos. 59.2 mos. 39.8 mos. Texas, Northern 548 62.2 112.3 65.9 49.1 83.6 52.5 37.6 Texas, Southern 1,320 36.5 62.8 24.6 26.3 47.8 23.8 17.4 Texas, Western 807 49.4 116.1 28.4 28.7 66.4 24.0 29.4 Utah 110 53.1 117.9 26.0 6.0 50.2 55.4 51.6
Vermont 60 53.7 mos. 237.5 mos. 25.0 mos. ... 44.1 mos. 102.4 mos. 47.0 mos . Virgin Islands 185 56.2 124.5 5.3 37.7 33.3 8.0 10.6 Virginia,Eastern 584 37.0 82.6 21.0 12.6 61.9 11.1 17.1 Virginia, Western 88 58.1 147.4 76.0 10.7 70.8 15.0 32.4 Washington, Eastern 167 34.4 105.6 8.2 54.0 51.8 2.0 13.2
Washington, Western 370 66.3 mos. 161.1 mos. 22.0 mos. 34.4 mos. 90.7 mos. 23.2 mos. 21.6 mos. West Virginia, Northern 127 63.4 91.3 35.3 45.7 64.2 120.0 65.3 West Virginia, Southern 207 33.2 120.0 27.8 19.0 37.4 22.0 35.9 Wisconsin, Eastern 139 69.8 172.8 21.1 30.4 88.8 31.3 20.4 Wisconsin, Western 113 50.7 300.0 19.8 38.1 74.4 41.0 20.8 Wyoming 39 41.9 27.9 36.8 19.0 71.~ 29.5
... No cases of this type occurred in the data. bData describes offenders convicted and sentenced to aExc1udes lile sentences and indeterminate sentences for youthful or incarceration in cases terminated in 19S8.
drug offenders. See Text Table 4.2
District tables 85

Table D-4.4 Probation rate, by offense, 1988
Percent of convicted offenders sentenced to probationa Total Property Public order offenses offenders All Drug
District sentencedb offenses Violent Fraudulent Other offenses Regulatory Other
All districts 43,550 49.9% ~I1.4% 73.5% 65.2% 35.2% 65.2% 43.6%
Alabama, Middle 219 56.2% 33.3% 80.0% 65.2% 18.9% 36.4% 60.8% Alabama, Northern 406 62.1 37.5 78.6 77.2 47.6 38.9 60.7 Alabama, Southern 247 62.3 80.4 80.0 43.1 100.0 62.5 Alaska 195 76.9 40.0 84.6 95.0 79.7 68.6 72.1 Arizona 959 41.5 28.6 49.6 82.6 31.2 76.2 43.1
Arkansas, Eastern 170 53.5% 77.3% 65.4% 28.8% 75.0% 48.1% Arkansas, Western 99 54.5 14.3 74.2 54.5 25.0 100.0 66.7 Califomia, Central 1,064 60.7 319.2 83.4 73.3 33.6 69.2 69.9 Califomia, Eas~rn 538 53.0 37.9 78.3 78.8 34.3 81.8 42.4 California, Northern 791 75.0 5~1.2 82.4 83.7 70.6 80.5 7::S.4
Califomia, Southem 1,514 51.2% 39.3% 72.2"k 40.9% 56.3% 72.0% 33.5% Colorado 391 49.6 32.0 57.5 56.3 35.6 53.3 56.9 Connecticut 316 67.4 63.6 93.0 77.8 46.7 73.9 69.2 Delaware 74 45.9 50.0 66.7 42.9 32.1 66.7 44.4 District of Columbia 639 46.6 37.5 68.1 69.8 19.3 60.0 36.4
Florida, Middle 893 39.5% 15.:3% 72.6% 68.6% 19.6% 63.2"/0 48.9% Florida, Northem 284 23.6 22.i' 48.6 65.0 11.0 20.0 30.0 Florida, Southern 1,900 36.2 20.0 65.7 80.6 19.5 45.6 43.2 Georgia, Middle 1,882 24.5 33.3 81.5 60.7 14.7 61.1 22.1 Georgia, Northem 733 54.4 35.7 81.0 59.6 30.1 77.1 44.9
Georgia, Southern 280 48.2% 20.0% 75.0% 41.4% 23.2% 50.0% 54.4% Guam 66 77.3 90.5 91.7 62.5 100.0 60.0 Hawaii 896 13.4 58.8 61.5 41.0 30.6 33.3 4.1 Idaho 136 72.1 33.3 89.7 77.8 52.9 66.7 73.2 Illinois, Central 186 66.7 40.0 89.2 80.0 58.7 71.4 38.9
Illinois, Northem 1,025 81.8% 61.1% 91.4% 93.7% 59.7% 92.3% 80.1% Illinois, Southern 179 64.2 50.0 80.0 70.0 26.7 66.1 52.2 Indiana, Northern 253 5-8.1 100.0 67.3 83.3 42.7 55.6 46.9 Indiana, Southern 354 53.4 37.5 77.9 81.3 48.0 78.3 40.4 Iowa, Northem 85 64.7 90.0 50.0 67.5 61.5 55.6
Iowa, Southern 75 64.00/0 25.0% 72.4% luO.O% ... 50.00/0 ~9.3% Kansas 318 51.6 47.6 60.5 70.0 26.3 77.1 44.7 Kentucky, Eastern 236 33.1 31.3 54.0 20.5 21.1 55.6 31.0 Kentucky, Western 465 63.4 20.0 59.2 87.7 18.8 60.9 50.0 Louisiana, Eastem 517 54.9 82.6 60.8 22.0 75.0 73.8
Louisiana, Middle 54 68.5% 87.0% 75.00/0 25.0% 50.0% 52.9% louisiana, Westem 209 67.9 14.3 82.1 95.5 29.3 57.9 71.4 Maine 169 43.2 16.7 72.2 70.0 47.1 50.0 21.7 Maryland 751 55.3 27.3 72.2 79.7 46.9 62.2 52.4 Massachusetts 384 54.9 36.8 75.6 54.3 23.6 41.7 57.9
Michigan, Eastem 796 46.9% 40.0% 59.3% 58.1% 32.1% 50.0% 46.3% Michigan, Western 181 47.0 16.7 75.0 75.0 20.0 60.0 33.3 Minnesota 385 33.5 16.7 61.5 36.0 19.2 80.0 34.4 Mississippi, Northem 119 62.2 16.7 70.7 33.3 58.8 100.0 65.2 Mississippi, Southern 167 80.8 16.7 93.0 100.0 69.8 100.0 72.7
Missouri, Eastern 31'! 38.5% 9.1% 64.8% 52.2% 10.4% 72.7% 30.9% Missouri, Westem 507 58.2 15.0 64.3 56.5 18.1 57.1 88.1 Montana 204 56.9 21.4 81.1 64.3 54.0 54.2 59.5
86 Compendium of Federal Justice Statistics, 1988

Table D-4.4 Continued
Percent of convicted offenders sentenced to probation8
Total Property Public order offenses offenders b All Drug
District sentenced offenses Violent Fraudulent Other offenses Regulatory Other
Nebraska 159 57.2% 35.7% 65.0% 33.3% 58.5% 100.0% 56.0% Nevada 396 76.5 48.4 84.8 73.3 73.0 87.1 71.1 New Hampshire 38 50.0 100.0 50,0 50,0 41.7 57.1 New Jersey 707 63.6 56.0 78.3 58.4 41.3 62.0 67.1 New Mexico 504 33.9 16.7 81.8 53.3 15.7 58.3 23.5
New York, Eastern 978 59.3% 41.2% 77.4% 72.0% 48.8% 61.1% 69.2% New York, Northern 310 66.5 62.5 72.7 55.6 58.5 72.0 67.3 New York, Southern 1,173 51.7 31.0 80.6 65.5 24.4 77.4 66.8 New York, Western 266 62.4 25.0 70.8 83.7 46.0 75.0 47.2 North Carolina, Eastern 538 55.4 46.2 87.0 66.0 39.0 34.6 54.9
North Carolina, Middle 268 28.4% 9.7% 52.9% 34.3% 6.9% 50.0% 37.8% North CarOlina, Westem 404 51.5 25.6 62.8 63.4 19.1 78.0 52.4 North Dakota 114 42.1 27.3 71.4 69.2 19.2 50.0 39.3 Northern Mariana Islands 6 83.3 100.0 100.0 100.0 50.0 Ohio, Northern 565 49.4 13.5 71.9 52.7 21.1 44.4 67.2
Ohio, Southern 466 46.4% 21.1% 69.4% 50.0% 24.2% 61.5% 45.8% Oklahoma, Eastern 65 40.0 68.2 25.0 11.1 66.7 40.0 Oklahoma, Northern 179 56.4 75.0 79.2 73.3 26.8 40.0 48.1 Oklahoma, Western 489 35.8 61.3 65.0 19.6 76.9 23.2 Oregon 406 37.7 21.8 64.6 64.7 25.0 83.3 40.0
Pennsylvania, Eastern 680 72.8% 80.0% 00.0% 86.5% 54.1% 64.4% . 75.0% Pennsylvania, Middle 252 53.6 41.7 64.9 40.0 52.2 76.5 40.4 Pennsy'lvania, Weslern 262 48.1 50.0 70.1 57.1 25.0 27.3 58.5 Puerto Rico 619 46.8 13.3 83.6 SO.5 4.5 SO.9 72.2 Rhode Island 8:.. 32.5 61.1 100.0 2.9 75.0 45.8
South Carolina 386 54.9% 31.3% 64.2% 51.5% 27.7% 70.7% 57.1% &luth Dakota 213 30.5 14.1 SO.O 50.0 27.4 37.5 33.3 Tennessee, Eastern 190 SO.5 14.3 87.3 91.2 17.6 SO.O SO.6 Tennessee, Middle 342 72.5 40.0 78.1 77.8 19.0 93.3 84.0 Tennessee, Western 387 49.1 40.0 77.0 70.0 17.6 14.3 44.6
Texas, Eastern 154 42.9% 50.0% 70.6% 40.0% 19.6% 62.5% 31.4% Texas, Northern 753 37.5 25.0 68.4 54.2 11.9 55.0 26.2 Texas, Southern 2,099 46.1 41.4 69.1 53.2 39.7 57.0 46.9 Texas, Western 1,175 40.4 12.9 57.4 46.7 32.1 59.1 39.0 Utah 250 68.8 31.6 81.3 90.9 62.5 73.3 65.5
Vermont 87 41.4% 66.7% SO.O% 50.0% 57.1% 57.1% 20.5% Virgin Islands 2SO 43.1 26.0 61.5 62.7 36.1 50.0 29.3 Virginia, Eastern 1,923 55.4 48.1 65.4 67.6 51.7 SO.O 53.8 Virginia, Western 190 65.8 61.5 77.1 80.0 53.7 85.7 59.6 Washington, Eastern 262 43.9 33.3 81.0 55.6 40.4 90.0 35.4
Washington, Western 1,391 40.8% .46.8% 62,(/% 30.7% 71.3% 77.3% 22.1% West Virginia, Northern 199 51.B 71.~ 50.0 48.2 50.0 SO.O West Virginia, Southern 314 51.6 50.0 71.4 45.8 45.2 41.7 57.9 Wisconsin, Eastern 199 50.8 10.5 84.4 56.3 21.9 75.0 57.1 Wisconsin, Western 130 41.5 78.8 70.0 3.6 33.3 64.3 Wyoming 91 72.5 37.5 76.5 95.2 63.6 100.0 66.7
Note: Offenses are classified by most serious offense of conviction. bData describe offenders convicted and sentenced in cases terminated ... No cases of this type occurred in the data. In 1988 .
81ncludes offenders with split or mixed sentences. See Text Table 4.3.
District tables 87

Table 0.5.1 Offenders terminating probation with a new crlmer ~y original offense, 1988
Percent of offenders terminating erobation with a new crimea
Total Original offense
terminatigg My Proe!:!rty Drug Public order offenses
District probation offense Violent Fraudulont Other offenses Regulatory Other
All districts 24,757 6.4% 9.7% 6.0% 7.2% 6.9% 5.0% 6.2%
Alabama, Middle 150 6.7% 2.9% 11.8% 13.3% 0% 6.1% Alabama, Northern 324 7.1 25.0 4.4 14.9 8.8 0 5.0 Alabama, Southern 109 13.8 0 15.6 0 14.7 0 18.8 Alaska 70 7.1 0 5.9 28.6 12.5 0 4.2 Arizona 501 5.2 7.0 0 8.0 4.6 2.9 7.3
Arkansas, Eastern 105 2.9% 1.9% 0% 28.6% 0% 0% Arkansas, VVestern 89 4.5 0 5.7 0 12.5 0 3.6 California, Central 1,107 8.3 16.5 6.8 9.1 5.2 7.5 9.2 California, Eastern 375 6.4 0 0 2.4 7.5 12.5 10.9 California, Northern 655 5.6 15.8 6.3 8.2 5.7 4.0 2.5
California, Southern 1,097 5.7% 9.1% 3.9% 9.1% 4.4% $.3% 6.9% Colorado 285 6.3 0 9.3 11.8 0 2.7 6.0 Connecticut 172 6.4 0 1.7 20.0 0 0 17.9 Delaware 41 9.8 0 15.4 25.0 0 Cl 0 District of Columbia 433 5.1 14.3 1.4 12.3 7.6 0 9.3
Florida, Middle 383 7.6% 15.4% 7.9% 4.4% 12.7% 13.3% 1.3% Florida, Northern 204 11.8 0 4.2 8.0 29.2 7.7 11.8 Florida, Southern 740 7.8 0 6.8 10.6 7.9 10.5 8.8 Georgia, Middle 296 9.5 0 13.8 1.8 6.3 0 12.2 Georgia, Northern 415 6.3 12.5 5.4 7.1 9.1 3.1 6.0
Georgia, Southern 125 8.0% 33.3% 11.8% 25.0% 7.1% 0% 1.7% Guam 30 3.3 0 0 0 0 0 33.3 Hawaii 129 2.3 0 3.1 8.7 0 0 0 Idaho 92 4.3 25.0 3.7 6.7 0 0 2.9 Illinois, Central 123 7.3 0 6.3 0 6.7 0 18.2
Illinois, Northern 706 1.8% 5.9% 1.7% 1.3% 3.6% 1.9% .9% Illinois, Southern 117 2.6 0 5.3 0 0 0 3.6 Indiana, Northern 104 8.7 7.0 5.0 12.5 16.7 10.5 Indiana, Southem 215 9.8 28.6 11.7 0 7.1 20.0 10.1 Iowa, Southern 45 2.2 0 5.6 0 0 0 0
Kansas 163 5.5% 20.0% 3.6% 20.0% 0% 0% 4.8% Kentucky, Eastern 95 6.3 0 7.5 33.3 0 0 0 Kentucky, Western 469 4.7 25.0 8.3 2.4 8.3 5.9 3.7 Louisiana, Eastern 296 8.4 13.3 14.3 2.6 6.9 4.2 Louisiana, Middle 122 6.6 7.7 12.5 30.0 0 2.9
Louisiana, VVestern 252 1.2% 0% 3.2% 5.0% 0% 0% 0% Maine 62 8.1 6.3 0 10.3 0 14.3 Maryland 984 4.7 8.3 2.2 6.7 7.3 9.1 3.8 Massachusetts 287 4.5 0 3.3 16.7 5.3 0 3.1 Michigan. Eastern 464 3.9 0 5.7 6.5 0 0 5.4
Michigan, VVestern 128 10.2% 0% 9.7% 9.1% 9.5% 11.8% 14.3% Minnesota 138 3.6 0 8.0 0 0 0 4.2 Mississippi, Northern 96 2.1 0 22.2 0 0 0 Mississippi, Southern 130 10.0 0 15.8 7.7 16.7 9.1 4.3 Missouri, Eastern 123 5.7 10.0 0 3.4 0 0 Missouri, VVestern 186 5.4 5.6 10.7 0 0 8.7
88 Compendiwn of Federal Justice Statistics, 1988

~ \
Table 0-5.1 Continued
Percent of offenders terminating erobation with a new crimea
Original offense Total
Pro~rty Public order offenses terminatigg Any Drug District probation offense Violent Fraudulent Other offenses RegulalQry Other
Nebraska 140 1.4% 0% 0% 9.1% 2.6% 0% 0% Nevada 390 7.9 50.0 10.9 14.3 15.8 11.8 5.1 New Jersey 523 3.S 0 5.9 2.9 3.4 0 3.2 New Mexico 160 3.1 0 0 0 0 11.1 4.5 New York, Eastern 445 3.1 0 3.6 1.0 5.9 9.3 0
New York, Northern 95 1.1% 0% 0% 0% 8.3% o q. 0% New York, Southern 875 6.5 17.4 4.3 7.9 9.2 2.:3 3.IS New York, Western 192 4.7 16.7 6.6 3.3 2.9 7.1 0 North Carolina, Eastern 410 8.0 50.0 12.9 17.8 2.9 2.8 5.7 North Carolina, Middle 137 18.2 0 19.0 27.3 25.0 25.0 11.8
North Carolina, Western 326 9.2% 0% 11.8% 12.1% 0% 7.5% 8.7% North Dakota 68 5.9 22.2 0 5.9 0 0 12.5 Ohio, Northern 263 9.1 0 7.3 19.0 14.3 7.4 10.9 Ohio, Southern 207 5.8 0 6.3 11.1 7.8 0 0 Oklahoma, Eastern 50 10.0 9.7 22.2 0 0 0
Oklahoma, Northern 114 6.1% 0% 4.9% 13.0% 7.7% 0% 0% Oklahoma, Western 185 4.3 0 2.5 4.2 3.1 16.7 6.1 Oregon 166 9.0 8.3 8.2 2.6 21.1 11.1 11.5 Pennsylvania, Eastern 498 5.0 18.8 3.4 6.0 5.6 3.7 6.1 Pennsylvania, Middle 140 .7 0 2.4 0 0 0 0
?ennsylvania, Western 159 8.8% 0% 10.9% 12.5% 5.9% 5.3% 6.3% Puerto Rico 164 3.7 0 1.3 3.8 18.2 13.3 0 Rhode Island 28 7.1 14.3 0 0 0 0 South Carolina 213 9.4 0 13.6 4.8 25.0 5.6 6.6 South Dakota 119 9.2 9.1 3.1 12.2 0 0 20.0
Tennessee, Eastern 197 7.1% 0 4.5% 13.3% 16.7% 0% 7.9% Tennessee, Middle 252 8.3 0 10.7 12.8 7.1 7.7 5.1 Tennessee, Western 263 4.2 4.2 8.6 3.6 0 0 Texas, Eastern 90 3.3 0 0 10.0 0 0 9.5 Texas, Northern 365 8.8 0 7.2 8.3 11.6 8.3 11.8
Texas, Southern 1,192 9.6% 20.0% 13.8% 3.8% 11.7% 2.1% 8.5% Texas, Western 719 5.1 25.0 5.4 0 6.9 9.1 4.7 Utah 184 10.9 0 11.3 13.8 25.0 0 9.2 Vermont 35 8.6 0 0 33.S 16.7 0 0 Virgin Islands 79 12.7 14.3 11.1 14.7 0 33.3 0
Virginia, Eastern 965 8.5% 18.8% 7.1% 7.1% 7.5% 0% 9.6% Virginia, Western 154 3.2 0 0 0 7.1 4.0 3.6 WashinglQn, Eastern 114 5.3 0 2.4 0 3.1 12.5 13.6 Washington, Western 272 7.0 11.8 6.3 7.4 7.5 0 7.9 West Virginia" Northern 66 6.1 4.5 0 5.3 0 16.7
Wast Virginia, Southern 102 6.9% 0% 10.3% 12.5% 2.8% 10.0% 5.6% Wisconsin, Eastern 116 3.4 0 1.6 7.7 15.4 0 0 Wyoming 64 15.6 0 7.1 20.0 8.3 0 31.8
Note: Original offenses are classified by most serious offense of conviction. bData describe offenders whose c:bation terms ended in 1988 ... No caiSes of this type occurred in the data. either because of a violation or ause the term expired .
alncludes both "major' and "minor' offenses. See Text Table 5.1.
District tables 89

Table 0-5.2 Offenders terminating probation with a new crime or technical violation, by orIginal offense, 1988
Percent of offenders terminating E!robation with a new crime or technical violation
Original offense Total
Property Public order offenses tenninatin~ Any Drug
District probation offense Violent Fraudulent Other offenses Regulatory Other
All districts 24,757 22.4% 28.7% 21.1% 28.6% 25.1% 17.3% 20.4%
Alabama, Middle 150 14.7% 5.7% 23.5% 20.0% 0% 15.9% Alabama, Northern 324 16.7 50.0 21.1 21.3 14.7 0 11.5 Alabama, Southern 109 32.1 100.0 33.3 16.7 32.4 0 37.5 Alaska 70 15.7 0 17.6 28.6 25.0 0 16.7 Arizona 501 27.1 20.9 25.0 34.0 32.4 20.0 26.0
Arkansas, Eastern 105 10.5% 14.8% 6.3% 28.6% 0% 0% Arkansas, Western 89 22.5 0 20.0 40.0 25.0 0 17.9 California, Central 1,107 30.0 56.5 25.7 49.7 21.9 25.8 22.0 California, Eastern 375 28.5 10.0 20.0 45.2 25.4 16.7 35.0 California, Northern 655 23.1 26.3 23.3 38.8 19.5 36.0 17.1
California, Southern 1,097 41.8% 27.3% 40.8% 31.8% 42.3% 3B.7% 43.3% Colorado 285 21.1 16.7 18.7 32.4 12.1 8.1 27.0 Connecticut 172 16.3 0 10.2 46.7 11.9 0 25.6 Delaware 41 22.0 0 30.8 37.5 50.0 0 0 District of Columbia 433 30.0 28.6 25.4 36.8 37.0 40.0 23.3
Florida, Middle 383 24.3% 23.1% 22.4% 44.4% 29.1% 20.0% 12.7% Florida, Northern 204 28.4 0 16.7 24.0 45.8 23.1 30.9 Florida, Southern 740 25.8 50.0 28.1 46.8 17.9 23.7 25.7 Georgia, Middle 296 13.2 0 20.7, 5.3 6.3 0 16.0 Georgia, Northern 415 24.8 25.0 23.1 31.4 42.4 15.6 20.5
Georgia, Southern 125 28.8% 33.3% 38.2% 50.0% 21.4% 0% 22.O"k Guam 30 3.3 0 0 0 0 0 33.3 Hawaii 129 13.2 0 6.3 26.1 13.8 0 13.9 Idaho 92 21.7 25.0 22.2 33.3 25.0 0 17.1 Illinois, Central 123 24.4 100.0 20.8 11.1 26.7 0 40.9
Illinois, Northern 706 18.1% 35.3% 15.5% 34.9% 7.2% 9.4% 12.3% Illinois, Southern 117 15.4 0 13.2 16.7 14.3 33.3 17.9 Indiana, Northern 104 19.2 23.3 10.0 12.5 33.3 21.1 Indiana, Southern 215 12.1 28.6 15.0 0 10.7 20.0 11.6 Iowa, Northern 58 8.6 0 0 25.0 14.3 33.3 5.9
Iowa, Southern 45 8.9% 33.3% 5.6% 22.2% 0% 0% 0% Kansas 163 19.0 20.0 14.3 40.0 6.3 25.0 20.6 Kentucky, Eastern 95 14.7 0 20.0 33.3 16.7 0 5.0 Kentucky, Western 469 9.2 25.0 11.7 4.1 292 5.9 9.6 Louisiana, Eastern 296 17.9 22.9 46.4 13.2 20.7 5.2
Louisiana, Middle 122 12.3% 15.4% 37.5% 30.0% 11.1% 5.8% loUisiana, Western 252 12.3 14.3 12.9 20.0 0 0 12.6 Maine 62 14.5 6.3 42.9 10.3 33.3 14.3 Maryland 984 20.3 16.7 14.1 22.7 20.9 36.4 20.9 Massachusetts 287 8.7 0 9.1 29.2 5.3 0 6.2
Michigan, Eastern 464 19.0% 60.0% 20.6% 33.9% 12.1% 10.3% 16.2% Michigan, Western 128 19.5 0 17.7 54.5 9.5 17.6 21.4 Minnesota 138 10.1 0 18.0 0 8.3 0 8.3 Mississippi, Northern 96 12.5 0 22.2 0 0 15.6 Mississippi, Southern 130 25.4 0 42.1 15.4 33.3 18.2 14.9
Missouri, Eastern 123 15.4% 18.3% 12.5% 20.7% 0% 0% Missouri, Western 186 16.7 16.9 25.0 11.1 5.3 21.7 Montana 113 7.1 1:2.\5 3.7 4.8 8.3 0 16.7
90 Compendium of Federal Justice Statistics, 1988

I
Table 0-5.2 Continued
Percent of offenoors terminating erobation with a new crime or technical violation
Original offense Total Property Public order offenses terminatilJ9 Any Drug
District probation offense Violent Fraudulent Other offenses Regulatory Other
Nebraska 140 25.0% 50.0% 22.4% 9.1 % 48.7% 0% 9.1% Nevada 390 36.2 75.0 34.4 50.0 36.8 23.5 36.9 New Hampshire 19 10.5 0 50.0 0 0 20.0 New Jersey 523 14.9 20.0 21.5 .23.2 8.5 6.5 7.4 New Mexico 160 9.4 0 6.7 15.8 7.1 16.7 9.0
New York, Eastern 445 23.1% 25.0% 27.1% 26.3% 22.1% 25.6% 12.0% New York, Northem 95 6.3 100.0 2.7 8.3 8.3 0 9.5 New York, Southern 875 26.9 47.8 23.0 25.7 35.9 20.9 12.4 New York, Western 192 16.7 16.7 21.3 13.3 14.7 25.0 6.1 North Carolina, Eastern 410 20.2 50.0 29.0 46.7 22.9 5.6 14.0
North Carolina, Middle 137 31.4% 0% 31.6% 63.6% 25.0% 37.5% 20.6% North Carolina, Western 326 25.2 33.3 33.3 33.3 5.3 20.0 20.6 North Dakota 68 33.8 66.7 17.6 47.1 28.6 10.0 37.5 Ohio, Northem 263 17.1 0 16.3 33.3 19.0 7.4 21.8 Ohio, Southern 207 12.1 0 11.4 14.8 19.6 0 4.8
Oklahoma, Eastem 50 12.0% 12.9% 22.20,{, 0% 0% 0% Oklahoma, Northem 114 25.4 0 24.6 34,8 15.4 0 33.3 Oklahoma, Western 185 10.3 0 6.3 8.3 18.8 25.0 9.1 Oregon 166 33.7 58.3 26.2 35.9 52.6 22.2 26.9 Pennsylvania, Eastern 498 26.3 43.8 23.3 38.0 33.3 25.9 15.9
Pennsylvania, Middle 140 10.7% 0% 16.7% 16.7% 4.5% 5.6% 11.1% Pennsylvania, Western 159 16.4 0 20.3 25.0 11.8 15.8 6.3 Puerto Rico 164 15.9 0 7.7 26.9 27.3 13.3 24.2 Rhode Island 28 7.1 14.3 0 0 0 0 South Carolina 213 22.1 33.3 24.7 14.3 37.5 8.3 26.2
South Dakota 119 31.1% 31.8% 18.8% 39.0% 28.6% 50.0% 33.3% Tennessee, Eastern 197 14.2 25.0 10.6 13.3 50.0 0 14.9 Tennessee, Middle 252 21.8 0 27.4 41.0 7.1 23.1 12.1 Tennessee, Western 263 19.0 19.0 31.4 10.7 0 14.3 Texas, Eastem 90 21.1 0 18.9 20.0 23.1 25.0 23.8
Texas, Northern 365 29.3% 33.3% 31.1% 41.7% 25.6% 27.1% 22.1% Texas, Southem 1,192 23.5 30.0 24.3 17.3 31.6 17.0 20.2 Texas, Westem 719 19.5 25.0 20.3 12.5 27.6 24.2 17.1 Utah 184 23.9 20.0 25.8 24.1 25.0 9.1 24.6 Vermont 35 11.4 0 0 33.3 16.7 0 14.3
Virgin Islands 79 31.60/.- 42.9% 44.4% 26.5% 16.7% 33.3% 0% Virginia, Eastern 965 28.1 43.8 28.3 36.7 32.0 10.0 24.6 Virginia, Western 154 9.1 0 2.6 0 14.3 8.0 12.5 Washington, Eastem 114 20.2 0 26.2 25.0 15.6 12.5 18.2 Washington, Westem 272 28.3 23.5 19.0 40.7 37.5 30.0 29.2
West Virginia, Northern 66 12.1% 9.1% 11.1% 10.5% 0% 25.0% West Virginia, Southern 102 19.6 0 20.7 25.0 25.0 10.0 11.1 Wisconsin, Eastem 116 11.2 0 4.8 53.8 23.1 0 0 Wisconsin, Western 39 10.3 0 6.3 20.0 100.0 0 8.3 Wyoming 64 29.7 25.0 14.3 20.0 16.7 14.3 54.5
Note; Original offenses are classified by most serious offense of conviction.
*Data describe offenders whose probation terms ended in 1988 either because of a violation or Decause the term expired .
... No cases if this type occurred in the data. See Text Table 5.1.
District tables 91

Table 0-5.3 Offenders termInating probation with a new crIme, by offender characterIstics, 1988
Percent of offenders terminating erobation with a new ~rlmea Total Ethnicity offenders terminati~ Sex Race Non· Age
District probation Mala Female White Black Other Hispanic Hispanic 16-18 19·20 21·30 31·40 OVer 40
All districts 24,757 7.1% 4.00k 5.7% 8.7% 5.4% 8.3% 6.2% 8.5% 12.4% 8.9% 6.9% 3.3%
Alabama, Middle 150 7.4% 3.4% 7.3% 5.9% 0% 6.7% 28.6% 8.5% 8.3% 0% Alabama, Northern 324 8.1 3.9 6.7 7.8 0 0 7.2 40.0 11.0 4.3 3.4 Alabama, Southern 109 16.7 6.5 13.6 14.6 0 50.0 11.7 20.0 15.6 9.4 Alaska 70 8.0 5.0 8.7 ... 11.1 0 7.9 12.5 9.5 0 Arizona 501 6.2 1.0 3.7 6.9 11.2 4.0 5.7 0 11.1 4.4 7.5 3.1
Arkansas, Eastern 105 2.6% 3.7% 1.3% 8.0% 2.9% 0% 3.4% 3.2% 2.4% Arkansas, Western 89 6.3 0 6.0 0 0 25.0 3.6 0 0 3.3 8.0 3.4 California, Central 1,107 9.8 3.0 6.8 12.4 5.9 9.7 8.1 0 0 11.6 11.6 3.6 California, Eastern 375 7.7 0 5.8 12.2 0 32.3 4.1 0 7.9 6.9 4.0 California, Norlhern 655 6.2 4.4 5.2 6.3 5.8 11.1 5.4 0 10.0 5.5 6.0 4.8
California, Southern 1,097 6.5% 3.1% 5.5% 8.5% 0% 5.0% 6.2% 12.5% 14.0% 6.5% 4.9% 3.7% Colorado 285 6.9 4.5 6.1 8.0 0 3.2 6.7 0 11.0 2.7 7.8 Connecticut 172 7.7 0 5.8 8.8 0 6.7 0 11.8 3.6 5.6 Delaware 41 10.0 9.1 7.1 16.7 0 ... 9.8 20.0 0 11.1 District of Columbia 433 7.0 1.4 .8 7.0 0 0 5.3 10.0 8.7 3.7 1.1
Florida, Middle 383 7.4% 8.1% 6.2% 12.0% 0% 0% 7.6% 25.0% 17.2% 7.2% 2.1% Florida, Northern 204 15.4 3.3 11.0 15.8 0 0 11.9 0 28.6 14.9 13.0 1.9 Florida, Southern 740 8.5 5.3 7.1 9.7 0 10.2 6.7 11.1 11.9 9.2 3.6 Georgia, Middle 296 11.7 2.7 8.6 10.5 20.0 33.3 9.0 0 15.4 14.2 9.7 3.1 Georgia, Northern 415 7.2 3.2 5.7 7.6 0 0 6.4 0 0 10.2 7.8 1.6
Georgia, Southern 125 8.4% 6.7% 6.6% 10.2% 0% 8.2% 0% 7.4% 11.8% 7.4% Hawaii 129 5.0 0 0 3.8 3.4 0 14.3 0 0 Idaho 92 3.2 0 3.6 0 1.6 0 2.5 0 2.7 6.1 0 Illinois, Central 123 4.8 3.3 3.5 14.3 0 4.5 0 4.3 4.2 6.3 Illinois, Northern 706 9.8 0 6.3 12.0 0 7.5 0 17.2 7.7 2.4
Illinois, SoulhEirn 117 2.1% .7% 1.4% 2.6% 0% 0% 2.0% 0% 0% 2.00/0 2.6% .8% Indiana, Northern 104 2.3 3.4 3.3 0 0 0 2.6 0 5.7 0 2.6 Indiana, Southern 215 9.0 7.7 10.5 3.6 33.3 8.2 100.0 17.4 10.0 2.1 Iowa, Southern 45 12j 0 7.9 16.3 0 9.8 0 0 11.9 8.5 9.7 Kansas 163 2.6 0 0 8.3 0 2.3 0 8.3 0 0
Kentucky, Eastern 95 5.7% 4.9% 2.7% 11.5% 0% 5.7% 33.3% 7.1% 3.7% 4.7% Kentucky, Western 469 5.6 8.7 5.7 14.3 0 6.5 10.0 14.3 2.6 Louisiana, Eastern 296 5.6 1.0 4.2 5.9 0 0 4.9 20.0 4.2 5.0 6.0 0 Louisiana, Middle 122 8.7 7.8 7.5 10.5 8.4 0 9.9 11.4 6.7 Louisiana, Western 252 6.5 6.7 5.3 12.0 0 6.6 0 3.5 17.4 3.2
Maine 62 1.1% 1.5% 0% 4.9% 0% 0% 1.2% 0% 8.3% 2.2% 0% 0% Maryland 984 10.0 0 8.1 8.1 15.8 5.3 4.5 Massachusetts 287 4.9 3.7 4.3 5.1 5.6 0 4.7 16.7 16.0 4.9 5.5 1.8 Michigan, Eastern 464 4.3 5.8 4.7 3.8 0 0 4.8 100.0 6.6 5.1 1.6 Michigan, Western 128 3.5 4.8 2.7 5.9 0 3.9 0 0 7.1 4.0 1.5
Minnesota 138 12.2% 5.3% 8.3% 21.1% 0% 16.7% 9.1% 66.7% 16.7% 4.8% 2.4% Mississippi, Northern 96 3.7 3.4 3.2 12.5 0 0 3.7 0 6.0 4.5 Mississippi, Southern 130 1.2 9.1 1.5 3.6 2.1 0 4.0 0 2.9 Missouri, Eastern 123 8.4 17.4 6.7 17.9 0 10.3 0 10.0 20.0 6.5 Missouri, Western 186 6.4 3.4 3.7 10.0 0 0 5.7 0 11.1 11.4 0
92 Compendium of Federal Justice Statistics, 1988

Table 0·5.3 Continued
Percent of offenders terminating probation with a new crimoB Total Ethnfcfty offenders termfnati~
Sex Race Non- Age
District erobation Male Female White Black Other Hi~anic Hi~nlc 16-18 19-20 21-30 31-40 OIer4O
Nebraska 140 5.7% 4.3% 4.7% 7.1% ... 5.4% 0% 8.1% 7.3% 2.7% Nevada 390 1.0 2.8 .8 7.7 0 0 1.5 0 2.4 2.4 0 New Jersoy 523 8.3 6.8 8.1 9.1 0 16.7 7.6 5.3 11.1 8.0 5.3 New Mexico 160 3.9 3.4 3.5 5.7 0 13.6 3.0 0 9.1 3.2 5.7 2.0 New York, Eastern 445 3.8 0 3.5 0 0 1.9 3.7 0 0 6.0 5.0 0
New York, Northern 95 3.6% 1.2% 2.6% 4.7% 0% 0% 3.2% 0% 6.5% 3.8% .6% New York, Southern 875 0 4.3 0 1.1 4.3 0 0 New York, Western 192 7.1 4.4 5.1 9.3 4.3 9.4 5.6 14.3 9.0 8.6 2.5 North Carolina, Eastern 410 3.7 7.0 2.3 10.0 0 0 4.3 ... 7.0 3.9 3.1 North Carolina, Middle 137 8.6 5.8 4.7 13.0 7.7 12.5 8.0 0 14.3 9.8 6.8 4.1
North Carolina, Western 326 18.3% 18.2% 14.3% 25.0% 0% 18.2% 0% 27.3%24.4% 10.4% North Dakota 68 10.6 5.5 8.9 12.3 3.4 0 9.3 0 13.3 12.4 7.7 7.9 Ohio, Northern 263 7.1 0 2.8 10.0 6.Q 0 0 4.0 13.0 0 Ohio, Southern 207 9.5 7.5 8.6 9.2 0 14.3 8.7 14.8 16.1 2.9 Oklahoma, Eastern 50 4.9 7.9 5.8 6.0 0 5.8 33.3 11.3 4.3 1.4
Oklahoma, Northern 114 11.4% 6.7% 8.7% 50.0% 0% 10.0% ... 21.4% 5.6% 0% Oklahoma, Western 185 10.0 0 3.7 13.3 0 0 6.3 50.0 2.9 8.6 5.1 Oregon 166 4.5 3.8 3.6 7.7 0 0 4.4 0 8.8 1.'7 3.8 Pennsylvania, Eastern 498 11.0 4.2 9.5 11.1 0 25.0 8.6 20.0 6.5 13.8 6.8 Pennsylvania, Middle 140 5.4 3.4 4.2 6.3 0 0 5.1 0 0 10.9 4.9 4.3
Pennsylvania, Western 159 .9% 0% .8% 0% 0% 0% .7% 0% 3.0% 0% 0% Puerto Rico 164 6.5 17.1 6.8 15.0 0 8.8 0 18.4 9.8 4.8 Rhode Island 2e 4.2 2.3 5.1 0 4.7 2.0 0 4.7 6.5 1.5 South Carolina 213 7.4 0 0 28.6 0 7.7 ... 40.0 0 0 South Dakota 119 9.4 9.4 3.2 18.6 0 9.4 50.0 16.4 9.1 4.9
Tennessee, Eastern 197 10.8% 3.8% 5.0% 0% 11.7% 0% 9.4%. 30.0% 10.0% 8.3% 10.0% 0% Tennessee, Middle 252 7.9 3.0 7.5 0 0 7.1 0 0 10.9 6.0 3.4 Tennessee, Western 263 9.1 5.5 7.8 10.5 0 0 8.4 0 9.1 8.2 13.5 3.1 Texas, Eastern 90 2.8 7.1 1.6 6.7 0 4.2 50.0 7.6 1.9 2.8 Texas, Northern 365 4.7 0 4.2 0 16.7 2.4 4.0 3.6 3.4
Texas, Southern 1,192 9.1% 7.5% 8.1% 10.7% 0% 21.4% 7.7% 0%13.9% 9.5% 4.1% Texas, Western 719 10.9 3.8 9.3 12.9 50.0 9.9 9.1 25.0 21.4 13.4 9.1 6.3 Utah 184 5.0 3.0 5.0 7.1 0 6.9 3.8 14.3 6.0 6.4 3.4
I • Vermont 35 12.1 5.7 8.4 54.5 0 0 10.9 25.0 13.5 10.0 9.1 Virgin Islands 79 9.7 0 8.8 0 8.6 0 5.6 11.1 16.7
Virginia, Eastern 965 14.7% 0% 0% 15.4% 5.0% 15.3% 60.0% 11.1% 10.5% 0% Virginia, Western 154 9.1 5.9 8.1 9.3 0 18.2 8.3 0 19.2 10.9 5.2 2.9 Washington, Eastern 114 3.8 0 3.6 0 0 3.3 0 0 5.9 4.2 0 Washington, Western 272 7.1 0 6.1 0 0 22.2 3.8 2.6 11.4 3.1 West Virginia, Northern 66 8.1 3.2 6.9 10.0 3.8 40.0 6.4 0 20.0 7.5 9.3 3.5
West Virginia, Southern 102 8.9% 0% 5.3% 11.1% 6.1% o % 11.8% 7.7% 0% Wisconsin, Eastern 116 8.2 3.4 6.8 7.1 6.9 10.0 7.0 6.7 Wyoming 64 3.9 2.6 1.2 7.7 12.5 3.4 12.0 2.9 0
'" No cases of this type occurred in the data. bData describe offenders whose probation term ended in 1988 either Blncludes both "major" and "minor" offenses. I::acause of a violation or because the term expired.
Sae Text Table 5.2.
District tables 93

Tabla D-5.3 \:ontlnuod. Offenders terminating probation with a new crime, by offender characteristics, 1988 ,
Percent of offenders terminating probation with a new crimea
Prior criminal record
Prior adult convlcdons ---E!.ug abuso_ Total Incarceration ofj,mders Employment at arrest Known No
termlnati~ Juvenile Nojall 1 year <Ner drug known District probation Employed Unemployed None on~i' or prison or lesG 1 year history abuse
All districts 24,757 6.3% 9.7% 4.0% 12.8% 8.00/0 13.4% 17.1% 10.9% 6.2%
Alabama, Middle 150 7.20/0 7.1% 2.3% 20.0% 14.60/0 0% 0% 20.00/0 6.7% Alabama, Northern 324 7.1 8.9 5.4 33.3 7.7 9.1 7.1 17.9 6.2 Alabama, Southern 109 16.7 10.0 10.3 0 14.7 50.0 22.2 13.3 15.7 Alaska 70 9.1 6.7 2.3 50.0 11.1 0 33.3 25.0 4.3 Arizona 501 4.0 9.8 3.4 i~.9 4.7 17.4 8.8 2.0 5.9
Arkansas, Eastern 105 2.7% 5.0% 1.4% 0% 8.3% 0% 0% 0% 3.4% Arkansas, VVestern 89 3.0 10.5 2.3 16.7 3.6 0 10.0 28.6 2.6 Califomia, Central 1,107 8.9 8.8 5.1 4.8 7.5 18.9 21.9 10.1 8.6 California, Eastern 375 6.3 7.7 3.0 14.3 7.1 11.1 8.8 9.5 5.4 California, North9rn 655 4.1 13.3 2.9 17.9 4.0 17.5 21.1 11.2 5.3
California, Southem 1,097 4.9% 7.9% 4.8% 9.3% 6.7% 8.1% 10.3% 4.6% 6.3% Colorado 285 6.9 10.3 4.3 20.0 7.8 11.8 16.7 7.4 7.4 Connecticut 172 5.9 8.8 1.9 14.3 9.7 0 19.0 15.4 3.5 Delaware 41 10.7 16.7 4.5 50.0 0 33.3 25.0 0 13.3 District of ColumbiR 433 4.5 12.3 4.0 20.0 4.1 7.7 4.8 9.0 4.0
Florida, Middle 383 7.7% 11.3% 6.7% 31.3% 5.7% 11.1% 5.4% 14.5% 7.0% Florida, Northern 204 13.8 12.5 8.1 12.5 14.7 50.0 40.0 42.9 9.4 Florida, Southern 740 7.3 12.0 5.5 23.1 10.3 28.6 12.9 13.5 7.4 Georgia, Middle 296 11.7 7.1 5.6 33.3 9.5 28.6 46.2 75.0 10.2 Georgia, Northern 415 6.0 8.6 4.7 0 5.1 15.8 17.1 19.0 4.3
Georgia, Southern 125 8.5% 5.00/0 5.6% 0% 12.1% 40.00/0 0% 22.~k 5.20/0 Hawaii 129 3.3 0 0 0 100.0 3.3 Idaho 92 2.3 6.3 0 0 7.1 100.0 0 6.3 2.3 Illinois, Central 123 4.5 10.0 1.8 0 12.5 16.7 0 5.9 5.1 Illinois, Northem 706 7.1 14.3 1.2 50.0 15.0 0 30.8 12.5 6.7
Illinois, Southern 117 1.4% 2.6% 1.1% 5.3% 3.5% 0% 3.3% 2.4% 1.6% Indiana, Northern 104 3.2 0 3.5 0 0 0 0 0 3,2 Indiana, Southern 215 8.8 7.4 6.5 25.0 10.0 14.3 9.1 11.1 8.1 Iowa, Southern 45 9.3 15.6 3.1 25.0 13.7 20.0 50.0 18.2 8.7 Kansas 163 2.4 0 0 0 0 0 33.3 14.3 0
Kentucky, Eastern 95 5.0% 11.5% 3.20/0 0% 5.0% 28.6% 14.3% 3.3% 6.8% Kentucky, VVestern 469 4.8 20.0 2.1 0 12.5 25.0 0 9.1 7.5 Louisiana, Eastem 296 3.3 10.6 3.9 8.3 5.3 50.0 0 0 4.7 Louisiana, Middle 122 8.3 13.7 6.2 20.0 12.2 8.3 21.1 5.4 11.0 Louisiana, VVestem 252 8.6 30.8 0 40.0 16.7 50.0 33.3 33.3 6.1
Maine 62 1.1% 4.7% 0% 22.2% 0% 0% 20.0% 13.3% .8% Maryland 984 9.6 0 3.0 33.3 13.0 0 0 7.7 8.9 Massachusetts 287 5.4 4.0 3.1 7.1 8.4 7.1 12.1 11.4 3.0 Michigan, Eastem 464 3.2 9.3 .7 6.3 5.3 0 19.4 10.9 3.1 Michigan, VVestem 128 2.8 8.4 3.0 0 3.5 0 20.8 6.8 3.5
Minnesota 138 5.3% 19.0% 7.9% 0% 3.2% 27.3% 37.5% 10.0% 7.&":' Mississippi, Northem 96 3.3 10.0 2.1 20.0 0 14.3 25.0 0 4.4 Mississippi, Southern 130 3.6 33.3 1.2 10.0 0 (j 6.7 Missouri, Eastern 123 2.7 29.4 4.1 33.3 17.2 20.0 15.0 45.5 7.1 Missouri, Westem 186 7.7 5.6 5.0 0 10.0 0 0 6.7 7.4
94 Compendium of Federal Justice Statistics, 1988

Table 0-5.3 Continued
Percent of offenders terminating probation with a new crimea
Prior criminal rocord
Prior adult convictions Druf.!a~ Total
Incarceration offenders Employment at arrest -- Known No terminati~ Juvenile No Jail 1 year Over drug known
District probation Employed Unemployed None only or prison or less 1 year history abuse
Nebraska 140 6.9% 0% 2.20/0 0% 7.7% 0% 16.7% 8.6% 4.8% Nevada 390 1.8 0 1.2 0 2.6 0 0 0 2.3 New Jersey 523 10.0 25.0 5.0 20.0 18.6 18.2 30.8 26.6 9.0 New Mexico 160 3.5 8.2 1.9 9.1 9.0 6.3 10.0 2.8 4.5 New York, Eastern 445 3.0 6.5 1.8 25.0 0 0 8.3 7.7 3.6
New York, Northern 95 2.9% 3.9% 1.3% 16.7% 3.4% 4.20/0 14.3% 8.6% 1.7% New York, Southern 875 0 7.1 0 0 0 50.0 0 0 1.4 New York, Western '192 5.7 10.1 3.1 7.4 9.9 7.5 25.0 9.6 5.8 North Carolina, Eastern 410 3.2 7.0 2.4 0 5.6 30.8 0 6.7 3.9 North Carolina, Middle 137 7.0 16.2 5.8 0 6.6 15.4 34.6 23.7 6.2
North Carolina, Western 326 20.4% 29.4% 5.5% 100l)"/. 21.6% 8.3% 43.8% 30.0% 20.0% North Dakota 68 13.2 6.5 2.6 50.f) 10.9 30.8 41.7 21.1 11.3 Ohio, Northern 263 4.0 8.3 2.7 16:7 0 50.0 0 5.9 4.4 Ohio, Southem 207 ... 9.4 0 14.3 33.3 Oklahoma, Eastern 50 3.8 16.1 2.5 10.0 7.4 9.1 25.0 7.5 5.4
Oklahoma, Northern 114 7.0% 25.0% 6.3% 33.3% 15.4% 0% 50.00/. 6.7% Oklahoma, Western 186 6.7 4.8 4.0 0 16.0 0 0 16.7 3.4 Oregon 166 5.0 0 4.0 0 7.5 0 0 3.8 4.8 Pennsylvania, Eastern 498 10.7 12.1 4.3 25.0 6.3 0 35.3 22.2 6.9 Pennsylvania, Middle 140 4.6 9.7 3.3 5.7 5.B 17.6 1D.4 10.7 4.5
Pennsylvania, Western 159 .8% 0% 0% 25.0% 0% 0% 4.2"10 0% Puerto Rico 164 7.0 17.6 5.1 25.0 9,4 42.9 7.7 22.7 7.1 Rhode Island 28 5.3 1.9 3.4 100.0 0 0 0 5.6 3.8 South Carolina 213 0 40.0 5.3 0 50.0 0 25.0 4.5 South Dakota 119 10.9 16.7 3.6 20.0 13.B 27.3 13.8 22.2 11.4
Tennessee, Eastern 197 10.0% 11.1% 3.1% 30.8% 9.4% 33.3% 16.7% 6.7% 10.8% Tennessee, Middle 252 11.5 6.9 4.2 10.0 3.3 16.7 62.5 25.0 8.7 Tennessee, Western 263 7.3 13.5 5.4 0 9.8 13.3 23.1 20.6 6,2 Texas, Eastern 90 3.8 6.4 1.3 20.0 1.9 8.3 16.7 7.7 'j,9 Texas, Northern 365 3.3 4.8 2.0 0 3.7% 0 12.5 0 4.8
Texas, Southern 1,192 9.8% 8.8% 7.7% 14.3% 11.9% 9.1% 3.3% 9.8% 9.6% Texas, Western 719 11.3 12.3 7.1 0 12.9 13.9 39.6 20.2 10.6 Utah 184 6.9 7.0 4.7 6.3 6.5 11.8 3.7 7.9 6.7 Vermont 35 9.8 20.0 0 35.3 7.8 50.0 33.3 41.2 8.6 Virgin Islands 79 7.1 16.7 6.3 0 25.0 16.7 4.5
Virginia, Eastern 965 11.1% 17.4% 4.0% 40.0% 38.5% 25.0% 0% 12.5% 13.2% Virginia, Western 154 7.6 13.2 6.6 8.5 10.7 8.8 25.0 10.2 7.3 Washington, Eastern 114 5.7 0 1.1 11.1 2.9 0 11.1 7.1 3.7 Washington, Western 272 3.3 8.1 2.2 0 7.7 6.3 13.3 0 6.6 West Virginia, Northern 66 6.6 11.9 4.4 0 13.0 4.0 10.0 13.3 6.7
West Virginia, Southern 102 6.5% 8.3% 4.9% 0% 0% 33.3% 13.3% 4.7% Wisconsin, Eastern 116 5.6 14.3 7.4 0 0 22.2 10.0 4.3 B.6 Wyoming 64 3.9 6.3 0 11.1 3.a 0 40.0 18.2 2.4
•. , No cases of this type occurred in the data. bData describe offenders whose p;"obation term ended in 1988 either Blncludes both "major" and "milior" orrenses. because of a violation or because the term expired.
See Text Table 5.2.
District tables 95

Table 0-5.4 Offenders terminating probation with a new crime or technical violation, by offender characteristics, 1988
Percent of offenders terminating erobation with a new crime '.Ir technical violation Total Ethnicity offenders teminatinll Sex Race Non· Age
District probation Male Female White Black Other Hispanic Hispanic 16-18 19·20 21·30 31-40 O;er4O ,
All districts 24,757 23.4% 19.1% 18.3% 34.1% 21.7% 27.5% 21.7% 34.0% 35.7% 31.5% 24.7% 11.2%
Alabama, Middle 150 15.7% 10.3% 9.4% 25.5% 0% 14.7% 28.6% 23.4% 16.7% 2.60/0 Alabama, Northern 324 18.6 10.4 12.0 25.2 0 0 16.9 80.0 24.6 12.0 10.1 Alabama, Southern 109 35.9 22.6 30.3 36.6 0 66.7 30.1 45.7 43.8 15.6 Alaska 70 18.0 10.0 17.4 10.0 11.1 0 15.9 12.5 23.8 10.0 Arizona 501 29.8 16.3 24.8 37.9 33.7 28.2 26.7 100.0 55.6 3M 31.3 14.6
Arkansas, Eastern 105 9.0% 14.8% 5.0% 26.0% ... 10.5% 100.0% 10.3% 6.5% 12.2% Arkansas, Western 89 27.0 11.5 19.4 33.3 0 50.0 21.4 0 0 33.3 32.0 6.9 Califomia, Central 1,107 31.7 24.2 23.6 47.1 19.6 3U 29.8 0 58.8 46.4 35.0 15.1 California, Eastern 375 29.7 23.1 26.6 46.3 16.7 41.9 27.4 40.0 40.9 30.4 15.8 California, Northern 655 23.4 22.5 15.6 40.7 17.3 27.8 23.0 0 30.0 30.0 24.S 18.7
Califomia, Southern 1,097 43.0% 37.5% 40.5% 53.0% 20.0% 37.7% "'04.0% 50.0% 55.1% 49.5% 39.0% 24.2% Colorado 285 23.4 13.4 19.7 30.0 0 25.8 20.5 20.0 31.5 19.1 14.3 Connecticut 172 18.3 6.7 16.1 17.6 ... 28.6 15.4 0 32.4 16.1 9.9 Delaware 41 20.0 27.3 25.0 16.7 0 2" " t:. .... 46.7 6.3 11.1 District of Columbia 433 33.4 23.3 18.6 35.6 0 20.0 30.6 50.0 39.1 27.4 17.2
Florida, Middle 383 25.0% 22.2% 17.6% 45.7% 0% 0% 24.5% ... 25.0% 49.5% 32.4% 4.8% Florida, Northern 204 33.6 16.4 24.5 47.4 0 0 28.7 0 50.0 34.5 30.4 11.5 Florida, Southern 740 26.1 24.7 21.2 41.2 0 27.6 24.9 55.6 38.1 28.2 13.8 Georgia, Middle 296 15.8 5.4 10.8 17.1 20.0 33.3 12.8 0 15.4 18.9 17.7 3.1 Georgia, Northern 415 26.9 17.9 14.8 43.8 14.3 25.0 24.8 0 40.0 33.6 31.9 11.5
Georgia, Southern 125 31.6% 20.0% 18.4% 44.9% 0% 29.5% 25.0%29.6% 35.3% 25.9% Guam 30 5.0 0 0 3.8 3.4 0 14.3 0 0 Hawaii 129 16.1 5.6 12.7 0 15.9 0 14.4 100.0 27.0 9.1 B.3 Idaho 92 25.8 13.3 18.8 57.1 0 22.7 25.0 43.5 20.8 12.5 Illinois, Central 123 28.3 12.9 20.0 44.0 0 24.2 0 51.7 23.1 14.3
Illinois, Northern 706 17.9% 19.1% 8.6% 34.2% 0% 8.3% 18.4% 100.0% 0%27.7% 27.7% 9.8% Illinois, Southern 117 19.3 3.4 14.4 20.8 0 50.0 14.8 0 22.9 14.7 12.8 Indiana, Northern 104 20.5 15.4 14.5 32.1 33.3 19.4 100.0 26.1 20.0 12.8 Indiana, Southern 215 13.8 4.9 10.3 18.4 0 12.1 0 0 18.6 9.9 9.7 Iowa, Northern 58 9.1 7.1 8.8 0 0 8.9 12.5 0 12.5
Iowa, Southern 45 5.3% 28.6% 6.1% 113.7% 0% 9.1% 100.0% 16.7% 0% 0% Kansas 163 19.7 17.1 13.5 30.8 0 19.7 33.3 26.8 18.5 11.6 Kentucky, Eastern 95 13.9 17.4 14.8 14.3 0 15.1 20.0 33.3 5.3 Kentucky, Western 469 9.4 8.2 7.8 12.5 0 0 9.5 20.0 4.2 10.8 9.0 6.7 Louisiana, Eastern 296 '/6.0 22.2 11.4 31.6 17.9 0 25.7 22.8 7.8
Louisiana, Middle 122 11.2% 20.0% 7.4% 32.0% 0% 12.4% 0% 8.8% 30.4% 3.20/0 Louisiana, Western 252 11.4 14.7 8.5 24.6 Q 25.0 12.1 25.0 16.7 152 12.1 9.2 Maine 62 16.0 8.3 14.5 14.5 21.1 15.8 9.1 Maryland 984 20.2 20.9 14.7 27.2 11.1 0 20.5 66.7 56.0 24.8 20.3 8.8 Massachusetts 287 8.9 7.7 7.8 19.2 0 5.9 8.9 100.0 15.8 10.3 2.4
Michigan, Eastern 464 20.6% 14.4% 12.9% 29.4% 0% 19.0% 100.0% 33.3% 26.8% 22.9% 7.3% Michigan, Western 128 22.2 13.2 13.0 57.9 0 16.7 19.0 100.0 33.3 11.9 4.9 Minnesota 138 10.1 10.3 9.7 25.0 0 0 10.4 17.1 8.0 6.8 Mississippi, Northern 96 12.9 9.1 8.8 21.4 12.5 0 16.0 16.1 8.6 Mississippi, Southern 130 23.4 34.8 18.0 43.6 0 26.2 0 40.0 37.1 15.2
Missouri, Eastern 123 18.1% 6.9% 8.6% 30.0% 0% 0% 15.6% 0% 33.3% 20.0% 2.6% Missouri, Western 186 15.0 21.7 10.9 30.4 16.8 100.0 25.8 26.8 2.7 Montana 113 7.8 4.3 7.2 0 7.0 33.3 6.4 25.0 4.2 0 17.2
96 Compendium of Federal Justice Statistics, 1988
I I

Table 0-5.4 Continued
Percent of offenders terminating Erobation with a new crime or technl~\i violation Total
Ethnicity offenders teminatinQ. Sex Race Non- Age
District probation Male Female White Black Other Hispanic Hispanic 16-18 19-20 21-30 31-40 Over 40
Nebraska 140 24.0% 27.8% 24.4% 30.8% 25.0% 0% 25.70/0 50.0% 43.9% 34.1% 3.8% Nevadt 390 38.2 22.0 35.4 36.4 50.0 55.6 34.8 26.3 51.1 39.0 17.5 New ~ iampshire 19 11.1 0 11.1 0 {) 11.8 0 20.0 0 New Jersey 523 15.2 13.6 9.7 35.8 0 22.7 14.2 66.7 36.4 23.0 18.4 5.1 New Mexico 160 10.7 3.4 10.6 0 0 3.8 12.0 0 0 10.0 12.5 9.4
New York, Eastern 445 23.4% 22.20/0 16.5% 40.3% 0% 0% 23.6% 0% 42.4% 26.7% 11.8% New York, Northern 95 G.9 4.3 3.8 6.3 8.7 4.0 6.8 New York, Solo.thern 875 26.4 28.6 22.8 36.0 4.3 42.9 21.5 28.6 44.1 27.9 11.5 New York, Western 192 16.3 17.5 11.5 28.3 0 0 16.3 29.6 13.8 9.2 North Carolina, Eastern 410 19.8 22.1 12.7 31.1 23.1 25.C 20.0 100.0 19.0 26.6 17.5 6.8
North Carolina, Middle 137 32.7% 27.3% 19.0% 50.0% 100.0% 31.4% ... 100.0% 39.4% 51.2% 12.5% North Carolina, Western 326 22.6 31.9 20.5 41.1 20.7 20.0 25.2 0 33.3 32.2 24.4 20.2 North Dakota 68 37.5 16.7 8.3 50.0 63.3 33.8 100.0100.0 52.0 30.4 0 Ohio, Northern 263 18.6 11.3 15.5 19.5 0 57.1 15.7 32.8 24.2 6.7 Ohi", Southern 207 11.8 12.7 10.4 18.0 0 12.1 66.7 20.8 10.1 4.3
Oklahoma, Eastern 50 11.4% 13.3% 1 0.9% 50.0% 0% 12.0% 28.6% 5.6% 0% Oklahoma, Northern 114 30.0 18.2 17.3 50.0 0 0 26.1 100.0 41.2 28.6 7.7 Oklahoma, Western 185 12.1 5.7 8.6 15.4 14.3 0 10.5 16.7 19.3 8.3 3.8 Oregon 166 34.7 31.3 30.4 66.7 55.6 25.0 34.0 40.0 54.3 36.2 15.9 Pennsylvania, Eastern 498 27.3 21.6 14.0 42.8 50.0 75.0 25.8 0 0 50.0 38.2 14.1
Pennsylvania, Middle 140 12.1% 4.20/0 8.7% 33.3% 0% 0% 10.9% 0% 12.1% 21.2% 4.5% Pennsylvania, Western 159 13.7 25.7 10.2 35.0 0 16.4 0 26.3 22.0 11.3 Puerto Rico 164 18.3 9.1 14.4 19.5 15.9 16.0 0 25.6 26.1 3.1 Rhode Island 28 7.4 0 0 28.6 0 7.7 40.0 0 0 South Carolina 213 21.9 22.6 12.7 36.0 0 22.2 50.0 40.0 25.8 8.2
South Dakota 1i9 36.6% 11.5% 15.0% 50.0% 39.0% 0% 31.60/0 60.0%80.0% 30.60/0 23.3% 11.1% Tennessee, Eastern 197 14.6 12.1 15.1 0 0 14.2 0 9.1 18.8 12.0 12.1 Tennes..c;ee, Middle 252 19.8 29.1 18.2 35.1 0 0 21.9 0 36.4 25.5 28.4 7.7 Tennessee, Western 263 17.9 21.4 11.7 25.9 0 19.1 50.0 27.8 15.2 13.9 Texas, Eastern 90 21.9 19.2 20.8 22.2 66.7 17.9 36.0 28.6 6.9
Texas, Northern 365 29.1% 30.0% 23.6% 43.7% 33.3% 28.6% 29.4% 100.0% 41.7% 32.5% 14.3% Texas, Southern 1,192 25.9 12.3 22.5 35.3 50.0 24.1 22.4 75.0 35.7 31.5 22.4 16.3 Texas, Western 719 21.5 14.4 17.4 35.7 12.5 20.4 18.8 ... 42.9 25.7 21.6 12.1 Utah 184 26.8 11.4 21.0 63.6 33.3 50.0 22.3 75.0 28.8 26.0 18.2 Vermont 35 12.9 0 11.8 0 11.4 0 11.1 11.1 16.7
Virgin Islands 79 30.9% 36.4% 7.1% 36.9% 30.0% 32.2% ... 80.0% 28.9% 36.8% 11.1% Virginia, Eastern 965 28.9 24.1 2·3.2 35.9 10.0 40.9 27.7 0 32.7 30.9 28.0 16.4 Virginia, Western 154 10.5 0 9.5 5.9 0 9.3 0 33.3 15.7 8.3 0 Washington, Eastern 114 20.2 20.0 19.2 22.2 33.3 22.2 20.0 28.9 25.7 9.4 Washington, Western 272 28.2 28.6 25.0 45.0 26.9 60.0 27.5 100.0 80.0 33.3 32.6 10.5
West Virginia, Northern 66 17.8% 0% 10.5% 22.20/0 12.1% 100.0% 17.60/0 11.5% 7.7% West Virginia, Southern 102 24.7 6.9 18.2 28.6 19.6 40.0 18.6 13.3 Wisconsin, Eastern 116 7.8 17.9 3.7 34.6 12.5 11.2 32.0 11.4 2.4 Wisconsin, Western 39 12.5 0 5.9 33.3 0 100.0 5.6 12.5 20.0 5.9 Wyoming 64 33.3 15.4 25.9 33.3 57.1 0 30.6 50.0100.0 42.1 21.7 25.0
... No cases of this type occurred in the data. See Table 5.2.
* Data describe offenders whose probation term ended in 1988 either because of a violation or because the term expired.
District tables 97

Table 0-5.4 continued. Offenders terminating probation with a new crlmo or technical violation, 1988
Percent of offenders terminating probation with a new crime or technical violation
Prior criminal record
Prior adult convictions Drug abuse Total Incarceration offenders Employment at arrest Known No
terminatin,p Juvenile No jail 1 year OVer drug known District probation Employed Unemployed None only or prison or less 1 year history abuse
All districts 24,757 20.9% 34.0% 16.0% 43.1% 27.4% 41.6% 46.0% 46.9% 18.3%
Alabama, Middle 150 13.6% 35.7% 7.0% 40.0% 22.9% 14.3% 50.0% 40.0% 14.9% Alabama, Northern 324 16.3 24.4 12.5 44.4 19.8 18.2 25.0 46.4 14.4 Alabama, Southern 109 37.2 30.0 20.7 75.0 29.4 100.0 66.7 80.0 27.7 Alaska 70 20.5 6.7 6.8 50.0 22.2 33.3 66.7 50.0 8.5 Arizona 501 24.5 41.3 .22.5 41.9 24.7 56.5 44.1 55.1 24.6
Arkansas, Eastern 105 8.1% 25.0% 4.2% 33.3% 20.8% 0% 40.0% 14.3% 11.5% Arkansas, Western 89 21.2 31.6 4.5 66.7 32.1 100.0 40.0 71.4 19.2 California, Central 1,107 30.5 40.3 20.9 54.S 29.0 58.9 54.3 66.9 24.9 California, Eastern 375 26.8 46.2 17.2 50.0 28.3 46.7 44.1 49.5 23.9 California, Northern 655 19.2 46.7 17.3 53.6 24.8 40.0 47.4 43.9 19.8
California, Southern 1,097 36.0% 47.8% 38.7% 57.4% 43.5% 54.8% 48.7% 59.8% 31.5% Colorado 285 18.4 31.0 17.1 40.0 21.9 29.4 58.3 33.3 18.2 Connecticut 172 13.4 29.4 7.7 28.6 25.8 12.5 38.1 35.9 10.5 Delaware 41 28.6 16.7 18.2 50.0 10.0 33.3 50.0 50.0 23.3 District of Columbia 433 28.2 43.9 23.2 60.0 34.7 30.8 61.9 49.3 20.6
Florida, Middle 383 23.8% 37.7% 13.0% 62.5% 33.3% 44.4% 43.2% 56.4% 20.1% Florida, Northern 204 25.5 25.0 27.0 37.5 23.5 50.0 50.0 64.3 19.8 Florida, Southern 740 24.1 36.0 20.1 53.8 36.0 46.4 54.8 55.2 21.9 Georgia, Middle 296 14.9 21.4 9.2 33.3 13.5 28.6 53.8 100.0 14.2 Georgia, Northern 415 23.2 38.2 16.7 25.0 37.4 26.3 48.6 54.8 22.6
Georgia, Southern 125 31.9% 25.0% 15.3% 83.3% 30.3% 100.0% 55.6% 61.1% 25.0% Guam 30 3.3 0 0 0 100.0 3.3 Hawaii 129 14.9 25.0 6.6 33.3 21.4 100.0 66.7 43.8 11.5 Idaho 92 24.2 20.0 12.5 37.5 37.5 33.3 33.3 47.1 16.9 Illinois, Central 123 23.5 28.6 15.5 50.0 45.0 0 53.8 37.5 20.0
Illinois, Northern 706 18.0% 26.5% 10.1% 42.1% 26.8% 30.0% 45.9% 58.5% 13.9% Illinois, Southern 117 15.8 33.3 9.4 0 11.8 25.0 77.8 33.3 15.8 Indiana, Northern 104 19.1 14.8 16.1 25.0 20.0 28.6 27.3 33.3 16.3 Indiana, Southern 215 11.3 21.9 4.7 25.0 19.6 20.0 50.0 18.2 12.1 Iowa, Northern 58 6.3 12.5 10.8 0 0 33.3 0 16.7 4.5
Iowa, Southern 45 9.8% 0% 0% 33.3% 18.2% 0% 33.3% 42.9% 2.8% Kansas 163 17.4 34.6 10.6 0 25.0 42.9 57.1 30.0 17.9 Kentucky, Eastern 95 11.1 40.0 2.1 33.3 31.3 25.0 0 45.5 11.9 Kentucky, Western 469 7.5 19.1 7.3 8.3 17.5 50.0 14.3 36.4 8.3 Louil>iana, Eastern 296 16.6 31.5 9.0 20.0 36.7 41.7 52.6 29.7 19.9
Louisiana, Middle 122 17.1% 53.8% 1.1% 60.0% 33.3% 100.0% 55.6"/0 66.7% 9.1% Louisiana, Western 252 17.9 16.3 10.8 22.2 12.5 0 60.0 26.7 16.3 Maine 62 15.4 16.7 3.0 33.3 26.1 0 50.0 7.7 17.8 Maryland 984 20.0 23.2 18.7 42.9 20.9 10.7 42.4 39.4 13.7 Massachusetts 287 6.8 16.7 1.3 12.5 14.7 0 27.8 19.6 6.6
Michigan, Eastern 464 16.6% 29.5% 14.0% 37.5% 26.3% 29.4% 33.3% 44.6"10 14.1% Michigan, Westem 128 11.7 42.9 11.8 50.0 9.7 81.8 37.5 20.0 17.1 Minnesota 138 9.8 20.0 5.3 60.0 7.4 42.9 25.0 15.8 9.6 Mississippi, Northern 96 3.6 33.3 13.1 10.0 0 0 6.7 Mississippi, Southern 130 20.0 44.1 16.4 66.7 41.4 40.0 25.0 72.7 22.4
Missouri, Eastern 123 17.9% 22.2% 11.3% 33.3% 26.7% 0% 25.0% 20.0% 18.5% Missouri, Western 186 16.6 14.3 11.1 20.0 16.9 25.0 38.9 27.7 11.9 Montana 113 7.8 5.0 7.2 0 4.8 0 20.0 20.0 5.7
98 Compendium of Federal Justice Statistics, 1988
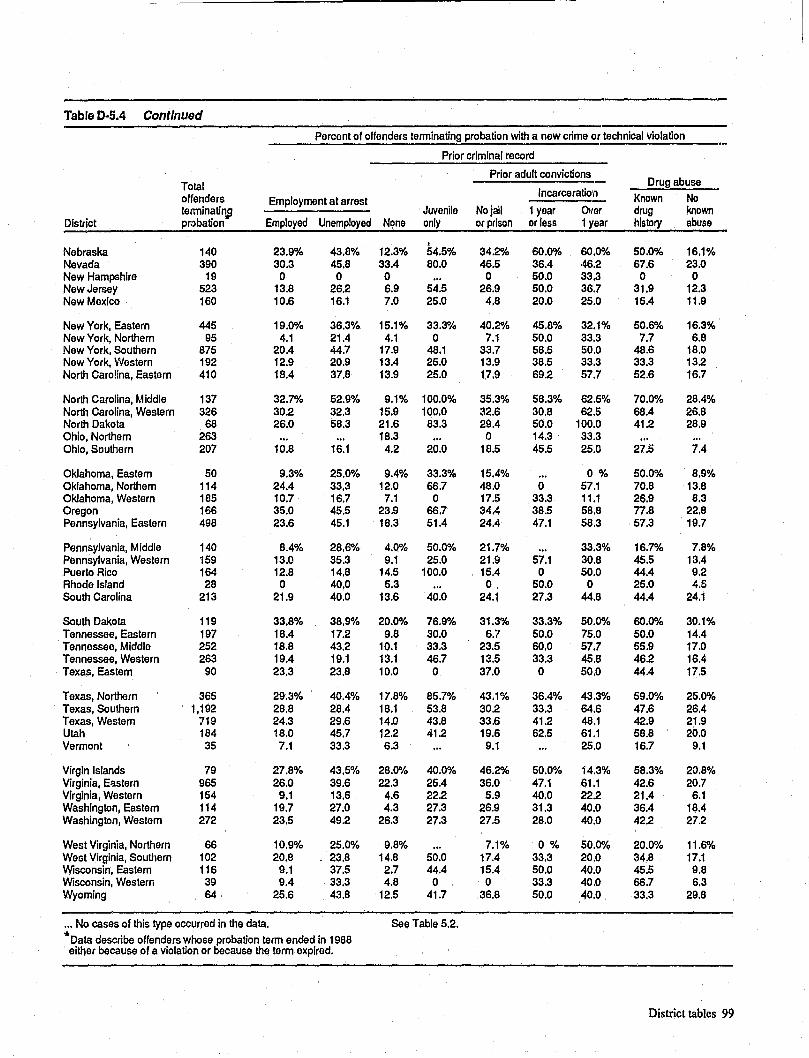
TabJeO-5.4 Continued
Percent of offenders terminating probation with a new crime or technical violation
Prior criminal record
Prior adult convictions Drug abuse Total Incarceration offenders Employment at arrest Known No
tennlnatin,.g Juvenile No jail 1 year Over drug known District probation Employed Unemployed None only or prison or less 1 year history abuse
, Nebraska 140 23.9% 43.8% 12.3% 54.5% 34.2% 60.0% 60.0% 50.0% 16.1% Nevada 390 30.3 45.8 33.4 80.0 46.5 36.4 ·46.2 67.6 23.0 New Hampshire 19 0 0 0 0 50.0 33.3 0 0 New Jersey 523 13.8 26.2 6.9 54.5 26.9 50.0 36.7 31.9 12.3 New Mexico 160 10.6 16.1 7.0 25.0 4.8 20.0 25.0 15.4 11.9
New York, Eastern 445 19.0% 36.3% 15.1% 33.3% 40.2% 45.8% 32.1% 50.6"k 16.3% New York, Northern 95 4.1 21.4 4.1 0 7.1 50.0 33.3 7.7 6.8 New York, Southern 875 20.4 44.7 17.9 48.1 33.7 58.5 50.0 48.6 18.0 New York, Western 192 12.9 20.9 13.4 25.0 13.9 38.5 33.3 33.3 13.2 North Carolina, Eastern 410 18.4 37.8 13.9 25.0 17.9 69.2 57.7 52.6 16.7
North Carolina, Middle 137 32.7% 52.9% 9.1% 100.0% 35.3% 58.3% 62.5% 70.0% 28.4% North Carolina, Western 326 30.2 32.3 15.9 100.0 32.6 30.8 62.5 68.4 26.8 North Dakota 68 26.0 58.3 21.6 83.3 29.4 50.0 100.0 41.2 28.9 Ohio, Northern 263 18.3 0 14.3 33.3 Ohio, Southern 207 10.8 16.1 4.2 20.0 18.5 45.5 25.0 27.5 7.4
Oklahoma, Eastern 50 9.3% 25.0% 9.4% 33.3% 15.4% 0% 50.0% 8.9% Oklahoma, Northern 114 24.4 33.3 12.0 66.7 48.0 0 57.1 70.8 13.8 Oklahoma, Western 185 10.7 16.7 7.1 0 17.5 33.3 11.1 26.9 B.3 Oregon 166 35.0 45.5 23.9 66.7 34.4- 38.5 58.8 77.8 22.8 Pennsylvania, Eastern 498 23.6 45.1 18.3 51.4 24.4 47.1 58.3 57.3 19.7
Pennsylvania, Middle 140 8.4% 28.6"k 4.Q% 50.0% 21.7% 33.3% 16.7% 7.8% Pennsylvania, Western 159 13.0 35.3 9.1 25.0 21.9 57.1 30.8 45.5 13.4 Puerto Rico 164 12.8 14.8 14.5 100.0 15.4 0 50.0 44.4 9.2 Rhode Island 28 0 40.0 5.3 0 50.0 0 25.0 4.5 South Carolina 213 21.9 40.0 13.6 40.0 24.1 27.3 44.8 44.4 24.1
South Dakota 119 33.8% 38.9% 20.0% 76.9% 31.3% 33.3% 50.0% 60.0% 30.1% Tennessee, Eastern 197 18.4 17.2 9.8 30.0 6.7 50.0 75.0 50.0 14.4 Tennessee, Middle 252 18.8 43.2 10.1 33.3 23.5 60.0 57.7 55.9 17.0 Tennessee, Western 263 19.4 19.1 13.1 46.7 13.5 33.3 45.8 46.2 16.4 Texas, Eastern 90 23.3 23.8 10.0 0 37.0 0 50.0 44.4 17.5
Texas, Northern 365 29.3% 40.4% 17.8% 85.7% 43.1% 36.4% 43.3% 59.0% 25.0% Texas, Southern 1,192 28.8 28.4 18.1 53.8 30.2 33.3 64.6 47.6 26.4 Texas, Western 719 24.3 29.6 14.0 43.8 33.6 41.2 48.1 42.9 21.9 Utah 184 18.0 45.7 12.2 41.2 19.6 62.5 61.1 58.8 20.0 Vermont 35 7.1 33.3 6.3 9.1 25.0 16.7 9.1
Virgin Islands 79 27.8% 43.5% 28.0% 40.0% 46.2% 50.0% 14.3% 58.3% 20.8% Virginia, E<lstern 965 26.0 39.6 22.3 25.4 36.0 47.1 61.1 42.6 20.7 Virginia, Western 154 9.1 13.6 4.6 22.2 5.9 40.0 22.2 21.4 6.1 Washington, Eastern 114 19.7 27.0 4.3 27.3 26.9 31.3 40.0 36.4 18.4 Washington, Western 272 23.5 49.2 26.3 27.3 27.5 28.0 40.0 42.2 27.2
West Virginia, Northern 66 10.9% 25.0% 9.8% 7.1% 0% 50.0% 20.0% 11.6% West Virginia, Southern 102 20.8 23.8 14.8 50.0 17.4 33.3 20.0 34.8 17.1 Wisconsin, Eastern 116 9.1 37.5 2.7 44.4 15.4 50.0 40.0 45.5 9.8 Wisconsin, Western 39 9.4 33.3 4.8 0 0 33.3 40.0 66.7 6.3 Wyoming 64 25.6 43.8 12.5 41.7 36.8 50.0 40.0 33.3 29.8
... No cases of this type occurred in the data. See Table 5.2.
* Data describe offenders whose probation teml ended in 1988 either because of a violation or because the term expired.
District tables 99

Table 0-5.5 Offenders terminating parole with a new crime, by anginal offense. 1988
Percent of offenders terminating parole with a new crimea
Original offense Total Property Public order offenses termingting Any Drug
District parole offense Violent Fraudulent Other offenses Regulatory . Other
All districts 10,032 18.3% 34.0% 16.8% 26.2% 13.4% 9.2% 15.4%
Alabama, Middle 35 11.4% 0% 12.5% 0% 15.8% 0% Alabama, Northern 77 22.1 36.4 21.4 22.2 18.8 18.2 Alabama, Southern 56 17.9 16.7 20.0 45.5 8.7 0 Alaska 15 13.3 50.0 0 9.1 Arizona 146 19.2 44.8 14.3 18.2 12.3 50.0 5.9
Arkansas, Eastern 57 17.5% 30.0% 33.3% 0% 15.4% 0% Arkansas, Western 20 20.0 50.0 25.0 50.0 IJ 100.0 0 California, Central 454 14.8 18.0 26.0 14.7 10.9 0 9.7 California, Eastern 128 13.3 21.6 25.0 28.6 4.7 0 California, Northern 166 21.1 37.0 20.0 38.1 10.3 50.0
California, Southern 133 12.8% 18.8% 11.1% 33.3% 11.7% 0% 11.5% Colorado 105 26.7 36.4 21.1 58.3 12.8 60.0 Connecticut 44 18.2 20.0 0 16.7 22.7 0 Delaware 13 30.8 25.0 66.7 0 20.0 District of Columbia 611 27.7 36.7 21.9 35.1 19.5 0 36.4
Florida, Middle 313 17.9% 48.1% 15.4% 31.3% 13.5% 0% 4.8% Florida, Northern 107 17.8 9.1 20.0 42.9 17.3 0 0 Florida, Southern 792 9.2 26.3 11.3 10.0 8.2 0 15.6 Georgia, Middle 48 33.3 61.5 25.0 20.0 30.0 0 Georgia, Northern 151 23.2 46.4 17.4 21.9 16.7 33.3 11.8
Georgia, Southern 60 10.0% 40.0'''10 7.7% 11.1% 4.2"k 11.1% Hawaii 31 3.2 33.3 0 0 0 Idaho 20 30.0 66.7 0 66.7 16.7 0 Illinois, Central 42 16.7 0 15.4 33.3 13.3 0 50.0 Illinois, Northern 181 20.4 35.0 15.4 20.0 19.6 0 20.0
Illinois, Southern 39 7.7% 100.0% 0% 0% 0% 40.0% Indiana, Northern 75 24.0 57.1 6.3 33.3 25.0 50.0 0 Indiana, Southern 61 34.4 58.8 62.5 30.0 13.0 0 0 Iowa, Northern 16 43.8 60.0 33.3 33.3 50.0 Iowa, Southern 29 13.8 0 33.3 14.3 7.1 33.3
Kansas 56 28.6% 55.6% 20.0% 27.3% 23.1% 20.0% Kentucky, Eastern 68 13.2 23.1 16.7 0 13.6 0 11.1 Kentucky, Western 62 11.3 33.3 0 0 0 0 22.2 Louisiana, Eastern 127 20.5 42.1 20.0 26.7 14.1 0 25.0 Louisiana, Middle 23 8.7 0 0 20.0 11.1 0
loUisiana, Western 38 15.8% 37.5% 20.0% 0% 9.1% 0% Maryland 279 21.9 38.5 20.0 26.5 13.6 0 11.8 Massachusetts 145 15.2 26.3 0 50.0 14.0 0 0 Michigan, Eastern 258 19.0 38.1 12.1 18.2 16.9 0 9.1 Michigan, Western 34 23.5 33.3 20.0 20.0 25.0 0
Minr.asota 115 18.3% 33.3% 14.3% 33.3% 16.5% 0% Mississippi, Northern 29 20.7 0 30.0 33.3 50.0 Mississippi, Southern 49 28.6 33.3 28.6 30.8 23.5 0 40.0 Missouri, Eastern 186 25.3 50.0 36.0 25.8 16.7 33.3 30.8 Missouri, Western 98 21.4 40.0 19.0 33.3 11.9 0 20.0
100 Compendium of Federal Justice Statistics, 1988

Table D-S.S Continued
Percent of offe~ders terminating parole with a new crimea
Original offense Total Property Public order offenses tennlneting Any Drug
District parole offense Violent Fraudulent Other offenses Regulatory Other
Nebraska 28 25.0% 0% 33.3% 50.0% 13.3% 0% 100.0% Nevada 44 11.4 28.6 12.5 0 10.5 0 New Jersey 144 13.2 33.3 6.3 30.S 5.6 0 11.1 New Mexico 98 18.4 0 7.1 25.0 28.3 0 12.0 New York, Eastern 330 12.4 32.5 10.8 23.8 9.2 0 0
New York, Northern 27 18.5% 28.6% 0% 33.3% 15.4% 0% 0% New York, Southern 382 16.8 21.1 10.0 20.0 16.7 0 '12.5 New York, Western 53 13.2 11.1 25.0 18.8 9.1 0 0 North Carolina, Eastern 65 32.3 50.0 38.4 44.4 11.8 0 25.0 North Carolina, Middle 96 28.1 47.8 29.2 11.1 24.2 0
North Carolina, Western 96 20.8% 31.8% 19.0% 25.0% 12.5% 0% North Dakota 26 3.8 0 0 0 0 33.3 Ohio, Northern 108 26.9 36.6 25.0 20.0 20.7 0 20.0 Ohio, Southern 115 37.4 59.0 33.3 58.3 14.6 0 33.3 Oklahoma, Eastern 30 26.7 0 33.3 11.1 40.0 50.0
Oklahoma, Northern 43 18.6% 0% 0% 55.6% 0.0% 33.3% Oklahoma, Western 91 19.8 42.9 4.3 44.4 16.7 100.0 22.2 Oregon 57 24.6 27.6 50.0 50.0 11.8 20.0 Pennsylvania, Eastern 146 5.5 13.3 0 0 5.6 0 0 Pennsylvania, Middle 28 3.6 0 0 0 7.7 0
Pennsylvania, Western 101 18.8% 34.6% 27.3% 0% 14.0,% 0% 0% Puerto Rico 154 11.7 0 6.3 23.1 10.3 0 16.7 Rhode Island 24 20.8 0 0 35.7 0 South Carolina 119 21.0 47.4 24.0 29.2 4.8 0 14.3 South Dakota 42 42.9 73.3 33.3 30.0 25.0 0
Tennessee, Eastern 76 18.4% 16.7% 11.8% 36.4% 10.5% 0% 50.0% Tennessee, Middle 60 25.0 50.0 30.8 14.3 18.2 40.0 Tennessee, Western 47 17.0 50.0 13.7 33.3 8.3 0 Texas, Eastern 48 22.9 25.0 17.6 30.0 23.1 100.0 0 Texas, Northern 325 17.5 40.0 11.9 34.6 13.1 21.4 19.6
Texas, Southern 527 18.2% 36.8% 17.5% 34.6% 18.8% 0 11.8% Texas, Westem 396 13.4 16.7 14.6 17.1 13.2 0 10.8 Utah 15 26.7 28.6 0 0 50.0 0 Vermont 9 22.2 100.0 0 0 25.0 0 Virgin Islands 48 6.3 14.3 0 0 0 0
Virginia, Eastern 142 28.9% 52.9% 30.0% 50.0% 14.9% 0% 15.4% Virginia, Western 31 29.0 66.7 0 50.0 20.0 0 16.7 Washington, Eastern 14 7.1 0 0 11.1 0 Washington, Western 88 15.9 32.0 5.9 0 10.8 33.3 0 Wast Virginia, Northern 23 4.3 0 0 B.3 0
West Virginia, Southern 31 19.4% 20.0% 0% 25.0% 17.6"10 33.3% Wisconsin, Eastern 37 24.3 33.3 42.9 28.6 0 Wisconsin, Western 15 13.3 0 0 0 0 100.0 Wyoming 7 14.3 100.0 0 0 0
Note: Original offenses are classified by most serious offense of conviction. bOata describe offenders whose parole terms ended in 1988 ... No cases of this type occurred in the data. either because of a violation or because the term expired •
alncludes both "major" and "minor" offenses. See Text Table 5.3.
District tables 101

Table 0-5.6 Offenders terminating parole with a new crime or technical violation, by original offense, 1998
Percent of offenders terminating parole with a neW crime or technical violation
Original offense Total Property Public order offenses tennln~ting Any Drug
District parole offense Violent Fraudulent Other offenses Regulatory Other
All districts 10,032 41.3% 64.7% 38.3% 53.20/ .. 35.0% 28.3% 31.0%
Alabama, Middle 35 17.1% 25.0% 12.5% 0% 21.1% 0% Alabama, Northern 77 40.3 54.5 35.7 44.4 37.5 36.4 Alabama, Southern 56 35.7 16.7 60.0 54.5 21.7 33.3 Alaska 15 20.0 50.0 0 ... 18.2 Arizona 146 43.8 75.9 42.9 45.5 37.0 50.0 17.6
Arkansas, Eastern 57 33.3% 30.0% 44.4% 33.3% 34.6% 0% Arkansas, Western 20 30.0 50.0 50.0 50.0 11.1 100.0 0 California, Central 454 45.4 67.7 44.0 52.9 33.8 0 25.8 California, Eastern 128 53.9 67.6 56.3 57.1 48.4 0 California, Northern 166 43.4 74.1 32.0 81.0 25.3 83.3
California, Southern 133 48.9% 81.3% 88.9% 33.3% 48.1% 50.0% 19.20/" Colorado 105 48.6 68.2 47.4 75.0 31.9 60.0 Connecticut 44 29.5 40.0 0 50.0 27.3 0 Delaware 13 53.8 75.0 66.7 100.0 20.0 District of Columbia 611 76.9 70.0 71.9 83.0 79.1 0 81.8
Florida, Middle 313 38.7% 81.5% 38.5% 59.4% 30.20/0 D% 33.3% Florida, Northern 107 30.8 63.6 30.0 57.1 25.3 0 0 Florida, Southern 792 28.0 63.2 34.0 50.0 25.5 20.0 33.3 Georgia, Middle 48 47.9 76.9 37.5 40.0 40.0 25.0 Georgia, Northern 151 46.4 75.0 43.5 53.1 22.9 66.7 52.9
Georgia, Southern 60 43.3% eo.O% 53.8% 66.7% 25.0% 33.3% Hawaii 31 25.8 33.3 66.7 20.8 0 Idaho 20 70.0 66.7 100.0 100.0 66.7 0 Illinois, Central 42 38.1 40.0 38.5 33.3 33.3 0 75.0 Illinois, Northern 181 38.1 70.0 34.6 45.0 33.0 33.3 26.7
Illinois, Southern 39 20.5% 100.0% 0% 0% 22.7% 40.0% Indiana, Northern 75 48.0 57.1 31.3 66.7 47.2 50.0 60.0 Indiana, Southern 61 34.4 58.8 62.5 30.0 13.0 0 0 Iowa, Northern 16 43.8 60.0 33.3 33.3 50.0 Iowa, Southern 29 24.1 0 33.3 28.6 21.4 33.3
Knnsas 56 53.6% 100.0% 40.0% 36.4% 53.8% 20.0% Kentucky, Eastern 68 25.0 53.8 33.3 0 18.2 0 22.2 Kentucky, Western ~ 30.6 66.7 25.0 20.0 8.3 0 44.4 Louisiana, Eastern 127 43.3 57.9 60.0 53.3 33.8 66.7 25.0 Louisiana, Middle 23 34.8 0 33.3 60.0 22.2 50.0
Louisiana, Western 38 26.3% 75.0% 30.0% 0% 9.1% 0% Maryland 279 49.5 64.6 60.0 55.1 37.6 33.3 52.9 Massachusetts 145 24.8 47.4 33.3 50.0 21.1 0 0 Michigan, Eastern 258 36.0 64.3 21.2 31.8 33.1 0 31.8 Michigan, Western 34 35.3 50.0 40.0 40.0 31.3 0
Minnesota 115 34.8% 33.3% 28.6% 55.6% 35.4% 12.5% Mississippi, Northern 29 20.7 0 30.0 33.3 50.0 MissiSSippi, Southern 49 40.8 33.3 28.6 69.2 29.4 0 40.0 Missouri, Eastern 186 48.9 72.2 48.0 41.9 47.9 33.3 46.2 Missouri, Western 98 43.9 75.0 38.1 44.4 35.7 0 20.0 Montana 14 14.3 0 0 33.3 16.7 0 0
102 Compendium of Federal Justice Statistics, 1988

Table 0-5.6 Continued
Percent of offenders terminatlng parole with a new crime or technical violation
Original offense Total Property Public order offenses termin~ting Any Drug
District parole offensa Violent Fraudulent Other offenses Regulatory Other .. _f_ .... _ Nebraska 28 46.4% 50.0% 33.3% 50.0% 40.0% 100.0% 100.0% Nevada 44 38.6 71.4 50.0 60.0 21.1 20.0 New Jersey 144 31.3 79.2 18.8 69.2 15.5 0 16.7 New Me)(ico 98 29.6 42.9 14.3 25.0 39.1 50.0 16.0 New York, Eastern 330 33.9 1)7.5 21.6 61.9 28.0 25.0 23.5
New York, Northem 27 25.9% 42.9% 0% 68.7% 15.4% 0% 0% New York, Southern 382 51.3 63.2 25.0 60.0 52.5 , 12.5 New York, Western 53 20.8 22.2 25.0 37.5 9.1 0 0 North Carolina, Eastern 65 44.6 61.1 54.5 68.7 11.0 0 50.0 North Carolina, Middle 96 43.8 60.9 37.5 44.4 36.4 42.9
North Carolina, Western 96 39.6% 59.1% 42.9% 41.7% 25.00k 0% North Dakota 26 19.2 20.0 0 25.0 22.2 33.3 Ohio, Northem 108 43.5 68.3 33.3 40.0 20.7 0 20.0 Ohio, Southern 115 51.3 74.4 58.3 68.7 29.3 0 33.3 Oklahoma, Eastem ao 50.0 100.0 33.3 22.2 60.0 50.0
Oklahoma, Northem 43 41.9% 0% 0% 77.8% 36.00k 68.7% Oklahoma, Western 91 34.1 57.1 30.4 66.7 23.8 100.0 33.3 Oregon 57 56.1 75.9 100.0 75.0 23.5 20.0 Pennsylvania, Eastern 146 28.1 60.0 0 40.0 27.1 50.0 0 Pennsylvania, Middle 28 14.3 12.5 0 0 15.4 50.0
Pennsylvania, Western 101 33.7% 57.7% 36.4% 50.0% 24.0010 0% 20.00k Puerto Rico 154 29.2 0 43.8 61.5 16.1 0 16.7 Rhode Island 24 25.0 0 0 42.0 0 South Carolina 119 35.3 73.7 44.0 37.5 16.7 0 14.3 South Dakota 42 59.5 86.7 33.3 50.0 50.0 33.3
Tennessee, Eastern 76 28.9% 50.0% 11.8% 36.4% 10.5% 0% 50.0% Tennessee, Middie 60 43.3 66.7 61.5 28.6 36.4 40.0 Tennessee, Western 47 27.7 87.5 16.7 33.3 16.7 0 Texas, Eastem 48 47.9 75.0 47.1 60.0 38.5 100.0 0 Te)(as, Northern 325 47.4 75.0 46.4 69.2 43.1 71.4 31.4
Texas, Southem 527 37.6% 57.9% 40.0% 57.7% 39.9% 42.9% 23.6% Te)(as, Westem 396 49.7 50.0 50.0 68.3 54.2 0 24.6 Utah 15 46.7 71.4 0 0 50.0 0 Vermont 9 22.2 100.0 0 0 25.0 0 Virgin Islands 48 10.4 19.0 0 10.0 0 0
Virginia, Eastern 142 44.4% 82.4% 70.0% 56.3% 20.9% 0% 38.5% Virginia, Western 31 32.3 66.7 0 66.7 20.0 0 16.7 Washington, Eastem 14 42.9 66.7 100.0 33.3 0 Washington, Westem 88 45.5 56.0 47.1 100.0 43.2 33.3 0 West Virginia, Northern 23 4.3 0 0 8.3 0
West Virginia, Southem 31 32.3% 40.0% 0% 75.0% 23.5% 33.3% Wisconsin, Eastem 37 40.5 83.3 42.9 28.6 0 Wisconsin, Western 15 20.0 0 0 0 100.0 100.0 Wyoming 7 28.6 100.0 50.0 0 0
Note: Original offenses are classified by most serious offense of conviction.
'" Data describe offenders whose parole terms ended in 1988 either because of a violation or Decause the term e)(pired.
... No cases of this type occurred in the data. See Te)(tTable 5.3 .
District tables 103

Table 0-5.7 Offenders terminating parole with a new crime, by offender characteristics, 1988
Percent of offenders terminati!:!!l ~role with a new crimea Total Ethniclty offenders termingting Sex Race Non· Age
District parole Male Female White Black Other Hispanic Hispanic 16-18 19·20 21·30 31·40 Over 40
All districts 10,032 19.1% 9.4% 15.1% 24.1% 23.7% 13.8% 19.3% 25.0% 23.8% 20.5% 18.7% 15.4%
Alabama, Middle 35 9.4% 33.3% 13.6% 7.7% 11.4% 37.5% 0% 16.7% Alabama, Northern 77 21.1 33.3 29.8 10.3 0 22.1 18.2 27.0 21.7 Alabama, Southern 56 14.3 42.9 11.4 28.6 17.9 20.0 28.6 12.5 Alaska 15 14.3 0 0 0 66.7 0 16.7 0 50.0 0 16.7 Arizona 146 19.9 0 15.7 18.2 50.0 8.5 24.2 100.0 20.5 16.0 11.9
Arkansas, Eastern 57 17.3% 20.0% 12.5% 29.4% 100.0% 16.1% 21.4% 13.0% 21.1% Arkansas, Western 20 22.2 0 13.3 40.0 0 21.1 66.7 14.3 0 California, Central 454 15.7 5.0 14.5 167 0 13.7 15.1 0 17.9 12.7 13.8 California, Eastern 128 14.3 6.3 10.8 25.0 0 12.5 13.3 22.2 10.0 8.9 California, Northern 166 19.6 33.3 16.7 32.6 20.0 7.7 22.4 19.0 18.2 24.6
Califomia, Southern 133 13.2% 8.3% 12.5% 15.0% 0% 18.5% 8.9% 0% 0%19.4% 11.7% 6.1% Colorado 105 29.8 0 22.6 42.9 28.6 26.4 26.7 25.7 25.0 Connecticut 44 19.0 0 10.7 31.3 25.0 15.8 25.0 26.7 0 Delaware 13 30.8 14.3 50.0 30.8 0 25.0 66.7 District of Columbia 611 28.9 14.8 43.8 27.4 0 25.0 27.7 30.0 28.2 22.3
Florida, Middle 313 10.6% 5.6% 17.4% 19.7% 0% 22.20/0 17.8% 16.7% 19.1% 17.4% Florida, Northern 107 18.1 15.4 17.5 18.5 0 18.1 22.7 18.4 14.3 Florida, Southern 792 9.8 0 9.8 6.5 0 9.1 9.4 9.7 9.3 9.0 Georgia, Middle 48 29.5 75.0 16.7 50.0 33.3 57.1 43.8 16.7 Georgia, Northern 151 24.8 0 25.8 19.0 0 23.3 27.3 34.0 13.6
Georgia, Southern 60 11.1% 0% 6.7% 13.3% 10.0% 10.5% 12.5% 5.9% Hawaii 31 0 25.0 5.0 0 0 3.4 20.0 0 0 Idaho 20 26.3 100.0 25.0 0 66.7 0 35.3 100.0 66.7 12.5 16.7 Illinois, Central 42 17.9 0 12.1 33.3 17.1 25.0 21.1 0 "'inois, Northern 181 21.4 7.7 17.8 24.1 33.3 19.5 30.0 18.1 19.0
Illinois, Southern 39 8.8% 0% 10.3% 0% 0% 8.1% 0% 9.5% 0% Indiana, Northern 75 23.9 25.0 14.3 36.4 0 24.2 16.7 34.5 13.3 Indiana, Southern 61 35.6 0 31.8 41.2 34.4 33.3 43.5 25.9 Iowa, Northern 16 46.7 0 38.5 50.0 100.0 0 46.7 0 57.1 66.7 Iowa, Southern 29 14.3 0 13.6 14.3 13.8 12.5 7.1 28.6
Kansas 56 26.4% 66.7% 22.2% 40.0% 50.0% 27.8% 30.0% 23.3% 35.7% Kentucky, Eastern 68 13.6 0 14.1 0 13.4 25.0 25.0 0 Kentucky, Western 62 11.7 0 8.5 20.0 11.3 8.3 13.0 9.1 Louisiana, Eastern 127 21.2 11.1 12.3 29.0 20.5 15.4 24.1 17.9 Louisiana, Middle 23 9.5 0 7.1 0 8.7 0 14.3 0
Louisiana, Western 38 17.1% 0% 14.3% 17.6% 0% 16.7% 20.0% 13.3% 20.0% Maryland 279 23.0 5.6 16.5 24.3 0 21.6 20.4 24.4 15.4 Massachusetts 145 15.8 0 16.1 9.5 22.2 14.3 13.3 19.3 11.3 Michigan, Eastern 258 21.9 0 15.6 23.6 0 0 19.2 20.4 17.3 19.3 Michigan, Western 34 25.0 0 27.3 18.2 0 100.0 21.2 66.7 23.5 16.7
Minnesota 115 18.3% 16.7% 15.1% 28.0% 25.0% 28.60/0 17.8% 19.0% 22.8% 11.4% Mississippi, Northern 29 20.7 27.8 9.1 20.7 0 20.0 25.0 Mississippi, Southern 49 28.3 33.3 17.4 41.7 0 28.6 15.4 36.0 33.3 Missouri, Eastern 186 27.4 5.6 21.1 28.4 0 0 25.4 30.2 24.4 21.4 Missouri, Western 98 21.3 25.0 15.1 27.9 50.0 21.6 0 13.3 21.1 23.7
1 04 Compendium of F ed.eral Justice Statistics, 1988

Tabla 0-5.7 Continued
Percent of offenders terminating parole with a new crimea Total
Ethnicill offenders tormlneting Sex Race Non- Age
District parole Male Female White Black Other Hispanic Hispanic 16-18 19-20 21-30 31-40 Over 40
Nebraska 28 22.2% 100.0% 20.0% 37.5% 25.0% 14.3% 38.5% 14.3% Nevada 44 12.5 0 6.5 25.0 0 33.3 9.8 222 16.7 0 New Jersey 144 13.9 0 6.7 23.6 0 14.0 20.0 6.9 10.2 New Mexico 98 19.6 0 18.9 20.0 0 21.9 16.7 100.0 14.3 27.0 10.7 New York, Eastern 330 13.1 4.2 6.1 24.3 0 0 12.2 0 19.0 9.5 9.6
New York, Northern 27 16.7% 33.3% 20.8% 0% 18.5% 50.0% 10.0% 16.7% New York, Southern 382 16.9 14.3 15.7 182 0 19.1 15.2 50.0 0 19.1 17.7 9.8 New York, Western 53 14.9 0 9.1 20.0 0 14.9 15.4 16.0 7.1 North Carolina, Eastern 65 32.1 33.3 23.3 39.4 50.0 32.8 44.4 28.6 29.2 North Carolina, Middle 96 27.3 37.5 20.9 32.7 100.0 28.1 36.8 28.9 20.0
North Carolina, Western 96 21.2% 18.20/0 19.6% 25.0% 0% 50.0% 20.7% 19.2% 33.3% 10.7% North Dakota 26 4.2 0 5.3 0 ... 3.8 0 0 10.0 0 Ohio, Northern 108 28.3 11.1 21.0 34.8 50.0 26.7 25.0 37.0 7.7 Ohio, Southern 115 39.1 0 30.9 45.7 100.0 37.4 58.3 38.6 26.1 Oklahoma, Eastern 30 26.7 29.2 25.0 0 26.7 0 46.7 8.3
Oklahoma, Northern 43 20.5% 0% 21.4% 14.3% 0% 18.6% 12.5% 17.6% 22.2% Oklahoma, Western 91 21.4 0 17.6 31.3 0 0 20.5 17.4 12.5 25.8 Oregon 57 24.1 33.3 21.3 40.0 0 25.5 50.0 20.8 20.8 Pennsylvania, Eastern 146 5.1 11.1 1.4 9.2 50.0 4.9 8.0 3.3 7.7 Pennsylvania, Middle 28 3.8 0 4.8 0 3.6 0 7.1 0
Pennsylvania, Western 101 19.8% 0% 10.3% 28.6% 100.0% 18.20/0 0% 11.6% 25.0% Puerto Rico 154 12.7 0 14.3 4.9 11.4 15.0 10.2 12.5 11.4 Rhode Island 24 23.8 0 20.8 ... 33.3 16.7 0 27.3 18.2 South Carolina 119 2~.3 0 15.3 30.4 0 21.2 37.5 16.7 11.1 South Dakota 42 43.9 0 14.3 57.1 42.9 33.3 40.0 35.7 55.6
Tennessee, Eastern 76 20.3% 0% 19.1% 12.5% 18.4% 50.00;" 14.3% 11.4% Tennessee, Middle 60 25.9 16.7 16.2 39.1 0 25.4 25.0 12.5 32.4 Tennessee, Western 47 19.0 0 7.4 30.0 100.0 15.2 0 16.0 25.0 Texas, Eastern 48 23.3 20.0 16.7 29.2 50.0 21.7 44.4 19.0 17.6 Texas, Northern 325 19.7 4.3 17.0 18.6 0 13.7 18.2 21.1 13.7 18.4%
Texas, Southern 527 18.8% 7.4% 16.8% 32.7% 0% 15.2% 24.5% 0% 0% 15.3% 20.2% 19.0% Texas, Western 396 13.9 8.3 12.6 21.6 12.8 14.2 100.0 13.6 12.8 14.6 Utah 15 26.7 27.3 33.3 0 0 28.6 0 0 37.5 Vermont 9 25.0 0 22.2 22.2 25.0 33.3 0 Virgin Islands 48 6.8 0 9.1 5.4 0 7.9 4.3 13.3 0
Virginia, Eastern 142 29.4% 16.7% 21.3% 38.7% 50.0% 29.2% 29.2% 25.4% 34.3% Virginia, Western 31 32.1 0 26.9 40.0 29.0 40.0 25.0 14.3 Washington, Eastern 14 7.7 0 0 0 50.0 0 10.0 12.5 0 0 Washington, Western 88 17.7 0 18.0 13.0 0 0 16.3 23.1 10.8 16.7 West Virginia, Northern 23 0 16.7 5.0 0 4.3 14.3 0 0
Wost Virginia, Southern 31 18.5% 25.00;" 14.3% 66.7% 16.7% 40.00/0 18.2% 0% Wisconsin, Eastern 37 26.5 0 18.2 38.5 0 0 25.0 25.0 7.7 30.8 Wisconsin, Western 15 13.3 8.3 33.3 ... 0 14.3 11.1 16.7 Wyoming 7 16.7 0 0 0 100.0 14.3 50.0 0 0
... No cases of this types occurred in the data. bData describe offenders whose parole term ended In 1988 either alncludes both "major· and "minor· offenses. because of a violation or because the term expired.
See Text Table 5.4.
District tables 105

Table 0-5.7, continued. Offenders terminating parole with a new crime, by offender characteristics, 1988
Percent of offenders terminating parole with a new crimea
Prior criminal record
Prior adult convictions Druaabuse Total
Incarceration offenders Emelo~ment at arrest Known No termlnBting Juvenile No Jail 1 year Over drug known
District parole Employed Unemployed None only or prison or less 1 year history abuse
All districts 10,032 15.9% 21.2"10 8.0% 26.5% 15.7% 17.1% 29.1% 20.8% 16.2%
Alabama, Middle 35 13.0% 10.0% 0% 0% 10.0% 20.0% 15.4% 27.3% 4.5% Alabama, Northern 77 27.3 21.1 0 33.3 12.5 60.0 25.6 31.0 19.0 Alabama, Southern 56 17.1 25.0 14.3 33.3 10.5 25.0 25.0 31.6 11.8 Alaska 15 16.7 0 0 100.0 0 50.0 0 10.0 25.0 Arizona 146 18.4 17.2 8.3 62.5 4.8 23.1 21.3 18.9 17.5
Arkansas, Eastern 57 18.SOt, 18.2"/0 9.5% 0% 6.3% 0% 41.2% 15.8% 20.00/0 Arkansas, Western 20 23.1 14.3 0 0 14.3 60.0 20.0 20.0 California, Central 454 11.2 16.4 8.3 23.7 5.5 9.1 23.6 13.3 14.6 California, Eastern 128 9.5 16.7 6.9 6.3 13.3 4.8 28.1 7.1 16.7 California, Northern 166 15.3 27.3 2.4 20.0 25.0 22.2 33.3 31.6 15.2
California, Southern 133 8.7% 16.1% 8.2% 11.1% 14.3% 20.0% 14.8% 9.5% 13.5% Colorado 105 22.6 31.4 17.2 40.0 15.4 22.2 41.7 22.0 29.8 Connecticut 44 a5.0 9.5 0 0 8.3 16.7 35.3 21.1 11.1 Delaware 13 67.1 0 33.3 0 0 0 50.0 22.2 50.0 District of Columbia 611 25.9 28.6 16.4 35.0 24.5 19.3 31.3 25.3 36.5
Florida, Middle 313 16.9% 21.1% 8.3% 22.2"/0 17.2"/0 16.00/0 26.9% 22.4% 16.1% Florida, Northern 107 13.8 30.8 9.3 50.0 18.8 0 33.3 20.0 16.9 Florida, Southern 792 9.2 11.1 6.3 5.6 13.3 15.2 16.8 10.2 9.6 Georgia, Middle 48 30.0 50.0 12.5 50.0 30.0 50.0 31.3 36.4 35.5 Georgia, Northern 151 25.0 20.0 7.9 38.5 20.0 20.0 32.2 25.6 22.7
Georgia, Southern 60 13.0% 0% 5.3% 25.0% 0% 0% 17.4% 20.0% 6.7% Hawaii 31 0 9.1 0 25.0 0 0 0 0 5.6 Idaho 20 27.3 28.6 0 25.0 50.0 33.3 33.3 22.2 Illinois, Central 42 15.4 15.4 0 100.0 6.7 0 26.7 16.7 14.3 Illinois, Northern 181 22.0 16.9 10.5 36.4 12.5 0 31.3 16.7 20.9
illinois, Southern 39 3.6% 10.0% 0% 0% 8.3% 50.0% 7.7% 13.3% 0% Indiana, Northern 75 21.9 21.1 19.0 22.2 18.2 33.3 28.6 22.2 20.9 indiana, Southern 61 27.0 42.9 12.5 40.0 9.1 33.3 57.7 37.5 31.0 Iowa, Northern 16 42.9 37.5 0 60.0 50.0 0 60.0 71.4 12.5 Iowa, Southern 29 10.0 22.2 8.3 100.0 25.0 0 0 12.5 14.3
Kansas 56 21.2% 36.8% 31.3% 66.7% 18.8% 0% 33.3% 22.2% 32.0% Kentucky, Eastern 68 11.4 15.8 6.3 66.7 14.3 0 13.3 16.7 11.8 Kentucky, Western 62 10.5 11.8 0 25.0 8.3 0 20.8 15.4 9.5 louisiana, Eastern 127 18.5 22.2 5.3 0 16.7 11.1 38.3 22.0 18.3 louisiana, Middle 23 7.1 12.5 0 20.0 0 16.7 28.6 0
Louisiana, Western 38 9.1% 3o.a% 15.4% 0% 0% 0% 40.00/0 18.2"10 16.7% Maryland 279 13.1 33.3 5.6 20.0 18.5 21.1 32.2 21.6 19.8 Massachusetts 145 8.4 27.3 0 9.1 8.3 36.4 41.9 21.0 9.1 Michigan, Eastern 258 14.0 24.5 6.1 20.0 10.4 15.4 38.1 21.6 15.8 Michigan, Western 34 22.2 28.6 14.3 0 40.0 25.0 25.0 27.3 23.8
Minnesota 115 12.0% 31.6% 8.3% 15.4% 8.7% 21.4% 29.3% 30.8% 8.2% Mississippi, Northern 29 11.8 25.0 0 44.4 0 40.0 16.7 15.8 Mississippi, Southern 49 35.1 0 16.7 0 30.0 50.0 40.0 33.3 26.7 Missouri, Eastern 186 24.0 25.9 8.8 44.4 22.4 15.4 34.7 25.9 24.0 Missouri, Western 98 18.0 25.0 13.0 0 20.0 14.3 29.3 15.4 24.1
106 Compendium of Federal Justice Statistics, 1988

Table 0-5.7 Continued
Percent of offenders terminating parole with a new crimea
Prior criminal record
Prior adult convictions Oru£! abuse Total
Incarceration offenders Employment at arrest Known No termingtlng Juvenile No Jall 1 year OVer drug known
District parole Employed Unemployod None only or prison or less 1 year history abuse
Nebraska 28 21.1% 42.9% 14.3% 25.0% 12.5% 100.0% 37.5% 18.2% 33.3% Nevada 44 11.5 11.8 0 0 18.8 0 22.2 6.3 14.8 New Jersey 144 6.8 15.7 5.4 22.2 13.0 16.7 18.8 13.0 8.9 New Mexico 98 15.7 23.3 5.9 50.0 20.0 20.0 19.0 37.0 11.9 New York, Eastern 330 12.3 12.7 2.7 50.0 14.9 25.0 22.7 23.9 7.9
New York, Northern 27 15.0% 33.3% 0% 50.0% 16.7% 50.0% 22.2% 20.0% 18.8% New York, Southern 382 9.6 19.2 8.7 15.0 19.2 17.1 22.3 21.3 9.4 New York, Western 53 12.0 14.8 15.4 0 0 0 22.7 30.8 7.7 North Carolina, Eastern 65 29.8 43.8 10.0 50.0 14.3 50.0 50.0 42.9 30.6 North Carolina, Middle 96 24.2 37.5 6.7 33.3 33.3 28.6 31.6 35.3 23.1
North Carolina, Western 96 17.9% 33.3% 5.9% 100.0% 12.9% 0% 33.3% 31.8% 18.8% North Dakota 26 5.9 0 0 0 0 0 14.3 0 8.3 Ohio, Northern 108 ... 26.0 0 50.0 Ohio, Southern 115 41.1 39.S 13.6 50.0 9.5 28.6 60.0 43.6 38.5 Ok/ahoma, Eastern 30 21.1 40.0 20.0 50.0 42.9 0 22.2 25.0 29.4
Ok/ahoma, Northern 43 15.6% 27.3% 0% 0% 0% 20.0% 38.9% 18.2% 19.0% Ok/ahoma, Western 91 16.9 26.7 16.7 50.0 4.0 0 35.5 9.7 23.6 Oregon 57 24.0 25.8 12.5 16.7 0 0 42.9 29.2 21.9 Pennsylvania, Eastern 146 2.7 9.4 9.3 18 .. ~ 0 0 3.9 5.3 6.6 Pennsylvania, Middle 28 5.6 0 0 0 0 0 12.5 6.7 0
Pennsylvania, Western 101 12.5% 18.2% 0% 0% 15.4% 22.2% 37.5% 13.3% 17.9% Puerto Rico 154 10.8 19.1 2.2 33.3 4.8 36.4 34.5 21.7 6.6 Rhode Island 24 21.1 20.0 11.1 0 12.5 0 60.0 37.5 12.5 South Carolina 119 16.4 26.5 2.4 0 28.0 40.0 36.6 19.0 19.8 South Dakota 42 27.3 57.9 11.1 37.5 50.0 61.5 44.4 40.6
Tennessee, Eastern 76 14.3% 28.0% 0% 33.3% 11.1% 0% 35.7% 21.4% 18.9% Tennessee, Middle 60 22.5 33.3 7.7 25.0 26.7 0 36.0 27.8 24.3 Tennessee, Western 47 19.2 15.8 0 0 30.0 0 35.7 6.3 24.1 Texas, Eastern 48 16.7 26.7 0 33.3 25.9 33.3 11.1 Texas, Northern 325 15.8 19.8 13.8 45.5 16.0 4.3 22.3 15.6 18.5
Texas, Southern 527 17.5% 19.7% 9.4% 31.6% 18.6% 25.7% 26.5% 30.5% 14.1% Texas, Western 396 15.3 12.0 10.1 6.3 13.3 13.6 17.8 11.7 16.4 Utah 15 28.6 16.7 0 0 0 36.4 40.0 12.5 Vermont 9 0 40.0 0 50.0 0 33.3 50.0 14.3 Virgin Islands 48 7.4 6.7 4.0 0 0 Q 22.2 0 8.6
Virginia, Eastern 142 24.2% 40.0% 7.4% 27.3% 23.5% 10.0% 44.8% 28.1% 29.0% Virginia, Western 31 22.2 36.4 0 40.0 33.3 100.0 30.8 28.6 27.3 Washington, Eastern 14 0 12.5 0 100.0 0 0 0 0 9.1 Washington, Western 88 14.8 13.3 5.9 12.5 11.8 14.3 25.0 14.9 13.5 West Virginia, Northern 23 0 7.7 0 0 0 50.0 0 9.1 0
West Virginia, Southern 31 21.4% 12.5% 7.7% 33.3% 0% 33.3% 11.1% 19.0% Wisconsin, Eastern 37 13.3 26.3 0 16.7 0 50.0 46.7 23.1 19.0 Wisconsin, Western 15 18.2 0 0 0 0 0 40.0 12.5 14.3 Wyoming 7 0 33.3 0 100.0 0 0 0 20.0
... No cases of this types occurred in the data. bOata describe offenders whoso parole term ended in 1988 either Bin eludes both "major" and "minor" offenses. because of a viol'ltlon or because the term expired.
\3ee Text Table 5.4.
District tables 107

Table D-S.B Offenders termlnatlne ~arole with a new crime or technical vlolatlonz b~ offender characterlstlcsz 1988
Percent of offenders terminating parole with a new crime or technical violation Total Ethnicity offenders terminiting
Sex Race Non-
Age
District parole Male Female White Black Other Hispanic Hispanic 16-18 19-20 21-30 31-40 OVer 40
All districts 10,032 41.9% 33.8% 32.2% 58.~k 45.5% 36.3% 42.4% 37.5% 33.3% 48.0% 43.0% 35.1%
Alabama, Middle 35 12.5% 66.7% 18.2% 15.4% ... 17.1% 37.5% 11.1% 16.7% Alabama, Northern 77 39.4 50.0 40.4 41.4 0 40.3 36.4 45.9 34.8 Alabama, Southem 56 32.7 57.1 17.1 66.7 35.7 60.0 35.7 25.0 Alaska 15 21.4 0 0 100.0 66.7 0 25.0 0 50.0 20.0 16.7 Arizona 146 44.7 20.0 39.7 54.5 71.4 23.4 53.5 100.0 50.0 40.0 35.7
Arkansas, Eastern 57 34.6% 20.0% 27.5% 47.1% ... 100.0% 32.1% 35.7% 30.4% 36.8% Arkansas, Western 20 27.8 50.0 20.0 60.0 0 31.6 66.7 28.6 0 California, Central 454 46.9 30.0 35.6 67.4 38.5 28.4 50.3 0 52.6 43.1 43.7 California, Eastern 128 50.0 81.3 49.0 75.0 50.0 62.5 53.3 66.7 58.0 40.0 California, Northern 166 43.9 3B.9 33.3 69.6 40.0 7.7 46.7 57.1 39.4 43.5
California, Southem 133 50.4% 33.3% 44.6% 75.0% 0% 3B.9% 55.7% 0% 0% 55.6% 46.7% 45.5% Colorado 105 52.1 lB.2 44.0 66.7 64.3 46.2 53.3 45.7 43.8 Connecticut 44 31.0 0 17.9 50.0 25.0 2B.9 41.7 33.3 16.7 Delaware 13 53.B 14.3 100.0 53.B 50.0 50.0 66.7 District of Columbia 611 78.6 59.3 50.0 78.0 0 50.0 77.2 81.9 79.7 70.2
Florida, Middle 313 40.0% 16.7% 33.1% 56.6% 0% 55.6% 3B.2% 50.0% 36.8% 34.9% Florida, Northem 107 31.9 23.1 25.0 48.1 0 31.4 45.5 32.7 20.0 Florida, Southern 792 2B.9 14.9 2B.1 28.3 0 28.3 27.8 34.7 26.9 26.0 Georgia, Middle 48 45.5 75.0 33.3 62.5 47.9 85.7 62.5 22.2 Georgia, Northern 151 46.8 40.0 41.9 53.4 0 46.7 63.6 58.5 34.8
Georgia, Southern 60 44.4% 33.3% 26.7% 60.0% 43.3% 63.2% 45.8% 17.6% Hawaii 31 25.9 25.0 15.0 45.5 0 27.6 60.0 20.0 10.2 Idaho 20 08.4 100.0 68.8 100.0 66.7 100.0 64.7 100.0 66.7 87.5 33.3 Illinois, Central 42 38.5 33.3 27.3 77.8 391:1 50.0 42.1 16.7 Illinois, Northem 181 39.9 15.4 28.7 50.6 33.3 38.4 45.0 41.7 34.2
Illinois, Southern 39 23.5% 1>% 20.7% 20.0% 0% 21.6"":' 0% 28.6"k 12.5% Indiana, Northern 75 47.9 50.0 33.3 66.7 50.0 45.5 41.7 55.2 43.3 Indiana, Southern 61 35.S 0 31.B 41.2 34.4 33.3 43.5 25.9 Iowa, Northem 16 46.7 0 38.5 50.0 100.0 0 46.7 0 57.1 66.7 Iowa, Southern 29 25.0 0 22.7 ,28.6 24.1 25.0 21.4 28.6
Kansas 56 52.8% 66.7% 41.7% 75.0% 50.0% 53.7% 60.0% 53.3% 50.0% Kentucky, Eastern 68 25.8 0 23.4 50.0 25.4 25.0 41.7 13.3 Kentucky, Western 62 31.7 0 25.5 46.7 30.6 16.7 39.1 31.8 Louisiana, Eastem 127 44.1 33.3 29.2 58.1 43.3 53.8 44.4 35.9 Louisiana, Middle 23 ~3.3 50.0 14.3 66.7 34.8 50.0 35.7 25.0
Louisiana, Westem 38 28.6% 0% 19.0% 35.3% 0% 27.8% 20.0% 26.7% 33.3% Maryland 279 49.4 50.0 34.1 57.3 0 49.3 55.6 56.7 35.9 Massac:huSGtts 145 23.7 50.0 21.8 42.9 33.3 23.8 30.0 28.1 18.9 Michigan, Eastem 258 37.9 23.5 27.9 47.3 0 0 36.5 42.9 29.B 36.4 Michigan, Westem 34 34.4 50.0 36.4 36.4 0 100.0 33.3 66.7 41.2 16.7
Minnelsota 115 34.9% 33.3% 27.9% 56.0% 50.0% 85.7% 31.8% 33.3% 42.1% 25.7% Missi:ssippi, Northem 29 20.7 27.8 9.1 20.7 0 20.0 25.0 Mississippi, Southern 49 41.3 33.3 21.7 58.3 50.0 40.8 30.8 48.0 44.4 Missouri, Eastern 186 51.8 22.2 31.6 61.5 0 0 492 55.8 50.0 41.1 Missouri, Westem 98 44.7 25.0 28.3 60.5 100.0 44.3 0 33.3 50.0 44.7 Montana 14 14.3 10.0 25.0 14.3 40.0 0 0
108 Compendium of Federal Justice Statistics, 1988

Table 0-5.S Contlnubd
Percent of offenders terminating parole with a new crime or technical violation Total Ethnicity offenders Sex Race Age terminiting Non·
District earole Male Female White Black Other His~anic His~anic 16-18 19·20 21·30 31·40 Over 40
Nebraska 28 44.4% 100.0% 45.0% 50.0% '" 46.4% 57.1% 61.5% 14.3% Nevada 44 37.5 50.0 29.0 58.3 100.0 33.3 39.0 66.7 50.0 11.8 New Jersey 144 31.4 28.6 14.6 582 0 33.3 35.0 32.8 20.4 New Mexico 98 30.4 16.7 28.9 40.0 33.3 34.4 27.3 100.0 28.6 29.7 25.0 New York, Eastern 330 34.3 29.2 23.0 53.9 50.0 12.5 33.9 0 35.4 33.3 33.0
New York, Northem 27 25.0% 33.3% 25.00/0 0% 25.9% 50.00/0 20.00/0 25.00/0 New York, Southern 382 51.0 57.1 41.4 63.0 0 48.8 53.5 50.0 25.0 66.4 52.3 34.8 New York, Western 53 21.3 16.7 12.1 35.0 0 23.4 30.8 24.0 7.1 North Carolina, Eastern 65 42.9 55.6 26.7 SO.6 50.0 45.3 50.0 42.9 41.7 North Carolina, Middle 96 42.0 62.5 34.9 50.0 100.0 43.8 52.6 39.5 43.3
North Carolina, Western 96 37.6% 54.5% 30.4% 55.6% 25.0% 100.0% 38.00/0 46.2% 52.8% 21.4% North Dakota 26 20.8 0 15.8 28.6 19.2 100.0 16.7 30.0 0 Ohio, Northern 108 45.5 22.2 35.5 54.3 50.0 43.8 39.3 63.0 15.4 Ohio, Southern 115 52.7 20.0 39.7 67.4 100.0 51.3 62.5 56.1 43.5 Oklahoma, Eastem 30 50.0 45.8 100.0 0 50.0 0 80.0 16.7
Oklahoma, Northern 43 43.6"10 25.0% 39.3% 50.0% 0% 41.9% 50.00/0 41.2% 38.9% Oklahoma, Western 91 36.9 0 29.7 50.0 100.0 0 35.2 34.8 34.4 32.3 Oregon 57 55.6 66.7 532 70.0 50.0 56.4 100.0 58.3 41.7 Pennsylvania, Eastern 146 28.5 222 15.7 39.5 100.0 27.1 40.0 25.0 28.8 Pennsylvania, Middle 28 11.5 50.0 14.3 14.3 14.3 0 14.3 20.0
Pennsylvania, Western 101 35.4% 0% 15.5% 57.1 % 1 00.0% 33.3% 0% 32.SOIo 40.6% Puerto Rico 154 29.6 25.0 33.0 19.5 31.1 20.0 40.8 26.8 20.5 Rhode Island 24 28.6 0 25.0 50.0 16.7 0 36.4 18.2 South Carolina 119 35.7 28.6 22.2 56.5 0 35.6 62.5 31.3 16.7 South Dakota 42 61.0 0 28.6 75.0 59.5 33.3 73.3 50.0 55.6
Tennessee, Eastern 76 29.0% 28.6"/0 29.4% 25.0% 28.9% 50.0% 19.0% 28.6% Tennessee, Middle 60 46.3 16.7 27.0 69.6 0 44.1 62.5 25.0 47.1 Tennessee, Western 47 31.0 0 14.8 45.0 100.0 26.1 20.0 32.0 25.0 Texas, Eastern 48 51.2 20.0 29.2 66.7 100.0 45.7 66.7 66.7 17.6 Texas, Northern 325 48.4 41.3 39.3 61.9 0 27.fJ 51.1 57.9 48.7 39.5
Texas, Southern 527 38.0% 29.6% 36,1% 49.00/0 1 00.0% 35.3% 42.3% 0% 14.3% 35.7% 38.0% 42.9% Texas, Western 396 50.0 47.2 49.2 56.8 54.9 432 100.0 49.4 45.6 56.9 Utah 15 46.7 54.5 33.3 0 0 50.0 0 33.3 62.5 Vermont 9 25.0 0 222 22.2 25.0 33.3 0 Virgin Islands 48 11.4 0 9.1 10.8 0 13.2 8.7 13.3 0
Virginia, Eastern 142 44.9% 33.3% 30.0% 62.9% 50.0% 43.8% 37.5% 46.3% 51.4% Virginia, Western 31 35.7 0 26.9 60.0 32.3 40.0 33.3 14.3 Washington, Eastern 14 38.5 100.0 36.4 100.0 50.0 0 SO.O 37.5 50.0 50.0 Washington, Western 88 48.1 22.2 41.0 65.2 0 50.0 45.3 53.8 37.8 50.0 West Virginia, Northern 23 0 16.7 5.0 0 4.3 14.3 0 0
West Virginia, SouL~ern 31 33.3% 25.0% 28.6% 66.7% 30.0% 60.0% 36.4% 7.7% Wisconsin, Eastern 37 44.1 0 182 76.9 50.0 0 41.7 37.5 38.5 38.5 Wisconsin, Western 15 20.0 16.7 33.3 0 21.4 22.2 16.7 Wyoming 7 16.7 100.0 20.0 0 100.0 28.6 100.0 0 0
... No cases of this types occurred in the data. See Text Table 5.4 .
* Data describe offenders whose parole term ended in 1988 either because of a violation or because the terrn expired.
District tables 109

Table 0-5.8, continued. Offenders terminating parole with a new crime or technical violation, by offender characteristics, 1988
Percent of offenders terminating parole with a new crime or technical violation
Prior criminal record
Prior adult convictions Drug abuse Total Incarceration offenders Known No
terminating EmElo~ment at arrest Juvenile No jail 1 year OVer drug known
District parole· Employed Unemployed None only or prison or less 1 year history abuse
All districts 10,032 34.4% 53.0% 20.9% 56.7% 37.0% 46.6"10 60.3% 59.7% 30.1%
Alabama, Middle 35 13.0% 30.0% 0% 0% 10.0% 20.0% 30.8% 36.4% 9.1% Alabama, Northern 77 36.4 44.7 20.0 33.3 25.0 60.0 48.8 62.1 26.2 Alabama, Southern 56 29.3 66.7 28.6 66.7 21.1 50.0 50.0 63.2 23.5 Alaska 15 25.0 0 . 0 100.0 0 50.0 33.3 20.0 25.0 Arizona 146 36.8 53.4 33.3 75.0 28.6 30.8 53.2 64.9 36.1
Arkansas. Eastern 57 34.9% 36.4% 14.3% 0% 18.8% 50.0% 70.6% 42.1% 31.4% Arkansas, Western 20 23.1 42.9 16.7 0 14.3 80.0 40.0 26.7 California, Central 454 31.5 55.9 21.7 57.9 30.1 50.9 64.8 66.9 29.1 California, Eastern 128 45.9 64.6 37.9 43.8 46.7 52.4 81.3 71.4 37.9 California, Northern 166 29.4 59.7 7.3 70.0 40.6 44.4 63.0 68.4 30.5
California, Southern 133 40.6% 56.5% 30.6% 66.7% 50.0% 60.0% 66.7% 69.0% 38.2% Colorado 105 38.7 62.9 41.4 80.0 26.9 55.6 63.9 56.0 38.3 Connecticut 44 31.3 28.6 25.0 0 16.7 16.7 47.1 42.1 16.7 Delaware 13 57.1 50.0 33.3 100.0 0 0 83.3 55.6 50.0 District of Columbia 611 77.0 79.4 58.9 83.3 74.5 77.2 81.2 83.5 57.4
Florida, Middle 313 33.8% 51.1% 19.0% 55.6% 30.1% 60.0% 55.9% 45.9% 35.6% Florida, Northern 107 26.3 46.2 18.6 50.0 31.3 0 61.9 48.6 22.5 Florida, Southern 792 27.3 34.8 19.4 38.9 34.1 51.5 53.5 44.1 26.6 Georgia, Middle 48 40.0 75.0 37.5 75.0 30.0 50.0 50.0 72.7 41.9 Georgia, Northern 151 46.0 55.0 13.2 76.9 46.7 80.0 55.9 55.8 45.4
Georgia, Southern 60 37.0% 64.3% 15.8% 100.0% 36.4% 33.3% 60.9% 80.0% 31.1% Hawaii 31 18.8 45.5 18.2 75.0 8.3 0 66.7 55.6 16.7 Idaho 20 45.5 100.0 0 75.0 100.0 83.3 66.7 66.7 Illinois, Central 42 38.5 30.8 0 100.0 20.0 50.0 66.7 44.4 28.6 Illinois, Northern 181 38.0 39.4 . 17.5 81.8 28.1 33.3 53.7 57.1 32.6
Illinois, Southern 39 14.3% 30.0% 0% 50.0% 25.0% 50.0% 23.1% 40.0% 4.3% Indiana, Northern 75 40.6 52.6 33.3 55.6 36.4 33.3 64.3 51.9 44.2 Indiana. Southern 61 27.0 42.9 12.5 40.0 9.1 33.3 57.7 37.5 31.0 Iowa. Northern 16 42.9 37.5 0 60.0 50.0 0 60.0 71.4 12.5 Iowa, Southern 29 25.0 22.2 16.7 100.0 37.5 0 14.3 25.0 23.8
Kansas 56 39.4% 78.9% 43.8% 66.7% 50.0% 33.3% 66.7% 59.3% 48.0% Kentucky. Eastern 68 18.2 42.1 6.3 66.7 21.4 20.0 33.3 41.7 21.6 Kentucky, Western 62 26.3 47.1 0 75.0 16.7 0 58.3 38.5 31.0 Louisiana. Eastern 127 40.0 48.1 21.1 33.3 50.0 33.3 59.6 55.9 31.7 Louisiana, Middle 23 42.9 25.0 30.0 20.0 100.0 50.0 71.4 20.0
Louisiana, Western 38 18.2% 46.2% 15.4% 0% 0% 50.0% 60.0% 27.3% 29.2% Maryland 279 39.4 67.7 14.8 %0 49.2 57.9 61.7 64.7 29.2 Massachusetts 145 18.9 36.4 4.5 18.2 25.0 36.4 51.6 33.9 16.9 Michigan, Eastern 258 26.6 45.9 17.1 40.0 26.9 23.1 61.9 49.0 23.7 Michigan, Western 34 27.8 42.9 14.3 50.0 60.0 25.0 37.5 45.5 28.6
Minnesota 115 28.0% 50.0% 33.3% 15.4% 30.4% 42.9% 41.5% 51.9% :::1.3% Mississippi, Northern 29 11.8 25.0 0 44.4 0 40.0 16.7 15.8 Mississippi. Southern 49 43.2 37.5 16.7 0 50.0 75.0 60.0 53.3 36.7 Missouri, Eastern 186 42.7 55.3 20.6 44.4 53.4 53.8 58.3 63.5 35.4 Missouri, Western 98 37.7 56.3 30.4 0 36.0 42.9 58.5 53.8 37.0 Montana 14 0 33.3 0 28.6 0 0 0 18.2
110 Compendium of Federal Justice Statistics, 1988

Table 0-5.8 Continued
Percent of offenders terminating parole with a new crime or technical violation
Prior criminal record
Prior adult convictions Drug abuse Total Incarceration offenders Known No Employment at arrest
tenninating Juvenile No jail 1 year Over drug known District parole* Employed Unemployed None only or prison or less 1 year history abuse
Nebraska 28 42.1% 57.1% 42.9% 75.0% 25.0% 100.0% 50.0% 54.5% 40.0% Nevada 44 26.9 58.8 14.3 100.0 37.5 25.0 77.8 50.0 33.3 New Jersey 144 12.2 52.9 10.7 55.6 26.1 33.3 50.0 52.2 15.2 New Mexico 98 21.6 37.2 17.6 66.7 20.0 20.0 42.9 55.6 17.9 New York, Eastern 330 26.7 40.8 12.8 100.0 45.9 50.0 53.3 GO.2 23.3
New York, Northern 27 20.0% 50.0% 0% 50.0% 16.7% 50.0% 44.4% 30.0% 25.0% New York, Southern 382 35.6 GO.3 30.8 60.0 57.7 61.0 59.8 67.6 32.7 New York, Western 53 12.0 29.6 23.1 0 14.3 14.3 27.3 46.2 12.8 North Carolina, Eastern 65 36.2 68.8 10.0 66.7 14.3 50.0 79.2 64.3 38.8 North Carolina, Middle 96 38.7 54.2 13.3 33.3 39.4 28.6 63.2 61.8 30.8
North Carolina, Western 96 37.3% 50.0% 11.8% 100.0% 32.3% 14.3% 59.0% 81.8% 27.5% North Dakota 26 23.5 11.1 0 33.3 14.3 0 42.9 14.3 25.0 Ohio, Northern 108 43.0 0 50.0 Ohio, Southern 115 50.0 60.4 18.2 62.5 19.0 57.1 76.0 66.7 47.7 Oklahoma, Eastern 30 36.8 70.0 40.0 50.0 71.4 50.0 44.4 50.0 47.1
Oklahoma, Northern 43 37.5% 54.5% 20.0% 0% 25.0% 40.00/0 66.7% 54.5% 28.6% Oklahoma, Western 91 32.4 40.0 23.3 50.0 20.0 33.3 54.8 32.3 34.5 Oregon 57 56.0 58.1 50.0 16.7 36.4 50.0 75.0 70.8 46.9 Pennsylvania, Easlern 146 12.3 48.4 20.9 54.5 20.6 14.3 35.3 39.5 16.4 Pennsylvania, Middle 28 16.7 11.1 0 0 0 33.3 37.5 20.0 8.3
Pennsylvania, Western 101 25.0% 38.6% 4.0% 28.6% 15.4% 22.2% 62.5% 42.2% 20.5% Puerto Rico 154 24.3 55.3 12.4 100.0 38.1 54.5 58.6 GO.O 13.1 Rhode Island 24 21.1 40.0 11.1 0 25.0 0 GO.O 37.5 18.8 South Carolina 119 26.0 50.0 11.9 20.0 52.0 40.0 51.2 47.6 30.2 South Dakota 42 45.5 73.7 22.2 75.0 58.3 76.9 77.8 53.1
Tennessee, Eastern 76 21.4% 44.0% 10.0% 33.3% 16.7% 0% 50.0% 21.4% 32.1% Tennessee, Middle 60 40.0 60.0 15.4 50.0 40.0 33.3 GO.O 66.7 35.1 Tennessee, Western 47 30.8 26.3 23.5 50.0 30.0 0 35.7 25.0 31.0 Texas, Eastern 48 36.7 66.7 11.1 33.3 66.7 83.3 22.2 Texas, Northern 325 45.0 53.5 26.4 81.8 43.0 39.1 68.0 63.1 34.6
Ter-as, Southern 527 35.5% 43.9% 22.0% 63.2% 32.4% 45.7% 59.SOIo 63.3% 30.0% Texas, Western 396 42.3 70.7 26.6 62.5 53.3 72.7 66.7 74.3 32.8 Utah 15 42.9 50.0 0 0 0 63.6 80.0 25.0 Vermont 9 0 40.0 0 50.0 0 33.3 50.0 14.3 Virgin Islands 48 7.4 13.3 12.0 0 0 0 22.2 0 11.4
Virginia, Eastern 142 44.0% 51.4% 14.8% 45.5% 32.4% 40.0% 65.5% 50.0% 41.9% Virginia, Western 31 22.2 45.5 0 40.0 50.0 100.0 30.8 42.9 27.3 Washington, Eastern 14 33.3 50.0 0 100.0 50.0 50.0 50.0 66.7 36.4 Washington, Western 88 33.3 66.7 17.6 50.0 29.4 50.0 65.6 57.4 29.7 West Virginia, Northern 23 0 7.7 0 0 0 50.0 0 9.1 0
West Virginia, Southern 31 21.4% 37.5% 15.4% 50.0% 0% 55.SOIo 22.2% 33.3% Wisconsin, Eastern 37 26.7 47.4 14.3 16.7 0 50.0 80.0 53.8 28.6 Wisconsin, Western 15 27.3 0 33.3 0 0 0 40.0 12.5 28.6 Wyoming 7 0 66.7 33.3 100.0 0 0 0 40.0
.. No cases of this types occurred in the data. See TextTable 5.4.
*Data describe offenders whose parole term ended in 1988 either because of a violation or because the term expired.
District tables 111

Glossary
This glossary defines each of the terms used in the tables. The definitions specijically describe the criteria used in establishing table classifications.
Definitions of offense categories describe all offenses Included in each category. Statutory sections are cited in parentheses at the end of each definition.
Agriculture violation - violation of the Federal statutes on agriculture and conservation, for example, violations of the Agricultural Acts, Federal Seed Act, Game Conservation Acts, Insecticide Act, and the Packers and Stockyards Act; also violation of laws concerning plant quarantine and the handling of animals pertaining to research (title 7 U.S.C. except sections on food stamps).
Antitrust - violation of Federal antitrust statutes (15 U.S.C. 1, 2, 3, 8, 13(A)(F), 20, 24, 701, and 72).
Arson - willfully or maliciously setting, or attempting to set, fire to any property within the special maritime and territorial jurisdiction of the United States as defined in 18 U.S.C. 7 (18 U.S.C. 81).
Assault - Intentionally inflicting or attempting or threatening to inflict bodily Injury to anyone within the special maritime and territorial jurisdiction of the United States as defined In 18 U.S.C. 7 or to any Government official, foreign official, official guest, internationally protected person, or any officer or employee of the Un ned States designated in section 1114 of title 18; also certain violations of the Fair Housing Law (18 U.S.C. 111, 112(A)-(C), 113(A)-(F), 114, 351 (C)-(E), 372,1501-2, 1751(E), 1991, 2231 (A)(B), and 2233; 21 U.S.C.461(C), 675(A)(B), and 1041 (C); 26 U.S.C. 7212(A)(B); 42 U.S.C. 3610(A}, 3611(F), and 3631; 46 U.S.C. 701 (6); and 49 U.S.C. 1472(k1) and 1475(J)(k1)).
Ball - the sum of money promised as a condition of release, to be paid If a released defendant defaults (18 U.S.C. 3142(0)).
Bribery - offering or promising anything of value with intent to unlawfully influence a public official, bank employee, officer or employee of the U.S. Government, witness, or any common carrier as well as soliciting or accepting such an offer. SolicHing or receiving anything of value In consideration of aiding a person to obtain employment in the U.S. Government. Receiving or soliciting any remuneration, directly or indirectly, in cash or any kind in return for purchasing, ordering, leasing, or recommending to purchase any good, service, facility, or nem for which payment may be made through Medical Assistance Programs. Bribing in sporting contests is also illegal (18 U.S.C. 201(A)-(I), 203-5, 207(B)(C), 208-15, and 224; 21 U.S.C. 622; 26 U.S.C. 7214(A); 42 U.S.C. 1396H(B); 46 U.S.C. 239(1); and 49 U.S.C. 10(4), 917{B), and 1472{D)).
Burglary - breaking and entering into another's property with intent to steal within the special maritime and territorial jurisdiction of the United States, as defined in 18 U.S.C. 7; also including breaking and entering into any official bank, credit union, savings and loan institution, post office, vessel or steamboat assigned to the use of mall service, or lJersonal property of the United States or breaking the seal or lock of any carrier facilny containing inter-State or foreign shipments of freight or express (18 U.S.C. 2111, 2113{A), and 2115-17).
Collateral Bond - an agreement made by a defendant as a condition of his or her pretrial release that requires the defendant to post property valued at the full bail amount as an assurance of his or her intention to appear at trial.
Conspiracy - an agreement by two or more persons to commit or to effect the commission of an unlawful act or to use unlawful means to accomplish an act that is not in itself unlawful; also any overt act in furtherance of the agreement. A person charged with conspiracy is classified under the substantive offense alleged.
Counterfeiting - falsely making, forging, or altering any obligation or security of the United States, foreign obligation or security, coin or bar stamped at any mint in the United States, money order issued by the Postal Service, domestic or foreign stamp, or seal of any department or agency of the United States. Passing, selling, attempting to pass or sell, or bringing into the United States any of the above falsely made articles. Making, selling, or possessing any plates or stones used for printing counterfeit obligations or securities of the United States, foreign obligations or securities, Government transportation requests, or postal stamps (18 U.S.C. 331,471-74,476-81,485-88,490,492,500-502,506-7, and 509; 21 U.S.C. 458{C4) and 611 (B4); 26 U.S.C. 5604{A4) and 7241; and 46 U.S.C. 410).
Declination - the decision by a prosecutor not to file a case.
Deposit bond - an agreement made by a defendant as a condition of his or her release that requires the defendant to post a fraction of the baH before he or she is released.
Detention - the legally authorized confinement of persons after arrest, whether before or during prosecution. Only those persons held 2 or more days are classified as detained in this compendium.
Glossary 113

Dlsmlssal- termination of a case before trial or other final judgment (including nolle prosequi and deferred prosecution).
Disposition - the decision made on a case brought before the Federal criminal courts.
Distribution - delivery (other than by administering or dispensing) of a controlled substance (21 U.S.C.802).
District of Columbia - the jurisdiction of the U.S. district court for the District of Columbia. This compendium includes Federal offenses prosecuted in U.S. district courts and excludes violations of the District of Columbia code and cases prosecuted in the District of Columbia superior court.
Drug offenses - possessing or trafficking in (distributing, importing, and manufacturing) controlled substances. Also furnishing of fraudulent or false information concerning prescriptions as well as any other unspecified drug-related offense. (See specific offenses in this glossary for citations.)
Embezzlement - fraudulently misapplying property by a person to whom such property has been entrusted or into whose hands it has lawfully come where offense is committed by bank officers or employees; officers or employees of the Postal Service; officers of lending, credit, or insurance institutions; any officer or employee of a corporation or association engaged in commerce as a common carrier; court officers of the U.S. courts; or officers or employees of the United States. Embezzling, stoaling, or knowingly converting to one's own use or the use of another or without authority selling, conveying, or disposing of any money, property, records, or thing of value to the United States or any department thereof (12 U.S.C. 630; 15 U.S.C. 645(B)(C); 18 U.S.C. 332, 334, 641-57, 660, 664, 665(A)(B), 1025, 1163, 1709-11 and 1721;22 U.S.C.1179;29 U.S.C. SOl (C) and 502(B); 38 U.S.C. 3501; and 42 U.S.C. 2703A, 2971F(A)(B), 3220(B), and 3791).
Escapo - departing or attempting to depart from the custody of a correctional institution; a judicial, correctional, or law enforcement officer; or a hospital where one is committed for drug abuse and drug dependency problems. Knowingly advising, aiding, assisting, or procuring the escape or attempted escape of any person from a correctional facility, an officer, or the above-mentioned hospital as well as concealing an escapee. Forcibly rescuing any person in an attempt to prevent execution or forcibly removing or attempting to remove the dead body of an executed offender in order to prevent an autopsy. Aiding or enticing any person belonging to the Armed Forces of a belligerent nation or fraction, who is interned in the United States in accordance with the law of nations, to escape or attempt to escape. Providing or attempting to provide to an inmate in prison a prohibited object or making, possessing, obtaining, or attempting to make or obtain a prohibited object (as defined in section 1791 C of title 18). Instigating, assisting, attempting to cause, or causing any mutiny or riot at any Federal penal, detention, or correctional facility or conveying into any of these institutions any dangerous instrumentalities (18 U.S.C. 751, 752(A)(B), 753-57, 1071-74, 1791-92,3150, and 4082(0); 42 U.S.C. 261(B)(C) and 3425-26; and 50 U.S.C.822-23).
Failure to appear - willful absence from any court appointment.
Felony - a criminal offense punishable by death or imprisonment for a term exceeding 1 year (18 U.S.C. 1).
Filing - The initiation of a criminal case in U.S. district court by formal submission to the court of a charging document alleging that one or more named persons have committed one or more specified offenses. In this compendium, each defendant in a case is counted separately, and only the most serious alleged offense is considered.
Financial conditions - monetary conditions upon which release of a defendant before trial is contingent. In-
114 Compendiwn of Federal Justice Statistics, 1988
cludes deposit bond, surety bond, and collateral bond (see individual definitions).
Food and drug violations - violations of the Federal Food and Drug Act (21 U.S.C.16-17, 20-23, 62-63,104,111,115, 117,120,122,124,126,134(A)-(E),141-45, 151-55,157,158,201,203,205,207,209-12, 331 (A)-(G), 331 (12)(13), 331 (J)-(P), 333(A)(B), 458(A 1 HA5), 459, 460(A)-(0), 461 (A), 463, 466(A), 610(A)(B)(B2)(C), 611(A)(B3), 620(0), 642, 676(A), 1037, 1041(A), 1175, and 1175F; and 26 U.S.C. 4591, 4594(A}-(C), 4597(A),4804(A2)(A4)(B), 4805(B), 4814(Al), 4815(A)(B), 4817, 4833(A2)(B)(C), 4834(A), 4841, 4862(8), 7234(A)(C)(01)(02A)(02B)(D3)(04) , 7235(A)(E), 7236, 7264, 7265(A)(B), and 7266(A 1)(A3)(B)).
Forgery - falsely and with intent to defraud, making, counterfeiting, altering, or possessing with intent to pass off as genuine any U.S. Postal Service money order; postmarking stamp or imr~ession; obligation or security of the United States; foreign obligation, security, or bank note; contractors' bond, bid, or public record; seal of a court or any department or agency of the U.S. Government; the signature of a judge or court officer; ships' papers; documents on entry of vessels; deed; power of attorney; customs matters; bond of distilleries; military or naval discharge certificate; coin or bar; and so forth. Also making, possessing, selling, or printing plates or stones for counterfeiting obligations or securities and receiving, possessing, concealing, selling, or disposing of any falsely made securitie~, tax stamps, or pledges that have crossed a State or the U.S. boundary after being stolen or unlawfully converted (18 U.S.C. 471-74, 478-79, 482-85, 493-98, SOO, 503,505-8,1025,2314-15, and 2318; 19 U.S.C. 1436; 21 U.S.C. 458(B)(C1)(C2), and 611(B1); 26 U.S.C. 5601 (A4)(A5); 43 U.S.C. 1191-92; and 49 U.S,C. 1472(B)).

Fraud -- unlawfully depriving a person of his or her property or legal rights through intentional misrepresentation of fact or deceit other than forgery or counterfeiting. Includes violations of statutes pertaining to lending and credit institutions, the Postal Service, interState wire, radio, television, veterans benefits, allotments, bankruptcy, marketing agreements, commodity credit, the Securities and Exchange Commission, railroad retirement, unemployment, Social Security, false personation, citizenship, passports, conspiracy, and claims and statements, excluding tax fraud. The category excludes fraud involving tax violations that are shown in a separate category under "Public-order, other offenses." (See specific offenses in this glossary for citations.)
Fraudulent property offenses - see "Property offenses, fraudulent."
Gambling - transporting, manufacturing, salling, possessing, or using any gambling device in the District of Columbia or any possession of the United States or within Indian country or the special maritime and territorial jurisdiction of the United States as defined in section 7 of title 18. Also transporting gambling devices in the jurisdiction of the United States, except under authority of the Federal Trade Commission or any State that has a law providing for their exemption from these provisions, transmitting wagering information in inter-State or foreign commerce, interState transporting of wagering paraphernalia, importing or transporting lottery tickets, or mailing lottery tickets or related matter. An employee of the Postal Service acting as a lottery agent is considered guilty of this offense (15 U.S.C. 1172-76; and 18 U.S.C.1082(A)(B), 1084, 1301-3, 1953, and 1955).
Guilty plea - a plea in response to formal charges admitting that the defendant committed offenses as charged. This category also includes pleas of nolo contendere.
Hispanic - ethnic category based on classification by reporting agency. Hispanic persons may be of any race.
Homicide - see murder
Immigration offenses - offenses Involving illegal entrance Into the United States, II/egally reentering after being deported, willfully failing to deport when so ordered, or willful/y remaining beyond days aI/owed on conditional permit. Falsely representing oneself to be a citizen of the United States or counterfeiting any visa, permit, or other document to enter the United States as weI/ as Violating any of the provisions for travel of citizens or aI/ens during war or national emergency. Also bringing in or harboring any aliens not duly admitted by an immigration officer (8 U.S.C. 331, 333-34,338-39, 1185(C), 1252(0)(E), 1282(A)(C), 1286-87, 1321, and 1324-26; and 18 U.S.C. 911 and 1546).
Incarceration - any sentence of confinement, including prison, jail, and other residential placements.
Indeterminate sentence "7"" a prison sentence whose maximum or minimum term is not specifical/y established at the time of sentencing (18 U.S.C. 4205 B(1 )(2».
Jurisdictional offonses - acts that are Federal crimes because of the place in which they occur, such as on an aircraft, on Federal land or property, and for certain crimes on Indian reservations or at sea, but that cannot be classified in a more specific substantive category.
Kidnaping - unlawfully seizing any person, within the special maritime and territorial jurisdiction of the United States as defined by section 7 of title 18, for ransom or reward, except in the case of a minor by a parent. Also receiving, possessing, or disposing of any money or other property that has been delivered as ransom or reward in connection with a kidnaping as well as conspiring to kidnap. This offense includes kidnaping or attempting to kidnap any Government official, the President of the United States, the President-elect, the Vice President, any foreign official, any official guest, or any international/y protected person (18 U.S.C. 351 (B)-(O), 1201-2, and 1751 (B)-(C)).
Labor law vlolat/ons - violations of the Fair Labor Standards Act, the TaftHartley Act (labor-management relations), the Byrnes Act (transportation of strikebreakers), laws regarding the 8-hour day on public works, and peonage laws (18 U.S.C. 1231 and 1581-88: 29 U.S.C. 162, 186(A), 206-7, 211(C)(0), 212, 214-15, 216(A), 439(A)-(C), 463(B), 503(C), 504(B), and 1131; and 40 U.S.C. 321-22).
Larceny - taking and carrying away with Intent to steal any personal property of another, within the special maritime and territorial jurisdiction of the United States, as defined in 18 U.S.C. 7. Stealing, possessing, converting to one's own use, or illegally selling or disposing of anything of value to the United States or any of its departments or agencies or any property made or being made under contract for the United States or any of its departments or agencies. Stealing anything of value (in excess of $100) from a bank, the Postal Service, or any Inter-State or foreign shipments by carrier. Receiving or possessing stolen property or pirate property. Stealing or obtaining by fraud any funds, assets, 0:property that are the subject of a grant, contract, or other form of assistance, whether received directly or indirectly, from the Law Enforcement Assistance Administration or that belong to or are entrusted to the custody of an Indian tribal organization. This offense category excludes the transportation of stolen property (18 U.S.C. 641,659,661-62,1024,1163,1660,1702,1704,1707-8, and 2113(B)(C); 42 U.S.C. 3791: and 49 U.S.C.1472(K1».
Liquor violations - violations of Internal Revenue Service laws on liquor as well as violations of liquor laws not cited under these laws, such as smuggling goods into the United States; dispensing or unlawfully possessing intoxicants in Indian country; transporting intoxicating liquors into any State, territory, district, or possession where sale is prohibited; shipping packages containing unmarked and unlabeled intoxicants; failing to declare liquor at customs; shipping liquor by C.O.D.; knowingly delivering a liquor shipment to someone other than to whom it has been consigned; and Violating in any way the Federal Alcohol
Glossary 115

-Administration Act (18 U.S.C. 545,1154-56, and 1262-65; 19 U.S.C.1461; 26 U.S.C. 5061 (B), 5113(A), 5115, 5171(A), 5179(A)SO, 5214(A), 5221 (A), 5273(B), 5291 (A), 5301 (A)·(C), 5601 (A 1 )-(A4 )(A6)-(A14), 5602, 5603(A)(B), 5604 (A 1 HA3), (A6)-(A 13)(A 15)(A19), 5605-7, 5608(A)(B), 5661 (A)(B), 5662, 5671-72,5674,5676(1-3)(5),5681(A)·(C), 5682-83, 5685(A)(B), 5686·87, 5689, and 5691 (A); and 27 U.S.C. 203, 205(E)(F), 206(A)(B), 207, and 208(A)(D)).
Mailing or transpoliatlon of obscene materials - knowingly using the mail for mailing obscene or crime-inciting matter, as defin'Jd in 18 U.S.C. 1461 and 39 U.S.C. 3001 (E). Also transporting for sale or distribution, importing, or transporting any obscene matter in inter-State or foreign commerce (18 U.S.C. 1461-63, 1465, and 1718).
Major offense - (while on conditional release) - allegation, arrest, or conviction of a crime for which the minimum sentence is incarceration for over 90 days or greater than 1 year on probation. (See Introduction to Probation Statistical Reporting, Administrative Office of the U.S. Courts, 1981.)
Mandatory release - the release of an inmate from prison after confinement for a time period equal to his or her full sentence minus statutory good-time, if any. Federal prisoners released on mandatory release may still be subject to a period of postrelease community supervision.
Matter - a potential case under review by a U.S. Attorney on which more than 1 hour is expended.
Matters concluded - matters about which a final decision has been reached by a U.S. Attorney. Specifically includes matters filed as cases, matters declined after investigation, matters referred for disposition by U.S. Magistrates, and matters otherwise terminated without reaching court.
Migratory birds offenses - taking, killing, or possessing migratory birds, or any part, nest, or egg thereof, in viola-
tlon of Federal regulations or the transportation laws of the State, territory, or district from which the bird was taken. Misuse or nonuse of a migratory-bird hunting and conservation stamp. Violation of the regulations of Bear River Refuge and Ouchha National Forest Sanctuary and Refuge (16 U.S.C. 690(D)(G), 69M, 701, 703-6, 707(A)(B), 708-11, and 718(A)(E)(G)).
Minor offense (while on conditional release) - conviction of a crime for which the maximum sentence is incarceration for 90 days or less, probation of 1 year or less, or a fine of $500 or less. (See Introduction to Probation Statistical Reporting, Administrative Office of the U.S. Courts, 1981.)
Misdemeanor - a criminal offense punishable by a Jail term not exceeding 1 year and any offense specifically defined as a misdemeanor by the Administrative Office of the U.S. Courts for the purposes of data collection. (This category includes offenses previously called minor offenses that were reclassified under the Federal Magistrates Act of 1979.)
Mixed sentence - a sentence requiring the convicted offender to serve more than 6 months of incarceration, followed by a term of probation. Unless otherwise noted, offenders receiving mixed sentences are included in both incarceration and probation categories (see also "Split sentence").
Most serious offense - the offense with the greatest potential penalty.
Motor carrier violations - violations of the Federal statutes listed below concerning the Motor Carrier Act (15 U.S.C. 1986, 1990, and 1990(C); and 49 U.S.C. 1(7)(17)(20), 10(1), 15(11)(12),41(1), 46,301-4, 322(A)(D), 917(A)(E)(F), 1021 (A)(B)(E)(F), and 1159(A)).
Motor vehicle theft - inter-State or foreign transporting, receiving, concealing, storing, bartering, selling, or disposing of any stolen motor vehicle or aircraft (18 U.S.C. 2312 and 2313; and 49 U.S.C. 14721, 11A, 11B, NA, and NB).
116 Compendiwn of Federal Justice Statistics, 1988
Murder - committing or attempting to commit murder (first or second degree) or voluntary manslaughter within the special maritime and territorial jurisdiction of the United States (18 U.S.C. 7). Killing or attempting to kill any Government official, the President of the United States, the President-elect, the Vice President, any officers and employees of the United States, any foreign officials, any official guests, or any internationally protected persons. As applied to the owner or charterer of any steamboat or vessel, knowingly and willfully causing or allowing fraud, neglect, misconduct, or violation of any law resu~ing In loss of life (18 U.S.C. 351(A), 1111-16, 1751 A, and 2113(E); 21 U.S.C. 461 (C) and 675(C); and 49 U.S.C. 1472(Kl)).
National defense violations - violations of the national defense laws on the Selective Service Acts, the Defense Production Act, the Economic Stabilization Act of 1970 (which includes prices, rents, and wages), the Subversive Activities Control Act, alien registration, treason (including espionage, sabotage, sedition, and the Smith Act), curfew and restricted areas, exportation of war materials, trading with an enemy, and use of uniform and any other violations of the Federal statutes concerning national defense (50 U,S.C. 210, 321-29, and 824; 50 A U.S.C. 327,462,468, and 2061-66; 8 U.S.C. 1304 (d-e), 1306 (a-d); 18 U.S.C. 792-95, 797-99, 953, 2153 (a-b), 2154 (a·b), 2155 (a-b), 2156 (a-b), 2381, 2384-90; and 42 U.S.C. 2273,2274 (a-b), 2275-77, 2278 A (b), 2278 A (c)(b), and 2462 (g)).
Negligent manslaughter - causing the death of another, within the special maritime and territorial jurisdiction of the United States as defined in 18 U.S.C. 7, by wanton or reckless disregard for human life. Also negligent manslaughter of any Government official, the President of the United States, the Presidentelect, the Vice President, any officers and employees of the United States, any foreign officials, any official guests, or any internationally protected persons. This offense category also includes misconduct, negligence, or inattention to duties by ship officers on a steamboat or vessel resulting in death to any person

(18 U.S.C. 351 (A), 1112, 1114-16, and 1751(A): and 49 U.S.C. 1472(Kl)).
Nolo contendere - defendant's plea In a criminal case Indicating that he or she will not contest charges, but not admitting or denying guilt.
Not convicted - acquittal by b.ench or jury trial, mistrial, and dismissal (Including nolle prosequi and deferred prosecution ).
Offense - violation of U.S. criminal law. Where more than one offense is charged, the offense with the greatest potential penalty is reported.
Other property offenses - offenses that involve the destruction of property moving in inter-State or foreign commerce in the possession of a common or contract carrier. The malicious destruction of Government property, or injury to U.S. postal property such as mailboxes or mailbags. Trespassing on timber and Government lands is also included in this category of offenses (15 U.S.C. 1281; 16 U.S.C. 3, 9A, 45A, 45C-E, 114,121-24,146,152,l63,171,403H-4, 4'13, 430H, 4300, 430V, 460K-3, 460N-3, 460N-5, 460N-7, 471, 476-78, 478A, 479, 481-82,551, and 604-6; 18 U.S.C. 1164, 1361-64,1705-6,1851-63, 2071(A)(B), and 2072; 24 U.S.C. 286; 40 U.S.C. 53, 101, 193(E)(O)(P)-(R), and 318(C); and 43 U.S.C. 316K).
Other pubJlc-order offenses - violations of laws pertaining to abortion; bigamy; disorderly conduct on the U.S. Capitol grounds; civil disorder; hunting, trapping, or fishing on Indian lands or military areas and zones; and obscene or harassing telephone calls (18 U.S.C. 231, 1165, 1384-85, and 2101; 40 U.S.C. 193(B)-(O)(F)(G)(O)(P); and 47 U.S.C. 223). Included in "public-order, non-regulatory offenses" (q.v.).
Other regulatory offenses ~ violations of civil rights, election laws, the Communication Act (including wire tapping and wire interception), contempt, laws regarding congressional contempt, custom laws (except narcotics and liquor), importation of injurious animals
and birds, Inter-State commerce (the Connally Act, Hot 011 Act, transportation or Importation of prison-made goods, and the Railroad and Transportation Act), maritime and shipping laws, laws regarding stowaways, the Federal Boat Safety Act of 1971, the Federal Water Pollution Control Act, U.S. postal laws (excluding Injury to postal property), Intimidation of witness laws, aircraft regulations, explosives (except in vessels), the Gold Acts, train wrecking, and any other regulatory offenses not listed above. (For cUatlons refar to the United States Title and Code Criminal Offense Citations, Administrative Office of the U.S. Courts, September 1982.)
Other sex offenses - transporting, coercing, or enticing any women to go from one place to another in inter-State or foreign commerce, in the District of Columbia, or in any territory or possession of the United States with the intent and purpose to engage in prostitution, debauchery, or any other immoral purpose. Importing, maintaining, or harboring any women for purposes of prostitution or debauchery or for any other immoral pm'pose. These offenses may be either violent or nonviolent (8 U.S.C. 1328 and 18 U.S.C. 2421-24).
Parole - period of supervision after release from custody before the expiration of sentence.
Perjury - knowingly or willfully giving false evidence or swearing to false statements under oath or by any means procuring or instigating any person to commit perjury. Making any false material declarations under oath in any proceeding before or ancillary to any court or grand jury of the United States. This offense also includes any officers and employees of the Government listed under 13 U.S.C. 21-25 who willfully or knowingly furnish or cause to be furnished any false information or statement (8 U.S.C. 1357(B), 13 U.S.C. 213, 18 U.S.C. 1621-23, and 22 U.S.C. 1203).
Personal recognizance - pretrial release condition in which the defendant promises to appear at trial and no financial conditions are required to be mat.
Petty offense - criminal offense punIshable by imprisonment for a term not exceeding 6 months or a fine not more than $500 or both (18 U.S.C.1(3)).
Possession - acquiring a controlled substance by misrepresentation or fraud, attempting or conspiring to possess, or simple possession of a controlled SUbstance in schedules I-V (as defined by 21 U.S.C. 812). Also possession of a controlled substance in schedule I or II or a narcotic drug in schedule III or IVan board a vessel of the United States or vessels within custom waters of the United States or by any citizen of the United States on board a vessel. Possessing any punch, die, plate, stone, or any other thing designed to reproduce the label upon any drug or container is an offense under this category. Distributing a small amount of marijuana for no remuneration is treated as simple possession and, therefore, is included In this offense category (21 U.S.C. 843(A3)(A5), 844(A), 846, 955, and 962-63).
Pretrial diversion - an agreement to defer (and possibly drop) prosecution conditioned on the defendant's good behavior and/or participation In programs during a sta.ted period.
Pretrial release - the release of a defendant from custody, for all or part of the time before or during prosecution. The defendant may be released eUher on personal recognizance or unsecured bond or on financial conditions. The category includes defendants released within 2 days after arrest and defen· dants who were initially detained but subsequently released after raising bail or having release condUions changed at a subsequent hearing.
Property offenses, fraudulent - property offenses involving the elements of deceit or intentional misrepresentation. Specifically includes embezzlement, fraud (excluding tax fraud), forgery, and counterfeiting.
Glossary 117
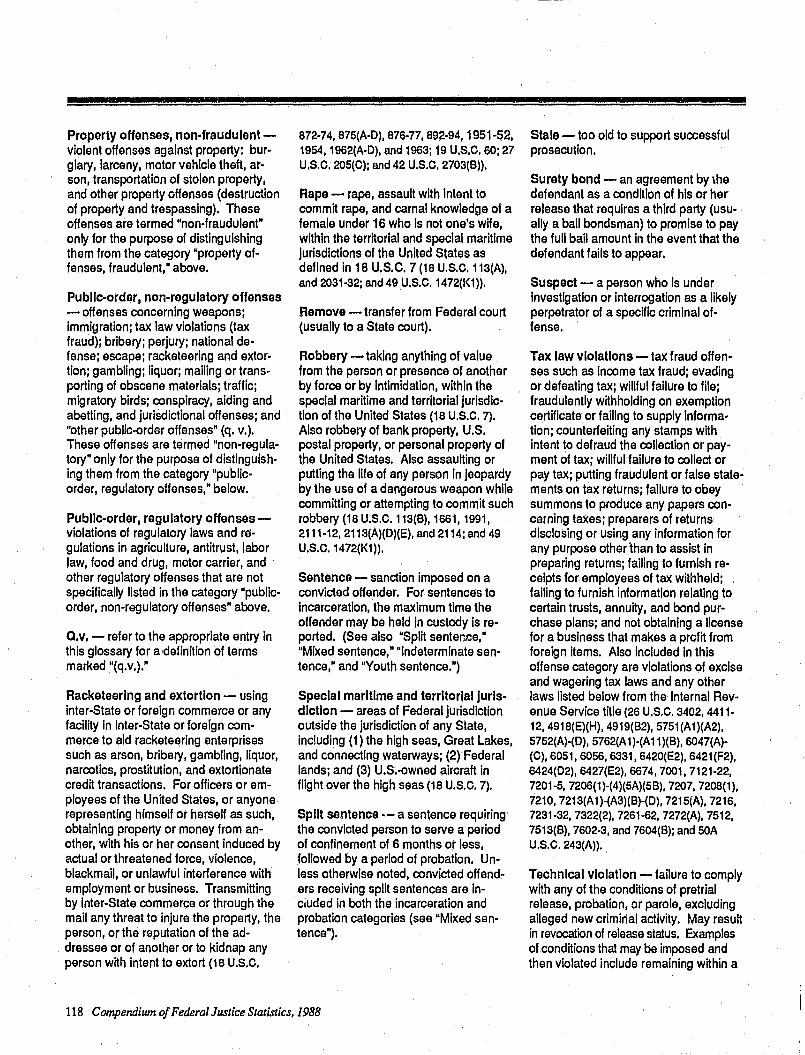
Property offenses, non-fraudulentviolent offenses against property: burglary, larceny, motor vehicle theft, arson, transportation of slolen property, and other property offenses (destruction of property and trespassing). These offenses are termed "non· fraudulent" only for the purpose of distinguishing them from the category "property offenses, fraudulent," above.
PubliCo-order, non-regulatory offenses - offenses concerning weapons; Immigration; tax law violations (tax fraud): bribery; perjury; national defanse: escape: racketeering and extortion; gambling; liquor; mailing or trans· porting of obscene materials: traffic: migratory birds; conspiracy, aiding and abetting, and jurisdictional offenses; and "other public-order offenses" (q. v.). These offenses are termed "non-regulatory" only for the purpose of distinguishIng them from the category "publicorder, regulatory offenses," below.
Publlc.order, regulatory offensesviolations of regulatory laws and regulations In agriculture, antitrust, labor law, food and drug, motor carrier, and other regulatory offenses that are not specifically listed in the category "publicorder, non·regulatory offensels" above.
a.v. - refer to the appropriate entry in this glossary for a definition of terms marked "(q.v.)."
Racketeering and extortion - using inter-State or foreign commerce or any facility In inter-State or foreign commerce to aid racketeering enterprises such as arson, bribery, gambling, liquor, narcotics, prostitution, and extortionate credit transactions. For officers or employees of the United States, or anyone representing himself or herself as such, obtaining property or money from another, with his or her consent induced by actual or threatened force, violence, blackmail, or unlawful interference with employment or business. Transmitting by inter-State commerce or through the mail any threat to injure the property, the person, or the reputation of the addressee or of another or to kidnap any person with intent to extort (18 U.S.C.
872-74, 875(A·0), 876-77, 892-94, 1951·52, 1954, 1962(A·0), and 1963: 19 U.S.C. 50; 27 U.S.C. 205(C); and 42 U.S.C. 2703(B)).
Rape - rape, assau~ with Intent to commit rape, and carnal knowledge of a female under 16 who is not one's wHe, within the territorial and special maritime Jurisdictions of the United States as defined in 18 U.S.C. 7 (18 U.S.C. 113(A), and 2031-32: and 49 U.S.C. 1472(1<1)).
Remove - transfer from Federal court (usually to a State court).
Robbery - taking anything of value from the person or presence of another by force or by Intimidation, within the special maritime and territorial jurisdiction of the United States (18 U.S.C. 7). Also robbery of bank property, U.S. postal property, or personal property of the United States. Also assau~ing or putting the life of any person In jeopardy by the use of a dangerous weapon while committing or attempting to commit such robbery (18 U.S.C. 113(B), 168 1, 1991, 2111-12, 2113(A)(0)(E), and 2114; and 49 U.S.C.1472(K1)).
Sentence - sanction imposed on a convicted offender. For sentences to Incarceration, the maximum time the offender may be held in custody is reported. (See also ·Split sentence," "Mixed sentence,· "Indeterminate sentence," and "Youth sentence.")
Special maritime and territorial Jurisdiction - areas of Federal jurisdiction outside the jurisdiction of any State, including (1) the high seas, Great Lakes, and c'Onnacting waterways: (2) Federal lands; and (3) U.S.-owned aircraft in flight over the high seas (18 U.S.C. 7).
Split sentence -- a sentence requiring the convicted person to serve a period of confinement of 6 months or less, followed by a period of probation. Unless otherwise noted, convicted offenders receiving split sentences are inciuded in both the incarceration and probation categories (see "Mixed sentence").
118 Compendium of Federal Justice Statistics, 1988
Stale - too old to support successful prosecution.
Surety bond - an agreement by \he defendant as a condition of his or her release that requires a third party (usually a ball bondsman) to promise to pay the full bail amount In the event that the defendant fails to appear.
Suspect - a person who Is under Investigation or interrogation as a likely perpetrator of a specific criminal offense.
Tax law violations - tax fraud offenses such as Income tax fraud; evading or defeating tax: willful failure to file; fraudulently withholding on exemption certificate or falling to supply Information; counterfeiting any stamps with Intent to defraud the collection or payment of tax; willful failure to collect or pay tax; putting fraudulent or false statements on tax returns; failure to obey summons to produce any papers concerning taxes; preparers of returns disclosing or using any information for any purpose other \han to assist in preparing returns; failing to furnish receipts for employees of tax withheld; falling to furnish information relating to certain trusts, annuity, and bond purchase plans; and not obtaining a license for a business that makes a profit from foreign items. Also included in this offense category are violations of excise and wagering tax laws and any other laws listed below from the Internal Revenue Service title (26 U.S,C. 3402, 4411-12,4918(E)(H), 4919(B2), 5751 (A1)(A2), 5752(A)·(0), 5762(A 1 )·(A 11 )(B), 6047(A)(C), 6051, 6056, 6331, 6420(E2), 6421(F2), 6424(02), 6427(E2), 6874, 7001, 7121·22, 7201·5, 7206(1)·(4)(5A)(5B), 7207, 7208(1), 7210, 7213(A1)·(A3)(B)-(0), 7215(A), 7216, 7231-32, 7322(2), 7261-62, 7272(A), 7512, 7513(B), 7602-3, and 7604(B); and 50A U.S.C.243(A)).
Technical violation - failure to comply with any of the conditions of pretrial release, probation, or parole, excluding alleged new criminal activity. May result in revocation of release status. Examples of conditions that may be imposed and then violated include remaining within a

specified jurisdiction, or appearing at specified Intervals for drug tests.
Threats against the President -knowingly and willfully depositing in the mall, at any post office, or by any letter carrier a letter, paper, writing, print, missive, or document containing any threat to take the life of or to Inflict bodily harm upon the President, Vice President, or any other officer in order of succession to the Presidency. Knowingly and willfully making such threats in any way to the above-named people (18 U.S.C.871).
Traffic offenses - driving while intoxicated or any moving or parking violations on Federal lands (40 U.S.C. 212 B).
Trafficking -Importing any controlled substance in schedule I, II, III, IV, or V (as defined by 21 U.S.C.812). Manufacturing, distributing, selling, or possessing with Intent to manufacture, distribute, or sell a controlled SUbstance or a counterfeit substance. Exporting any controlled substance In schedules 1-V. Manufacturing or distributing a controlled substance in schedule I or II for purposes of unlawful Importation. MakIng or distributing any punch, die, plate, stone, or any other thing designed to reproduce the label upon any drug or container or removing or obl~erating the label or symbol of any drug or container. Obtaining a prescription of a controlled substance in schedule III or IV without a written or oral prescription. Distributing for reasons other than medical a controlled substance in schedule V. illegally crossing the border if the individual is addicted to or using drugs or has been convicted of any violation of narcotics or marijuana laws (18 U.S.C. 1407; and 21 U.S.C. 825(A)-(0), 829(B)(C), 841 (A)(B1A)(B2)-(84), 842(A4)-(A8), 843(A 1 )(A2)(A5)(B), 845(A)(B), 846, 952(A)(B), 953(A)(C)(E), 954-55, 957, 959, 960(A 1 )(B2), 961 (2), and 962-63).
Transportation of stolen propertytransporting, selling, or receiving stolen goods, stolen secu~ities, stolen moneys, stolen cattle, fraudulent State tax
stamps, or articles used in coUnterfeiting If the above articles or goods Involve or constnuta Inter-State or fbrelgn commerce (18 U.S.C. 2314-17).
Trial conviction - conviction by judge or jury after trial.
True blll- an Indictment.
United States - the territory occupied by the 50 states, the District of Columbia (q.v.), Guam, Puerto Rico, and the U.S. Virgin Islands. .
U.S. Attorneys - all United States Attorneys. Prosecutorial data in this compendium come from the Docket and Reporting System of the Executive Office for U.S. Attorneys.
Unsecured bond - an agreement by the defendant as a condition of his or her release in which the defendant agrees to pay full bond amount in the event of nonappearance at trial, but is not required to post security as a condition to release.
Violation (of pretrial release, probation, or parole) - allegation of a new crime or a technical violation (q.v.) while on pretrial release, probation, or parole.
Violent offenses - threatening, attempting, or actually using physical force against a person. Includes murder, negligent manslaughter, assau~, robbery, rape, other sex offenses (some of which may be nonViolent), kidnaping, and threats against the President. (See specific offenses for citations.)
Weapons violations - violations of any of the provisions of sections 922 and 923 of title 18 concerning the manufacturing, importing, possessing, receiving, and licensing of firearms and ammunition. Manufacturing, selling, possessing, or transportirlg (within any territory or possession of the United
States, within Indian country, or within the special maritime and territorial jurisdiction of the United States) (18 U.S.C. 7) any switchblade knife. Engaging In importing, manufacturing, or dealing in firearms if not registered wnh the secretary in the Internal Revenue Service District in which the business is conducted or not having paid a special occupational tax. Carrying on the U.S. Capitol grounds or within U.S. Capitol buildings any firearm, dangerous weapon, explosive, or incendiary device (2 U.S.C. 167(0); 15 U.S.C. 1242-43; 18 U.S.C. 922(A)-(M), 923, and 924(A)-(C); l8A U.S.C. 1202(A1)-(A5),(Bl)(B5); 26 U.S.C. 5801-2,5811-12,5821-22,5841-44,5851, 5861 (A)-(L), and 5871; 40 U.S.C. 193F(A); and 49 U.S.C. 1472(L 1 )(L2)).
Youth sentence - a sentence of confinement under the Youth Gorrections Act (18 U.S.C. 5010(B)(C».
Glossary 119

Now you can receive BJS press releases and other current data from the NCJRS Electronic Bulletin Board!
The Electronic Bulletin Board provides quick and easy access to new informationuse your personal computer and modem, set at 8-N-1 (rates 300 to 2400 baud), and call 301-738-8895, 24 hours a day.
Once online, you will be able to review current news and announcements from BJS and its Justice Statistics Clearinghouse, including new publication listings and conference calendars.
For more information about the Bulletin Board, call 1-800-732-3277.

Call 800-732-3277 for free and timely reports Sourcebook of Criminal Justice Statistics
Report to the Nation on Crime and Justice
BJS Bulletins and Special Reports
Drugs and crime data
National Crime Survey reports
Law enforcement reports
Prosecution and adjudication in State courts
Corrections reports: jails, prisons, probation, parole
Privacy and security of criminal justice history data and policy
Federal justice case processing: investigation, prosecution, adjudication, corrections
International statistics
White-collar crime
Justice expenditure and employment
Your toll-free line to the Justice Statistics Clearinghouse is sponsored by the Bureau of Justice Statistics U.S. Department of Justice

U.S. Department of Justice Office of Justice Pl'ograms Bureau of Justice Statistics
~ Drugs '&' Crime Data ,t, ."'
, .
Do you know ... • what percentage of persons arrested
for felony drug offenses are released on bail?
• what proportion of felons convicted in State courts were convicted of drug offenses?
• what proportion of felony clrug trafficking convictions result from a guilty plea?
The Drugs & Crime Data Center & Clearinghouse has the answers to these questions and many more.
The Data Center & Clearinghouse-
• operates a toll-free 800 number staffed by drugs and crime information specialists
• answers requests for specific drugrelated data
• maintains a data base of more than 2,000 drugs and crime citations
• performs bibliographic searches on specific topics
• disseminates Bureau of Justice Statistics and other Department of Justice publications relating to drugs and crime
• maintains a library and reading room
• publishes reports on current topics of interest.
Do you ever ... • need statistics on drug defendants
and their sentences?
• seek information on innovative methods to expedite drug cases through the court process?
• have any questions about drug testing programs?
Are you ... • ever at a loss for a statistic?
• pressed for time?
• in a rush for information?
Call today .. D
Drugs & Crime Data Center & Clearinghouse 1-800-666-3332 The resource for drugs-and-crime data.
The Drugs & Crime Data Center & Clearinghouse is a free service funded by the Bureau of Justice Assistance (BJA) and managed by the Bureau of Justice Statistics (BJS).
... A- product o! the Drugs & Crin:'e Data Center & Clear,nghou~e . ,t:..sOO-6q6-3332
-Bureau of Justice Statistics reports (ReVised December 1991)
Call toll· free 800-732·3277 (local 301· 251·5500) to order BJS reports, to be added to one of the BJS mailing lists, or to speak to a reference specialist In statistics at the Justice statistics Clearinghouse, National Criminal Justice Reference Service, Box 6000. Rockville, MD 20850. BJS maintains the following mailing lists: • Law p.nforcement reports (new) • Drugs and crime data (naw) • Justice spending & employment • Whlte·collar crime • National Crime Survey (annual) • Corrections (annual) • Courts (annual) • Privacy and security of criminal
history Information and Information polley
• Federal statistics (annual) • BJS bulletins and special reports
(approximately twice a month) .. Sourcebook of Criminal Justice
Statistics (annual) Single caples of reports are freej usc NCJ number to order. Postage and handling are charged for bulk orders of single reports. For single caples of multiple titles, up to 10 titles are free; 11·40 tllles $10; more than 40, $20; libraries call for special rates.
Publlc·use tapes of BJS data sets and other criminal Justice data are available from the National Archive of Criminal Justice Data (formerly CJAIN), P.O. Box 1248, Ann Arbor, MI 48106 (toll.free 1-800·999·0960).
National Crime Victimization Survey The Nation's two crime measures: Uniform
Crime Reports and the National Crime Survey, NCJ·122705, 4/90
Criminal victimization In the U.S.: 1973·88 trends, NCJ·I29392, 7/91 1989 (final), NCJ.129391, 6/91 1988 (final), NCJ·122024, 10/90
BJS ~peclal reports Handgun crime victims, NCJ·123559, 7/90 Black victims, NCJ·122562, 4/90 Hispanic victims, NCJ·120SO·', 1/90 The redesigned National Crime Survey:
Selected new d2ta, NCJ·114746, 1/89 Motor vehicle theft, NCJ·l09978, 3/88 Elderly victims, NCJ·l0767f:, 11187 Violent crime trends, NCJ·l07217, 11/87 Robbery victims, NCJ.l04li38, 4187 Violent crlmo by strangers and non·
strangers, NCJ·l03702, 1/87 Preventing domestic violence against
women, NCJ·l02037, 8/86 Crime prevention measures, NCJ·l00438,
3/86 Tho use of weapons In committing crimes,
NCJ·99643, 1/86 Reporting crimes to the police, NCJ·99432,
12185 The economic cost of crime to victims,
NCJ·93450, 4/84
BJS bulletins Criminal victimization 1990, NCJ.130234,
10/91 Crime and the Nation's househOlds, 1990,
NCJ·130302, 8/91 The crime of rape, NCJ·96777, 3/85 Household burglary, NCJ·96021, 1185 Measuring crime, NCJ·75710, 2181
BJS technicat reports New directions for the NCS, NCJ·115571,
3/89 Series crimes: Report of a field test,
NCJ'104615,4187
School crime, NCJ·131645, 9/91 Teenage victims, NCJ·128129, 5/91 Female victims of violent crime,
NCJ·126826, 1/91
Redesign of the National Crime Survey, NCJ·111457,3/89
The seasonality of crime victimization, NCJ·l11033, 6/88
Crime and older Americans Inlormation package, NCJ·l04569, 5187, $10
Victimization and fear of crime: World perspectives, NCJ·93872, 1185, $9.15
The National Crime Survey: Wc.rklog papers, Current and historical perspectives, vol. I,
NCJ.75374, 8/82 Methodology studies, vol. II,
NCJ·90307, 12/84
Corrections BJS bulletins end special reports
Capitol pUnishment 1990, NCJ·131648, 9191 Prisoners In 1990, NCJ·129198, 5191 Women In prison, NCJ·127991, 4/91 Vloleht Stoto prison Inmates and their
victims, NCJ·124133, 7190 Prison rule violators, NCJ·120344. 12/89 Recidivism of prisoners released In 1963,
NCJ·116261,4189 Ilrug US9 and crime: State prison Inmate
survey, 1986, NCJ·111940, 7188 Time served In prison and on parole, 1984,
NCJ·l08544, 12187 Profilo of State prison Inmates, 1986,
NCJ·l09926, 1188 fmprlsonment In four countries,
NCJ·l03967,2187 PopUlation density In State prisons,
NCJ·l03204, 12186 State and Federal prisoners, 1925·85,
NCJ·l02494, 11186 Prison admissions and releases, 1983,
NCJ·l00582,3186 The prevalence of Imprisonment,
NCJ·93657, 7/85
Prisoners at midyear 1991 (press release), NCJ·133281, 10191
Correctional popUlations In the United States: 1989, NCJ·130445, 10/91 1988, NCJ·124280. 3/91
Race of prisoners admitted to State and Federal Institutions, 1926-86, NCJ·125618, 6/91
Natlor.al corrections reporting program, 1985, NCJ·123522, 12190
Historical statlstl~s on prisoners In State and Federal InstitUtions, yearend 1925·86, NCJ.ll1098,6188
1984 census of State adult correctional facilities, NCJ·l05585, 7/87
Census of Jails and survey of laltlnmates BJS bulletins and special reports
Drugs and lallinmates, NCJ·130836, 8/91 Jail Inmates, 1990, NCJ·129756, 6/91 Profli& of lallinmates, 1989, NCJ·129097,
4/91 Jail Inmates, 1989, NCJ·123264, 6190 Population density In local/ails, 1988,
NCJ·122299. 3190 Census of locallalls, 1988 (BJS bullelln),
NCJ·121101,2190 Jail Inmates, 1987, NCJ·114319, 12188 Drunk drlvln9, NCJ·l09945, 2188 Jail Inmates, 1986, NCJ·l07123, 10187
Census of loco I Jails 1988: Summary and methodology, vol. I,
NCJ·127992, 3191 Data for indlviduallalls In the Northeast,
Midwest, South, West, vols. 1f.V, NCJ·130759·130762,9191
Census of locallalls, 1983: Data for Individual Jails, Northeast, Midwest, South,
West, vols. I·IV, NCJ·112796·9, 11188 Selected findings, methodology, summary
tables, vol. V, NCJ·t12796, 11188
Parole and probation BJS bulletins
Probation and parole: 1990, NCJ,125833, 11191 1989, NCJ·125833, 11190 1988, NCJ·119970. 11189
BJS special reports Recidivism of young parolees, NCJ·l04916,
5187
Children in custody Census of public and private luvenile
detention, correctional, and shelter facilities, 1975·85, NCJ·114065. 6/89
Survey of youth In custody, 1987 (speCIal report), NCJ·113365. 9188
Law enforcement management BJS bulletins and special reporls
State and local police depf1ments, 1990, NCJ·133284, 12191
Sheriffs' d~partments, 1990, NCJ·133283, 12191
Profile of slate and local law enforcement agencies, 1987, NCJ·113949, 3/89
Expenditure and employment BJS bulletins
Justice expenditure and employmenl: 1988, NCJ'124132, 7/90
Antl·drug abuse formula grants: Justice variable pass·through data, 1988 (BJS technical repolt), NCJ·120070, 3/90
Justice expenditure and employment: 1988 (full report), NCJ·125619, 8/91 1985 (full repor(), NCJ·l06356, 8189 Extracts, 1984, 1985, 1988, NCJ·124139, 8191
Courts BJS bullellns
Pretrial release of felony delendants, 1988, NCJ·127202,2/91
Felony sentences In State courts, 1988, NCJ·126923, 12190
Criminal defense for the poor, 1988, NCJ·1129,9, 9/88
Slate felony courts and felony laws, NCJ·l08273,8187
rhe growth of appeals: 1973·83 trends, NCJ·96381, 2185
Case filings In State courts 1983, NCJ·95111, 10184
BJS special reports Felony case processing In State coulls,
1988, NCJ·121753, 2190 Felony case·processlng tlm~, NCJ·l01985,
8186 Felony sentencing In 18 loeal jurlcdlctlons,
NCJ·97681, 6185
Felons sentenced to probation In State courts, 1986, NCJ·124944, 11/90
Felony defendanls In large urban counties, '1988, NCJ·122385, 4190
Prolile of felons convicted 'n Stale courts, 1988, NCJ·120021, 1/90
Sentencing outcomes In 28 felony courts, NCJ·l05743,8187
The prosecution 01 felony arrests: 1987, NCJ·124140, 9/90
Felony laws of the 50 States and the District of Columbia, 1988, NCJ·l05066, 21BS, $14.60
State court m\)del statistical dictionary: Supplemef't, NCJ·98326, al85 1st edition, NCJ·62320, 9/80
Privacy and security Compendium of State privacy and security
legislation: 1989 overview, NCJ·121157, 5190 1987 overview, NCJ·l11097, 9188 1989 fu', report (1, 500 pages,
microfiche $2, hard copy $145), NCJ'I~1158, 9/90
Crimlnallustlce Information policy: Forensic DNA analysis: Issues, NCJ·128567,
6/91 Statutes requiring use of criminal history
record information, NCJ·129896, 6/91 Survey of criminal history Information
systems, NCJ·12b620, 3/91 Original records of entry, NCJ·125626,
12190 BJSISEARCH conlerence proceedings:
Criminal Justice In the 1990's: The future of Information management, NCJ·121697,5/90
Juvenile and adult records: One system, one record?, NCJ.114947, 1/90
Open vs. confidential records, NCJ·113560, 1188
Strategies for Improving data quality, NCJ·115339, 5/89
Public: access to criminal history record Information, NCJ·111458, 11188
Juvenile records and recordkeeplng systems, NCJ·112815, 11/88
Automated fingerprint Identification systems: Technology and policy Issues, NCJ·l04342,4187
Crimlnallustlce "hoI" liles, NCJ·l01850. 12186
Drugs & crime data Calalog 01 selected Federal publications
on Illegal drug and alcohol abuse, NCJ·132582, 10191
-Drugs and crime facts, 1990, NCJ·128662, 8191 State drug resources: A national directory,
NCJ·122582, 5/90 Federal drug dala for national policy,
NCJ·122715,4190 Drugs and crime lacb, 1989, NCJ·121022,
1190
Computer crime BJS special reporls
Electronic fund transfer. fraud, NCJ·96666, 3/85 and crime, NCJ·92650, 2/84
Electronic fund transfer systems fraud, NCJ·l00461, 4186
Expert witness manual, NCJ.77927. 9/81, $11.50
Federal Justice statistics Compendium of Federallustlce statistics:
1988, NCJ·130474, 12191 1988, NCJ·125617, 1/91 1985, NCJ·123560, 8/90
Federal criminal case processing, 1980·89, with preliminary data for 1990, NCJ·130526, 10/91
The Federal civil Justice syslem (BJS bulletin), NCJ·l04769, 8/87
Federal offenses and offendsrs BJS special reports
Immigration offenses, NCJ·124546. 8/90 Fe~aral criminal cases, 1&80·87,
NCJ·118311, 7189 Drug law violators, 1980·88, NCJ·111763.
6188 Pretrial release and detention: The Ball
Reform Act of 1984, NCJ·l09929, 2188 Whlte·collar crime, NCJ·l08876, 9187
General BJS bulletins and special reports
BJS telephone contacts, '91, NCJ·130133, 7/91
Tracking ollenders, 1988, NCJ·129861, 6/91 Tracking ollenders, 1987, NCJ·125315, 10190 Criminal cases In five Stales, 1983·06,
NCJ·118798,9/89 International crime rates, NCJ·ll0776, 5188
BJS national update: Jan. '92, NCJ·133097, 12/91 Oct. '91, NCJ·131778, 10/91 July '91, NCJ·129863. 7/91
Sourcebook 01 criminal Justice statlstics,l990, N(;J·13U580, 9/91
BJS program application kit, fiscal 1991, NCJ·128413, 31~1
Violent crime In the Unlled States, NCJ·127855,3/91
Attorney General's program for Improving the Nation's criminal history records and Identifying felons who attempl to purchase firearms, NCJ·128131. 3/91
BJS data report, 1989, NCJ·121514, 1191 Publications of BJS, 1985·89:
Microfiche library, PR030014, 5190, $190 Bibliography, TB0030013, 5190, $17.50
Publications of BJS, 1971-84: Microfiche library, PR030012, 10186, $203 Bibliography, TB030012, 10186, $17.50
1990 directory of automated criminal Justice Inlormatlon systems, Vol. I, Corrections, $10.60; 2, Courts, $11.50; 3, Law enforcement, free; 4, Probation and parole, $11.50; 5, Prosecution, $11.50. NCJ·12226·30, 5190
BJS annual report, fiscal 1988, NCJ·l t5749. 4189
Report to the Nation on crime and Justice: Second edillon, NCJ·l05506. 6i88 Technical appendix, NCJ·112011. 8188
Crimlnallustlce microcomputer guide and software catalog, NCJ·112178. 8/88
National survey ot crime severily, NCJ 36017. 10185
See order form on last page

Please put me on the mailing list for-
C) Law enforcement reports-national data on State and local police and sheriffs' tiepartments, operations, equipment, personnel, salaries, spending, policies, programs
C1 Federal statistics-data describing Federal case processing, from Investigation through prosecution, adjudication, and corrections
[J Drugs and crime-sentencing and time served by drug offenders, drug use at time of crime by jail inmates and State prisoners, and other quality data on drugs, crime, and law enforcement
[J Justice expenditure & employmentannual spending and staffing by Federal, State, and local governments and by function (police, courts, corrections, etc.)
To be added to any BJS mailing list, please copy or cut out this page, fill in, fold, stamp, and mail to the Justice Statistics Clearinghouse/NCJRS.
o Privacy and security of criminal history data and Information policynew legislation; maintaining and releasing Intelligence and investigative records: data quality issues
LJ BJS bulletins and special reportstimely reports of the most current justice data in all BJS data series
o Prosecution and adjudication In State courts-case processing from prosecution through court disposition, State felony laws, felony sentencing, public defenders, pretrial release
o Corrections reports-results of sample surveys and censuses of jails, prisons, parole, probation, and other corrections data
Name: Title:
Organization:
Street or box:
o National Crime Victimization Survey-the only ongoing national survey of crime victimization
o Sourcebook of Criminal Justice Statistics (annual)-broad·based data from 150 + sources with addresses; 400 + tables, figures, Index, annotated bibliography
o BJS National Update-a quarterly summary of new BJS data, programs, and information services and products
o Send me a signup form for NIJ Catalog, free 6 times a year, which abstracts private and government criminal Justice publications
You will receive an annual renewal card. If you do not return it, we must drop you from the mailing list.
City, State, Zip: ______________ _
To order copies of recent BJS reports, check here 0 and circle items you want to receive on other side of this sheet.
Daytime phone number: Criminal justice interest: ___________________ _
Put your organization and title here if you
used home address above:
--------------------FOLD. SEAL WITH TAPE. AND STAMP-------------------
U.S. Department of Justice Office of Justice Programs Bureau of Justice Statistics Washington, D.C. 20531
Justice Statistics Clearinghouse/NCJRS U.S. Department of Justice Box 6000 Rockville, MD 20850
Place 1st-class stamp here

For librarians and researchers, 20 years of criminal justice statistics in complete, convenient form - free bibliographies have subject-title index and abstract for each title
Publications of the Bureau of Justice Statistics: 1985 .. 89 (240 reports) 1971-84 (284 reports) Reports on crime, victims, offenders, and criminal justice system operations from major data series:
II National Crime Survey III Computer crime III Law enforcement management .. Prisons, jails, capital punishment III Recidivism, parole, probation
Ii! Criminal justice information policy • Federal justice statistics II Justice expenditure and employment II Bulletins and Special Reports III Courts
III Drugs and crime II Privacy and security
Order form
o Yes! Send me Publications of the Bureau of Justice Statistics, 1985·89 microfiche library with free Topical Bibliography for $190 ($200 Canada and $235 other foreign countries):
$_---CI Yes! Send me Publications of the Bureau c;(. Justice Statistics. 1971·84 microfiche library ','11th freoTopical Bibliography for $203 U.S. al'Jd Canada ($248.25 other foreign countries):
$ -..,.--:-:J Send me only the topical blbliography(ies) for Publica lions of the Bureau of Justice Statistics for $17.50 each ($18.50 Canada, ~,22.50 other foreign countries): 01985-89 $ ___ _ C! 1971-84 $ __ _
Return With payment to: ,Justice Statistics ClearinghouselNCJRS, Dept. F·AKD, Box 6000, RockVille, MD 20850
II Sourcebook of Criminal Justice Statistics • Report to the Nation on Crime and Justice
Name ~ _____ _
Title __ _
For more information, call the Justice Statistics Clearinghouse
at 800-732-3277
---.---~~~--
Agency ___________ ~ _____ ~ _____ ~ ... _
Address
Telephone L, ___ ) __ o My check for $ ~_~ __ . is enclosed.
o Charge my Visa Mastercard
Card no. EXp. date Signature ___ _ __________________ _
o Charge my NCJRS Deposit Account no, __ ~ __ _ o Government Purchase Order no. (add $2 processing fee) .~ ________ ~.~ __ Total of order: $_. ____ ~ __

U.S. Department of Justice Office of Justice Programs Bureau of Justice Statistics
Wa.lhinglon, D.C. 20531
Official Business Penalty for Private Use $300 BULK RATE
POSTAGE & FEES PAID DOJ/BJS
Pcmlit No. G-91