Embed Size (px)
Citation preview
Census 2000 Evaluation A2cApril 15 2002
Census 2000 Internet Web Site and Questionnaire Customer Satisfaction Surveys
FINAL REPORT
This evaluation reports the results of research and analysis undertaken by the US Census Bureau It is part of a broad program the Census 2000 Testing Experimentation and Evaluation (TXE) Program designed to assess Census 2000 and to inform 2010 Census planning Findings from the Census 2000 TXE Program reports are integrated into topic reports that provide context and background for broader interpretation of results
Courtney Stapleton
John Irwin
Planning Research and
Evaluation Division
CONTENTS
EXECUTIVE SUMMARY vi
1 BACKGROUND 111 Implementation of IQA and IDC 212 Development of the customer satisfaction surveys 2
2 METHODS 321 Sample design of the customer satisfaction surveys 322 Data analysis 323 The gamma statistic 324 Multi-dimensional scaling 425 Use of a log-linear model 4
251 The G2 statistic 426 Applying quality assurance procedures 5
3 LIMITS 5
4 RESULTS 641 IQA customer satisfaction survey 6
411 Were respondents satisfied with IQA 6412 What are the associations between IQA satisfaction measures 7413 From what location did users access IQA 8414 How did IQA users hear about the Census 2000 help screens 9415 IQA respondentsrsquo intention to submit census form online 10
42 IDC customer satisfaction survey 12421 Who were the IDC respondents 12422 Were respondents satisfied with IDC 12423 What are the associations between IDC satisfaction measures 14424 Log-linear modeling 15425 How useful were the IDC help topics 16426 From what location did users access IDC 19427 How did IDC users hear about the Census 2000 Internet form 20
5 RECOMMENDATIONS 2151 System Design 2152 Customer satisfaction survey implementation 2153 Research and Testing 22
ii
References 23
Appendix A-1 IQA Survey 24Appendix A-2 IDC Survey 26Appendix B Log-linear models 29Appendix C Table 13 IDC satisfaction ratings for the Census 2000 Internet Form 31Appendix D Log-linear model comparison 32Appendix E IDC response rates by day 33
iii
LIST OF TABLES
Table 1 Satisfaction ratings for IQA 7
Table 2 Associations between IQA satisfaction measures 7
Table 3 Location from which IQA users accessed Census 2000 help screens 8
Table 4 How IQA users heard about the Census 2000 help screens 9
Table 5 Percent of IQA respondents who knew about the online census forms 10
Table 6 IQA respondentsrsquo intention to submit census form online 11
Table 7 IDC satisfaction ratings for the Census 2000 Internet Form 13
Table 8 Associations between IDC satisfaction measures 14
Table 9 Usefulness of IDC help topics 17
Table 10 Usefulness of IDC help topics among respondents who used one or more help topics 18
Table 11 Location from which IDC users accessed the Census 2000 Internet Form 19
Table 12 How IDC users heard about the Census 2000 Internet Form 20
Table 13 IDC satisfaction ratings for the Census 2000 Internet Form 31
iv
LIST OF FIGURES
Figure 1 Multi-dimensional scaling for associations between IQA satisfaction measures 8
Figure 2 How IQA users heard about the Census 2000 help screens 10
Figure 3 IQA respondentsrsquo intention to submit census form online 11
Figure 4 IDC satisfaction ratings for the Census 2000 Internet Form 14
Figure 5 Multi-dimensional scaling for associations between IDC satisfaction measures 15
Figure 6 Usefulness of IDC help topics 17
Figure 7 Usefulness of IDC help topics among respondents who used one or more help topics 19
Figure 8 How IDC users heard about the Census 2000 Internet Form 21
v
EXECUTIVE SUMMARY
Census 2000 marks the first time in the history of the decennial census that the US Census Bureau provided respondents with the option to submit their census form via the World Wide Web As part of a comprehensive plan to simplify public participation and to increase response rates to Census 2000 Census Bureau staff designed a single web site to service Internet users The site contained two major components Internet Questionnaire Assistance and Internet Data Collection The overall objectives were to provide census respondents with a highly secure Internet filing option to the paper-based short form questionnaire and to assist respondents with completing their census questionnaire
The purpose of this evaluation is to measure respondent satisfaction with the Internet Questionnaire Assistance and the Internet Data Collection We conducted customer satisfaction surveys with users of each system We use these survey results to analyze the degree of respondent satisfaction with each system
Were users satisfied with the Internet Questionnaire Assistance Most respondents were not satisfied with the Internet Questionnaire Assistance Nearly 62 percent of the respondents indicated that overall they were not at all satisfied with the Internet help screens While nearly 77 percent of the respondents found it easy or very easy to understand the help screen information about 58 percent said it was not at all easy to find the help topics for which they were searching In addition 65 percent of the respondents stated that the help screen information was not at all helpful These findings suggest that while the information presented on the site was easy to interpret it may not have been the appropriate information for the users
We should note however that those respondents who did find the information helpful were more satisfied overall Helpfulness of the help screen information was highly associated with overall satisfaction with the Internet help screens
While the information on Internet Questionnaire Assistance was easy to understand it was difficult to locate and generally unhelpful In short the Internet Questionnaire Assistance did not provide the information that respondents were seeking However the high correlation between helpfulness and overall satisfaction indicates how we might improve customer satisfaction -- by focusing future improvements on IQA elements that are helpful to users
Were users satisfied with the Internet Data Collection We took satisfaction measures on the following seven aspects of the Census 2000 Internet Form (1) time required to load the form (2) moving through the form (3) availability of help screens (4) understanding the help screen information (5) ease of sending the form (6) security and confidentiality procedures and (7) overall satisfaction Respondents were largely satisfied with most of the seven aspects related to the Census 2000 Internet Form The percent of respondents indicating they were satisfied or very satisfied with a specific aspect was as high as 94 percent (for the item lsquoease of sending formrsquo) However satisfaction lapsed slightly for the two items which dealt with help screens availability of help screens and understanding the help information (74 percent and 73 percent respectively)
vi
While users were less satisfied with the Internet Data Collection help screens and help information it is important to note that most respondents did not use help while completing the Census 2000 Internet Form The percentage of respondents who chose lsquoNot Applicablersquo on questions about the usefulness of specific help topics ranged from nearly 69 percent to over 85 percent
Overall 91 percent of respondents were satisfied with the Census 2000 Internet Form Given the high levels of customer satisfaction Internet Data Collection demonstrated a strong potential for large-scale implementation in 2010
The customer satisfaction surveys provided invaluable information regarding how well users perceived the Census 2000 web site From these findings come our recommendations for improvements and for further research and exploration Our key recommendations include
bull Implement a content redesign of the Internet census help instrument While respondents found the help screen information easy to understand they were generally unsatisfied with the information presented The Internet Questionnaire Assistance help information on specific census topics came primarily from the Questionnaire Reference Book and focused on questions about the census questionnaire Respondents had questions about much more than just the questionnaire We need to update and enhance the information available from the Questionnaire Reference Book as well as investigate the use of other resources that would provide helpful information to users
bull Conduct research on knowledge and perceptions of the decennial census as well as the needs of potential users of the Census 2000 web site While the implementation of the Census 2000 web site was somewhat small scale it is important to put more focus on research for future projects or there will be severe limitations for a similar large-scale project in 2010 Design research based on these survey findings
bull Look beyond restricting online assistance to questionnaire help To maximize customer satisfaction we should investigate all kinds of relevant census information that may be helpful to users
bull Conduct an evaluation during the 2004 Census Test in which evaluation methodologies and production requirements are developed simultaneously
vii
1 BACKGROUND
The Census Bureau is committed to the application of technological innovations to make participation in the census enumeration simple for US residents As in the past the primary mode of responding to Census 2000 was the mailing of a paper census form However as part of a comprehensive plan to simplify public participation and to increase response rates Census Bureau staff designed a single web site that serviced Internet users who needed questionnaire assistance andor wanted to electronically fill out and submit a completed census form
Interest in the implementation of web surveys has increased dramatically in recent years Dillman (2000) points out that new research is needed for identifying the best means of helping web surveys achieve their potential as an effective means for conducting sample surveys In April 1997 the Census Bureau conducted a proof-of-concept study of collecting data via the Web In that study Nichols and Sedivi (1998) developed and tested a Computerized Self-Administered Questionnaire (CSAQ) with 50 companies in the 1996 Industrial Research and Development Study They found enough positive respondent reaction to continue pursuing data collection using the Web
Internet questionnaire assistance and data collection are new to the decennial census and were not available prior to Census 2000 An increase in public awareness and use of the Internet presents new opportunities for questionnaire administration Originally the Census 2000 Dress Rehearsal planned to include Internet Data Collection (IDC) However based on the public perception that the Internet was insecure the Census Bureau canceled Internet data collection plans (Coon 1999)
For Census 2000 we revisited IDC and implemented strict security measures This was also the first time we implemented Internet Questionnaire Assistance (IQA)
The major objectives of the Census 2000 IQA effort were to
bull provide online help to respondents who need assistance completing traditional paper forms (long and short)
bull provide online help to respondents who need assistance completing the web-based Internet short form (IDC questionnaire)
bull allow respondents to search for help on specific questionnaire items bull provide general information about the census form and bull provide answers to Frequently Asked Questions (FAQs) about Census 2000
(Coon 1999)
IQA consisted of a collection of webpages and contained all of the materials from the Census 2000 Questionnaire Reference Book (QRB) and other general Census 2000 information It allowed users to search an alphabetic list of topics or select a popular help topic from a pull down menu The QRB contained descriptions relating to the use of and how to fill out each questionnaire item The QRB was also adapted for the Census 2000 Telephone Questionnaire Assistance (TQA) operation Along with information from IQA and TQA specifications the
1
QRB formed the basis of a core knowledge database which underlies both the TQA and IQA systems for Census 2000
The major objectives of the Census 2000 IDC effort were to
bull supplement more traditional data collection methods bull develop experience in IDC for forthcoming censuses and bull provide respondents with another response option (Coon 1999)
Census respondents were eligible to answer an English language version short-form questionnaire on the Census 2000 web site if they could provide a valid 22-digit housing unit ID Valid housing unit IDs included those from the following forms
bull MailoutMailback Short Form [D-1] bull UpdateLeave Short Form [D-1(UL)] bull Puerto Rico UpdateLeave Short Form [D-1(UL)PR] bull Response Mode and Incentive Experimental Short Forms [S-9001 S-9004
S-9007]
Census Bureau staff designed the Census 2000 Internet Form to mirror the paper form as closely as possible within technical constraintslimitations That is the wording of the questions and the skip patterns were the same Like the paper form the electronic form had space to provide data for six persons and names for up to 12 persons Restricted access to the Census 2000 Internet Form by means of the 22-digit housing unit ID prevented unauthorized access to the system
11 Implementation of IQA and IDC
IQA was online from March 3 2000 to July 7 2000 IDC was brought online on March 3 2000 for stateside and Puerto Rico UpdateLeave operations However the mailoutmailback version was not brought online until March 13 2000 IDC was taken off-line on April 18 2000 when the Census Bureau began Nonresponse Followup (NRFU) As part of the Response Mode Incentive Experiment (RMIE) a special mailing was sent to a selected group of people determined to be nonrespondents which asked them to complete their census form via the Internet The web site for these NRFU people was available from April 29 2000 to June 3 2000
12 Development of the customer satisfaction surveys
In 1993 the National Performance Review (now known as the National Partnership for Reinventing Government) was formed to help create customer focused government and the Congress passed nearly 100 laws to support a more effective and efficient government Since then a key goal of the government is to ensure that the Federal government provides the highest quality services to the American people The Census Bureau believes strongly in the importance of excellent customer service and has defined five standards of customer service1 The standard
1The five standards are Excellence Timeliness Responsiveness Accessibility and Commitment
2
of accessibility states that the Census Bureau will provide its customers with choices for products services and the means of delivery To do this the Census Bureau will periodically survey their customers to assess their needs and will use the results of these customer surveys for product development In support of this government-wide initiative to measure customer satisfaction with government services we conducted customer satisfaction surveys with users of IQA and IDC
2 METHODS
21 Sample design of the customer satisfaction surveys
We selected a sample of IQA users to fill out the survey by a link made available on various pages throughout the IQA system For IDC we selected the sample from respondents who successfully submitted their census form online Additionally all NRFU respondents selected through the RMIE had the option of completing the survey
The sample designs for both IDC and IQA are as follows
bull The IQA universe includes all IQA users We selected a sample of these users based on time The survey was initially open to IQA users who visited during a pre-selected five-minute window each hour However on April 6 2000 the window was increased to 15 minutes for the remainder of the data collection period because of low response to the survey
bull The IDC universe includes only those respondents who submit their census questionnaire via the Census 2000 web site We selected a sample of these respondents based on time that is the survey was open to respondents who submitted their census form online during a pre-selected five-minute window each hour The survey was available for five minutes each hour for every hour of the day
22 Data analysis
To analyze the customer satisfaction survey data we will present various descriptive statistics Frequencies proportions and unweighted means and variances are presented in tables to summarize describe and organize the data
23 The gamma statistic
Our survey data is ordinal by nature A basic question usually posed when analyzing ordinal data is ldquoDoes Y tend to increase as X increasesrdquo Bivariate analyses of interval-scale variables often summarize covariation by the Pearson correlation which describes the degree to which Y has a linear relationship with X Ordinal variables do not have a defined metric so the notion of linearity is not meaningful However the inherent ordering of categories allows consideration of monotonicityndashthat is whether Y tends to increase as X does (Agresti 1990)
3
The gamma statistic is a measure of association for ordinal variables and is analogous to the Pearson correlation It describes the degree to which the relationship is monotone When comparing two respondents on an ordinal scale we can classify the pair of respondents as concordant or discordant Agresti (1990) states ldquoThe pair is concordant if the subject ranking higher on variable X also ranks higher on variable Y The pair is discordant if the subject ranking higher on X ranks lower on Y The pair is tied if the subjects have the same classification on X andor Yrdquo
The sample gamma is defined
=
where C is the total number of concordant pairs and D is the total number of discordant pairs
24 Multi-dimensional scaling
We used multi-dimensional scaling to create a simultaneous graphical representation of all the estimated gammas According to Borg (1997) multi-dimensional scaling represents a measure of relative similarity or dissimilarity among pairs as distances between points of a low-dimensional multi-dimensional space In our case we use the gamma statistic as a measure of association in a two-dimensional space The points are configured such that their distances correspond to the gamma values That is two points that are close together are highly associated relative to two points that are far apart
25 Use of a log-linear model
There are many situations where several factors interact with each other in a multivariate manner We used a log-linear model to analyze our categorical data They describe the means of cell counts in a multidimensional table and do not look upon any one variable or dimension as the response to the others (Zelterman 1990) We build and select a log-linear model that best describes the relationship between seven IDC satisfaction measures
251 The G2 statistic
When building a log-linear model we compute the G2 statistic as a measure of how well the model fits We then compare the G2 of different models to determine which best fits the data ie describes the associations The associations that are in our final model are significant and those not in the final model are not The G2 statistic is defined
Where denote the multinomial vector with respective fitted values according
to some log-linear model The G2 statistic lsquoquantifiesrsquo the difference between the and When these are very different from each other we are generally dissatisfied with the model
4
being fitted If and are closer in value we havenrsquot proved the model is correct but rather feel less anxious about drawing inferences from the model (Zelterman 1990) See Appendix B for more information on log-linear models
26 Applying quality assurance procedures
We applied quality assurance procedures throughout the creation of this report They encompassed how we determined evaluation methods created specifications for project procedures and software designed and reviewed computer systems developed clerical and computer procedures analyzed data and prepared this report For a description of these procedures see the binder ldquoCensus 2000 Evaluation Program Quality Assurance Processrdquo
3 LIMITS
When considering the results of the evaluation keep in mind several limits
bull Because of the unique environment of the Internet and the administration methods of our survey we are unable to identify the exact number of people exposed to the IQA survey invitation We can only identify the number of lsquohitsrsquo to the survey link which is not equivalent to the number of unique people exposed to the link2 Therefore it is impossible to compute an accurate response rate for IQA
bull Historically customer satisfaction surveys have low response rates Therefore nonresponse bias may limit the generalization of the survey data
bull Due to the self-selected response nature of the surveys the results may suffer from response bias Respondents are likely to represent customers with stronger feelings (very satisfied or very dissatisfied) compared to those who donrsquot take the time to respond (Wellens and Martin) This effect may be evident in the overwhelming satisfaction of the IDC customer satisfaction survey respondents
bull RMIE survey respondents were ultimately excluded from this analysis because their selection process was different than all other survey respondents In addition there were not enough RMIE respondents to produce reliable estimates of group differences
2Web page hits are not an accurate measure of web traffic volume They can be used as a relative measure of
one pagersquos hits relative to another pagersquos hits or one serverrsquos hits relative to another serverrsquos Web hits are a poor
measure of traffic volume but in most cases it is the only measure available
5
4 RESULTS
41 IQA customer satisfaction survey
Response to the IQA customer satisfaction survey was low with just 234 completed surveys We were unable to compute a response rate as the number of people who saw or clicked on the link to the survey is unknown As described in Section 3 access to the survey was tracked in lsquohitsrsquo and there is not a stable way to relate lsquohitsrsquo to number of people
411 Were respondents satisfied with IQA
Nearly 62 percent of the respondents indicated that overall they were not at all satisfied with the Internet help screens While nearly 77 percent of the respondents found it easy or very easy to understand the help screen information about 58 percent said it was not at all easy to find the help topics for which they were searching In addition 65 percent of the respondents stated that the help screen information was not at all helpful
These findings suggest that while the information presented on the site was easy to interpret it may not have been the appropriate information for the users That is IQA did not provide the information that users were seeking Mayhew (1992) notes that ldquofancy formatting navigational ease and ease of accesswill not be of much use if the information contained in the help system is not the information users seek Clearly basic research into help content is requiredrdquo Mayhew also provides some basic principles and guidelines to be used when designing on-line help These include
bull Make help visible ldquoadvertiserdquo bull Make it complete and accurate bull Organize help around user tasks and goals bull Provide different levels of detail under user control
Horton (1990) suggests similar guidelines including ldquodo not merely replicate or mimic the exact features of paper documentsrdquo
Table 1 presents data obtained from respondents who rated the following items on a three-point scale (1) ease of finding help topics (2) ease of understanding the help screen information (3) helpfulness of help screen information and (4) overall satisfaction with help screens
6
Table 1 Satisfaction ratings for IQA
1 Ease of finding help topics
2 Understanding the help screen
information
3 Helpfulness of the help screen
information
N Percent Percent Percent
No t at a ll Easy Ver y easy
easy
225 578 213 209
(330) (274) (272)
220 232 482 286
(285) (338) (305)
N Percent Percent Percent
No t at a ll Helpful Very
helpful helpful
217 650 217 134
(338) (280) (231)
N Percent Percent Percent
No t at a ll Satisfied Very
satisfied Satisfied
4 Overall satisfaction with help screens 220 618 264 118
(328) (298) (218)
dagger Standard errors appear in parentheses
412 What are the associations between IQA satisfaction measures
We used the gamma statistic as a measure of association for the ordinal IQA variables We found a strong association between helpfulness of the help screen information and overall satisfaction with the help screens (09693) Overall satisfaction is also highly associated with ease of finding help information (08606) and understanding the help information (07167) Table 2 shows the gamma statistics used to examine the relationship between the same four measures studied in Table 1 We are primarily interested in how each measure is associated with overall satisfaction
Table 2 Associations between IQA satisfaction measures
Ease of finding Understanding Helpfulness Overall satisfaction
1 Ease of finding 10000 06607 07890 08606
2 Understanding 10000 05291 07167
3 Helpfulness 10000 09693
4 Overall satisfaction 10000
7
--- ---
--- ---
--- ---
Figure 1 presents the same results in a graphical representation using multi-dimensional scaling As we can see helpfulness of the help screen information (3) is the closest point to overall satisfaction (4) hence the strongest association
Figure 1 Multi-dimensional scaling for associations between IQA satisfaction measures
413 From what location did users access IQA
Seventy-six percent of the respondents accessed the site from home while 18 percent accessed from work There were less than 10 respondents each for the lsquolibraryrsquo lsquoschoolrsquo or lsquosome other locationrsquo categories Table 3 shows the locations from which IQA users primarily accessed the Census 2000 Internet help screens Some data are withheld due to insufficient sample sizes
Table 3 Location from which IQA users accessed Census 2000 help screens
Location Frequency Percent
Home
Work
Library
School
Other
Total
dagger Standard errors appear in parentheses
169 765
(286)
40 181
(260)
221 100 0
8
--- ---
--- ---
--- ---
---
414 How did IQA users hear about the Census 2000 help screens
The most often cited source was the TQA toll-free line (32 percent) This is not surprising since the initial telephone greeting told callers they could obtain help at any time at www2000censusgov The main Census web site (wwwcensusgov) was noted by approximately 23 percent of the respondents This site contained a direct link to the Census 2000 web site A good number of respondents (14 percent) selected the media (televisionnewspaperradio) as their source Respondents indicated where they heard about the Census 2000 Internet help screens by marking one or more of the ten given categories
Table 4 gives the distribution of how users heard about the help screens Respondents could mark more than one answer therefore responses do not add to 100 percent Some data are withheld due to insufficient sample sizes Figure 2 presents the same information in a bar graph
Table 4 How IQA users heard about the Census 2000 help screens
Source Frequency Per cent of T ota l
of Respon dents
M ain U S Ce nsus B ureau web site 50 233
(289)
Internet service provider (ISP) 10 47
(144)
M ajor web site
Internet news web site
Other Internet site
TelevisionRadioNewspaper (Media) 29 135
(234)
Toll free Census telephone help line 69 321
(319)
Census In Schools program ---
Letter attached to the Census form 27 126
(227)
Other 28 130
(230)
Total of R espondents 215 NA
dagger Standard errors appear in parentheses
daggerdagger Respondents could mark more than one response
NA ndash Table does not add to 100 percent
9
Figure 2 How IQA users heard about the Census 2000 help screens
415 IQA respondentsrsquo intention to submit census form online
We designed two survey questions to obtain an estimate of the proportion of IQA users who intended to submit their census form through IDC (See Questions 4 and 5 in Appendix A-1) Of all respondents just 16 percent intended to submit their census form online Of those who did not intend to submit their census form online 20 percent noted that they had already completed the paper form and 15 percent noted that their form type was not available to complete online
As shown in Table 5 about half of the respondents knew that some forms were available to complete online Table 6 presents the breakdown of respondentsrsquo intention to submit their census form online It also gives the reasons why respondents chose not to submit their census form online Respondents could mark more than one reason Figure 3 presents the same information in a bar graph
Table 5 Percent of IQA respondents who knew about the online census forms
Knowledge of availability
Yes
No
Total
daggerStandard errors appear in parentheses
Frequency Percent
115 516
(335)
108 484
(335)
223 100 0
10
Table 6 IQA respondentsrsquo intention to submit census form online
Intention to submit the form Frequency Percent of Total
of Respondents
Yes
No
Form not available
Unsuccessful submission
Security concerns
Prefer paper form
Already completed paper form
Other reasons
Not sure
Total of Respondents
35 159
(247)
188 855
(238)
33 150
(241)
17 77
(180)
15 68
(170)
30 136
(232)
45 205
(273)
48 218
(279)
20 91
(194)
220 NA
dagger Standard errors appear in parentheses
daggerdagger Respondents could mark more than one response
NA - Table does not add to 100 percent
Figure 3 IQA respondentsrsquo intention to submit census form online
11
42 IDC customer satisfaction survey
Response to the IDC customer satisfaction survey was much higher than to the IQA survey There were 3226 completed surveys We estimated response rates by each day in the data collection period for an overall average response rate of 585 percent (See Appendix E for daily response rates)
421 Who were the IDC respondents
We were able to obtain a demographic profile of IDC respondents by matching their 22-digit census ID to their IDC survey responses We found that the IDC respondents were primarily male (75 percent) white (78 percent) not of Hispanic origin (92 percent) and 25-54 years old (77 percent) This profile reflects the first person listed on the census form and may not be the customer satisfaction survey respondent in all cases Thus our finding that over 75 percent of our respondents were male is likely a reflection of census respondentsrsquo tendency to list the male head of household as the first person on the census form regardless of who is the actual respondent (DeMaio and Bates 1990)
422 Were respondents satisfied with IDC
Overall 91 percent of respondents were satisfied with the Census 2000 Internet Form Additionally respondents were satisfied with nearly all aspects of the Census 2000 Internet Form with satisfaction levels as high as 94 percent Satisfaction lapsed slightly for the two items which dealt with the help screens availability of help screens and understanding the help information (74 percent and 73 percent respectively)
We should note that respondents answered the two items concerning help screens nearly identically therefore it is likely that they may not have made a distinction between the two questions For these two items we also included the percent by only those respondents who actually used help screens We see that respondents who used help screens were somewhat more satisfied with the availability of help information and understanding the help information (83 percent and 82 percent respectively) than all respondents taken together That is some respondents who didnrsquot use any help screens tended to rate them on the lower end of the scale rather than selecting lsquoNot Applicablersquo
Table 7 presents respondentsrsquo level of satisfaction with certain aspects of the Census 2000 Internet Form Respondents indicated on a 5-point scale their level of satisfaction with each of the following items
(1) time required to load the form(2) moving through the form(3) availability of help screens (4) understanding the help information(5) ease of sending the form(6) security and confidentiality procedures and(7) overall satisfaction
12
In Table 7 lsquoSatisfiedrsquo reflects the selection of a four or five on the five-point response scale (See Appendix C for a complete breakdown of responses) Although a score of three represents neither satisfaction nor dissatisfaction we excluded these counts to obtain a conservative estimate of satisfaction Figure 4 presents the same data in a bar graph
Table 7 IDC satisfaction ratings for the Census 2000 Internet Form
Variable
1 Time required to load the form
2 Moving through the form
3 Availability of help screens
Among Help Users Only
4 Understanding the help information
Among Help Users Only
5 Ease of sending the form
6 Security and confidentiality procedures
7 Overall Satisfaction
dagger Standard errors appear in parentheses
N Percent
Satisfied
3216
3210
3118
1593
3096
1587
3199
3192
3198
922
(047)
905
(052)
737
(079)
831
(094)
725
(080)
816
(097)
942
(042)
879
(058)
910
(051)
This row includes only those respondents who used at least one help screen
13
Figure 4 IDC satisfaction ratings for the Census 2000 Internet Form
423 What are the associations between IDC satisfaction measures
We used the gamma statistic as a measure of association for the ordinal IDC variables We found a strong association between availability of the help screens and understanding the help information (09461) This strong association confirms our earlier claim that respondents answered these two questions similarly Overall satisfaction is highly associated with ease of sending the form (08820) moving through the form (08604) and time required to load the form (08420)
Table 8 presents the gamma statistic which examines the relationship between the seven measures studied above We are primarily interested in how each measure is associated with overall satisfaction
Table 8 Associations between IDC satisfaction measures
Gamma 1 2 3 4 5 6
1 Time required to load the form 10000 09050 07072 07044 09408 08063 08420
2 Moving through the form 10000 07546 07310 09349 07943 08604
3 Availability of the help screens 10000 09461 07552 07105 06794
4 Understanding the help information 10000 07520 07088 06852
5 Ease of sending the form 10000 08817 08820
6 Security and confidentiality 10000 08040
procedures
7 Overall satisfaction 10000
14
7
Figure 5 gives the multi-dimensional scaling of the seven measures In Figure 5 we see that the time required to load the form (1) ease of moving through the form (2) and ease of sending the form (5) are the three closest points to overall satisfaction (7) indicating that each has a strong association with overall satisfaction
Figure 5 Multi-dimensional scaling for associations between IDC satisfaction measures
424 Log-linear modeling
In Table 8 there is no clear definition of what is considered a significant association According to Agresti (1990) for an I x J table it is rarely possible to summarize association by a single number without some loss of information We used a log-linear model to further describe the relationship between the IDC satisfaction measures Just as a multiple regression model is more informative than a simple correlation the log-linear model describes associations and provides more information than the univariate gamma statistic We examined all the possible interactions of the seven variables that describe IDC satisfaction We systematically fit several models to find which interactions are needed to explain the data well
Our best model includes almost all of the possible two-way interactions excluding the interactions ABBGBECDCG3 (See Appendix D for a log-linear model comparison) That is all two way interactions are important in describing satisfaction except
3A=Time required to load the form E =Ease of sending the formB=Availability of help screens F=Security and confidentiality concernsC=Understanding of help information G=Overall SatisfactionD=Moving through the form
15
bull time required to load the form and availability of the help screens (AB) bull availability of the help screens and overall satisfaction (BG) bull availability of the help screens and ease of sending the form (BE) bull understanding the help information and moving through the form (CD) bull understanding the help information and overall satisfaction (CG)
Three of the non-significant interactions (ABBECD) are not surprising We wouldnrsquot necessarily expect these interactions to be important The non-significance of the interactions (BGCG) is however quite intriguing One could assume that every variable would be significantly associated with overall satisfaction We see that this isnrsquot the case for availability of the help screens and understanding the help information Thus the interactions of availability of the help screens and understanding the help information with overall satisfaction are not as important in describing the data as the other variables with overall satisfaction
Recall that the gamma statistic relates the relative degree of association between two variables The gamma values for the interactions of availability of help screens and understanding the help information with overall satisfaction were smaller than the other variablesrsquo association with overall satisfaction This is consistent with our final log-linear model The associations might also be low because as we will see in Table 9 not many respondents used the help screens Therefore in general respondents may not have had a strong opinion concerning the help screens
425 How useful were the IDC help topics
On the whole just about half of the respondents used one or more help topics Of those respondents who did use the help screens most were satisfied Respondents rated the usefulness of the twelve help topics embedded in the online census form Respondents found information on these twelve topics by clicking on the blue linked text throughout the census form
Before discussing the usefulness of these items it is important to note that the respondents did not use the IDC help links often The percent of respondents who reported that they did not use the help links ranged from nearly 69 percent to 85 percent for each particular help topic This is important to note as it reflects other literature that suggests that users rarely use help when available Mayhew (1992) suggests that ldquousers worry that if they go into help they will not be able to get back to the place where they were working Remembering how to navigate in help adds a burden to short-term memory The help information may obscure part of the screen interrupting the userrsquos primary task and causing loss of contextrdquo Schneiderman (1998) suggests that ldquousersrsquo navigation among online help segments should be recorded and studied so that we can gain a better understanding of what help segments are effectiverdquo
Table 9 and Figure 6 show the percent of respondents who used the help links for each particular help topic Table 10 and Figure 7 present the usefulness ratings of only those respondents who used at least one help topic The percent of respondents who marked topics lsquovery usefulrsquo ranged from 49 percent (Race) to 69 percent (SecurityConfidentiality) The help topics most prevalent in the lsquonot at all usefulrsquo category were Hispanic origin (20 percent) Race (18 percent) and Telephone number (16 percent)
16
Table 9 Usefulness of IDC help topics
Help Topics N Percent
Use d H elp
Ve rify form a uthenticity 3071 305
(083)
Numbe r of pe ople in 3048 178
household (069)
Hom e ownershiprent 3046 170
(068)
Name 3044 161
(067)
Rela tionship 3032 145
(064)
Age Date of birth 3031 174
(069)
Hisp anic o rigin 3022 150
(065)
Race 3032 185
(070)
Telephone number 3026 160
(067)
Submitting the form 3032 211
(074)
SecurityCo nfidentiality 3023 311
(084)
OM B approval number 2998 201
(073)
dagger Standard errors appear in parentheses
Figure 6 Usefulness of IDC help topics
Percent
Did not use help
695
(083)
822
(069)
830
(068)
839
(067)
855
(064)
826
(069)
850
(065)
815
(070)
840
(067)
789
(074)
689
(084)
799
(073)
17
Table 10 Usefulness of IDC help topics among respondents who used one or more help topics
Help Topics N
Verify form authenticity 936
Number of people in household 542
Home ownershiprent 519
Name 489
Relationship 441
AgeDate of birth 528
Hispanic origin 452
Race 560
Telephone number 484
Submitting the form 641
SecurityConfidentiality 940
OMB approval number 604
dagger Standard errors appear in parentheses
Percent Percent Percent
Not at all Useful
(1)
62
(079)
87
(121)
93
(127)
110
(142)
102
(144)
87
(123)
199
(188)
179
(162)
163
(168)
52
(087)
44
(067)
68
(102)
18
Useful Very Useful
(2) (3)
329 609
(154) (160)
308 605
(199) (210)
357 551
(210) (219)
342 548
(215) (225)
345 553
(227) (237)
309 604
(201) (213)
299 502
(216) (235)
330 491
(199) (211)
333 504
(214) (228)
275 674
(176) (185)
269 687
(145) (151)
263 669
(179) (192)
--- ---
--- ---
Figure 7 Usefulness of IDC help topics among respondents who used one or more help topics
426 From what location did users access IDC
Eighty-five percent of respondents submitted their Census 2000 Internet Form from home while almost 14 percent accessed the site from work Less than one percent submitted their form from a school or some other place Fewer than ten respondents selected lsquolibraryrsquo Table 11 shows the locations from which IDC users primarily accessed the Census 2000 Internet Form Some data are withheld due to insufficient sample size
Table 11 Location from which IDC users accessed the Census 2000 Internet Form
Location Frequency Percent
Home
Work
School
Library
Some other place
Total
daggerStandard errors appear in parentheses
2728 853
(063)
435 136
(061)
22 07
(015)
3199 100 0
19
---
427 How did IDC users hear about the Census 2000 Internet form
The media (televisionradionewspaper) was the most marked answer with over 52 percent This is not surprising since IDC was not a part of the Census 2000 advertising campaign and publicity came primarily from the media The Census 2000 Home Page was marked by over 14 percent of respondents Surprisingly almost ten percent of respondents said that they heard about the Census 2000 Internet Form through the letter attached to the Census form However only households selected for the RMIE actually received a letter informing them of the Internet filing option Respondents may have confused this response option with the advance letter which contained the Census web address but did not mention the Census Internet Form
Table 12 gives the distribution of where users heard about the Census 2000 Internet Form Respondents indicated where they heard about the Census 2000 Internet Form by marking one or more of the 11 given categories Since respondents could mark more than one response the responses do not add to 100 percent Figure 8 presents the information in a bar graph
Table 12 How IDC users heard about the Census 2000 Internet Form
Source Frequency Percent of Total
Census 2000 H ome Page
Main US Census Bureau web site
Internet service provider
Major web site
Internet news web site
Other Internet site
TelevisionRadioNewspaper (Media)
Toll free Census telephone help line
Census In Schools program
Letter attached to the Census form
Other
Total of Respondents
daggerStandard errors appear in parentheses
of Respondents
454 143
(062)
187 59
(042)
288 91
(051)
103 33
(032)
183 58
(041)
136 43
(036)
1658 524
(089)
169 53
(040)
28 09
(017)
310 98
(053)
342 108
(055)
3167
daggerdaggerRespondents could mark more than one response
The letter was included with Census materials only for those households selected for the RMIE
20
Figure 8 How IDC users heard about the Census 2000 Internet Form
5 RECOMMENDATIONS
The customer satisfaction surveys provided some very insightful information regarding how well the users perceived the Census 2000 web site Overall respondents were quite satisfied with IDC On the other hand users were generally unsatisfied with IQA and the help information contained within Taken together these results suggest a variety of areas for further research and exploration
51 System Design
bull Implement a content redesign of the Internet census help instrument While respondents found the help screen information easy to understand they were generally unsatisfied with the information presented The IQA help information on specific census topics came primarily from the QRB and focused on questions about the census questionnaire Respondents had questions about much more than just the questionnaire We need to update and enhance the information available from the QRB as well as investigate the use of other resources that would provide helpful information to users
52 Customer satisfaction survey implementation
bull To increase survey quality with better user representation consider alternate survey implementation choices such as a pop-up survey rather than a link Advantages of using a pop-up survey include
-Systematic selection of every lsquonthrsquo visitor -Survey automatically pops up on screen (using a new browser window) -Use of ldquocookiesrdquo to ensure that each user only completes the survey once
21
53 Research and Testing
bull Conduct research on knowledge and perceptions of the decennial census The implementation of the Census 2000 web site was somewhat small scale and did not require extensive research prior to implementation However it is important to put more focus on research for future projects or there may be severe implications for a similar large-scale implementation in 2010 Design research based on these survey findings
bull Look beyond restricting online assistance to questionnaire help To maximize customer satisfaction we should investigate all kinds of relevant census information that may be helpful to users
bull Incorporate usability testing to explore the user expectations and preferred content of IQA
bull Conduct an evaluation during the 2004 Census Test in which evaluation methodologies and production requirements are developed simultaneously
22
References
Agresti Alan Categorical Data Analysis John Wiley amp Sons Inc New York City 1990
ldquoAmericarsquos Customer Satisfaction Initiative for Federal Governmentrdquo The Federal Governmentrsquos Customer Service Web Site ltwwwcustomerservicegovgt (December 28 2000)
Borg Ingwer and Groenen Patrick Modern Multidimensional Scaling Theory and Applications Springer-Verlag New York Inc New York City 1997
Coon David ldquoProgram Master Plan Census 2000 Internet Questionnaire Assistance and Data Collection Operationsrdquo May 11 1999
DeMaio TJ and Bates NA ldquoWho Fills Out the Census Formrdquo Proceedings of the Survey Research Methods Section of the American Statistical Association 1990 584-589
Dillman Don A and Bowker Dennis K ldquoThe Web Questionnaire Challenge to Survey Methodologistsrdquo Book Chapter forthcoming 2000
Horton William K Designing and Writing Online Documentation John Wiley New York 1990
Malakhoff Lawrence A ldquoProgram Master Plan for the Response Mode and Incentive Experimentrdquo May 2 2000
Mayhew Deborah J Principles and Guidelines in Software User Interface Design Prentice Hall Englewood Cliffs NJ 1992
Nichols Elizabeth and Sedivi Barbara ldquoEconomic Data Collection via the Web A Census Bureau Case Studyrdquo US Bureau of the Census May 29 1998
Schneiderman B Designing the User Interface Addison-Wesley Reading MA 1998
Sweet E and Russell C ldquoA Discussion of Data Collection via the Internetrdquo Proceedings of the Section on Survey Research Methods of the American Statistical Association 1996 774-779
Wellens Tracy and Martin Elizabeth ldquoCustomer Satisfaction Measurement Issues in the Federal Governmentrdquo
Zelterman Daniel Models for Discrete Data Oxford University Press Oxford 1999
23
Appendix A-1 IQA Survey
OMB No 0607-0760
The Census Bureau would like to know how well the Census 2000 Internet help screens worked for you Please take a few moments to answer our questions and give us your opinions about the on-line help Your answers are voluntary and confidential and will help us learn where improvements are
needed in future Census Internet products Thank you in advance for your participation
1 A How easy was it for you to find the topics you were looking for while using the Internet help screens
Not at all easy Easy Very easy 1 2 3
B Overall how easy was it to understand the Internet help screen information
Not at all easy Easy Very easy 1 2 3
C Overall how helpful to you was the Internet help screen information
Not at all helpful Helpful Very helpful 1 2 3
D Overall how satisfied are you with the Internet help screens
Not at all satisfied Satisfied Very satisfied 1 2 3
2 From which location did you primarily use the Census 2000 Internet help screens
Home Work School Library Some other place please specify_______________
24
Appendix A-1 IQA Survey
3 How did you hear about the Census 2000 Internet help screens Please mark all that apply
G From the Main US Census Bureau web site (wwwcensusgov)G From an Internet Service Provider (AOL MSN Mindspring etc)
G From a major web site (Yahoo Netcenter AltaVista etc)G From an Internet news web site (ABC MSNBC CBS etc)G From some other Internet site (not covered above)
G Through televisionradionewspaperG Through the toll free Census telephone help lineG Through the Census In Schools Program
G Through the letter attached to the census form you received in the mailG Other please specify______________________
4 Did you know that some census forms are available for you to complete through the Census 2000 web site
__Yes __No
5 Do you intend to submit your census form through the Census 2000 web site
__Yes__No my type of form was not available through the Census 2000 web site__No I tried to submit the Internet form and was unsuccessful__No I have security concerns__No I prefer to use the paper form__No I have already completed the paper form__No some other reason please specify________________________________Not sure
Submit this survey
25
Appendix A-2 IDC Survey
OMB No 0607-0760
The Census Bureau would like to know how well the Census Internet Form worked for you Please take a few moments to answer our questions and give us your opinions on the Census Internet Form Your answers are voluntary and confidential and will help us learn where improvements are needed in
future Internet products Thank you in advance for your participation
IV How satisfied are you with the following aspects of the Census 2000 Internet Form
Very Dissatisfied
1
Dissatisfied
2
Neither Satisfied nor Dissatisfied
3
Satisfied
4
Very Satisfied
5
Time required to load the form
Moving through the form
Availability of help screens
Understanding the help information
Ease of sending the form
Security and confidentiality procedures
2 Overall how satisfied are you with the Census 2000 Internet Form
Very Dissatisfied Dissatisfied Neither Satisfied Satisfied Very Satisfied nor Dissatisfied
1 2 3 4 5
26
Appendix A-2 IDC Survey
3 While you were completing the Census 2000 Internet Form help was available for a variety of topics (if you clicked on the linked text) In the following chart please mark how useful the help information was to you For topics on which you did not use help please mark lsquoNArsquo
Help Topics How useful was the information
Not at all Useful
1
Useful
2
Very Useful
3
Did not use this topic
NA
Verify form authenticity
Number of people in household
Home ownershiprent
Name
Relationship
AgeDate of birth
Hispanic origin
Race
Telephone number
Submitting the form
SecurityConfidentiality
OMB approval number
4 From which location did you submit your Census 2000 Internet Form
Home Work School Library Some other place please specify_______________
27
Appendix A-2 IDC Survey
5 How did you hear about the Census 2000 Internet Form Please mark all that apply
G From the Census 2000 Home page (www2000censusgov)G From the Main US Census Bureau web site (wwwcensusgov)G From an Internet Service Provider (AOL MSN Mindspring etc)
G From a major web site (Yahoo Netcenter AltaVista etc)G From an Internet News web site (ABC MSNBC CBS etc)G From some other Internet site (not covered above)
G Through televisionradionewspaperG Through the toll free Census telephone help lineG Through the Census In Schools Program
G Through the letter attached to the census form you received in the mailG Other please specify______________________
Submit this survey
28
Appendix B Log-linear models
Screening and building a log-linear model
First we analyzed a model with seven variables (1) time required to load the form (2) moving through the form (3) availability of help screens (4) understanding the help screen information (5) ease of sending the form (6) security and confidentiality procedures and (7) overall satisfaction including all 2-way interactions
Next we will delete an arbitrary interaction from the model By comparing the G2 statistics and the p-value for the initial model vs the reduced model we will determine whether the interaction is significant If the G2 and the p-value are roughly the same for the two models we can
conclude that is not significant and we can drop the interaction from the model
Consequently we can exclude any three-way interactions that include such as If
is significant we cannot drop any three-way interactions that include We will perform this procedure for each two-way interaction hoping to eliminate as many terms as possible to achieve the simplest model Any higher-level interactions greater than three are extremely difficult to interpret consequently we will ignore them in our analysis
however
Interpreting the results
The G2 statistic its p-value and the degrees of freedom of the model are the criteria of a good fit Specifically we are looking for a simple model with a small G2 a large p-value and a large number of degrees of freedom Adding additional model terms will always decrease the value of the G2 statistic If the additional terms donrsquot make an important contribution to the model then the G2 statistic will decrease by only a small amount and the significance level may actually decrease indicating a poorer fit to the data This is analogous to linear regression in which the mean squared error may increase when forcing non-significant independent variables into the model
29
Example of the results
Suppose we have the summary statistics for several log-linear models
Model df p-value
Model 1 (ACBCABC) 2068 34 03624
Model 2 (ABCD) 2101 35 04551
Model 3 (AB) 3498 36 00558
Model 4 (BC) 3622 36 00126
Which model should we choose Recall we want a simple model with a small G2 a large p-value and large number of degrees of freedom By these criteria we will go with Model 2 The G2 for Model 1 is smaller but just barely Notice however that the p-value for Model 1 actually decreases We identify Model 2 as the best fit
30
Appendix C
Table 13 IDC satisfaction ratings for the Census 2000 Internet Form
Variable
Time required to load
the form
Moving through the
form
Availability of help
screens
Help Users Only
Understanding help
info
Help Users Only
Ease of sending form
Security and
Confidentiality
procedures
Overall Satisfaction
Percent Percent Percent Percent Percent
N VD D Neither S VS
(1) (2) (3) (4) (5)
3216 41 09 28 281 642
(035) (017) (029) (079) (085)
3210 42 18 35 276 629
(036) 024) (032) (079) (085)
3118 37 08 218 243 494
(034) (016) (074) (077) (090)
1593 383 119 1186 2762 5549
(048) (027) (081) (112) (125)
3096 38 08 230 240 484
(034) (016) (076) (077) (089)
1587 391 139 1311 2710 5451
(049) (029) (085) (112) (125)
3199 42 07 10 175 767
(035) (014) (018) (067) (037)
3192 45 06 70 272 607
(013) (045) (079) (086) (036)
3198 44 14 32 259 651
(036) (021) (031) (077) (084)
31
Appendix D
Log Linear Model Comparison4
Model
Model 1--A ll two-w ay interactions
Model 1a
(ACADAEAFAGBCBDBE
BFBGCDCECFCGDEDFDG
EFEGFG)
Model 1b
(ACADAEAFAGBCBDBF
CDCECFCGDEDFDGEFEGFG)
Model 1c
(ACADAEAFAGBCBDBF
CECFDEDFDGEFEGFG)
Model 1d
(ACADAEAFAGBCBDBF
CECFDEDFDGEFFG)
Model 2
(ADEADFAEFADGAEG
DEGEFG)
G-squared df p-value
10516 99 3170
10517 100 3422
10627 102 3664
11068 104 3087
12330 105 1072
425522 105 0000
Which model should we choose Recall from Appendix B we want a simple model with a small G2 a large p-value and a large number of degrees of freedom By these criteria we will go with Model 1c The G2 for Model 1b is smaller but just barely and it includes two more interactions We identify Model 1c as the simplest and best fitting model
4A=Time required to load the form E=Ease of sending the formB=Availability of help screens F=Security and confidentiality concernsC=Understanding of help information G=Overall satisfactionD=M oving through the form
32
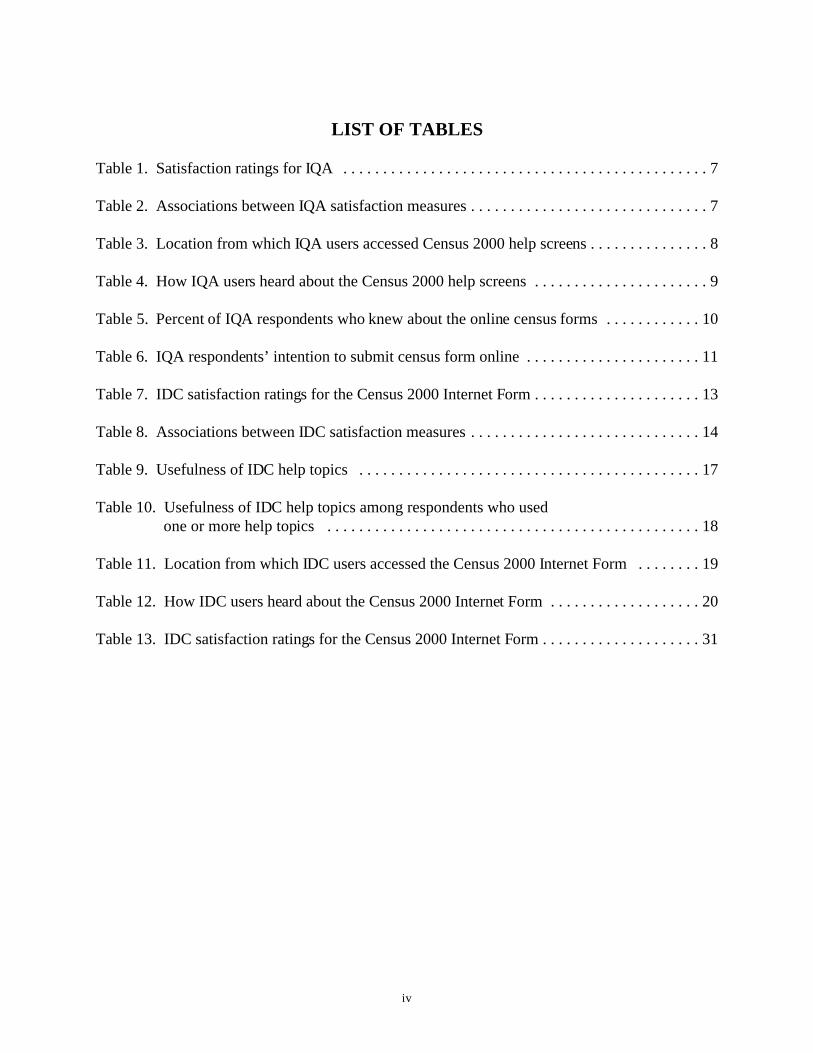
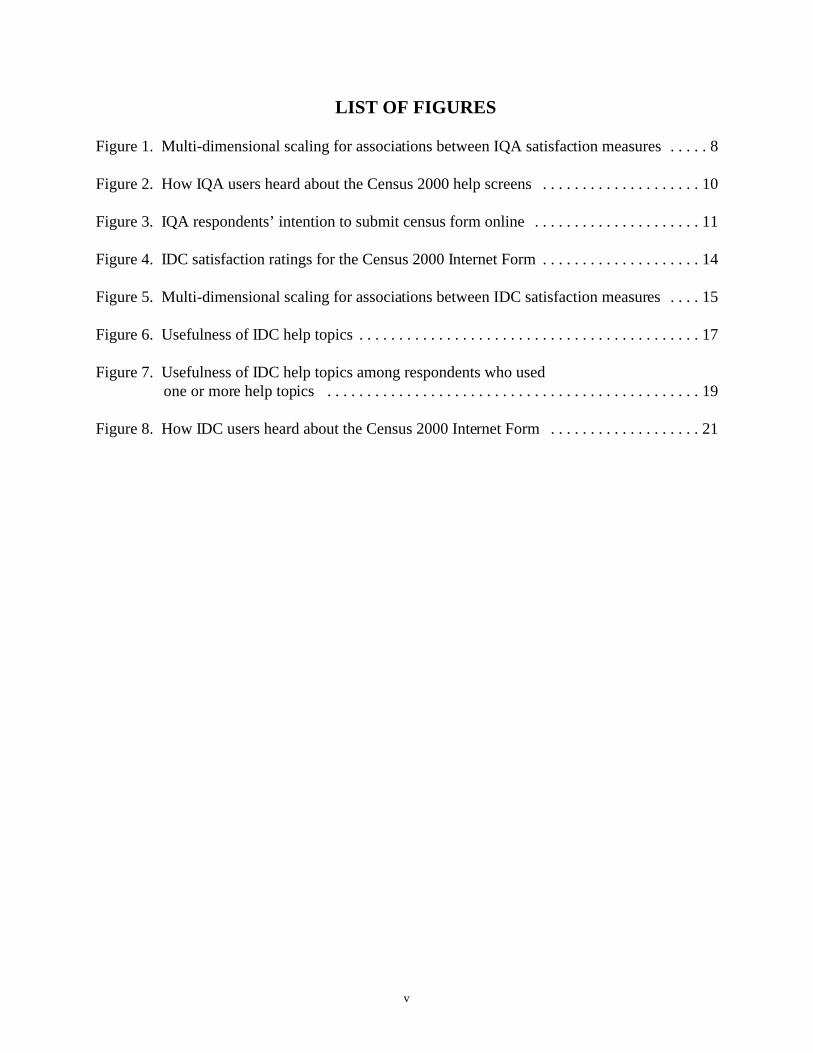
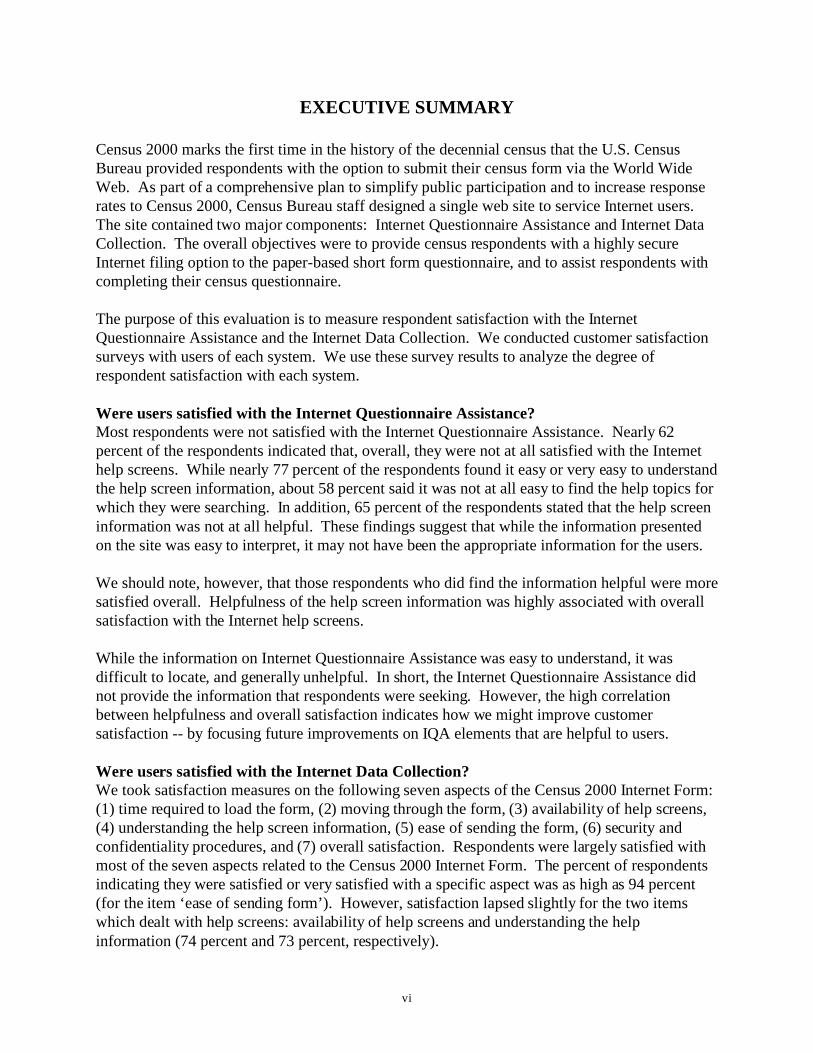
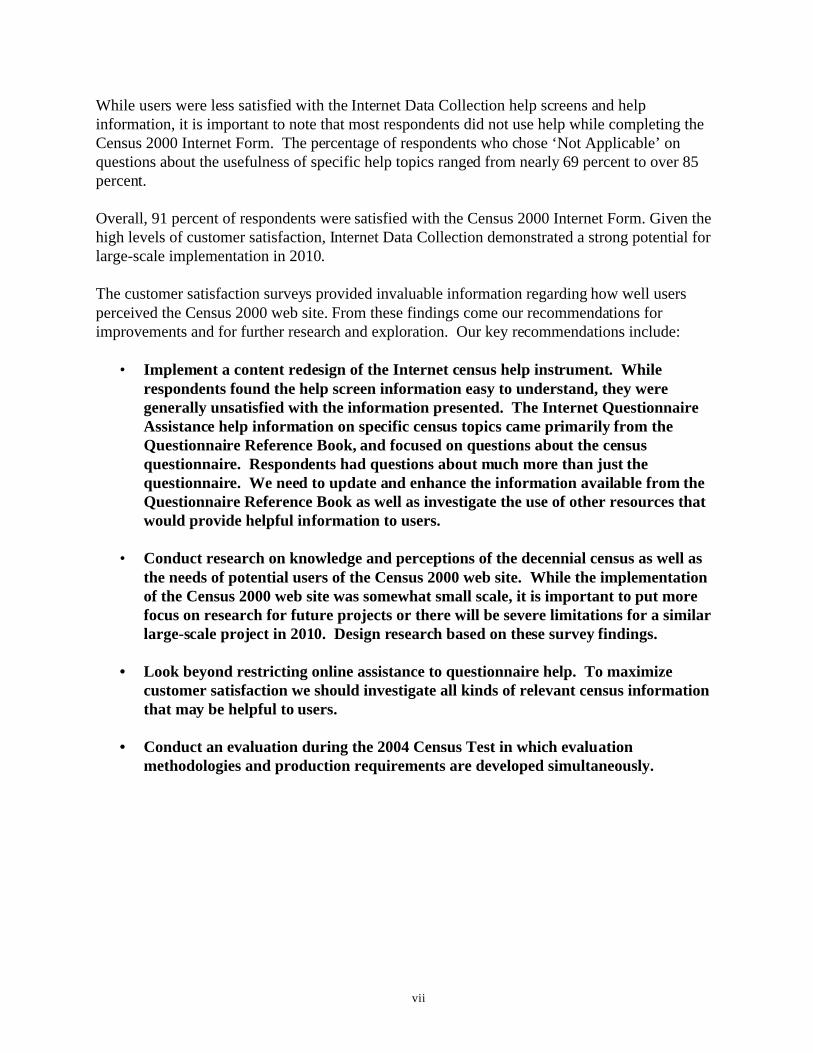
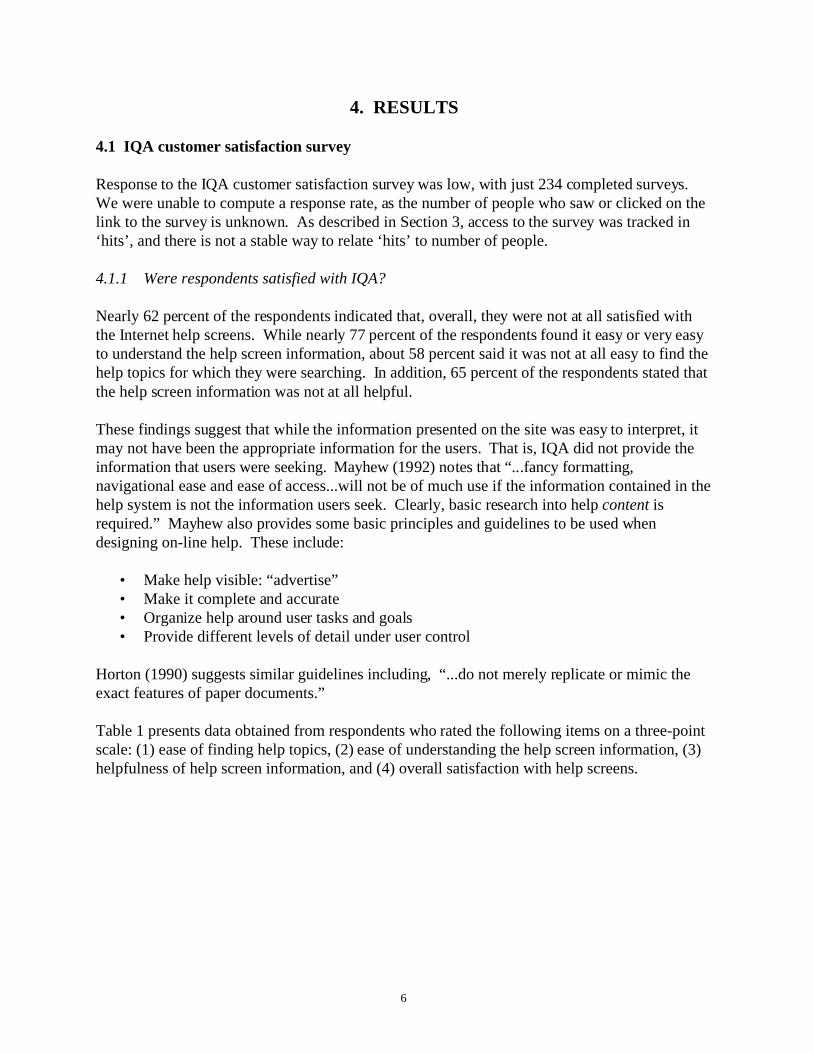
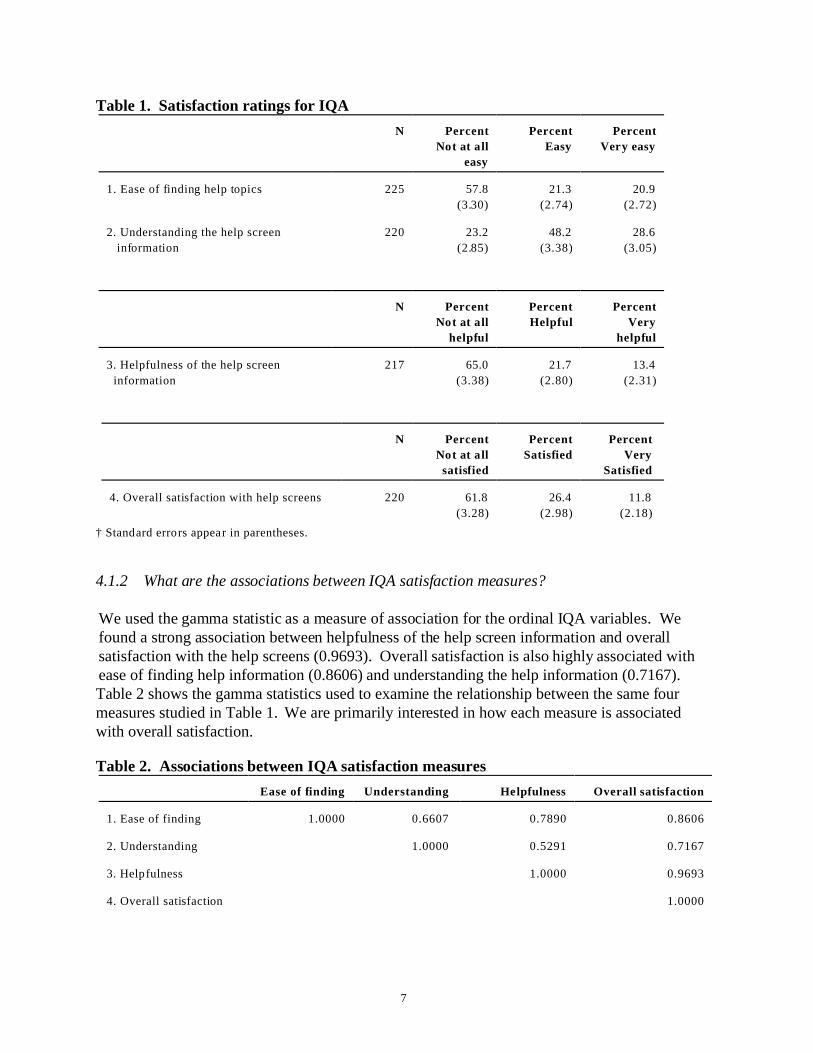
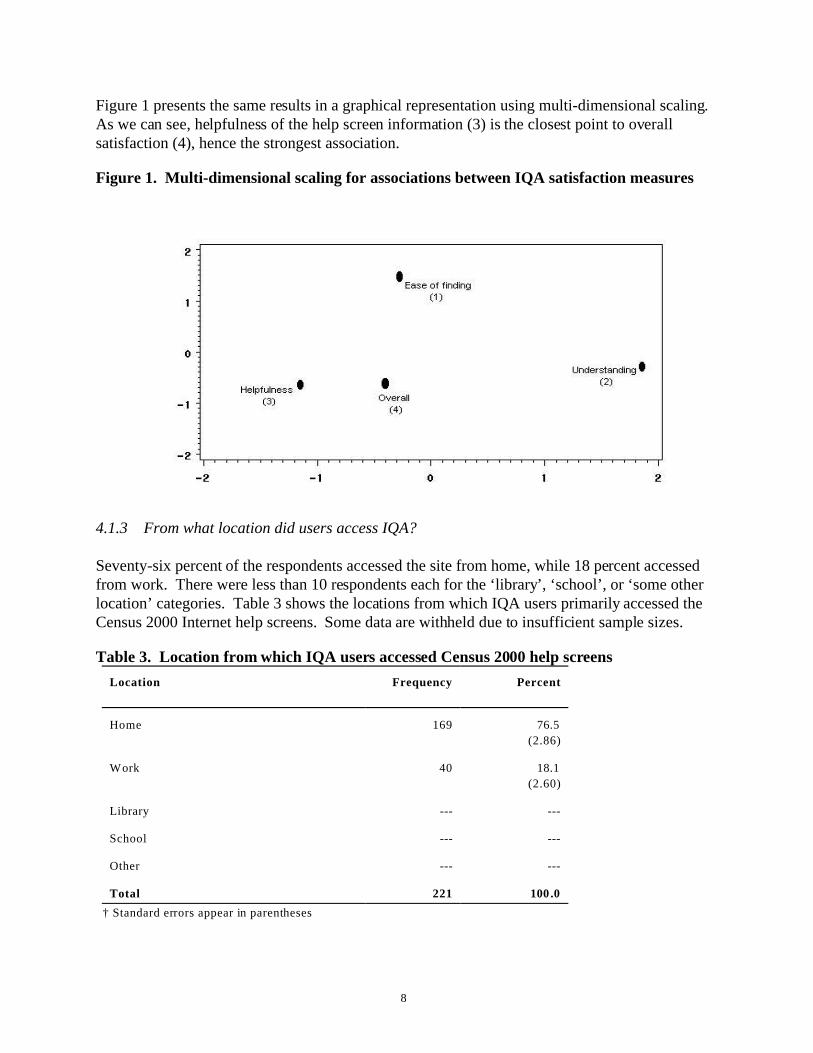
--- ---
--- ---
--- ---
Figure 1 presents the same results in a graphical representation using multi-dimensional scaling As we can see helpfulness of the help screen information (3) is the closest point to overall satisfaction (4) hence the strongest association
Figure 1 Multi-dimensional scaling for associations between IQA satisfaction measures
413 From what location did users access IQA
Seventy-six percent of the respondents accessed the site from home while 18 percent accessed from work There were less than 10 respondents each for the lsquolibraryrsquo lsquoschoolrsquo or lsquosome other locationrsquo categories Table 3 shows the locations from which IQA users primarily accessed the Census 2000 Internet help screens Some data are withheld due to insufficient sample sizes
Table 3 Location from which IQA users accessed Census 2000 help screens
Location Frequency Percent
Home
Work
Library
School
Other
Total
dagger Standard errors appear in parentheses
169 765
(286)
40 181
(260)
221 100 0
8
--- ---
--- ---
--- ---
---
414 How did IQA users hear about the Census 2000 help screens
The most often cited source was the TQA toll-free line (32 percent) This is not surprising since the initial telephone greeting told callers they could obtain help at any time at www2000censusgov The main Census web site (wwwcensusgov) was noted by approximately 23 percent of the respondents This site contained a direct link to the Census 2000 web site A good number of respondents (14 percent) selected the media (televisionnewspaperradio) as their source Respondents indicated where they heard about the Census 2000 Internet help screens by marking one or more of the ten given categories
Table 4 gives the distribution of how users heard about the help screens Respondents could mark more than one answer therefore responses do not add to 100 percent Some data are withheld due to insufficient sample sizes Figure 2 presents the same information in a bar graph
Table 4 How IQA users heard about the Census 2000 help screens
Source Frequency Per cent of T ota l
of Respon dents
M ain U S Ce nsus B ureau web site 50 233
(289)
Internet service provider (ISP) 10 47
(144)
M ajor web site
Internet news web site
Other Internet site
TelevisionRadioNewspaper (Media) 29 135
(234)
Toll free Census telephone help line 69 321
(319)
Census In Schools program ---
Letter attached to the Census form 27 126
(227)
Other 28 130
(230)
Total of R espondents 215 NA
dagger Standard errors appear in parentheses
daggerdagger Respondents could mark more than one response
NA ndash Table does not add to 100 percent
9
Figure 2 How IQA users heard about the Census 2000 help screens
415 IQA respondentsrsquo intention to submit census form online
We designed two survey questions to obtain an estimate of the proportion of IQA users who intended to submit their census form through IDC (See Questions 4 and 5 in Appendix A-1) Of all respondents just 16 percent intended to submit their census form online Of those who did not intend to submit their census form online 20 percent noted that they had already completed the paper form and 15 percent noted that their form type was not available to complete online
As shown in Table 5 about half of the respondents knew that some forms were available to complete online Table 6 presents the breakdown of respondentsrsquo intention to submit their census form online It also gives the reasons why respondents chose not to submit their census form online Respondents could mark more than one reason Figure 3 presents the same information in a bar graph
Table 5 Percent of IQA respondents who knew about the online census forms
Knowledge of availability
Yes
No
Total
daggerStandard errors appear in parentheses
Frequency Percent
115 516
(335)
108 484
(335)
223 100 0
10
Table 6 IQA respondentsrsquo intention to submit census form online
Intention to submit the form Frequency Percent of Total
of Respondents
Yes
No
Form not available
Unsuccessful submission
Security concerns
Prefer paper form
Already completed paper form
Other reasons
Not sure
Total of Respondents
35 159
(247)
188 855
(238)
33 150
(241)
17 77
(180)
15 68
(170)
30 136
(232)
45 205
(273)
48 218
(279)
20 91
(194)
220 NA
dagger Standard errors appear in parentheses
daggerdagger Respondents could mark more than one response
NA - Table does not add to 100 percent
Figure 3 IQA respondentsrsquo intention to submit census form online
11
42 IDC customer satisfaction survey
Response to the IDC customer satisfaction survey was much higher than to the IQA survey There were 3226 completed surveys We estimated response rates by each day in the data collection period for an overall average response rate of 585 percent (See Appendix E for daily response rates)
421 Who were the IDC respondents
We were able to obtain a demographic profile of IDC respondents by matching their 22-digit census ID to their IDC survey responses We found that the IDC respondents were primarily male (75 percent) white (78 percent) not of Hispanic origin (92 percent) and 25-54 years old (77 percent) This profile reflects the first person listed on the census form and may not be the customer satisfaction survey respondent in all cases Thus our finding that over 75 percent of our respondents were male is likely a reflection of census respondentsrsquo tendency to list the male head of household as the first person on the census form regardless of who is the actual respondent (DeMaio and Bates 1990)
422 Were respondents satisfied with IDC
Overall 91 percent of respondents were satisfied with the Census 2000 Internet Form Additionally respondents were satisfied with nearly all aspects of the Census 2000 Internet Form with satisfaction levels as high as 94 percent Satisfaction lapsed slightly for the two items which dealt with the help screens availability of help screens and understanding the help information (74 percent and 73 percent respectively)
We should note that respondents answered the two items concerning help screens nearly identically therefore it is likely that they may not have made a distinction between the two questions For these two items we also included the percent by only those respondents who actually used help screens We see that respondents who used help screens were somewhat more satisfied with the availability of help information and understanding the help information (83 percent and 82 percent respectively) than all respondents taken together That is some respondents who didnrsquot use any help screens tended to rate them on the lower end of the scale rather than selecting lsquoNot Applicablersquo
Table 7 presents respondentsrsquo level of satisfaction with certain aspects of the Census 2000 Internet Form Respondents indicated on a 5-point scale their level of satisfaction with each of the following items
(1) time required to load the form(2) moving through the form(3) availability of help screens (4) understanding the help information(5) ease of sending the form(6) security and confidentiality procedures and(7) overall satisfaction
12
In Table 7 lsquoSatisfiedrsquo reflects the selection of a four or five on the five-point response scale (See Appendix C for a complete breakdown of responses) Although a score of three represents neither satisfaction nor dissatisfaction we excluded these counts to obtain a conservative estimate of satisfaction Figure 4 presents the same data in a bar graph
Table 7 IDC satisfaction ratings for the Census 2000 Internet Form
Variable
1 Time required to load the form
2 Moving through the form
3 Availability of help screens
Among Help Users Only
4 Understanding the help information
Among Help Users Only
5 Ease of sending the form
6 Security and confidentiality procedures
7 Overall Satisfaction
dagger Standard errors appear in parentheses
N Percent
Satisfied
3216
3210
3118
1593
3096
1587
3199
3192
3198
922
(047)
905
(052)
737
(079)
831
(094)
725
(080)
816
(097)
942
(042)
879
(058)
910
(051)
This row includes only those respondents who used at least one help screen
13
Figure 4 IDC satisfaction ratings for the Census 2000 Internet Form
423 What are the associations between IDC satisfaction measures
We used the gamma statistic as a measure of association for the ordinal IDC variables We found a strong association between availability of the help screens and understanding the help information (09461) This strong association confirms our earlier claim that respondents answered these two questions similarly Overall satisfaction is highly associated with ease of sending the form (08820) moving through the form (08604) and time required to load the form (08420)
Table 8 presents the gamma statistic which examines the relationship between the seven measures studied above We are primarily interested in how each measure is associated with overall satisfaction
Table 8 Associations between IDC satisfaction measures
Gamma 1 2 3 4 5 6
1 Time required to load the form 10000 09050 07072 07044 09408 08063 08420
2 Moving through the form 10000 07546 07310 09349 07943 08604
3 Availability of the help screens 10000 09461 07552 07105 06794
4 Understanding the help information 10000 07520 07088 06852
5 Ease of sending the form 10000 08817 08820
6 Security and confidentiality 10000 08040
procedures
7 Overall satisfaction 10000
14
7
Figure 5 gives the multi-dimensional scaling of the seven measures In Figure 5 we see that the time required to load the form (1) ease of moving through the form (2) and ease of sending the form (5) are the three closest points to overall satisfaction (7) indicating that each has a strong association with overall satisfaction
Figure 5 Multi-dimensional scaling for associations between IDC satisfaction measures
424 Log-linear modeling
In Table 8 there is no clear definition of what is considered a significant association According to Agresti (1990) for an I x J table it is rarely possible to summarize association by a single number without some loss of information We used a log-linear model to further describe the relationship between the IDC satisfaction measures Just as a multiple regression model is more informative than a simple correlation the log-linear model describes associations and provides more information than the univariate gamma statistic We examined all the possible interactions of the seven variables that describe IDC satisfaction We systematically fit several models to find which interactions are needed to explain the data well
Our best model includes almost all of the possible two-way interactions excluding the interactions ABBGBECDCG3 (See Appendix D for a log-linear model comparison) That is all two way interactions are important in describing satisfaction except
3A=Time required to load the form E =Ease of sending the formB=Availability of help screens F=Security and confidentiality concernsC=Understanding of help information G=Overall SatisfactionD=Moving through the form
15
bull time required to load the form and availability of the help screens (AB) bull availability of the help screens and overall satisfaction (BG) bull availability of the help screens and ease of sending the form (BE) bull understanding the help information and moving through the form (CD) bull understanding the help information and overall satisfaction (CG)
Three of the non-significant interactions (ABBECD) are not surprising We wouldnrsquot necessarily expect these interactions to be important The non-significance of the interactions (BGCG) is however quite intriguing One could assume that every variable would be significantly associated with overall satisfaction We see that this isnrsquot the case for availability of the help screens and understanding the help information Thus the interactions of availability of the help screens and understanding the help information with overall satisfaction are not as important in describing the data as the other variables with overall satisfaction
Recall that the gamma statistic relates the relative degree of association between two variables The gamma values for the interactions of availability of help screens and understanding the help information with overall satisfaction were smaller than the other variablesrsquo association with overall satisfaction This is consistent with our final log-linear model The associations might also be low because as we will see in Table 9 not many respondents used the help screens Therefore in general respondents may not have had a strong opinion concerning the help screens
425 How useful were the IDC help topics
On the whole just about half of the respondents used one or more help topics Of those respondents who did use the help screens most were satisfied Respondents rated the usefulness of the twelve help topics embedded in the online census form Respondents found information on these twelve topics by clicking on the blue linked text throughout the census form
Before discussing the usefulness of these items it is important to note that the respondents did not use the IDC help links often The percent of respondents who reported that they did not use the help links ranged from nearly 69 percent to 85 percent for each particular help topic This is important to note as it reflects other literature that suggests that users rarely use help when available Mayhew (1992) suggests that ldquousers worry that if they go into help they will not be able to get back to the place where they were working Remembering how to navigate in help adds a burden to short-term memory The help information may obscure part of the screen interrupting the userrsquos primary task and causing loss of contextrdquo Schneiderman (1998) suggests that ldquousersrsquo navigation among online help segments should be recorded and studied so that we can gain a better understanding of what help segments are effectiverdquo
Table 9 and Figure 6 show the percent of respondents who used the help links for each particular help topic Table 10 and Figure 7 present the usefulness ratings of only those respondents who used at least one help topic The percent of respondents who marked topics lsquovery usefulrsquo ranged from 49 percent (Race) to 69 percent (SecurityConfidentiality) The help topics most prevalent in the lsquonot at all usefulrsquo category were Hispanic origin (20 percent) Race (18 percent) and Telephone number (16 percent)
16
Table 9 Usefulness of IDC help topics
Help Topics N Percent
Use d H elp
Ve rify form a uthenticity 3071 305
(083)
Numbe r of pe ople in 3048 178
household (069)
Hom e ownershiprent 3046 170
(068)
Name 3044 161
(067)
Rela tionship 3032 145
(064)
Age Date of birth 3031 174
(069)
Hisp anic o rigin 3022 150
(065)
Race 3032 185
(070)
Telephone number 3026 160
(067)
Submitting the form 3032 211
(074)
SecurityCo nfidentiality 3023 311
(084)
OM B approval number 2998 201
(073)
dagger Standard errors appear in parentheses
Figure 6 Usefulness of IDC help topics
Percent
Did not use help
695
(083)
822
(069)
830
(068)
839
(067)
855
(064)
826
(069)
850
(065)
815
(070)
840
(067)
789
(074)
689
(084)
799
(073)
17
Table 10 Usefulness of IDC help topics among respondents who used one or more help topics
Help Topics N
Verify form authenticity 936
Number of people in household 542
Home ownershiprent 519
Name 489
Relationship 441
AgeDate of birth 528
Hispanic origin 452
Race 560
Telephone number 484
Submitting the form 641
SecurityConfidentiality 940
OMB approval number 604
dagger Standard errors appear in parentheses
Percent Percent Percent
Not at all Useful
(1)
62
(079)
87
(121)
93
(127)
110
(142)
102
(144)
87
(123)
199
(188)
179
(162)
163
(168)
52
(087)
44
(067)
68
(102)
18
Useful Very Useful
(2) (3)
329 609
(154) (160)
308 605
(199) (210)
357 551
(210) (219)
342 548
(215) (225)
345 553
(227) (237)
309 604
(201) (213)
299 502
(216) (235)
330 491
(199) (211)
333 504
(214) (228)
275 674
(176) (185)
269 687
(145) (151)
263 669
(179) (192)
--- ---
--- ---
Figure 7 Usefulness of IDC help topics among respondents who used one or more help topics
426 From what location did users access IDC
Eighty-five percent of respondents submitted their Census 2000 Internet Form from home while almost 14 percent accessed the site from work Less than one percent submitted their form from a school or some other place Fewer than ten respondents selected lsquolibraryrsquo Table 11 shows the locations from which IDC users primarily accessed the Census 2000 Internet Form Some data are withheld due to insufficient sample size
Table 11 Location from which IDC users accessed the Census 2000 Internet Form
Location Frequency Percent
Home
Work
School
Library
Some other place
Total
daggerStandard errors appear in parentheses
2728 853
(063)
435 136
(061)
22 07
(015)
3199 100 0
19
---
427 How did IDC users hear about the Census 2000 Internet form
The media (televisionradionewspaper) was the most marked answer with over 52 percent This is not surprising since IDC was not a part of the Census 2000 advertising campaign and publicity came primarily from the media The Census 2000 Home Page was marked by over 14 percent of respondents Surprisingly almost ten percent of respondents said that they heard about the Census 2000 Internet Form through the letter attached to the Census form However only households selected for the RMIE actually received a letter informing them of the Internet filing option Respondents may have confused this response option with the advance letter which contained the Census web address but did not mention the Census Internet Form
Table 12 gives the distribution of where users heard about the Census 2000 Internet Form Respondents indicated where they heard about the Census 2000 Internet Form by marking one or more of the 11 given categories Since respondents could mark more than one response the responses do not add to 100 percent Figure 8 presents the information in a bar graph
Table 12 How IDC users heard about the Census 2000 Internet Form
Source Frequency Percent of Total
Census 2000 H ome Page
Main US Census Bureau web site
Internet service provider
Major web site
Internet news web site
Other Internet site
TelevisionRadioNewspaper (Media)
Toll free Census telephone help line
Census In Schools program
Letter attached to the Census form
Other
Total of Respondents
daggerStandard errors appear in parentheses
of Respondents
454 143
(062)
187 59
(042)
288 91
(051)
103 33
(032)
183 58
(041)
136 43
(036)
1658 524
(089)
169 53
(040)
28 09
(017)
310 98
(053)
342 108
(055)
3167
daggerdaggerRespondents could mark more than one response
The letter was included with Census materials only for those households selected for the RMIE
20
Figure 8 How IDC users heard about the Census 2000 Internet Form
5 RECOMMENDATIONS
The customer satisfaction surveys provided some very insightful information regarding how well the users perceived the Census 2000 web site Overall respondents were quite satisfied with IDC On the other hand users were generally unsatisfied with IQA and the help information contained within Taken together these results suggest a variety of areas for further research and exploration
51 System Design
bull Implement a content redesign of the Internet census help instrument While respondents found the help screen information easy to understand they were generally unsatisfied with the information presented The IQA help information on specific census topics came primarily from the QRB and focused on questions about the census questionnaire Respondents had questions about much more than just the questionnaire We need to update and enhance the information available from the QRB as well as investigate the use of other resources that would provide helpful information to users
52 Customer satisfaction survey implementation
bull To increase survey quality with better user representation consider alternate survey implementation choices such as a pop-up survey rather than a link Advantages of using a pop-up survey include
-Systematic selection of every lsquonthrsquo visitor -Survey automatically pops up on screen (using a new browser window) -Use of ldquocookiesrdquo to ensure that each user only completes the survey once
21
53 Research and Testing
bull Conduct research on knowledge and perceptions of the decennial census The implementation of the Census 2000 web site was somewhat small scale and did not require extensive research prior to implementation However it is important to put more focus on research for future projects or there may be severe implications for a similar large-scale implementation in 2010 Design research based on these survey findings
bull Look beyond restricting online assistance to questionnaire help To maximize customer satisfaction we should investigate all kinds of relevant census information that may be helpful to users
bull Incorporate usability testing to explore the user expectations and preferred content of IQA
bull Conduct an evaluation during the 2004 Census Test in which evaluation methodologies and production requirements are developed simultaneously
22
References
Agresti Alan Categorical Data Analysis John Wiley amp Sons Inc New York City 1990
ldquoAmericarsquos Customer Satisfaction Initiative for Federal Governmentrdquo The Federal Governmentrsquos Customer Service Web Site ltwwwcustomerservicegovgt (December 28 2000)
Borg Ingwer and Groenen Patrick Modern Multidimensional Scaling Theory and Applications Springer-Verlag New York Inc New York City 1997
Coon David ldquoProgram Master Plan Census 2000 Internet Questionnaire Assistance and Data Collection Operationsrdquo May 11 1999
DeMaio TJ and Bates NA ldquoWho Fills Out the Census Formrdquo Proceedings of the Survey Research Methods Section of the American Statistical Association 1990 584-589
Dillman Don A and Bowker Dennis K ldquoThe Web Questionnaire Challenge to Survey Methodologistsrdquo Book Chapter forthcoming 2000
Horton William K Designing and Writing Online Documentation John Wiley New York 1990
Malakhoff Lawrence A ldquoProgram Master Plan for the Response Mode and Incentive Experimentrdquo May 2 2000
Mayhew Deborah J Principles and Guidelines in Software User Interface Design Prentice Hall Englewood Cliffs NJ 1992
Nichols Elizabeth and Sedivi Barbara ldquoEconomic Data Collection via the Web A Census Bureau Case Studyrdquo US Bureau of the Census May 29 1998
Schneiderman B Designing the User Interface Addison-Wesley Reading MA 1998
Sweet E and Russell C ldquoA Discussion of Data Collection via the Internetrdquo Proceedings of the Section on Survey Research Methods of the American Statistical Association 1996 774-779
Wellens Tracy and Martin Elizabeth ldquoCustomer Satisfaction Measurement Issues in the Federal Governmentrdquo
Zelterman Daniel Models for Discrete Data Oxford University Press Oxford 1999
23
Appendix A-1 IQA Survey
OMB No 0607-0760
The Census Bureau would like to know how well the Census 2000 Internet help screens worked for you Please take a few moments to answer our questions and give us your opinions about the on-line help Your answers are voluntary and confidential and will help us learn where improvements are
needed in future Census Internet products Thank you in advance for your participation
1 A How easy was it for you to find the topics you were looking for while using the Internet help screens
Not at all easy Easy Very easy 1 2 3
B Overall how easy was it to understand the Internet help screen information
Not at all easy Easy Very easy 1 2 3
C Overall how helpful to you was the Internet help screen information
Not at all helpful Helpful Very helpful 1 2 3
D Overall how satisfied are you with the Internet help screens
Not at all satisfied Satisfied Very satisfied 1 2 3
2 From which location did you primarily use the Census 2000 Internet help screens
Home Work School Library Some other place please specify_______________
24
Appendix A-1 IQA Survey
3 How did you hear about the Census 2000 Internet help screens Please mark all that apply
G From the Main US Census Bureau web site (wwwcensusgov)G From an Internet Service Provider (AOL MSN Mindspring etc)
G From a major web site (Yahoo Netcenter AltaVista etc)G From an Internet news web site (ABC MSNBC CBS etc)G From some other Internet site (not covered above)
G Through televisionradionewspaperG Through the toll free Census telephone help lineG Through the Census In Schools Program
G Through the letter attached to the census form you received in the mailG Other please specify______________________
4 Did you know that some census forms are available for you to complete through the Census 2000 web site
__Yes __No
5 Do you intend to submit your census form through the Census 2000 web site
__Yes__No my type of form was not available through the Census 2000 web site__No I tried to submit the Internet form and was unsuccessful__No I have security concerns__No I prefer to use the paper form__No I have already completed the paper form__No some other reason please specify________________________________Not sure
Submit this survey
25
Appendix A-2 IDC Survey
OMB No 0607-0760
The Census Bureau would like to know how well the Census Internet Form worked for you Please take a few moments to answer our questions and give us your opinions on the Census Internet Form Your answers are voluntary and confidential and will help us learn where improvements are needed in
future Internet products Thank you in advance for your participation
IV How satisfied are you with the following aspects of the Census 2000 Internet Form
Very Dissatisfied
1
Dissatisfied
2
Neither Satisfied nor Dissatisfied
3
Satisfied
4
Very Satisfied
5
Time required to load the form
Moving through the form
Availability of help screens
Understanding the help information
Ease of sending the form
Security and confidentiality procedures
2 Overall how satisfied are you with the Census 2000 Internet Form
Very Dissatisfied Dissatisfied Neither Satisfied Satisfied Very Satisfied nor Dissatisfied
1 2 3 4 5
26
Appendix A-2 IDC Survey
3 While you were completing the Census 2000 Internet Form help was available for a variety of topics (if you clicked on the linked text) In the following chart please mark how useful the help information was to you For topics on which you did not use help please mark lsquoNArsquo
Help Topics How useful was the information
Not at all Useful
1
Useful
2
Very Useful
3
Did not use this topic
NA
Verify form authenticity
Number of people in household
Home ownershiprent
Name
Relationship
AgeDate of birth
Hispanic origin
Race
Telephone number
Submitting the form
SecurityConfidentiality
OMB approval number
4 From which location did you submit your Census 2000 Internet Form
Home Work School Library Some other place please specify_______________
27
Appendix A-2 IDC Survey
5 How did you hear about the Census 2000 Internet Form Please mark all that apply
G From the Census 2000 Home page (www2000censusgov)G From the Main US Census Bureau web site (wwwcensusgov)G From an Internet Service Provider (AOL MSN Mindspring etc)
G From a major web site (Yahoo Netcenter AltaVista etc)G From an Internet News web site (ABC MSNBC CBS etc)G From some other Internet site (not covered above)
G Through televisionradionewspaperG Through the toll free Census telephone help lineG Through the Census In Schools Program
G Through the letter attached to the census form you received in the mailG Other please specify______________________
Submit this survey
28
Appendix B Log-linear models
Screening and building a log-linear model
First we analyzed a model with seven variables (1) time required to load the form (2) moving through the form (3) availability of help screens (4) understanding the help screen information (5) ease of sending the form (6) security and confidentiality procedures and (7) overall satisfaction including all 2-way interactions
Next we will delete an arbitrary interaction from the model By comparing the G2 statistics and the p-value for the initial model vs the reduced model we will determine whether the interaction is significant If the G2 and the p-value are roughly the same for the two models we can
conclude that is not significant and we can drop the interaction from the model
Consequently we can exclude any three-way interactions that include such as If
is significant we cannot drop any three-way interactions that include We will perform this procedure for each two-way interaction hoping to eliminate as many terms as possible to achieve the simplest model Any higher-level interactions greater than three are extremely difficult to interpret consequently we will ignore them in our analysis
however
Interpreting the results
The G2 statistic its p-value and the degrees of freedom of the model are the criteria of a good fit Specifically we are looking for a simple model with a small G2 a large p-value and a large number of degrees of freedom Adding additional model terms will always decrease the value of the G2 statistic If the additional terms donrsquot make an important contribution to the model then the G2 statistic will decrease by only a small amount and the significance level may actually decrease indicating a poorer fit to the data This is analogous to linear regression in which the mean squared error may increase when forcing non-significant independent variables into the model
29
Example of the results
Suppose we have the summary statistics for several log-linear models
Model df p-value
Model 1 (ACBCABC) 2068 34 03624
Model 2 (ABCD) 2101 35 04551
Model 3 (AB) 3498 36 00558
Model 4 (BC) 3622 36 00126
Which model should we choose Recall we want a simple model with a small G2 a large p-value and large number of degrees of freedom By these criteria we will go with Model 2 The G2 for Model 1 is smaller but just barely Notice however that the p-value for Model 1 actually decreases We identify Model 2 as the best fit
30
Appendix C
Table 13 IDC satisfaction ratings for the Census 2000 Internet Form
Variable
Time required to load
the form
Moving through the
form
Availability of help
screens
Help Users Only
Understanding help
info
Help Users Only
Ease of sending form
Security and
Confidentiality
procedures
Overall Satisfaction
Percent Percent Percent Percent Percent
N VD D Neither S VS
(1) (2) (3) (4) (5)
3216 41 09 28 281 642
(035) (017) (029) (079) (085)
3210 42 18 35 276 629
(036) 024) (032) (079) (085)
3118 37 08 218 243 494
(034) (016) (074) (077) (090)
1593 383 119 1186 2762 5549
(048) (027) (081) (112) (125)
3096 38 08 230 240 484
(034) (016) (076) (077) (089)
1587 391 139 1311 2710 5451
(049) (029) (085) (112) (125)
3199 42 07 10 175 767
(035) (014) (018) (067) (037)
3192 45 06 70 272 607
(013) (045) (079) (086) (036)
3198 44 14 32 259 651
(036) (021) (031) (077) (084)
31
Appendix D
Log Linear Model Comparison4
Model
Model 1--A ll two-w ay interactions
Model 1a
(ACADAEAFAGBCBDBE
BFBGCDCECFCGDEDFDG
EFEGFG)
Model 1b
(ACADAEAFAGBCBDBF
CDCECFCGDEDFDGEFEGFG)
Model 1c
(ACADAEAFAGBCBDBF
CECFDEDFDGEFEGFG)
Model 1d
(ACADAEAFAGBCBDBF
CECFDEDFDGEFFG)
Model 2
(ADEADFAEFADGAEG
DEGEFG)
G-squared df p-value
10516 99 3170
10517 100 3422
10627 102 3664
11068 104 3087
12330 105 1072
425522 105 0000
Which model should we choose Recall from Appendix B we want a simple model with a small G2 a large p-value and a large number of degrees of freedom By these criteria we will go with Model 1c The G2 for Model 1b is smaller but just barely and it includes two more interactions We identify Model 1c as the simplest and best fitting model
4A=Time required to load the form E=Ease of sending the formB=Availability of help screens F=Security and confidentiality concernsC=Understanding of help information G=Overall satisfactionD=M oving through the form
32
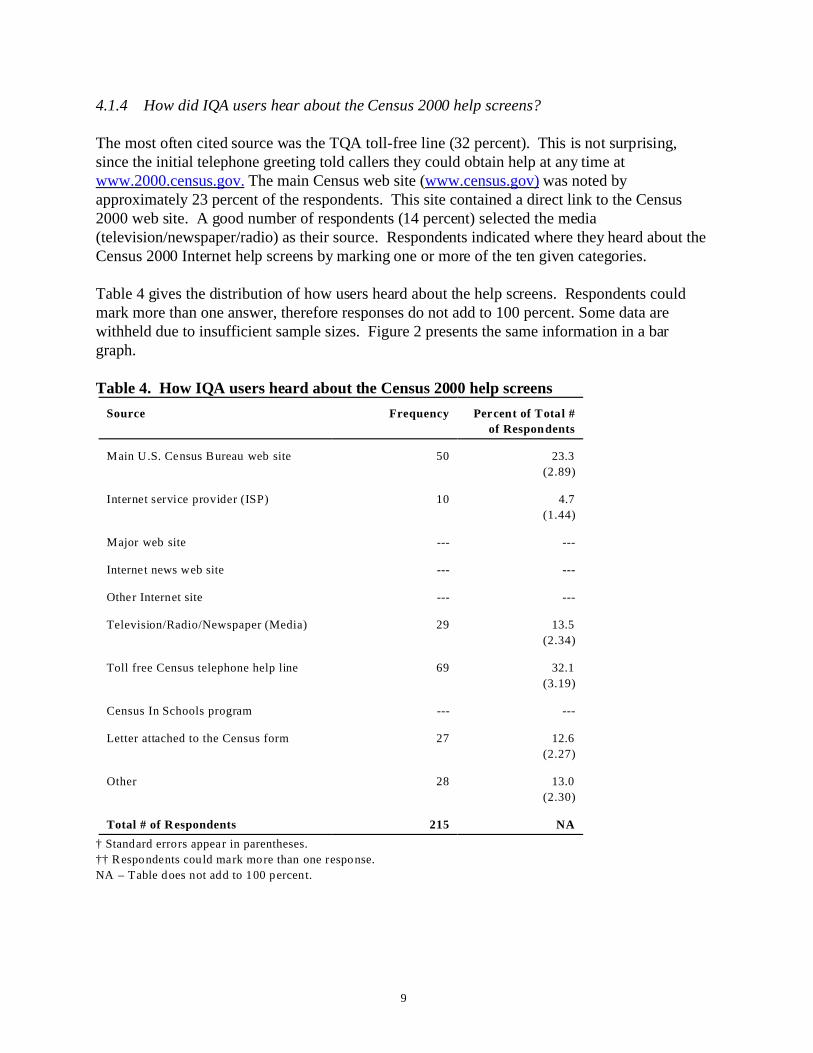
--- ---
--- ---
--- ---
---
414 How did IQA users hear about the Census 2000 help screens
The most often cited source was the TQA toll-free line (32 percent) This is not surprising since the initial telephone greeting told callers they could obtain help at any time at www2000censusgov The main Census web site (wwwcensusgov) was noted by approximately 23 percent of the respondents This site contained a direct link to the Census 2000 web site A good number of respondents (14 percent) selected the media (televisionnewspaperradio) as their source Respondents indicated where they heard about the Census 2000 Internet help screens by marking one or more of the ten given categories
Table 4 gives the distribution of how users heard about the help screens Respondents could mark more than one answer therefore responses do not add to 100 percent Some data are withheld due to insufficient sample sizes Figure 2 presents the same information in a bar graph
Table 4 How IQA users heard about the Census 2000 help screens
Source Frequency Per cent of T ota l
of Respon dents
M ain U S Ce nsus B ureau web site 50 233
(289)
Internet service provider (ISP) 10 47
(144)
M ajor web site
Internet news web site
Other Internet site
TelevisionRadioNewspaper (Media) 29 135
(234)
Toll free Census telephone help line 69 321
(319)
Census In Schools program ---
Letter attached to the Census form 27 126
(227)
Other 28 130
(230)
Total of R espondents 215 NA
dagger Standard errors appear in parentheses
daggerdagger Respondents could mark more than one response
NA ndash Table does not add to 100 percent
9
Figure 2 How IQA users heard about the Census 2000 help screens
415 IQA respondentsrsquo intention to submit census form online
We designed two survey questions to obtain an estimate of the proportion of IQA users who intended to submit their census form through IDC (See Questions 4 and 5 in Appendix A-1) Of all respondents just 16 percent intended to submit their census form online Of those who did not intend to submit their census form online 20 percent noted that they had already completed the paper form and 15 percent noted that their form type was not available to complete online
As shown in Table 5 about half of the respondents knew that some forms were available to complete online Table 6 presents the breakdown of respondentsrsquo intention to submit their census form online It also gives the reasons why respondents chose not to submit their census form online Respondents could mark more than one reason Figure 3 presents the same information in a bar graph
Table 5 Percent of IQA respondents who knew about the online census forms
Knowledge of availability
Yes
No
Total
daggerStandard errors appear in parentheses
Frequency Percent
115 516
(335)
108 484
(335)
223 100 0
10
Table 6 IQA respondentsrsquo intention to submit census form online
Intention to submit the form Frequency Percent of Total
of Respondents
Yes
No
Form not available
Unsuccessful submission
Security concerns
Prefer paper form
Already completed paper form
Other reasons
Not sure
Total of Respondents
35 159
(247)
188 855
(238)
33 150
(241)
17 77
(180)
15 68
(170)
30 136
(232)
45 205
(273)
48 218
(279)
20 91
(194)
220 NA
dagger Standard errors appear in parentheses
daggerdagger Respondents could mark more than one response
NA - Table does not add to 100 percent
Figure 3 IQA respondentsrsquo intention to submit census form online
11
42 IDC customer satisfaction survey
Response to the IDC customer satisfaction survey was much higher than to the IQA survey There were 3226 completed surveys We estimated response rates by each day in the data collection period for an overall average response rate of 585 percent (See Appendix E for daily response rates)
421 Who were the IDC respondents
We were able to obtain a demographic profile of IDC respondents by matching their 22-digit census ID to their IDC survey responses We found that the IDC respondents were primarily male (75 percent) white (78 percent) not of Hispanic origin (92 percent) and 25-54 years old (77 percent) This profile reflects the first person listed on the census form and may not be the customer satisfaction survey respondent in all cases Thus our finding that over 75 percent of our respondents were male is likely a reflection of census respondentsrsquo tendency to list the male head of household as the first person on the census form regardless of who is the actual respondent (DeMaio and Bates 1990)
422 Were respondents satisfied with IDC
Overall 91 percent of respondents were satisfied with the Census 2000 Internet Form Additionally respondents were satisfied with nearly all aspects of the Census 2000 Internet Form with satisfaction levels as high as 94 percent Satisfaction lapsed slightly for the two items which dealt with the help screens availability of help screens and understanding the help information (74 percent and 73 percent respectively)
We should note that respondents answered the two items concerning help screens nearly identically therefore it is likely that they may not have made a distinction between the two questions For these two items we also included the percent by only those respondents who actually used help screens We see that respondents who used help screens were somewhat more satisfied with the availability of help information and understanding the help information (83 percent and 82 percent respectively) than all respondents taken together That is some respondents who didnrsquot use any help screens tended to rate them on the lower end of the scale rather than selecting lsquoNot Applicablersquo
Table 7 presents respondentsrsquo level of satisfaction with certain aspects of the Census 2000 Internet Form Respondents indicated on a 5-point scale their level of satisfaction with each of the following items
(1) time required to load the form(2) moving through the form(3) availability of help screens (4) understanding the help information(5) ease of sending the form(6) security and confidentiality procedures and(7) overall satisfaction
12
In Table 7 lsquoSatisfiedrsquo reflects the selection of a four or five on the five-point response scale (See Appendix C for a complete breakdown of responses) Although a score of three represents neither satisfaction nor dissatisfaction we excluded these counts to obtain a conservative estimate of satisfaction Figure 4 presents the same data in a bar graph
Table 7 IDC satisfaction ratings for the Census 2000 Internet Form
Variable
1 Time required to load the form
2 Moving through the form
3 Availability of help screens
Among Help Users Only
4 Understanding the help information
Among Help Users Only
5 Ease of sending the form
6 Security and confidentiality procedures
7 Overall Satisfaction
dagger Standard errors appear in parentheses
N Percent
Satisfied
3216
3210
3118
1593
3096
1587
3199
3192
3198
922
(047)
905
(052)
737
(079)
831
(094)
725
(080)
816
(097)
942
(042)
879
(058)
910
(051)
This row includes only those respondents who used at least one help screen
13
Figure 4 IDC satisfaction ratings for the Census 2000 Internet Form
423 What are the associations between IDC satisfaction measures
We used the gamma statistic as a measure of association for the ordinal IDC variables We found a strong association between availability of the help screens and understanding the help information (09461) This strong association confirms our earlier claim that respondents answered these two questions similarly Overall satisfaction is highly associated with ease of sending the form (08820) moving through the form (08604) and time required to load the form (08420)
Table 8 presents the gamma statistic which examines the relationship between the seven measures studied above We are primarily interested in how each measure is associated with overall satisfaction
Table 8 Associations between IDC satisfaction measures
Gamma 1 2 3 4 5 6
1 Time required to load the form 10000 09050 07072 07044 09408 08063 08420
2 Moving through the form 10000 07546 07310 09349 07943 08604
3 Availability of the help screens 10000 09461 07552 07105 06794
4 Understanding the help information 10000 07520 07088 06852
5 Ease of sending the form 10000 08817 08820
6 Security and confidentiality 10000 08040
procedures
7 Overall satisfaction 10000
14
7
Figure 5 gives the multi-dimensional scaling of the seven measures In Figure 5 we see that the time required to load the form (1) ease of moving through the form (2) and ease of sending the form (5) are the three closest points to overall satisfaction (7) indicating that each has a strong association with overall satisfaction
Figure 5 Multi-dimensional scaling for associations between IDC satisfaction measures
424 Log-linear modeling
In Table 8 there is no clear definition of what is considered a significant association According to Agresti (1990) for an I x J table it is rarely possible to summarize association by a single number without some loss of information We used a log-linear model to further describe the relationship between the IDC satisfaction measures Just as a multiple regression model is more informative than a simple correlation the log-linear model describes associations and provides more information than the univariate gamma statistic We examined all the possible interactions of the seven variables that describe IDC satisfaction We systematically fit several models to find which interactions are needed to explain the data well
Our best model includes almost all of the possible two-way interactions excluding the interactions ABBGBECDCG3 (See Appendix D for a log-linear model comparison) That is all two way interactions are important in describing satisfaction except
3A=Time required to load the form E =Ease of sending the formB=Availability of help screens F=Security and confidentiality concernsC=Understanding of help information G=Overall SatisfactionD=Moving through the form
15
bull time required to load the form and availability of the help screens (AB) bull availability of the help screens and overall satisfaction (BG) bull availability of the help screens and ease of sending the form (BE) bull understanding the help information and moving through the form (CD) bull understanding the help information and overall satisfaction (CG)
Three of the non-significant interactions (ABBECD) are not surprising We wouldnrsquot necessarily expect these interactions to be important The non-significance of the interactions (BGCG) is however quite intriguing One could assume that every variable would be significantly associated with overall satisfaction We see that this isnrsquot the case for availability of the help screens and understanding the help information Thus the interactions of availability of the help screens and understanding the help information with overall satisfaction are not as important in describing the data as the other variables with overall satisfaction
Recall that the gamma statistic relates the relative degree of association between two variables The gamma values for the interactions of availability of help screens and understanding the help information with overall satisfaction were smaller than the other variablesrsquo association with overall satisfaction This is consistent with our final log-linear model The associations might also be low because as we will see in Table 9 not many respondents used the help screens Therefore in general respondents may not have had a strong opinion concerning the help screens
425 How useful were the IDC help topics
On the whole just about half of the respondents used one or more help topics Of those respondents who did use the help screens most were satisfied Respondents rated the usefulness of the twelve help topics embedded in the online census form Respondents found information on these twelve topics by clicking on the blue linked text throughout the census form
Before discussing the usefulness of these items it is important to note that the respondents did not use the IDC help links often The percent of respondents who reported that they did not use the help links ranged from nearly 69 percent to 85 percent for each particular help topic This is important to note as it reflects other literature that suggests that users rarely use help when available Mayhew (1992) suggests that ldquousers worry that if they go into help they will not be able to get back to the place where they were working Remembering how to navigate in help adds a burden to short-term memory The help information may obscure part of the screen interrupting the userrsquos primary task and causing loss of contextrdquo Schneiderman (1998) suggests that ldquousersrsquo navigation among online help segments should be recorded and studied so that we can gain a better understanding of what help segments are effectiverdquo
Table 9 and Figure 6 show the percent of respondents who used the help links for each particular help topic Table 10 and Figure 7 present the usefulness ratings of only those respondents who used at least one help topic The percent of respondents who marked topics lsquovery usefulrsquo ranged from 49 percent (Race) to 69 percent (SecurityConfidentiality) The help topics most prevalent in the lsquonot at all usefulrsquo category were Hispanic origin (20 percent) Race (18 percent) and Telephone number (16 percent)
16
Table 9 Usefulness of IDC help topics
Help Topics N Percent
Use d H elp
Ve rify form a uthenticity 3071 305
(083)
Numbe r of pe ople in 3048 178
household (069)
Hom e ownershiprent 3046 170
(068)
Name 3044 161
(067)
Rela tionship 3032 145
(064)
Age Date of birth 3031 174
(069)
Hisp anic o rigin 3022 150
(065)
Race 3032 185
(070)
Telephone number 3026 160
(067)
Submitting the form 3032 211
(074)
SecurityCo nfidentiality 3023 311
(084)
OM B approval number 2998 201
(073)
dagger Standard errors appear in parentheses
Figure 6 Usefulness of IDC help topics
Percent
Did not use help
695
(083)
822
(069)
830
(068)
839
(067)
855
(064)
826
(069)
850
(065)
815
(070)
840
(067)
789
(074)
689
(084)
799
(073)
17
Table 10 Usefulness of IDC help topics among respondents who used one or more help topics
Help Topics N
Verify form authenticity 936
Number of people in household 542
Home ownershiprent 519
Name 489
Relationship 441
AgeDate of birth 528
Hispanic origin 452
Race 560
Telephone number 484
Submitting the form 641
SecurityConfidentiality 940
OMB approval number 604
dagger Standard errors appear in parentheses
Percent Percent Percent
Not at all Useful
(1)
62
(079)
87
(121)
93
(127)
110
(142)
102
(144)
87
(123)
199
(188)
179
(162)
163
(168)
52
(087)
44
(067)
68
(102)
18
Useful Very Useful
(2) (3)
329 609
(154) (160)
308 605
(199) (210)
357 551
(210) (219)
342 548
(215) (225)
345 553
(227) (237)
309 604
(201) (213)
299 502
(216) (235)
330 491
(199) (211)
333 504
(214) (228)
275 674
(176) (185)
269 687
(145) (151)
263 669
(179) (192)
--- ---
--- ---
Figure 7 Usefulness of IDC help topics among respondents who used one or more help topics
426 From what location did users access IDC
Eighty-five percent of respondents submitted their Census 2000 Internet Form from home while almost 14 percent accessed the site from work Less than one percent submitted their form from a school or some other place Fewer than ten respondents selected lsquolibraryrsquo Table 11 shows the locations from which IDC users primarily accessed the Census 2000 Internet Form Some data are withheld due to insufficient sample size
Table 11 Location from which IDC users accessed the Census 2000 Internet Form
Location Frequency Percent
Home
Work
School
Library
Some other place
Total
daggerStandard errors appear in parentheses
2728 853
(063)
435 136
(061)
22 07
(015)
3199 100 0
19
---
427 How did IDC users hear about the Census 2000 Internet form
The media (televisionradionewspaper) was the most marked answer with over 52 percent This is not surprising since IDC was not a part of the Census 2000 advertising campaign and publicity came primarily from the media The Census 2000 Home Page was marked by over 14 percent of respondents Surprisingly almost ten percent of respondents said that they heard about the Census 2000 Internet Form through the letter attached to the Census form However only households selected for the RMIE actually received a letter informing them of the Internet filing option Respondents may have confused this response option with the advance letter which contained the Census web address but did not mention the Census Internet Form
Table 12 gives the distribution of where users heard about the Census 2000 Internet Form Respondents indicated where they heard about the Census 2000 Internet Form by marking one or more of the 11 given categories Since respondents could mark more than one response the responses do not add to 100 percent Figure 8 presents the information in a bar graph
Table 12 How IDC users heard about the Census 2000 Internet Form
Source Frequency Percent of Total
Census 2000 H ome Page
Main US Census Bureau web site
Internet service provider
Major web site
Internet news web site
Other Internet site
TelevisionRadioNewspaper (Media)
Toll free Census telephone help line
Census In Schools program
Letter attached to the Census form
Other
Total of Respondents
daggerStandard errors appear in parentheses
of Respondents
454 143
(062)
187 59
(042)
288 91
(051)
103 33
(032)
183 58
(041)
136 43
(036)
1658 524
(089)
169 53
(040)
28 09
(017)
310 98
(053)
342 108
(055)
3167
daggerdaggerRespondents could mark more than one response
The letter was included with Census materials only for those households selected for the RMIE
20
Figure 8 How IDC users heard about the Census 2000 Internet Form
5 RECOMMENDATIONS
The customer satisfaction surveys provided some very insightful information regarding how well the users perceived the Census 2000 web site Overall respondents were quite satisfied with IDC On the other hand users were generally unsatisfied with IQA and the help information contained within Taken together these results suggest a variety of areas for further research and exploration
51 System Design
bull Implement a content redesign of the Internet census help instrument While respondents found the help screen information easy to understand they were generally unsatisfied with the information presented The IQA help information on specific census topics came primarily from the QRB and focused on questions about the census questionnaire Respondents had questions about much more than just the questionnaire We need to update and enhance the information available from the QRB as well as investigate the use of other resources that would provide helpful information to users
52 Customer satisfaction survey implementation
bull To increase survey quality with better user representation consider alternate survey implementation choices such as a pop-up survey rather than a link Advantages of using a pop-up survey include
-Systematic selection of every lsquonthrsquo visitor -Survey automatically pops up on screen (using a new browser window) -Use of ldquocookiesrdquo to ensure that each user only completes the survey once
21
53 Research and Testing
bull Conduct research on knowledge and perceptions of the decennial census The implementation of the Census 2000 web site was somewhat small scale and did not require extensive research prior to implementation However it is important to put more focus on research for future projects or there may be severe implications for a similar large-scale implementation in 2010 Design research based on these survey findings
bull Look beyond restricting online assistance to questionnaire help To maximize customer satisfaction we should investigate all kinds of relevant census information that may be helpful to users
bull Incorporate usability testing to explore the user expectations and preferred content of IQA
bull Conduct an evaluation during the 2004 Census Test in which evaluation methodologies and production requirements are developed simultaneously
22
References
Agresti Alan Categorical Data Analysis John Wiley amp Sons Inc New York City 1990
ldquoAmericarsquos Customer Satisfaction Initiative for Federal Governmentrdquo The Federal Governmentrsquos Customer Service Web Site ltwwwcustomerservicegovgt (December 28 2000)
Borg Ingwer and Groenen Patrick Modern Multidimensional Scaling Theory and Applications Springer-Verlag New York Inc New York City 1997
Coon David ldquoProgram Master Plan Census 2000 Internet Questionnaire Assistance and Data Collection Operationsrdquo May 11 1999
DeMaio TJ and Bates NA ldquoWho Fills Out the Census Formrdquo Proceedings of the Survey Research Methods Section of the American Statistical Association 1990 584-589
Dillman Don A and Bowker Dennis K ldquoThe Web Questionnaire Challenge to Survey Methodologistsrdquo Book Chapter forthcoming 2000
Horton William K Designing and Writing Online Documentation John Wiley New York 1990
Malakhoff Lawrence A ldquoProgram Master Plan for the Response Mode and Incentive Experimentrdquo May 2 2000
Mayhew Deborah J Principles and Guidelines in Software User Interface Design Prentice Hall Englewood Cliffs NJ 1992
Nichols Elizabeth and Sedivi Barbara ldquoEconomic Data Collection via the Web A Census Bureau Case Studyrdquo US Bureau of the Census May 29 1998
Schneiderman B Designing the User Interface Addison-Wesley Reading MA 1998
Sweet E and Russell C ldquoA Discussion of Data Collection via the Internetrdquo Proceedings of the Section on Survey Research Methods of the American Statistical Association 1996 774-779
Wellens Tracy and Martin Elizabeth ldquoCustomer Satisfaction Measurement Issues in the Federal Governmentrdquo
Zelterman Daniel Models for Discrete Data Oxford University Press Oxford 1999
23
Appendix A-1 IQA Survey
OMB No 0607-0760
The Census Bureau would like to know how well the Census 2000 Internet help screens worked for you Please take a few moments to answer our questions and give us your opinions about the on-line help Your answers are voluntary and confidential and will help us learn where improvements are
needed in future Census Internet products Thank you in advance for your participation
1 A How easy was it for you to find the topics you were looking for while using the Internet help screens
Not at all easy Easy Very easy 1 2 3
B Overall how easy was it to understand the Internet help screen information
Not at all easy Easy Very easy 1 2 3
C Overall how helpful to you was the Internet help screen information
Not at all helpful Helpful Very helpful 1 2 3
D Overall how satisfied are you with the Internet help screens
Not at all satisfied Satisfied Very satisfied 1 2 3
2 From which location did you primarily use the Census 2000 Internet help screens
Home Work School Library Some other place please specify_______________
24
Appendix A-1 IQA Survey
3 How did you hear about the Census 2000 Internet help screens Please mark all that apply
G From the Main US Census Bureau web site (wwwcensusgov)G From an Internet Service Provider (AOL MSN Mindspring etc)
G From a major web site (Yahoo Netcenter AltaVista etc)G From an Internet news web site (ABC MSNBC CBS etc)G From some other Internet site (not covered above)
G Through televisionradionewspaperG Through the toll free Census telephone help lineG Through the Census In Schools Program
G Through the letter attached to the census form you received in the mailG Other please specify______________________
4 Did you know that some census forms are available for you to complete through the Census 2000 web site
__Yes __No
5 Do you intend to submit your census form through the Census 2000 web site
__Yes__No my type of form was not available through the Census 2000 web site__No I tried to submit the Internet form and was unsuccessful__No I have security concerns__No I prefer to use the paper form__No I have already completed the paper form__No some other reason please specify________________________________Not sure
Submit this survey
25
Appendix A-2 IDC Survey
OMB No 0607-0760
The Census Bureau would like to know how well the Census Internet Form worked for you Please take a few moments to answer our questions and give us your opinions on the Census Internet Form Your answers are voluntary and confidential and will help us learn where improvements are needed in
future Internet products Thank you in advance for your participation
IV How satisfied are you with the following aspects of the Census 2000 Internet Form
Very Dissatisfied
1
Dissatisfied
2
Neither Satisfied nor Dissatisfied
3
Satisfied
4
Very Satisfied
5
Time required to load the form
Moving through the form
Availability of help screens
Understanding the help information
Ease of sending the form
Security and confidentiality procedures
2 Overall how satisfied are you with the Census 2000 Internet Form
Very Dissatisfied Dissatisfied Neither Satisfied Satisfied Very Satisfied nor Dissatisfied
1 2 3 4 5
26
Appendix A-2 IDC Survey
3 While you were completing the Census 2000 Internet Form help was available for a variety of topics (if you clicked on the linked text) In the following chart please mark how useful the help information was to you For topics on which you did not use help please mark lsquoNArsquo
Help Topics How useful was the information
Not at all Useful
1
Useful
2
Very Useful
3
Did not use this topic
NA
Verify form authenticity
Number of people in household
Home ownershiprent
Name
Relationship
AgeDate of birth
Hispanic origin
Race
Telephone number
Submitting the form
SecurityConfidentiality
OMB approval number
4 From which location did you submit your Census 2000 Internet Form
Home Work School Library Some other place please specify_______________
27
Appendix A-2 IDC Survey
5 How did you hear about the Census 2000 Internet Form Please mark all that apply
G From the Census 2000 Home page (www2000censusgov)G From the Main US Census Bureau web site (wwwcensusgov)G From an Internet Service Provider (AOL MSN Mindspring etc)
G From a major web site (Yahoo Netcenter AltaVista etc)G From an Internet News web site (ABC MSNBC CBS etc)G From some other Internet site (not covered above)
G Through televisionradionewspaperG Through the toll free Census telephone help lineG Through the Census In Schools Program
G Through the letter attached to the census form you received in the mailG Other please specify______________________
Submit this survey
28
Appendix B Log-linear models
Screening and building a log-linear model
First we analyzed a model with seven variables (1) time required to load the form (2) moving through the form (3) availability of help screens (4) understanding the help screen information (5) ease of sending the form (6) security and confidentiality procedures and (7) overall satisfaction including all 2-way interactions
Next we will delete an arbitrary interaction from the model By comparing the G2 statistics and the p-value for the initial model vs the reduced model we will determine whether the interaction is significant If the G2 and the p-value are roughly the same for the two models we can
conclude that is not significant and we can drop the interaction from the model
Consequently we can exclude any three-way interactions that include such as If
is significant we cannot drop any three-way interactions that include We will perform this procedure for each two-way interaction hoping to eliminate as many terms as possible to achieve the simplest model Any higher-level interactions greater than three are extremely difficult to interpret consequently we will ignore them in our analysis
however
Interpreting the results
The G2 statistic its p-value and the degrees of freedom of the model are the criteria of a good fit Specifically we are looking for a simple model with a small G2 a large p-value and a large number of degrees of freedom Adding additional model terms will always decrease the value of the G2 statistic If the additional terms donrsquot make an important contribution to the model then the G2 statistic will decrease by only a small amount and the significance level may actually decrease indicating a poorer fit to the data This is analogous to linear regression in which the mean squared error may increase when forcing non-significant independent variables into the model
29
Example of the results
Suppose we have the summary statistics for several log-linear models
Model df p-value
Model 1 (ACBCABC) 2068 34 03624
Model 2 (ABCD) 2101 35 04551
Model 3 (AB) 3498 36 00558
Model 4 (BC) 3622 36 00126
Which model should we choose Recall we want a simple model with a small G2 a large p-value and large number of degrees of freedom By these criteria we will go with Model 2 The G2 for Model 1 is smaller but just barely Notice however that the p-value for Model 1 actually decreases We identify Model 2 as the best fit
30
Appendix C
Table 13 IDC satisfaction ratings for the Census 2000 Internet Form
Variable
Time required to load
the form
Moving through the
form
Availability of help
screens
Help Users Only
Understanding help
info
Help Users Only
Ease of sending form
Security and
Confidentiality
procedures
Overall Satisfaction
Percent Percent Percent Percent Percent
N VD D Neither S VS
(1) (2) (3) (4) (5)
3216 41 09 28 281 642
(035) (017) (029) (079) (085)
3210 42 18 35 276 629
(036) 024) (032) (079) (085)
3118 37 08 218 243 494
(034) (016) (074) (077) (090)
1593 383 119 1186 2762 5549
(048) (027) (081) (112) (125)
3096 38 08 230 240 484
(034) (016) (076) (077) (089)
1587 391 139 1311 2710 5451
(049) (029) (085) (112) (125)
3199 42 07 10 175 767
(035) (014) (018) (067) (037)
3192 45 06 70 272 607
(013) (045) (079) (086) (036)
3198 44 14 32 259 651
(036) (021) (031) (077) (084)
31
Appendix D
Log Linear Model Comparison4
Model
Model 1--A ll two-w ay interactions
Model 1a
(ACADAEAFAGBCBDBE
BFBGCDCECFCGDEDFDG
EFEGFG)
Model 1b
(ACADAEAFAGBCBDBF
CDCECFCGDEDFDGEFEGFG)
Model 1c
(ACADAEAFAGBCBDBF
CECFDEDFDGEFEGFG)
Model 1d
(ACADAEAFAGBCBDBF
CECFDEDFDGEFFG)
Model 2
(ADEADFAEFADGAEG
DEGEFG)
G-squared df p-value
10516 99 3170
10517 100 3422
10627 102 3664
11068 104 3087
12330 105 1072
425522 105 0000
Which model should we choose Recall from Appendix B we want a simple model with a small G2 a large p-value and a large number of degrees of freedom By these criteria we will go with Model 1c The G2 for Model 1b is smaller but just barely and it includes two more interactions We identify Model 1c as the simplest and best fitting model
4A=Time required to load the form E=Ease of sending the formB=Availability of help screens F=Security and confidentiality concernsC=Understanding of help information G=Overall satisfactionD=M oving through the form
32
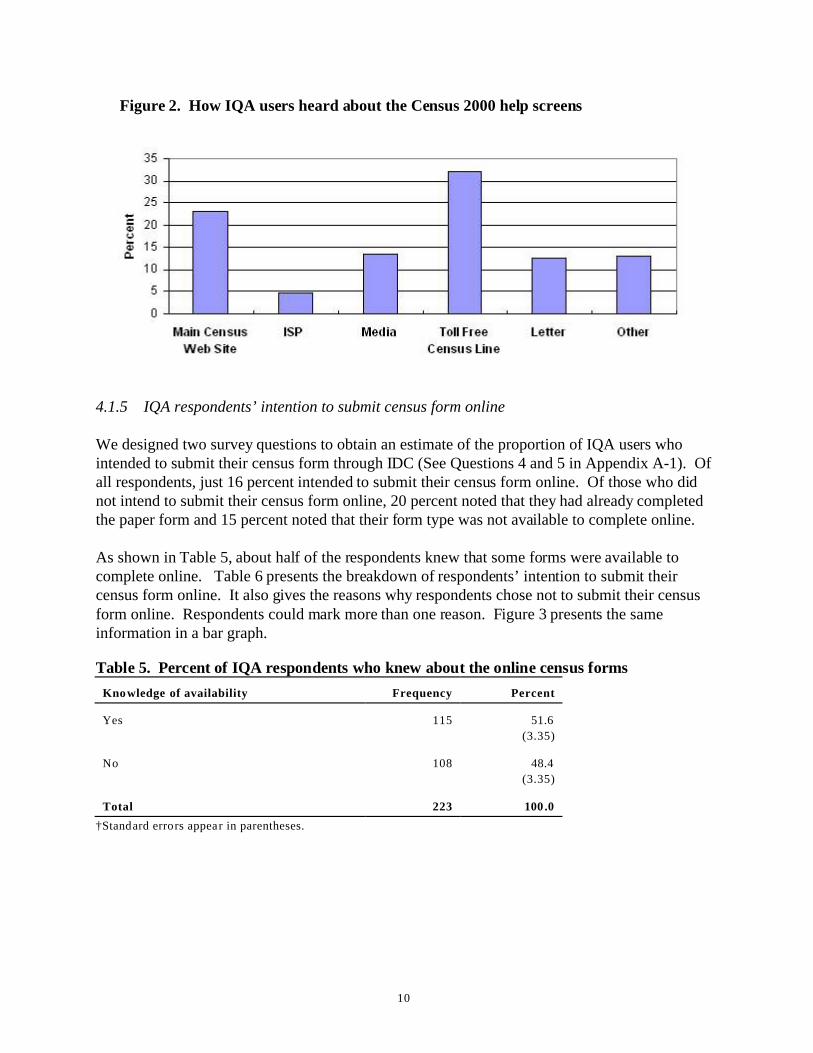
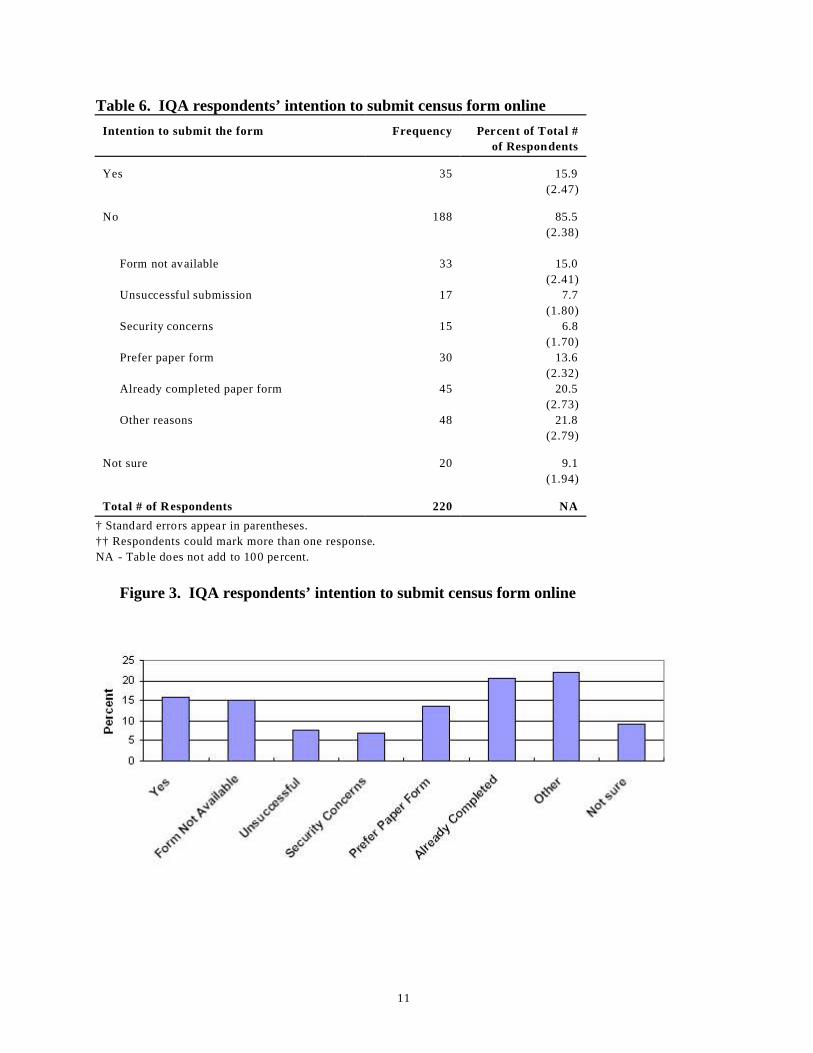
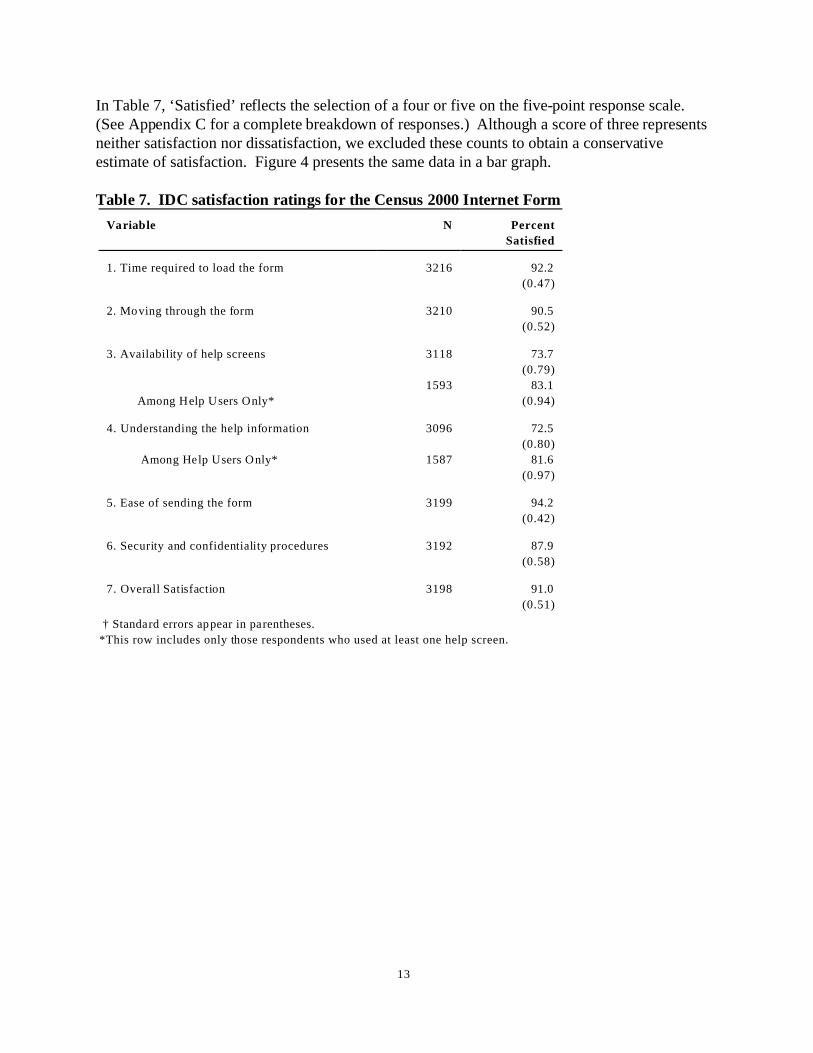
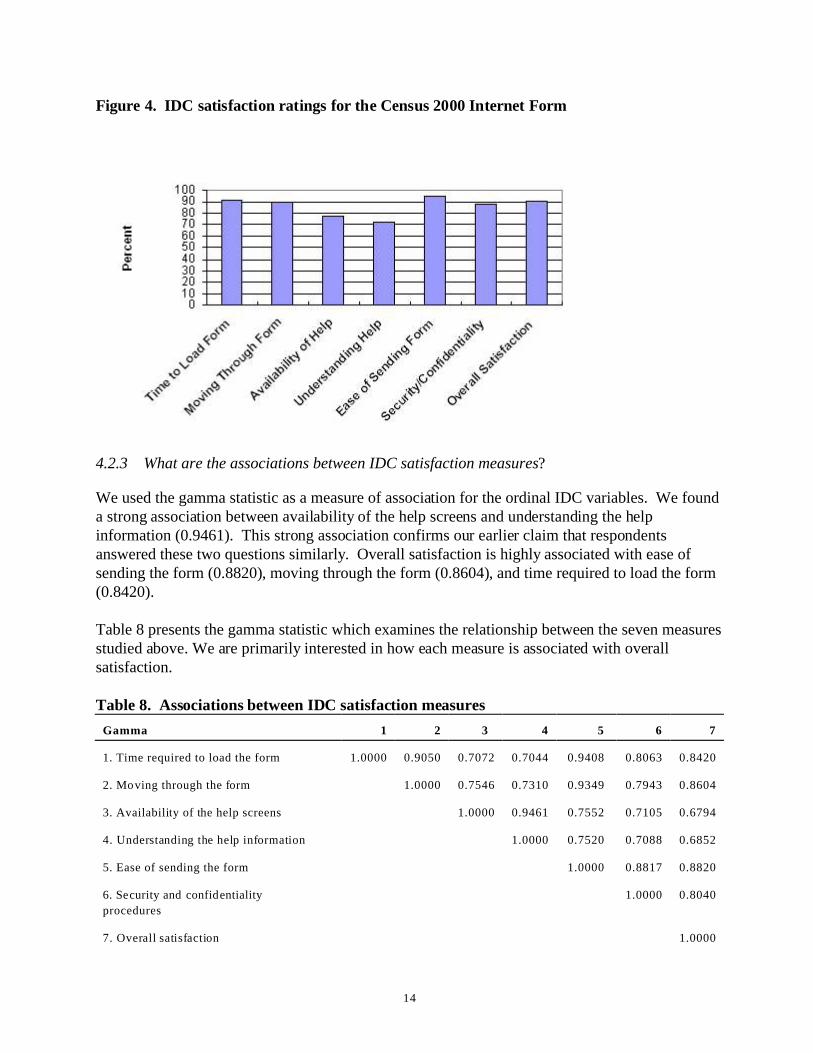
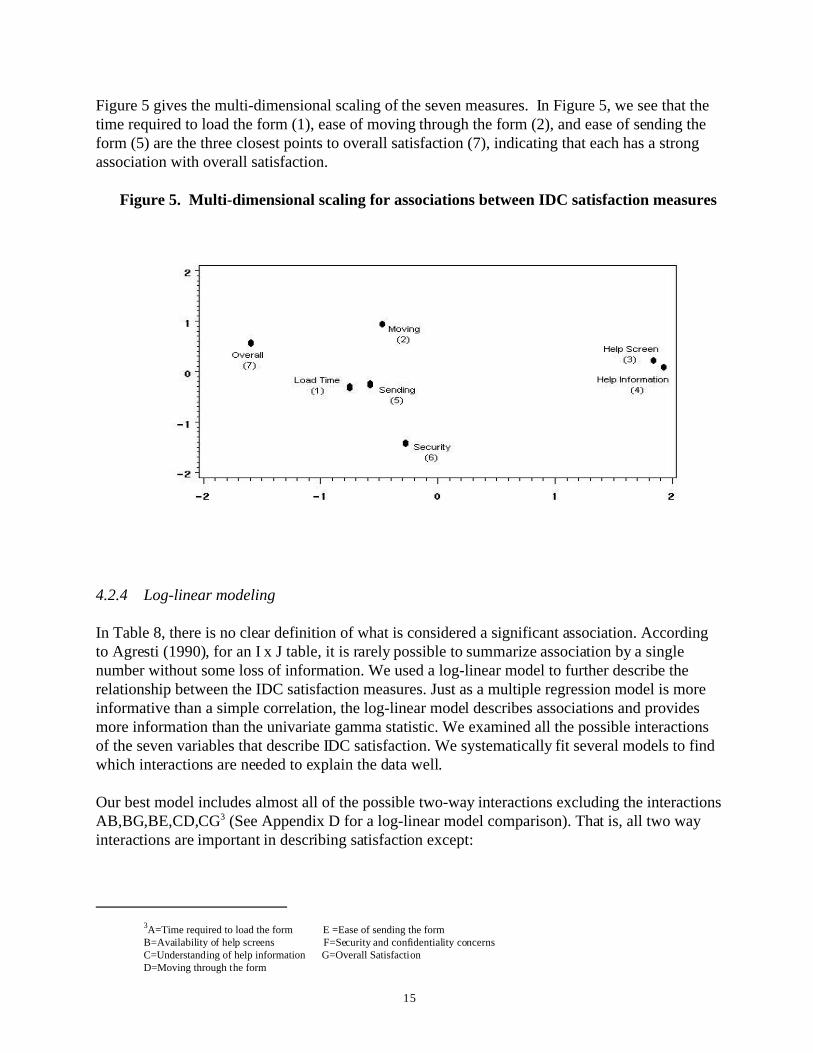
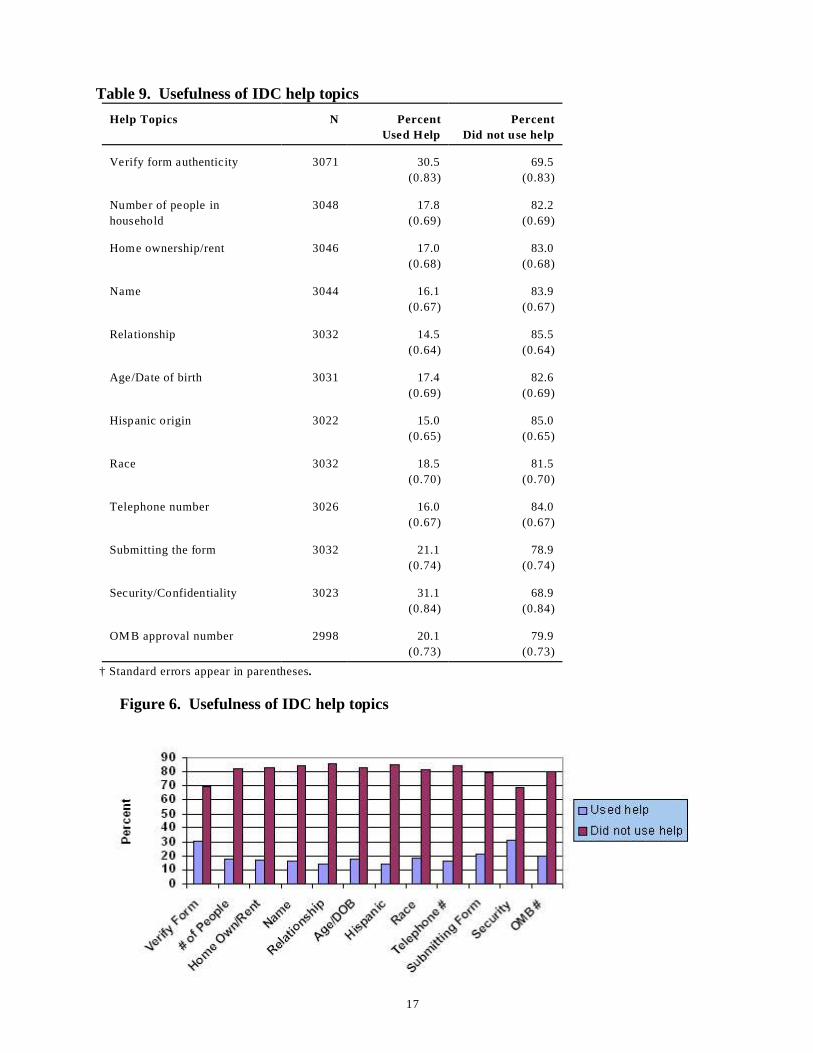
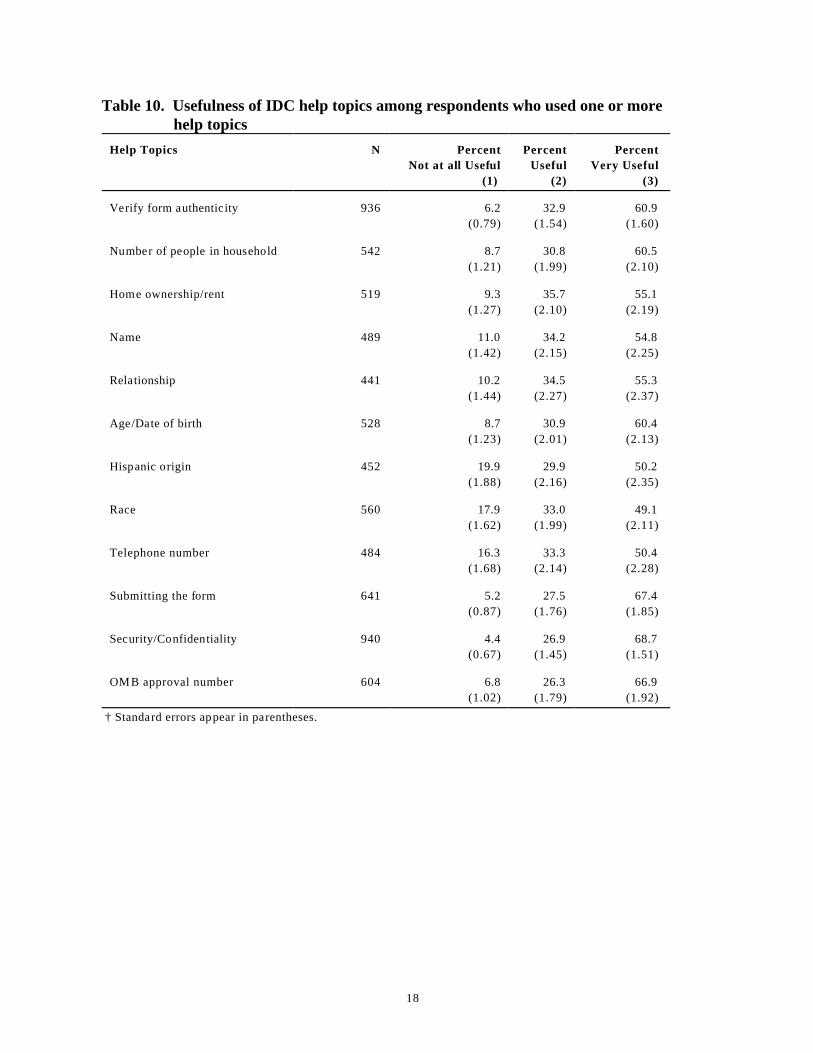
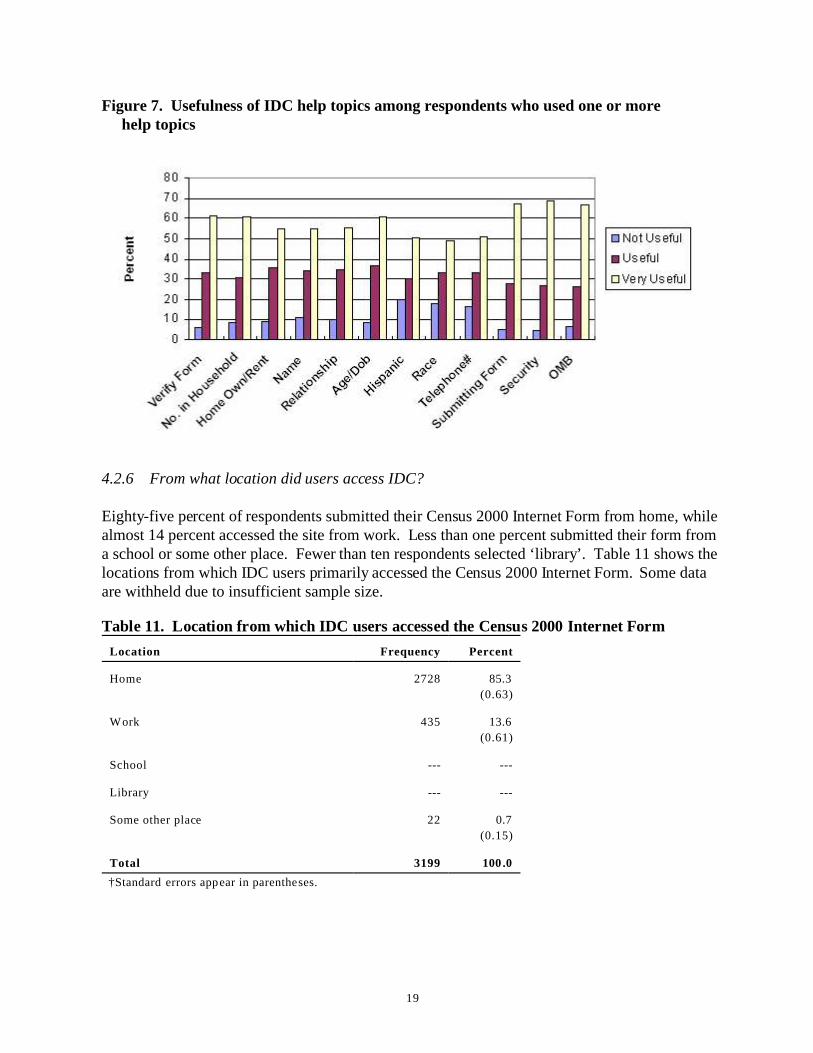
--- ---
--- ---
Figure 7 Usefulness of IDC help topics among respondents who used one or more help topics
426 From what location did users access IDC
Eighty-five percent of respondents submitted their Census 2000 Internet Form from home while almost 14 percent accessed the site from work Less than one percent submitted their form from a school or some other place Fewer than ten respondents selected lsquolibraryrsquo Table 11 shows the locations from which IDC users primarily accessed the Census 2000 Internet Form Some data are withheld due to insufficient sample size
Table 11 Location from which IDC users accessed the Census 2000 Internet Form
Location Frequency Percent
Home
Work
School
Library
Some other place
Total
daggerStandard errors appear in parentheses
2728 853
(063)
435 136
(061)
22 07
(015)
3199 100 0
19
---
427 How did IDC users hear about the Census 2000 Internet form
The media (televisionradionewspaper) was the most marked answer with over 52 percent This is not surprising since IDC was not a part of the Census 2000 advertising campaign and publicity came primarily from the media The Census 2000 Home Page was marked by over 14 percent of respondents Surprisingly almost ten percent of respondents said that they heard about the Census 2000 Internet Form through the letter attached to the Census form However only households selected for the RMIE actually received a letter informing them of the Internet filing option Respondents may have confused this response option with the advance letter which contained the Census web address but did not mention the Census Internet Form
Table 12 gives the distribution of where users heard about the Census 2000 Internet Form Respondents indicated where they heard about the Census 2000 Internet Form by marking one or more of the 11 given categories Since respondents could mark more than one response the responses do not add to 100 percent Figure 8 presents the information in a bar graph
Table 12 How IDC users heard about the Census 2000 Internet Form
Source Frequency Percent of Total
Census 2000 H ome Page
Main US Census Bureau web site
Internet service provider
Major web site
Internet news web site
Other Internet site
TelevisionRadioNewspaper (Media)
Toll free Census telephone help line
Census In Schools program
Letter attached to the Census form
Other
Total of Respondents
daggerStandard errors appear in parentheses
of Respondents
454 143
(062)
187 59
(042)
288 91
(051)
103 33
(032)
183 58
(041)
136 43
(036)
1658 524
(089)
169 53
(040)
28 09
(017)
310 98
(053)
342 108
(055)
3167
daggerdaggerRespondents could mark more than one response
The letter was included with Census materials only for those households selected for the RMIE
20
Figure 8 How IDC users heard about the Census 2000 Internet Form
5 RECOMMENDATIONS
The customer satisfaction surveys provided some very insightful information regarding how well the users perceived the Census 2000 web site Overall respondents were quite satisfied with IDC On the other hand users were generally unsatisfied with IQA and the help information contained within Taken together these results suggest a variety of areas for further research and exploration
51 System Design
bull Implement a content redesign of the Internet census help instrument While respondents found the help screen information easy to understand they were generally unsatisfied with the information presented The IQA help information on specific census topics came primarily from the QRB and focused on questions about the census questionnaire Respondents had questions about much more than just the questionnaire We need to update and enhance the information available from the QRB as well as investigate the use of other resources that would provide helpful information to users
52 Customer satisfaction survey implementation
bull To increase survey quality with better user representation consider alternate survey implementation choices such as a pop-up survey rather than a link Advantages of using a pop-up survey include
-Systematic selection of every lsquonthrsquo visitor -Survey automatically pops up on screen (using a new browser window) -Use of ldquocookiesrdquo to ensure that each user only completes the survey once
21
53 Research and Testing
bull Conduct research on knowledge and perceptions of the decennial census The implementation of the Census 2000 web site was somewhat small scale and did not require extensive research prior to implementation However it is important to put more focus on research for future projects or there may be severe implications for a similar large-scale implementation in 2010 Design research based on these survey findings
bull Look beyond restricting online assistance to questionnaire help To maximize customer satisfaction we should investigate all kinds of relevant census information that may be helpful to users
bull Incorporate usability testing to explore the user expectations and preferred content of IQA
bull Conduct an evaluation during the 2004 Census Test in which evaluation methodologies and production requirements are developed simultaneously
22
References
Agresti Alan Categorical Data Analysis John Wiley amp Sons Inc New York City 1990
ldquoAmericarsquos Customer Satisfaction Initiative for Federal Governmentrdquo The Federal Governmentrsquos Customer Service Web Site ltwwwcustomerservicegovgt (December 28 2000)
Borg Ingwer and Groenen Patrick Modern Multidimensional Scaling Theory and Applications Springer-Verlag New York Inc New York City 1997
Coon David ldquoProgram Master Plan Census 2000 Internet Questionnaire Assistance and Data Collection Operationsrdquo May 11 1999
DeMaio TJ and Bates NA ldquoWho Fills Out the Census Formrdquo Proceedings of the Survey Research Methods Section of the American Statistical Association 1990 584-589
Dillman Don A and Bowker Dennis K ldquoThe Web Questionnaire Challenge to Survey Methodologistsrdquo Book Chapter forthcoming 2000
Horton William K Designing and Writing Online Documentation John Wiley New York 1990
Malakhoff Lawrence A ldquoProgram Master Plan for the Response Mode and Incentive Experimentrdquo May 2 2000
Mayhew Deborah J Principles and Guidelines in Software User Interface Design Prentice Hall Englewood Cliffs NJ 1992
Nichols Elizabeth and Sedivi Barbara ldquoEconomic Data Collection via the Web A Census Bureau Case Studyrdquo US Bureau of the Census May 29 1998
Schneiderman B Designing the User Interface Addison-Wesley Reading MA 1998
Sweet E and Russell C ldquoA Discussion of Data Collection via the Internetrdquo Proceedings of the Section on Survey Research Methods of the American Statistical Association 1996 774-779
Wellens Tracy and Martin Elizabeth ldquoCustomer Satisfaction Measurement Issues in the Federal Governmentrdquo
Zelterman Daniel Models for Discrete Data Oxford University Press Oxford 1999
23
Appendix A-1 IQA Survey
OMB No 0607-0760
The Census Bureau would like to know how well the Census 2000 Internet help screens worked for you Please take a few moments to answer our questions and give us your opinions about the on-line help Your answers are voluntary and confidential and will help us learn where improvements are
needed in future Census Internet products Thank you in advance for your participation
1 A How easy was it for you to find the topics you were looking for while using the Internet help screens
Not at all easy Easy Very easy 1 2 3
B Overall how easy was it to understand the Internet help screen information
Not at all easy Easy Very easy 1 2 3
C Overall how helpful to you was the Internet help screen information
Not at all helpful Helpful Very helpful 1 2 3
D Overall how satisfied are you with the Internet help screens
Not at all satisfied Satisfied Very satisfied 1 2 3
2 From which location did you primarily use the Census 2000 Internet help screens
Home Work School Library Some other place please specify_______________
24
Appendix A-1 IQA Survey
3 How did you hear about the Census 2000 Internet help screens Please mark all that apply
G From the Main US Census Bureau web site (wwwcensusgov)G From an Internet Service Provider (AOL MSN Mindspring etc)
G From a major web site (Yahoo Netcenter AltaVista etc)G From an Internet news web site (ABC MSNBC CBS etc)G From some other Internet site (not covered above)
G Through televisionradionewspaperG Through the toll free Census telephone help lineG Through the Census In Schools Program
G Through the letter attached to the census form you received in the mailG Other please specify______________________
4 Did you know that some census forms are available for you to complete through the Census 2000 web site
__Yes __No
5 Do you intend to submit your census form through the Census 2000 web site
__Yes__No my type of form was not available through the Census 2000 web site__No I tried to submit the Internet form and was unsuccessful__No I have security concerns__No I prefer to use the paper form__No I have already completed the paper form__No some other reason please specify________________________________Not sure
Submit this survey
25
Appendix A-2 IDC Survey
OMB No 0607-0760
The Census Bureau would like to know how well the Census Internet Form worked for you Please take a few moments to answer our questions and give us your opinions on the Census Internet Form Your answers are voluntary and confidential and will help us learn where improvements are needed in
future Internet products Thank you in advance for your participation
IV How satisfied are you with the following aspects of the Census 2000 Internet Form
Very Dissatisfied
1
Dissatisfied
2
Neither Satisfied nor Dissatisfied
3
Satisfied
4
Very Satisfied
5
Time required to load the form
Moving through the form
Availability of help screens
Understanding the help information
Ease of sending the form
Security and confidentiality procedures
2 Overall how satisfied are you with the Census 2000 Internet Form
Very Dissatisfied Dissatisfied Neither Satisfied Satisfied Very Satisfied nor Dissatisfied
1 2 3 4 5
26
Appendix A-2 IDC Survey
3 While you were completing the Census 2000 Internet Form help was available for a variety of topics (if you clicked on the linked text) In the following chart please mark how useful the help information was to you For topics on which you did not use help please mark lsquoNArsquo
Help Topics How useful was the information
Not at all Useful
1
Useful
2
Very Useful
3
Did not use this topic
NA
Verify form authenticity
Number of people in household
Home ownershiprent
Name
Relationship
AgeDate of birth
Hispanic origin
Race
Telephone number
Submitting the form
SecurityConfidentiality
OMB approval number
4 From which location did you submit your Census 2000 Internet Form
Home Work School Library Some other place please specify_______________
27
Appendix A-2 IDC Survey
5 How did you hear about the Census 2000 Internet Form Please mark all that apply
G From the Census 2000 Home page (www2000censusgov)G From the Main US Census Bureau web site (wwwcensusgov)G From an Internet Service Provider (AOL MSN Mindspring etc)
G From a major web site (Yahoo Netcenter AltaVista etc)G From an Internet News web site (ABC MSNBC CBS etc)G From some other Internet site (not covered above)
G Through televisionradionewspaperG Through the toll free Census telephone help lineG Through the Census In Schools Program
G Through the letter attached to the census form you received in the mailG Other please specify______________________
Submit this survey
28
Appendix B Log-linear models
Screening and building a log-linear model
First we analyzed a model with seven variables (1) time required to load the form (2) moving through the form (3) availability of help screens (4) understanding the help screen information (5) ease of sending the form (6) security and confidentiality procedures and (7) overall satisfaction including all 2-way interactions
Next we will delete an arbitrary interaction from the model By comparing the G2 statistics and the p-value for the initial model vs the reduced model we will determine whether the interaction is significant If the G2 and the p-value are roughly the same for the two models we can
conclude that is not significant and we can drop the interaction from the model
Consequently we can exclude any three-way interactions that include such as If
is significant we cannot drop any three-way interactions that include We will perform this procedure for each two-way interaction hoping to eliminate as many terms as possible to achieve the simplest model Any higher-level interactions greater than three are extremely difficult to interpret consequently we will ignore them in our analysis
however
Interpreting the results
The G2 statistic its p-value and the degrees of freedom of the model are the criteria of a good fit Specifically we are looking for a simple model with a small G2 a large p-value and a large number of degrees of freedom Adding additional model terms will always decrease the value of the G2 statistic If the additional terms donrsquot make an important contribution to the model then the G2 statistic will decrease by only a small amount and the significance level may actually decrease indicating a poorer fit to the data This is analogous to linear regression in which the mean squared error may increase when forcing non-significant independent variables into the model
29
Example of the results
Suppose we have the summary statistics for several log-linear models
Model df p-value
Model 1 (ACBCABC) 2068 34 03624
Model 2 (ABCD) 2101 35 04551
Model 3 (AB) 3498 36 00558
Model 4 (BC) 3622 36 00126
Which model should we choose Recall we want a simple model with a small G2 a large p-value and large number of degrees of freedom By these criteria we will go with Model 2 The G2 for Model 1 is smaller but just barely Notice however that the p-value for Model 1 actually decreases We identify Model 2 as the best fit
30
Appendix C
Table 13 IDC satisfaction ratings for the Census 2000 Internet Form
Variable
Time required to load
the form
Moving through the
form
Availability of help
screens
Help Users Only
Understanding help
info
Help Users Only
Ease of sending form
Security and
Confidentiality
procedures
Overall Satisfaction
Percent Percent Percent Percent Percent
N VD D Neither S VS
(1) (2) (3) (4) (5)
3216 41 09 28 281 642
(035) (017) (029) (079) (085)
3210 42 18 35 276 629
(036) 024) (032) (079) (085)
3118 37 08 218 243 494
(034) (016) (074) (077) (090)
1593 383 119 1186 2762 5549
(048) (027) (081) (112) (125)
3096 38 08 230 240 484
(034) (016) (076) (077) (089)
1587 391 139 1311 2710 5451
(049) (029) (085) (112) (125)
3199 42 07 10 175 767
(035) (014) (018) (067) (037)
3192 45 06 70 272 607
(013) (045) (079) (086) (036)
3198 44 14 32 259 651
(036) (021) (031) (077) (084)
31
Appendix D
Log Linear Model Comparison4
Model
Model 1--A ll two-w ay interactions
Model 1a
(ACADAEAFAGBCBDBE
BFBGCDCECFCGDEDFDG
EFEGFG)
Model 1b
(ACADAEAFAGBCBDBF
CDCECFCGDEDFDGEFEGFG)
Model 1c
(ACADAEAFAGBCBDBF
CECFDEDFDGEFEGFG)
Model 1d
(ACADAEAFAGBCBDBF
CECFDEDFDGEFFG)
Model 2
(ADEADFAEFADGAEG
DEGEFG)
G-squared df p-value
10516 99 3170
10517 100 3422
10627 102 3664
11068 104 3087
12330 105 1072
425522 105 0000
Which model should we choose Recall from Appendix B we want a simple model with a small G2 a large p-value and a large number of degrees of freedom By these criteria we will go with Model 1c The G2 for Model 1b is smaller but just barely and it includes two more interactions We identify Model 1c as the simplest and best fitting model
4A=Time required to load the form E=Ease of sending the formB=Availability of help screens F=Security and confidentiality concernsC=Understanding of help information G=Overall satisfactionD=M oving through the form
32
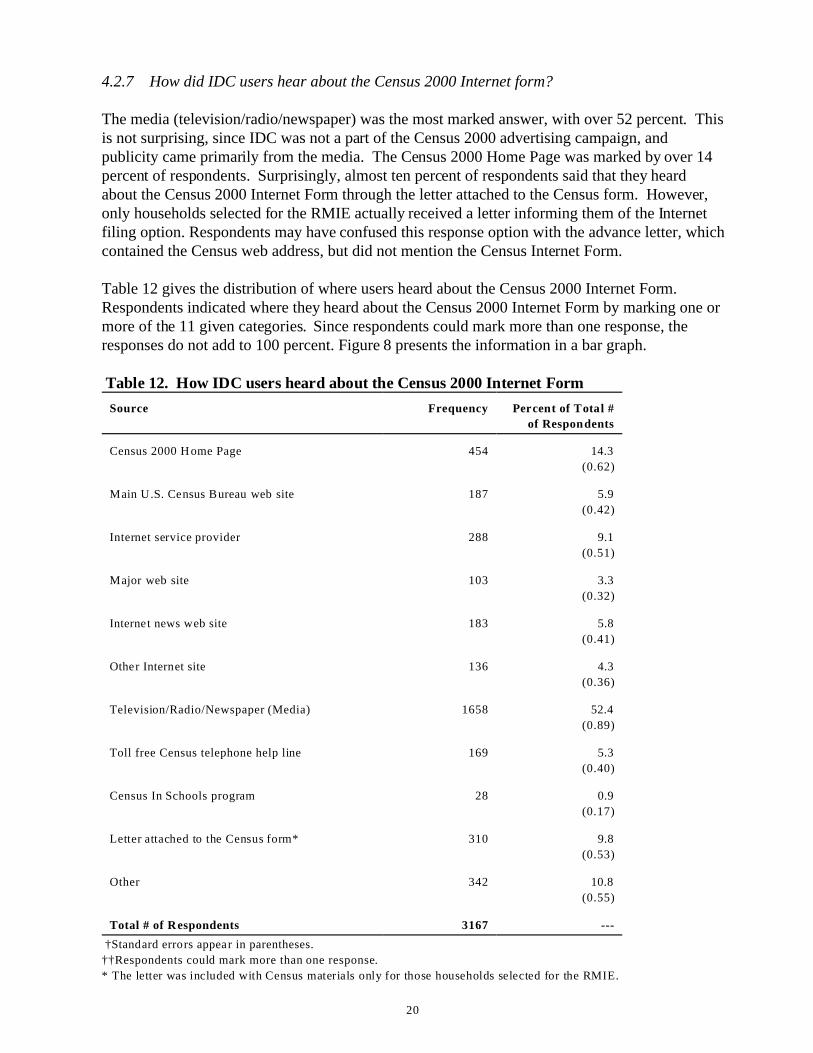
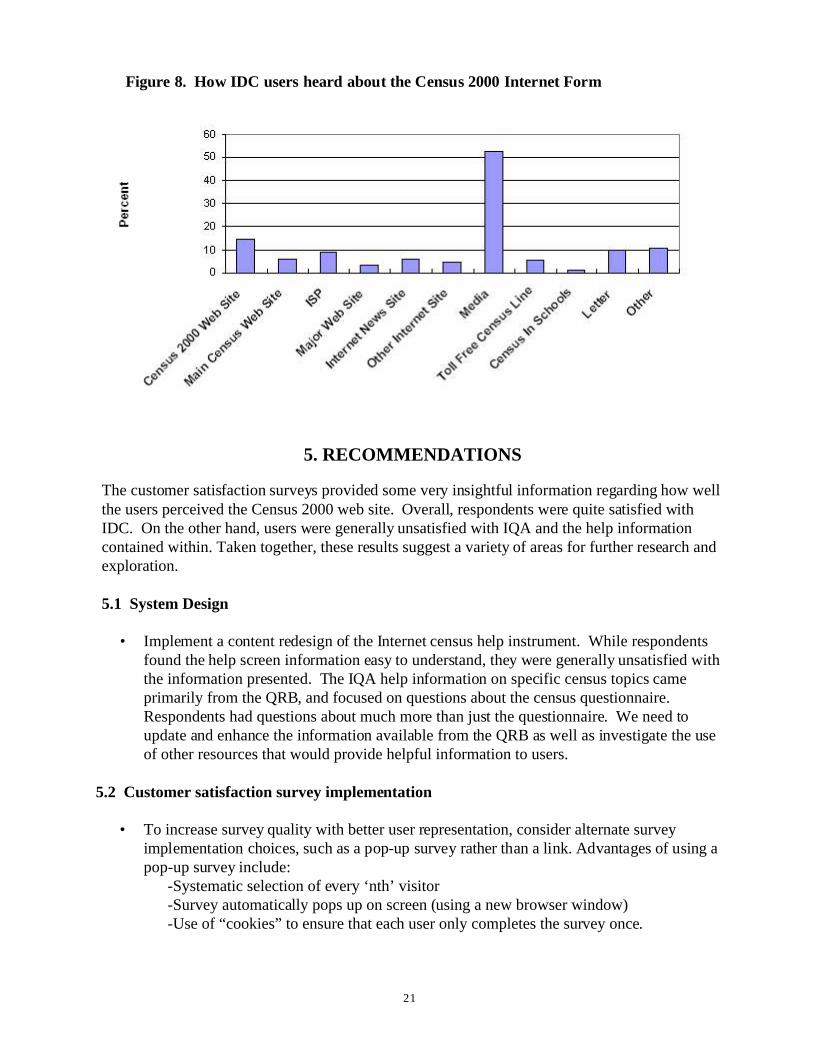
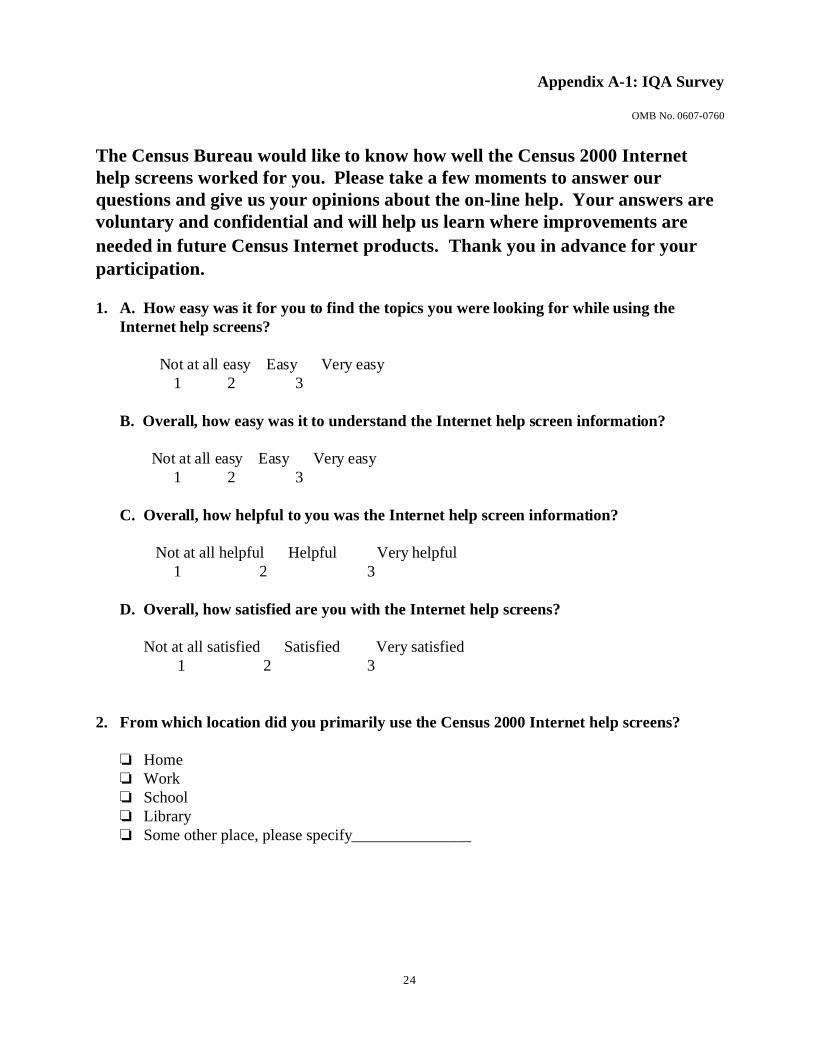
Appendix A-1 IQA Survey
OMB No 0607-0760
The Census Bureau would like to know how well the Census 2000 Internet help screens worked for you Please take a few moments to answer our questions and give us your opinions about the on-line help Your answers are voluntary and confidential and will help us learn where improvements are
needed in future Census Internet products Thank you in advance for your participation
1 A How easy was it for you to find the topics you were looking for while using the Internet help screens
Not at all easy Easy Very easy 1 2 3
B Overall how easy was it to understand the Internet help screen information
Not at all easy Easy Very easy 1 2 3
C Overall how helpful to you was the Internet help screen information
Not at all helpful Helpful Very helpful 1 2 3
D Overall how satisfied are you with the Internet help screens
Not at all satisfied Satisfied Very satisfied 1 2 3
2 From which location did you primarily use the Census 2000 Internet help screens
Home Work School Library Some other place please specify_______________
24
Appendix A-1 IQA Survey
3 How did you hear about the Census 2000 Internet help screens Please mark all that apply
G From the Main US Census Bureau web site (wwwcensusgov)G From an Internet Service Provider (AOL MSN Mindspring etc)
G From a major web site (Yahoo Netcenter AltaVista etc)G From an Internet news web site (ABC MSNBC CBS etc)G From some other Internet site (not covered above)
G Through televisionradionewspaperG Through the toll free Census telephone help lineG Through the Census In Schools Program
G Through the letter attached to the census form you received in the mailG Other please specify______________________
4 Did you know that some census forms are available for you to complete through the Census 2000 web site
__Yes __No
5 Do you intend to submit your census form through the Census 2000 web site
__Yes__No my type of form was not available through the Census 2000 web site__No I tried to submit the Internet form and was unsuccessful__No I have security concerns__No I prefer to use the paper form__No I have already completed the paper form__No some other reason please specify________________________________Not sure
Submit this survey
25
Appendix A-2 IDC Survey
OMB No 0607-0760
The Census Bureau would like to know how well the Census Internet Form worked for you Please take a few moments to answer our questions and give us your opinions on the Census Internet Form Your answers are voluntary and confidential and will help us learn where improvements are needed in
future Internet products Thank you in advance for your participation
IV How satisfied are you with the following aspects of the Census 2000 Internet Form
Very Dissatisfied
1
Dissatisfied
2
Neither Satisfied nor Dissatisfied
3
Satisfied
4
Very Satisfied
5
Time required to load the form
Moving through the form
Availability of help screens
Understanding the help information
Ease of sending the form
Security and confidentiality procedures
2 Overall how satisfied are you with the Census 2000 Internet Form
Very Dissatisfied Dissatisfied Neither Satisfied Satisfied Very Satisfied nor Dissatisfied
1 2 3 4 5
26
Appendix A-2 IDC Survey
3 While you were completing the Census 2000 Internet Form help was available for a variety of topics (if you clicked on the linked text) In the following chart please mark how useful the help information was to you For topics on which you did not use help please mark lsquoNArsquo
Help Topics How useful was the information
Not at all Useful
1
Useful
2
Very Useful
3
Did not use this topic
NA
Verify form authenticity
Number of people in household
Home ownershiprent
Name
Relationship
AgeDate of birth
Hispanic origin
Race
Telephone number
Submitting the form
SecurityConfidentiality
OMB approval number
4 From which location did you submit your Census 2000 Internet Form
Home Work School Library Some other place please specify_______________
27
Appendix A-2 IDC Survey
5 How did you hear about the Census 2000 Internet Form Please mark all that apply
G From the Census 2000 Home page (www2000censusgov)G From the Main US Census Bureau web site (wwwcensusgov)G From an Internet Service Provider (AOL MSN Mindspring etc)
G From a major web site (Yahoo Netcenter AltaVista etc)G From an Internet News web site (ABC MSNBC CBS etc)G From some other Internet site (not covered above)
G Through televisionradionewspaperG Through the toll free Census telephone help lineG Through the Census In Schools Program
G Through the letter attached to the census form you received in the mailG Other please specify______________________
Submit this survey
28
Appendix B Log-linear models
Screening and building a log-linear model
First we analyzed a model with seven variables (1) time required to load the form (2) moving through the form (3) availability of help screens (4) understanding the help screen information (5) ease of sending the form (6) security and confidentiality procedures and (7) overall satisfaction including all 2-way interactions
Next we will delete an arbitrary interaction from the model By comparing the G2 statistics and the p-value for the initial model vs the reduced model we will determine whether the interaction is significant If the G2 and the p-value are roughly the same for the two models we can
conclude that is not significant and we can drop the interaction from the model
Consequently we can exclude any three-way interactions that include such as If
is significant we cannot drop any three-way interactions that include We will perform this procedure for each two-way interaction hoping to eliminate as many terms as possible to achieve the simplest model Any higher-level interactions greater than three are extremely difficult to interpret consequently we will ignore them in our analysis
however
Interpreting the results
The G2 statistic its p-value and the degrees of freedom of the model are the criteria of a good fit Specifically we are looking for a simple model with a small G2 a large p-value and a large number of degrees of freedom Adding additional model terms will always decrease the value of the G2 statistic If the additional terms donrsquot make an important contribution to the model then the G2 statistic will decrease by only a small amount and the significance level may actually decrease indicating a poorer fit to the data This is analogous to linear regression in which the mean squared error may increase when forcing non-significant independent variables into the model
29
Example of the results
Suppose we have the summary statistics for several log-linear models
Model df p-value
Model 1 (ACBCABC) 2068 34 03624
Model 2 (ABCD) 2101 35 04551
Model 3 (AB) 3498 36 00558
Model 4 (BC) 3622 36 00126
Which model should we choose Recall we want a simple model with a small G2 a large p-value and large number of degrees of freedom By these criteria we will go with Model 2 The G2 for Model 1 is smaller but just barely Notice however that the p-value for Model 1 actually decreases We identify Model 2 as the best fit
30
Appendix C
Table 13 IDC satisfaction ratings for the Census 2000 Internet Form
Variable
Time required to load
the form
Moving through the
form
Availability of help
screens
Help Users Only
Understanding help
info
Help Users Only
Ease of sending form
Security and
Confidentiality
procedures
Overall Satisfaction
Percent Percent Percent Percent Percent
N VD D Neither S VS
(1) (2) (3) (4) (5)
3216 41 09 28 281 642
(035) (017) (029) (079) (085)
3210 42 18 35 276 629
(036) 024) (032) (079) (085)
3118 37 08 218 243 494
(034) (016) (074) (077) (090)
1593 383 119 1186 2762 5549
(048) (027) (081) (112) (125)
3096 38 08 230 240 484
(034) (016) (076) (077) (089)
1587 391 139 1311 2710 5451
(049) (029) (085) (112) (125)
3199 42 07 10 175 767
(035) (014) (018) (067) (037)
3192 45 06 70 272 607
(013) (045) (079) (086) (036)
3198 44 14 32 259 651
(036) (021) (031) (077) (084)
31
Appendix D
Log Linear Model Comparison4
Model
Model 1--A ll two-w ay interactions
Model 1a
(ACADAEAFAGBCBDBE
BFBGCDCECFCGDEDFDG
EFEGFG)
Model 1b
(ACADAEAFAGBCBDBF
CDCECFCGDEDFDGEFEGFG)
Model 1c
(ACADAEAFAGBCBDBF
CECFDEDFDGEFEGFG)
Model 1d
(ACADAEAFAGBCBDBF
CECFDEDFDGEFFG)
Model 2
(ADEADFAEFADGAEG
DEGEFG)
G-squared df p-value
10516 99 3170
10517 100 3422
10627 102 3664
11068 104 3087
12330 105 1072
425522 105 0000
Which model should we choose Recall from Appendix B we want a simple model with a small G2 a large p-value and a large number of degrees of freedom By these criteria we will go with Model 1c The G2 for Model 1b is smaller but just barely and it includes two more interactions We identify Model 1c as the simplest and best fitting model
4A=Time required to load the form E=Ease of sending the formB=Availability of help screens F=Security and confidentiality concernsC=Understanding of help information G=Overall satisfactionD=M oving through the form
32
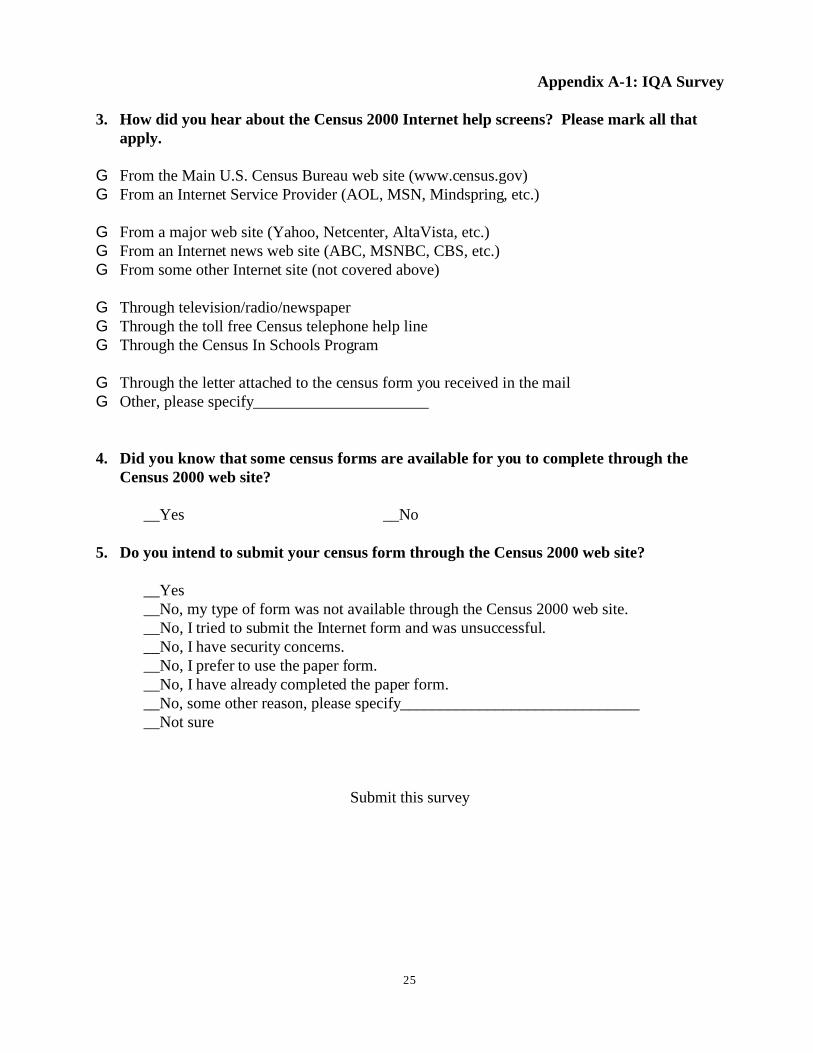
Appendix A-1 IQA Survey
3 How did you hear about the Census 2000 Internet help screens Please mark all that apply
G From the Main US Census Bureau web site (wwwcensusgov)G From an Internet Service Provider (AOL MSN Mindspring etc)
G From a major web site (Yahoo Netcenter AltaVista etc)G From an Internet news web site (ABC MSNBC CBS etc)G From some other Internet site (not covered above)
G Through televisionradionewspaperG Through the toll free Census telephone help lineG Through the Census In Schools Program
G Through the letter attached to the census form you received in the mailG Other please specify______________________
4 Did you know that some census forms are available for you to complete through the Census 2000 web site
__Yes __No
5 Do you intend to submit your census form through the Census 2000 web site
__Yes__No my type of form was not available through the Census 2000 web site__No I tried to submit the Internet form and was unsuccessful__No I have security concerns__No I prefer to use the paper form__No I have already completed the paper form__No some other reason please specify________________________________Not sure
Submit this survey
25
Appendix A-2 IDC Survey
OMB No 0607-0760
The Census Bureau would like to know how well the Census Internet Form worked for you Please take a few moments to answer our questions and give us your opinions on the Census Internet Form Your answers are voluntary and confidential and will help us learn where improvements are needed in
future Internet products Thank you in advance for your participation
IV How satisfied are you with the following aspects of the Census 2000 Internet Form
Very Dissatisfied
1
Dissatisfied
2
Neither Satisfied nor Dissatisfied
3
Satisfied
4
Very Satisfied
5
Time required to load the form
Moving through the form
Availability of help screens
Understanding the help information
Ease of sending the form
Security and confidentiality procedures
2 Overall how satisfied are you with the Census 2000 Internet Form
Very Dissatisfied Dissatisfied Neither Satisfied Satisfied Very Satisfied nor Dissatisfied
1 2 3 4 5
26
Appendix A-2 IDC Survey
3 While you were completing the Census 2000 Internet Form help was available for a variety of topics (if you clicked on the linked text) In the following chart please mark how useful the help information was to you For topics on which you did not use help please mark lsquoNArsquo
Help Topics How useful was the information
Not at all Useful
1
Useful
2
Very Useful
3
Did not use this topic
NA
Verify form authenticity
Number of people in household
Home ownershiprent
Name
Relationship
AgeDate of birth
Hispanic origin
Race
Telephone number
Submitting the form
SecurityConfidentiality
OMB approval number
4 From which location did you submit your Census 2000 Internet Form
Home Work School Library Some other place please specify_______________
27
Appendix A-2 IDC Survey
5 How did you hear about the Census 2000 Internet Form Please mark all that apply
G From the Census 2000 Home page (www2000censusgov)G From the Main US Census Bureau web site (wwwcensusgov)G From an Internet Service Provider (AOL MSN Mindspring etc)
G From a major web site (Yahoo Netcenter AltaVista etc)G From an Internet News web site (ABC MSNBC CBS etc)G From some other Internet site (not covered above)
G Through televisionradionewspaperG Through the toll free Census telephone help lineG Through the Census In Schools Program
G Through the letter attached to the census form you received in the mailG Other please specify______________________
Submit this survey
28
Appendix B Log-linear models
Screening and building a log-linear model
First we analyzed a model with seven variables (1) time required to load the form (2) moving through the form (3) availability of help screens (4) understanding the help screen information (5) ease of sending the form (6) security and confidentiality procedures and (7) overall satisfaction including all 2-way interactions
Next we will delete an arbitrary interaction from the model By comparing the G2 statistics and the p-value for the initial model vs the reduced model we will determine whether the interaction is significant If the G2 and the p-value are roughly the same for the two models we can
conclude that is not significant and we can drop the interaction from the model
Consequently we can exclude any three-way interactions that include such as If
is significant we cannot drop any three-way interactions that include We will perform this procedure for each two-way interaction hoping to eliminate as many terms as possible to achieve the simplest model Any higher-level interactions greater than three are extremely difficult to interpret consequently we will ignore them in our analysis
however
Interpreting the results
The G2 statistic its p-value and the degrees of freedom of the model are the criteria of a good fit Specifically we are looking for a simple model with a small G2 a large p-value and a large number of degrees of freedom Adding additional model terms will always decrease the value of the G2 statistic If the additional terms donrsquot make an important contribution to the model then the G2 statistic will decrease by only a small amount and the significance level may actually decrease indicating a poorer fit to the data This is analogous to linear regression in which the mean squared error may increase when forcing non-significant independent variables into the model
29
Example of the results
Suppose we have the summary statistics for several log-linear models
Model df p-value
Model 1 (ACBCABC) 2068 34 03624
Model 2 (ABCD) 2101 35 04551
Model 3 (AB) 3498 36 00558
Model 4 (BC) 3622 36 00126
Which model should we choose Recall we want a simple model with a small G2 a large p-value and large number of degrees of freedom By these criteria we will go with Model 2 The G2 for Model 1 is smaller but just barely Notice however that the p-value for Model 1 actually decreases We identify Model 2 as the best fit
30
Appendix C
Table 13 IDC satisfaction ratings for the Census 2000 Internet Form
Variable
Time required to load
the form
Moving through the
form
Availability of help
screens
Help Users Only
Understanding help
info
Help Users Only
Ease of sending form
Security and
Confidentiality
procedures
Overall Satisfaction
Percent Percent Percent Percent Percent
N VD D Neither S VS
(1) (2) (3) (4) (5)
3216 41 09 28 281 642
(035) (017) (029) (079) (085)
3210 42 18 35 276 629
(036) 024) (032) (079) (085)
3118 37 08 218 243 494
(034) (016) (074) (077) (090)
1593 383 119 1186 2762 5549
(048) (027) (081) (112) (125)
3096 38 08 230 240 484
(034) (016) (076) (077) (089)
1587 391 139 1311 2710 5451
(049) (029) (085) (112) (125)
3199 42 07 10 175 767
(035) (014) (018) (067) (037)
3192 45 06 70 272 607
(013) (045) (079) (086) (036)
3198 44 14 32 259 651
(036) (021) (031) (077) (084)
31
Appendix D
Log Linear Model Comparison4
Model
Model 1--A ll two-w ay interactions
Model 1a
(ACADAEAFAGBCBDBE
BFBGCDCECFCGDEDFDG
EFEGFG)
Model 1b
(ACADAEAFAGBCBDBF
CDCECFCGDEDFDGEFEGFG)
Model 1c
(ACADAEAFAGBCBDBF
CECFDEDFDGEFEGFG)
Model 1d
(ACADAEAFAGBCBDBF
CECFDEDFDGEFFG)
Model 2
(ADEADFAEFADGAEG
DEGEFG)
G-squared df p-value
10516 99 3170
10517 100 3422
10627 102 3664
11068 104 3087
12330 105 1072
425522 105 0000
Which model should we choose Recall from Appendix B we want a simple model with a small G2 a large p-value and a large number of degrees of freedom By these criteria we will go with Model 1c The G2 for Model 1b is smaller but just barely and it includes two more interactions We identify Model 1c as the simplest and best fitting model
4A=Time required to load the form E=Ease of sending the formB=Availability of help screens F=Security and confidentiality concernsC=Understanding of help information G=Overall satisfactionD=M oving through the form
32
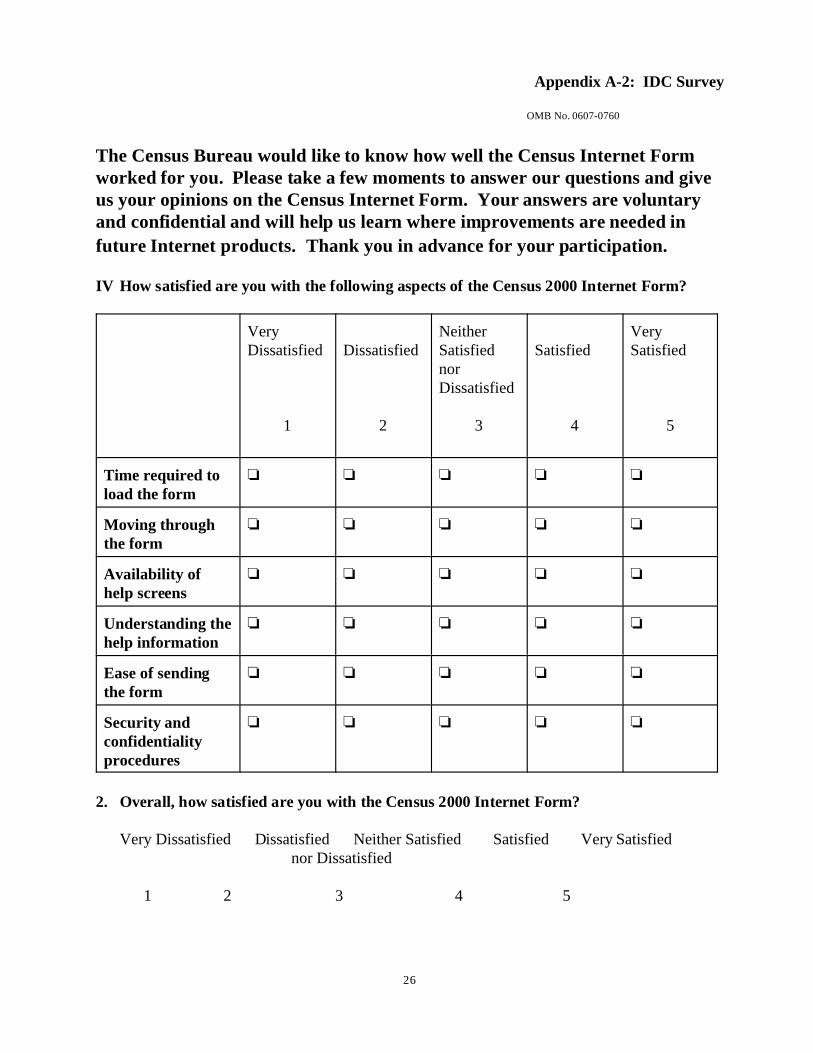
Appendix A-2 IDC Survey
OMB No 0607-0760
The Census Bureau would like to know how well the Census Internet Form worked for you Please take a few moments to answer our questions and give us your opinions on the Census Internet Form Your answers are voluntary and confidential and will help us learn where improvements are needed in
future Internet products Thank you in advance for your participation
IV How satisfied are you with the following aspects of the Census 2000 Internet Form
Very Dissatisfied
1
Dissatisfied
2
Neither Satisfied nor Dissatisfied
3
Satisfied
4
Very Satisfied
5
Time required to load the form
Moving through the form
Availability of help screens
Understanding the help information
Ease of sending the form
Security and confidentiality procedures
2 Overall how satisfied are you with the Census 2000 Internet Form
Very Dissatisfied Dissatisfied Neither Satisfied Satisfied Very Satisfied nor Dissatisfied
1 2 3 4 5
26
Appendix A-2 IDC Survey
3 While you were completing the Census 2000 Internet Form help was available for a variety of topics (if you clicked on the linked text) In the following chart please mark how useful the help information was to you For topics on which you did not use help please mark lsquoNArsquo
Help Topics How useful was the information
Not at all Useful
1
Useful
2
Very Useful
3
Did not use this topic
NA
Verify form authenticity
Number of people in household
Home ownershiprent
Name
Relationship
AgeDate of birth
Hispanic origin
Race
Telephone number
Submitting the form
SecurityConfidentiality
OMB approval number
4 From which location did you submit your Census 2000 Internet Form
Home Work School Library Some other place please specify_______________
27
Appendix A-2 IDC Survey
5 How did you hear about the Census 2000 Internet Form Please mark all that apply
G From the Census 2000 Home page (www2000censusgov)G From the Main US Census Bureau web site (wwwcensusgov)G From an Internet Service Provider (AOL MSN Mindspring etc)
G From a major web site (Yahoo Netcenter AltaVista etc)G From an Internet News web site (ABC MSNBC CBS etc)G From some other Internet site (not covered above)
G Through televisionradionewspaperG Through the toll free Census telephone help lineG Through the Census In Schools Program
G Through the letter attached to the census form you received in the mailG Other please specify______________________
Submit this survey
28
Appendix B Log-linear models
Screening and building a log-linear model
First we analyzed a model with seven variables (1) time required to load the form (2) moving through the form (3) availability of help screens (4) understanding the help screen information (5) ease of sending the form (6) security and confidentiality procedures and (7) overall satisfaction including all 2-way interactions
Next we will delete an arbitrary interaction from the model By comparing the G2 statistics and the p-value for the initial model vs the reduced model we will determine whether the interaction is significant If the G2 and the p-value are roughly the same for the two models we can
conclude that is not significant and we can drop the interaction from the model
Consequently we can exclude any three-way interactions that include such as If
is significant we cannot drop any three-way interactions that include We will perform this procedure for each two-way interaction hoping to eliminate as many terms as possible to achieve the simplest model Any higher-level interactions greater than three are extremely difficult to interpret consequently we will ignore them in our analysis
however
Interpreting the results
The G2 statistic its p-value and the degrees of freedom of the model are the criteria of a good fit Specifically we are looking for a simple model with a small G2 a large p-value and a large number of degrees of freedom Adding additional model terms will always decrease the value of the G2 statistic If the additional terms donrsquot make an important contribution to the model then the G2 statistic will decrease by only a small amount and the significance level may actually decrease indicating a poorer fit to the data This is analogous to linear regression in which the mean squared error may increase when forcing non-significant independent variables into the model
29
Example of the results
Suppose we have the summary statistics for several log-linear models
Model df p-value
Model 1 (ACBCABC) 2068 34 03624
Model 2 (ABCD) 2101 35 04551
Model 3 (AB) 3498 36 00558
Model 4 (BC) 3622 36 00126
Which model should we choose Recall we want a simple model with a small G2 a large p-value and large number of degrees of freedom By these criteria we will go with Model 2 The G2 for Model 1 is smaller but just barely Notice however that the p-value for Model 1 actually decreases We identify Model 2 as the best fit
30
Appendix C
Table 13 IDC satisfaction ratings for the Census 2000 Internet Form
Variable
Time required to load
the form
Moving through the
form
Availability of help
screens
Help Users Only
Understanding help
info
Help Users Only
Ease of sending form
Security and
Confidentiality
procedures
Overall Satisfaction
Percent Percent Percent Percent Percent
N VD D Neither S VS
(1) (2) (3) (4) (5)
3216 41 09 28 281 642
(035) (017) (029) (079) (085)
3210 42 18 35 276 629
(036) 024) (032) (079) (085)
3118 37 08 218 243 494
(034) (016) (074) (077) (090)
1593 383 119 1186 2762 5549
(048) (027) (081) (112) (125)
3096 38 08 230 240 484
(034) (016) (076) (077) (089)
1587 391 139 1311 2710 5451
(049) (029) (085) (112) (125)
3199 42 07 10 175 767
(035) (014) (018) (067) (037)
3192 45 06 70 272 607
(013) (045) (079) (086) (036)
3198 44 14 32 259 651
(036) (021) (031) (077) (084)
31
Appendix D
Log Linear Model Comparison4
Model
Model 1--A ll two-w ay interactions
Model 1a
(ACADAEAFAGBCBDBE
BFBGCDCECFCGDEDFDG
EFEGFG)
Model 1b
(ACADAEAFAGBCBDBF
CDCECFCGDEDFDGEFEGFG)
Model 1c
(ACADAEAFAGBCBDBF
CECFDEDFDGEFEGFG)
Model 1d
(ACADAEAFAGBCBDBF
CECFDEDFDGEFFG)
Model 2
(ADEADFAEFADGAEG
DEGEFG)
G-squared df p-value
10516 99 3170
10517 100 3422
10627 102 3664
11068 104 3087
12330 105 1072
425522 105 0000
Which model should we choose Recall from Appendix B we want a simple model with a small G2 a large p-value and a large number of degrees of freedom By these criteria we will go with Model 1c The G2 for Model 1b is smaller but just barely and it includes two more interactions We identify Model 1c as the simplest and best fitting model
4A=Time required to load the form E=Ease of sending the formB=Availability of help screens F=Security and confidentiality concernsC=Understanding of help information G=Overall satisfactionD=M oving through the form
32
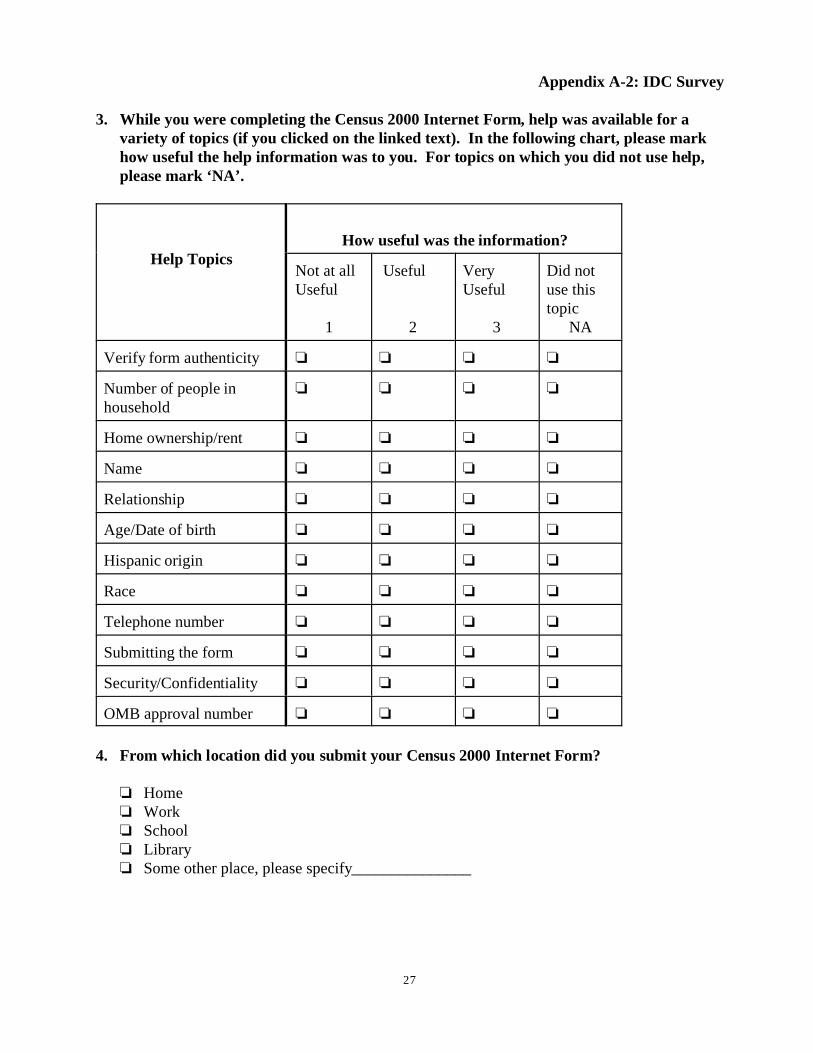
Appendix A-2 IDC Survey
3 While you were completing the Census 2000 Internet Form help was available for a variety of topics (if you clicked on the linked text) In the following chart please mark how useful the help information was to you For topics on which you did not use help please mark lsquoNArsquo
Help Topics How useful was the information
Not at all Useful
1
Useful
2
Very Useful
3
Did not use this topic
NA
Verify form authenticity
Number of people in household
Home ownershiprent
Name
Relationship
AgeDate of birth
Hispanic origin
Race
Telephone number
Submitting the form
SecurityConfidentiality
OMB approval number
4 From which location did you submit your Census 2000 Internet Form
Home Work School Library Some other place please specify_______________
27
Appendix A-2 IDC Survey
5 How did you hear about the Census 2000 Internet Form Please mark all that apply
G From the Census 2000 Home page (www2000censusgov)G From the Main US Census Bureau web site (wwwcensusgov)G From an Internet Service Provider (AOL MSN Mindspring etc)
G From a major web site (Yahoo Netcenter AltaVista etc)G From an Internet News web site (ABC MSNBC CBS etc)G From some other Internet site (not covered above)
G Through televisionradionewspaperG Through the toll free Census telephone help lineG Through the Census In Schools Program
G Through the letter attached to the census form you received in the mailG Other please specify______________________
Submit this survey
28
Appendix B Log-linear models
Screening and building a log-linear model
First we analyzed a model with seven variables (1) time required to load the form (2) moving through the form (3) availability of help screens (4) understanding the help screen information (5) ease of sending the form (6) security and confidentiality procedures and (7) overall satisfaction including all 2-way interactions
Next we will delete an arbitrary interaction from the model By comparing the G2 statistics and the p-value for the initial model vs the reduced model we will determine whether the interaction is significant If the G2 and the p-value are roughly the same for the two models we can
conclude that is not significant and we can drop the interaction from the model
Consequently we can exclude any three-way interactions that include such as If
is significant we cannot drop any three-way interactions that include We will perform this procedure for each two-way interaction hoping to eliminate as many terms as possible to achieve the simplest model Any higher-level interactions greater than three are extremely difficult to interpret consequently we will ignore them in our analysis
however
Interpreting the results
The G2 statistic its p-value and the degrees of freedom of the model are the criteria of a good fit Specifically we are looking for a simple model with a small G2 a large p-value and a large number of degrees of freedom Adding additional model terms will always decrease the value of the G2 statistic If the additional terms donrsquot make an important contribution to the model then the G2 statistic will decrease by only a small amount and the significance level may actually decrease indicating a poorer fit to the data This is analogous to linear regression in which the mean squared error may increase when forcing non-significant independent variables into the model
29
Example of the results
Suppose we have the summary statistics for several log-linear models
Model df p-value
Model 1 (ACBCABC) 2068 34 03624
Model 2 (ABCD) 2101 35 04551
Model 3 (AB) 3498 36 00558
Model 4 (BC) 3622 36 00126
Which model should we choose Recall we want a simple model with a small G2 a large p-value and large number of degrees of freedom By these criteria we will go with Model 2 The G2 for Model 1 is smaller but just barely Notice however that the p-value for Model 1 actually decreases We identify Model 2 as the best fit
30
Appendix C
Table 13 IDC satisfaction ratings for the Census 2000 Internet Form
Variable
Time required to load
the form
Moving through the
form
Availability of help
screens
Help Users Only
Understanding help
info
Help Users Only
Ease of sending form
Security and
Confidentiality
procedures
Overall Satisfaction
Percent Percent Percent Percent Percent
N VD D Neither S VS
(1) (2) (3) (4) (5)
3216 41 09 28 281 642
(035) (017) (029) (079) (085)
3210 42 18 35 276 629
(036) 024) (032) (079) (085)
3118 37 08 218 243 494
(034) (016) (074) (077) (090)
1593 383 119 1186 2762 5549
(048) (027) (081) (112) (125)
3096 38 08 230 240 484
(034) (016) (076) (077) (089)
1587 391 139 1311 2710 5451
(049) (029) (085) (112) (125)
3199 42 07 10 175 767
(035) (014) (018) (067) (037)
3192 45 06 70 272 607
(013) (045) (079) (086) (036)
3198 44 14 32 259 651
(036) (021) (031) (077) (084)
31
Appendix D
Log Linear Model Comparison4
Model
Model 1--A ll two-w ay interactions
Model 1a
(ACADAEAFAGBCBDBE
BFBGCDCECFCGDEDFDG
EFEGFG)
Model 1b
(ACADAEAFAGBCBDBF
CDCECFCGDEDFDGEFEGFG)
Model 1c
(ACADAEAFAGBCBDBF
CECFDEDFDGEFEGFG)
Model 1d
(ACADAEAFAGBCBDBF
CECFDEDFDGEFFG)
Model 2
(ADEADFAEFADGAEG
DEGEFG)
G-squared df p-value
10516 99 3170
10517 100 3422
10627 102 3664
11068 104 3087
12330 105 1072
425522 105 0000
Which model should we choose Recall from Appendix B we want a simple model with a small G2 a large p-value and a large number of degrees of freedom By these criteria we will go with Model 1c The G2 for Model 1b is smaller but just barely and it includes two more interactions We identify Model 1c as the simplest and best fitting model
4A=Time required to load the form E=Ease of sending the formB=Availability of help screens F=Security and confidentiality concernsC=Understanding of help information G=Overall satisfactionD=M oving through the form
32
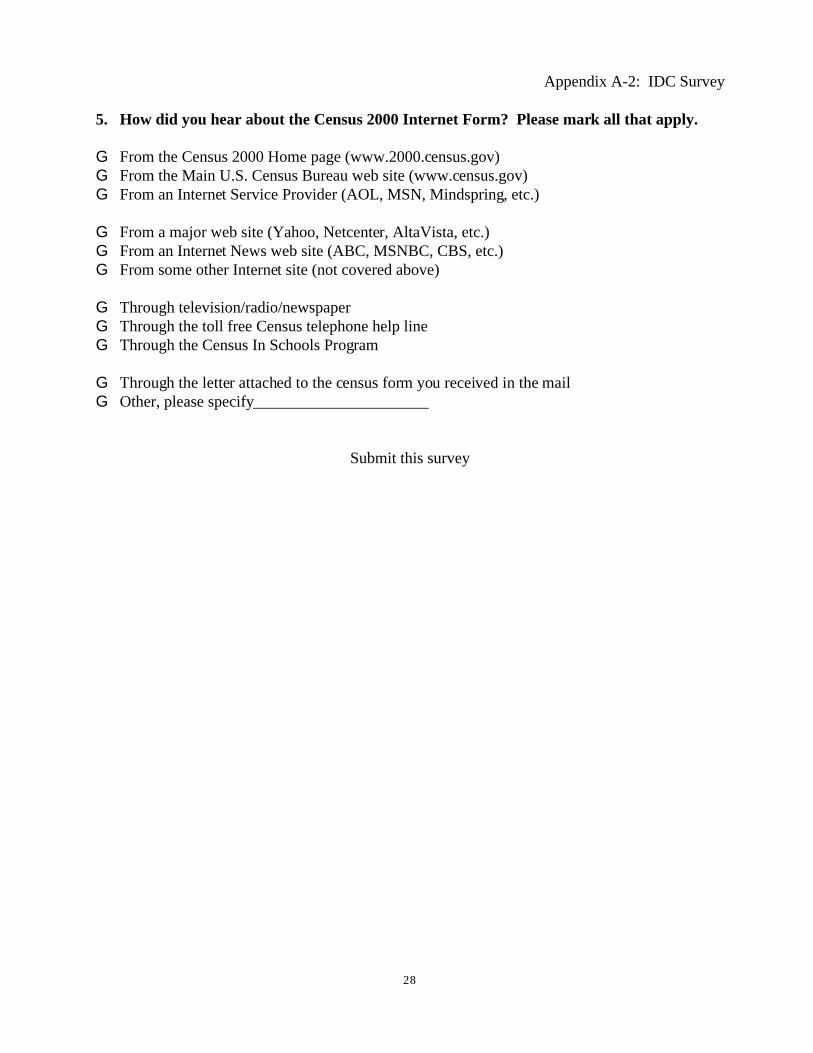
Appendix A-2 IDC Survey
5 How did you hear about the Census 2000 Internet Form Please mark all that apply
G From the Census 2000 Home page (www2000censusgov)G From the Main US Census Bureau web site (wwwcensusgov)G From an Internet Service Provider (AOL MSN Mindspring etc)
G From a major web site (Yahoo Netcenter AltaVista etc)G From an Internet News web site (ABC MSNBC CBS etc)G From some other Internet site (not covered above)
G Through televisionradionewspaperG Through the toll free Census telephone help lineG Through the Census In Schools Program
G Through the letter attached to the census form you received in the mailG Other please specify______________________
Submit this survey
28
Appendix B Log-linear models
Screening and building a log-linear model
First we analyzed a model with seven variables (1) time required to load the form (2) moving through the form (3) availability of help screens (4) understanding the help screen information (5) ease of sending the form (6) security and confidentiality procedures and (7) overall satisfaction including all 2-way interactions
Next we will delete an arbitrary interaction from the model By comparing the G2 statistics and the p-value for the initial model vs the reduced model we will determine whether the interaction is significant If the G2 and the p-value are roughly the same for the two models we can
conclude that is not significant and we can drop the interaction from the model
Consequently we can exclude any three-way interactions that include such as If
is significant we cannot drop any three-way interactions that include We will perform this procedure for each two-way interaction hoping to eliminate as many terms as possible to achieve the simplest model Any higher-level interactions greater than three are extremely difficult to interpret consequently we will ignore them in our analysis
however
Interpreting the results
The G2 statistic its p-value and the degrees of freedom of the model are the criteria of a good fit Specifically we are looking for a simple model with a small G2 a large p-value and a large number of degrees of freedom Adding additional model terms will always decrease the value of the G2 statistic If the additional terms donrsquot make an important contribution to the model then the G2 statistic will decrease by only a small amount and the significance level may actually decrease indicating a poorer fit to the data This is analogous to linear regression in which the mean squared error may increase when forcing non-significant independent variables into the model
29
Example of the results
Suppose we have the summary statistics for several log-linear models
Model df p-value
Model 1 (ACBCABC) 2068 34 03624
Model 2 (ABCD) 2101 35 04551
Model 3 (AB) 3498 36 00558
Model 4 (BC) 3622 36 00126
Which model should we choose Recall we want a simple model with a small G2 a large p-value and large number of degrees of freedom By these criteria we will go with Model 2 The G2 for Model 1 is smaller but just barely Notice however that the p-value for Model 1 actually decreases We identify Model 2 as the best fit
30
Appendix C
Table 13 IDC satisfaction ratings for the Census 2000 Internet Form
Variable
Time required to load
the form
Moving through the
form
Availability of help
screens
Help Users Only
Understanding help
info
Help Users Only
Ease of sending form
Security and
Confidentiality
procedures
Overall Satisfaction
Percent Percent Percent Percent Percent
N VD D Neither S VS
(1) (2) (3) (4) (5)
3216 41 09 28 281 642
(035) (017) (029) (079) (085)
3210 42 18 35 276 629
(036) 024) (032) (079) (085)
3118 37 08 218 243 494
(034) (016) (074) (077) (090)
1593 383 119 1186 2762 5549
(048) (027) (081) (112) (125)
3096 38 08 230 240 484
(034) (016) (076) (077) (089)
1587 391 139 1311 2710 5451
(049) (029) (085) (112) (125)
3199 42 07 10 175 767
(035) (014) (018) (067) (037)
3192 45 06 70 272 607
(013) (045) (079) (086) (036)
3198 44 14 32 259 651
(036) (021) (031) (077) (084)
31
Appendix D
Log Linear Model Comparison4
Model
Model 1--A ll two-w ay interactions
Model 1a
(ACADAEAFAGBCBDBE
BFBGCDCECFCGDEDFDG
EFEGFG)
Model 1b
(ACADAEAFAGBCBDBF
CDCECFCGDEDFDGEFEGFG)
Model 1c
(ACADAEAFAGBCBDBF
CECFDEDFDGEFEGFG)
Model 1d
(ACADAEAFAGBCBDBF
CECFDEDFDGEFFG)
Model 2
(ADEADFAEFADGAEG
DEGEFG)
G-squared df p-value
10516 99 3170
10517 100 3422
10627 102 3664
11068 104 3087
12330 105 1072
425522 105 0000
Which model should we choose Recall from Appendix B we want a simple model with a small G2 a large p-value and a large number of degrees of freedom By these criteria we will go with Model 1c The G2 for Model 1b is smaller but just barely and it includes two more interactions We identify Model 1c as the simplest and best fitting model
4A=Time required to load the form E=Ease of sending the formB=Availability of help screens F=Security and confidentiality concernsC=Understanding of help information G=Overall satisfactionD=M oving through the form
32
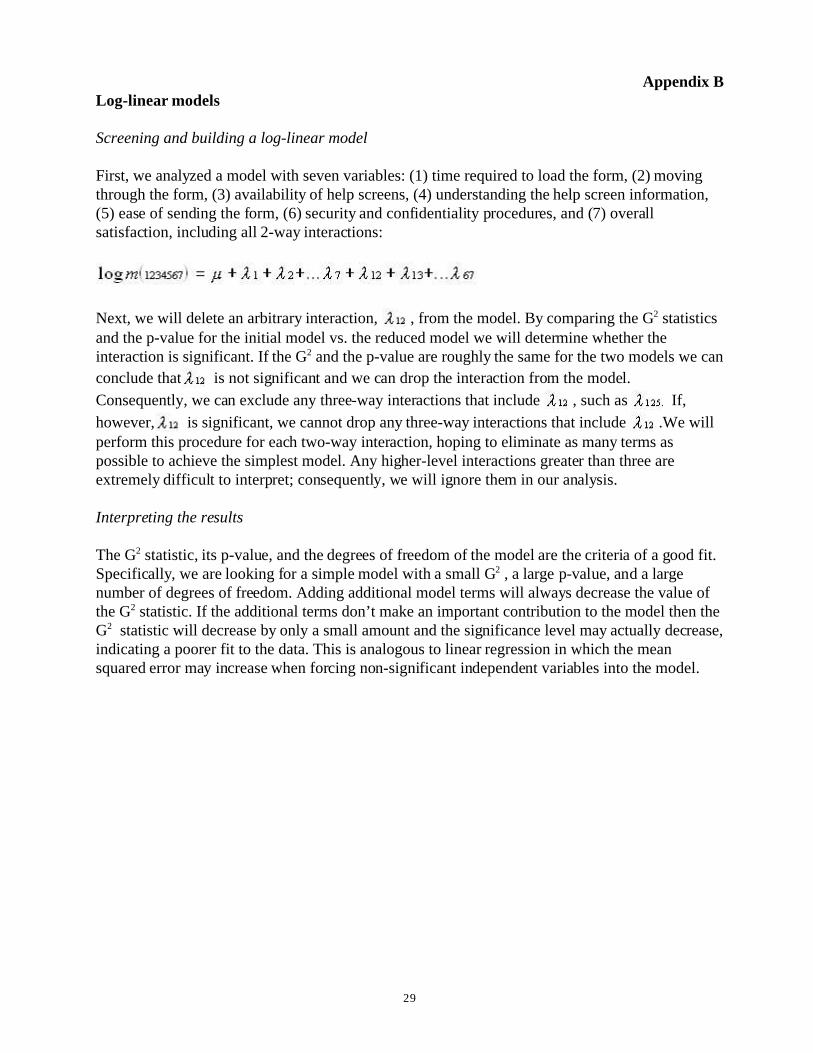
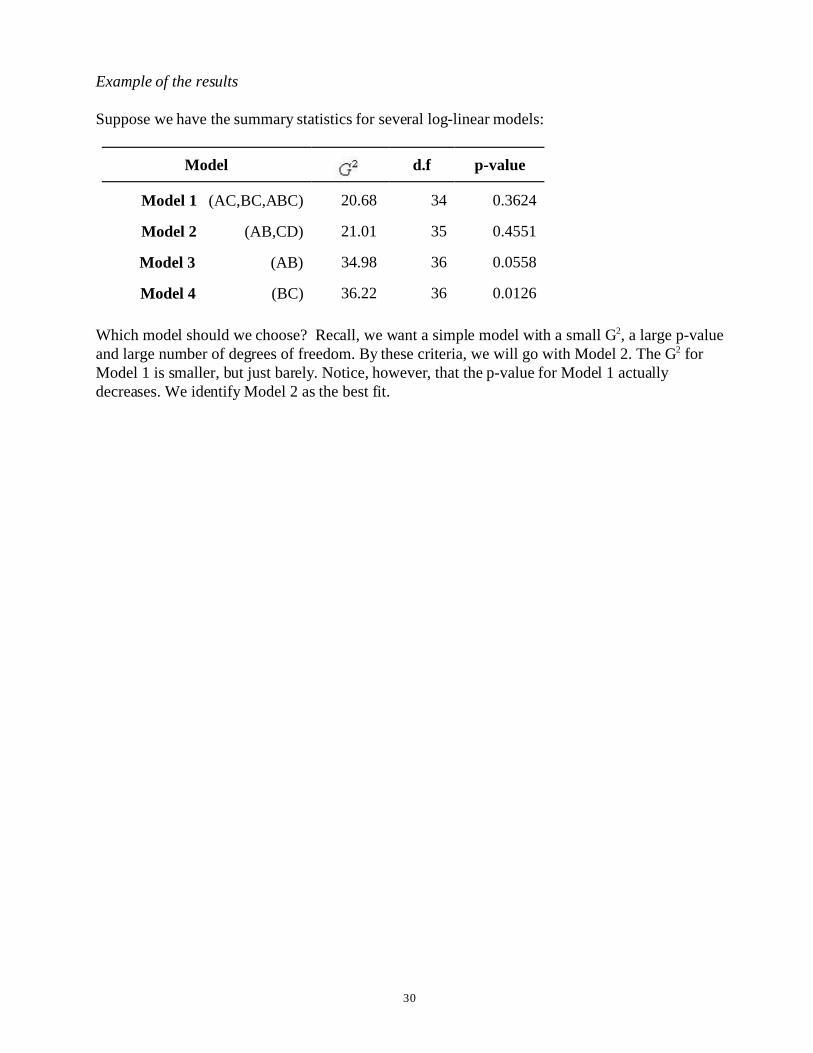
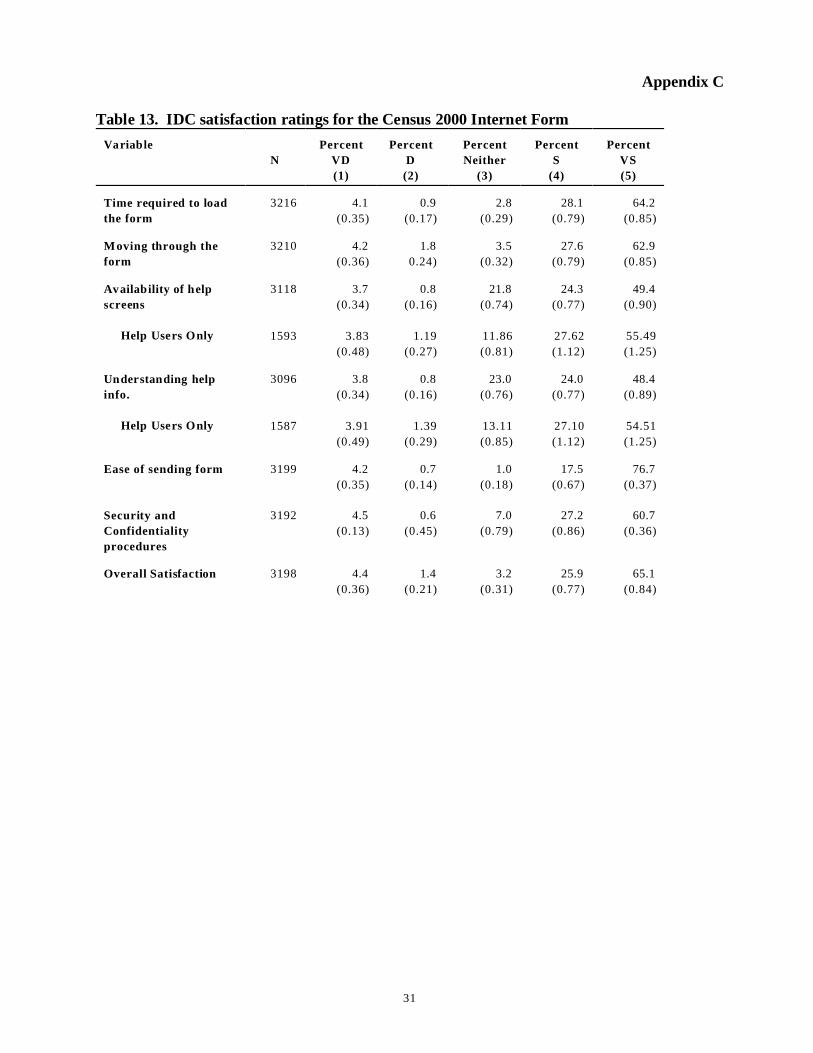
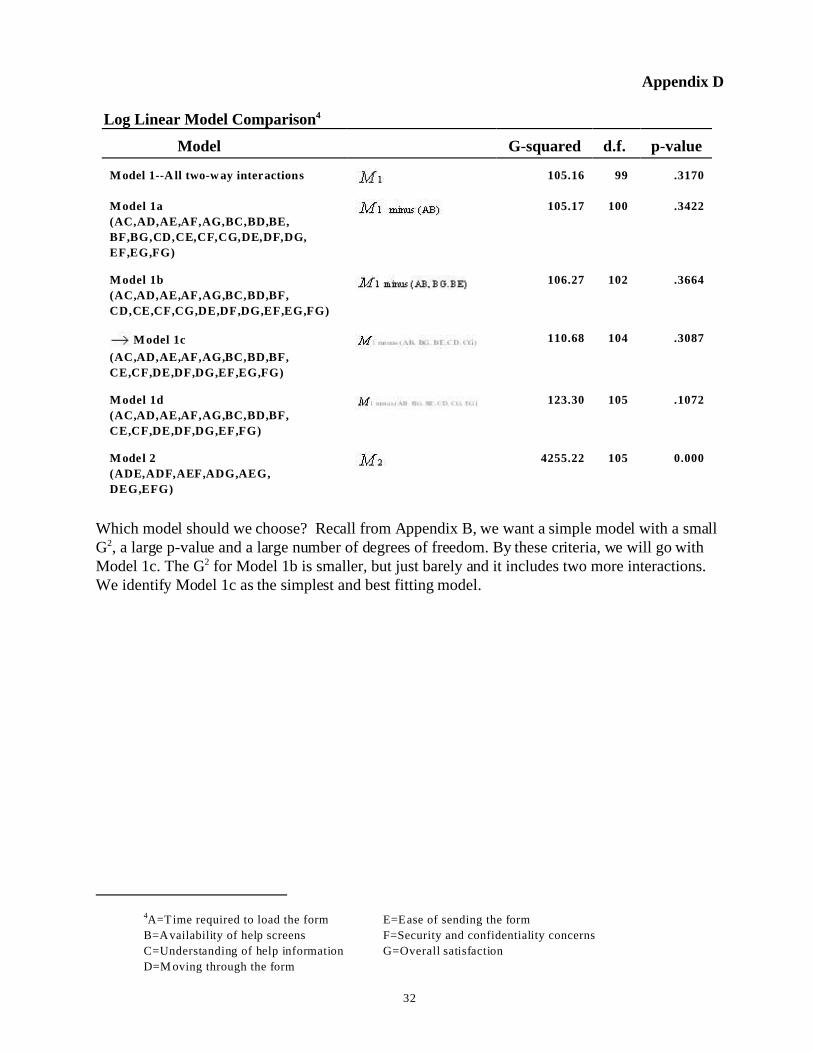