Embed Size (px)
Citation preview

Census Overview:Basics, Decennial,
ACS, and Estimates2016 NLA/NSLA Joint Conference
8:00 to 9:00 a.m., October 21, 2016
David DrozdUNO Center for Public Affairs [email protected]/cpar www.facebook.com/unocpar
Please Like

Terminology and Definitions• Decennial Census: “the Census”; headcount taken once every 10 years;
mandated by Constitution for equal representation in Congress• Short form: basic decennial Census questionnaire sent to most
households in 2000 and all households in 2010; records simple demographics like age, gender, race, housing tenure (own or rent)
• Long form: detailed decennial Census questionnaire sent to a sample of about 1 in 6 households in the 2000 Census but not used in the 2010 Census (replaced by ACS); recorded socio‐economic and detailed housing information
• American Community Survey (ACS): continuous sample survey (forms sent every month) compiled to provide current annual data; nearly identical to long form – allowed 2010 Census to be short form only (simply a headcount)– 2016 ACS (and in future years) continues monthly surveying even though
decennial census is not currently being conducted• The ACS is subject to the federal budget so it will only continue if funded into the future
Census Datafiles• Summary File 1 (SF 1): Used for both 2000 and 2010 basic demographic
data from the short form: age, gender, race/ethnicity, housing tenure (own vs. rent), etc.
– SF 2 has the SF 1 tables available by race, for detailed racial combinations, tribes, etc.
• Summary File 3 (SF 3): Not part of 2010 Census, replaced by ACS datasets; has detailed socio‐economic and housing data from the 2000 long form; also has figures for SF 1 items (age) but they are based on a “weighted” sample, not the official counts
BE CAREFUL – You must go to the right source to get correct data!• ACS Datasets: contain data for ACS variables; are based upon the
timeframe over which the data was collected– 1‐year: 2013 3‐year: 2011‐2013 5‐year: 2009‐2013– Do NOT Compare ACS datasets to SF 1 from the decennial census
• Compare SF 1 from 2000 to: SF 1 from 2010• Compare SF 3 from 2000 to: ACS datasets

ACS Data are Released Based Upon the Population of the Geographic Unit
Note that even the multi-year aggregates get an annual data update (rolling timeframe as new data is released: 2009-2013 then 2010-2014, with 2011-2015 coming this fall). More data = be more careful! Cite sources accurately and with detail (use table #s): 2014 ACS (S1701), U.S. Census Bureau
Annual Estimates (2005, 2006, 2007, etc.) 65,000+ Only Omaha and Lincoln
3-year aggregates (2005-07, 2006-08, etc.) 20,000+ Omaha, Lincoln, and regional
centers like Kearney, Norfolk, etc.
5-year aggregates (2005-09; 2006-10, etc.)
No threshold (data for all areas, even census tracts, zip codes, small towns & low population counties)
All cities/towns, little suppression (Gross, NE: population 4 had 2008-12 ACS data); realize fewer people = more accuracy concerns
Timeframe of DataPopulation Threshold to have Data Released Nebraska Cities with Data
No longer made

Questionnaire and Concepts• Residence: For the Census, it is based on usual residence – where people
are most of the year (their permanent residence). It is also based upon an April 1 reference date.– Snowbirds spending 3 months in Texas and 9 months in Nebraska should be a
resident of NE– College students are almost always counted in their college city (that’s where
they are on April 1)– Since the ACS forms are sent out and mailed back monthly, residence for the
ACS is based upon who is living in the household for “the next 2 months” • Provides a more accurate picture of the population: e.g. some snowbirds are
counted in the South & college students in parent’s house if home for summer
• Race/Ethnicity: In the census world, each person is either Hispanic/Latino or they are not, AND then they also have one or more races (option for 2+ races first utilized in 2000)– Hispanic/Latino question is asked first; then comes the race question
• White non‐Hispanic (WnH) is the “majority population”• Total population – WnH = minority population

How does CPAR typically analyze race/ethnicity?
• We usually list totals for Hispanic/Latino, and then all races ALONE as being non‐Hispanic (nH): White nH; Black nH; etc.– This avoids double counting and the sum of all groups when combined with
2+ races nH will equal the total population (percents sum to 100%)– Race ALONE means that only one race was stated on the form– Many groups/agencies and grants ask for simply White, Black, etc. and
Hispanic – by definition many Hispanics in this case would be represented twice (their race is often listed as White or Other)
• The 2020 census will likely use a combined race/ethnicity question! It will get similar results, “other” race category will be selected less frequently, and will have areas to write in ancestry/origin (so we’d get data on African and European countries/origins in addition to Asians, Native Amer., & Hispanic); census is testing whether to use a Middle Eastern or North African (MENA) category in 2020
• Also can evaluate race for those ALONE or IN COMBINATION– This includes those who selected that race specifically (alone) as well as those
who selected that race and another one (2 or more races)• Double counts the people selecting 2+ races (doesn’t sum to total pop. or 100%)• Might use more often as lessens effect of multi‐race births “always” being minority

Questionnaire and Concepts continued• Householder: simply the first person on the census form
– Is NOT necessarily the “head of the household” (that’s old terminology)– Supposed to be the person “in whose name the residence is owned or
rented”; that’s usually but not always the person who fills out the form• Can be male or female; householder is somewhat arbitrary but makes a big
difference for how families and by extension items like poverty are defined
• Relationship: how other persons living in the household are related or connected to the householder– Spouse, biological/adopted/step child, parent‐in‐law, roommate, unmarried
partner, foster child, etc.– A household with 2 or more related individuals is a “family” household
• One person households are not a family by definition, and thus are excluded from variables like median family income (but are included in median household income)
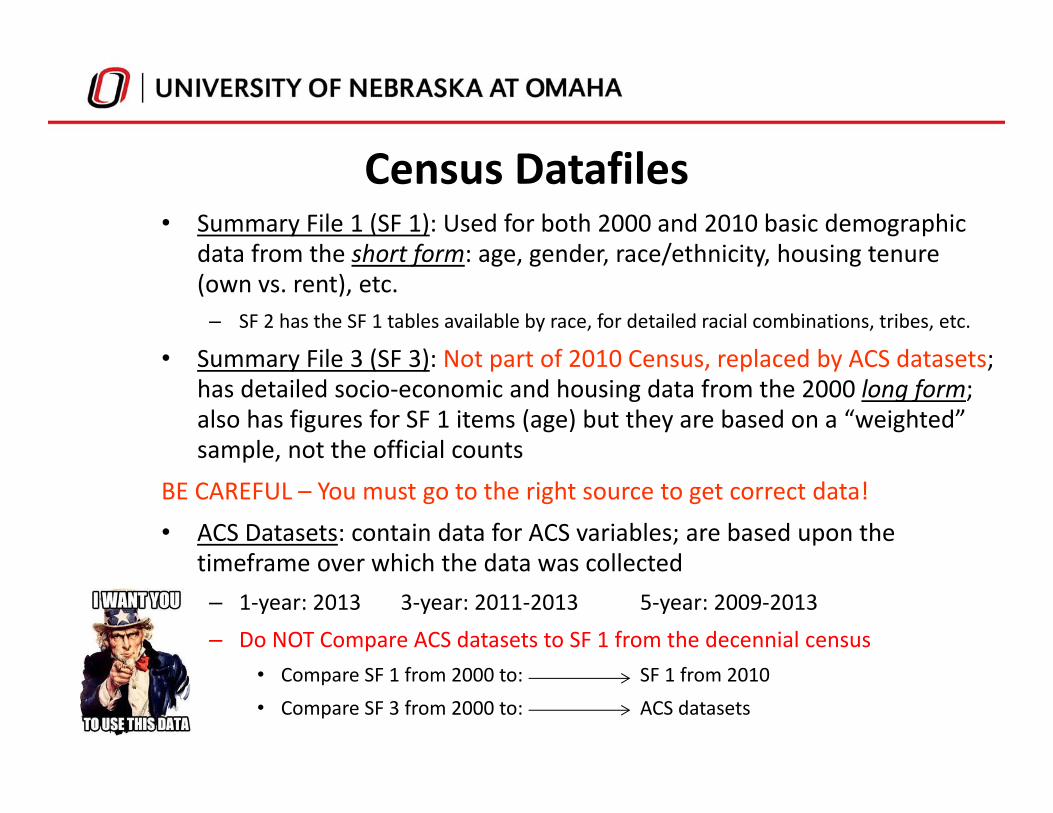
• Unmarried partners are not a family by definition– If a child lives in the household of unmarried partners but is from a prior relationship, it
is a function of who fills out the form (who is the householder) for whether that is a “family” or not – RELATIONSHIPS CAN BE COMPLEX – impacts items like poverty
If Susan
and her child Emily
Live with Paul
Notes: Susan and Paul are dating but not married; Paul is not the father of Emily
Susan
Emily is related to Susan as biological child and this is a family household; Paul is unmarried partner & not part of the ‘family’
is the householder…
If Paul
is the householder…
Emily is an “other nonrelative” and Susan is unmarried partner; this is NOT a family householdIn both cases Paul’s income is NOT included in Susan and Emily’s poverty calculation; if they were married it would be.
Householder Example:

What’s my universe?• Data can be for individuals, households, families, householders, or
any number of age/race/gender categories– Often need to choose – some have advantages/disadvantages
• Poverty can be for individuals, households or families – since there are more individuals, we usually rely on that data as it is more accurate
• Do you want population only in households, in group quarters (dorms, prisons, nursing homes, military barracks, etc.) or both (the total population)
– Other data is compiled specifically for certain groups• Health insurance data is for the “civilian noninstitutionalized population”
– Watch the table description or the categories in the tables:
Choosing who you want the data for is a key step in any analysis
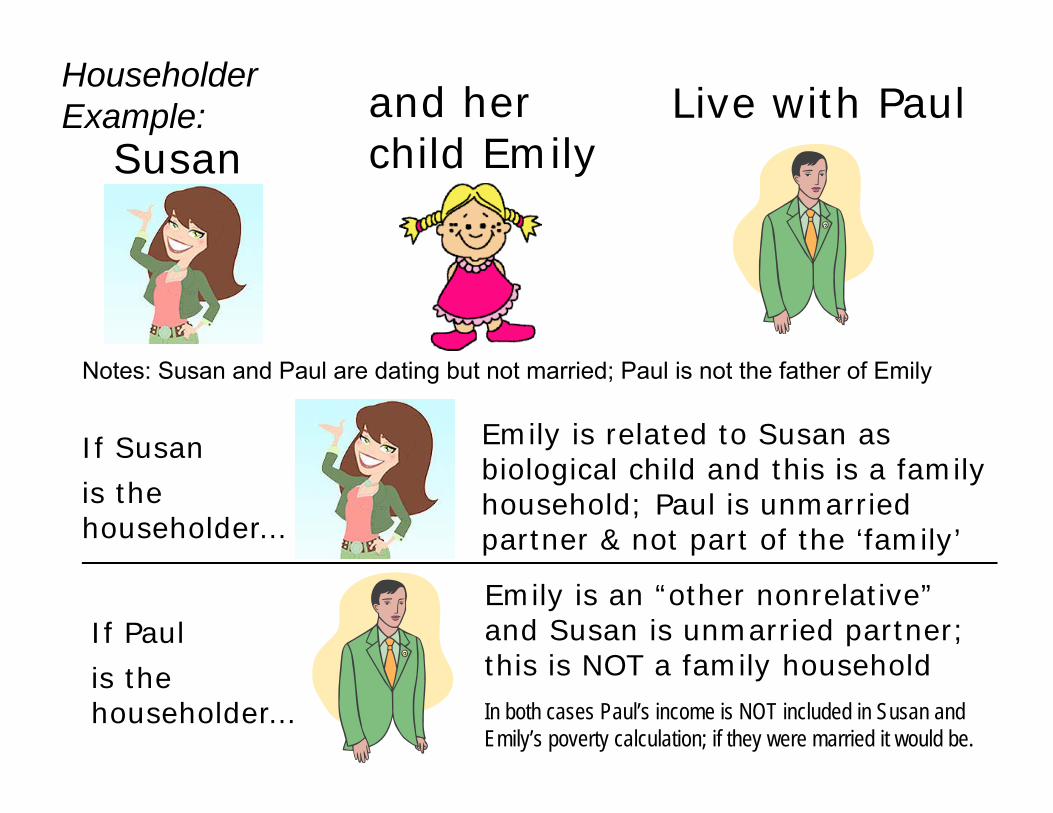
Geography• Size continuum: large to small, or small to large• Legal/Administrative vs. Census/Statistical
– Nation—State—County—City—Township
– Block—Block Group—Census Tract—Zip Code—PUMA—Metro Area (MSA)—Division—Region
The West North Central Division of the United States

FactFinder Address Search Page & Results
11

12
Block 2022 in Block Group 2, Census Tract 47 Douglas County, NE
This is a single block – they are “building blocks” for larger geographies.
Blocks are bounded by physical features like roads, streams, or railroads.

13
Block 2022 in Block Group 2, Census Tract 47 Douglas County, NE
A group of usually about 15-30 blocks comprise a “block group”.
14
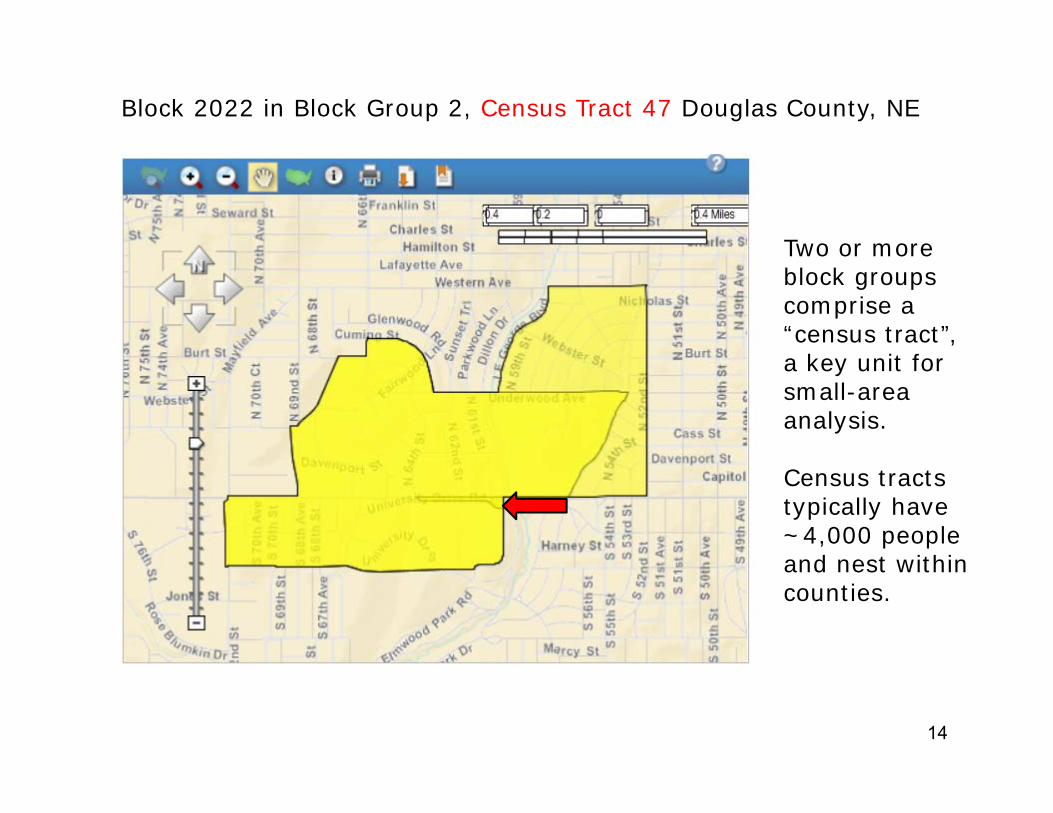
Block 2022 in Block Group 2, Census Tract 47 Douglas County, NE
Two or more block groups comprise a “census tract”, a key unit for small-area analysis.
Census tracts typically have ~4,000 people and nest within counties.
• There is usually a tradeoff between available information and the geography for which it is available– Can be due to confidentiality restraints– More specific information may require expanding to a larger
geography (or a longer timeframe)• Even if the data is provided, you must ask whether the data is “reliable” for that geography?
• Are the figures based on a small number of cases where sampling error is highly likely and could be quite large?
– Sampling error occurs if the figures would be different if different households/people were included in the sample. ACS data always lists the “margin of error”, which is a gauge of data accuracy (we want low MOE).
Are you ready to rumble???
Geography VS. Data (A Duel)
Relationship between Data/Datafiles and Geography• For blocks, you can only get Redistricting or SF 1 data
– Confidentiality reasons: you’d know certain incomes on your block (also sampling/error issues)
• Block groups have most SF 3 data; only meant as building blocks for larger custom geographies in the ACS– No ancestry or unmarried partner data
• Census Tracts are a key geography as they are one of the smallest geographies to have most all data compiled– PCT (population items) and HCT (housing) tables in decennial files– Now have 5‐yr ACS zip code data; like tracts they are a good unit of analysis
for “neighborhoods” but typically larger than tracts so more accurate/less variability
• Public Use Microdata Areas (PUMAs) are combined census tracts that contain at least 100,000 people and are the smallest geography for the PUMS files; important geography in the ACS/for ACS data!
Not all data is released for every geography!

PUMA geography• Nebraska has 14 PUMA areas (4 in Douglas County, 2 in Lancaster)• ACS data used 2000 based PUMAs from 2005‐2011; 2012 and future
years use updated 2010 based PUMA boundaries– The 2010 PUMAs are nearly identical to the ones from 2000: a couple tracts
changed in Douglas and Lancaster counties; Sarpy Co. is now its own PUMA
• PUMA geography has more importance in the ACS– Data are released annually since PUMAs with 100,000 population exceed the
annual ACS population threshold of 65,000• Not many Nebraska geographies get annual data; PUMAs are the smallest annual
geography for getting statewide coverage and making statewide comparisons!
– Breaks core metro counties into smaller areas and gives proxies for smaller geographies that are similar to the larger PUMA area
• Southeast Douglas County PUMA a proxy for “South Omaha”• Northeast Nebraska PUMA a proxy for Pierce County
• State Maps for PUMA boundaries can be viewed on the web– http://www.census.gov/geo/maps‐data/maps/reference.html

18

The American Community Survey: What is it?• Nationwide written/mail survey conducted by the U.S.
Census Bureau – Sent to a sample of households, not all households– Online completion option began January 2013
• Similar to the sample portion of the decennial (10 year) census but it is completed every year– Gives us more current information: annual data rather than 10 year
intervals between releases– Provides data on the same Census topic areas, plus a few others– Replaced “long form” of decennial census; 2010 Census primarily a
population head count– The “future” of socio‐economic Census data, IF funded into the future
• Subject to Congressional review and oversight, budget, gov’t shutdowns, etc.
ACS Methodology in Brief• Surveys mailed out & received back each month
– 3.5 million surveys sent annually nationwide• Sample about 1 in 40 housing units (1 in 8 over five years of survey collection – Census 2000 long form was 1 in 6)
– Census assigns both household and person weights. Summing these weights produces the estimates. Base weight for households is about 40 given 1 in 40 sample.
– Monthly surveys are combined to estimate figures for the calendar year as a whole.
– Nebraska response rate is in the top 5 (but has been slipping—help us promote participation in the ACS)
• 1 in 3 non‐respondents are personally interviewed to get info (very important—improves ACS data over other sources, but Census 2000 had full non‐response follow up)

Census does little to promote ACS awareness/participation. Can you help?

ACS New Subject Areas• Fertility (women age 15‐50 giving birth in the last year)• Food stamp/SNAP receipt (for households)
– Note: These two items were not asked on Census 2000 but have been asked since early‐on in the ACS
• Health insurance coverage, changes in marital status, and veteran service connected disabilities added in 2008; field of Bachelor’s Degree added in 2009– Disability question was revamped in 2008: see all forms here:
• http://www.census.gov/programs‐surveys/acs/methodology/questionnaire‐archive.html
• New questions on computer/internet access (and type like cable, dial up, etc.) started in 2013KEY POINT: Remember that the goal of the ACS is not to make exact counts of the population or an item like the number of births (other sources for that), but to provide information on the characteristics of the population or those giving birth (like education levels) – information you can’t find elsewhere!

Point Estimates, Margin of Error (MOE), and Confidence Intervals
• The ACS data provide point estimates for various characteristics. ACS data also include a margin of error (MOE) for finding a lower and upper bound. (e.g. poverty rate of 12.4% ± 0.5%)
– Why?• The ACS is a sample and subject to sampling error.• Is the ACS data representative of the entire population?• Census 2000 long form also a sample—1 in 6 sampling rate made sampling error small and MOE was not released.
• Adding and subtracting the MOE to/from the point estimate creates a range called a confidence interval. – Example from above: 2014 NE poverty rate: 12.4 – 0.5; 12.4 + 0.5; so
the range or interval is 11.9 to 12.9%– ACS displays the MOE for a 90% confidence interval.
• The bounds tell us that we are 90% confident that the figure for the entire population would be in this range if all households were surveyed.

Advantages of Multi‐year Aggregate Estimates• The aggregates provide data for more geographies
• Annual data for NE: 3 counties (Douglas, Lancaster, Sarpy)• Old 3‐yr aggregates: 17 counties; 5‐yr aggregate: all 93 counties
• For areas that get annual data, the aggregates based on more completed surveys will be more accurate and have smaller margins of error (MOE)– Especially important for sub‐groups—data for specific age
groups or racial/ethnic groups• General rule: whenever you need to split a statistic (education by age; poverty by race, etc.) use the 5‐year dataset as it is the most accurate!!
– Aggregated data help reduce variability in year‐to‐year figures• Some prepared FactFinder tables do not have data released annually because of accuracy concerns—some of those tables will have the data released in the 5‐year dataset

Example of Standard Table without Data Released; this was for Sarpy County – the 3-yr and 5-yr datasets did list figures
ACS Sample Size Increase Began in 2011 and Continues!!
• Higher sampling rate means more completed surveys and more data items available with better accuracy!!
• National sample expanded from 2.9 million to 3.54 million addresses per year (+ 22%)– Nebraska housing unit sample increased by about 5,700 (3,450
more completes or + 21%)• >21,000 NE ACS completes in 2014 vs. U.S. opinion polls of 1,000• Statistical quality improvements are seen with 2011 & newer data vs. prior years (smaller error factors with bigger sample)
• Full impact will be seen this fall when we get the 2011‐15 five‐yr data• This may prove to be the “golden time” for ACS data
– Larger sample with solid weighting based on 2010 census; NOTE: 2009 ACS data was not weighted to 2010 counts so it has too few minorities

2015 ACS Data Coming In 2016• The annual (one‐year) data for 2015 (for areas with 65,000+ persons) were
released on September 15, 2016• 2015 “Supplemental Estimates” to be released Thursday October 20, 2016
(areas with 20,000+ persons)• This is the Bureau’s attempt to replace the discontinued 3‐year estimates• Only for 58 detailed tables; will have a larger MOE than the former 3‐yr data; 2014 supplemental estimates were just released in July
• New 5‐year aggregate estimates covering 2011‐15 will be released on December 8, 2016 (all geographies; embargo on Dec. 6, 2016)
• Will have “Comparative Profiles” showing values for 2006‐10 versus non‐overlapping 2011‐15 timeframe
• Increased sampling rate is important, especially for small areas– Will be our last major bump in completed interviews stemming from the 2011
sample size increase– We must keep updating our data files to the most current timeframe as it will
also tend to be the most accurate given the sample size increase

Population Estimates Program: Basic Overview• The population estimates program provides the official head and housing
unit counts as well as counts by age, sex, and race in non‐census years– Shows how the population has changed since the Census
• As of July 1 of the specific year• Staggered releases throughout the year
– Large geographies first, most detailed data last
• The current release/vintage always supersedes prior year’s releases– Can create confusion for why one 7‐1‐14 estimate will differ from another—
cite the source and release date– You always have to be going and getting/using the most currently released
data• Estimates differ from projections
– Estimates are the newest look at our current population– Projections predict the population structure in the future

Population Estimates: Methodology in Brief– Start with the Census 2010 headcount (refers to 4‐1‐2010)– Adjust for headcount revisions, boundary changes (annexations)
so that everything is consistent over time• This is called the Estimates Base (refers to 4‐1‐2010)
– Add births, subtract deaths from vital records– Make estimates of domestic and international migration
• Partner with IRS to show changes in where people file tax returns– Limited to people/families who file their taxes, doesn’t account for
people leaving the U.S. very well• Use Medicare records to be more precise in age 65+ population
– Various methods estimate changes in group quarters and military populations (deployment affects)
– Use building permit data and recorded demolitions• Tornados don’t file demolition permits!! (Hallam, Pilger)• Permit allocation has issues (Lancaster County units allocated to most cities/towns therein although some don’t have housing unit growth)

Population Estimates Program: Its Importance• The estimates give us our best look and official figures for how the
population has changed since the Census• Some grants and $ allocations are calculated based on the estimates• On SF 1 style demographics, it is the estimates and not the ACS that are the
official population source – use it for age, gender, race
– Is Nebraska growing more/less than regional/neighboring states and the U.S.?
• Will be the basis of predicting whether Nebraska will keep all 3 Congressional seats in 2020!
– What population components are changing• Births/Deaths; Foreign and Domestic net migration
– How is the state’s population distribution (more growth in metro counties) and age/race structure changing?
• Migration of baby boomers and those age 20‐34 is key• Will Nebraska’s growth continue to be dominated by minority populations, especially Hispanic/Latino?

Estimates Program Data• Our office has a lot of the data compiled and often makes an
annual Nebraska Population Report– Is a good reference document as data changes year to year– If you need something specific, contact us to see if we have
compiled what you’re looking for• Realize that you may just want to use 2010 data rather than
the estimates—the estimates have more value as we move further away from 2010
• Pop. estimates website is: www.census.gov/popest/• Next big release will be for data as of July 1, 2016
– Data for states will be released in December 2016– Data for counties/metro areas will be released in March 2017– Data for places and by age/sex/race comes later: May‐June 2017
Bottomline: Ask yourself these questions…• What information would I like to have ideally?
– Exact data items (variables)– Geography– Timeframe
• What source is best to use for that – Decennial Census, ACS, Estimates Program, other source?
• Is that data available? Is it accurate or have large error factors?– If not, what are my best tradeoffs?
• Is it more important to have that exact geography or can I use a larger one as a proxy? (Douglas County census tract 11 versus PUMA 903)
• Do I want the most current data or can I extend to a longer timeframe (to increase accuracy or availability)? (2014 versus 2010‐14)
– Any item split by age or race should use longer 5‐year timeframe unless geography is sufficiently large (State level might not be large enough)

33
This shouldn’t happen now that you know CENSUS BASICS.

The End
Thanks for coming, and feel free to contact me any time for Census data or to answer
questions
*contact info is on slide #1*and “like” our facebook page!!