Embed Size (px)
Citation preview
Cement Sector Scope 3 GHG Accounting and Reporting Guidance
business solutions for a sustainable world
Contents1 Introduction to Scope 3 in the cement sector 1
1.1 Background 1
1.2 What are Scope 3 emissions? 2
1.2.1 Why account for Scope 3 emissions? 3
1.2.2 Relevance to the cement industry 3
1.2.3 Principles of Scope 3 accounting 4
1.2.4 Types of cement companies 4
2 Approach to Scope 3 accounting 52.1 Scope 3 categories 5
2.2 Relevance of Scope 3 categories to the cement sector 8
2.2.1 Assessment of upstream categories 8
2.2.2 Assessment of downstream categories 8
2.2.3 Recommendations on including categories for the cement sector 9
2.2.4 Upstream or downstream? 10
3 Methods for accounting for Scope 3 emissions 113.1 Accounting methodology for categories 12
3.2 Suggested process for Scope 3 accounting projects 12
3.3 Other issues to consider 13
3.3.1 Disclosing and justifying exclusions 13
3.3.2 Boundaries 14
3.3.3 Accounting for emissions and removals from biogenic sources 14
4 Detailed guidance by category 154.1 Category 1 Purchased goods and services 15
4.2 Category 2 Capital goods 18
4.3 Category 3 Fuel and energy-related activities 20
4.4 Category 4 Upstream transportation and distribution 26
4.5 Category 6 Business travel 32
4.6 Category 7 Employee commuting 35
4.7 Category 9 Downstream transportation and distribution 38
4.8 Category 10 Processing of sold products 40
4.9 Category 11 Processing of sold products and Category 12 End of life of sold products 41
4.10 Non-relevant Scope 3 categories 41
Appendices 42Appendix 1 Detailed data requirements and product and supplier methodology, 42 Category 1 – (Purchased goods and services)
Appendix 2 Data collection guidance, 44 Category 4 – (Upstream transportation and distribution)
List of figuresFigure 1: Overview of Greenhouse Gas (GHG) Standard scopes and emissions across the value chain 2
Figure 2: Italcementi GHG emissions sources 3
Figure 3: Scenarios for assigning emissions to upstream or downstream categories 10
Figure 4: Process for completing a Scope 3 accounting project 12
Figure 5: Emissions from fixed capital assets 18
Figure 6: Decision tree for selecting a calculation method for emissions from upstream distribution 30
Figure 7: Decision tree for selecting a calculation method for emissions from business travel 33
List of tablesTable 1: Emissions for companies in different sectors 3
Table 2: Types of cement company used in this document 4
Table 3: The relevance of Scope 3 GHG categories to the cement industry 5
Table 4: Scope 3 categories relevant to cement companies 9
Table 5: Use of primary and secondary data for reporting Scope 3 emissions 12
Table 6: Criteria for identifying relevant Scope 3 categories 13
Table 7: Details of the data requirements for purchased goods and services 16
Table 8: Calculation methodology for purchased goods and services 17
Table 9: Estimated impacts of typical capital spending for an existing cement kiln 18 Table 10: Emissions from operating and building kilns for different sized cement companies 19
Table 11: Activities included in Category 3 – Fuel and energy-related emissions not included in 21 Scope 1 or 2 (from the GHG Scope 3 Standard)
Table 12: Calculation methodology for supplier data or average method 22
Table 13: Scope and category of emissions 26
1 Cement Sector Scope 3 GHG Accounting and Reporting Guidance
1 Introduction to Scope 3 in the cement sector
• This document is prepared by the Cement Sustainability Initiative (CSI) of the World Business Council for Sustainable Development (WBCSD) and in collaboration with a number of leading cement companies.
• This Cement Sector Scope 3 GHG Accounting and Reporting Guidance is intended as a tool for use by cement companies worldwide. It provides a harmonized methodology for the calculation of Scope 3 emissions, with a view to reporting these emissions for various purposes.
• This Guidance is based on the WBCSD-WRI Greenhouse Gas Corporate Value Chain (Scope 3) Accounting and Reporting Standard (September 2011), hereunder referred to as Scope 3 Standard and supplements the Cement CO2 and Energy Protocol – CO2 and Energy Accounting and Reporting Standard for the Cement Industry (version 3, May 2011), which covers Scope 1 and 2, hereunder referred to as Cement CO2 and Energy Protocol or Standard.
• This Guidance provides consistency for voluntary Scope 3 accounting and reporting in the cement industry. It addresses the main CO2 and non-CO2 greenhouse gas (GHG) emissions from upstream and downstream activities related to cement production.
1.1 Background• The purpose of this Guidance is to enable comparisons of
a company’s GHG emissions over time. It is not intended, at this stage, to be used for comparisons between companies based on their Scope 3 emissions although overtime a more consistent set of principles for Scope 3 emissions reporting may emerge. Differences in reported emissions may be a result of differences in inventory methodology or differences in company size or structure.
• This Guidance has been designed for use by companies that produce cement and not necessarily for companies that sell ready mix or aggregates. We believe that some of the principles will be helpful to companies in these sectors, but relevant calculations and approaches to measuring emissions will be different.
• The development of this Guidance has included consultation with key stakeholders, including:
– The European Cement Association (CEMBUREAU)
– Japan Cement Association (JCA)
– Federación Interamericana del Cemento (FICEM)
– CDP (formerly Carbon Disclosure Project)
– World Resources Institute (WRI) GHG Standard Team
– The Portland Cement Association (PCA)
– German Cement Association (VDZ)
2Introduction to Scope 3 in the cement sector
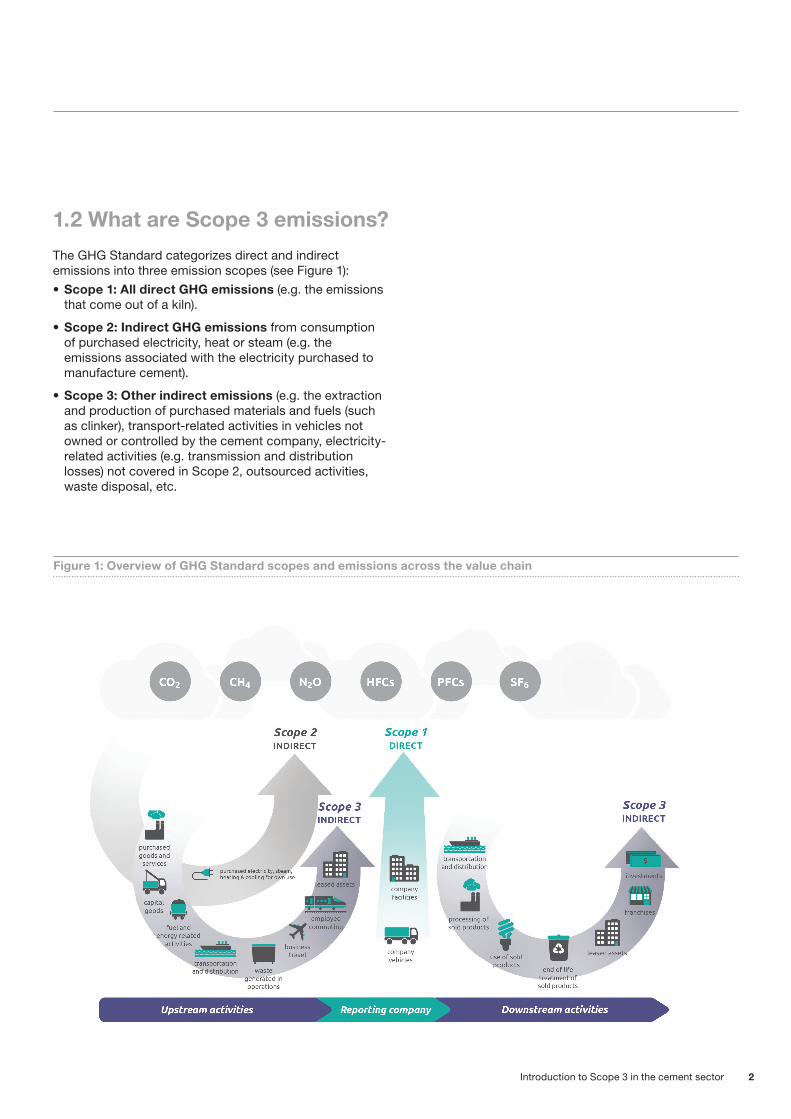
The GHG Standard categorizes direct and indirect emissions into three emission scopes (see Figure 1):• Scope 1: All direct GHG emissions (e.g. the emissions
that come out of a kiln).
• Scope 2: Indirect GHG emissions from consumption of purchased electricity, heat or steam (e.g. the emissions associated with the electricity purchased to manufacture cement).
• Scope 3: Other indirect emissions (e.g. the extraction and production of purchased materials and fuels (such as clinker), transport-related activities in vehicles not owned or controlled by the cement company, electricity-related activities (e.g. transmission and distribution losses) not covered in Scope 2, outsourced activities, waste disposal, etc.
1.2 What are Scope 3 emissions?
Figure 1: Overview of GHG Standard scopes and emissions across the value chain
3 Cement Sector Scope 3 GHG Accounting and Reporting Guidance
1.2.1 Why account for Scope 3 emissions?Scope 3 accounting allows companies to develop a value chain footprint that provides an accurate picture of the total impact of a company’s activities.
By measuring Scope 3 emissions, cement companies can:
• Assess where the emission hotspots are in their value chain.
• Identify resource and energy risks in their value chain.
• Identify which suppliers are sustainability leaders.
• Identify cost reduction and energy-efficiency opportunities across their value chain.
• Engage suppliers and help them to implement sustainability initiatives.
• Reduce their employees’ emissions from business travel and commuting.
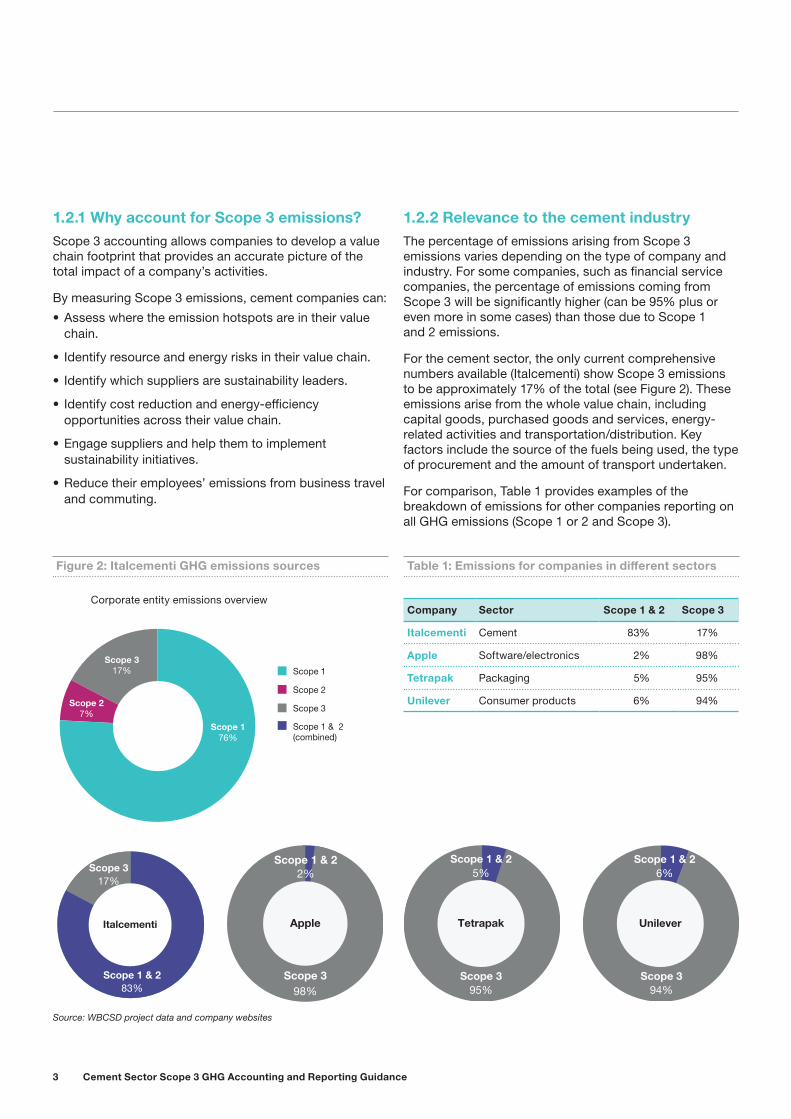
1.2.2 Relevance to the cement industryThe percentage of emissions arising from Scope 3 emissions varies depending on the type of company and industry. For some companies, such as financial service companies, the percentage of emissions coming from Scope 3 will be significantly higher (can be 95% plus or even more in some cases) than those due to Scope 1 and 2 emissions.
For the cement sector, the only current comprehensive numbers available (Italcementi) show Scope 3 emissions to be approximately 17% of the total (see Figure 2). These emissions arise from the whole value chain, including capital goods, purchased goods and services, energy-related activities and transportation/distribution. Key factors include the source of the fuels being used, the type of procurement and the amount of transport undertaken.
For comparison, Table 1 provides examples of the breakdown of emissions for other companies reporting on all GHG emissions (Scope 1 or 2 and Scope 3).
Figure 2: Italcementi GHG emissions sources Table 1: Emissions for companies in different sectors
Source: WBCSD project data and company websites
Scope 1
Scope 2
Scope 3
Scope 1 & 2(combined)
Scope 176%
Scope 317%
Scope 27%
Tetrapak
Scope 1 & 25%
Scope 395%
Scope 398%
Scope 1 & 2
Apple
2%Scope 1 & 2
6%
Scope 394%
Unilever
Company Sector Scope 1 & 2 Scope 3
Italcementi Cement 83% 17%
Apple Software/electronics 2% 98%
Tetrapak Packaging 5% 95%
Unilever Consumer products 6% 94%
Corporate entity emissions overview
Italcementi
Scope 317%
Scope 1 & 283%
4Introduction to Scope 3 in the cement sector
1.2.3 Principles of Scope 3 accountingIn accordance with the Scope 3 Standard, GHG accounting and reporting of Scope 3 emissions is based on the following principles:• Relevance: Ensure the GHG inventory appropriately
reflects the GHG emissions of the company and serves the decision-making needs of users — both internal and external to the company.
• Completeness: Account for and report on all GHG emission sources and activities within the inventory boundary. Disclose and justify any specific exclusion.
• Consistency: Use consistent methodologies to allow for meaningful performance tracking of emissions over time. Transparently document any changes to the data, inventory boundary, methods or any other relevant factors in the time series.
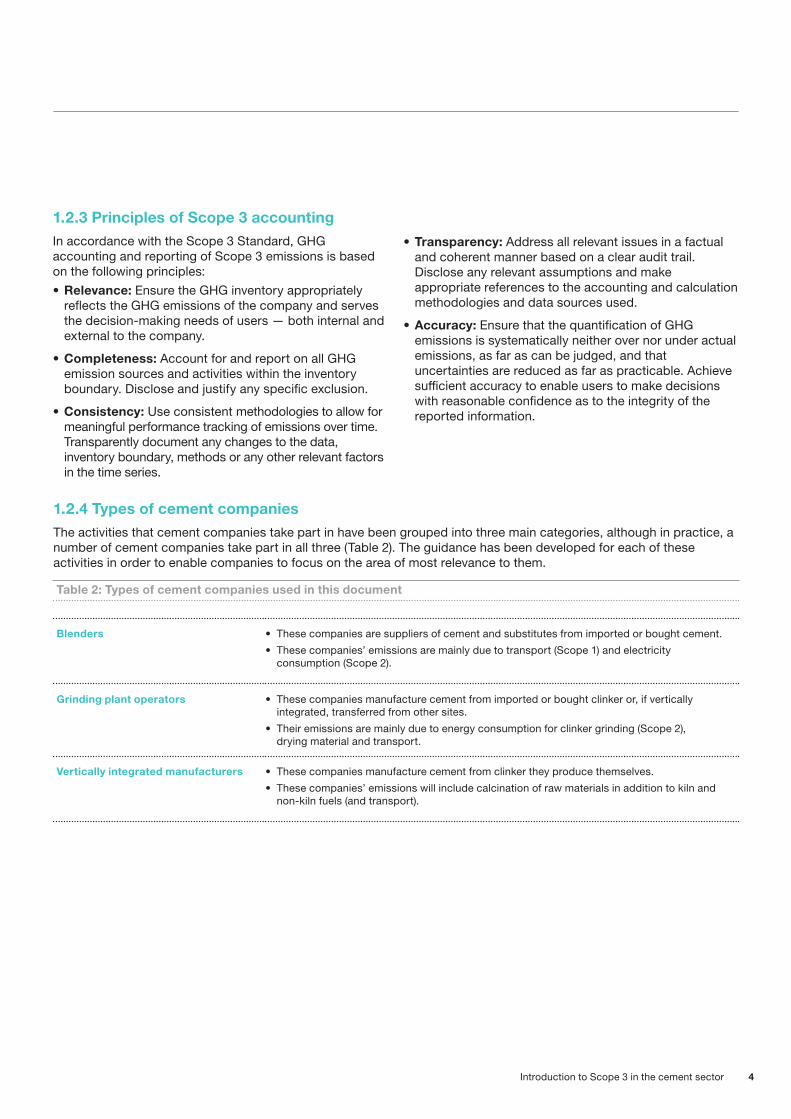
Table 2: Types of cement companies used in this document
Blenders • These companies are suppliers of cement and substitutes from imported or bought cement.
• These companies’ emissions are mainly due to transport (Scope 1) and electricity consumption (Scope 2).
Grinding plant operators • These companies manufacture cement from imported or bought clinker or, if vertically integrated, transferred from other sites.
• Their emissions are mainly due to energy consumption for clinker grinding (Scope 2), drying material and transport.
Vertically integrated manufacturers • These companies manufacture cement from clinker they produce themselves.
• These companies’ emissions will include calcination of raw materials in addition to kiln and non-kiln fuels (and transport).
1.2.4 Types of cement companiesThe activities that cement companies take part in have been grouped into three main categories, although in practice, a number of cement companies take part in all three (Table 2). The guidance has been developed for each of these activities in order to enable companies to focus on the area of most relevance to them.
• Transparency: Address all relevant issues in a factual and coherent manner based on a clear audit trail. Disclose any relevant assumptions and make appropriate references to the accounting and calculation methodologies and data sources used.
• Accuracy: Ensure that the quantification of GHG emissions is systematically neither over nor under actual emissions, as far as can be judged, and that uncertainties are reduced as far as practicable. Achieve sufficient accuracy to enable users to make decisions with reasonable confidence as to the integrity of the reported information.
5 Cement Sector Scope 3 GHG Accounting and Reporting Guidance
2 Approach to Scope 3 accounting
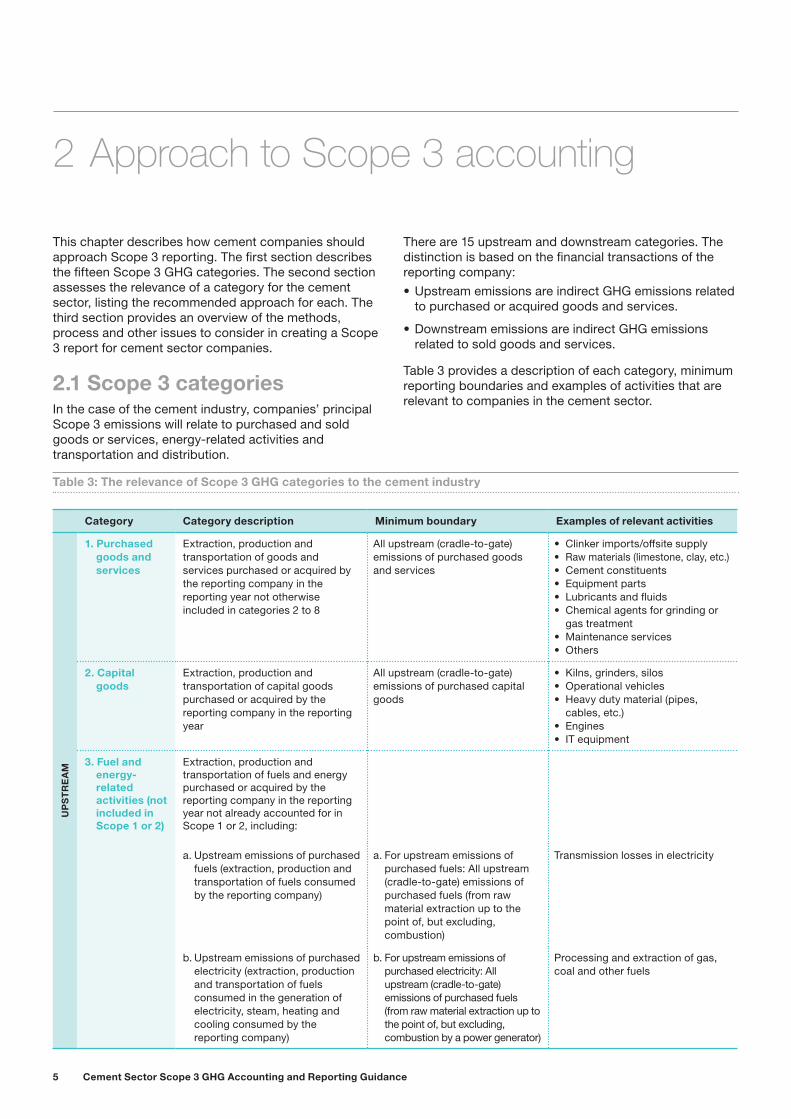
This chapter describes how cement companies should approach Scope 3 reporting. The first section describes the fifteen Scope 3 GHG categories. The second section assesses the relevance of a category for the cement sector, listing the recommended approach for each. The third section provides an overview of the methods, process and other issues to consider in creating a Scope 3 report for cement sector companies.
2.1 Scope 3 categoriesIn the case of the cement industry, companies’ principal Scope 3 emissions will relate to purchased and sold goods or services, energy-related activities and transportation and distribution.
There are 15 upstream and downstream categories. The distinction is based on the financial transactions of the reporting company:• Upstream emissions are indirect GHG emissions related
to purchased or acquired goods and services.
• Downstream emissions are indirect GHG emissions related to sold goods and services.
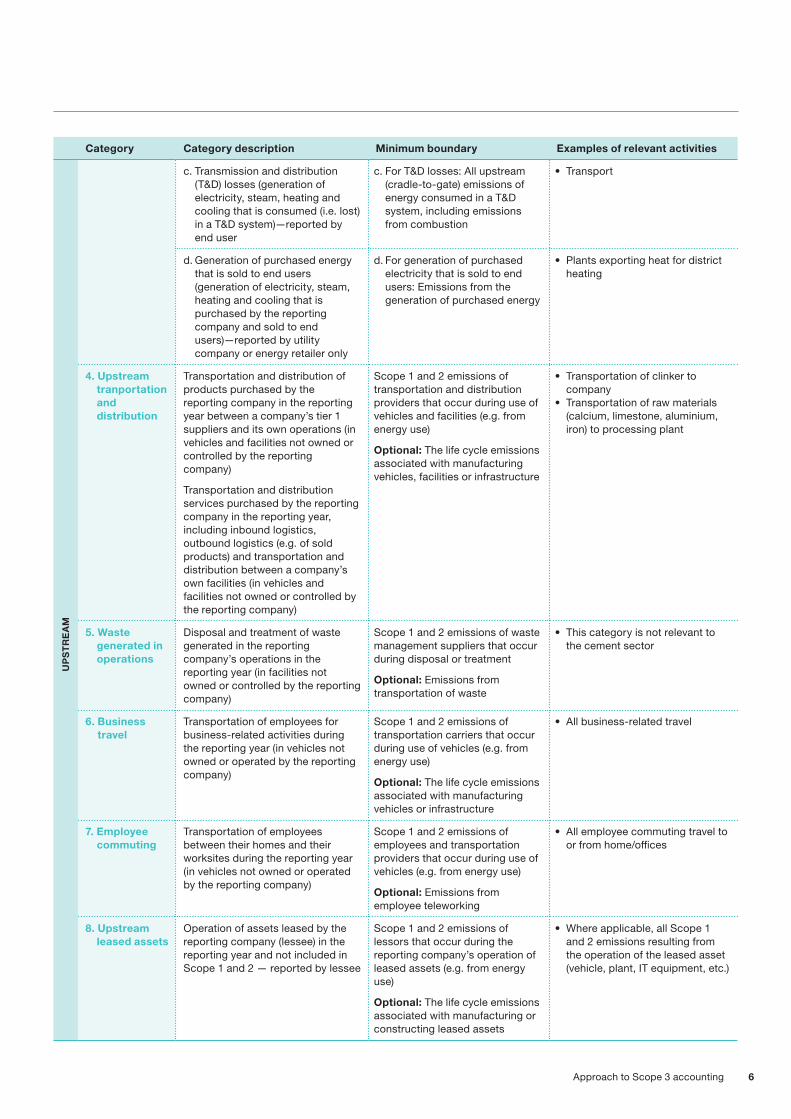
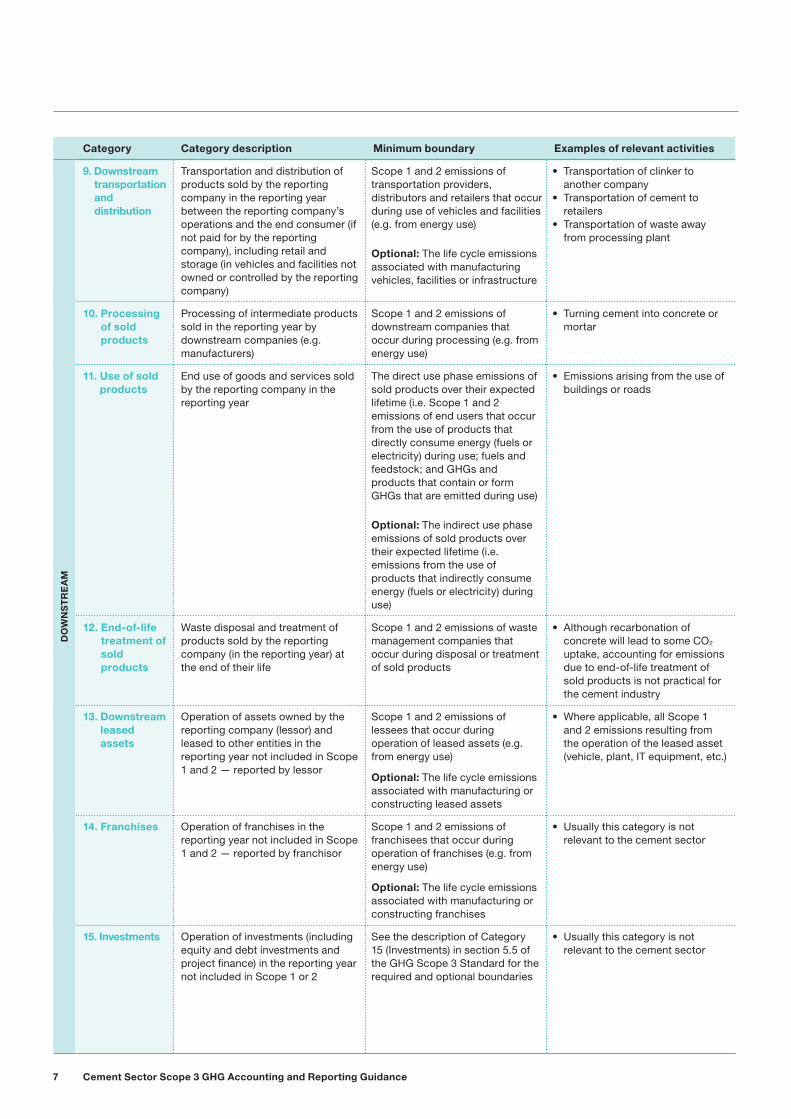
Table 3 provides a description of each category, minimum reporting boundaries and examples of activities that are relevant to companies in the cement sector.
Table 3: The relevance of Scope 3 GHG categories to the cement industry
Category Category description Minimum boundary Examples of relevant activities
UP
ST
RE
AM
1. Purchased goods and services
Extraction, production and transportation of goods and services purchased or acquired by the reporting company in the reporting year not otherwise included in categories 2 to 8
All upstream (cradle-to-gate) emissions of purchased goods and services
• Clinker imports/offsite supply• Raw materials (limestone, clay, etc.)• Cement constituents• Equipment parts• Lubricants and fluids• Chemical agents for grinding or
gas treatment• Maintenance services• Others
2. Capital goods
Extraction, production and transportation of capital goods purchased or acquired by the reporting company in the reporting year
All upstream (cradle-to-gate) emissions of purchased capital goods
• Kilns, grinders, silos• Operational vehicles• Heavy duty material (pipes,
cables, etc.)• Engines• IT equipment
3. Fuel and energy-related activities (not included in Scope 1 or 2)
Extraction, production and transportation of fuels and energy purchased or acquired by the reporting company in the reporting year not already accounted for in Scope 1 or 2, including:
a. Upstream emissions of purchased fuels (extraction, production and transportation of fuels consumed by the reporting company)
a. For upstream emissions of purchased fuels: All upstream (cradle-to-gate) emissions of purchased fuels (from raw material extraction up to the point of, but excluding, combustion)
Transmission losses in electricity
b. Upstream emissions of purchased electricity (extraction, production and transportation of fuels consumed in the generation of electricity, steam, heating and cooling consumed by the reporting company)
b. For upstream emissions of purchased electricity: All upstream (cradle-to-gate) emissions of purchased fuels (from raw material extraction up to the point of, but excluding, combustion by a power generator)
Processing and extraction of gas, coal and other fuels
6Approach to Scope 3 accounting
Category Category description Minimum boundary Examples of relevant activities
c. Transmission and distribution (T&D) losses (generation of electricity, steam, heating and cooling that is consumed (i.e. lost) in a T&D system)—reported by end user
c. For T&D losses: All upstream (cradle-to-gate) emissions of energy consumed in a T&D system, including emissions from combustion
• Transport
UP
ST
RE
AM
d. Generation of purchased energy that is sold to end users (generation of electricity, steam, heating and cooling that is purchased by the reporting company and sold to end users)—reported by utility company or energy retailer only
d. For generation of purchased electricity that is sold to end users: Emissions from the generation of purchased energy
• Plants exporting heat for district heating
4. Upstream tranportation and distribution
Transportation and distribution of products purchased by the reporting company in the reporting year between a company’s tier 1 suppliers and its own operations (in vehicles and facilities not owned or controlled by the reporting company)
Transportation and distribution services purchased by the reporting company in the reporting year, including inbound logistics, outbound logistics (e.g. of sold products) and transportation and distribution between a company’s own facilities (in vehicles and facilities not owned or controlled by the reporting company)
Scope 1 and 2 emissions of transportation and distribution providers that occur during use of vehicles and facilities (e.g. from energy use)
Optional: The life cycle emissions associated with manufacturing vehicles, facilities or infrastructure
• Transportation of clinker to company
• Transportation of raw materials (calcium, limestone, aluminium, iron) to processing plant
5. Waste generated in operations
Disposal and treatment of waste generated in the reporting company’s operations in the reporting year (in facilities not owned or controlled by the reporting company)
Scope 1 and 2 emissions of waste management suppliers that occur during disposal or treatment
Optional: Emissions from transportation of waste
• This category is not relevant to the cement sector
6. Business travel
Transportation of employees for business-related activities during the reporting year (in vehicles not owned or operated by the reporting company)
Scope 1 and 2 emissions of transportation carriers that occur during use of vehicles (e.g. from energy use)
Optional: The life cycle emissions associated with manufacturing vehicles or infrastructure
• All business-related travel
7. Employee commuting
Transportation of employees between their homes and their worksites during the reporting year (in vehicles not owned or operated by the reporting company)
Scope 1 and 2 emissions of employees and transportation providers that occur during use of vehicles (e.g. from energy use)
Optional: Emissions from employee teleworking
• All employee commuting travel to or from home/offices
8. Upstream leased assets
Operation of assets leased by the reporting company (lessee) in the reporting year and not included in Scope 1 and 2 — reported by lessee
Scope 1 and 2 emissions of lessors that occur during the reporting company’s operation of leased assets (e.g. from energy use)
Optional: The life cycle emissions associated with manufacturing or constructing leased assets
• Where applicable, all Scope 1 and 2 emissions resulting from the operation of the leased asset (vehicle, plant, IT equipment, etc.)
7 Cement Sector Scope 3 GHG Accounting and Reporting Guidance
Category Category description Minimum boundary Examples of relevant activities
DO
WN
ST
RE
AM
9. Downstream transportation and distribution
Transportation and distribution of products sold by the reporting company in the reporting year between the reporting company’s operations and the end consumer (if not paid for by the reporting company), including retail and storage (in vehicles and facilities not owned or controlled by the reporting company)
Scope 1 and 2 emissions of transportation providers, distributors and retailers that occur during use of vehicles and facilities (e.g. from energy use)
Optional: The life cycle emissions associated with manufacturing vehicles, facilities or infrastructure
• Transportation of clinker to another company
• Transportation of cement to retailers
• Transportation of waste away from processing plant
10. Processing of sold products
Processing of intermediate products sold in the reporting year by downstream companies (e.g. manufacturers)
Scope 1 and 2 emissions of downstream companies that occur during processing (e.g. from energy use)
• Turning cement into concrete or mortar
11. Use of sold products
End use of goods and services sold by the reporting company in the reporting year
The direct use phase emissions of sold products over their expected lifetime (i.e. Scope 1 and 2 emissions of end users that occur from the use of products that directly consume energy (fuels or electricity) during use; fuels and feedstock; and GHGs and products that contain or form GHGs that are emitted during use)
Optional: The indirect use phase emissions of sold products over their expected lifetime (i.e. emissions from the use of products that indirectly consume energy (fuels or electricity) during use)
• Emissions arising from the use of buildings or roads
12. End-of-life treatment of sold products
Waste disposal and treatment of products sold by the reporting company (in the reporting year) at the end of their life
Scope 1 and 2 emissions of waste management companies that occur during disposal or treatment of sold products
• Although recarbonation of concrete will lead to some CO2 uptake, accounting for emissions due to end-of-life treatment of sold products is not practical for the cement industry
13. Downstream leased assets
Operation of assets owned by the reporting company (lessor) and leased to other entities in the reporting year not included in Scope 1 and 2 — reported by lessor
Scope 1 and 2 emissions of lessees that occur during operation of leased assets (e.g. from energy use)
Optional: The life cycle emissions associated with manufacturing or constructing leased assets
• Where applicable, all Scope 1 and 2 emissions resulting from the operation of the leased asset (vehicle, plant, IT equipment, etc.)
14. Franchises Operation of franchises in the reporting year not included in Scope 1 and 2 — reported by franchisor
Scope 1 and 2 emissions of franchisees that occur during operation of franchises (e.g. from energy use)
Optional: The life cycle emissions associated with manufacturing or constructing franchises
• Usually this category is not relevant to the cement sector
15. Investments Operation of investments (including equity and debt investments and project finance) in the reporting year not included in Scope 1 or 2
See the description of Category 15 (Investments) in section 5.5 of the GHG Scope 3 Standard for the required and optional boundaries
• Usually this category is not relevant to the cement sector
8Approach to Scope 3 accounting
2.2.1 Assessment of upstream categories Due to the processes that take place within the cement industry, the majority of emissions are Scope 1 and 2. Scope 3 emissions will be relevant according to the specific activities that take place within a cement company. Below is a list of Scope 3 categories and their applicability to the cement sector.
Most Scope 3 emissions in the cement industry come from Category 1 (Purchased goods and services), Category 3 (Fuel and energy-related activities) and Category 4 (Upstream transportation and distribution).
Category 2 (Capital goods) for the cement industry are used for a very long time period (often 40 or 50 years); while allocated emissions from capital goods in a reporting year are insignificant for a number of companies, certain company structures may make these relevant (see Table 2, page 4).
More recent cement production processes generate almost no waste. Therefore, the emissions from Category 5 (Waste generated in operations) will be negligible (and not be accounted for and reported) for companies.
Emissions from Category 6 (Business travel) and Category 7 (Employee commuting) are also negligible but they can be accounted for credibly. Emissions from those categories can be accounted for and reported at the discretion of the reporting company.
Cement companies mostly own their production facilities. The emissions from Category 8 (Upstream leased assets) are therefore negligible and should not usually be accounted for and reported unless a company is leasing the production plant capacity from another company.
2.2 Relevance of Scope 3 categories to the cement sector
2.2.2 Assessment of downstream categoriesThe cement industry produces cement, which is considered an intermediate product. Cement therefore has a number of downstream applications that are relevant and specific to each cement company depending on the scope of their operations and the methods they use.
Emissions from Category 9 (Downstream transportation and distribution) should be accounted for and reported by a majority of companies.
Emissions of Category 10 (Processing of sold products), Category 11 (Use of sold products) and Category 12 (End-of-life treatment of sold products) are difficult to measure for companies making intermediate products like cement. The diversity and use of cement products is wide and in general unknown to the producer. In addition, it is difficult for producers to determine how the products are used, which would limit the use of data collected to report this category.
Emissions from Category 13 (Downstream leased assets) are only relevant if assets owned by the company are leased to another company.
Emissions from Category 14 (Franchises) and Category 15 (Investments) are not relevant to the cement industry and therefore do not need to be reported. Subsidiary cement producers’ emissions should not be accounted for under Category 15 (Investments). If they are part or fully owned by the company, their Scope 1 and 2 emissions should be accounted for as part of the initial company’s emissions.
9 Cement Sector Scope 3 GHG Accounting and Reporting Guidance
While this approach to categories is valid for the companies that have developed this Guidance, other cement companies might differ in their structure. As such, some categories not listed as relevant in Table 3 maybe need to be reported.
Blending plant operators
Grinding plant operators
Vertically integrated manufacturers
1 Purchased goods and services 2 Capital goods l l l3 Fuel and energy-related activities 4 Upstream transportation and distribution 5 Waste generated in operations – – –6 Business travel l l l7 Employee commuting l l l8 Upstream leased assets – – –9
Downstream transportation and distribution
10 Processing of sold products l l l11 Use of sold products n n n12 End-of-life treatment of sold products n n n13 Downstream leased assets – – –14 Franchises – – –15 Investments – – –
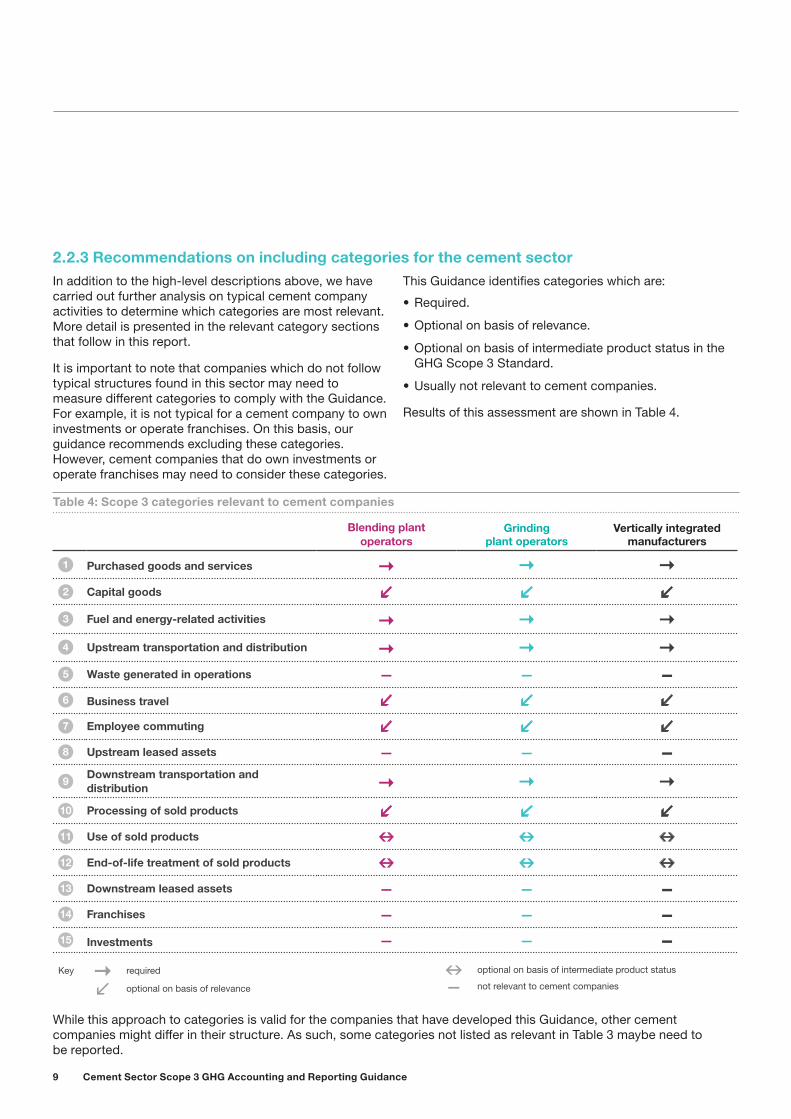
Table 4: Scope 3 categories relevant to cement companies
2.2.3 Recommendations on including categories for the cement sectorIn addition to the high-level descriptions above, we have carried out further analysis on typical cement company activities to determine which categories are most relevant. More detail is presented in the relevant category sections that follow in this report.
It is important to note that companies which do not follow typical structures found in this sector may need to measure different categories to comply with the Guidance. For example, it is not typical for a cement company to own investments or operate franchises. On this basis, our guidance recommends excluding these categories. However, cement companies that do own investments or operate franchises may need to consider these categories.
This Guidance identifies categories which are:
• Required.
• Optional on basis of relevance.
• Optional on basis of intermediate product status in the GHG Scope 3 Standard.
• Usually not relevant to cement companies.
Results of this assessment are shown in Table 4.
Key required
l optional on basis of relevancen optional on basis of intermediate product status
– not relevant to cement companies
10Approach to Scope 3 accounting
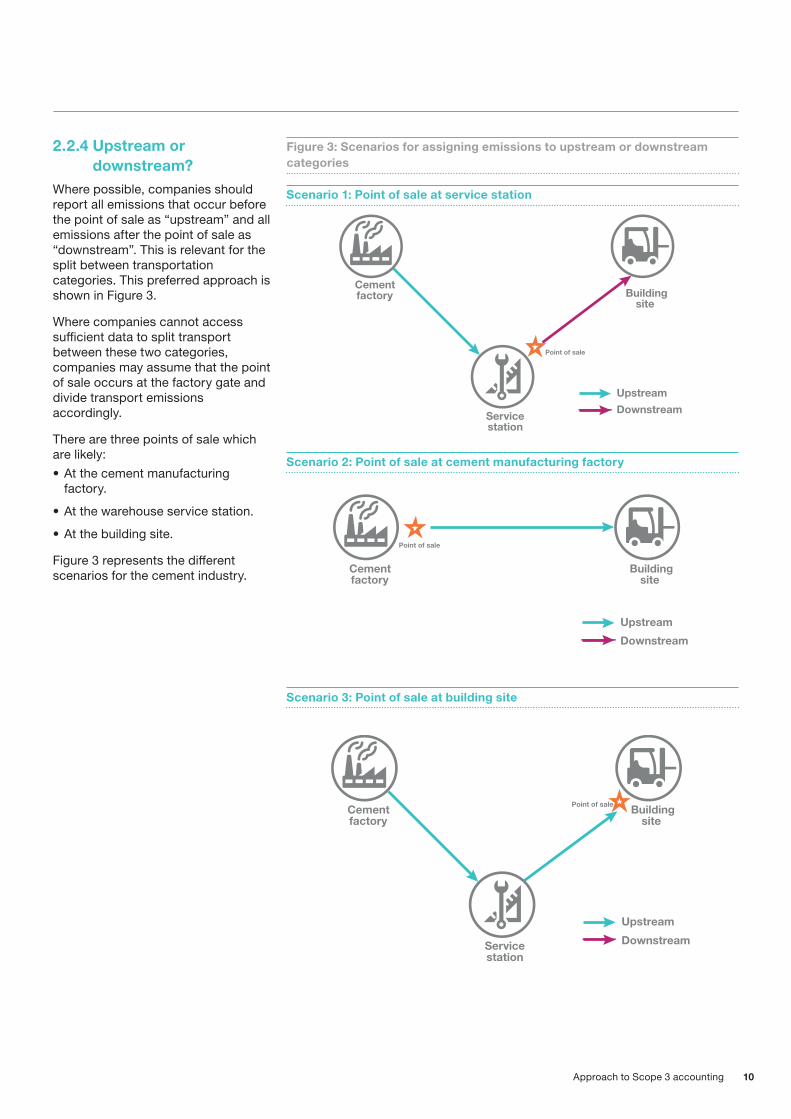
Figure 3: Scenarios for assigning emissions to upstream or downstream categories
2.2.4 Upstream or downstream?
Where possible, companies should report all emissions that occur before the point of sale as “upstream” and all emissions after the point of sale as “downstream”. This is relevant for the split between transportation categories. This preferred approach is shown in Figure 3.
Where companies cannot access sufficient data to split transport between these two categories, companies may assume that the point of sale occurs at the factory gate and divide transport emissions accordingly.
There are three points of sale which are likely:• At the cement manufacturing
factory.
• At the warehouse service station.
• At the building site.
Figure 3 represents the different scenarios for the cement industry.
Cementfactory
Servicestation
Buildingsite
Point of sale
Upstream
Downstream
Scenario 1: Point of sale at service station
Cementfactory
Buildingsite
Upstream
Downstream
Point of sale
Scenario 2: Point of sale at cement manufacturing factory
Cementfactory
Servicestation
Buildingsite
Upstream
Downstream
Point of sale
Scenario 3: Point of sale at building site
Reporting Scope 3 emissions requires companies to collect data from outside the operational boundaries of the company. Therefore, it can be more difficult than reporting Scope 1 and 2 emissions. Companies may need to use averaging/estimating or modelling methods to generate data.
There are three methods for accounting for Scope 3 emissions: 1. Primary data (using a specific product or supplier data)
2. Regional/national secondary data (specific life cycle assessment (LCA) or environmentally extended input-output model (EEIO) data set for specific cement company)
3. Global average secondary data (average LCA or EEIO model depending on category measured).
It should be noted that even those approaches in the second and third methods will need to use company data for the calculation — this will either be the company spend on products or services or the use of different materials by mass. The term “primary” above applies to the source of the emissions factors for the calculation.
These are listed in hierarchical order of preference for use based on likely reliability. So where possible, the first method should be applied.
When accounting for Scope 3 emissions, companies should note that:• Companies may adopt a primary and secondary data
approach, as in the overall GHG Scope 3 Standard. Where secondary data is used, there are two primary methods: LCA and environmentally extended input-output analyses EEIO.
• LCAs are a technique used to assess environmental impacts associated with all stages of a product, from cradle-to-grave. Typical data sources include inventory databases such as Ecoinvent1.
1 There are some public free sources of data such as the European Platform on Life Cycle Assessment (http://eplca.jrc.ec.europa.eu/) and the U.S. Life Cycle Inventory (LCI) Database (http://www.nrel.gov/lci/). Ecoinvent (http://www.ecoinvent.org) (and others) provides a global database of LCA inventory data for different industry sectors.
• EEIO analysis provides a simple method for evaluating the linkages between economic consumption activities and environmental impacts. It includes the harvesting and degradation of natural resources. Typical data sources include the World Input-Output Database (WIOD) and the Global Trade Analysis Project (GTAP).
There is no overall single best approach. Different cement companies in different parts of the world may have a different approach which is better. Additionally, different methods may be required for different Scope 3 categories.
To determine if a regional or national data source is appropriate, the following factors should be considered:• Timeliness: Is the data based on recent studies? Has
the structure or technology of the sector changed significantly since the study?
• Geographical region: Does it apply to the correct region?
• Technology assumption: Is the process technology used in the creation of the data set relevant to the company using the dataset?
• Quality: Have the data and approach been produced according to international standards? Has it been independently reviewed and tested elsewhere?
If a regional or national model meets the above requirements, then companies may apply the data source to calculate Scope 3 emissions.
If not, companies should apply global average LCA data from Ecoinvent or use an EEIO model. Where an EEIO model is used, it should be a multi-region model and from a recognized peer-reviewed source.
3 Methods for accounting for Scope 3 emissions
11 Cement Sector Scope 3 GHG Accounting and Reporting Guidance
The best approach for accounting for Scope 3 emissions will vary depending on the category, and some categories will need a combination of approaches. The preference is set out in the section above but in practice, availability of data will determine the use of primary data methods.
Therefore, we indicate our view (in Table 5) on the most likely use of primary and secondary data for companies reporting Scope 3 emissions at the time of publication of this Guidance.
3.1 Accounting methodology for categories
Table 5: Use of primary and secondary data for reporting Scope 3 emissions
Category Expected approach
1. Purchased goods and services Most likely approach is a secondary data method, combined with some supplier data if available.
2. Capital goods Most likely approach is a secondary data method, combined with some supplier data if available.
3. Fuel and energy-related activities (not included in Scope 1 or 2)
Most likely approach is a secondary data method, combined with some supplier data if available.
4. Upstream transportation and distribution Combination of primary data sources where company operates its own fleet and a secondary data method, using some supplier data if available—boundaries can be complex for this category and are discussed in detail in Category 4 (Upstream transportation and distribution).
5. Business travel Combination of primary data sources where company operates its own fleet and a secondary data method, using some supplier data if available (information from travel providers on air/rail/ship emissions, use of company data for car/taxi travel).
6. Employee commuting Use of either primary or secondary survey data, with national data on impacts from different travel modes.
7. Downstream transportation and distribution
Combination of primary data sources where company operates its own fleet and a secondary data method, using some supplier data if available.
8. Processing of sold products Most likely approach is a secondary data method, probably modelling using LCA-based approaches.
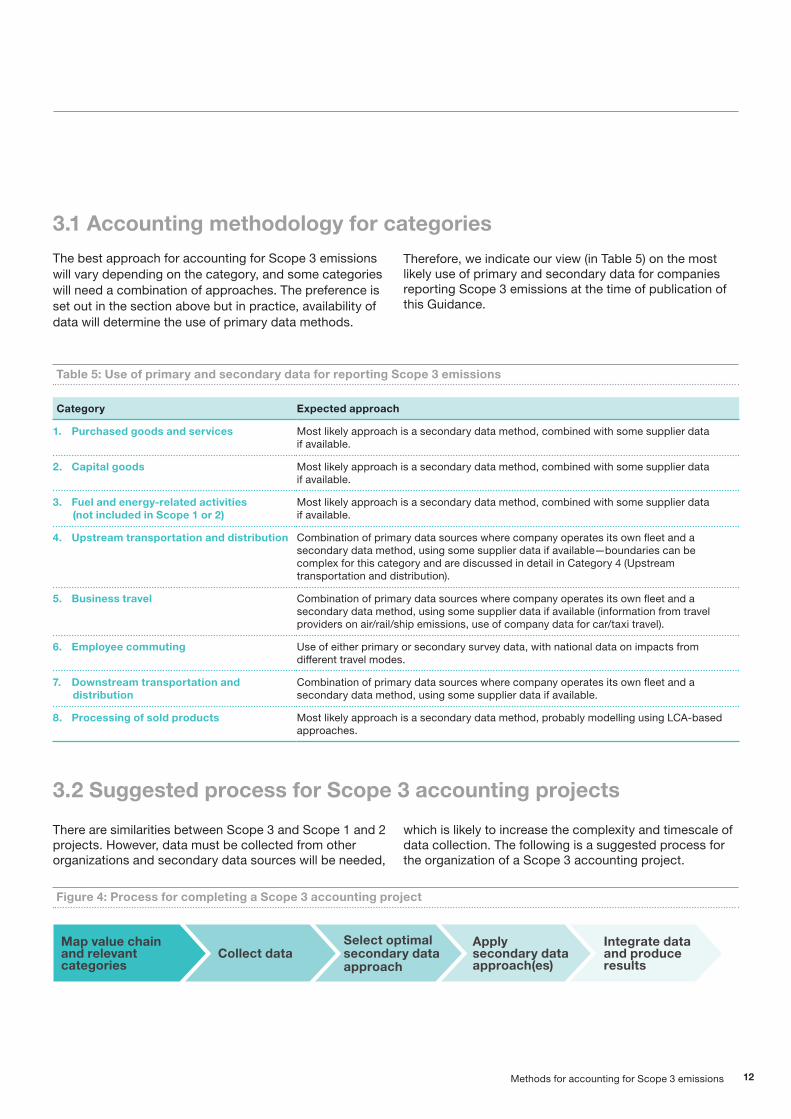
3.2 Suggested process for Scope 3 accounting projects
Figure 4: Process for completing a Scope 3 accounting project
Integrate data and produce results
Apply secondary data approach(es)
Select optimal secondary data approach
Collect dataMap value chain and relevant categories
There are similarities between Scope 3 and Scope 1 and 2 projects. However, data must be collected from other organizations and secondary data sources will be needed,
which is likely to increase the complexity and timescale of data collection. The following is a suggested process for the organization of a Scope 3 accounting project.
12Methods for accounting for Scope 3 emissions
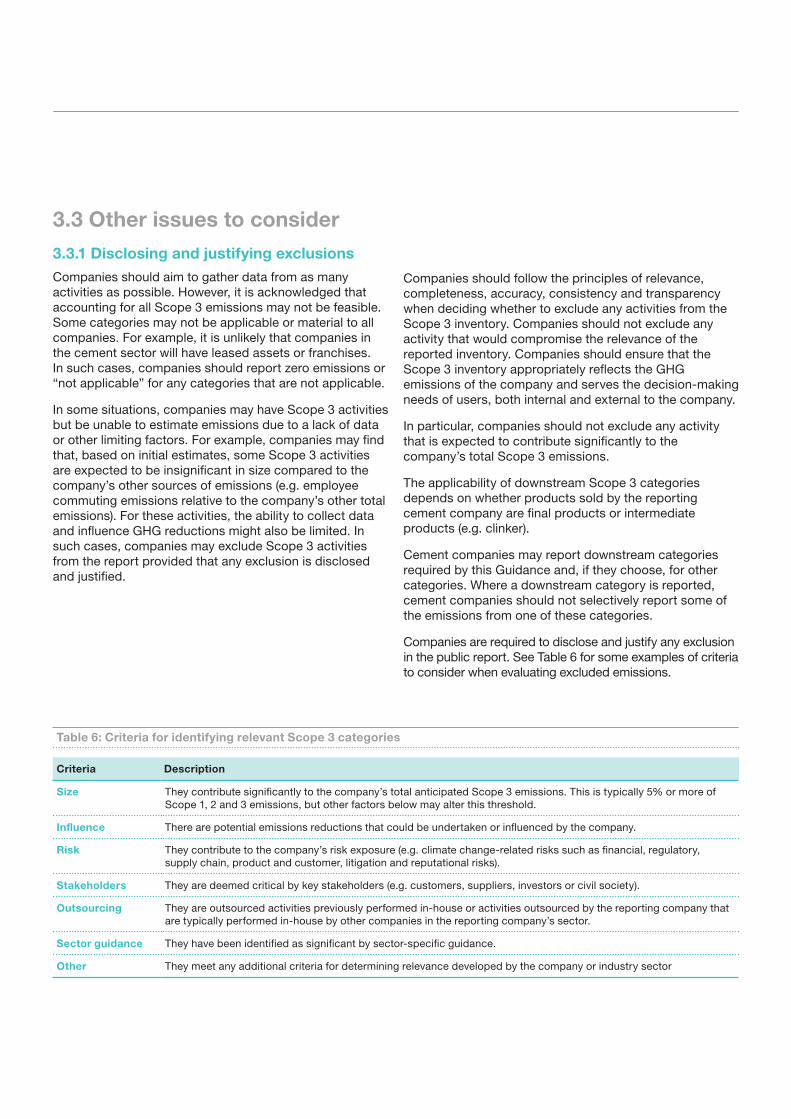
3.3.1 Disclosing and justifying exclusionsCompanies should aim to gather data from as many activities as possible. However, it is acknowledged that accounting for all Scope 3 emissions may not be feasible. Some categories may not be applicable or material to all companies. For example, it is unlikely that companies in the cement sector will have leased assets or franchises. In such cases, companies should report zero emissions or “not applicable” for any categories that are not applicable.
In some situations, companies may have Scope 3 activities but be unable to estimate emissions due to a lack of data or other limiting factors. For example, companies may find that, based on initial estimates, some Scope 3 activities are expected to be insignificant in size compared to the company’s other sources of emissions (e.g. employee commuting emissions relative to the company’s other total emissions). For these activities, the ability to collect data and influence GHG reductions might also be limited. In such cases, companies may exclude Scope 3 activities from the report provided that any exclusion is disclosed and justified.
Companies should follow the principles of relevance, completeness, accuracy, consistency and transparency when deciding whether to exclude any activities from the Scope 3 inventory. Companies should not exclude any activity that would compromise the relevance of the reported inventory. Companies should ensure that the Scope 3 inventory appropriately reflects the GHG emissions of the company and serves the decision-making needs of users, both internal and external to the company.
In particular, companies should not exclude any activity that is expected to contribute significantly to the company’s total Scope 3 emissions.
The applicability of downstream Scope 3 categories depends on whether products sold by the reporting cement company are final products or intermediate products (e.g. clinker).
Cement companies may report downstream categories required by this Guidance and, if they choose, for other categories. Where a downstream category is reported, cement companies should not selectively report some of the emissions from one of these categories.
Companies are required to disclose and justify any exclusion in the public report. See Table 6 for some examples of criteria to consider when evaluating excluded emissions.
3.3 Other issues to consider
Table 6: Criteria for identifying relevant Scope 3 categories
Size They contribute significantly to the company’s total anticipated Scope 3 emissions. This is typically 5% or more of Scope 1, 2 and 3 emissions, but other factors below may alter this threshold.
Influence There are potential emissions reductions that could be undertaken or influenced by the company.
Risk They contribute to the company’s risk exposure (e.g. climate change-related risks such as financial, regulatory, supply chain, product and customer, litigation and reputational risks).
Stakeholders They are deemed critical by key stakeholders (e.g. customers, suppliers, investors or civil society).
Outsourcing They are outsourced activities previously performed in-house or activities outsourced by the reporting company that are typically performed in-house by other companies in the reporting company’s sector.
Sector guidance They have been identified as significant by sector-specific guidance.
Other They meet any additional criteria for determining relevance developed by the company or industry sector
Criteria Description

3.3.2 BoundariesDetermining which Scope 3 emissions to include in the inventory is a critical decision in the inventory process.
This Guidance allows the company flexibility in choosing which, if any, Scope 3 categories of activities to include in its inventory when the company defines its operational boundaries.
Companies shall account for all Scope 3 emissions as defined in this Guidance and disclose and justify any exclusion. Companies shall account for emissions from each Scope 3 category according to the minimum boundaries. Companies may include emissions from optional activities within each category. Companies shall account for Scope 3 emissions of carbon dioxide (CO2), methane (CH4), nitrous oxide (N2O), hydrofluorocarbons (HFCs), perfluorocarbons (PFCs), nitrogen tri-fluoride (NF3) and sulphur hexafluoride (SF6) if they are emitted in the value chain.
Companies may exclude Scope 3 activities from the inventory, provided that any exclusion is disclosed and justified.
3.3.3 Accounting for emissions and removals from biogenic sources
The GHG Corporate Standard requires that direct CO2 emissions from the combustion of biomass be included in the public report but reported separately from the scopes, rather than included in Scope 1. The separate reporting requirement also applies to Scope 3. Biogenic CO2 emissions (e.g. CO2 from the combustion of biomass) that occur in the reporting company’s value chain are required to be included in the public report but reported separately from Scope 3.
The requirement to report biogenic CO2 emissions separately refers to CO2 emissions from combustion or biodegradation of biomass only, not to emissions of any other GHGs (e.g. CH4 and N2O) or to any GHG emissions that occur in the life cycle of biomass other than from combustion or biodegradation (e.g. GHG emissions from processing or transporting biomass).
Scope 1, 2 and 3 inventories include only emissions, not removals. Any removals (e.g. biological GHG sequestration) may be reported separately from the scopes.
14 Cement Sector Scope 3 GHG Accounting and Reporting Guidance 14
15 Cement Sector Scope 3 GHG Accounting and Reporting Guidance
Category description
This category includes all upstream (i.e. cradle-to-gate) emissions from the production of products purchased or acquired by the reporting company in the reporting year. Products include both goods (tangible products such as raw materials, parts, purchased items, sales-related materials) and services (intangible products such as telecommunications).
This category includes emissions from all purchased goods and services not otherwise included in the other categories of upstream Scope 3 emissions (i.e. Category 2 through Category 8). Specific categories of upstream emissions are reported separately in Category 2 through Category 8 to enhance the transparency and consistency of Scope 3 reports.
Cradle-to-gate emissions include all emissions that occur in the life cycle of purchased products, up to the point of receipt by the reporting company (excluding emissions from sources that are owned or controlled by the reporting company). Cradle-to-gate emissions may include:• Extraction of raw materials (such as calcium, limestone,
aluminium, iron).
• Agricultural activities (such as raw fuels cultivation).
• Land use and land-use change (such as for the extraction of raw materials).
• Manufacturing, production and processing (such as clinker production).
• Generation of electricity consumed by upstream activities (such as the electricity required to extract raw materials).
• Disposal/treatment of waste generated by upstream activities (such as effluent water/pollution caused by the extraction of raw materials).
• Transportation of materials and products between suppliers (such as processing equipment).
• Transportation from the stage of resource extraction to the primary supplier.
• Any other activities prior to acquisition by the reporting company (such as data services, professional services, maintenance services, catering services).
When calculating emissions:• Emissions from extracting and transporting limestone as
recorded into the gross emission, emissions from equipment and on-site vehicles and cement plant power consumption by the CO2 and energy standard should not be double-counted in Scope 3 emissions.
• If the company applies the proportional accounting method, those emissions are allocated into Scope 2 and 3 accordingly, with the proportion.
• Emissions from the extraction and manufacturing, etc. of purchased fuel and energy are calculated under Category 3.
Minimum boundaries
The minimum boundaries are all upstream (cradle-to-gate) emissions of purchased goods and services. If using either an LCA or EEIO method, the scope will be set according to these methods.
4.1 Category 1 Purchased goods and services
4 Detailed guidance by category
16Detailed guidance by category
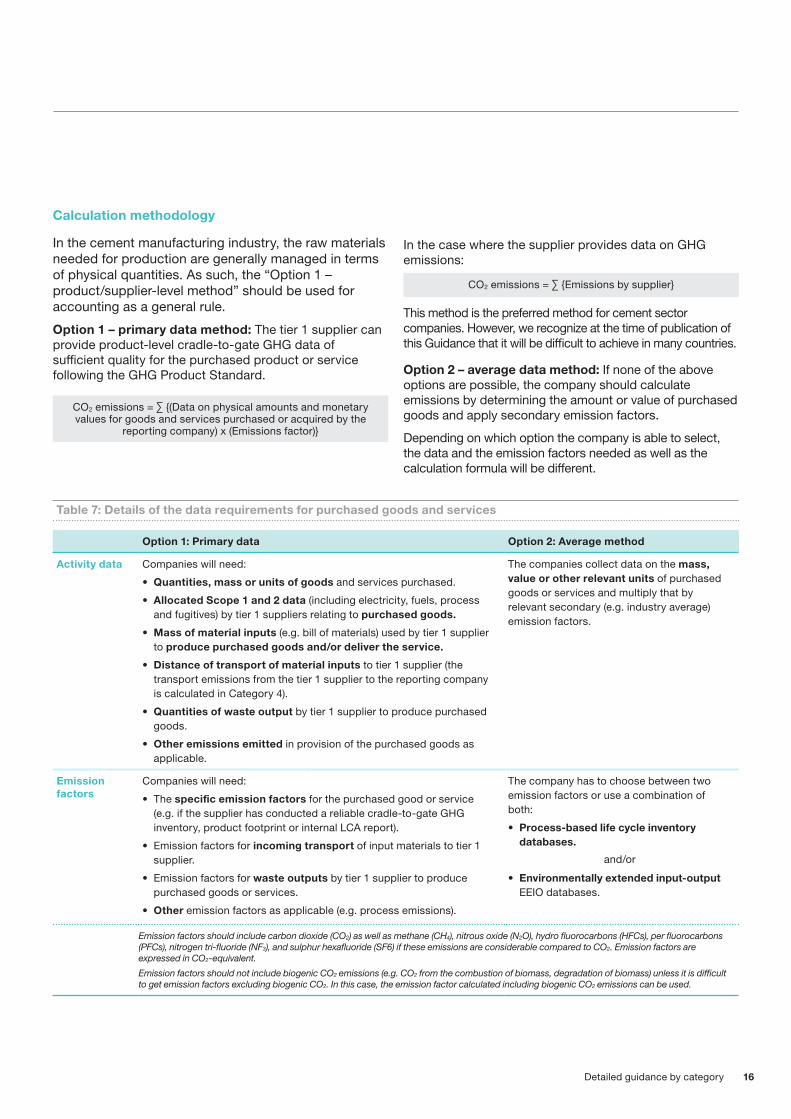
Calculation methodology
In the cement manufacturing industry, the raw materials needed for production are generally managed in terms of physical quantities. As such, the “Option 1 – product/supplier-level method” should be used for accounting as a general rule.
Option 1 – primary data method: The tier 1 supplier can provide product-level cradle-to-gate GHG data of sufficient quality for the purchased product or service following the GHG Product Standard.
Table 7: Details of the data requirements for purchased goods and services
Option 1: Primary data Option 2: Average method
Activity data Companies will need:
• Quantities, mass or units of goods and services purchased.
• Allocated Scope 1 and 2 data (including electricity, fuels, process and fugitives) by tier 1 suppliers relating to purchased goods.
• Mass of material inputs (e.g. bill of materials) used by tier 1 supplier to produce purchased goods and/or deliver the service.
• Distance of transport of material inputs to tier 1 supplier (the transport emissions from the tier 1 supplier to the reporting company is calculated in Category 4).
• Quantities of waste output by tier 1 supplier to produce purchased goods.
• Other emissions emitted in provision of the purchased goods as applicable.
The companies collect data on the mass, value or other relevant units of purchased goods or services and multiply that by relevant secondary (e.g. industry average) emission factors.
Emission factors
Companies will need:
• The specific emission factors for the purchased good or service (e.g. if the supplier has conducted a reliable cradle-to-gate GHG inventory, product footprint or internal LCA report).
• Emission factors for incoming transport of input materials to tier 1 supplier.
• Emission factors for waste outputs by tier 1 supplier to produce purchased goods or services.
• Other emission factors as applicable (e.g. process emissions).
The company has to choose between two emission factors or use a combination of both:
• Process-based life cycle inventory databases.
and/or
• Environmentally extended input-output EEIO databases.
Emission factors should include carbon dioxide (CO2) as well as methane (CH4), nitrous oxide (N2O), hydro fluorocarbons (HFCs), per fluorocarbons (PFCs), nitrogen tri-fluoride (NF3), and sulphur hexafluoride (SF6) if these emissions are considerable compared to CO2. Emission factors are expressed in CO2-equivalent.
Emission factors should not include biogenic CO2 emissions (e.g. CO2 from the combustion of biomass, degradation of biomass) unless it is difficult to get emission factors excluding biogenic CO2. In this case, the emission factor calculated including biogenic CO2 emissions can be used.
In the case where the supplier provides data on GHG emissions:
This method is the preferred method for cement sector companies. However, we recognize at the time of publication of this Guidance that it will be difficult to achieve in many countries.
Option 2 – average data method: If none of the above options are possible, the company should calculate emissions by determining the amount or value of purchased goods and apply secondary emission factors.
Depending on which option the company is able to select, the data and the emission factors needed as well as the calculation formula will be different.
CO2 emissions = ∑ {Emissions by supplier}
CO2 emissions = ∑ {(Data on physical amounts and monetary values for goods and services purchased or acquired by the
reporting company) x (Emissions factor)}
17 Cement Sector Scope 3 GHG Accounting and Reporting Guidance
Data collection guidance
The reporting company may request the following information from tier 1 suppliers to assist in calculation:
• Internal data systems (e.g. bill of materials, freight distance of incoming raw materials) of tier 1 suppliers.
• GHG inventory reports of tier 1 suppliers.
In some life cycle databases, the cradle-to-gate emission factor of material inputs includes the transport, energy and waste emissions associated with the input material. In such cases, those associated emissions do not need to be calculated separately.
Companies that have a breakdown of primary data for purchased goods and services either separately or combined may choose to use the full calculation methodology to suit their data set. The full calculation methodology is provided in Appendix 1.
Data source for activity data:• Internal data systems (e.g. bill of materials).
• Purchasing records.
• Service suppliers.
• Internal IT systems.
The Scope 1 and 2 emissions of a supplier may be allocated by reference to total energy consumed for a given year, total number of man-hours worked and/or the number of man-hours it took to complete the service.
If a company does not know either the mass and type of products purchased or the amount spent on products purchased, the following estimates can be used; however, they are expected to increase the level of uncertainty of the calculated emissions:• Industry-average activity data from associations or
databases; and/or
• Proxy or extrapolated data from other purchased products in a company’s Scope 3 Inventory.
Data sources for emission factors include:• Process life cycle databases.
• Environmentally EEIO databases.
• Industry associations.
• Reporting company or supplier developed emission factors.
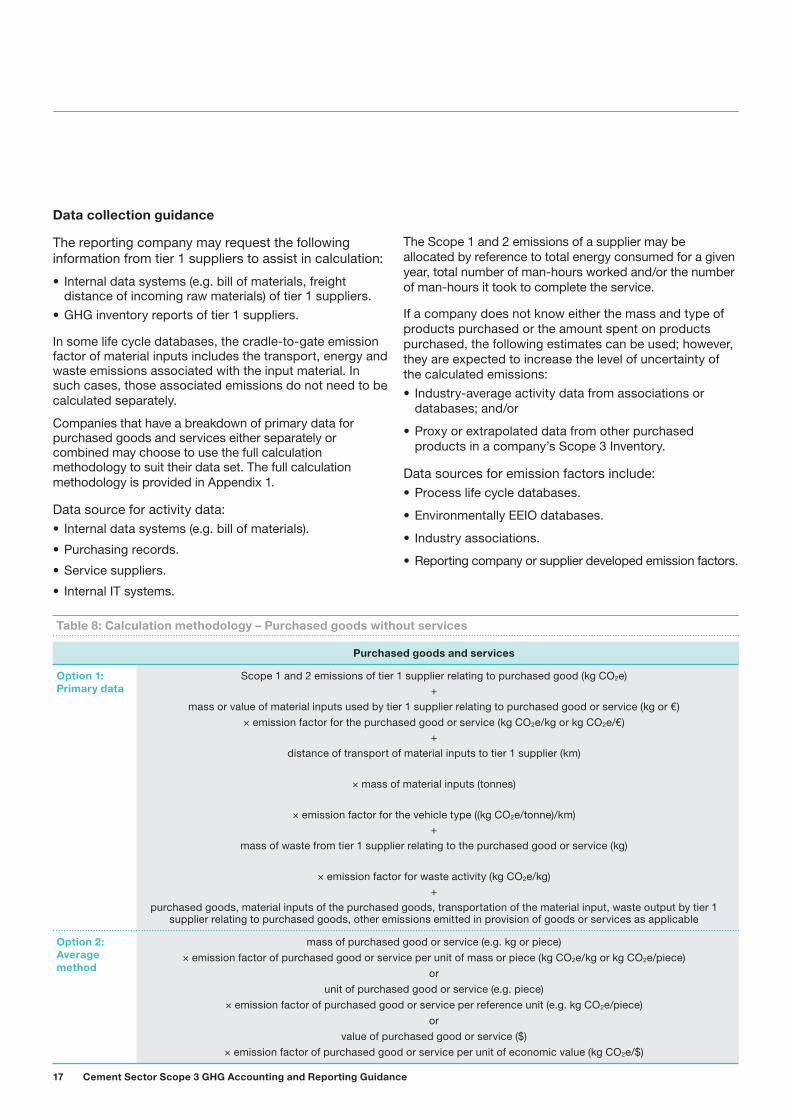
Table 8: Calculation methodology – Purchased goods without services
Purchased goods and services
Option 1: Primary data
Scope 1 and 2 emissions of tier 1 supplier relating to purchased good (kg CO2e)+
mass or value of material inputs used by tier 1 supplier relating to purchased good or service (kg or €)× emission factor for the purchased good or service (kg CO2e/kg or kg CO2e/€)
+distance of transport of material inputs to tier 1 supplier (km)
× mass of material inputs (tonnes)
× emission factor for the vehicle type ((kg CO2e/tonne)/km)+
mass of waste from tier 1 supplier relating to the purchased good or service (kg)
× emission factor for waste activity (kg CO2e/kg)+
purchased goods, material inputs of the purchased goods, transportation of the material input, waste output by tier 1 supplier relating to purchased goods, other emissions emitted in provision of goods or services as applicable
Option 2: Average method
mass of purchased good or service (e.g. kg or piece) × emission factor of purchased good or service per unit of mass or piece (kg CO2e/kg or kg CO2e/piece)
orunit of purchased good or service (e.g. piece)
× emission factor of purchased good or service per reference unit (e.g. kg CO2e/piece)or
value of purchased good or service ($) × emission factor of purchased good or service per unit of economic value (kg CO2e/$)
18Detailed guidance by category
Category description
This category consists of all emissions associated with the extraction, production and transportation of capital goods purchased or acquired in the reporting year. This includes all upstream (cradle-to-gate) emissions. For example, this might include:
• Kilns
• Operational vehicles
• Heavy duty material (pipes, cables, etc.)
• Engines
• IT equipment
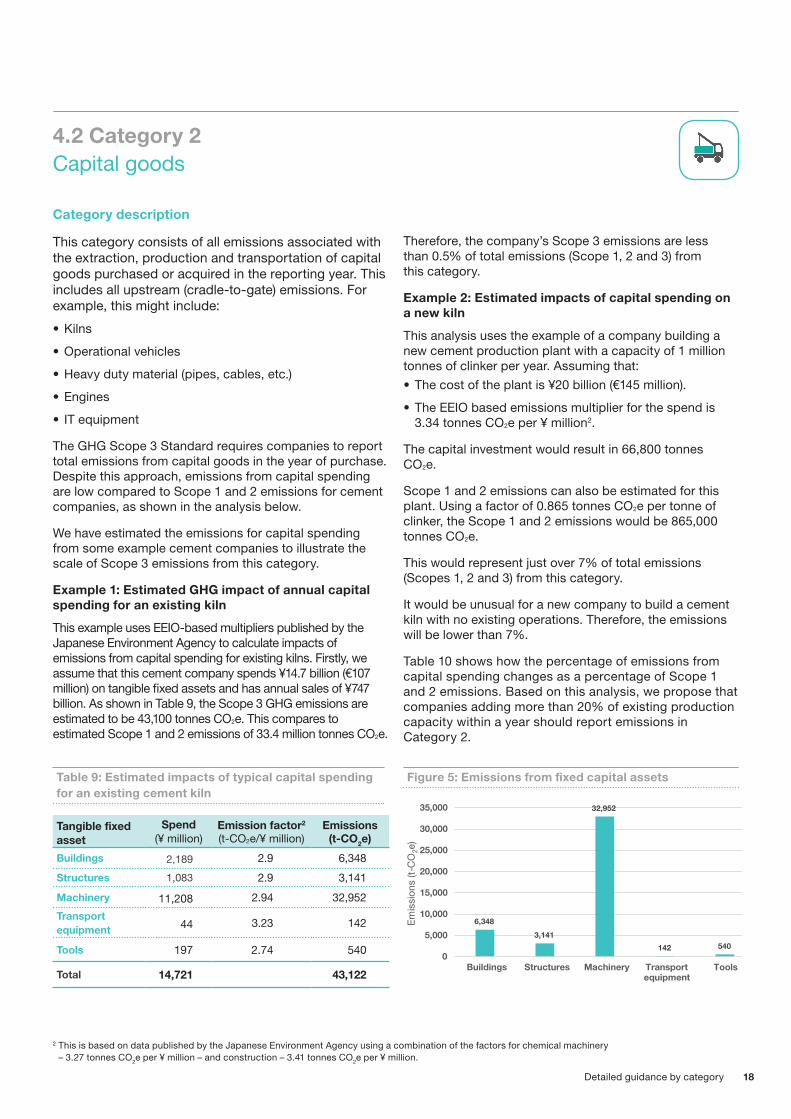
The GHG Scope 3 Standard requires companies to report total emissions from capital goods in the year of purchase. Despite this approach, emissions from capital spending are low compared to Scope 1 and 2 emissions for cement companies, as shown in the analysis below.
We have estimated the emissions for capital spending from some example cement companies to illustrate the scale of Scope 3 emissions from this category.
Example 1: Estimated GHG impact of annual capital spending for an existing kiln
This example uses EEIO-based multipliers published by the Japanese Environment Agency to calculate impacts of emissions from capital spending for existing kilns. Firstly, we assume that this cement company spends ¥14.7 billion (€107 million) on tangible fixed assets and has annual sales of ¥747 billion. As shown in Table 9, the Scope 3 GHG emissions are estimated to be 43,100 tonnes CO2e. This compares to estimated Scope 1 and 2 emissions of 33.4 million tonnes CO2e.
Therefore, the company’s Scope 3 emissions are less than 0.5% of total emissions (Scope 1, 2 and 3) from this category.
Example 2: Estimated impacts of capital spending on a new kiln
This analysis uses the example of a company building a new cement production plant with a capacity of 1 million tonnes of clinker per year. Assuming that: • The cost of the plant is ¥20 billion (€145 million).
• The EEIO based emissions multiplier for the spend is 3.34 tonnes CO2e per ¥ million2.
The capital investment would result in 66,800 tonnes CO2e.
Scope 1 and 2 emissions can also be estimated for this plant. Using a factor of 0.865 tonnes CO2e per tonne of clinker, the Scope 1 and 2 emissions would be 865,000 tonnes CO2e.
This would represent just over 7% of total emissions (Scopes 1, 2 and 3) from this category.
It would be unusual for a new company to build a cement kiln with no existing operations. Therefore, the emissions will be lower than 7%.
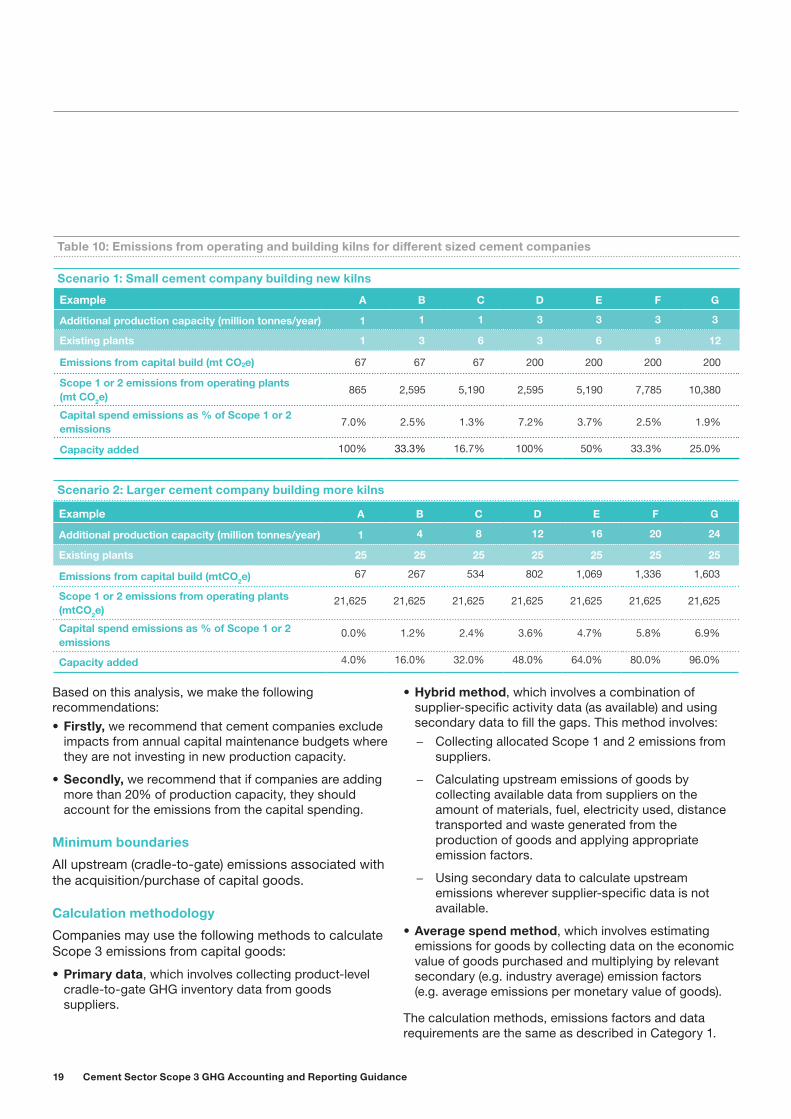
Table 10 shows how the percentage of emissions from capital spending changes as a percentage of Scope 1 and 2 emissions. Based on this analysis, we propose that companies adding more than 20% of existing production capacity within a year should report emissions in Category 2.
Tangible fixed asset
Spend (¥ million)
Emission factor2 (t-CO2e/¥ million)
Emissions (t-CO2e)
Buildings 2,189 2.9 6,348
Structures 1,083 2.9 3,141
Machinery 11,208 2.94 32,952
Transport equipment 44 3.23 142
Tools 197 2.74 540
Total 14,721 43,122
Table 9: Estimated impacts of typical capital spending for an existing cement kiln
2 This is based on data published by the Japanese Environment Agency using a combination of the factors for chemical machinery – 3.27 tonnes CO2e per ¥ million – and construction – 3.41 tonnes CO2e per ¥ million.
Figure 5: Emissions from fixed capital assets
6,348
3,141
32,952
142 5400
5,000
10,000
15,000
20,000
25,000
30,000
35,000
Buildings Structures Machinery Transportequipment
Tools
Emis
sion
s (t
-CO
2e)
4.2 Category 2 Capital goods
19 Cement Sector Scope 3 GHG Accounting and Reporting Guidance
Example A B C D E F G
Additional production capacity (million tonnes/year) 1 1 1 3 3 3 3
Existing plants 1 3 6 3 6 9 12
Emissions from capital build (mt CO2e) 67 67 67 200 200 200 200
Scope 1 or 2 emissions from operating plants (mt CO2e)
865 2,595 5,190 2,595 5,190 7,785 10,380
Capital spend emissions as % of Scope 1 or 2 emissions
7.0% 2.5% 1.3% 7.2% 3.7% 2.5% 1.9%
Capacity added 100% 33.3% 16.7% 100% 50% 33.3% 25.0%
Scenario 1: Small cement company building new kilns
Table 10: Emissions from operating and building kilns for different sized cement companies
Example A B C D E F G
Additional production capacity (million tonnes/year) 1 4 8 12 16 20 24
Existing plants 25 25 25 25 25 25 25
Emissions from capital build (mtCO2e) 67 267 534 802 1,069 1,336 1,603
Scope 1 or 2 emissions from operating plants (mtCO2e)
21,625 21,625 21,625 21,625 21,625 21,625 21,625
Capital spend emissions as % of Scope 1 or 2 emissions
0.0% 1.2% 2.4% 3.6% 4.7% 5.8% 6.9%
Capacity added 4.0% 16.0% 32.0% 48.0% 64.0% 80.0% 96.0%
Scenario 2: Larger cement company building more kilns
Based on this analysis, we make the following recommendations:• Firstly, we recommend that cement companies exclude
impacts from annual capital maintenance budgets where they are not investing in new production capacity.
• Secondly, we recommend that if companies are adding more than 20% of production capacity, they should account for the emissions from the capital spending.
Minimum boundaries
All upstream (cradle-to-gate) emissions associated with the acquisition/purchase of capital goods.
Calculation methodology
Companies may use the following methods to calculate Scope 3 emissions from capital goods:
• Primary data, which involves collecting product-level cradle-to-gate GHG inventory data from goods suppliers.
• Hybrid method, which involves a combination of supplier-specific activity data (as available) and using secondary data to fill the gaps. This method involves:
– Collecting allocated Scope 1 and 2 emissions from suppliers.
– Calculating upstream emissions of goods by collecting available data from suppliers on the amount of materials, fuel, electricity used, distance transported and waste generated from the production of goods and applying appropriate emission factors.
– Using secondary data to calculate upstream emissions wherever supplier-specific data is not available.
• Average spend method, which involves estimating emissions for goods by collecting data on the economic value of goods purchased and multiplying by relevant secondary (e.g. industry average) emission factors (e.g. average emissions per monetary value of goods).
The calculation methods, emissions factors and data requirements are the same as described in Category 1.
20Detailed guidance by category
Category description
This category consists of upstream emissions (resource extraction, production and transportation) from fuel purchased by the reporting company and upstream emissions (resource extraction, production and transportation) from the manufacturing process of electricity and heat (steam, hot water and cold water) purchased by the reporting company in the reporting year subject to accounting.
Examples of included goods:• Fuel used in cement manufacturing at the reporting
company (coal, heavy oil, oil coke) – The scope of accounting includes emissions at
stages that are upstream from the reporting company, including fuel resource extraction, refining and transportation. Transportation of fuel is included under Category 3, not Category 4.
• Electricity and heat used in cement manufacturing at the reporting company
– The scope of accounting consists of emissions upstream of the suppliers (resource extraction, production and transportation of energy used in the generation of electricity and heat). Emissions from the use of electricity and heat purchased or manufactured by the reporting company correspond to Scope 1 or 2 emissions and are not included under Category 3.
Category 3 excludes emissions from the combustion of fuels or electricity consumed by the reporting company since they are already included in Scope 1 or 2. • Scope 1 includes emissions from the combustion of
fuels by sources owned or controlled by the reporting company.
• Scope 2 includes the emissions from the combustion of fuels to generate electricity, steam, heating and cooling purchased and consumed by the reporting company.
For fuels from waste materials, the approach should be consistent with the product category rules in the environmental product declaration, such as UN CPC 375 for concrete.
In summary, this involves the following approach:• Where there is no gate fee, then ideally companies
would use economic allocation of the process emissions of the material. (In Asia, companies will typically agree that the emissions are reported by the company producing the material).
• In practice, the use of these fuels is limited and the data on the processes difficult to obtain. If no specific data is available on the fuel type, we recommend companies use the average emissions factor for waste oils to calculate an initial estimate:
– 0.03228 kg CO2e per kWh gross calorific value or
– 0.03434 kg CO2e per kWh net calorific value or
– 388.4 kg CO2e per tonne.
Minimum boundaries• For upstream emissions of purchased fuels: All
upstream (cradle-to-gate) emissions of purchased fuels (from raw material extraction up to the point of, but excluding combustion).
• For upstream emissions of purchased electricity: All upstream (cradle-to-gate) emissions of purchased fuels (from raw material extraction up to the point of, but excluding, combustion by a power generator).
• For transmission and distribution losses: All upstream (cradle-to-gate) emissions of energy consumed in a T&D system, including emissions from combustion.
4.3 Category 3 Fuel and energy-related activities
21 Cement Sector Scope 3 GHG Accounting and Reporting Guidance
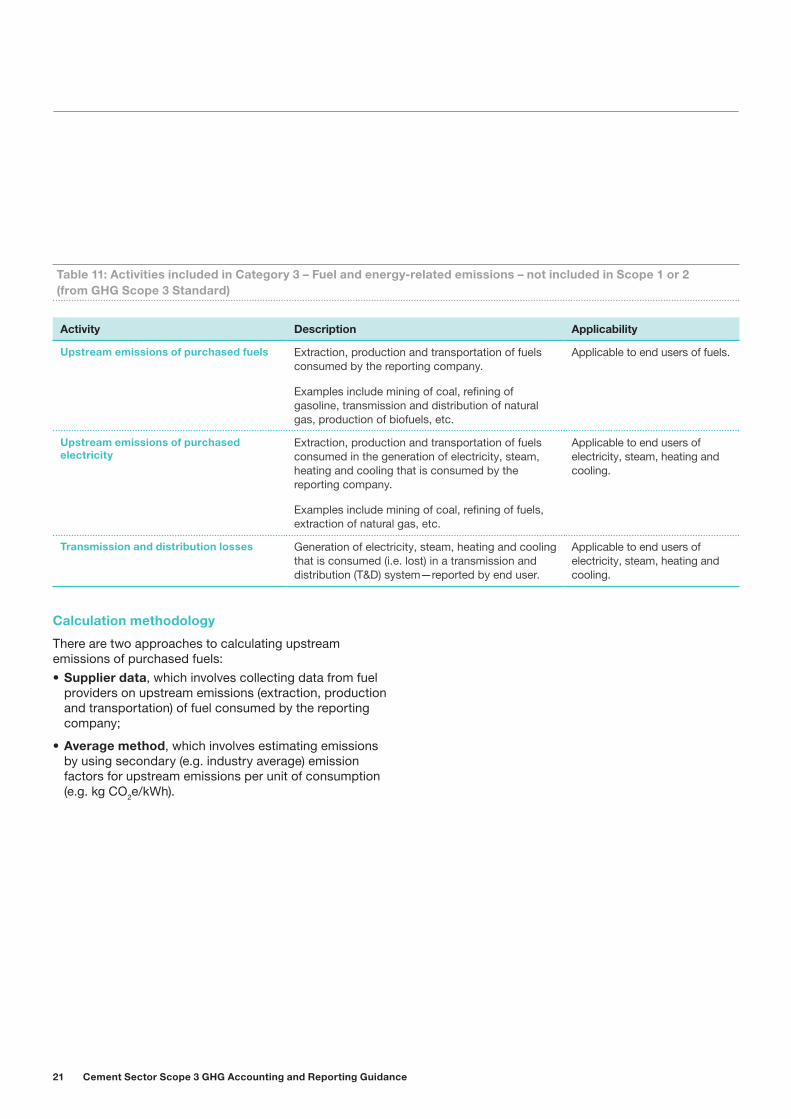
Activity Description Applicability
Upstream emissions of purchased fuels Extraction, production and transportation of fuels consumed by the reporting company.
Examples include mining of coal, refining of gasoline, transmission and distribution of natural gas, production of biofuels, etc.
Applicable to end users of fuels.
Upstream emissions of purchased electricity
Extraction, production and transportation of fuels consumed in the generation of electricity, steam, heating and cooling that is consumed by the reporting company.
Examples include mining of coal, refining of fuels, extraction of natural gas, etc.
Applicable to end users of electricity, steam, heating and cooling.
Transmission and distribution losses Generation of electricity, steam, heating and cooling that is consumed (i.e. lost) in a transmission and distribution (T&D) system—reported by end user.
Applicable to end users of electricity, steam, heating and cooling.
Table 11: Activities included in Category 3 – Fuel and energy-related emissions – not included in Scope 1 or 2 (from GHG Scope 3 Standard)
Calculation methodology
There are two approaches to calculating upstream emissions of purchased fuels:• Supplier data, which involves collecting data from fuel
providers on upstream emissions (extraction, production and transportation) of fuel consumed by the reporting company;
• Average method, which involves estimating emissions by using secondary (e.g. industry average) emission factors for upstream emissions per unit of consumption (e.g. kg CO2e/kWh).
22Detailed guidance by category
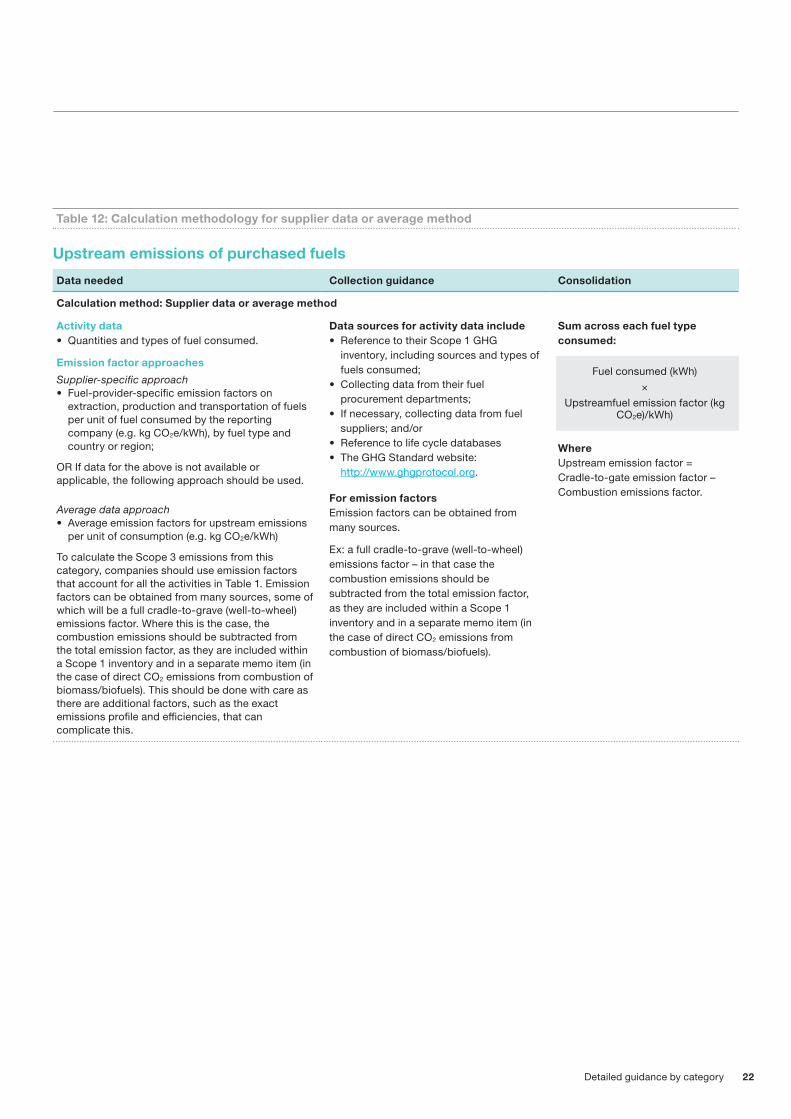
Table 12: Calculation methodology for supplier data or average method
Data needed Collection guidance Consolidation
Calculation method: Supplier data or average method
Activity data• Quantities and types of fuel consumed.
Emission factor approaches
Supplier-specific approach• Fuel-provider-specific emission factors on
extraction, production and transportation of fuels per unit of fuel consumed by the reporting company (e.g. kg CO2e/kWh), by fuel type and country or region;
OR If data for the above is not available or applicable, the following approach should be used.
Average data approach• Average emission factors for upstream emissions
per unit of consumption (e.g. kg CO2e/kWh)
To calculate the Scope 3 emissions from this category, companies should use emission factors that account for all the activities in Table 1. Emission factors can be obtained from many sources, some of which will be a full cradle-to-grave (well-to-wheel) emissions factor. Where this is the case, the combustion emissions should be subtracted from the total emission factor, as they are included within a Scope 1 inventory and in a separate memo item (in the case of direct CO2 emissions from combustion of biomass/biofuels). This should be done with care as there are additional factors, such as the exact emissions profile and efficiencies, that can complicate this.
Data sources for activity data include• Reference to their Scope 1 GHG
inventory, including sources and types of fuels consumed;
• Collecting data from their fuel procurement departments;
• If necessary, collecting data from fuel suppliers; and/or
• Reference to life cycle databases• The GHG Standard website:
http://www.ghgprotocol.org.
For emission factors Emission factors can be obtained from many sources.
Ex: a full cradle-to-grave (well-to-wheel) emissions factor – in that case the combustion emissions should be subtracted from the total emission factor, as they are included within a Scope 1 inventory and in a separate memo item (in the case of direct CO2 emissions from combustion of biomass/biofuels).
Sum across each fuel type consumed:
Fuel consumed (kWh) ×
Upstreamfuel emission factor (kg CO2e)/kWh)
Where Upstream emission factor = Cradle-to-gate emission factor – Combustion emissions factor.
Upstream emissions of purchased fuels
23 Cement Sector Scope 3 GHG Accounting and Reporting Guidance
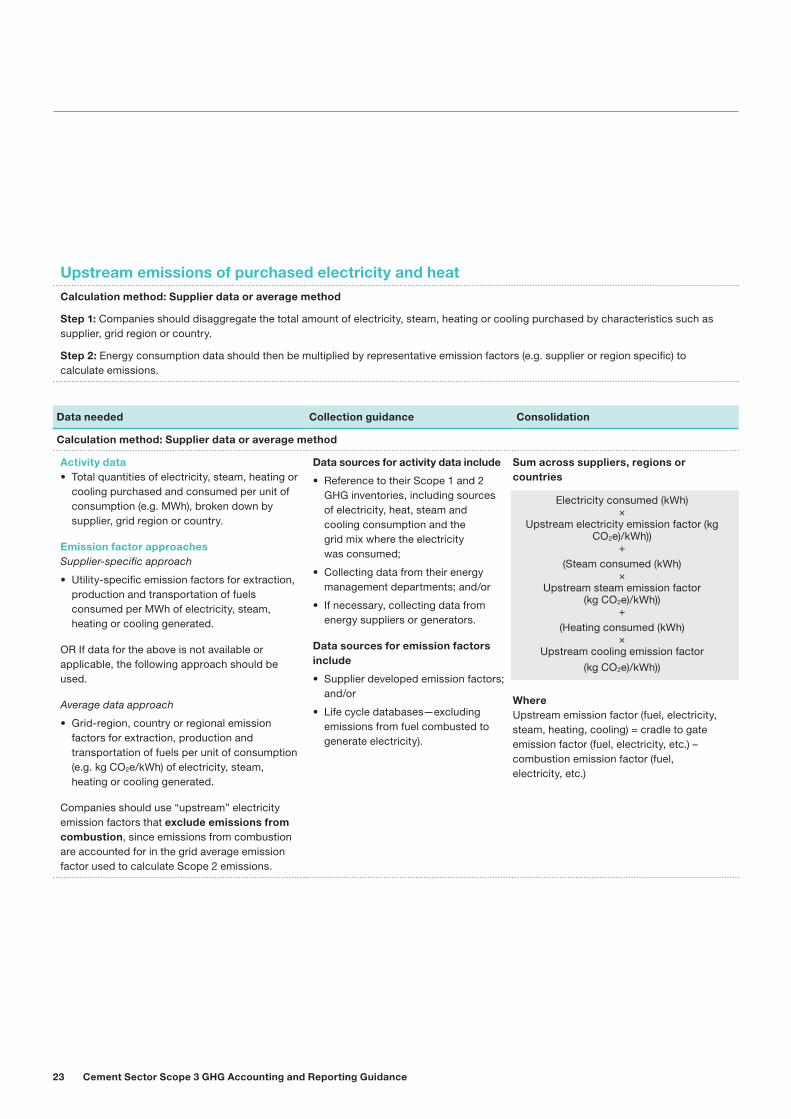
Data needed Collection guidance Consolidation
Calculation method: Supplier data or average method
Activity data• Total quantities of electricity, steam, heating or
cooling purchased and consumed per unit of consumption (e.g. MWh), broken down by supplier, grid region or country.
Emission factor approachesSupplier-specific approach
• Utility-specific emission factors for extraction, production and transportation of fuels consumed per MWh of electricity, steam, heating or cooling generated.
OR If data for the above is not available or applicable, the following approach should be used.
Average data approach
• Grid-region, country or regional emission factors for extraction, production and transportation of fuels per unit of consumption (e.g. kg CO2e/kWh) of electricity, steam, heating or cooling generated.
Companies should use “upstream” electricity emission factors that exclude emissions from combustion, since emissions from combustion are accounted for in the grid average emission factor used to calculate Scope 2 emissions.
Data sources for activity data include
• Reference to their Scope 1 and 2 GHG inventories, including sources of electricity, heat, steam and cooling consumption and the grid mix where the electricity was consumed;
• Collecting data from their energy management departments; and/or
• If necessary, collecting data from energy suppliers or generators.
Data sources for emission factors include
• Supplier developed emission factors; and/or
• Life cycle databases—excluding emissions from fuel combusted to generate electricity).
Sum across suppliers, regions or countries
Electricity consumed (kWh) ×
Upstream electricity emission factor (kg CO2e)/kWh))
+(Steam consumed (kWh)
× Upstream steam emission factor
(kg CO2e)/kWh)) +
(Heating consumed (kWh) ×
Upstream cooling emission factor (kg CO2e)/kWh))
Where Upstream emission factor (fuel, electricity, steam, heating, cooling) = cradle to gate emission factor (fuel, electricity, etc.) – combustion emission factor (fuel, electricity, etc.)
Upstream emissions of purchased electricity and heatCalculation method: Supplier data or average method
Step 1: Companies should disaggregate the total amount of electricity, steam, heating or cooling purchased by characteristics such as supplier, grid region or country.
Step 2: Energy consumption data should then be multiplied by representative emission factors (e.g. supplier or region specific) to calculate emissions.
24Detailed guidance by category
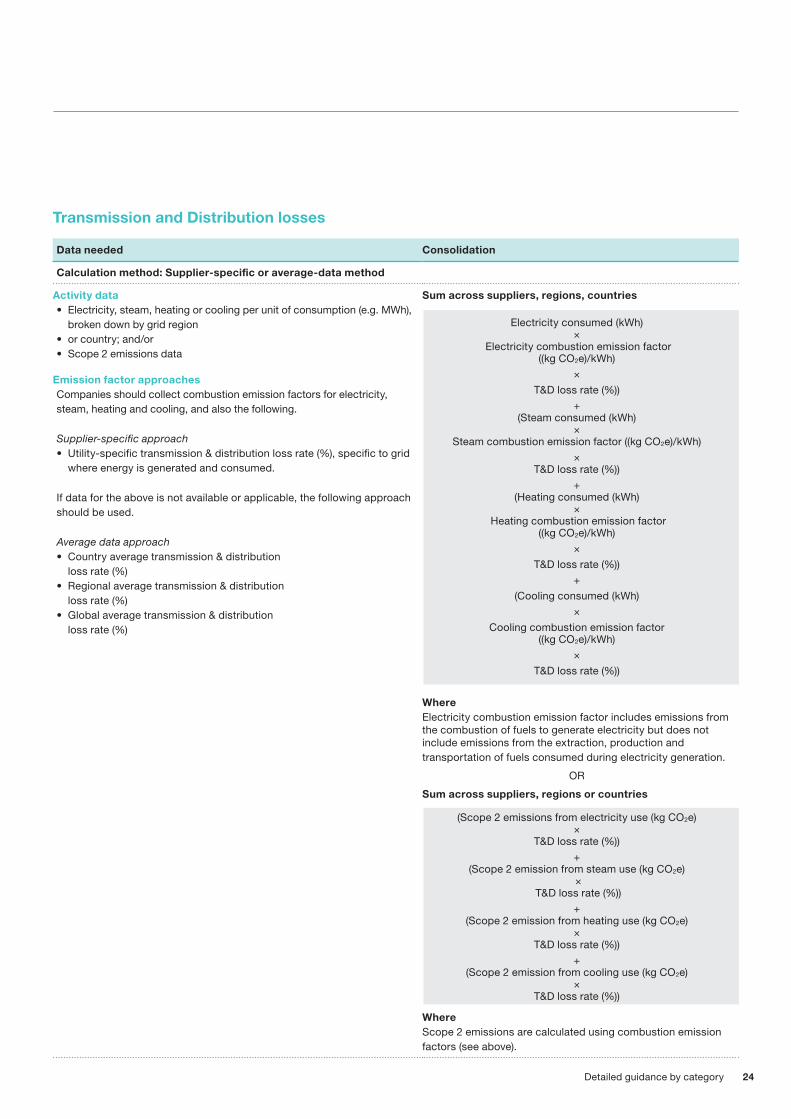
Data needed Consolidation
Calculation method: Supplier-specific or average-data method
Activity data• Electricity, steam, heating or cooling per unit of consumption (e.g. MWh),
broken down by grid region• or country; and/or• Scope 2 emissions data
Emission factor approachesCompanies should collect combustion emission factors for electricity, steam, heating and cooling, and also the following.
Supplier-specific approach• Utility-specific transmission & distribution loss rate (%), specific to grid
where energy is generated and consumed.
If data for the above is not available or applicable, the following approach should be used.
Average data approach• Country average transmission & distribution
loss rate (%)• Regional average transmission & distribution
loss rate (%)• Global average transmission & distribution
loss rate (%)
Sum across suppliers, regions, countries
Electricity consumed (kWh) ×
Electricity combustion emission factor ((kg CO2e)/kWh)
× T&D loss rate (%))
+ (Steam consumed (kWh)
× Steam combustion emission factor ((kg CO2e)/kWh)
× T&D loss rate (%))
+ (Heating consumed (kWh)
× Heating combustion emission factor
((kg CO2e)/kWh) ×
T&D loss rate (%))+
(Cooling consumed (kWh) ×
Cooling combustion emission factor ((kg CO2e)/kWh)
× T&D loss rate (%))
Where Electricity combustion emission factor includes emissions from the combustion of fuels to generate electricity but does not include emissions from the extraction, production and transportation of fuels consumed during electricity generation.
OR
Sum across suppliers, regions or countries
(Scope 2 emissions from electricity use (kg CO2e) ×
T&D loss rate (%))+
(Scope 2 emission from steam use (kg CO2e) ×
T&D loss rate (%))+
(Scope 2 emission from heating use (kg CO2e) ×
T&D loss rate (%))+
(Scope 2 emission from cooling use (kg CO2e) ×
T&D loss rate (%))
Where Scope 2 emissions are calculated using combustion emission factors (see above).
Transmission and Distribution losses
25 Cement Sector Scope 3 GHG Accounting and Reporting Guidance
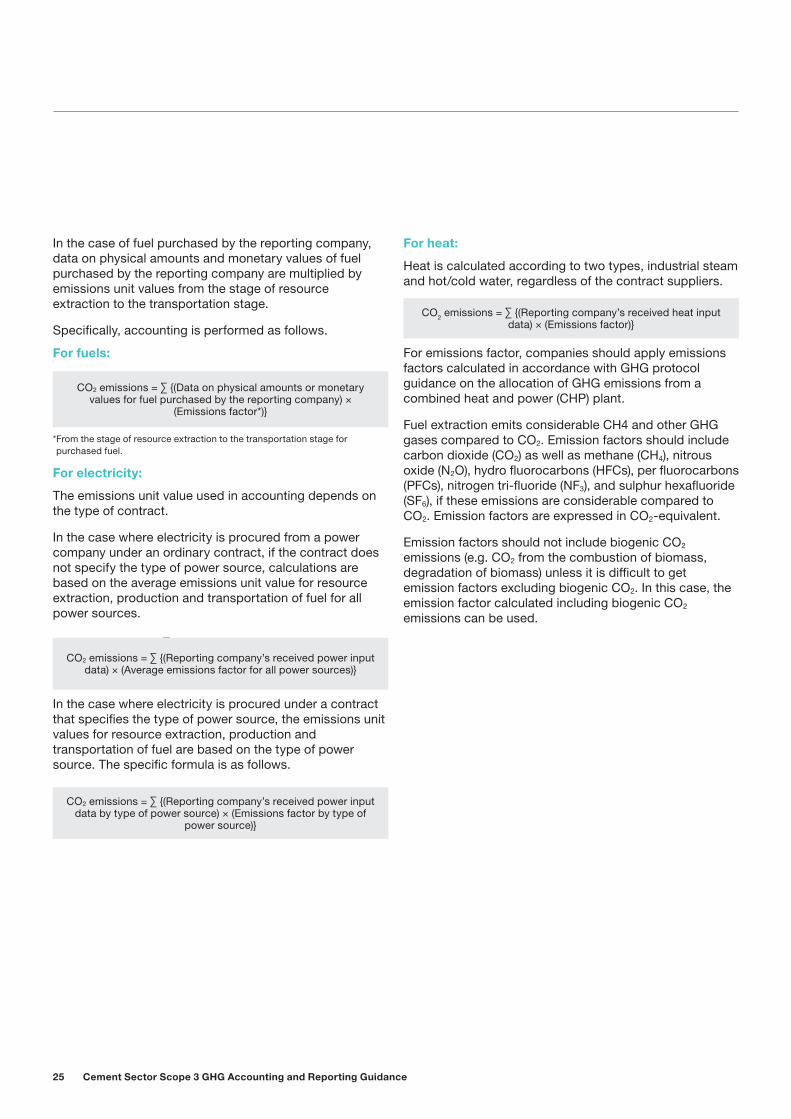
In the case of fuel purchased by the reporting company, data on physical amounts and monetary values of fuel purchased by the reporting company are multiplied by emissions unit values from the stage of resource extraction to the transportation stage.
Specifically, accounting is performed as follows.
For fuels:
* From the stage of resource extraction to the transportation stage for purchased fuel.
For electricity:
The emissions unit value used in accounting depends on the type of contract.
In the case where electricity is procured from a power company under an ordinary contract, if the contract does not specify the type of power source, calculations are based on the average emissions unit value for resource extraction, production and transportation of fuel for all power sources.
• CO2 emissions = ∑ {(Reporting company’s received power input data) × (Average emissions factor for all power sources)}
In the case where electricity is procured under a contract that specifies the type of power source, the emissions unit values for resource extraction, production and transportation of fuel are based on the type of power source. The specific formula is as follows.
• CO2 emissions = ∑ {(Reporting company’s received power input data by type of power source) × (Emissions factor by type of power source)}
For heat:
Heat is calculated according to two types, industrial steam and hot/cold water, regardless of the contract suppliers.
• CO2 emissions = ∑ {(Reporting company’s received heat input data) × (Emissions factor)}
For emissions factor, companies should apply emissions factors calculated in accordance with GHG protocol guidance on the allocation of GHG emissions from a combined heat and power (CHP) plant.
Fuel extraction emits considerable CH4 and other GHG gases compared to CO2. Emission factors should include carbon dioxide (CO2) as well as methane (CH4), nitrous oxide (N2O), hydro fluorocarbons (HFCs), per fluorocarbons (PFCs), nitrogen tri-fluoride (NF3), and sulphur hexafluoride (SF6), if these emissions are considerable compared to CO2. Emission factors are expressed in CO2-equivalent.
Emission factors should not include biogenic CO2 emissions (e.g. CO2 from the combustion of biomass, degradation of biomass) unless it is difficult to get emission factors excluding biogenic CO2. In this case, the emission factor calculated including biogenic CO2 emissions can be used.
CO2 emissions = ∑ {(Data on physical amounts or monetary values for fuel purchased by the reporting company) ×
(Emissions factor*)}
CO2 emissions = ∑ {(Reporting company’s received power input data) × (Average emissions factor for all power sources)}
CO2 emissions = ∑ {(Reporting company’s received power input data by type of power source) × (Emissions factor by type of
power source)}
CO2 emissions = ∑ {(Reporting company’s received heat input data) × (Emissions factor)}
26Detailed guidance by category
Category description
Category 4 includes emissions from:
• Transportation and distribution of products purchased in the reporting period, between a company’s tier 1 suppliers and its own operations in vehicles not owned or operated by the reporting company (including multi-modal shipping where multiple carriers are involved in the delivery of a product, but excluding fuel and energy products);
• Third-party transportation and distribution services purchased by the reporting company in the reporting year (either directly or through an intermediary), including inbound logistics, outbound logistics (e.g. of sold products), and third-party transportation and distribution between a company’s own facilities.
Emissions may arise from the following transportation and distribution activities throughout the value chain:• Air transport
• Rail transport
• Road transport
• Marine transport
• Storage of purchased products in warehouses, distribution centers and retail facilities.
The CSI Cement CO2 and Energy Protocol for Scope 1 and 2 does not require companies to report transport emissions on the grounds of relevance. Companies should report on all upstream transport emissions in their Scope 1 or Scope 3 reports. Any emissions not included in the Scope 1 report should be included in the Scope 3 report.
Table 12 shows the scope and category of emissions where each type of transportation and distribution activity should be accounted for.
Transportation and distribution activity in the value chain Scope and category
Transportation and distribution in vehicles and facilities owned or controlled by the reporting company.
Scope 1 (for fuel use) or Scope 2 (for electricity use).
Transportation and distribution in vehicles and facilities leased by and operated by the reporting company (and not already included in Scope 1 or 2).
Scope 3, Category 8 (Upstream leased assets).
Transportation and distribution of purchased products, upstream of the reporting company’s tier 1 suppliers (e.g. transportation between a company’s tier 2 and tier 1 suppliers).
Scope 3, Category 1 (Purchased goods and services), since emissions from transportation are already included in the cradle-to-gate emissions of purchased products. These emissions are not required to be reported separately from Category 1.
Production of vehicles (e.g. ships, trucks, planes) purchased or acquired by the reporting company.
Account for the upstream (i.e. cradle-to-gate) emissions associated with manufacturing vehicles in Scope 3, Category 2 (Capital goods).
Transportation of fuels and energy consumed by the reporting company. Scope 3, Category 3 (Fuel and energy-related emissions) (not included in Scope 1 or 2).
Transportation and distribution of products purchased by the reporting company between a company’s tier 1 suppliers and its own operations (in vehicles and facilities not owned or controlled by the reporting company); transportation and distribution services purchased by the reporting company in the reporting year (either directly or through an intermediary), including inbound logistics, outbound logistics (e.g. of sold products), and transportation and distribution between a company’s own facilities (in vehicles and facilities not owned or controlled by the reporting company).
Scope 3, Category 4 (Upstream transportation and distribution).
Transportation and distribution of products sold by the reporting company between the reporting company’s operations and the end consumer (if not paid for by the reporting company), including retail and storage (in vehicles and facilities not owned or controlled by the reporting company).
Scope 3, Category 9 (Downstream transportation and distribution).
Table 13: Scope and category of emissions
4.4 Category 4 Upstream transportation and distribution
27 Cement Sector Scope 3 GHG Accounting and Reporting Guidance
Minimum boundaries
Companies should report all Scope 1 and 2 emissions of transportation and distribution providers that occur during the use of vehicles and facilities (e.g. from energy use) before the point of sale.
Companies may also report the life cycle emissions from the extraction and production of fuels.
TransportationCalculation methodology
Companies may use the following methods to calculate Scope 3 emissions from transportation:
• Distance-based method, which involves determining the mass, distance and mode of each shipment, then applying the appropriate mass-distance emission factor for the vehicle used.
• Fuel-based method, which involves determining the amount of fuel consumed (i.e. Scope 1 and 2 emissions of transport providers) and applying the appropriate emission factor for that fuel.
• Spend-based method, which involves determining the amount of money spent on each mode of business travel transport and applying secondary (EEIO) emission factors.
The GHG Standard has a calculation tool for transportation that uses a combination of the fuel-based and distance-based methods. This combination is used because CO2 is better estimated from fuel use and CH4 and N2O are better estimated from distance travelled. The tool uses fuel-efficiency ratios to convert either type of activity data (fuel or distance) supplied by the user into either fuel or distance depending on the GHG being calculated. The calculation tool (“GHG emissions from transport or mobile sources”) is available at the GHG Standard website: http://www.ghgprotocol.org/calculation-tools/all-tools. It is important to note that the calculation tool was originally developed to calculate an organization’s Scope 1 emissions (i.e. emissions from vehicles that the organization owns and operates). Therefore, the emission factors that pre-populate the calculation tool are
combustion emission factors. When calculating emissions from transportation in Scope 3, companies should use life cycle emission factors (see “Energy emission factors in Scope 3 accounting” on page 14 of Technical Guidance for Calculating Scope 3 Emissions – www.ghgprotocol.org/sites/default/files/ghgp/Scope3_Calculation_Guidance.pdf. If using the GHG Standard transport calculation tool to calculate Scope 3 emissions, companies should customize the tool by entering life cycle emission factors from sources listed on page 45 of the calculation tool.The fuel-based method is preferred if data is available for the types and quantities/cost of fuels for either transportation provided or the transportation of purchased goods and/or services. Data should also be available on the quantities of various products shipped on individual vehicles. Where this data is not available but there is information on the mass, distance and mode of each shipment delivered by transportation providers, the distance-based method should be used. In the circumstance where data is limited and is not available in any level of detail previously listed, the spend-based data method should be applied.
The spend-based method can be applied through the use of EEIO modelling. The spend data is used to calculate emissions from transport services. This is described in more detail for Category 1.
In general, reporting companies may have to apply a variety of methods that are the most suitable for the activities of the company and the most practical.
Fuel-based method (transportation)
The fuel-based method should be used when companies can obtain data for fuel use from transport providers (and, if applicable, refrigerant leakage due to product refrigeration) from vehicle fleets (e.g. trucks, trains, planes, vessels).
Companies should also take into account any additional energy used and account for fugitive emissions (e.g. refrigerant loss or air conditioning). Companies may optionally calculate any emissions from unladen backhaul (i.e. the return journey of the empty vehicle).
28Detailed guidance by category
Where fuel use data is unavailable, the company may derive fuel use by using the:
• Amount spent on fuels and the average price of fuels.
• Distance travelled and the vehicle’s fuel efficiency.
• Amount spent on transportation services, fuel cost share (as percent of total cost of transportation services) and the average price of fuels.
For calculating CO2, the fuel-based method is more accurate than the distance-based method because fuel consumption is directly related to emissions.
The fuel-based method is best applied if the vehicle exclusively ships the reporting company’s purchased goods (i.e. exclusive use or truckload shipping, rather than less-than-truckload (LTL) shipping). Otherwise, emissions should be allocated between goods shipped for the reporting company and goods shipped for other companies.
Companies should allocate emissions based on the following default limiting factors for each transportation mode, unless more accurate data is available to show that another factor is the limiting factor:
• Road transport – Truck capacity is typically limited by mass, so mass-based allocation should be used.
• Marine transport – Vessel capacity is typically limited by volume, so volume-based allocation should be used.
• Air transport – Aircraft capacity is typically limited by mass, so mass-based allocation should be used.
• Rail transport – Rail capacity is typically limited by mass, so mass-based allocation should be used.
If there are multiple shipments on a transport leg, distance should also be used as a means for allocation.
If the data required for allocation is not available or reliable due to the variety of goods transported in one vehicle at the same time, the distance-based method should be used to calculate Scope 3 emissions.
Activity data needed
Companies should collect data on:
• Quantities of fuel (e.g. diesel, gasoline, jet fuel, biofuels) consumed.
• Amount spent on fuels.
• Quantities of fugitive emissions (e.g. from air conditioning and refrigeration).
If applicable:
• Distance travelled.
• Average fuel efficiency of the vehicle, expressed in liters of fuel consumed per tonne per kilometer transported.
• Cost of fuels.
• Volume and/or mass of purchased goods in the vehicle.
Emission factors needed
Companies should collect:
• Fuel emission factors, expressed in units of emissions per unit of energy consumed (e.g. kg CO2e/liters, CO2e/Btu).
• For electric vehicles (if applicable), electricity emission factors, expressed in units of emissions per unit of electricity consumed (e.g. kg CO2e/kWh).
• Fugitive emission factors, expressed in units of emissions per unit (e.g. kg CO2e/kg refrigerant leakage).
Emission factors should at a minimum include emissions from fuel combustion and should, where possible, include cradle-to-gate emissions of the fuel (i.e. from extraction, processing and transportation to the point of use).
For air travel emission factors, multipliers or other corrections may account for higher levels of radiative forcing and may be applied to the global warming potential (GWP) of emissions arising from aircraft transport. If applied, companies should disclose the specific factor used.
Data collection guidance
For data collection guidance, see Appendix 2.
29 Cement Sector Scope 3 GHG Accounting and Reporting Guidance
Distance-based method (transportation)
In this method, distance is multiplied by mass or volume of goods transported and relevant emission factors that incorporate average fuel consumption, average utilization, average size and mass or volume of the goods and the vehicles, and their associated GHG emissions.
Emission factors for this method are typically represented in grams or kilograms of carbon dioxide equivalent per tonne-kilometer or TEU-kilometer. Tonne-kilometer is a unit of measure representing one tonne of goods transported over one kilometer. TEU-kilometer is a unit of measure representing one twenty-foot container equivalent of goods transported over 1 kilometer.
The distance-based method is especially useful for an organization that does not have access to fuel or mileage records from the transport vehicles or has shipments smaller than those that would consume an entire vehicle or vessel.
If sub-contractor fuel data cannot be easily obtained in order to use the fuel-based method, then the distance-based method should be used. Distance can be tracked using internal management systems or, if these are unavailable, online maps. However, accuracy is generally lower than the fuel-based method as assumptions are made about the average fuel consumption, mass or volume of goods, and loading of vehicles.
Activity data needed
Companies should collect data on the distance travelled by transportation suppliers or use reliable and accepted estimation methods. This data may be obtained by:
• Mass or volume of the products sold.
• Actual distances provided by transportation supplier.
• Online maps or calculators (from recommended providers of route information).
• Published port-to-port travel distances (from reputable providers).
The actual distances should be used when available and each leg of the transportation supply chain should be collected separately. Simplified approaches may be used as long as they include what is material to the cement company.
Emission factors needed
Companies should collect:
Emission factor by mode of transport (e.g. rail, air, road) or vehicle types (e.g. articulated lorry, container vessel), expressed in units of GHG gas (CO2, CH4, N2O, or CO2e) per unit of mass (e.g. tonne) or volume (e.g. TEU) travelled (e.g. kilometer).
Common forms of emission factors are kg CO2e/tonne/km for road transport or kg CO2e/TEU/km for sea transport.
For air travel emission factors, multipliers or other corrections to account for radiative forcing may be applied to the GWP of emissions arising from aircraft transport. If applied, companies should disclose the specific factor used.
Data collection guidance
Companies may obtain activity data from:
• Purchase orders.
• Specific carrier or mode operator.
• Internal management systems.
• Industry associations.
• Online maps and calculators.
Companies may obtain emission factors from:
• Transportation carriers.
• Government agencies (e.g. Defra provides emission factors for the United Kingdom).
• The GHG Standard website (http://www.ghgprotocol.org/calculation-tools/all-tools and http://www.ghgprotocol.org/standards/Scope-3-standard).
• Industry associations.
When collecting emission factors, it is important to note that they may be vehicle, region or country specific.
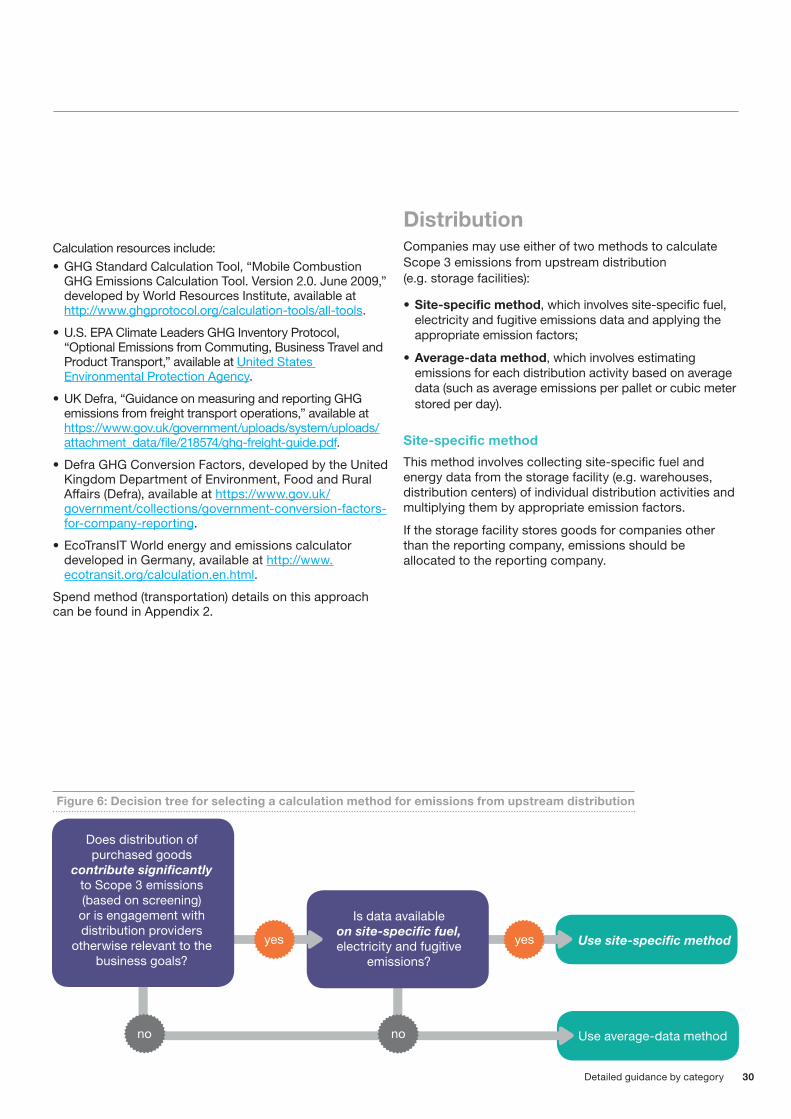
30Detailed guidance by category
Calculation resources include:• GHG Standard Calculation Tool, “Mobile Combustion
GHG Emissions Calculation Tool. Version 2.0. June 2009,” developed by World Resources Institute, available at http://www.ghgprotocol.org/calculation-tools/all-tools.
• U.S. EPA Climate Leaders GHG Inventory Protocol, “Optional Emissions from Commuting, Business Travel and Product Transport,” available at United States Environmental Protection Agency.
• UK Defra, “Guidance on measuring and reporting GHG emissions from freight transport operations,” available at https://www.gov.uk/government/uploads/system/uploads/attachment_data/file/218574/ghg-freight-guide.pdf.
• Defra GHG Conversion Factors, developed by the United Kingdom Department of Environment, Food and Rural Affairs (Defra), available at https://www.gov.uk/government/collections/government-conversion-factors-for-company-reporting.
• EcoTransIT World energy and emissions calculator developed in Germany, available at http://www.ecotransit.org/calculation.en.html.
Spend method (transportation) details on this approach can be found in Appendix 2.
DistributionCompanies may use either of two methods to calculate Scope 3 emissions from upstream distribution (e.g. storage facilities):
• Site-specific method, which involves site-specific fuel, electricity and fugitive emissions data and applying the appropriate emission factors;
• Average-data method, which involves estimating emissions for each distribution activity based on average data (such as average emissions per pallet or cubic meter stored per day).
Site-specific method
This method involves collecting site-specific fuel and energy data from the storage facility (e.g. warehouses, distribution centers) of individual distribution activities and multiplying them by appropriate emission factors.
If the storage facility stores goods for companies other than the reporting company, emissions should be allocated to the reporting company.
Figure 6: Decision tree for selecting a calculation method for emissions from upstream distribution
Does distribution of purchased goods
contribute significantly to Scope 3 emissions (based on screening)
or is engagement with distribution providers
otherwise relevant to the business goals?
Is data available on site-specific fuel, electricity and fugitive
emissions?
Use site-specific method
Use average-data method
yes
no no
yes
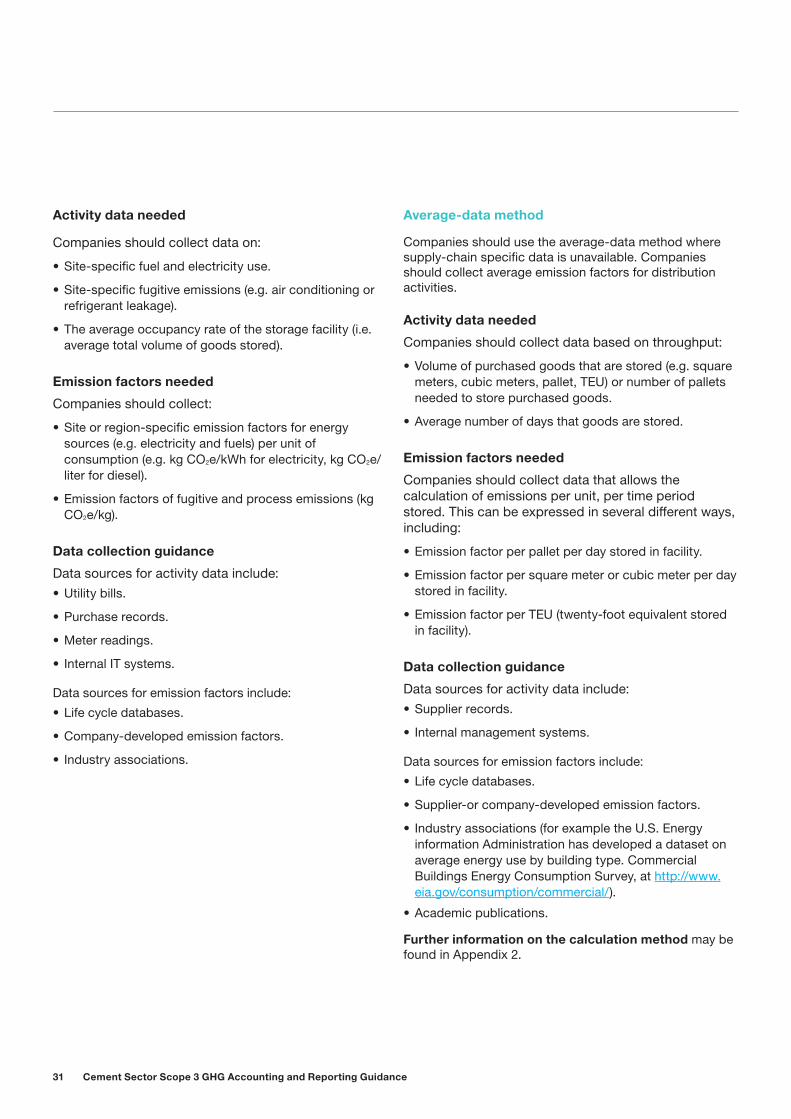
31 Cement Sector Scope 3 GHG Accounting and Reporting Guidance
Activity data needed
Companies should collect data on:
• Site-specific fuel and electricity use.
• Site-specific fugitive emissions (e.g. air conditioning or refrigerant leakage).
• The average occupancy rate of the storage facility (i.e. average total volume of goods stored).
Emission factors needed
Companies should collect:
• Site or region-specific emission factors for energy sources (e.g. electricity and fuels) per unit of consumption (e.g. kg CO2e/kWh for electricity, kg CO2e/liter for diesel).
• Emission factors of fugitive and process emissions (kg CO2e/kg).
Data collection guidance
Data sources for activity data include:• Utility bills.
• Purchase records.
• Meter readings.
• Internal IT systems.
Data sources for emission factors include:
• Life cycle databases.
• Company-developed emission factors.
• Industry associations.
Average-data method
Companies should use the average-data method where supply-chain specific data is unavailable. Companies should collect average emission factors for distribution activities.
Activity data needed
Companies should collect data based on throughput:
• Volume of purchased goods that are stored (e.g. square meters, cubic meters, pallet, TEU) or number of pallets needed to store purchased goods.
• Average number of days that goods are stored.
Emission factors needed
Companies should collect data that allows the calculation of emissions per unit, per time period stored. This can be expressed in several different ways, including:
• Emission factor per pallet per day stored in facility.
• Emission factor per square meter or cubic meter per day stored in facility.
• Emission factor per TEU (twenty-foot equivalent stored in facility).
Data collection guidance
Data sources for activity data include:• Supplier records.
• Internal management systems.
Data sources for emission factors include:
• Life cycle databases.
• Supplier-or company-developed emission factors.
• Industry associations (for example the U.S. Energy information Administration has developed a dataset on average energy use by building type. Commercial Buildings Energy Consumption Survey, at http://www.eia.gov/consumption/commercial/).
• Academic publications.
Further information on the calculation method may be found in Appendix 2.
32Detailed guidance by category
Category description
This category includes emissions from the transportation of employees for business-related activities in vehicles owned or operated by third parties, such as aircraft, trains, buses and passenger cars.
Emissions from transportation in vehicles owned or controlled by the reporting company are accounted for in either Scope 1 (for fuel use) or, in the case of electric vehicles, Scope 2 (for electricity use). Emissions from leased vehicles operated by the reporting company not included in Scope 1 or 2 are accounted for in Scope 3, Category 8 (Upstream leased assets). Emissions from transportation of employees to and from work are accounted for in Scope 3, Category 7 (Employee commuting).
Emissions from business travel may arise from:
• Air travel
• Rail travel
• Bus travel
• Automobile travel (e.g. business travel in rental cars or employee-owned vehicles other than employee commuting to and from work)
• Other modes of travel
Companies may optionally include emissions from business travelers staying in hotels.
A reporting company’s Scope 3 emissions from business travel include the Scope 1 and 2 emissions of transportation companies (e.g. airlines).
Emissions from business travel for cement companies are deemed immaterial in comparison to other Scope 1, 2 and 3 emissions.
Although companies are encouraged to report business travel emissions, companies may choose to opt out of reporting.
Minimum boundaries
All emissions associated with the transportation of employees for business-related activities in vehicles owned or operated by third parties.
Note that:
• Emissions from transportation in vehicles owned or controlled by the reporting company should be reported in Scope 1 (for vehicles that consume fuel) and 2 (for vehicles that consume electricity).
• Emissions from transportation of employees to and from work should be reported in Category 7.
• Emissions from leased vehicles operated by the reporting company not included in Scope 1 or 2 should be reported in Category 8.
Calculation methodology
Companies may use one of the following methods to calculate Scope 3 emissions from business travel:
• Fuel-based method, which involves determining the amount of fuel consumed during business travel (i.e. Scope 1 and 2 emissions of transport providers) and applying the appropriate emission factor for that fuel;
• Distance-based method, which involves determining the distance and mode of business trips, then applying the appropriate emission factor for the mode used;
• Spend-based method, which involves determining the amount of money spent on each mode of business travel transport and applying secondary (EEIO) emission factors.
4.5 Category 6 Business travel
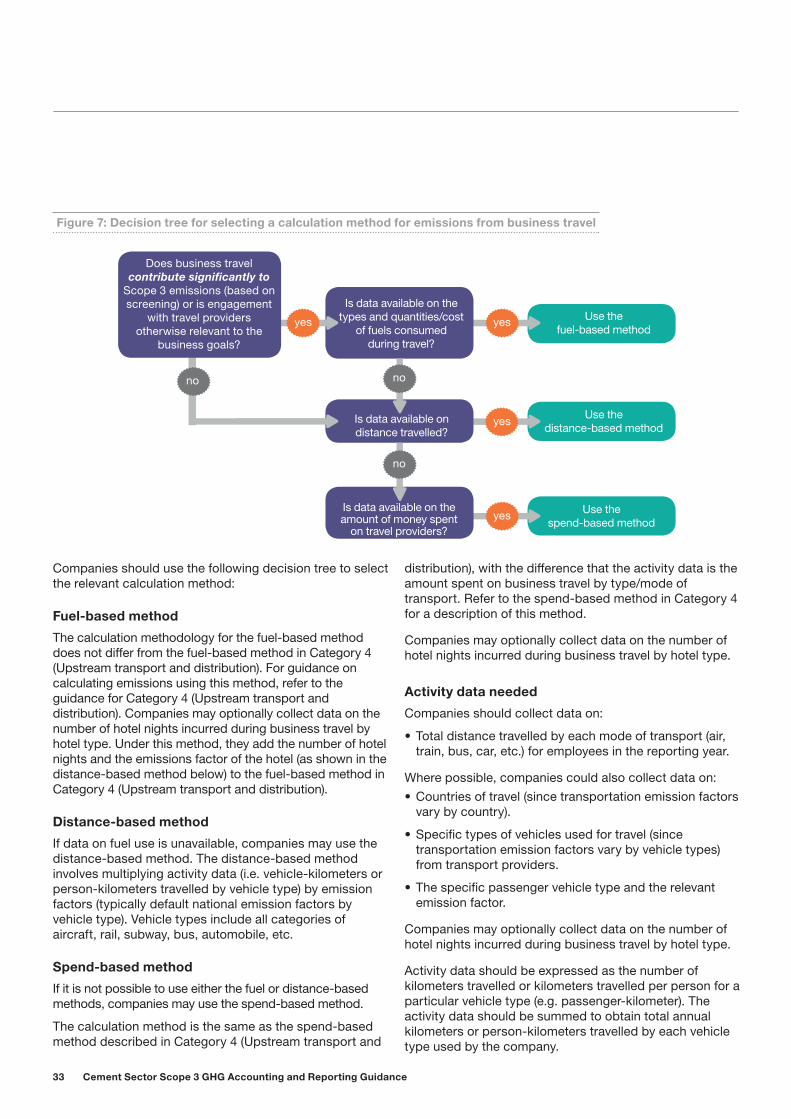
33 Cement Sector Scope 3 GHG Accounting and Reporting Guidance
Figure 7: Decision tree for selecting a calculation method for emissions from business travel
Companies should use the following decision tree to select the relevant calculation method:
Fuel-based method
The calculation methodology for the fuel-based method does not differ from the fuel-based method in Category 4 (Upstream transport and distribution). For guidance on calculating emissions using this method, refer to the guidance for Category 4 (Upstream transport and distribution). Companies may optionally collect data on the number of hotel nights incurred during business travel by hotel type. Under this method, they add the number of hotel nights and the emissions factor of the hotel (as shown in the distance-based method below) to the fuel-based method in Category 4 (Upstream transport and distribution).
Distance-based method
If data on fuel use is unavailable, companies may use the distance-based method. The distance-based method involves multiplying activity data (i.e. vehicle-kilometers or person-kilometers travelled by vehicle type) by emission factors (typically default national emission factors by vehicle type). Vehicle types include all categories of aircraft, rail, subway, bus, automobile, etc.
Spend-based method
If it is not possible to use either the fuel or distance-based methods, companies may use the spend-based method.
The calculation method is the same as the spend-based method described in Category 4 (Upstream transport and
distribution), with the difference that the activity data is the amount spent on business travel by type/mode of transport. Refer to the spend-based method in Category 4 for a description of this method.
Companies may optionally collect data on the number of hotel nights incurred during business travel by hotel type.
Activity data needed
Companies should collect data on:
• Total distance travelled by each mode of transport (air, train, bus, car, etc.) for employees in the reporting year.
Where possible, companies could also collect data on:• Countries of travel (since transportation emission factors
vary by country).
• Specific types of vehicles used for travel (since transportation emission factors vary by vehicle types) from transport providers.
• The specific passenger vehicle type and the relevant emission factor.
Companies may optionally collect data on the number of hotel nights incurred during business travel by hotel type.
Activity data should be expressed as the number of kilometers travelled or kilometers travelled per person for a particular vehicle type (e.g. passenger-kilometer). The activity data should be summed to obtain total annual kilometers or person-kilometers travelled by each vehicle type used by the company.
Is data available on the types and quantities/cost
of fuels consumed during travel?
Use the fuel-based method
Use the distance-based method
Use the spend-based method
Is data available on the amount of money spent
on travel providers?
Is data available on distance travelled?
yes
no no
no
yes
yes
yes
Does business travel contribute significantly to
Scope 3 emissions (based on screening) or is engagement
with travel providers otherwise relevant to the
business goals?
34Detailed guidance by category
Emission factors needed
Companies should collect:
• Emission factors for each mode of transport (e.g. aircraft, rail, metro, bus, taxi), expressed in units of GHG gas (CO2, CH4, N2O, HFC, or CO2e) emitted per kilometer or per passenger-kilometer travelled.
Companies may optionally use emission factors for hotel stays by hotel type (e.g. kilograms of CO2e emitted per hotel night).
For air travel emission factors, multipliers or other corrections to account for radiative forcing may be applied to the GWP of emissions arising from aircraft transport. If applied, companies should disclose the specific factor used.
Data collection guidance
Methods of data collection include:
• Automatic tracking of distance travelled by mode through a travel agency or other travel providers.
• Automatic tracking of distance travelled by mode through internal expense and reimbursement systems, which may require adding new questions on distance travelled and mode of transport to travel or expense forms submitted by employees.
• Annual survey/questionnaires of employees.
• Working with travel providers (e.g. transportation companies, hotels) to obtain GHG emissions data.
Collecting travel data from all employees may not be feasible. In such a case, companies may extrapolate from a representative sample of employees to identify the total business travel of all employees. For example, a company may have 4,000 employees, each of whom has a different travel profile. The company may extrapolate from a representative sample of 400 employees to approximate the total business travel of all employees. Companies may also choose to group or combine data from business travelers with similar travel profiles. See Appendix A in Technical Guidance for Calculating Scope 3 Emissions (version 1.0) www.ghgprotocol.org/sites/default/files/ghgp/Scope3_Calculation_Guidance.pdf.
Calculation resources
• GHG Standard Calculation Tool, “Mobile Combustion GHG Emissions Calculation Tool. Version 2.0. June 2009,” developed by World Resources Institute, available at http://www.ghgprotocol.org/calculation-tools/all-tools.
• U.S. EPA Climate Leaders GHG Inventory Protocol, “Optional Emissions from Commuting, Business Travel and Product Transport,” available at: http://nepis.epa.gov/Exe/ZyNET.exe/P1001177.TXT?ZyActionD=ZyDocument&Client=EPA&Index=2006+Thru+2010&Docs=&Query=&Time=&EndTime=&SearchMethod=1&TocRestrict=n&Toc=&TocEntry=&QField=&QFieldYear=&QFieldMonth=&QFieldDay=&IntQFieldOp=0&ExtQFieldOp=0&XmlQuery=&File=D%3A%5Czyfiles%5CIndex%20Data%5C06thru10%5CTxt%5C00000003%5CP1001177.txt&User=ANONYMOUS&Password=anonymous&SortMethod=h%7C-&MaximumDocuments=1&FuzzyDegree=0&ImageQuality=r75g8/r75g8/x150y150g16/i425&Display=p%7Cf&DefSeekPage=x&SearchBack=ZyActionL&Back=ZyActionS&BackDesc=Results%20page&MaximumPages=1&ZyEntry=1&SeekPage=x&ZyPURL.
• For UK organizations, the Department for Transport provides guidance and a calculation tool for work-related travel at: https://www.gov.uk/measuring-and-reporting-environmental-impacts-guidance-for-businesses.
Once the company has determined total annual distance travelled by each mode of transport (aggregated across all employees), apply the formula below to calculate emissions.
Calculation formula
CO2e emissions from business travel =
sum across vehicle types: ∑ (distance travelled by vehicle type (vehicle-km or passenger-km)
× vehicle-specific emission factor (kg CO2e/vehicle-km or kg CO2e/
passenger-km))+
(optional) ∑ (annual number of hotel nights (nights) ×
hotel emission factor (kg CO2e/night))
35 Cement Sector Scope 3 GHG Accounting and Reporting Guidance
Category description
This category includes emissions from the transportation of employees between their homes and their worksites.
Emissions from employee commuting may arise from:
• Automobile travel
• Bus travel
• Rail travel
• Air travel
• Other modes of transportation (e.g. subway, bicycling, walking)
Companies may include emissions from teleworking (i.e. employees working remotely) in this category.
A reporting company’s Scope 3 emissions from employee commuting include the Scope 1 and 2 emissions of employees and third-party transportation providers.
Emissions from employee commuting for cement companies are deemed immaterial in comparison to other Scope 1, 2 and 3 emissions.
Although companies are encouraged to report employee commuting emissions, companies may choose to opt out of reporting them.
Minimum boundaries
The minimum boundaries include all emissions associated with the transportation of employees to and from their places of employment.
“Employees” refers to employees of entities and facilities owned, operated or leased by the reporting company. Companies may include employees of other relevant entities (e.g. outsourced operations) in this category, as well as consultants, contractors and other individuals who are not employees of the company but commute to facilities owned and operated by the company.
Calculation methodology
Companies may use one of the following methods:
• Fuel-based method, which involves determining the amount of fuel consumed during commuting and applying the appropriate emission factor for that fuel.
• Distance-based method, which involves collecting data from employees on commuting patterns (e.g. distance travelled and mode used for commuting) and applying appropriate emission factors for the modes used.
• Average-data method, which involves estimating emissions from employee commuting based on average (e.g. national) data on commuting patterns.
The distance-based method or average-data method can be used where employee commuting either contributes significantly to Scope 3 emissions or emissions associated with employee commuting are relevant to the business. Where data is available on distance travelled by employees, the distance-based method should be used in preference to the average-data method. The fuel-based method is the preferred approach but it is understood that this may be impractical for reporting companies (see appendix 1 for details on the fuel-based methodology).
Distance-based method
Activity data needed
Companies should collect data on the following:
• Total distance travelled by employees over the reporting period (e.g. passenger-kilometers travelled).
• Mode of transport used for commuting (e.g. train, subway, bus, car, bicycle).
Emission factors neededCompanies should collect:
• Emission factors for each mode of transport (usually expressed in units of GHG gas (CO2, CH4, N2O, or CO2e) emitted per passenger-kilometer travelled).
4.6 Category 7 Employee commuting
36Detailed guidance by category
Data collection guidance
Companies should collect data on employee commuting habits, for example through a survey. Companies should survey their employees annually to obtain information on average commuting habits. Types of data to collect include:
• Distance travelled by employees per day or location of residence and office.
• The number of days per week that employees use different vehicle types (all categories of subway, car, bus, train, bicycle, etc.)
• Number of commuting days per week and number of weeks worked per year.
• If the company is multinational: employees’ region of residence/work (since transportation emission factors vary by region).
• Whether there is a significant car-pooling scheme in operation, the proportion of employees using the scheme and the average occupancy per vehicle.
• If applicable, the amount of energy used from teleworking (e.g. kWh of gas, electricity consumed).
Collecting commuting data from all employees through a survey may not be feasible. Companies may extrapolate from a representative sample of employees to represent the total commuting patterns of all employees. For example, a company with 4,000 employees, who each have different commuting profiles, may extrapolate from a representative sample of, for example, 400 employees to approximate the total commuting of all employees. See appendix A in Technical Guidance for Calculating Scope 3 Emissions (version 1.0) www.ghgprotocol.org/sites/default/files/ghgp/Scope3_Calculation_Guidance.pdf for more information on sampling.
Calculation formula
CO2e emissions from employee travel =First, sum across all employees to determine total distance
travelled using each vehicle type:total distance travelled by vehicle type (vehicle-km or passenger-
km) =
∑ (daily one-way distance between home and work (km) ×
2 × number of commuting days per year)Then, sum across vehicle types to determine total emissions:
kg CO2e from employee commuting =
∑ (total distance travelled by vehicle type (vehicle-km or passenger-km)
× vehicle-specific emission factor (kg CO2e/vehicle-km or kg CO2e/
passenger-km)) +
(optionally) for each energy source used in teleworking:∑ (quantities of energy consumed (kWh)
× emission factor for energy source (kg CO2e/kWh))
37 Cement Sector Scope 3 GHG Accounting and Reporting Guidance
Average-data method
If company-specific data is unavailable, companies may use average secondary activity data to estimate distance travelled and mode of transport. This may include using:
• Average daily commuting distances of typical employees
• Average modes of transport of typical employees
• Average number of commuting days per week and average number of weeks worked per year.
Such estimation requires making several simplifying assumptions, which add uncertainty to the emissions estimates.
Activity data needed
Companies should collect data on:
• Number of employees
• Average distance travelled by an average employee per day
• Average breakdown of transport modes used by employees
• Average number working days per year.
Emission factors needed
Companies should collect:
• Emission factors for each mode of transport (usually expressed as kilograms of GHG emitted per passenger per kilometer travelled).
Data collection guidance
Companies may collect average secondary data from sources such as national transportation departments, ministries or agencies, national statistics publications and/or industry associations.
For example, the UK Office for National Statistics publishes average commuting patterns and distances (http://www.neighbourhood.statistics.gov.uk/dissemination/Info.do?page=analysisandguidance/commutingstatistics/commuting-statistics.htm).
Calculation resources include:
• GHG Standard Calculation Tool, “Mobile Combustion GHG Emissions Calculation Tool. Version 2.0. June 2009,” developed by World Resources Institute, available at http://www.ghgprotocol.org/calculation-tools/all-tools.
U.S. EPA Climate Leaders GHG Inventory Protocol, “Optional Emissions from Commuting, Business Travel and Product Transport,” available at: http://nepis.epa.gov/Exe/ZyNET.exe/P1001177.TXT?ZyActionD=ZyDocument&Client=EPA&Index=2006+Thru+2010&Docs=&Query=&Time=&EndTime=&SearchMethod=1&TocRestrict=n&Toc=&TocEntry=&QField=&QFieldYear=&QFieldMonth=&QFieldDay=&IntQFieldOp=0&ExtQFieldOp=0&XmlQuery=&File=D%3A%5Czyfiles%5CIndex%20Data%5C06thru10%5CTxt%5C00000003%5CP1001177.txt&User=ANONYMOUS&Password=anonymous&SortMethod=h%7C-&MaximumDocuments=1&FuzzyDegree=0&ImageQuality=r75g8/r75g8/x150y150g16/i425&Display=p%7Cf&DefSeekPage=x&SearchBack=ZyActionL&Back=ZyActionS&BackDesc=Results%20page&MaximumPages=1&ZyEntry=1&SeekPage=x&ZyPURL.
• For UK organizations, the Department for Transport provides guidance and a calculation tool for work-related travel at: https://www.gov.uk/measuring-and-reporting-environmental-impacts-guidance-for-businesses.
Calculation formula
Companies should convert average daily commuting distance into annual average commuting distance by multiplying the one-way distance by two for the daily return trip and by the average number of days worked per year (i.e. excluding weekends and days spent on business travel, vacation or working from home).
CO2e emissions from employee commuting = sum across each transport mode:
∑ (total number of employees ×
% of employees using mode of transport ×
one way commuting distance (vehicle-km or passenger-km)
× 2 × working days per year
× emission factor of transport mode (kg CO2e/vehicle-km or kg
CO2e/passenger-km))
38Detailed guidance by category
Category description
This category includes emissions that occur in the reporting year from transportation and distribution of sold products in vehicles and facilities not owned or controlled by the reporting company.
This category also includes emissions from retail and storage. Outbound transportation and distribution services that are purchased by the reporting company are excluded from Category 9 and included in Category 4 (Upstream transportation and distribution), because the reporting company purchases the service. Category 9 includes only emissions from transportation and distribution of products after the point of sale.
Companies should report on all downstream transport emissions in their Scope 1 or 3 reports. Any emissions not included in the Scope 1 report should be included in the Scope 3 report.
Minimum boundaries
Companies should report all Scope 1 and 2 emissions of transportation and distribution providers that occur during the use of vehicles and facilities (e.g. from energy use) after the point of sale until the product is used.
Companies may also report the life cycle emissions, including manufacturing vehicles, facilities or infrastructure.
Emissions from downstream transportation and distribution can arise from transportation/storage of sold products in vehicles/facilities not owned by the reporting company. For example:
• Air transport
• Rail transport
• Road transport
• Marine transport
In this category, companies may include emissions from customers traveling to and from retail stores, which can be significant for companies that own or operate retail facilities.
A reporting company’s Scope 3 emissions from downstream transportation and distribution include the Scope 1 and 2 emissions of transportation companies, distribution companies, retailers and (optionally) customers.
If the reporting company sells an intermediate product, the company should report emissions from transportation and distribution of this intermediate product between the point of sale by the reporting company and either (1) the end consumer (if the eventual end use of the intermediate product is known) or (2) business customers (if the eventual end use of the intermediate product is unknown).
Calculation methodology
Calculating emissions from transportation (downstream)
The emissions from downstream transportation should follow the calculation methods described in Category 4 (Upstream transportation and distribution). Companies may use either the fuel-based, distance-based or spend-based method.
Activity data needed
The major difference between calculating upstream and downstream emissions of transportation is likely to be the availability and quality of activity data. Transportation data may be easier to obtain from upstream suppliers than from downstream customers and transportation companies. Therefore, companies may need to use the distance-based method to calculate downstream transportation emissions.
If the actual transportation distances are not known, the reporting company may estimate downstream distances by using a combination of:
• Government, academic or industry publications.
• Online maps and calculators.
• Published port-to-port travel distances.
4.7 Category 9 Downstream transportation and distribution

39 Cement Sector Scope 3 GHG Accounting and Reporting Guidance
Emission factors needed
See emission factors guidance for Category 4 (Upstream transportation and distribution).
Data collection guidance
The UK government produces average freight distances for the economy’s main categories of goods (see https://www.gov.uk/government/collections/road-freight-domestic-and-international-statistics). This database may be used in the absence of purchaser-specific or region-specific data.
A list of life cycle databases is provided on the GHG Standard website: http://www.ghgprotocol.org/Third-Party-Databases.
Calculating emissions from distribution (downstream)
The emissions from downstream distribution should follow the calculation methods described in Category 4 (Upstream transportation and distribution). Companies may use either the site-specific method or the average-data method. For the reasons outlined above, companies are more likely to apply the average-data method.
39Detailed guidance by category
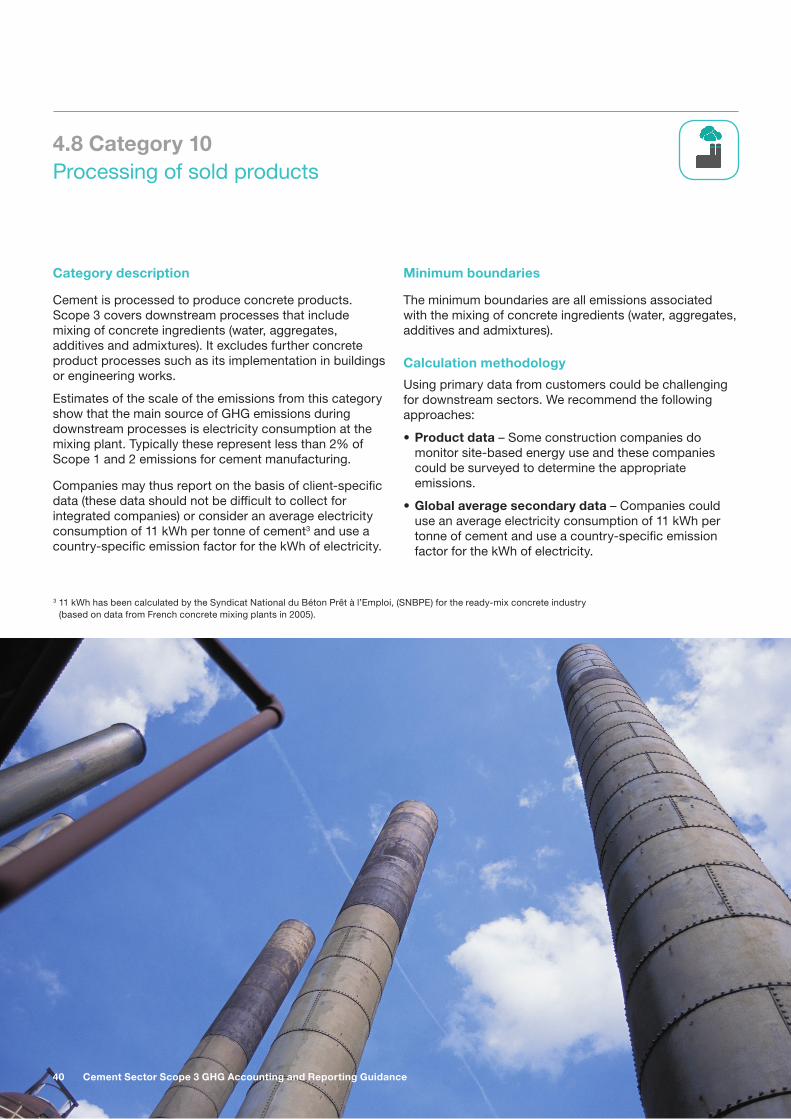
40Detailed guidance by category
Category description
Cement is processed to produce concrete products. Scope 3 covers downstream processes that include mixing of concrete ingredients (water, aggregates, additives and admixtures). It excludes further concrete product processes such as its implementation in buildings or engineering works.
Estimates of the scale of the emissions from this category show that the main source of GHG emissions during downstream processes is electricity consumption at the mixing plant. Typically these represent less than 2% of Scope 1 and 2 emissions for cement manufacturing.
Companies may thus report on the basis of client-specific data (these data should not be difficult to collect for integrated companies) or consider an average electricity consumption of 11 kWh per tonne of cement3 and use a country-specific emission factor for the kWh of electricity.
Minimum boundaries
The minimum boundaries are all emissions associated with the mixing of concrete ingredients (water, aggregates, additives and admixtures).
Calculation methodology
Using primary data from customers could be challenging for downstream sectors. We recommend the following approaches:
• Product data – Some construction companies do monitor site-based energy use and these companies could be surveyed to determine the appropriate emissions.
• Global average secondary data – Companies could use an average electricity consumption of 11 kWh per tonne of cement and use a country-specific emission factor for the kWh of electricity.
3 11 kWh has been calculated by the Syndicat National du Béton Prêt à l’Emploi, (SNBPE) for the ready-mix concrete industry (based on data from French concrete mixing plants in 2005).
4.8 Category 10 Processing of sold products
40 Cement Sector Scope 3 GHG Accounting and Reporting Guidance
41 Cement Sector Scope 3 GHG Accounting and Reporting Guidance
The following categories are usually not considered relevant for typical cement companies (see “Relevance of Scope 3 categories to the cement sector” in this Guidance and the Corporate Value Chain Scope 3 Accounting and Reporting Standard):• Category 5 (Waste generated in operations)
• Category 8 (Upstream leased assets)
• Category 11 (Use of sold products)
• Category 12 (End of life of sold products)
• Category 13 (Downstream leased assets)
• Category 14 (Franchises)
• Category 15 (Investments)
4.10 Non-relevant Scope 3 categories
The Scope 3 standard identifies producers of “intermediate products.” Companies producing intermediate products do not have to report Categories 11 and 12. Identifying the end use of intermediate products is very difficult.
This Guidance regards cement as an intermediate product. Therefore, companies do not have to report these categories.
However, some organizations have expressed an interest in measuring these emissions. Therefore, companies may choose to report these categories if they are of interest.
Calculation methodology
Companies may choose to adopt either life cycle assessment or environmental input-output modelling as the basis for these sectors. Good practice should be followed in the application of these methods to these categories.
4.9 Category 11 Use of sold products and Category 12 End of life of sold products
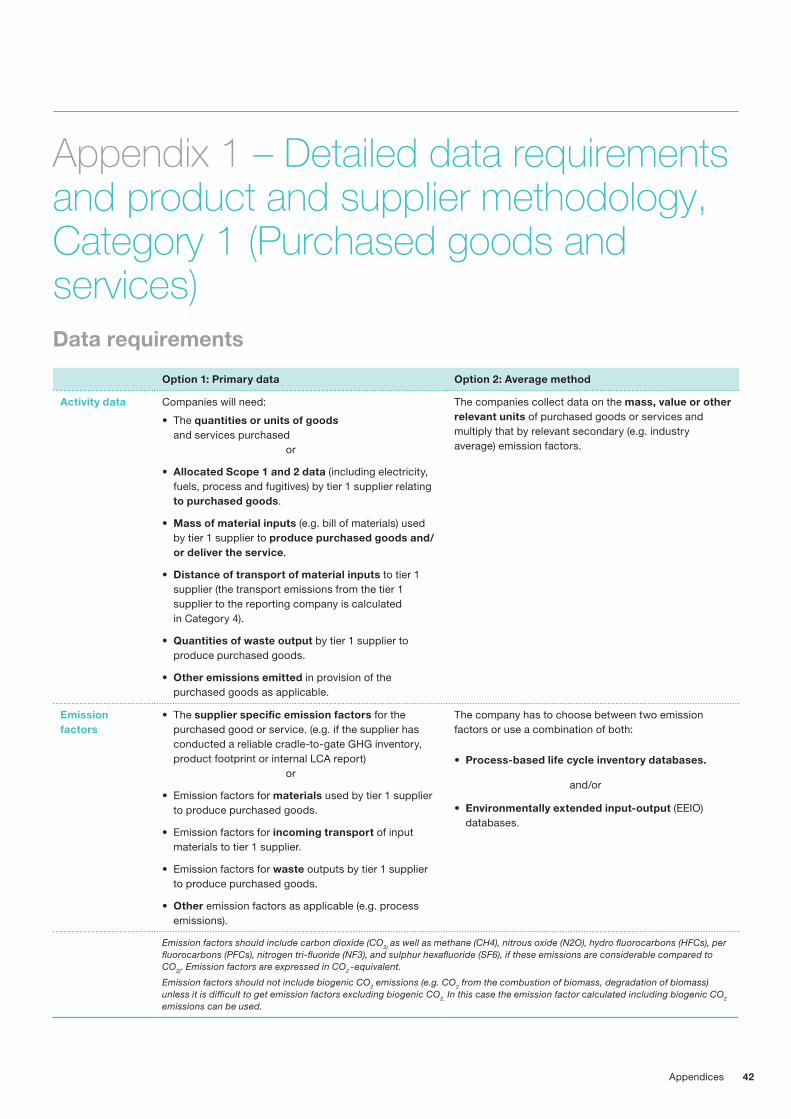
42Appendices
Appendix 1 – Detailed data requirements and product and supplier methodology, Category 1 (Purchased goods and services)Data requirements
Option 1: Primary data Option 2: Average method
Activity data Companies will need:
• The quantities or units of goods and services purchased or
• Allocated Scope 1 and 2 data (including electricity, fuels, process and fugitives) by tier 1 supplier relating to purchased goods.
• Mass of material inputs (e.g. bill of materials) used by tier 1 supplier to produce purchased goods and/or deliver the service.
• Distance of transport of material inputs to tier 1 supplier (the transport emissions from the tier 1 supplier to the reporting company is calculated in Category 4).
• Quantities of waste output by tier 1 supplier to produce purchased goods.
• Other emissions emitted in provision of the purchased goods as applicable.
The companies collect data on the mass, value or other relevant units of purchased goods or services and multiply that by relevant secondary (e.g. industry average) emission factors.
Emission factors
• The supplier specific emission factors for the purchased good or service. (e.g. if the supplier has conducted a reliable cradle-to-gate GHG inventory, product footprint or internal LCA report) or
• Emission factors for materials used by tier 1 supplier to produce purchased goods.
• Emission factors for incoming transport of input materials to tier 1 supplier.
• Emission factors for waste outputs by tier 1 supplier to produce purchased goods.
• Other emission factors as applicable (e.g. process emissions).
The company has to choose between two emission factors or use a combination of both:
• Process-based life cycle inventory databases.
and/or
• Environmentally extended input-output (EEIO) databases.
Emission factors should include carbon dioxide (CO2) as well as methane (CH4), nitrous oxide (N2O), hydro fluorocarbons (HFCs), per fluorocarbons (PFCs), nitrogen tri-fluoride (NF3), and sulphur hexafluoride (SF6), if these emissions are considerable compared to CO2). Emission factors are expressed in CO2 -equivalent.
Emission factors should not include biogenic CO2 emissions (e.g. CO2 from the combustion of biomass, degradation of biomass) unless it is difficult to get emission factors excluding biogenic CO2. In this case the emission factor calculated including biogenic CO2 emissions can be used.
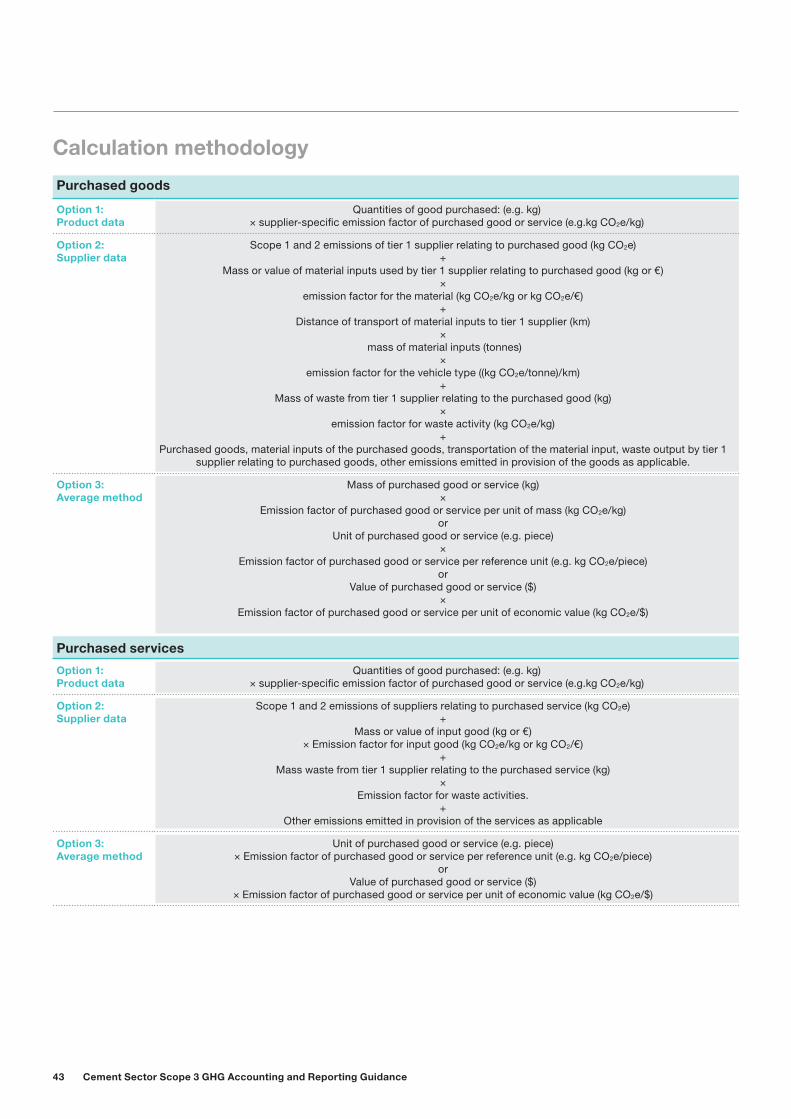
43 Cement Sector Scope 3 GHG Accounting and Reporting Guidance
Calculation methodology
Purchased goods
Option 1: Product data
Quantities of good purchased: (e.g. kg) × supplier-specific emission factor of purchased good or service (e.g.kg CO2e/kg)
Option 2: Supplier data
Scope 1 and 2 emissions of tier 1 supplier relating to purchased good (kg CO2e)+
Mass or value of material inputs used by tier 1 supplier relating to purchased good (kg or €)×
emission factor for the material (kg CO2e/kg or kg CO2e/€)+
Distance of transport of material inputs to tier 1 supplier (km)×
mass of material inputs (tonnes)×
emission factor for the vehicle type ((kg CO2e/tonne)/km)+
Mass of waste from tier 1 supplier relating to the purchased good (kg) ×
emission factor for waste activity (kg CO2e/kg)+
Purchased goods, material inputs of the purchased goods, transportation of the material input, waste output by tier 1 supplier relating to purchased goods, other emissions emitted in provision of the goods as applicable.
Option 3: Average method
Mass of purchased good or service (kg) ×
Emission factor of purchased good or service per unit of mass (kg CO2e/kg)or
Unit of purchased good or service (e.g. piece) ×
Emission factor of purchased good or service per reference unit (e.g. kg CO2e/piece)or
Value of purchased good or service ($) ×
Emission factor of purchased good or service per unit of economic value (kg CO2e/$)
Purchased services
Option 1: Product data
Quantities of good purchased: (e.g. kg) × supplier-specific emission factor of purchased good or service (e.g.kg CO2e/kg)
Option 2: Supplier data
Scope 1 and 2 emissions of suppliers relating to purchased service (kg CO2e)+
Mass or value of input good (kg or €) × Emission factor for input good (kg CO2e/kg or kg CO2/€)
+ Mass waste from tier 1 supplier relating to the purchased service (kg)
× Emission factor for waste activities.
+Other emissions emitted in provision of the services as applicable
Option 3: Average method
Unit of purchased good or service (e.g. piece) × Emission factor of purchased good or service per reference unit (e.g. kg CO2e/piece)
orValue of purchased good or service ($)
× Emission factor of purchased good or service per unit of economic value (kg CO2e/$)
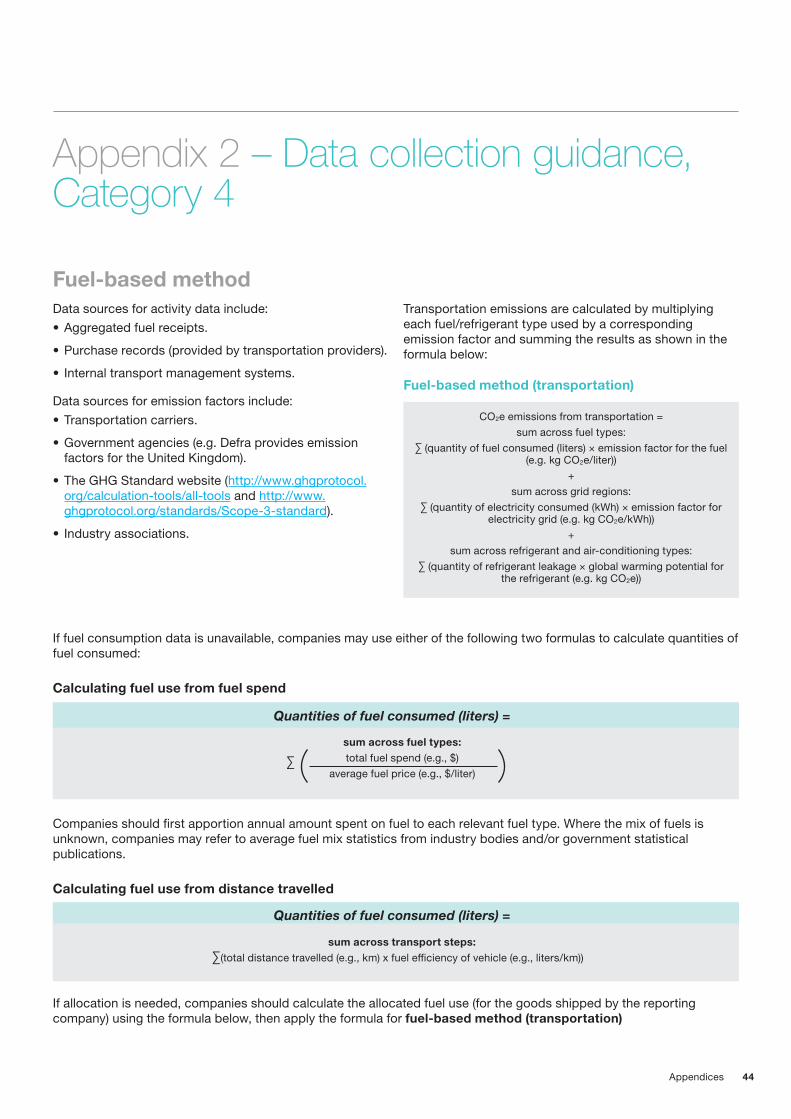
44Appendices
Fuel-based methodData sources for activity data include:• Aggregated fuel receipts.
• Purchase records (provided by transportation providers).
• Internal transport management systems.
Data sources for emission factors include:• Transportation carriers.
• Government agencies (e.g. Defra provides emission factors for the United Kingdom).
• The GHG Standard website (http://www.ghgprotocol.org/calculation-tools/all-tools and http://www.ghgprotocol.org/standards/Scope-3-standard).
• Industry associations.
Appendix 2 – Data collection guidance, Category 4
Transportation emissions are calculated by multiplying each fuel/refrigerant type used by a corresponding emission factor and summing the results as shown in the formula below:
CO2e emissions from transportation =sum across fuel types:
∑ (quantity of fuel consumed (liters) × emission factor for the fuel (e.g. kg CO2e/liter))
+sum across grid regions:
∑ (quantity of electricity consumed (kWh) × emission factor for electricity grid (e.g. kg CO2e/kWh))
+sum across refrigerant and air-conditioning types:
∑ (quantity of refrigerant leakage × global warming potential for the refrigerant (e.g. kg CO2e))
Fuel-based method (transportation)
Quantities of fuel consumed (liters) =
If fuel consumption data is unavailable, companies may use either of the following two formulas to calculate quantities of fuel consumed:
Calculating fuel use from fuel spend
Companies should first apportion annual amount spent on fuel to each relevant fuel type. Where the mix of fuels is unknown, companies may refer to average fuel mix statistics from industry bodies and/or government statistical publications.
Calculating fuel use from distance travelled
Quantities of fuel consumed (liters) =
∑
sum across fuel types:total fuel spend (e.g., $)
average fuel price (e.g., $/liter)
∑sum across transport steps:
(total distance travelled (e.g., km) x fuel efficiency of vehicle (e.g., liters/km))
If allocation is needed, companies should calculate the allocated fuel use (for the goods shipped by the reporting company) using the formula below, then apply the formula for fuel-based method (transportation)
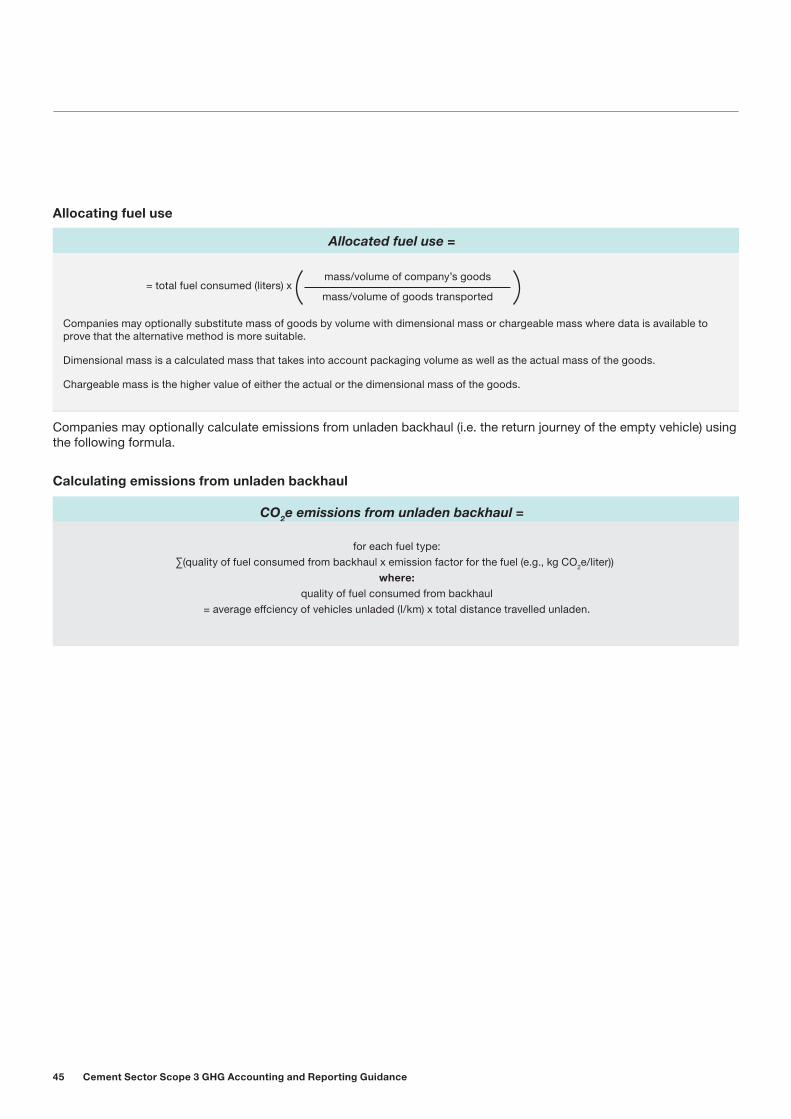
45 Cement Sector Scope 3 GHG Accounting and Reporting Guidance
Companies may optionally calculate emissions from unladen backhaul (i.e. the return journey of the empty vehicle) using the following formula.
Calculating emissions from unladen backhaul
CO2e emissions from unladen backhaul =
Allocated fuel use =
mass/volume of company’s goods
mass/volume of goods transported= total fuel consumed (liters) x
Companies may optionally substitute mass of goods by volume with dimensional mass or chargeable mass where data is available to prove that the alternative method is more suitable.
Dimensional mass is a calculated mass that takes into account packaging volume as well as the actual mass of the goods.
Chargeable mass is the higher value of either the actual or the dimensional mass of the goods.
∑for each fuel type:
(quality of fuel consumed from backhaul x emission factor for the fuel (e.g., kg CO2e/liter))where:
quality of fuel consumed from backhaul= average effciency of vehicles unladed (l/km) x total distance travelled unladen.
Allocating fuel use
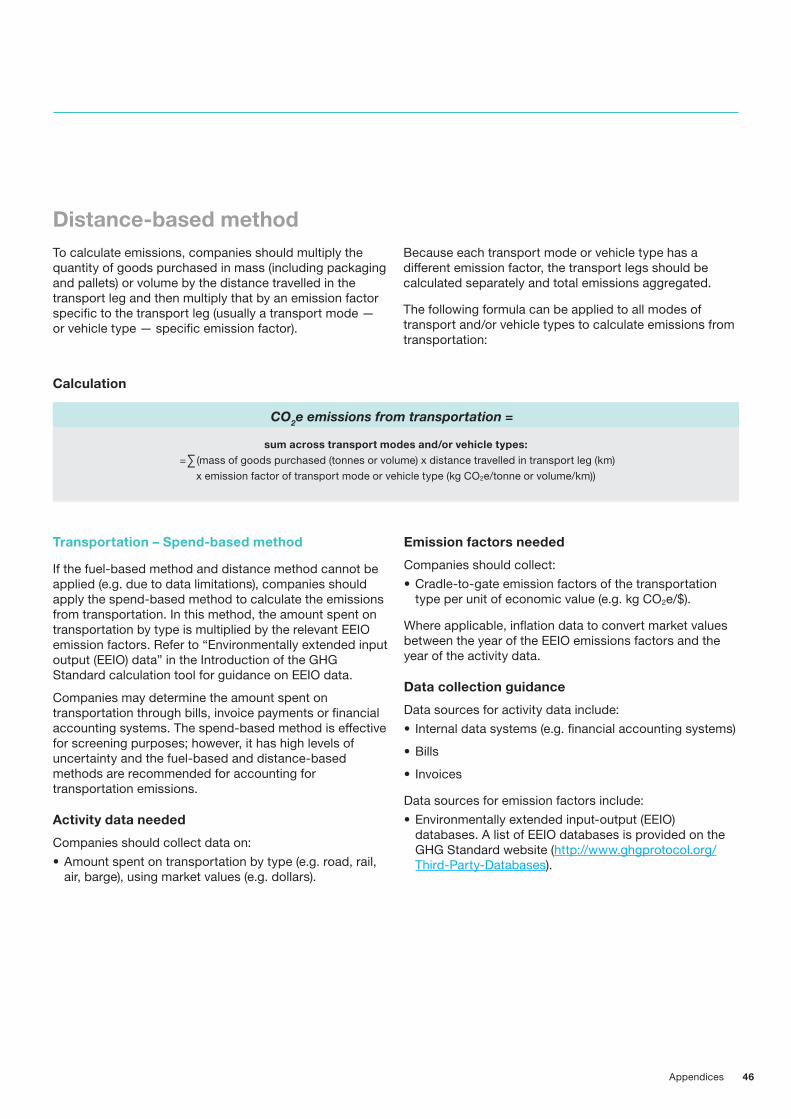
46Appendices
Distance-based methodTo calculate emissions, companies should multiply the quantity of goods purchased in mass (including packaging and pallets) or volume by the distance travelled in the transport leg and then multiply that by an emission factor specific to the transport leg (usually a transport mode — or vehicle type — specific emission factor).
Because each transport mode or vehicle type has a different emission factor, the transport legs should be calculated separately and total emissions aggregated.
The following formula can be applied to all modes of transport and/or vehicle types to calculate emissions from transportation:
Transportation – Spend-based method
If the fuel-based method and distance method cannot be applied (e.g. due to data limitations), companies should apply the spend-based method to calculate the emissions from transportation. In this method, the amount spent on transportation by type is multiplied by the relevant EEIO emission factors. Refer to “Environmentally extended input output (EEIO) data” in the Introduction of the GHG Standard calculation tool for guidance on EEIO data.
Companies may determine the amount spent on transportation through bills, invoice payments or financial accounting systems. The spend-based method is effective for screening purposes; however, it has high levels of uncertainty and the fuel-based and distance-based methods are recommended for accounting for transportation emissions.
Activity data needed
Companies should collect data on:• Amount spent on transportation by type (e.g. road, rail,
air, barge), using market values (e.g. dollars).
Emission factors needed
Companies should collect:• Cradle-to-gate emission factors of the transportation
type per unit of economic value (e.g. kg CO2e/$).
Where applicable, inflation data to convert market values between the year of the EEIO emissions factors and the year of the activity data.
Data collection guidance
Data sources for activity data include:• Internal data systems (e.g. financial accounting systems)
• Bills
• Invoices
Data sources for emission factors include:• Environmentally extended input-output (EEIO)
databases. A list of EEIO databases is provided on the GHG Standard website (http://www.ghgprotocol.org/Third-Party-Databases).
Calculation
CO2e emissions from transportation =
∑sum across transport modes and/or vehicle types:
= (mass of goods purchased (tonnes or volume) x distance travelled in transport leg (km)x emission factor of transport mode or vehicle type (kg CO2e/tonne or volume/km))
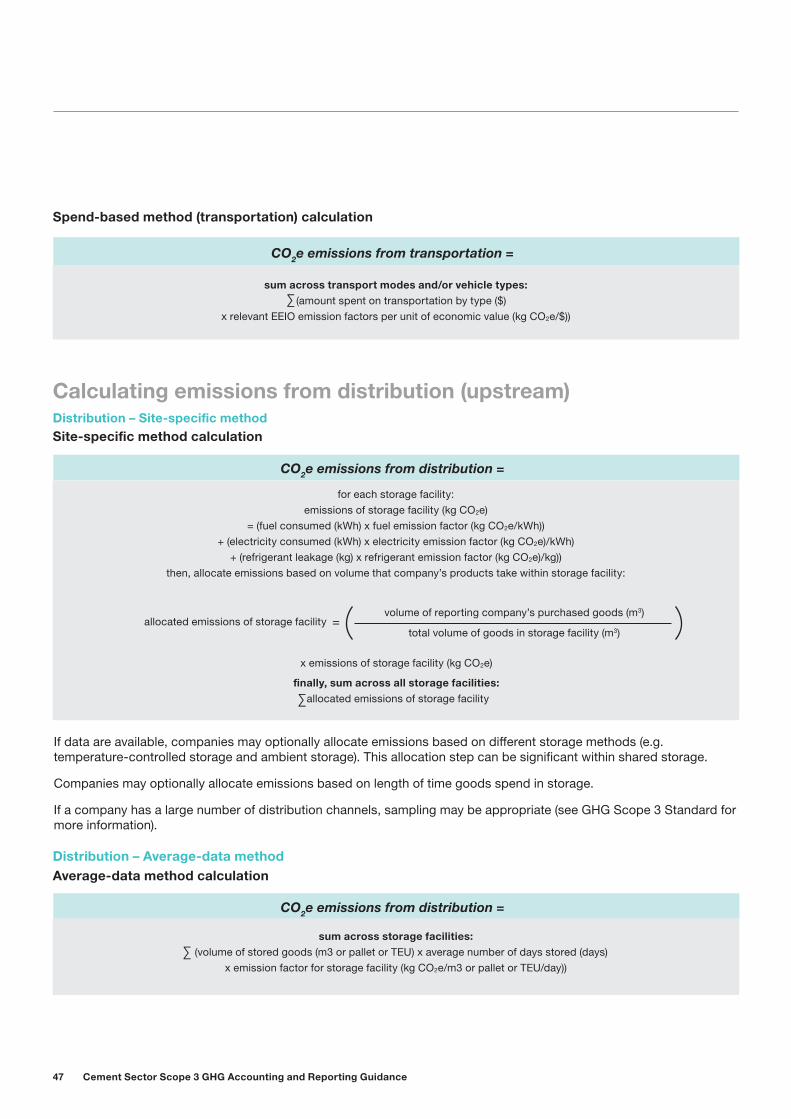
47 Cement Sector Scope 3 GHG Accounting and Reporting Guidance
Spend-based method (transportation) calculation
Distribution – Site-specific method Site-specific method calculation
Distribution – Average-data methodAverage-data method calculation
If data are available, companies may optionally allocate emissions based on different storage methods (e.g. temperature-controlled storage and ambient storage). This allocation step can be significant within shared storage.
Companies may optionally allocate emissions based on length of time goods spend in storage.
If a company has a large number of distribution channels, sampling may be appropriate (see GHG Scope 3 Standard for more information).
CO2e emissions from distribution =
CO2e emissions from distribution =
allocated emissions of storage facility =volume of reporting company’s purchased goods (m3)
total volume of goods in storage facility (m3)
x emissions of storage facility (kg CO2e)
finally, sum across all storage facilities: allocated emissions of storage facility∑
Calculating emissions from distribution (upstream)
CO2e emissions from transportation =
∑sum across transport modes and/or vehicle types:
(amount spent on transportation by type ($)x relevant EEIO emission factors per unit of economic value (kg CO2e/$))
for each storage facility:emissions of storage facility (kg CO2e)
= (fuel consumed (kWh) x fuel emission factor (kg CO2e/kWh))+ (electricity consumed (kWh) x electricity emission factor (kg CO2e)/kWh)
+ (refrigerant leakage (kg) x refrigerant emission factor (kg CO2e)/kg))then, allocate emissions based on volume that company’s products take within storage facility:
∑sum across storage facilities:
(volume of stored goods (m3 or pallet or TEU) x average number of days stored (days)x emission factor for storage facility (kg CO2e/m3 or pallet or TEU/day))
48
About the World Business Council for Sustainable Development (WBCSD)
The World Business Council for Sustainable Development (WBCSD), a CEO-led organisation of some 200 forwardthinking global companies, is committed to galvanising the global business community to create a sustainable future for business, society and the environment. Together with its members, the council applies its respected thought leadership and effective advocacy to generate constructive solutions and take shared action. Leveraging its strong relationships with stakeholders as the leading advocate for business, the council helps drive debate and policy change in favour of sustainable development solutions.
The WBCSD provides a forum for its member companies – who represent all business sectors, all continents and a combined revenue of more than $7 trillion – to share best practices on sustainable development issues and to develop innovative tools that change the status quo. The council also benefits from a network of 65+ national and regional business councils and partner organisations, a majority of which are based in developing countries.
www.wbcsd.org
About the Cement Sustainability Initiative (CSI)
The CSI is a global effort by 24 leading cement producers, with operations in more than 100 countries. Collectively, these companies account for around 30% of the world’s cement production and range in size from very large multinationals to smaller local producers. All CSI members have integrated sustainable development into their business strategies and operations, as they seek strong financial performance with an equally strong commitment to social and environmental responsibility. The CSI is an initiative of the World Business Council for Sustainable Development (WBCSD).
www.wbcsdcement.org
Disclaimer
This report is released in the name of the WBCSD. It is the result of a collaborative effort by members of the secretariat and executives from member companies participating in the Cement Sustainability Initiative (CSI). Drafts were reviewed among CSI members, so ensuring that the document broadly represents the majority view of this group. This does not mean, however, that every member company agrees with every word.
Copyright: © WBCSD, October 2016
Designer: PwC
Photo credits: Courtesy of CSI member companies and iStock.
ISBN: 978-2-940521-22-7

World Business Council for Sustainable Development Maison de la Paix, Chemin Eugène-Rigot 2,Case postale 246, 1211 Geneve 21, Tel: +41 (0)22 839 31 00115 Fifth Ave, 6th Floor, New York, NY 100034th Floor, Worldmark 2, Aerocity, New Delhi 110037, India, Tel: +91 11 4138 7361