Embed Size (px)
Citation preview

8/9/2019 Cement HSCtext
http://slidepdf.com/reader/full/cement-hsctext 1/11
Insert A
It is important to note the high-strength and high-performance concrete are not
synonymous. Concrete is defined as “high-strength concrete” solely on the basis of its
compressive strength measured at a given age. In the 1970’s, any concrete mixtures that
showed 40 MPa or more compressive strength at 28-days were designed as high-strength
concrete. Later, 60-100 MPa concrete mixtures were commercially developed and usedin the construction of high-rise buildings and long-span bridges in many parts of the
world.
The definition of high-performance concrete is more controversial. Mehta and
Aitcin1 used the term, high-performance concrete (HPC) for concrete mixtures
possessing high workability, high durability and high ultimate strength. An ACI
committee on HPC 2 defined high-performance concrete as a concrete meeting special
combinations of performance and uniformity requirements that cannot always be
achieved routinely using conventional constituents and normal mixing, placing, and
curing practice. This definition has been used by the construction industry to develop
very high-early strength concrete mixtures and designate them as high-performance
concrete. High-early strength concrete is often made with a high cement content, a verylow water-cement ratio, a highly reactive pozzolan such as silica fume, and is called
high-performance concrete. The structure may not turn out to be durable and
maintenance-free because these concrete mixtures generate too much heat and are
characterized by high autogeneous and drying shrinkage, and therefore are prone to
cracking. A concrete structure containing interconnected cracks and microcracks will not
be durable under severe exposure conditions and will give “low-performance” according
to Mehta and Aitcin’s definition. This next section is restricted to the materials and
properties of high-strength concrete.
Insert B –
Almost any ASTM portland cement type can be used to obtain concrete with
adequate rheology and with compressive strength up to 60 MPa. In order to obtain
higher strength mixtures while maintaining good workability, it is necessary to study
carefully the cement composition and finenesses and its compatibility with the chemical
admixtures. Experience has shown that low-C3A cements generally produce concrete
with improved rheology.
In normal-strength concrete, the type and amount of aggregate plays an important
role in the volume stability of concrete, but it has limited influence on the strength. In
high-strength concrete, the aggregate remains important for volume stability, but it also
plays an important role on the strength of concrete. The low-water to cement ratio usedin high-strength concrete causes densification in both the matrix and interfacial transition
zone, and the aggregate may become the weak link in the development of the mechanical
1 P.K. Mehta and P.C. Aitcin, Cement, Concrete, and Aggregates Journal, ASTM, Vol. 12, No. 2, pp. 70-
78, 1990.2 H.G. Russell, ACI Defines High-Performance Concrete, ACI Concrete International, pp.56-7, February
1999.

8/9/2019 Cement HSCtext
http://slidepdf.com/reader/full/cement-hsctext 2/11
strength. Extreme care is necessary, therefore, in the selection of aggregate to be used in
very high-strength concrete.
The particle size distribution of fine aggregate that meets the ASTM
specifications (see Chapter 7) is adequate for high-strength concrete mixtures. If possible,
Aitcin3
recommends using fine aggregates with higher fineness modulus (around 3.0).His reasoning is as follows: a) high-strength concrete mixtures already have large
amounts of small particles of cement and pozzolan, therefore fine particles of aggregate
will not improve the workability of the mix; b) the use of coarser fine aggregates requires
less water to obtain the same workability; and c) during the mixing process, the coarser
fine aggregates will generate higher shearing stresses that can help prevent floculation of
the cement paste.
Insert C
Aitcin4 summarized the general guidelines for the selection of materials to be
used in high strength concrete:
The higher the targeted compressive strength, the smaller the maximumsize of coarse aggregate. Up to 70 MPa compressive strength can be
produced with a good coarse aggregate of a maximum size ranging from 20
to 28 mm. To produce 100 MPa compressive strength aggregate with a
maximum size of 10 to 20 mm should be used. To date, concretes with
compressive strengths of over 125 MPa have been produced, with 10 to 14
mm maximum size coarse aggregate.
Using supplementary cementitious materials, such as blast-furnace slag,
fly ash and natural pozzolans, not only reduces the production cost of
concrete, but also addresses the slump loss problem. The optimum
substitution level is often determined by the loss in 12- or 24-hour strength
that is considered acceptable, given climatic conditions or the minimumstrength required. While silica fume is usually not really necessary for
compressive strengths under 70 MPa, most concrete mixtures contain it
when higher strengths are specified.
Properties
Microstructure. The description of the interfacial transition of normal strength
concrete is presented in Chapter 2. This porous zone, where cracks often originate,
prevents the efficient load transfer between the coarse aggregate and the cement mortar.
From the general principles behind the design of high-strength concrete mixtures, it is
apparent that high strengths are made possible by reducing porosity, inhomogeneity, and
microcracks in the hydrated cement paste and the transition zone. Compare thediagrammatic representation of the interfacial transition zone and bulk cement paste in
normal-strength concrete (Fig. 2-14) and in high-strength concrete (Fig. *). The large
volume and size of voids in the interfacial transition zone is drastically reduced for high-
strength concrete. The utilization of fine pozzolanic materials in high-strength concrete
3 P.C. Aitcin, High-Performance Concrete, E & FN Spon, pp. 10, 1998.4 P.C. Aitcin, High-Performance Concrete, E & FN Spon, pp. 10, 1998.
8/9/2019 Cement HSCtext
http://slidepdf.com/reader/full/cement-hsctext 3/11
leads to a reduction of the size of the crystalline compounds, particularly, calcium
hydroxide. Consequently, there is a reduction of the thickness of the interfacial transition
zone in high-strength concrete. The densification of the interfacial transition zone allows
for efficient load transfer between the cement mortar and the coarse aggregate,
contributing to the strength of the concrete. For very high-strength concrete where the
matrix is extremely dense, a weak aggregate may become the weak link in concretestrength. It should be noted that due to reduction in porosity in the interfacial transition
zone, high-strength concrete will have a different fracture mechanism than normal
strength concrete.
Strength
The evolution of compressive strength of normal strength concrete with time is
presented in Eqs. (3-4) and (3-5). Based on 289 observations of moist-cured high-
strength concrete samples made with Type III cement, Mokhtarzadeh and French5
obtained the following relationship:
f cm = f c28
t
0.89 + 0.97t
(*)
The notation is the same as for Eq. (3-4). The ultimate strength of normal strength
predicted by Eq. 3-4 is 17% higher than the compressive strength at 28 days. The
estimation for high-strength concrete using Eq. (*) is only 3% higher than at 28 days.
Field and experimental results confirm that high-strength concrete develops fast strength
at early ages which stabilizes after a few weeks. Laboratory results of high-strength
concrete exposed for long periods in air showed a small decrease in strength, particularly
if the samples contained silica fume6. Fortunately, this strength retrogression has not
been found in field applications and a possible reason for the strength loss is drying of thesmall samples, thereby creating residual stresses and some microcracking.
Because of a decrease in the amount and extent of microcracks in the interfacial
transition zone of high-strength concrete, ascending branches of the stress-strain curve
are steeper and more linear to a higher percentage of the peak strength than in normal
strength concrete. Iravani and MacGregor 7 reported linearity of the stress-strain diagram
at 65 to 70, 75 to 80 and above 85% of the peak load for concrete with compressive
strengths of 65, 95, and 105 MPa.
5 A. Mokhtarzadeh and C. French, Mechanical Properties of High-Strength Concrete with Consideration
for Precast Applications, ACI Materials Journal , 97(2):136-147, 2000.6 F. de Larrard and P.C. Aitcin, The Strength Retrogression of Silica Fume Concrete. ACI Materials
Journal , 90(6):581-5, 1993.7 S. Iravani and J. G. MacGregor, Sustained Load Strength and Short-Term Strain Behavior of High-
Strength Concrete, ACI Materials Journal , 95(5):636-647, 1998.
8/9/2019 Cement HSCtext
http://slidepdf.com/reader/full/cement-hsctext 4/11
In his classic paper 8, Rüsch showed that the sustained loading strength of normal-
strength concrete is about 75% of the short-term loading strength. Further research
indicates that for normal strength concrete, the sustained strength has a broader range,
say 65 to 75%, of the short-term strength. Such information is vital for structural
engineers who are responsible for the long-term structural safety of reinforced concrete
structures. As explained in Chapter 4, around 70-75% of the short-term strength,numerous microcracks are formed in the matrix and in the interfacial transition zone. If
this load is sustained, the cracks can grow over time and eventually may develop a failure
plane, leading to the collapse of the concrete. From their experimental study of high-
strength concrete, Iravani and MacGregor 9 suggested the following strength values for
sustained loading:
• 70 to 75% (of the short-time loading strength) for 65 MPa concrete
• 75 to 80% for 95 MPa concrete, without silica fume
• 85 to 90% for 105 MPa concrete, with silica fume
• 85 to 90% for 120 MPa concrete, with silica fume
These results indicate that the reduction of the porosity needed to obtain a higher
compressive strength also delays the formation and propagation of the microcracks,
therefore increasing the allowable sustained load. Silica fume contributes to the
densification and grain refinement of the cement paste and the interfacial transition zone,
therefore, it is not surprising that its use also increases the allowable sustained load.
The strength of concrete under biaxial compression is higher than under uniaxial
compression because the confining stresses delay the formation and propagation of
cracks. The state of stresses is relevant for normal and high strength concrete, and for
normal weight and lightweight concrete. Figure ** shows the biaxial strength envelopes
for various types of concrete. The results are normalized by the unconfined uniaxialcompressive strength, σco. The maximum biaxial strength occurs when the confining
stress is about half of the other principal stress. At this stress ratio, note that the strength
increases compared to unconfined uniaxial compressive strength of 31%, 32%, 35%, and
38% for normal strength, high-strength, ultra-high strength concrete, and high-strength
light-weight concrete, respectively10
.
Insert Fig.4 from Hussein and Marzourk
Caption
Biaxial strength envelopes for normal strength concrete with at 91 days (NSC), high-
strength lightweight concrete (LWAC), ultra-high strength concrete (UHSC), and high-strength concrete (HSC). The unconfined uniaxial compressive strength, σco at 91 days
8 H Rüsch., Researches Toward a General Flexural Theory for Structural Concrete, ACI Journal , 57:1-28,
1960.9 S. Iravani and J. G. MacGregor, Sustained Load Strength and Short-Term Strain Behavior of High-
Strength Concrete, ACI Materials Journal , 95(5):636-647, 1998.10 A. Hussein and H. Marzouk, Behavior of High-Strength Concrete under Biaxial Stresses, ACI Materials
Journal , 97(1):27-36, 2000.
8/9/2019 Cement HSCtext
http://slidepdf.com/reader/full/cement-hsctext 5/11
were 44.3 MPa, 68.7 MPa, 100.1 MPa, and 76.6 MPa for NSC, LWAC, UHSC, and
HSC, respectively. [From A. Hussein and H. Marzouk, Behavior of High-Strength
Concrete under Biaxial Stresses, ACI Materials Journal , 97(1):27-36, 2000.]
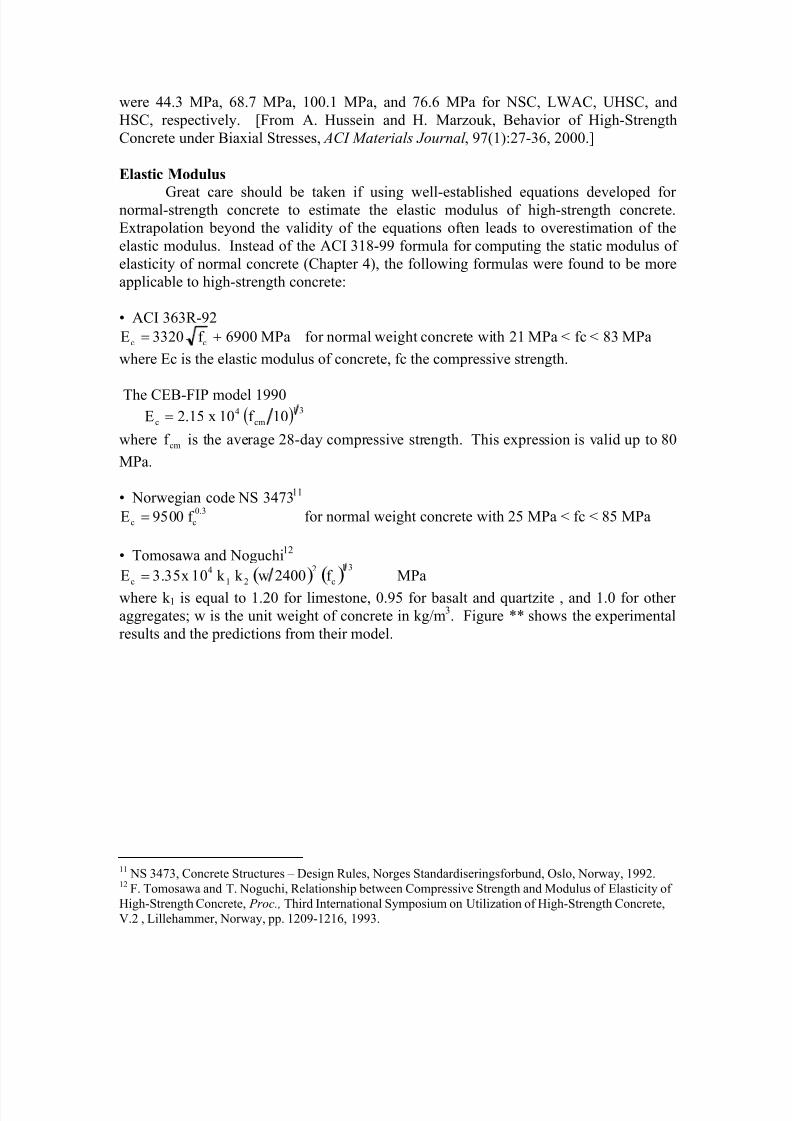
Elastic Modulus
Great care should be taken if using well-established equations developed fornormal-strength concrete to estimate the elastic modulus of high-strength concrete.
Extrapolation beyond the validity of the equations often leads to overestimation of the
elastic modulus. Instead of the ACI 318-99 formula for computing the static modulus of
elasticity of normal concrete (Chapter 4), the following formulas were found to be more
applicable to high-strength concrete:
• ACI 363R-92
Ec = 3320 f c + 6900 MPa for normal weight concrete with 21 MPa < fc < 83 MPa
where Ec is the elastic modulus of concrete, fc the compressive strength.
The CEB-FIP model 1990( ) 31
cm
4
c 10f 10x15.2E =
where cmf is the average 28-day compressive strength. This expression is valid up to 80
MPa.
• Norwegian code NS 347311
Ec = 9500 f c0.3
for normal weight concrete with 25 MPa < fc < 85 MPa
• Tomosawa and Noguchi12
Ec = 3.35x 10⁴
k 1 k 2 w 2400( )2 f c( )1 3 MPa
where k 1 is equal to 1.20 for limestone, 0.95 for basalt and quartzite , and 1.0 for other
aggregates; w is the unit weight of concrete in kg/m3. Figure ** shows the experimental
results and the predictions from their model.
11 NS 3473, Concrete Structures – Design Rules, Norges Standardiseringsforbund, Oslo, Norway, 1992.12 F. Tomosawa and T. Noguchi, Relationship between Compressive Strength and Modulus of Elasticity of
High-Strength Concrete, Proc., Third International Symposium on Utilization of High-Strength Concrete,
V.2 , Lillehammer, Norway, pp. 1209-1216, 1993.

8/9/2019 Cement HSCtext
http://slidepdf.com/reader/full/cement-hsctext 6/11
Figure ** from Tomosawa and Noguchi
The reason why it is easier to increase the compressive strength than the elastic
modulus is clear if concrete is treated as a composite material formed by rigid inclusions
of aggregate dispersed in the cement paste matrix (see Chapter 12).
Chemical and Autogeneous shrinkage
During hydration of the cement paste in a closed system, the volume of the
hydration products, Vh , is less than the sum of the volume of water and the volume of
cement that is hydrated. This leads to chemical shrinkage, εch , whose magnitude can be
expressed by:
εch =Vc + Vw( )− Vh
Vci + Vwi
where Vc and Vci are the current and initial volume of cement, and Vw and Vwi are the
current and initial volume of water, respectively. In the literature, chemical shrinkage is
also referred as “Le Chatelier contraction”, in honor of the French scientist who first
0
20000
40000
60000
0 50 100 150 200
river gravelCrushed GraywackCrushed QuartzCrushed LimestoneCrushed AndesiteBlast furnace slagCalcined bauxiteCrushed CobbleCrushed BasaltLightweight CALightweight FA + CAModel
E l a s t i c M o d u l u s ( M P a )
Compressive Strength (MPa)
8/9/2019 Cement HSCtext
http://slidepdf.com/reader/full/cement-hsctext 7/11
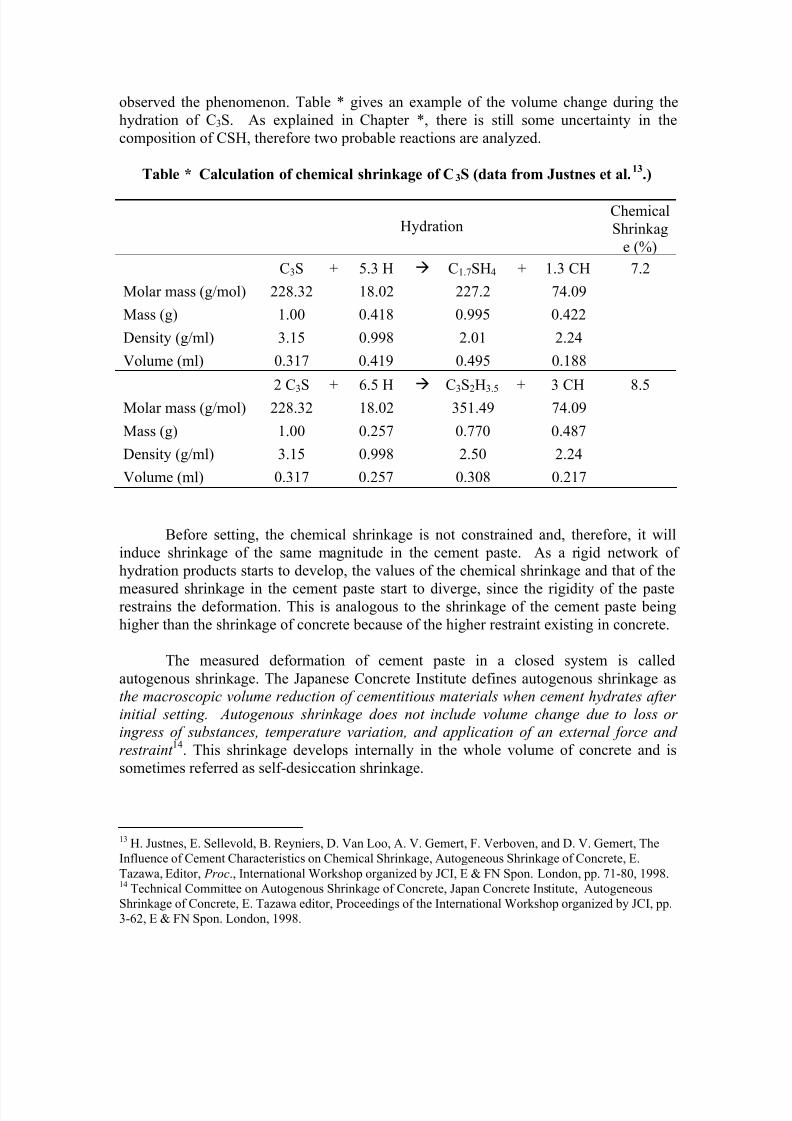
observed the phenomenon. Table * gives an example of the volume change during the
hydration of C3S. As explained in Chapter *, there is still some uncertainty in the
composition of CSH, therefore two probable reactions are analyzed.
Table * Calculation of chemical shrinkage of C3S (data from Justnes et al.13
.)
HydrationChemical
Shrinkag
e (%)
C3S + 5.3 H C1.7SH4 + 1.3 CH 7.2
Molar mass (g/mol) 228.32 18.02 227.2 74.09
Mass (g) 1.00 0.418 0.995 0.422
Density (g/ml) 3.15 0.998 2.01 2.24
Volume (ml) 0.317 0.419 0.495 0.188
2 C3S + 6.5 H
C3S2H3.5 + 3 CH 8.5Molar mass (g/mol) 228.32 18.02 351.49 74.09
Mass (g) 1.00 0.257 0.770 0.487
Density (g/ml) 3.15 0.998 2.50 2.24
Volume (ml) 0.317 0.257 0.308 0.217
Before setting, the chemical shrinkage is not constrained and, therefore, it will
induce shrinkage of the same magnitude in the cement paste. As a rigid network of
hydration products starts to develop, the values of the chemical shrinkage and that of the
measured shrinkage in the cement paste start to diverge, since the rigidity of the pasterestrains the deformation. This is analogous to the shrinkage of the cement paste being
higher than the shrinkage of concrete because of the higher restraint existing in concrete.
The measured deformation of cement paste in a closed system is called
autogenous shrinkage. The Japanese Concrete Institute defines autogenous shrinkage as
the macroscopic volume reduction of cementitious materials when cement hydrates after
initial setting. Autogenous shrinkage does not include volume change due to loss or
ingress of substances, temperature variation, and application of an external force and
restraint 14
. This shrinkage develops internally in the whole volume of concrete and is
sometimes referred as self-desiccation shrinkage.
13 H. Justnes, E. Sellevold, B. Reyniers, D. Van Loo, A. V. Gemert, F. Verboven, and D. V. Gemert, The
Influence of Cement Characteristics on Chemical Shrinkage, Autogeneous Shrinkage of Concrete, E.
Tazawa, Editor, Proc., International Workshop organized by JCI, E & FN Spon. London, pp. 71-80, 1998.14 Technical Committee on Autogenous Shrinkage of Concrete, Japan Concrete Institute, Autogeneous
Shrinkage of Concrete, E. Tazawa editor, Proceedings of the International Workshop organized by JCI, pp.
3-62, E & FN Spon. London, 1998.
8/9/2019 Cement HSCtext
http://slidepdf.com/reader/full/cement-hsctext 8/11
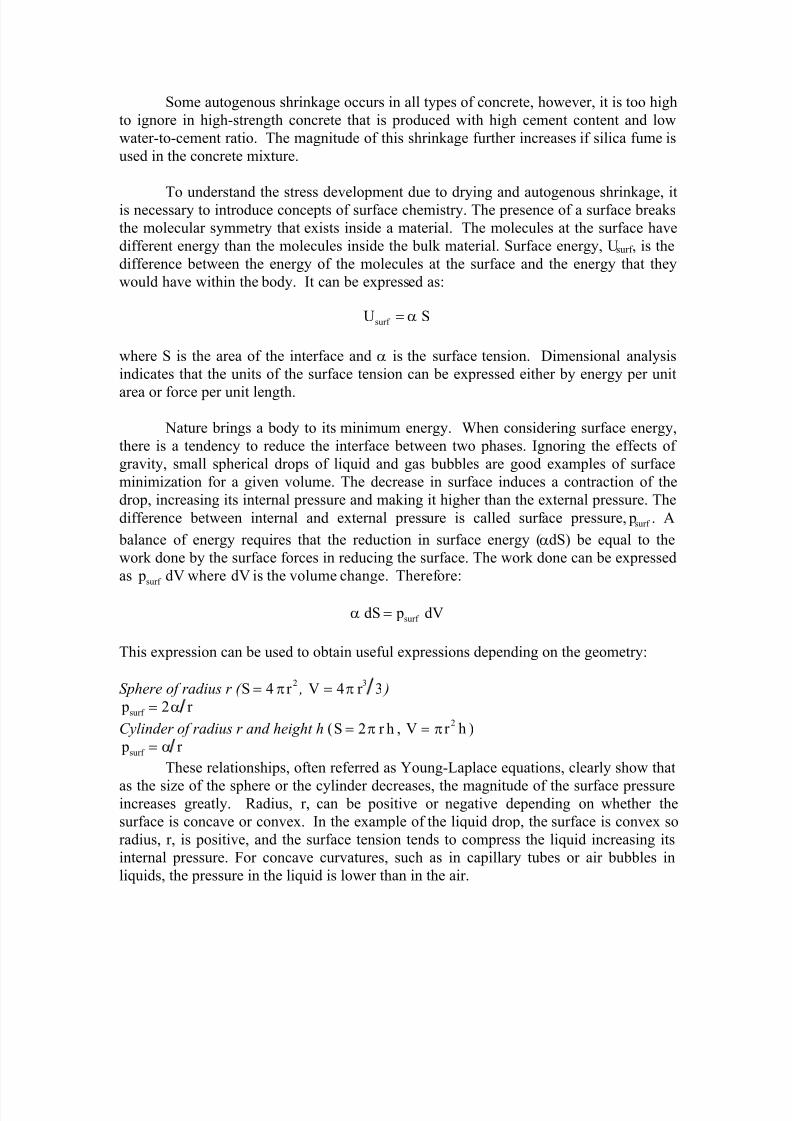
Some autogenous shrinkage occurs in all types of concrete, however, it is too high
to ignore in high-strength concrete that is produced with high cement content and low
water-to-cement ratio. The magnitude of this shrinkage further increases if silica fume is
used in the concrete mixture.
To understand the stress development due to drying and autogenous shrinkage, itis necessary to introduce concepts of surface chemistry. The presence of a surface breaks
the molecular symmetry that exists inside a material. The molecules at the surface have
different energy than the molecules inside the bulk material. Surface energy, Usurf , is the
difference between the energy of the molecules at the surface and the energy that they
would have within the body. It can be expressed as:
Usurf = α S
where S is the area of the interface and α is the surface tension. Dimensional analysis
indicates that the units of the surface tension can be expressed either by energy per unit
area or force per unit length.
Nature brings a body to its minimum energy. When considering surface energy,
there is a tendency to reduce the interface between two phases. Ignoring the effects of
gravity, small spherical drops of liquid and gas bubbles are good examples of surface
minimization for a given volume. The decrease in surface induces a contraction of the
drop, increasing its internal pressure and making it higher than the external pressure. The
difference between internal and external pressure is called surface pressure, psurf . A
balance of energy requires that the reduction in surface energy (αdS) be equal to the
work done by the surface forces in reducing the surface. The work done can be expressed
as psurf dV where dV is the volume change. Therefore:
α dS = psurf dV
This expression can be used to obtain useful expressions depending on the geometry:
Sphere of radius r ( S = 4π r 2 , V = 4π r
33 )
psurf = 2α r
Cylinder of radius r and height h (S = 2π r h , V = π r 2h )
psurf = α r
These relationships, often referred as Young-Laplace equations, clearly show that
as the size of the sphere or the cylinder decreases, the magnitude of the surface pressureincreases greatly. Radius, r, can be positive or negative depending on whether the
surface is concave or convex. In the example of the liquid drop, the surface is convex so
radius, r, is positive, and the surface tension tends to compress the liquid increasing its
internal pressure. For concave curvatures, such as in capillary tubes or air bubbles in
liquids, the pressure in the liquid is lower than in the air.
8/9/2019 Cement HSCtext
http://slidepdf.com/reader/full/cement-hsctext 9/11
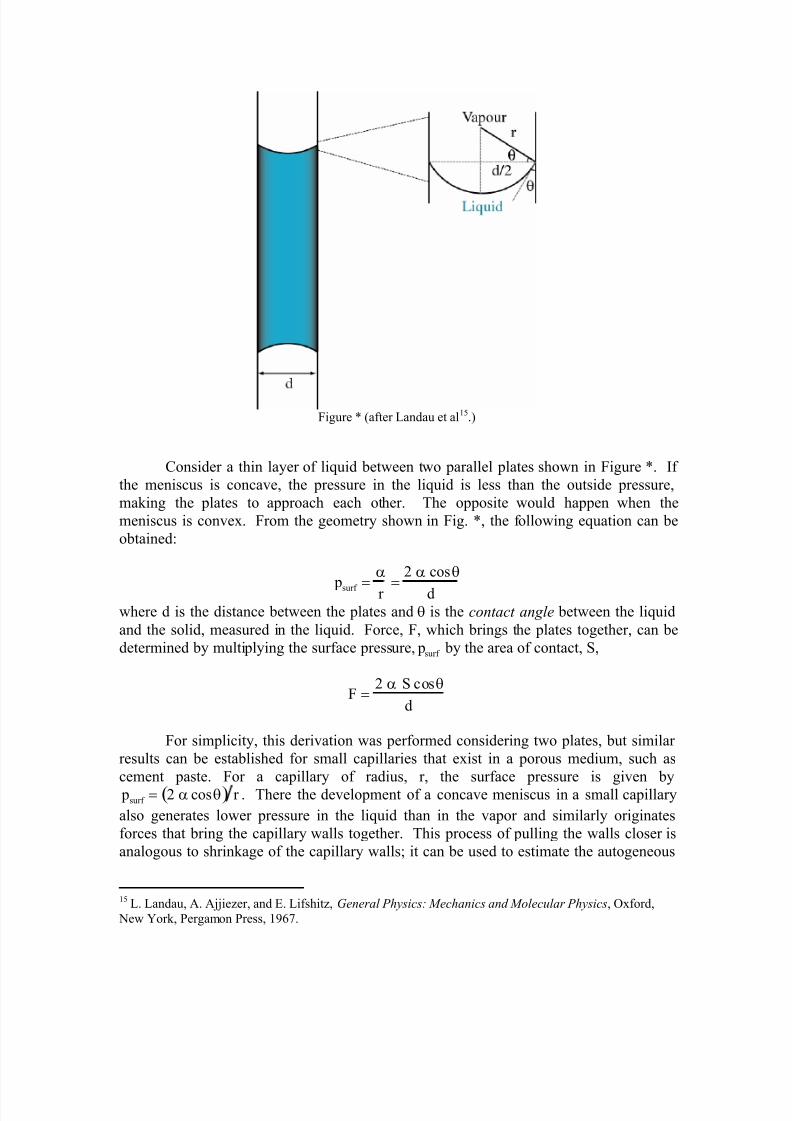
Figure * (after Landau et al15.)
Consider a thin layer of liquid between two parallel plates shown in Figure *. If
the meniscus is concave, the pressure in the liquid is less than the outside pressure,
making the plates to approach each other. The opposite would happen when the
meniscus is convex. From the geometry shown in Fig. *, the following equation can be
obtained:
psurf =
α
r =
2 α cosθ
d where d is the distance between the plates and θ is the contact angle between the liquid
and the solid, measured in the liquid. Force, F, which brings the plates together, can be
determined by multiplying the surface pressure, psurf by the area of contact, S,
F =2 α S cosθ
d
For simplicity, this derivation was performed considering two plates, but similar
results can be established for small capillaries that exist in a porous medium, such as
cement paste. For a capillary of radius, r, the surface pressure is given by
psurf = 2 α cosθ( ) r . There the development of a concave meniscus in a small capillary
also generates lower pressure in the liquid than in the vapor and similarly originates
forces that bring the capillary walls together. This process of pulling the walls closer is
analogous to shrinkage of the capillary walls; it can be used to estimate the autogeneous
15 L. Landau, A. Ajjiezer, and E. Lifshitz, General Physics: Mechanics and Molecular Physics, Oxford,
New York, Pergamon Press, 1967.

8/9/2019 Cement HSCtext
http://slidepdf.com/reader/full/cement-hsctext 10/11
volume change. In a porous material, the internal stress, σc , in the matrix caused by the
capillary pressure can be estimated by:
σc 1− V( ) + p surf V = 0
where V is the relative volume of pores. In normal strength concrete, the volume of pores ranges from 15 to 20%, whereas for high strength concrete the value is lower than
15%. The capillary pressure can be estimated from the relative humidity existing inside
the concrete, either by mathematical equations or tabulated data from surface chemistry
textbooks. For instance, a relative humidity of 90% inside the concrete generates a
capillary pressure of 14.6 MPa. Assuming a porosity of 15% in the concrete and using
the equation above leads to a compressive stress σc of 2.6 MPa. This stress will cause a
viscoelastic strain εc in the concrete given by
εc =σEc
1 + ϕ( )
where Ec is the elastic modulus and, ϕ , the creep coefficient. In the example where the
compressive stress was 2.6 MPa, assuming an elastic modulus of 35 GPa and a creep
coefficient of 2, we obtain a strain of 222 x 10-6
. This value is of the same order of
magnitude as reported by experimental results. More sophisticated analysis can be found
in the work of Hua et al16
.
To avoid cracking due to the volume changes, it is necessary to minimize all
factors contributing to the total shrinkage of a high-strength concrete mixture (i.e.,
plastic, thermal, autogenous, and drying). Mix proportions can reduce the potential
volume changes, however, only a properly designed curing process can prevent the
formation of cracks. High-strength concrete has little bleeding, so it is very sensitive to plastic shrinkage, therefore a water mist should be provided or an evaporation-retarding
curing membrane should be applied to the surface of the fresh concrete. As the concrete
hardens, water curing should be provided to prevent drying of the concrete mass. To
guarantee a small shrinkage over time, the application of an impervious film may become
necessary once the water-cure ends. This sequence is diagrammatically shown in Fig. **.
Insert Fig. **
Schematic representation of a desirable curing pattern [from Aitcin, Neville, and Acker 17
]
I’m working on Thermal Strain, Creep, Fracture and Durability.
16 C. Hua, P. Acker, and A. Ehrlacher, Analyses and Models of the Autogenous Shrinkage of Hardening
Cement Paste, Cement and Concrete Research, 25(7):1457-1468, 1995.17 P.C. Aitcin, A.M Neville, and P. Acker, Integrated View of Shrinkage Deformation, Concrete
International, pp. 35-41, September, 1997.
8/9/2019 Cement HSCtext
http://slidepdf.com/reader/full/cement-hsctext 11/11
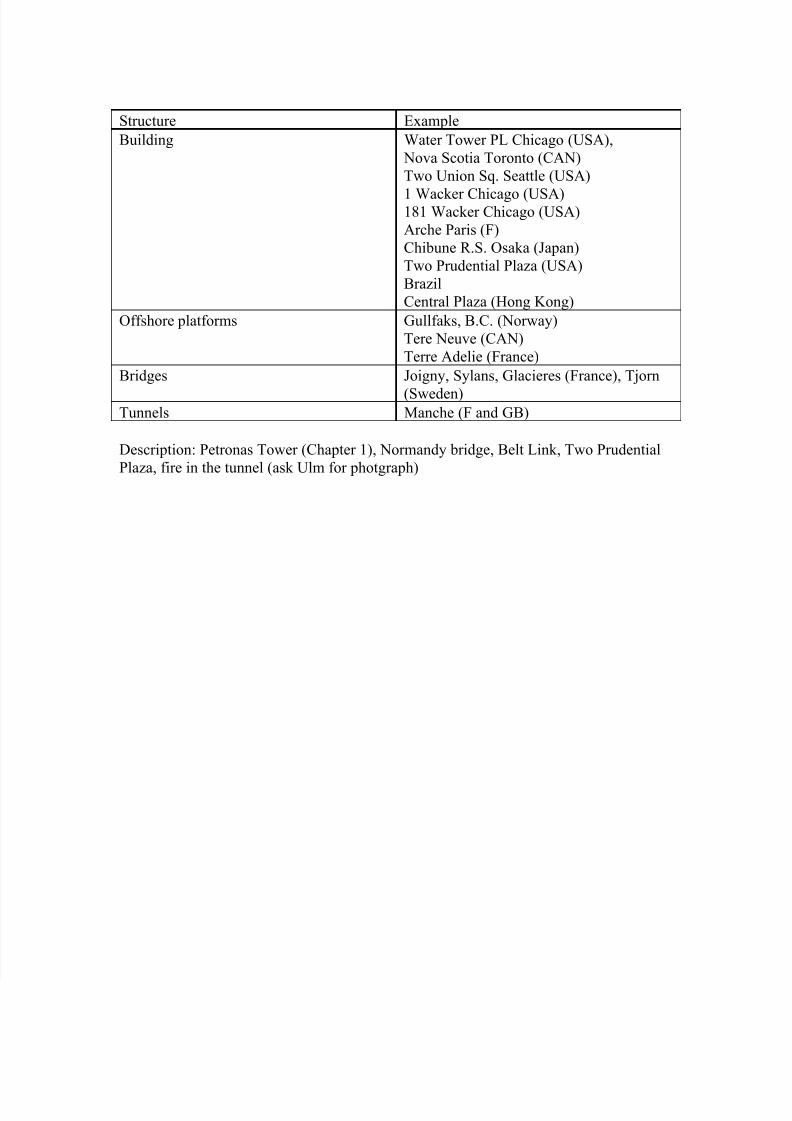
Structure Example
Building Water Tower PL Chicago (USA),
Nova Scotia Toronto (CAN)
Two Union Sq. Seattle (USA)
1 Wacker Chicago (USA)181 Wacker Chicago (USA)
Arche Paris (F)
Chibune R.S. Osaka (Japan)
Two Prudential Plaza (USA)
Brazil
Central Plaza (Hong Kong)
Offshore platforms Gullfaks, B.C. (Norway)
Tere Neuve (CAN)
Terre Adelie (France)
Bridges Joigny, Sylans, Glacieres (France), Tjorn
(Sweden)Tunnels Manche (F and GB)
Description: Petronas Tower (Chapter 1), Normandy bridge, Belt Link, Two Prudential
Plaza, fire in the tunnel (ask Ulm for photgraph)