Embed Size (px)
Citation preview

Thesis submitted in partial fulfillment of the requirements for the degree of Doctor of Philosophy
Cellular Tracking and Mitosis Detection in Dense In-vitro Cellular Data
By
Ketheesan Thirusittampalam
Supervisor: Professor Paul F. Whelan
Dublin City University School of Electronic Engineering
April 2012

ii
Declaration I hereby certify that this material, which I now submit for assessment on the
programme of study leading to the award of Doctor of Philosophy is entirely my own
work, that I have exercised reasonable care to ensure that the work is original, and
does not to the best of my knowledge breach any law of copyright, and has not been
taken from the work of others save and to the extent that such work has been cited
and acknowledged within the text of my work.
Signed: (Candidate) ID No.: 57123438 Date:
iii
Title: Cellular Tracking and Mitosis Detection in Dense In-vitro Cellular Data
Author: Ketheesan Thirusittampalam
Abstract
Cell migration and cell division are two key processes that are associated with a wide range of biological phenomena including embryogenesis, inflammation, wound healing, tumour development etc. The study of these cellular processes has received a substantial interest from the cell and molecular scientists since the understanding of the mechanisms that stimulate and control these dynamic events has important practical implications. With the advent of modern microscopy imaging modalities the amount of information required to be analysed by the clinical experts has substantially increased and the development of computer-based automatic techniques that are able to robustly track cells in large image sequences is currently one of the most active topics of research. While cellular migration is the major source of information in describing biological processes, recent studies emphasised the growing importance of cell mitosis, as this information can be directly used in the estimation of the cell cycle and in the understanding of complex biological mechanisms.
Due to the increasing clinical interest in the automatic analysis of cellular data, a substantial number of studies have been recently reported in the field of cellular imaging and in the development of robust solutions that are able to identify the cell mitosis. Following a detailed analysis of published works in the field of cellular tracking, it can be concluded that the development of automated tracking strategies proved extremely challenging due to several factors such as changes in cell morphology over time, random motion, cell division, cell interaction and low signal to noise ratio. To answer these challenges in a robust manner, several approaches have been advanced where the key task was the cellular association. In this regard, the major directions of research explored cellular tracking techniques where the cellular association was implemented using either segmentation or model-driven strategies. The methods included in the former category attempt to identify the cells in each frame of the sequence and then they are later associated by employing rules that enforce the continuity of the tracking process in the spatio-temporal domain. For these approaches the cellular association process proved particularly challenging when the cells undergo shape deformation over time and their motility is generally described by random motion patterns. To adapt to these challenges, alternative approaches where parametric or non-parametric representations that sample the cells morphologies and their intensity patterns were employed to identify the corresponding cells in consecutive frames of the sequence. These methods offer the advantage that they do not entail the segmentation of the cells in each frame, but they were also problematic in the presence of cell mitosis and cell interaction - a situation when they are likely to be either trapped in local minima or to return incorrect cell associations. A distinct category of model-driven cellular tracking techniques applied motion prediction to guide the cellular association process, but practice has indicated that the simplistic inclusion of the motion estimators in the tracking process proved troublesome since the resulting tracking strategies are not able to sample in a coherent manner the modes of motion that encompass the cell migration. In the vast majority of the published works on cell tracking, the cellular division has been approached during cellular association and often their application was restricted to particular cellular data types.
iv
The major objective of this thesis is to introduce a novel framework that is able to
address the theoretical and practical challenges associated with the cell tracking and cell division (mitosis) detection in dense time-lapse image sequences. To this end, a multi-phase adaptive algorithm was developed where the cell association is carried out by evaluating the topology of the local cell structures in consecutive frames of the sequences. To allow for a detailed evaluation of the local cellular structures, the connectivity rules between the neighbouring cells are encoded using Delaunay triangulation. A particular challenge associated with phase-contrast cellular datasets is associated with the large intensity contrast variation and the relative high level of noise that is present in the image data, and the robust identification of the cells throughout the sequence proved problematic. To compensate for the inconsistent inter-frame cell segmentations, in the proposed framework, a novel approach based on the evaluation of the topology changes in the local cellular structures was developed, with substantial benefits in relation to overall tracking accuracy. The last component of the proposed algorithm addresses the mitosis detection using a backward tracking analysis that integrates the local cellular structures with a pattern matching algorithm for the identification of the mitotic cells that were missed in the forward tracking phase of the algorithm.
While the major contributions that emerge from this work are associated with the proposed computational framework that has been designed to address cellular tracking and mitosis detection, it would be useful to point out that another contribution resides in the detailed performance analysis of the algorithm. Thus, to comprehensively evaluate the performance of the proposed framework, several challenging time-lapse phase-contrast cell image sequences were used in the experimental study and the results returned by the proposed automatic cell tracking algorithms were compared against the manually annotated data. To further evaluate the performance of the developed method it has also been applied to public available cellular datasets and its performance is compared against those reported by the state-of-the-art cellular tracking and mitosis detection implementations. The experimental results indicate that the proposed method is able to successfully track phase-contrast cells in the presence of random migration and detect the mitosis events, and its performance proved superior to those attained by the state-of-the-art implementations.
v
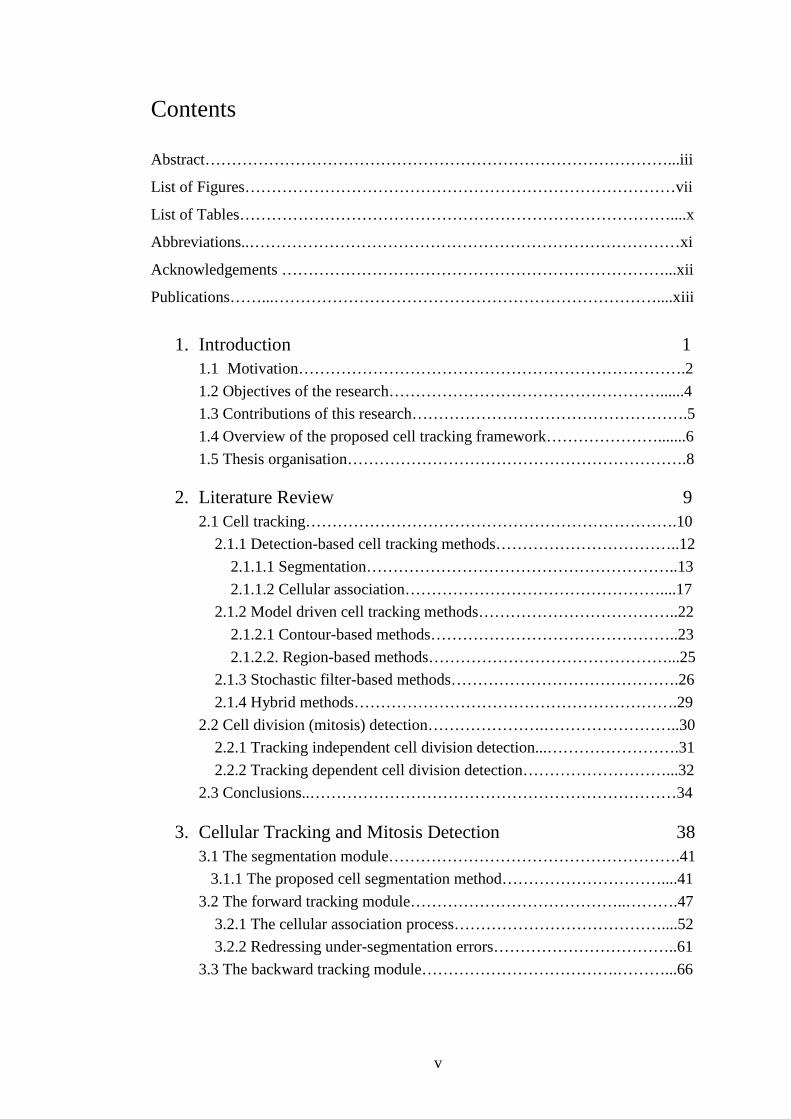
Contents
Abstract……………………………………………………………………………...iii
List of Figures………………………………………………………………………vii
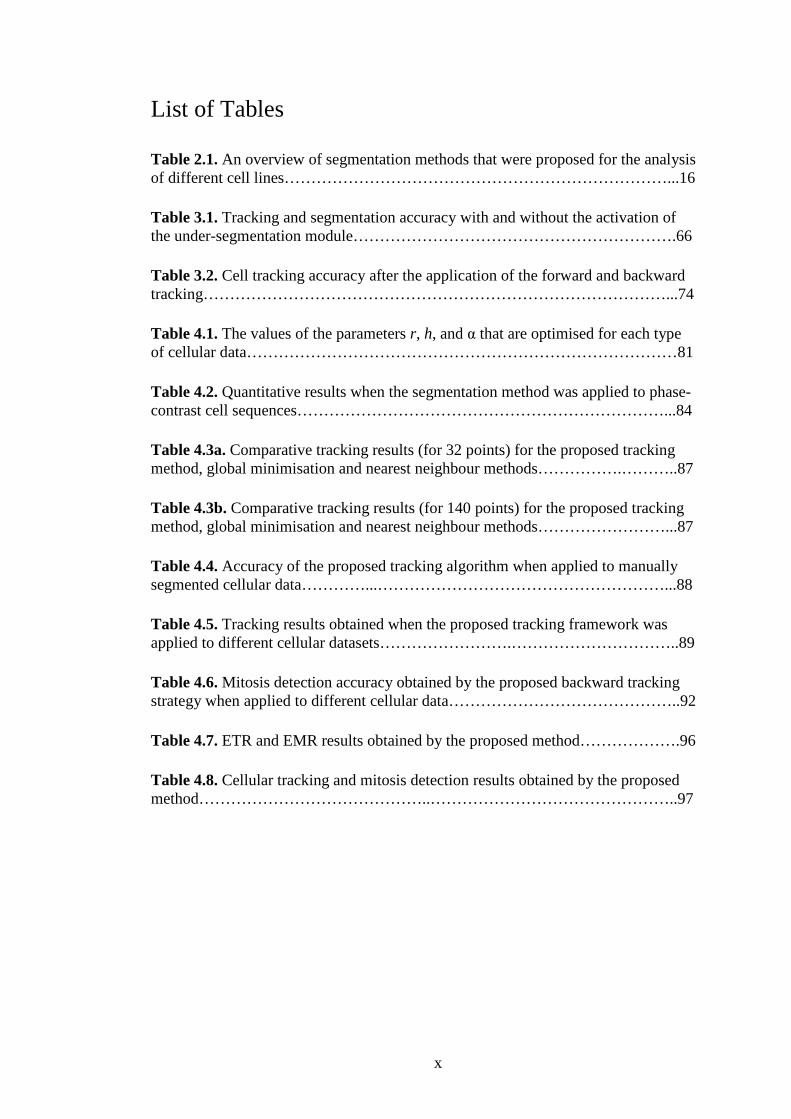
List of Tables………………………………………………………………………....x
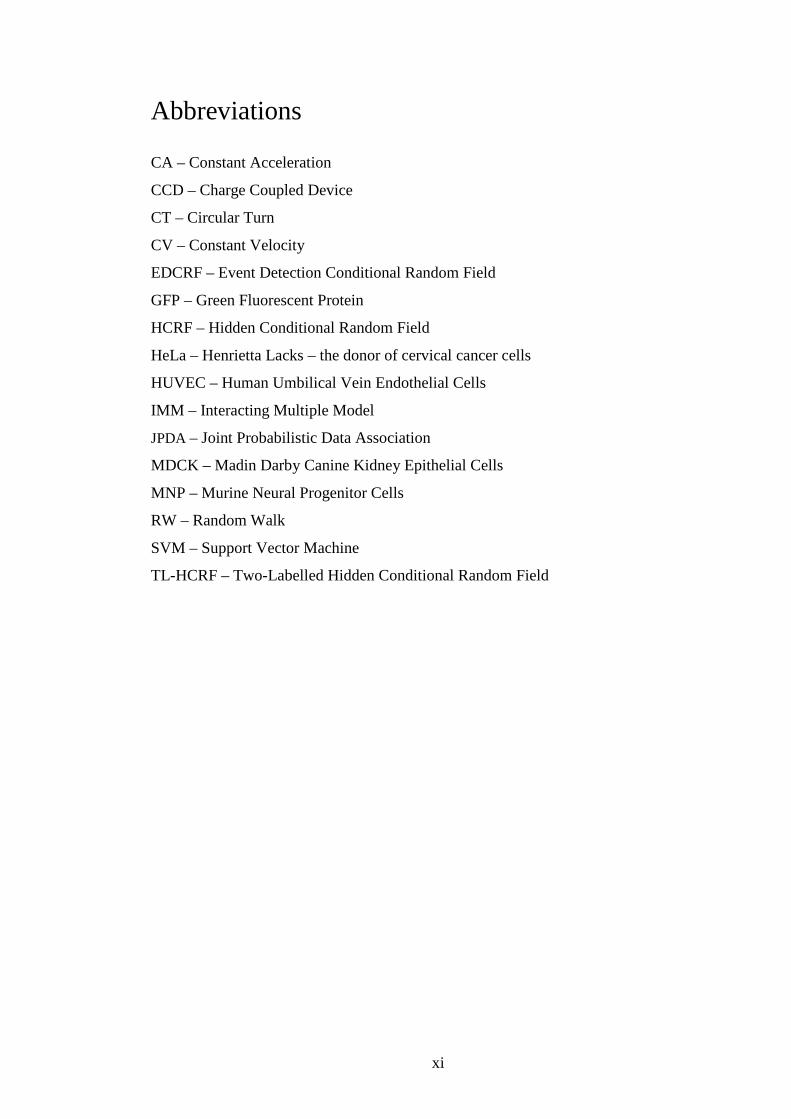
Abbreviations..………………………………………………………………………xi
Acknowledgements ………………………………………………………………...xii
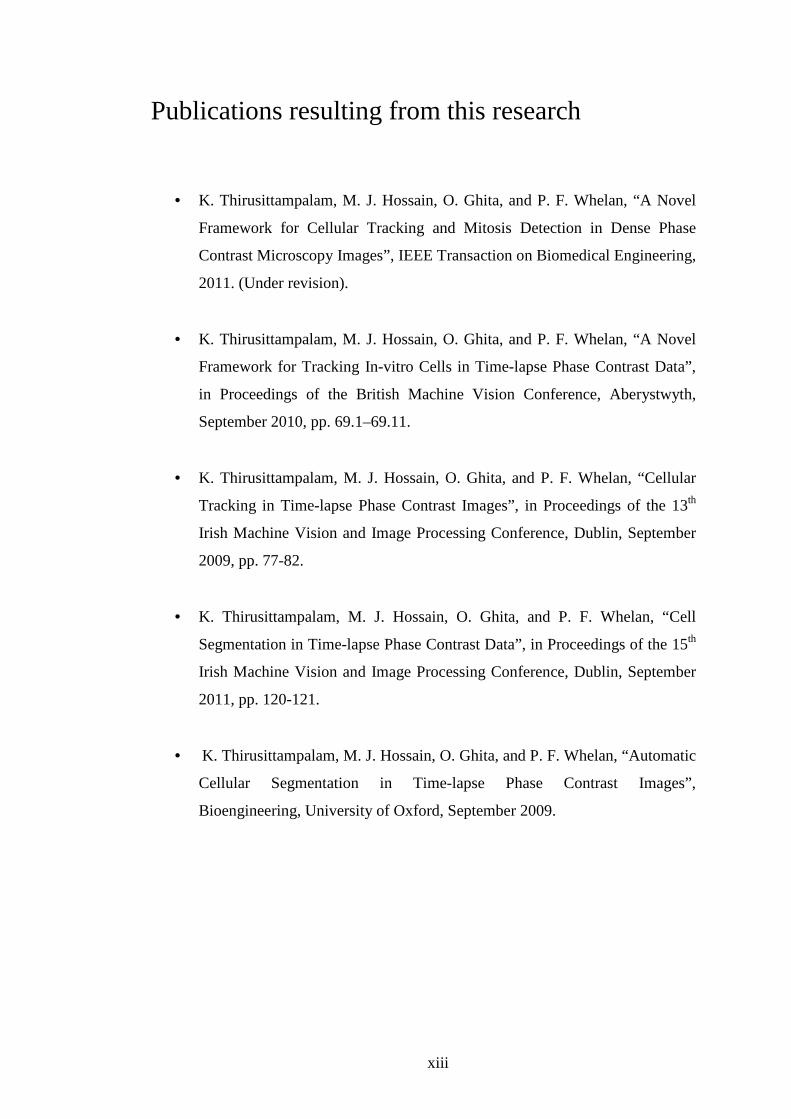
Publications……...………………………………………………………………....xiii
1. Introduction 1
1.1 Motivation……………………………………………………………….2
1.2 Objectives of the research……………………………………………......4
1.3 Contributions of this research…………………………………………….5
1.4 Overview of the proposed cell tracking framework………………….......6
1.5 Thesis organisation……………………………………………………….8
2. Literature Review 9 2.1 Cell tracking…………………………………………………………….10
2.1.1 Detection-based cell tracking methods……………………………..12
2.1.1.1 Segmentation…………………………………………………..13
2.1.1.2 Cellular association…………………………………………....17
2.1.2 Model driven cell tracking methods………………………………..22
2.1.2.1 Contour-based methods………………………………………..23
2.1.2.2. Region-based methods………………………………………...25
2.1.3 Stochastic filter-based methods…………………………………….26
2.1.4 Hybrid methods…………………………………………………….29
2.2 Cell division (mitosis) detection………………….……………………..30
2.2.1 Tracking independent cell division detection...…………………….31
2.2.2 Tracking dependent cell division detection………………………...32
2.3 Conclusions..……………………………………………………………34
3. Cellular Tracking and Mitosis Detection 38 3.1 The segmentation module……………………………………………….41
3.1.1 The proposed cell segmentation method…………………………....41
3.2 The forward tracking module…………………………………..……….47
3.2.1 The cellular association process…………………………………....52
3.2.2 Redressing under-segmentation errors……………………………..61
3.3 The backward tracking module……………………………….………...66
vi
4. Experimental Results 75
4.1 Generation of the ground truth data…………………………………......79
4.2 Validation of the cellular segmentation algorithm……………………...80
4.3 Validation of the forward tracking algorithm…………………………...84
4.4 Experimental results using synthetic and manually annotated data…….85
4.5 Experimental results for real cellular data – Automatic segmentation….88
4.6 Experimental results for cellular division (mitosis) detection…………..92
4.7 Comparative results obtained by the proposed framework and state-of-
the-art implementations..……………………………………………………95
5. Conclusions and Future Works 98 5.1 Contributions…………………………………………………………..100
5.2 Future directions of research…………………………………………..102 Appendix A………………………………………………………………………..104
Appendix B………………………………………………………………………...110
References…………………………………………………………………………113
vii
List of Figures
Figure 1.1. Main computational components of the proposed cell tracking and mitosis detection framework………………………………………………………...7
Figure 2.1. Categorisation of the processes and approaches in the field of cellular tracking and mitosis detection.……………………………………………………..12
Figure 2.2. Illustration of the cell association process..…………………………….17
Figure 3.1. The block diagram of the proposed cellular tracking and mitosis detection framework………………………………………………………………...39
Figure 3.2. The overview of the cell segmentation module………………………..42
Figure 3.3.1. Cell segmentation process showing the steps associated with the application of morphological filter …………………………………….……….......43
Figure 3.3.2. Cell segmentation process showing the steps associated with h-maxima transform and Gaussian smoothing………………………………...…………….…44
Figure 3.4. Additional segmentation results for HUVEC data………...……….…..45
Figure 3.5.1. Examples that illustrate under-segmentation error in MDCK data…..46
Figure 3.5.2. Examples that illustrate under-segmentation error in HUVEC data…47
Figure 3.6.1. The use of global and local relationship for cellular association.........49
Figure 3.6.2 Delaunay triangulation and its advantages in cellular association…....50
Figure 3.6.3. Examples that illustrate that the removal and the insertion of nodes affect the structure encoded by the Delaunay mesh only at local level……………..51
Figure 3.7.1. The local structure associated with a cell in the Delaunay mesh.........52
Figure 3.7.2. Example that illustrate the problem associated with the use of the shortest Euclidean distance in triangle matching…………………………………...54
Figure 3.8. An example that illustrates a case where the local structures for two nodes are completely matched......…………………………………………………..56
Figure 3.9. The first stage of the cell association process………………………….57
Figure 3.10. Examples that illustrate two cases of corresponding nodes for which their local structure has been partially matched…………………………………….58
viii
Figure 3.11. The cell association using partial structure matching………………...59
Figure 3.12. Matching results at the end of the two-stage cellular association process………………………………………………………………………………60
Figure 3.13. 2D+time plot detailing the cell tracks for 100 frames………..……...61
Figure 3.14. An example that illustrates the step by step operations associated with the under-segmentation module……………………………………………………64
Figure 3.15. 2D+time plot that illustrates the tracking results when the under segmentation module has been applied…………………………………...………...65
Figure 3.16.1. Two examples that illustrate the problems generated by under segmentation during cell division…………………………………...………………67
Figure 3.16.2. 2D+time plot that illustrates the forward tracking results in the presence of cellular division………………………………………………………...68
Figure 3.17.1. An example that illustrate four consecutive frames that depict a cell division event………………………………………………..………………………70
Figure 3.17.2 The backward tracking process in the presence of under-segmentation …………………………….……………………………………………..………….71
Figure 3.18. Tracking results displayed in 2D+time plots…………………………72
Figure 3.19. 2D+time plots that outline the results obtained by the proposed cellular tracking and mitosis detection algorithm…………………………………………...73
Figure 4.1.1. Four consecutive frames from a phase-contrast MDCK image sequence...…………………………………………………………………………..76
Figure 4.1.2. Four consecutive frames from a phase-contrast HUVEC image sequence.…………………………………………………………………….……...77
Figure 4.2. Additional cellular datasets used in the experimental study…………...78
Figure 4.3. Robustness of the segmentation in low contrast image data…………...82
Figure 4.4. Segmentation results when the proposed algorithm was applied to different cellular data…………………………………………………………...…...83
Figure 4.5.1. Tracking results for MDCK and HUVEC cellular data……………...90
Figure 4.5.2. Tracking results for MNP and HeLa cellular data…………………...91
ix
Figure 4.6.1. 2D+time plots that illustrate the tracking and mitosis detection in MDCK and HUVEC cellular data...………………………………………………...93
Figure 4.6.2. 2D+time plots that illustrate the tracking and mitosis detection in MNP and HeLa cellular data………………………………………………………………94
Figure A1. Diagram that illustrates the calculation of the directional movement and the total cell displacement…………………………………………………………105
Figure A2. Cell migration indicators calculated for the MDCK data….....……….105
Figure A3. The total cell displacement calculated for several cellular data..……..106
Figure A4.1. Directional movement extracted from MDCK data ……...………...108
Figure A4.2. Directional movement extracted from HUVEC data ………………109
Figure B1. A sample image showing HeLa cells………………………………....111
Figure B2. Sample images showing MDCK and HUVEC data……...…………..112
x
List of Tables
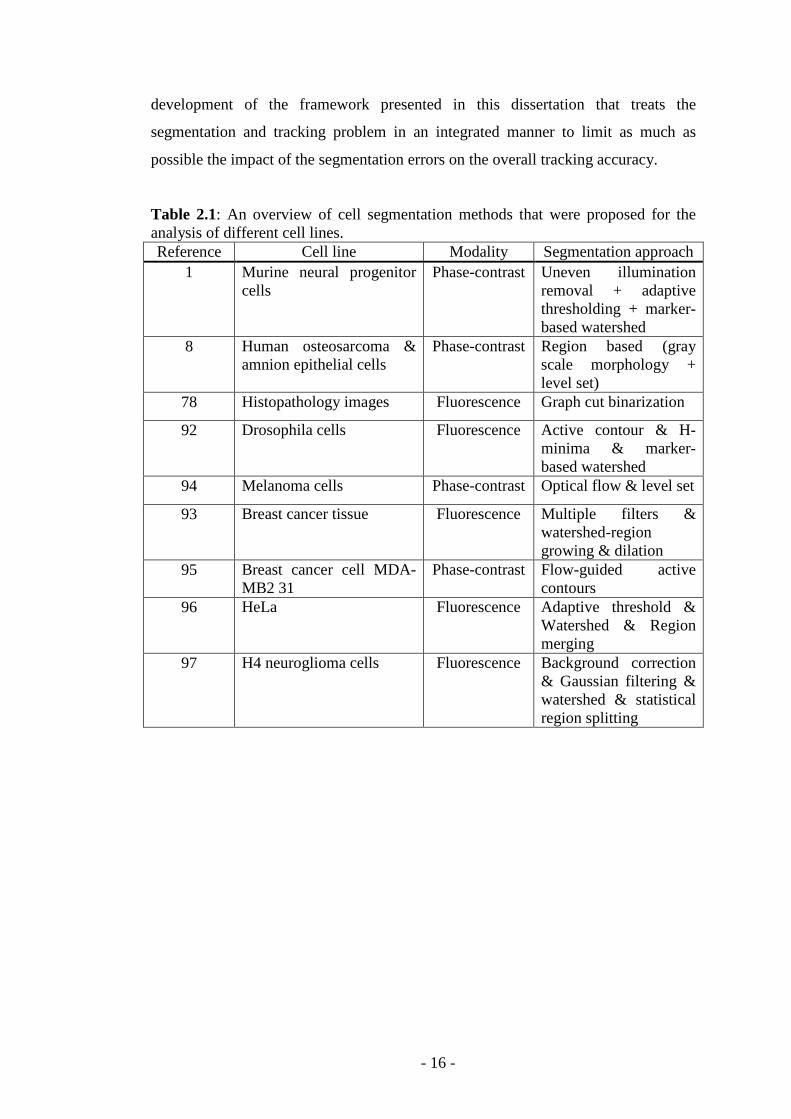
Table 2.1. An overview of segmentation methods that were proposed for the analysis of different cell lines………………………………………………………………...16
Table 3.1. Tracking and segmentation accuracy with and without the activation of the under-segmentation module…………………………………………………….66
Table 3.2. Cell tracking accuracy after the application of the forward and backward tracking……………………………………………………………………………...74
Table 4.1. The values of the parameters r, h, and α that are optimised for each type of cellular data………………………………………………………………………81
Table 4.2. Quantitative results when the segmentation method was applied to phase- contrast cell sequences……………………………………………………………...84
Table 4.3a. Comparative tracking results (for 32 points) for the proposed tracking method, global minimisation and nearest neighbour methods…………….………..87
Table 4.3b. Comparative tracking results (for 140 points) for the proposed tracking method, global minimisation and nearest neighbour methods……………………...87
Table 4.4. Accuracy of the proposed tracking algorithm when applied to manually segmented cellular data…………...………………………………………………...88
Table 4.5. Tracking results obtained when the proposed tracking framework was applied to different cellular datasets…………………….…………………………..89
Table 4.6. Mitosis detection accuracy obtained by the proposed backward tracking strategy when applied to different cellular data……………………………………..92
Table 4.7. ETR and EMR results obtained by the proposed method……………….96
Table 4.8. Cellular tracking and mitosis detection results obtained by the proposed method……………………………………..………………………………………..97
xi
Abbreviations
CA – Constant Acceleration
CCD – Charge Coupled Device
CT – Circular Turn
CV – Constant Velocity
EDCRF – Event Detection Conditional Random Field
GFP – Green Fluorescent Protein
HCRF – Hidden Conditional Random Field
HeLa – Henrietta Lacks – the donor of cervical cancer cells
HUVEC – Human Umbilical Vein Endothelial Cells
IMM – Interacting Multiple Model
JPDA – Joint Probabilistic Data Association
MDCK – Madin Darby Canine Kidney Epithelial Cells
MNP – Murine Neural Progenitor Cells
RW – Random Walk
SVM – Support Vector Machine
TL-HCRF – Two-Labelled Hidden Conditional Random Field
xii
Acknowledgements
First of all, I would like to express my special thanks to Professor Paul F.
Whelan for giving me the opportunity to work on this research programme and for
his guidance and constant support throughout the course of this project.
I would also like to express my gratitude to Dr. Ovidiu Ghita and Dr. M.
Julius Hossain for their constructive comments and for their help in relation to the
understanding of the theoretical challenges associated with my project. In particular I
would like to mention their unabated enthusiasm and their competent suggestions.
Special thanks go to Dr. András Czirók, Kansas University Medical Center,
for providing most of the data used in the experimental study and for his valuable
clinical input.
I would like to thank all members from the Center for Image Processing and
Analysis (CIPA) for the helpful discussions and for their friendship during my
research period. Also, I would like to extend my thanks to the CIPA administrator
and to the technicians from the School of Electronic Engineering.
I would also like to express my gratitude to the NBIPI - National
Biophotonics & Imaging Platform Ireland and to the Irish Government for funding
my research programme.
Finally, I am most grateful to my parents, wife and my son for their
permanent encouragements and their tremendous support. This project could not be
successfully completed without them.
xiii
Publications resulting from this research
• K. Thirusittampalam, M. J. Hossain, O. Ghita, and P. F. Whelan, “A Novel
Framework for Cellular Tracking and Mitosis Detection in Dense Phase
Contrast Microscopy Images”, IEEE Transaction on Biomedical Engineering,
2011. (Under revision).
• K. Thirusittampalam, M. J. Hossain, O. Ghita, and P. F. Whelan, “A Novel
Framework for Tracking In-vitro Cells in Time-lapse Phase Contrast Data”,
in Proceedings of the British Machine Vision Conference, Aberystwyth,
September 2010, pp. 69.1–69.11.
• K. Thirusittampalam, M. J. Hossain, O. Ghita, and P. F. Whelan, “Cellular
Tracking in Time-lapse Phase Contrast Images”, in Proceedings of the 13th
Irish Machine Vision and Image Processing Conference, Dublin, September
2009, pp. 77-82.
• K. Thirusittampalam, M. J. Hossain, O. Ghita, and P. F. Whelan, “Cell
Segmentation in Time-lapse Phase Contrast Data”, in Proceedings of the 15th
Irish Machine Vision and Image Processing Conference, Dublin, September
2011, pp. 120-121.
• K. Thirusittampalam, M. J. Hossain, O. Ghita, and P. F. Whelan, “Automatic
Cellular Segmentation in Time-lapse Phase Contrast Images”,
Bioengineering, University of Oxford, September 2009.
- 1 -
Chapter 1:
Introduction
This thesis describes the development of a novel automatic tracking
framework that has been specifically designed for cell tracking and mitosis detection
in phase-contrast time-lapse image sequences. Cellular tracking is an important
research area in the field of molecular biology, since the tracking results can be
directly used by clinical experts to estimate motility and proliferation indicators
(please refer to Appendix A for additional details). These cellular indicators are often
used in the process of interpreting a wide spectrum of biological phenomena
including embryogenesis, inflammation, wound healing, tumour development, etc [7,
68, 69, 70]. Typically, cell migration and cellular division (proliferation) are
evaluated in time-lapse image sequences where the image data is captured by a CCD
camera that is fitted to a digital microscope [71]. Subject to various image protocols
that are adjusted for each type of in-vitro cell line, the CCD camera captures cellular
structures at specific time intervals over a long observation period (in some studies
the acquisition time may span several days). While the acquisition of dense time-
lapse image sequences is beneficial as it allows a precise estimation of cellular
indicators, on the other hand it generates a vast amount of image data that has to be
analysed by the clinical experts. The manual analysis of such large cellular datasets
has become (in many situations) impractical, and as a consequence, the development
of computer-based techniques that are able to robustly attain cellular tracking results
represents one of the most active contemporary topics of research in this field. While
cellular migration is the prime source of information when applied to the
description/modelling of in-vitro biological processes, recent studies emphasised the
importance of cellular division, as the frequency of the mitosis events defines a key
indicator that can be used in the assessment of the efficiency of newly developed
therapeutic agents. To this end, the major objective of this thesis is to advance a fully
automatic framework that can accurately estimate the migration patterns and detect
mitosis events in challenging time-lapse phase-contrast image sequences.
- 2 -
1.1 Motivation
Cellular motility and proliferation (mitosis or cell division) are two key
indicators that are assessed in the study of artificially induced physiological and
pathological processes that lead to the development of new drugs and therapies. The
traditional approach that is applied to identify motility patterns and the frequency of
mitosis events involves a user-driven procedure where the cells and the association
rules in the image stack are established based on the decisions made by a clinical
expert (molecular biologist). In general, the manual interpretation of cellular data
returns satisfactory results, but it is important to note that due to the advent of new
microscopy imaging modalities, the amount of data that needs to be interpreted by
the biologists is constantly increasing. There is no doubt that the availability of
cellular data with high spatial and temporal resolutions is welcome as it allows a
detailed analysis of biological processes. At the same time the vast amount of data
renders impractical in many clinical studies the procedure associated with the
manual cell annotation. In addition, manual annotation procedures are prone to intra-
and inter-observer variability, and the accuracy of the user-driven data interpretation
is highly influenced by the experience of the molecular biologist [67]. This is one of
the major reasons that motivated the development of automatic cellular tracking
solutions, which currently represents one of the most important areas of research in
this field.
During the development of automated cell tracking algorithms, the accurate
association of cells in large image sequences represents the major challenging task.
This is caused by several factors such as the high similarities between the intensity of
the cells present in each frame of the sequence and the predominately random nature
of the cellular migration process. In addition, since the image acquisition process
involves the application of specific protocols that are adjusted for each type of in-
vitro cell (for instance, one protocol entails the administration of fluorescent agents
to increase the image contrast between the cells and the background), computer
vision-based tracking solutions have to be designed to accommodate the imaging
characteristics of the data to be analysed. There were substantial studies centred on
the optimisation of the imaging and the specimen preparation protocols, but these
studies were in particular concerned with issues related to extraneous effects on the
- 3 -
biological process that are caused by staining agents (fluorescent dyes) or the
illumination set-up. From an image analysis standpoint, the major objective is to
design an optimised protocol that is able to generate cellular data with sufficient
image contrast, which allows the application of computer vision-based solutions for
the estimation of the relevant biological indicators. To this end, a wide variety of cell
tracking algorithms have been published in the specialised literature where they
attempted to address a specific application domain in the field of molecular biology.
To answer this application driven scenario, the proposed algorithms were custom
designed to serve the segmentation and tracking of specific cellular data. This strict
application context of the published works motivated the research work detailed in
this thesis, whose main goal is to develop a more generic framework that can be
successfully applied to cellular datasets that consist of image sequences that are
captured for diverse cell types. Among the cellular data types that are currently used
in clinical studies, the time-lapse phase-contrast image sequences define a very
complex and challenging tracking scenario that is the main focus of the work
detailed in this thesis. Thus, the proposed framework has been carefully developed to
be able to address several issues related to faint image contrast, intra and inter-frame
intensity variations, large deformations in the shape of the corresponding cells in
consecutive frames of the sequence, random migration and various rates of cellular
division. All these challenges form a difficult research problem and in this thesis,
novel solutions have been advanced to achieve a robust and distinct cell tracking
framework.
Another area of interest was focused on the robust identification of cell
division events. During cell division or mitosis, the parent cells divide into two child
cells (or daughter cells) and the identification of these biological events is
particularly relevant in the estimation of the cell cycle and other related biological
parameters. In some distinct types of cellular datasets, mitosis events are preceded by
apparent changes in the intensity profile of the parent cell and this information can
be used for the robust identification of parent-child cells links. However, other types
of cellular data (such as MDCK datasets) do not exhibit such prominent intensity
transitions, and as a consequence, the precise detection of cellular mitosis requires
the development of more complex solutions that rely on the application of backward
tracking strategies.
- 4 -
1.2 Objectives of the research
The final goal of this research work is the development of a fully automated
framework that adaptively employs the topological information associated with local
cellular structures in the tracking process and in the detection of the cellular division
events. Since the incidence of cell segmentation errors has undesirable effects on the
accuracy of the tracking process, another major aim of this work was the
development of targeted algorithmic solutions that evaluate the consistency of the
cellular association decisions in consecutive frames of the time-lapse image
sequence.
Since the cells in phase–contrast data exhibit similar intensity and shape
characteristics, the process associated with the identification of the corresponding
cells over the entire image cannot be robustly carried out using standard pattern
matching techniques. In addition, the motility of the cells is defined by random
migration and this fact restricts the use of motion prediction in the implementation of
robust cell tracking strategies. To address this challenging cell matching scenario,
the main concept behind the cell tracking approach proposed in this thesis resides in
the construction of a graph-based representation that is able to encode the local
relationships (or topological structure) between the cells that are present in each
frame of the image sequence. By using this representation, the cellular tracking
process can be elegantly formulated as a graph matching process in pairs of
consecutive frames in the image sequence. One important problem, as indicated
earlier, is caused by the cell segmentation errors that occur due to the low contrast
between the cells and the background. Under-segmentation inserts local disturbances
in the graphs that are constructed in each frame, and as a result, artificially reduces
the efficiency of the cell tracking process. To compensate for this issue, a novel
approach to identify and correct these segmentation errors has been developed in this
research work.
The next objective of this research work consists of developing a robust
cellular division detection strategy that is sufficiently flexible to adapt to situations
where the division events are not signalled by conspicuous transitions in the intensity
profile of the parent cells. To achieve this research objective, a novel backward
- 5 -
tracking strategy has been developed that is able to return accurate results in the
presence of segmentation errors. The last major objective associated with this
research work is to perform a comprehensive evaluation of the developed cell
tracking and mitosis detection framework when applied to various cellular datasets
and to compare its performance with respect to those obtained by the state-of-the-art
implementations.
1.3 Contributions of this research
As indicated in the previous section, the process associated with the precise
tracking of cellular structures in phase-contrast time-lapse image data is very
challenging. This is caused by a wide variety of imaging and biological factors
including the low image contrast, intra and inter-frame intensity variations,
unpredictable changes in the shape of the cells in consecutive frames of the
sequence, cellular division, random migration patterns, etc. All these adverse factors
prevent the direct application of common feature-based tracking strategies to address
the cell tracking in long phase-contrast image sequences. In addition, the incidence
of cellular mitosis cannot be robustly predicted/modelled a priori, and this further
complicates the methodologies that have to be devised to achieve robust inter-frame
cellular association.
According to the research objectives stated in Section 1.2, the most visible
contribution associated with this research work consists of the overall cell tracking
and mitosis detection framework. The proposed framework has been developed in a
modular manner and in this work substantial efforts have been devoted to provide a
flexible implementation that allows the inclusion/testing of various computational
components of the proposed cellular tracking and mitosis algorithm using a plug-in
approach.
The second major contribution resulting from this research work is associated
with the theoretical aspects related to the development of the cellular association
process. Thus, in this thesis, a novel graph-based cell association technique has been
introduced, where the spatial relationships between the cells are encoded in a
hierarchical manner by the use of Delaunay triangulation. This approach proved
- 6 -
particularly robust when tracking dense cellular structures in the presence of random
(Brownian) motion and one major aspect that is useful to mention is the fact that the
tracking scheme discussed in this thesis is well adapted to deal with situations caused
by cellular division, which explains its high accuracy when applied to challenging
cell tracking scenarios.
The methodology devised for cell division detection represents another major
contribution resulting from this work. In the proposed approach, the normal tracking
(forward tracking) results are analysed using a backward tracking strategy, which
entails the application of a hybrid algorithm to identify and redress the errors
inserted by the segmentation process.
The last major contribution is located in the detailed experimental validation
of the proposed method on various cellular datasets and in its comparison against
relevant state-of-the-art cell tacking and mitosis detection methods.
Another contribution resulting from the investigation detailed in this
dissertation resides in the algorithmic solution proposed to redress the segmentation
errors (under-segmentation) during the normal (forward) and backward tracking
stages of the algorithm. In the proposed work under-segmentation is addressed by
applying an intensity based pattern matching technique that is combined with a
process that evaluates the consistency of the local cellular structures in adjacent
frames of the image sequence.
1.4 Overview of the proposed cell tracking framework
This section provides a brief description of the structure of the proposed cell
tracking framework that has been developed during this research programme. The
main computational components of the cell tracking and mitosis detection scheme
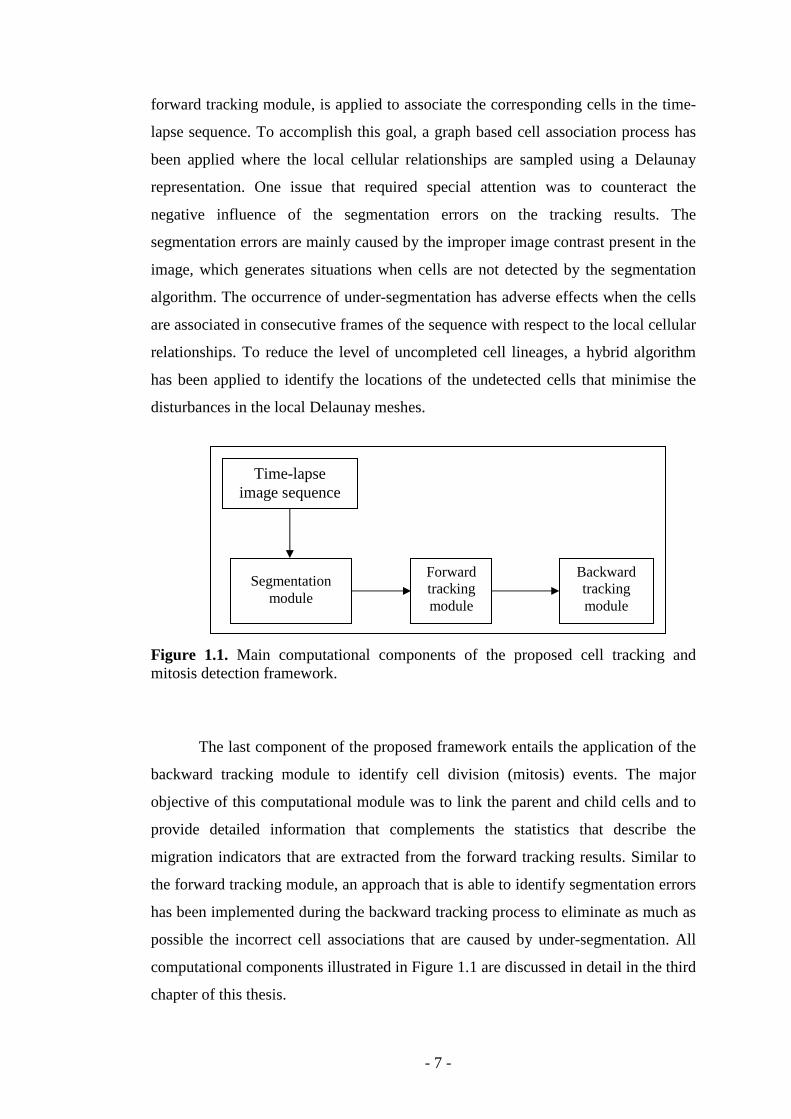
are shown in Figure 1.1. The proposed tracking framework consists of three major
modules including cell segmentation, forward tracking and backward tracking
modules. The developed framework initially detects the cells’ centroid points in each
frame of the image sequence by applying a morphology-based segmentation
approach. Once the cell segmentation process is complete, the next component, the
- 7 -
forward tracking module, is applied to associate the corresponding cells in the time-
lapse sequence. To accomplish this goal, a graph based cell association process has
been applied where the local cellular relationships are sampled using a Delaunay
representation. One issue that required special attention was to counteract the
negative influence of the segmentation errors on the tracking results. The
segmentation errors are mainly caused by the improper image contrast present in the
image, which generates situations when cells are not detected by the segmentation
algorithm. The occurrence of under-segmentation has adverse effects when the cells
are associated in consecutive frames of the sequence with respect to the local cellular
relationships. To reduce the level of uncompleted cell lineages, a hybrid algorithm
has been applied to identify the locations of the undetected cells that minimise the
disturbances in the local Delaunay meshes.
Figure 1.1. Main computational components of the proposed cell tracking and mitosis detection framework.
The last component of the proposed framework entails the application of the
backward tracking module to identify cell division (mitosis) events. The major
objective of this computational module was to link the parent and child cells and to
provide detailed information that complements the statistics that describe the
migration indicators that are extracted from the forward tracking results. Similar to
the forward tracking module, an approach that is able to identify segmentation errors
has been implemented during the backward tracking process to eliminate as much as
possible the incorrect cell associations that are caused by under-segmentation. All
computational components illustrated in Figure 1.1 are discussed in detail in the third
chapter of this thesis.
Time-lapse image sequence
Segmentation module
Forward tracking module
Backward tracking module
- 8 -
1.5 Thesis organisation
Chapter 2 provides an in-depth analysis of past research works on automatic
cell segmentation, tracking and mitosis detection that are published in the specialised
literature. In this chapter the most relevant techniques are discussed and categorised
based on their algorithmic content, and a comprehensive discussion is provided to
emphasise the connections between the theoretical contributions and the clinical
application context.
Chapter 3 presents in detail the development of the cell tracking and mitosis
detection framework, where ample discussions are included to motivate and
emphasise the theoretical advances associated with each component of the proposed
framework.
Chapter 4 details the experimental results that emerged from a
comprehensive validation of the proposed cell tracking framework on various types
of cellular data. The reported results are compared with the manual ground truth
annotations to illustrate the efficiency achieved by the automatic cell tracking
framework with respect to tracking and mitosis detection accuracy. To provide a
wider assessment of the proposed cellular tracking framework, its performance was
quantitatively evaluated on publicly available datasets and compared to those
achieved by state-of-the-art cell tracking and mitosis detection algorithms.
Chapter 5 summarises the main conclusions and contributions resulting from
this research work and discusses the main future directions of research.
- 9 -
Chapter 2:
Literature Review
The study of cell migration entails a three-step process: live cell microscopy,
application of computer vision-driven cell tracking techniques, and evaluation of the
tracking results to understand/model the biological implications associated with the
cell migration. Generally, the cell images are captured by a digital camera that is
fitted to a microscope in order to record the cellular migration/proliferation over a
long period of time. During the data acquisition phase, the camera captures images at
a specific interval of time (usually in the range of minutes) which is generally set in
agreement with the cell type, migration patterns, therapeutic agents, cell environment
interactions, etc. Existing microscopic imaging modalities [90, 110] that are typically
employed to capture sequences of time-lapse images include bright-field/dark-field
[89], phase-contrast [91, 109], differential interference contrast [109], Hoffman
modulation contrast [109] and fluorescence microscopy [89] – a detailed discussion
about most common cellular time-lapse imaging modalities is provided in Appendix
B. The time-lapse images obtained in this process are analysed using computer
vision and image processing techniques that are able to track the cell migration,
detect automatically the mitosis events and generate statistical indicators that
describe the cellular motility such as speed, distance travelled, directionality, cell
cycle, etc. These results are analysed by the molecular scientists to determine/model
the biological processes associated with cellular migration and cellular division.
While the biological implications associated with the interpretation of time-lapse
cellular data represent a very specific and active area of research, it is important to
note that this dissertation mainly addresses the development of automated computer
vision algorithms for cellular tracking and mitosis detection. Thus, the major
objective of this chapter is to provide a comprehensive review of past research work
that was focused on the development of algorithmic solutions that addressed the
automatic tracking of multiple cells and the detection of cell division in time-lapse
microscopic image sequences.
- 10 -
When analysing cellular activity from a biological perspective, the
identification of cellular migration and the detection of cell division are two separate
problems. Along with cellular migration, which is the major source of information in
describing/modelling biological processes, several recent studies emphasised the
growing importance of the cell mitosis (as this information can be directly used in
the estimation of the cell cycle and in the understanding of complex biological
mechanisms). Although cellular migration and mitosis are distinct biological
processes, when they are evaluated from a computer vision standpoint, they cannot
be considered in isolation, since the tracking information that quantifies the cell
migration plays an important role in the identification of the cell division events. By
extending this observation, we can note that the occurrence of cell mitosis has
adverse implications on the robust identification of the corresponding cells in
consecutive frames of the sequence, as the new cells may generate incorrect tracking
decisions. The optimal approach to identify the mitosis events opened a difficult
research problem. Consequently, a distinct category of approaches detailed in the
literature dealt with cellular division in coordination with cellular tracking, while
another category of methods analysed the cell tracking and cell division as
independent problems. For clarity reasons, in this chapter the state-of-the-art cellular
tracking and cell division detection algorithms are discussed in two different sub-
sections.
2.1 Cell tracking
Generally, live cell imaging is targeted to particular biological applications
that have their own specific requirements. Hence, the strong application
characteristic of the cellular data has a direct impact on the image features that has to
be evaluated by the automatic tracking algorithm. Also, as indicated in the previous
section, a wide variety of microscopy imaging modalities are applied in current
studies and the main properties of the image data captured by a particular method are
fairly distinct when compared to those captured by a different image acquisition
method. Moreover, some image acquisition techniques (due to constraints related to
the specimen (living cells) being observed and in particular due to the imaging
problems induced by the illumination set-up) generate poor quality image data which
effects the performance of the automated cell tracking. For instance, phase-contrast
- 11 -
microscopy is very popular when applied to live cell imaging because it requires
standard imaging equipment and does not involve cytotoxic effects generated by
spotting proteins (SPs) used in fluorescent microscopy. As a downside, phase-
contrast microscopy has certain disadvantages such as poor photomicrography, halo
and shade-off effects [1, 2, 3, 85]. One solution to increase the contrast between the
specimen and the surrounding cell environment involves the use of fluorescent dyes.
However, these dyes have cytotoxic effects that induce artificial changes to the cells’
health and this issue is particularly important when cells have to be monitored for
long periods. To limit the cytotoxicity induced by the fluorescent agents, scientists
have designed complex image acquisition protocols that allow the use of low
concentrations of fluorescent dyes for which the microscope is still able to generate
image data with an appropriate signal to noise ratio [4]. Nonetheless, the large
variety of imaging protocols corroborated with the wide-range of cell types generate
a complex scenario that has to be addressed by automated cell tracking solutions.
Cellular image sequences typically contain a large number of cells with
similar characteristics and this substantially increases the difficulty of the cell
matching process. As time-lapse microscopy records cells over a long period of time,
there are large frame-to-frame variations in the image contrast with respect to the
imaged cellular structures. Cells are non-rigid biological structures, i.e. their size and
shape vary frequently throughout the image sequence, and they are guided by self-
propelled motility which makes the task to predict their future states difficult. In
addition, cells undergo division and interact each other (forming cellular clusters),
which turn the identification/segmentation/tracking process into a difficult problem.
The challenges associated with automated tracking vary substantially depending on
the characteristics of the imaging systems or on the nature of the cell types being
analysed. Hence, numerous semi-automatic [1, 5, 6] and fully automatic [7, 8, 74]
algorithms have been proposed in the literature to solve the cellular association task
for different cell lines.
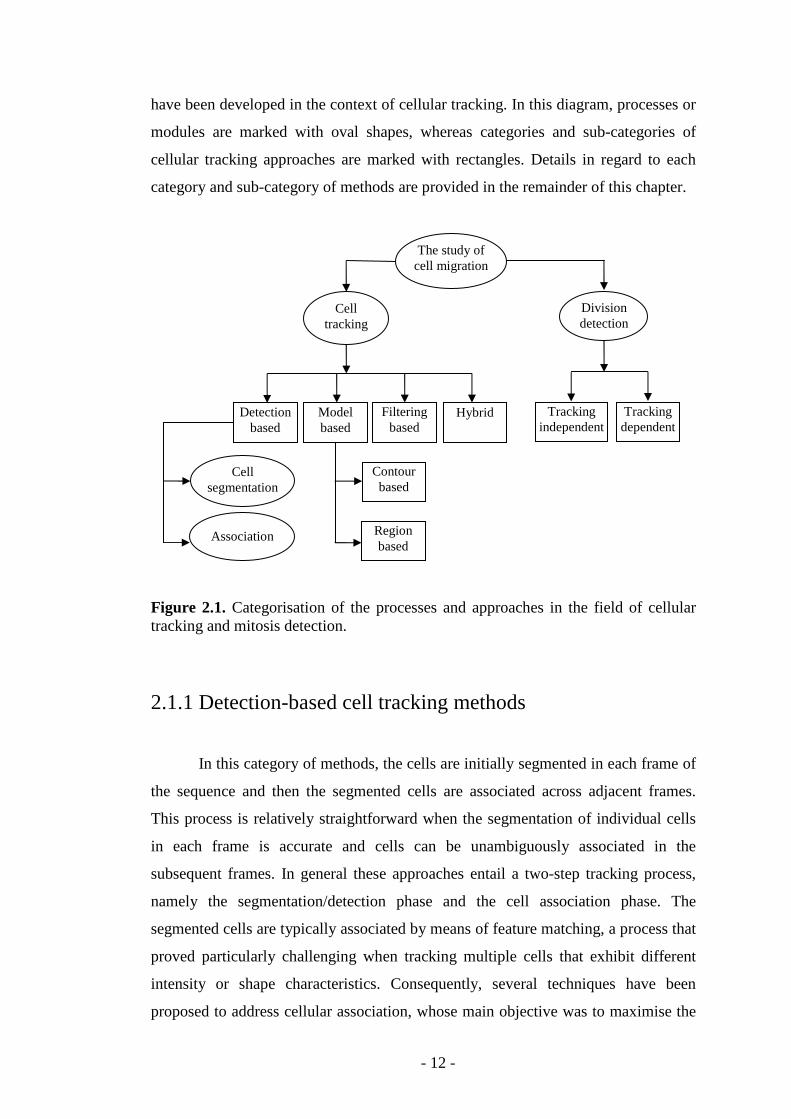
The cell tracking algorithms reported in the literature can roughly be divided
into four broad categories as follows: detection-based, model-based, filter-based and
hybrid methods. Each broad category can be further sub-divided and Figure 2.1
provides a graphical organisation of categories and sub-categories of methods that
- 12 -
have been developed in the context of cellular tracking. In this diagram, processes or
modules are marked with oval shapes, whereas categories and sub-categories of
cellular tracking approaches are marked with rectangles. Details in regard to each
category and sub-category of methods are provided in the remainder of this chapter.
Figure 2.1. Categorisation of the processes and approaches in the field of cellular tracking and mitosis detection.
2.1.1 Detection-based cell tracking methods
In this category of methods, the cells are initially segmented in each frame of
the sequence and then the segmented cells are associated across adjacent frames.
This process is relatively straightforward when the segmentation of individual cells
in each frame is accurate and cells can be unambiguously associated in the
subsequent frames. In general these approaches entail a two-step tracking process,
namely the segmentation/detection phase and the cell association phase. The
segmented cells are typically associated by means of feature matching, a process that
proved particularly challenging when tracking multiple cells that exhibit different
intensity or shape characteristics. Consequently, several techniques have been
proposed to address cellular association, whose main objective was to maximise the
The study of cell migration
Cell tracking
Division detection
Detection based
Model based
Filtering based
Hybrid Tracking independent
Tracking dependent
Cell segmentation
Association
Contour based
Region based
- 13 -
use of the image features during the cellular matching process. However,
segmentation errors such as under/over segmentation are unavoidable [9] when
dealing with challenging data, and in this scenario, false matching or incomplete
tracking results may often occur. The occurrence of segmentation errors is the major
problem for the detection-based cell tracking strategies and the vast majority of the
algorithms developed have included the implementation of additional post-
processing steps to reduce as much as possible the rate of incorrect tracking
decisions [10]. While cellular segmentation is one component that has a substantial
effect on the overall performance of the cell tracking process, in the next section I
discuss in detail the most relevant techniques that have been published in the
specialised literature.
2.1.1.1 Segmentation
As cellular segmentation has a key role in the cellular tracking process, some
published papers analysed the cell segmentation as an independent problem [7, 11,
73, 78]. At this stage it is useful to mention that due to the large variety of cell types,
imaging protocols and the frequency of mitosis events, a large palette of approaches
has been proposed. While the analysed cellular data is often characterised by distinct
characteristics such as variation in cell morphology, intensity profile, illumination
set-up and different degrees of cellular agglomeration, the proposed methods were,
in general, custom designed. In this regard, some segmentation algorithms apply
simple detection/thresholding technique, others explored more sophisticated
segmentation approaches to accommodate the poor image contrast and high level of
noise [12, 13], while another category based on active contours or level sets
addressed the segmentation problem in close coordination with the tracking process
[14].
However, as the application context was the key element in the development
of cellular segmentation strategies, this makes their precise categorisation extremely
difficult. The published cellular segmentation methods employ a wide range of
techniques such as thresholding, watershed, mean shift, deformable models and
wavelet transform to achieve accurate results. In this regard, the thresholding-based
- 14 -
cell segmentation methods are based on the assumption that the intensity of the
background is uniform and it can be robustly separated from the intensity signal
associated with the cell regions [15, 83]. Thus, these methods initially binarise all
images that compose the time-lapse sequence using adaptive thresholding techniques
[16] followed by some morphological operations that are applied to merge and split
the detected regions in order to deal with under-segmentation and over-
segmentation, respectively. These methods proved successful when applied to data
that can be precisely approximated with a bi-modal distribution, but they have shown
substantial limitations when applied to more challenging cellular data that exhibit
substantial intensity variation within each frame or across consecutive frames in the
image sequence. Watershed algorithms were also used for cell segmentation. These
methods are generally marker-controlled, where the seed points are selected by
applying either adaptive thresholding or the h-maxima operation. For instance, in
[17], the h-maxima transform has been used to detect the seeds in the gradient image
and the image regions resulting from the watershed process are subsequently merged
to avoid over-segmentation. In [7], cell segmentation is carried out using a multi-step
algorithm that initially binarises the input image using an adaptive thresholding
technique [77]. To limit the level of under-segmentation, the authors applied a
distance transformation [76] to accommodate the situations generated by the cellular
interaction (cell clustering). The last step applies a watershed-based algorithm to
merge the cell nuclei in order to eliminate false cell detection. A different cell
segmentation method based on the morphological top-hat and the h-maxima
transform is reported in [12]. In this method the segmentation errors are redressed
during the tracking process by analysing the initial tracking results in the temporal
domain.
Mean shift is another method that proved popular in the context of cellular
segmentation and in general these methods involve a multi-step analysis that is
usually designed for a particular data type [19]. In [20], the authors presented a
wavelet transform-based method that was employed to identify the bright spots in
fluorescence images. In this approach, the authors used the multi-scale correlation of
the filtered wavelet coefficients to enhance the peaks of the spots and to reduce the
level of noise present in the image. This method has been further developed in [21]
to detect apparent spots in 3D image stacks. However, it is important to point out
- 15 -
that the application of this method to cell segmentation in phase-contrast imaging is
not appropriate, as the intensity of the cell region is not substantially higher than that
of its immediate neighbourhood.
As indicated in the introductory part of this section, a distinct category of
methods attempted to integrate the cell segmentation in the tracking process. In this
sense, the cell segmentation methods based on active contours [22] and level sets
[14] make use of the information relating to the shape of the cells and image
contrast. In this process the results obtained in the current frame are utilised as the
initial solution for the next frame, where the final segmentation is achieved by
evolving the contours based on the gradient information and some parameters that
constrain the geometric properties of the contour. These methods proved highly
successful when applied to sparse cellular data, but they have shown substantial
drawbacks such as erroneous contour merging and convergence to high contrast non-
cellular regions when applied to data characterised by low image contrast and high
cellular density. In addition, they have an inherent inability to adapt to situations
caused by large cellular movements (migration) in consecutive frames of the
sequence.
The analysis of the main directions of research in cellular segmentation that
has been carried out in this section allowed us to draw some useful conclusions. The
most apparent is that the vast majority of the developed methods have been
developed to serve a particular application domain (cell type, image conditions and
protocols, cell density, etc.) – for additional details refer to Table 2.1. However, in
spite of the strong application context that was the prevailing factor in the
development of cellular segmentation strategies, this section attempts to identify the
advantages and limitations associated with existing segmentation algorithms. An
important conclusion resulting from this study is that precise cell
detection/segmentation using standard segmentation approaches is impractical due to
the wide range of morphology and intensity variations that are present in cellular
data. This issue proved particularly visible when the algorithms are applied to
challenging cellular datasets and the limitations associated with the imperfect cell
segmentation generate a difficult research problem that will receive full attention in
this thesis. The conclusions that emerged from this survey prompted the
- 16 -
development of the framework presented in this dissertation that treats the
segmentation and tracking problem in an integrated manner to limit as much as
possible the impact of the segmentation errors on the overall tracking accuracy.
Table 2.1: An overview of cell segmentation methods that were proposed for the analysis of different cell lines. Reference Cell line Modality Segmentation approach
1 Murine neural progenitor cells
Phase-contrast Uneven illumination removal + adaptive thresholding + marker-based watershed
8 Human osteosarcoma & amnion epithelial cells
Phase-contrast Region based (gray scale morphology + level set)
78 Histopathology images Fluorescence Graph cut binarization
92 Drosophila cells Fluorescence Active contour & H-minima & marker-based watershed
94 Melanoma cells Phase-contrast Optical flow & level set
93 Breast cancer tissue Fluorescence Multiple filters & watershed-region growing & dilation
95 Breast cancer cell MDA-MB2 31
Phase-contrast Flow-guided active contours
96 HeLa Fluorescence Adaptive threshold & Watershed & Region merging
97 H4 neuroglioma cells Fluorescence Background correction & Gaussian filtering & watershed & statistical region splitting
- 17 -
2.1.1.2 Cellular association
Each image of the cellular sequence contains cells with similar intensity
profiles, a fact that complicates their matching/association in consecutive frames.
Cells also undergo random motion, deformation and division, and these factors
further enhance the difficulty of the cellular tracking process. Several matching
(cellular association) techniques have been reported in the literature that are
principally based on image features [1, 23, 24], motion estimation [21, 25, 26],
spatial relationship [7, 27, 82] and hybrid implementations (image and motion
features) [12, 28, 84].
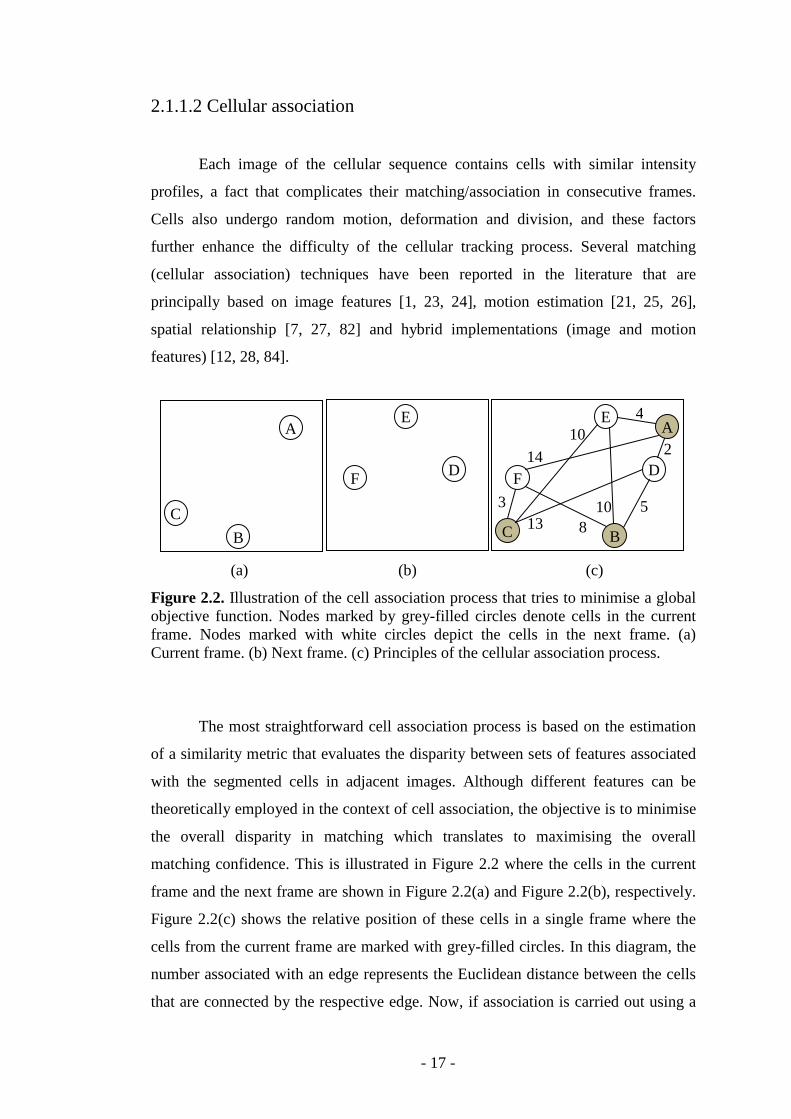
(a) (b) (c)
Figure 2.2. Illustration of the cell association process that tries to minimise a global objective function. Nodes marked by grey-filled circles denote cells in the current frame. Nodes marked with white circles depict the cells in the next frame. (a) Current frame. (b) Next frame. (c) Principles of the cellular association process.
The most straightforward cell association process is based on the estimation
of a similarity metric that evaluates the disparity between sets of features associated
with the segmented cells in adjacent images. Although different features can be
theoretically employed in the context of cell association, the objective is to minimise
the overall disparity in matching which translates to maximising the overall
matching confidence. This is illustrated in Figure 2.2 where the cells in the current
frame and the next frame are shown in Figure 2.2(a) and Figure 2.2(b), respectively.
Figure 2.2(c) shows the relative position of these cells in a single frame where the
cells from the current frame are marked with grey-filled circles. In this diagram, the
number associated with an edge represents the Euclidean distance between the cells
that are connected by the respective edge. Now, if association is carried out using a
E
D F
B
C
A E
D F
B C
A 2
5 10
4
3
8
10
13
14
- 18 -
simple greedy approach [98], A, C and B will be associated with D, F and E,
respectively, generating a matching cost of 2, 3 and 10, respectively. Thus the total
cost will be 15. However, the cellular association A-E, B-D and C-F will result in an
overall matching cost equal to 12, which illustrates the inability of this approach to
generate reliable matching decisions.
If the cells in adjacent frames of the sequence do not show large migration
patterns (such as depicted in Figure 2.2), the distance between the cell centroids can
be used as a cell association metric. In this regard, the methods proposed in [10, 29,
30] implemented cell matching based on the distance between the centroids of the
segmented cells and the amount of overlap in the cell regions in consecutive frames.
Apgar et al [29] validated their method using micro-sphere particles fluorescent
image sequences and the inter-frame particle association was carried out with respect
to nearest neighbour rules. The experimental results indicate that this association
process produces satisfactory results, but it is useful to mention that the distribution
of the micro-spheres is sparse and the displacements between corresponding particles
in consecutive frames are very small. A similar approach was reported in [31] where
the size of the cells was used to complement the Euclidean distance between the
cells’ centroids in the association process. Related association principles were
applied by Jaeger et al [30], where they initially segmented Dictyostelium cells in
each image and then associated them based on the distance between their contours.
Since the association process is implemented by minimising an overall cost function,
the problems generated by the segmentation errors proved particularly cumbersome
to address. This issue has received a substantial level of attention in [10] where the
authors developed an elaborated segmentation process to identify Escherichia coli
cells in fluorescence images.
A distinct characteristic of cell tracking methods based on the simple
evaluation of the minimum distance between cells is that they return an appropriate
level of performance when applied to track spatially sparse cells only in situations
where the segmentation errors are not significant. Indeed, incorrect cell association
decisions are determined by several factors, including unexpected shape changes that
are encountered during the cell growth, high cell density and more importantly by
the random migration of cells. For instance, to accommodate different cell motility
- 19 -
patterns, multiple features need to be concurrently analysed in the cell association
process [23, 32]. Nath et al [23] employed three discrete distances (the overlapping
area of the bounding boxes that enclose the segmented cell regions, the distance
between cell contours and the amount of overlap between the cell regions) to track
cells in time-lapse phase-contrast epithelial cell image sequences. This tracking
solution proved efficient when applied to image sequences captured with a small
time lapse interval, but since the algorithm strongly relies on the area of overlap
between cells in consecutive frames, it is not applicable to tracking scenarios where
cells undergo large migration. A related approach is presented in [32] that
incorporates two distinct measurements, namely the overlap area and the distance
between cell centroids, measures that were normalised with respect to the maximum
size of the cells under analysis. The experiments were conducted on fluorescence
image data containing cancer cells (HeLa cells) and the authors reported that more
than 90% of cells were correctly tracked. However, it is important to point out that
this high tracking accuracy is achieved under the condition that accurate cell
segmentation is available (>98%). This condition was satisfied in their study, as the
identification of the nuclei of the HeLa cells requires a fairly straightforward
segmentation process. There is no doubt that this favourable scenario cannot be
applied when dealing with challenging phase-contrast data that is often characterised
by low image contrast and a high level of noise. In this situation the segmentation
errors have to be accommodated during the cell tracking process, and some
algorithmic solutions have been reported in [9, 33].
When all challenges associated with complex time-lapse phase-contrast data
are taken into consideration, simple measurements that record the displacements
between cells in consecutive frames are inadequate to obtain robust cellular
association. To provide more confidence in the tracking process, multiple
measurements have been included to generate more detailed features that can
substantially increase the overall tracking accuracy. As an example, the method
presented in [1] evaluated the likelihood for all possible pairs of cells in two adjacent
frames using the following set of features: centroid, area, eccentricity, major axis
length and orientation. To achieve a global minimisation in this high dimensional
feature space, the authors employed linear programming. However, the association
process based on large feature sets is computationally expensive as it generates a
- 20 -
large matrix whose size is proportional to the number of cells present in the image.
In their experiments, the authors evaluated phase-contrast data containing murine
progenitor cells, and in their study they showed that the incidence of segmentation
errors artificially increases the number of broken tracks. To overcome this problem,
the authors proposed to approximate the position and the shape of the undetected cell
in the next frame with that of the unmatched cell in the current frame. This process is
repeated over a number of consecutive frames and if no matching cell is found, the
tracking for the cell in the current frame is terminated. While this approach to
address the under-segmentation errors is intuitive, it is applicable only in situations
where the inter-frame migration is very small. Moreover, the approach applied to
estimate the location of the missed cell is inappropriate when dealing with cell data
characterised by random migration patterns. A similar idea was applied in [34],
where the authors employed a sliding temporal window to redress the errors caused
by under-segmentation. To alleviate the problems associated with the approach
detailed in [1], additional constraints were enforced in [34] to handle the situations
when the cells are entering and exiting from the region of interest that is imaged by
the microscope.
Another important issue associated with detection-based tracking methods is
the identification of the optimal computational architecture for robust cell
association. In this sense, in [4] the authors introduced a graph-based framework that
formulated the cell association problem as a flow network that can be efficiently
solved using the minimum-cost flow algorithm. In this framework, a weighted bi-
partite graph is used where one set of nodes represents the cells in the current frame
and the other set represents the cells in the next frame. The weight/cost of an edge is
defined by the absolute difference between feature vectors associated with the nodes
that are connected by that edge. Using this data structure, the cell association is given
by the minimum weighted bipartite matching. The approach based on bipartite
graphs proved well adapted for cellular association and it has been extended to cover
more complex situations including cell division. In [4], the authors evaluated their
algorithm using fluorescence HeLa cell sequences and the reported results proved
very promising. A related cell tracking framework based on the bipartite graph
formulation has also been reported in [12].
- 21 -
As indicated above, the cellular tracking approaches based on feature
matching proved inefficient when applied to cellular data characterised by low
contrast or/and random migration. To answer such a challenging tracking scenario,
some of the existing methods attempted to use structural information associated with
neighbouring cells. Such an implementation has been reported in [27] where the
structural (spatial) relationship between the neighbouring cells was encoded into a
graph representation. The use of structural information proved critical in increasing
tracking accuracy especially in complex situations that are generated by random
migration. However, the main problem associated with this approach is the
methodology applied to encode the spatial relationships between closely located
cells. For instance, even small changes in the topology of the cells in the consecutive
frames can have a significant impact on the graph representation [27], and this
substantially complicates the cellular association process. However, the advantages
of using the spatial information for cellular tracking outweigh the limitations, and
many efforts have been devoted to improve the manner in which the spatial
information is included in the tracking process. In this regard, Delaunay triangulation
[35] has been actively used in the context of cell tracking [7, 13, 36, 37]. This
representation has several advantages, such as it generates a unique planar graph that
is independent of the topology of the nodes [35], and at the same time maximises the
minimum angles of the triangles that compose the mesh. Moreover, in the Delaunay
mesh the triangles tend towards equiangularity and the insertion or the removal of a
node affects the mesh representation only at the local level. These properties are
particularly well adapted to encode the neighbouring relationship between the cells
in the image, as the insertion and the removal of nodes can be caused either by
cellular division or by under-segmentation.
In [7] the authors reported a tracking algorithm where the spatial distribution
of the cells in each frame is encoded using Delaunay triangulation and the cell
association decisions were obtained by employing a linear programming algorithm.
The algorithm detailed in [7] has been evaluated on fluorescent data containing HeLa
cells and the reported results clearly demonstrate that the use of spatial information
proved to be the key factor in obtaining high cellular tracking accuracy. As a
disadvantage, the tracking process detailed in [7] consists of a rigid architecture, and
it proved inefficient in accommodating the errors that occur during the segmentation
- 22 -
process. This problem formed one of the main research issues that received special
attention in the development of the cellular tracking method discussed in this thesis.
The problem caused by improper segmentation is most apparent when dealing with
phase-contrast cellular image sequences, as they are typically characterised by large
intensity variations within the same image and a relatively high level of noise. Due
to this challenging segmentation process, under-segmentation frequently occurs, and
this significantly reduces the tracking accuracy by generating incomplete cell
lineages (trajectories). To address this problem, recently, a flexible cell tracking
algorithm was reported in [12] that includes a computational module that was
designed to link the broken tracks generated by segmentation errors. In this
approach, five features including motion information are adaptively combined to
measure the similarity between cells in consecutive frames and a post-processing
step has been applied to bridge the broken cell tracks throughout the sequence. The
major drawback associated with this approach is that it cannot handle the situations
where the under-segmentation occurs in the presence of cellular division. This is
another research problem that has been fully addressed in the cellular tracking
framework presented in this thesis. The errors induced by the segmentation process
form the main challenge associated with the detection-based cellular tracking
approaches. To alleviate this issue, computer vision researchers have approached the
cellular association from a more supervised perspective, which implies the accurate
identification of prior models that describe the shape variation and/or the migration
patterns. These methods are reviewed in the next section of the thesis.
2.1.2 Model driven cell tracking methods
As pointed out in the concluding remarks of the previous section, since cells
are difficult to segment in each frame of the image sequence, substantial research
efforts have been concentrated on the development of model-driven techniques. In
these methods, a model is constructed for each cell to be tracked. The model
generally encodes information relating to the shape or/and the intensity profile of the
cell. The constructed model is propagated to the next frame(s) and is evolved to
identify the most probable target in that (those) frame(s). Model propagation and
target identification using this approach simultaneously solves both the cell detection
and tracking problems. The model-based techniques developed in the context of
- 23 -
cellular tracking can be classified into two sub-categories: contour-based and region-
based. Snake/active contours [38] and level sets [39] are the predominant methods
employed in the development of contour based cell tracking methods, whereas
normalised cross-correlation [40] and mean-shift [41] approaches were used in the
implementation of region-based cell tracking methods.
2.1.2.1 Contour-based methods
The snake/active contour methods [38] are well known techniques that are
popular in the development of cellular tracking techniques. An active contour
represents a deformable model where its deformation is controlled by user-defined
parameters and image information (usually gradient data). When this approach is
applied to analyse the cell migration, the contour for each cell in the current frame is
propagated to the next frame (i.e. the contour in the current frame is used as an initial
condition for the contour in the next frame). The propagated contour is evolved with
respect to the image information and subject to the internal parameters that impose a
priori constraints on the smoothness of the evolved contour. From a biological
perspective, this model is especially suitable for describing the shape variation
during the cell migration. However, active contours do not generally handle cellular
division which needs to be addressed using additional post-processing steps.
In [42], an active contour method is applied for single cell tracking, where
the contour initialised in the first image is passed to the next frame and evolved until
convergence. In this work the authors applied a multi-scale filtering process to
remove noise, to smooth the original image data and to emphasize image features
such as edges or contours. Goobic et al [43] also proposed a cell tracking method
based on active contours and experimentally compared the performance of their
method with that achieved by the centroid and correlation-based tracking methods.
The authors conducted the experimental validation using 33 sequences, and
concluded that tracking with active contours returns better results. While the use of
active contours may be beneficial when applied to well-imaged cellular data that is
characterised by small cellular migration, the active contour framework has several
limitations when applied to more challenging scenarios. These include convergence
problems when dealing with poor contrast data, inability to accommodate cell
- 24 -
division, incorrect propagation into the contours of nearby cells and errors caused by
large cellular migration. To address these issues, algorithmic solutions have been
proposed to improve the suitability of the active contour methodology when applied
to challenging data.
To overcome the difficulties associated with the ambiguities between the
cells’ boundaries, an edge map based on the average intensity dispersion is applied in
[44] to take advantage of the relatively homogenous background. The same problem
was also addressed in [45] by employing a modified/texture constrained active
contour formulation that is able to grow across isolated strong edges and stop at
weak boundaries. To avoid contour merging and at the same time allowing cell
division, in [46] repulsive forces and topological constraints were applied, whereas
in [47] the authors modified the standard active contour framework to be able to
accommodate large cell migrations. However, the inclusion of the additional
constraints to control the active contour evolution significantly increased the
“custom-designed” characteristic of the devised methods. In [22], size and shape
constraints are integrated within the energy functional to precisely track leukocytes
(white blood cells) in time-lapse data. In this work, the authors coupled active
contours with Kalman filters to infer the location of the leukocyte cells when they
are occluded or undetected. The application of the Kalman filter proved successful,
as the migration of the leukocytes can be well approximated with a linear model.
Ray and Acton [47] reported another extension of this work by including the motion
gradient vector flow to track large cell movements.
The geometric active contours, which are widely referred to as level sets,
were also used for cell tracking because they are able to handle topological changes
such as contour splitting, a property that is extremely useful when dealing with cell
division. As an example, the application of the level sets in the development of cell
segmentation and tracking has been reported in [14, 48]. However, in its standard
form, the level sets methods do not prevent two boundaries from merging and thus it
is prone to erroneously joining multiple cells that are close to each other into a single
cell. To address this issue, different implementations were developed to prevent the
cell merging when the cells are spatially close [49]. This approach was further
extended to track cells in 3D data and it has been reported in [18, 79]. However, it is
- 25 -
useful to note that this approach shows limitations when applied to dense cellular
structures (the occurrence of cell agglomeration proved particularly problematic).
2.1.2.2 Region-based methods
In distinction to the contour propagation-based cell tracking techniques, in
region-based approaches the shape of the cell is not explicitly used in the tracking
process. Instead, the intensity profile of the cell region is utilised in the process of
inferring the cell association decisions. In this approach, the mass centre for each cell
is first identified, which provides information relating to the position of the cell
within frame. Then, a template/pattern surrounding the mass centre is created and the
cell is tracked by identifying a template/pattern in the next frame that minimises a
cost-matching functional. This process is sequentially carried out to track the
corresponding cells in the subsequent frames of sequence. The normalised cross
correlation [40] was generally employed to identify the corresponding (associated)
cells in the image sequence and several methods that followed this approach were
reported in [43, 50, 51]. In [51], the intensity pattern of the cell under analysis is
selected in the first frame of the sequence and the point that maximises the
normalised cross-correlation matching criteria is selected as the location of the
corresponding cell in the next image. The tracking path for each cell is obtained by
connecting the best locations in the temporal domain. While this approach is simple
and intuitive, it is likely to generate matching errors as the cells frequently change
their shapes and intensity profiles in consecutive frames of the image sequence.
Therefore, simplistic template matching is not sufficiently robust to identify the
corresponding cells over long periods of time especially in challenging time-lapse
phase-contrast data. In [43], the authors also applied a correlation-based method to
track in vitro leukocytes in a flow chamber environment. This approach proved
successful, but it is useful to note that the leukocyte cells do not exhibit large
migration patterns and the image data show only minor inter-frame intensity
changes. There is no doubt that this favourable scenario is not usually encountered in
time-lapse cellular data, and in the context of large migration and inter-frame
intensity changes, the template matching process returns erroneous decisions [50].
Thus, the researchers included further features in the matching process to provide
more robust information when deciding if the candidate cell location is correctly
- 26 -
identified [26]. This issue has received special attention in this dissertation and in the
proposed cellular tracking framework the limitations associated with the standard
correlation-based template-matching approach have been addressed by incorporating
additional information that describes the spatial distribution of the cells in each
frame of the sequence.
To further improve the accuracy of the cellular association process, other
region-based tracking methods employed the mean-shift strategy to identify the
corresponding cells in the image data [5, 52]. The mean-shift implements an iterative
process that locates the mode of the intensity pattern within the search space for the
given intensity pattern. The mean-shift-based cell tracking method proposed in [5] is
semi-automatic and defines an octagon kernel to encompass the area covered by each
cell in the phase-contrast image. Thus, based on the cell intensity profile, which is
defined by a dark cell nucleus that is surrounded by a bright region, two intensity-
based kernels are coupled which are completed with a third kernel that models the
cell division. While the user is allowed to select only a restricted set of cells in the
first image, this approach has difficulties in tracking new cells that enter or exit the
region of interest that is imaged by the microscope. Consequently, the performance
of this approach is downgraded by the occurrence of false matching. The application
of the mean-shift for cellular tracking proved very problematic due to the following
limitations: (a) the mean-shift tracking is likely to generate incorrect association
when the cells present similar pixel-intensity characteristics, (b) after a few frames
the tracking process usually diverges from the actual cell location and it is often
trapped by local minima, and (c) it does not naturally handle cell division.
2.1.3 Stochastic filter-based methods
Stochastic filter-based tracking methods involve a probabilistic/Bayesian
approach and they usually rely on a priori knowledge about cell motion
characteristics and/or deformation patterns. These methods are extremely powerful if
the cell motion and the deformation patterns can be accurately modelled [4], and the
application of Bayesian frameworks to cellular tracking has been extensively studied
in recent years. The major advantage of this approach consists of its ability to
estimate the future states of the target (cell) in terms of its position, size, intensity,
- 27 -
etc, by making use of prior assumptions. When dealing with complex cell tracking
data this estimation is very useful, especially in situations where the cell
segmentation is extremely challenging. Thus, such model-based estimation can be
used to identify the target cell [53] or it can be combined with additional cost
functions to increase the matching confidence of the cell association process [54,
80]. Within the Bayesian framework, the posterior probability density function is
derived from the state transition model, which can be linear in the case of Kalman
filter [55] and non-linear in the case of particle filtering [56]. Methods that use the
Kalman filter for tracking are based on the hypothesis that the noise distributions are
Gaussian and the system dynamics are linear [56]. However, in the case of cellular
tracking, the Gaussian and linear assumptions are sub-optimal. In this context,
particle filtering-based schemes are more appropriate because they are able to
accommodate the nonlinear cell migration and the non-Gaussian distributed noise.
As a downside, these methods require accurate a priori knowledge about the motion
patterns associated with the cells to be tracked.
The methods presented in [21, 25, 26, 54, 57] involve the application of
Kalman filtering to track spot-like particles/cells in fluorescence images. The
application of the Kalman filter to track the cells in time-lapse image sequences is
appealing as it provides a recursive solution to estimate the state of the tracking
process by minimising the mean of the squared error. In these approaches the
transition model that describes the cellular motion plays a very important role. As
cell migration does not follow a particular motion pattern, it is difficult to describe
them using only a single motion model. Thus, a number of motion models (random
walk, first order linear extrapolation (constant velocity), and second-order linear
extrapolation (constant acceleration)) that describe different migration patterns are
integrated with the aim of implementing an interacting multiple model (IMM)
algorithm [21]. In this approach, the switching between different models is
controlled by a finite state Markov chain. Genovesio et al [21] evaluated their IMM
tracking technique on synthetically generated image data and attempted to
characterise the 3-D movements of the endocytic vesicles containing quantum dots.
Although the experimental results proved accurate, the synthetic generated data does
not fully encompass all challenges associated with complex cell migration.
- 28 -
To improve the robustness of the probabilistic tracking process, non-linear
single-model particle filters [26, 45, 53, 54] and multi-model particle filters [25]
have been applied to track spot-like biological targets. In these implementations the
particle filters were implemented as a set of random samples/particles and their
associated weights are used to compute the posterior density function. Then, the
samples and their weights are propagated to give an approximation of the particle
distributions in subsequent frames. During this operation, re-sampling of the
particles is often necessary to avoid the degeneracy problem [56] (i.e. when the
weights associated with the vast majority of the particles attain very low values
compared to the remaining ones). In spite of these limitations, the particle filtering-
based methods provide a better integration of the spatial and temporal information
than approaches based on Kalman filtering, and in addition, they offer the possibility
of incorporating more detailed prior knowledge that samples more accurately the cell
migration and image dynamics. Similar to Kalman filtering based strategies, the
particle filtering methods are generally application dependent and they are designed
to model specific migration patterns
A different tracking approach involves the application of joint probabilistic
data association (JPDA), which considers for the cell under analysis in the current
frame more than one candidate as a potential target in the next frames of the
sequence [33, 58]. Kirubarajan et al [33] reported a JPDA based method for the
tracking of fibroblast (tissue) cells in phase-contrast image sequences. This
framework proved able to accommodate difficult situations that are caused by under-
segmentation and cell division. However, the efficiency of this method is highly
influenced by a large number of a priori assumptions, a requirement that is difficult
to fulfil when dealing with random migration. This issue has been fully addressed in
[58] where the authors developed a JPDA tracking method that evaluates a large set
of a priori conditions. To attain a computational tractable approach, the authors
applied the Hungarian method [58] that entails a linear programming optimisation
process.
- 29 -
2.1.4 Hybrid methods
Considering the large spectrum of challenges associated with the cellular
tracking problem, some published techniques integrate multiple algorithms into a
single framework to obtain better performance. In this dissertation, these approaches
are referred to as hybrid methods. For instance, a method included in this category
has been reported in [8], where a topologically constrained geometric active contour
algorithm was combined with edge-based segmentation and an interactive multiple
motion models approach to robustly track cells in phase-contrast images. As post-
processing, the authors applied a track compiler to validate the identified cell tracks
and a track linking module to connect the broken tracks. In this way, this method
incorporates the advantages associated with both filter-based and contour-based
approaches, but one obvious disadvantage resides in the substantial level of
supervision required to identify the optimal values for a large set of parameters.
In [60], the individual cells in each frame were segmented first by applying a
level sets method that is extended with a customized pruning procedure to identify
the individual cells in the presence of cell clustering (agglomeration). Then, the final
cell tracking process was implemented using a stochastic filtering approach. In this
tracking method, the authors assume that the migration for each cell can be
approximated with only two models: random diffusion and goal-directed movement.
Thus, a two-state Hidden Markov Model was applied, where the cell migration was
modelled as a random walk with Gaussian distributed displacements. It is important
to note that this particular cell migration modelling was suggested by the motility
characteristics of the adult neural stem/progenitor cells and may not be suitable for
accurately approximating the migration of other types of cells.
In [70], the authors detailed a framework that is able to track cells in growing
plant roots. This method involves the application of the Network Snakes technique
[72] (which is a variant of parametric active contours) that allows the optimisation of
arbitrary graphs that encode both the geometry and the boundaries between adjacent
cells. To allow the tracking of fast-moving cells, the Network Snakes method is
combined with a Markov Chain Monte Carlo algorithm [75], and to obtain a precise
- 30 -
initialisation for each cell contour, the authors applied a semi-automatic algorithm
based on the watershed transform.
In [59] the authors combined the optical flow and region-based active
contours methods by implementing a unified energy formulation to track neuronal
cell data. A similar approach was proposed in [61] where a standard detection-based
method was combined with an active contour method. In line with all methods
included in this category, these approaches were also designed to serve well-defined
cellular application domains.
2.2 Cellular division (mitosis) detection
A characteristic of modern cell culturing and imaging equipment is that they
facilitate the monitoring of cell behaviours over long periods of time. Thus, the time-
lapse image sequences encompass a large number of cell division events. While cell
migration remains the main field of research, in recent years the automatic detection
of cellular division started to capture the attention of molecular scientists. This
research interest was motivated by the role of cellular mitosis in biological studies,
as this information is crucial in the process of quantifying the cell cycle and the
growth rate of the cell population [48, 62, 63]. To answer this research interest,
similar to cellular tracking, computer-vision algorithms have been developed to
identify mitotic events in cellular data with no user interaction. The methods
published in the literature attempt to detect mitosis events either during the cellular
association process, or they approached the cell division as a post-processing step
that relies on the availability of cellular tracking results. Thus, the existing cell
division detection algorithms can be broadly classified into tracking-independent [7,
62, 64, 65] and tracking-based [5, 8, 12, 37] cell division approaches. In the first sub-
category, intensity-based features are usually extracted to detect the cell divisions,
while in the second sub-category the tracking results are utilised to identify the
mitosis events.
- 31 -
2.2.1 Tracking independent cell division detection
Mitosis detection methods included in this category exploit the distinctive
intensity features that are associated with cells prior to the cellular division event.
More exactly, these methods use the knowledge that mitotic cells undergo distinct
phase changes during the cell cycle [48, 86] that are reflected in significant intensity
and shape variations. In some cellular images, during cell division the shape of the
cells becomes very regular (circular) and their outlines show a very bright intensity
halo. Thus, these apparent visual features have been often employed to identify cell
division events.
The method presented in [7] first identifies the child cells (anaphase) in the
next frame that follows the division event using a Support Vector Machine (SVM)
classifier. Thus, if both child cells are identified based on their shape and intensity
similarity, then they are associated with the closest parent (metaphase) cell in frame
that precedes mitosis. The results returned by this method were promising when
applied to fluorescence HeLa cell data, as the phase changes associated with the
mitotic events are apparent. As a limitation, this approach is highly dependent on the
results returned by the segmentation process, since each cell needs to be evaluated in
order to measure its suitability to be assigned as a child cell. Thus, accurate cell
division detection can be obtained only in situations where both child and parent
cells are available as input for the cell division process. Also, the application of this
method to dense cell phase-contrast image data is not straightforward due to the
substantial challenges associated with the cell segmentation procedure.
A different classification-based cell division detection method has been
proposed in [65] that has been specifically designed to detect mitotic cells in phase-
contrast image data. This method first identifies the image sub-regions where the
potential cell division may have occurred. Then, a trained Hidden Conditional
Random Field (HCRF) [66] was applied to the selected sub-regions to determine
whether each potential candidate contains a mitotic event. This work has been
further extended in [63, 64] to enhance the accuracy of the mitosis detection. In [64]
the HCRF was replaced with the Event Detection Conditional Random Field
(EDCRF), which is a probabilistic approach that is able to model the dynamic
- 32 -
changes before and after the cell division event. The detection accuracy of this
method proved excellent when applied to low to medium density cellular data, but it
has shown problems when applied to dense phase-contrast data. In [63], a Two-
Labelled Hidden Conditional Random Field (TL-HCRF) was used, an approach that
complements the changes in the intensity profile of the mitotic cells with the
information that samples the timing associated with the cell division process.
As a common property of the mitosis detection methods analysed in this
section, they are based on the assumptions that the cellular division is signalled by
conspicuous changes in the shape and the brightness of the parent cell. These
assumptions are not always present in all types of cellular phase-contrast data [1, 7].
Another limitation is associated with their dependency on the accuracy of the
segmentation results, and, in addition, the mitosis detection implies a
computationally intensive search process.
2.2.2 Tracking dependent cell division detection
When dealing with cellular data where the mitosis events are not signalled by
distinct shape and intensity changes, more sophisticated procedures have to be
developed by analysing the spatio-temporal information encompassed in the tracking
results [1, 5, 12, 32]. The use of the tracking results in the context of mitosis
detection leads to increased accuracy, and at the same time permits the
implementation of computationally efficient algorithms.
The cell division detection method proposed in [32] applied the one-to-many
matching constraint during the cell association process. In other words, two child
cells in frame (at time T+1) that follows mitosis correspond to only one cell in the
current frame (at time T). However, multiple cell divisions may occur at the same
time and they may generate ambiguities in the cell division detection. This problem
has been partially addressed in [32] by using geometric information that is calculated
for all cells situated in the neighbourhood of the mitotic cells. The major limitation
associated with this method lies in the assumption that all child cells are detected
after the cell division, which may not be the case when dealing with low contrast
image data.
- 33 -
A similar approach for cell division detection has been reported in [1] where
the likelihood that a cell is divided is estimated based on the absolute differences
between the feature vectors associated with the parent and the child cells. To do this,
the pairs of candidate child cells are merged, and the prior estimates of the mean and
covariance of the difference vectors (calculated for each parent cell) are employed to
increase the confidence of the parent-child matching process. Thus, a successful
detection can be obtained when the parent and the child cells are correctly
segmented, a condition that may be difficult to fulfil when the algorithm is applied to
low contrast cell data.
Cellular tracking results are affected by segmentation and cell association
errors. Hence, often during segmentation one or both child cells may be undetected
in several frames after the mitosis event. There is no doubt that these errors have a
negative effect on the accuracy of the mitosis detection, and to reduce their
occurrence, backward tracking analysis has been applied to identify the child cells
that are missed by the segmentation process. More precisely, the goal of the
backward tracking process is to identify the location of the cells that are missed by
the forward (normal) tracking in frame or frames that follow mitosis. To solve this
task, pattern recognition methods based on normalised cross-correlation [12] and
mean-shift [5] have been reported. For example, in [5] an integrated multiple mean-
shift kernel-based backward tracking procedure was employed to detect the cell
division. To alleviate the problems caused by the sudden intensity shifts, the
proposed kernels were tuned to accommodate the intensity variation during the
mitotic event. The method presented in [12] also employed the reverse tracking
process for mitosis detection in phase-contrast cell data. In [12], a normalised cross-
correlation based method was incorporated to detect the missing cell locations in
frames where the segmentation results are not available, and backward tracking was
applied to identify the parent-child cells links.
- 34 -
2.3. Conclusions
The goal of the literature survey presented in this chapter was to analyse the
main directions of research in the area of cellular tracking and mitosis detection. The
evaluation of the state-of-the-art algorithms mainly addressed the technical aspects
relating to the implementation of computer vision-based automatic cell tracking
solutions and details about the application context were also provided whenever such
information was made available in the analysed papers. Since the cellular tracking
and mitosis detection play a central role in the process of understanding/modelling
diverse biological processes, a substantial number of approaches have been
published in this field of research. One distinct conclusion that emerged from the
literature survey is that the complexity of the cellular tracking and mitosis detection
algorithms was dictated by the innate characteristics of the analysed cellular data.
This conclusion is not unexpected, since the biological patterns that are captured in
sequences of cellular images exhibit strong particularities that are related to the type
of cells being analysed. Nonetheless, this conclusion is extremely important as it
elevated one main direction of research that was followed in this thesis, namely the
need of developing more flexible cell-tracking and mitosis-detection algorithms that
are able to better accommodate the problems relating to improper image conditions
such as low contrast and image noise, and the issues associated with the random
nature of the cell migration.
Another important objective of this chapter was to analyse from a technical
standpoint the most important algorithms published in the literature and to identify
their advantages and limitations. To facilitate this discussion the algorithms analysed
in this section have been grouped in distinct categories based on the approach
applied to solve the inter-frame cellular association. In this regard, four major
categories have been identified: detection-based, model-based, filtering-based and
hybrid cellular tracking strategies. As indicated in Section 2.1.1, a dominant
characteristic associated with the detection-based techniques is their dependence on
the accuracy of the segmentation process. Since segmentation errors are unavoidable
when dealing with dense time-lapse phase-contrast data, these methods have shown
substantial limitations in the presence of cellular interaction and random migration,
and these limitations motivated the researchers to investigate more sophisticated
- 35 -
cellular tracking strategies. Indeed, in an effort to reduce the undesirable effects
induced by the segmentation errors, the researchers have investigated alternative
solutions based on the inclusion of intensity and geometric models in the cellular
association process.
The major advantage associated with model-based cellular tracking
approaches is that they do not require the explicit identification of cells in each frame
of the image sequence, but they have several inherent limitations. Among these
limitations two are most apparent.
Firstly, the model-based cellular tracking methods are not able to achieve
accurate results when applied to datasets that are characterised by large migration
patterns. Secondly, they are not suitable for handling the topological changes in the
cellular structures that are caused by cellular division events. To overcome the major
limitations of the model-based approaches, the cellular tracking process has been
addressed by constructing a priori motion models that describe cellular migration.
The cellular tracking methods based on Kalman and particle filters use the
assumption that the future states (locations) of the cells in consecutive frames of the
sequence can be efficiently predicted using well-defined state transition models that
are often integrated in a Bayesian framework. While the Kalman and particle
filtering schemes are theoretically attractive when analysed in the context of cellular
tracking (as they are not dependent on the accuracy of the segmentation process)
they proved problematic when applied to data that is characterised by random
cellular migration. The random migration cannot be accurately modelled using
particular motion models, and as a consequence, more complex schemes based on
the interaction of multiple motion models were proposed. The application of multiple
motion models to solve the cellular association is opportune, but substantial practical
problems emerged in relation to the identification of the optimal motion model that
best approximates the image dynamics and the substantial level of supervision that is
required in the training process. In an effort to generate more flexible and accurate
cell tracking strategies (that can better adapt to the large spectrum of challenges that
are present in dense time-lapse cellular datasets), hybrid techniques that integrate
multiple tracking algorithms have been recently investigated. Indeed, the hybrid
- 36 -
cellular tracking implementations proved more robust when compared to the
detection, model or filtering-based tracking strategies, but one apparent problem is
associated with the optimisation of large sets of parameters.
Thus, in conclusion, the critical analysis described in this chapter was
particularly useful as it highlighted the major theoretical areas in the field of cellular
tracking that require additional research. In this work, substantial efforts have been
devoted towards the development of a robust cellular tracking framework that is able
to minimise the tracking errors that are caused by the incidence of segmentation
errors.
Another area of interest focused on was the robust identification of cellular
division events. As indicated in Section 2.2, two categories of mitosis detection
algorithms have been identified. In this regard, the algorithms included in the first
category approached the mitosis detection by exploiting the apparent intensity
changes that are associated with the parent cells prior to cellular division. These
algorithms proved robust in the identification of the patent-child cells links, but they
are not feasible for application in the absence of such conspicuous intensity changes
that signal the mitosis events. Thus, the second category of algorithms approached
the problem of mitosis detection from a more generic standpoint by analysing the
cell tracking results in a backward manner. One prominent limitation associated with
these algorithms is the negative impact of segmentation errors, which generates
incorrect parent-child cells links. This problem has received special attention in this
thesis, where a novel backward tracking scheme that is able to redress the under-
segmentation problems has been proposed and comprehensively evaluated.
The proposed theoretical framework provides an integrated solution for cell
tracking and mitosis detection. In this research work a novel cellular association
algorithm has been developed that evaluates the topological information between the
cells in each frame of the sequence. To alleviate the negative influence of
segmentation errors on the accuracy of cell tracking and mitosis detection, a distinct
module has been designed to identify and redress the segmentation errors during the
forward and backward tracking processes. The theoretical and practical problems
- 37 -
relating to the development of the proposed cell tracking and mitosis detection
framework are extensively discussed in the next chapter of this thesis.
- 38 -
Chapter 3:
Cellular Tracking and Mitosis Detection
As indicated in the previous chapter, the topic of cellular tracking and mitosis
detection has received substantial interest from computer vision researchers. This
interest has been largely motivated by the wide spectrum of molecular application
domains that can be targeted by the development of fully automatic cellular tracking
solutions. The aim of this chapter is to detail a novel image processing framework
that has been designed to robustly identify the migration patterns and mitosis events
in time-lapse phase-contrast image sequences.
As mentioned above, the main objective of this chapter is to present the
technical details associated with the proposed cellular tracking and mitosis detection
algorithm and to emphasise how the major limitations identified in the previous
chapter are addressed in the solution advanced in this dissertation. The main issues
that hamper the development of robust cellular tracking algorithms are as follows:
• Under-segmentation
• Random motion
• Cell division
• Cellular agglomeration
• Cells that enter/Exit the ROI imaged by the microscope
In order to provide a flexible and efficient solution for automatic cell tracking
and mitosis detection, in this work a multi-stage approach has been developed that
involves a computational framework that consists of three main components:
segmentation, forward-tracking and backward-tracking modules. Figure 3.1
illustrates the block diagram of the full system where the sub-modules of the three
main components of the developed algorithm are also shown.
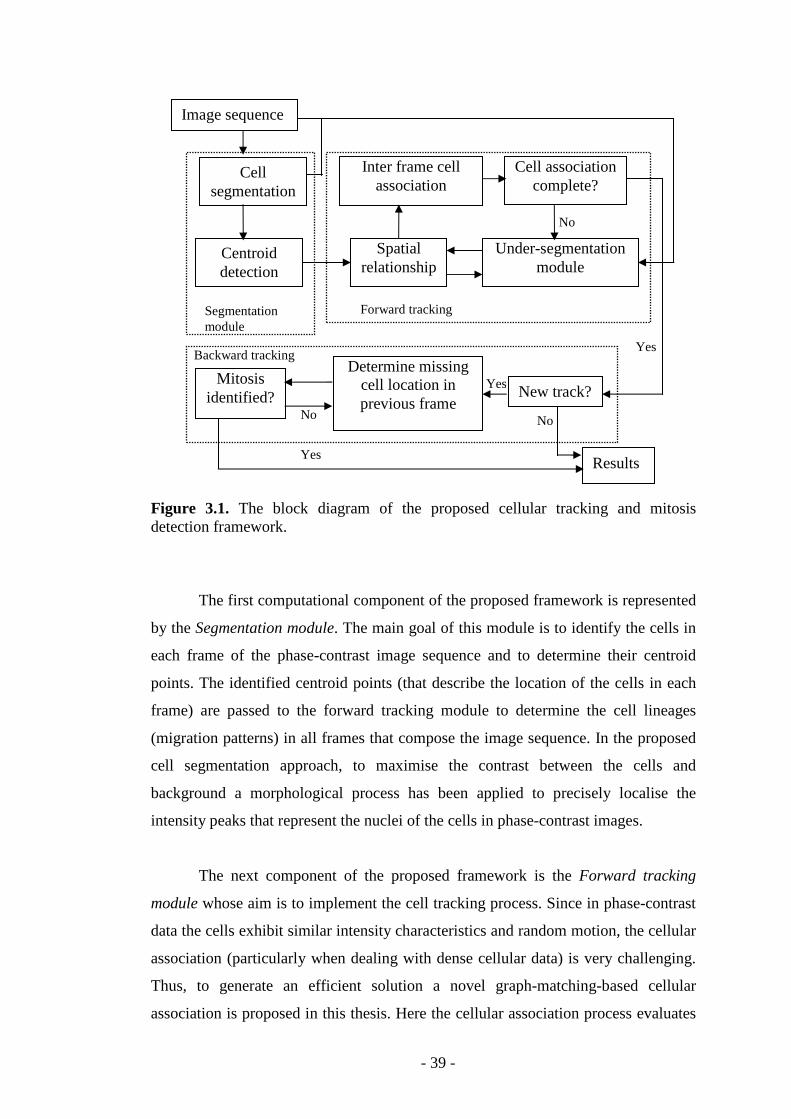
- 39 -
Figure 3.1. The block diagram of the proposed cellular tracking and mitosis detection framework.
The first computational component of the proposed framework is represented
by the Segmentation module. The main goal of this module is to identify the cells in
each frame of the phase-contrast image sequence and to determine their centroid
points. The identified centroid points (that describe the location of the cells in each
frame) are passed to the forward tracking module to determine the cell lineages
(migration patterns) in all frames that compose the image sequence. In the proposed
cell segmentation approach, to maximise the contrast between the cells and
background a morphological process has been applied to precisely localise the
intensity peaks that represent the nuclei of the cells in phase-contrast images.
The next component of the proposed framework is the Forward tracking
module whose aim is to implement the cell tracking process. Since in phase-contrast
data the cells exhibit similar intensity characteristics and random motion, the cellular
association (particularly when dealing with dense cellular data) is very challenging.
Thus, to generate an efficient solution a novel graph-matching-based cellular
association is proposed in this thesis. Here the cellular association process evaluates
Cell segmentation
Inter frame cell association
Spatial relationship
Under-segmentation module
Cell association complete?
Image sequence
New track?
Determine missing cell location in previous frame
Mitosis identified?
Centroid detection
Results
Segmentation module
Forward tracking
Backward tracking
No
Yes
Yes
No No
Yes
- 40 -
the local distribution (topological structure) of the cells that is encoded using a
graph-based representation for each frame of the sequence. In this work, the graph
that describes the relationships between neighbouring cells is constructed using
Delaunay triangulation that encodes the spatial position of the cells within frame.
The proposed cellular association is formulated as a graph matching process where
the cell trajectories (or cell tracks) are obtained by identifying the corresponding
centroid points in consecutive frames of the image sequence. One problem that had
to be addressed in the proposed graph-based cell association process was to tackle
the errors that are caused by under-segmentation. In this regard, a pattern matching
approach (under-segmentation module in the block diagram shown in Figure 3.1) has
been devised that is able to signal the occurrence of under-segmentation and to
identify the location of the cells that have been missed by the segmentation process.
More exactly, if the cell tracking identifies an unmatched cell during cellular
association, the under-segmentation module is activated to find the cell location in
the next image using a pattern matching algorithm that minimises the local distortion
in the Delaunay mesh. The under-segmentation module forms one contribution that
enhanced the performance of the proposed graph-based cell tracking algorithm.
The last module is designed to deal with cell division (mitosis) detection that
performs the cell tracking in a reverse manner to identify the links between the
parent and child cells. Cellular division is a biological process where a parent cell
divides into two identical child cells. In this situation, the Forward tracking module
associates the parent cell with one child cell, while the other child cell is considered
as a new cell that will erroneously initiate a new track. The cellular division cannot
be handled during the forward association process, so to link the un-associated child
cell with the correct parent cell, in this thesis a reverse tracking strategy has been
implemented that makes use of the cellular association results provided by the
Forward tracking module. In this way, if an unmatched cell (due to cell division) is
identified, a searching process is initiated using pattern matching and local cellular
structure to identify the parent cell in the previous frame. In the following sections of
this chapter each component (module) of the proposed framework are explained in
detail.
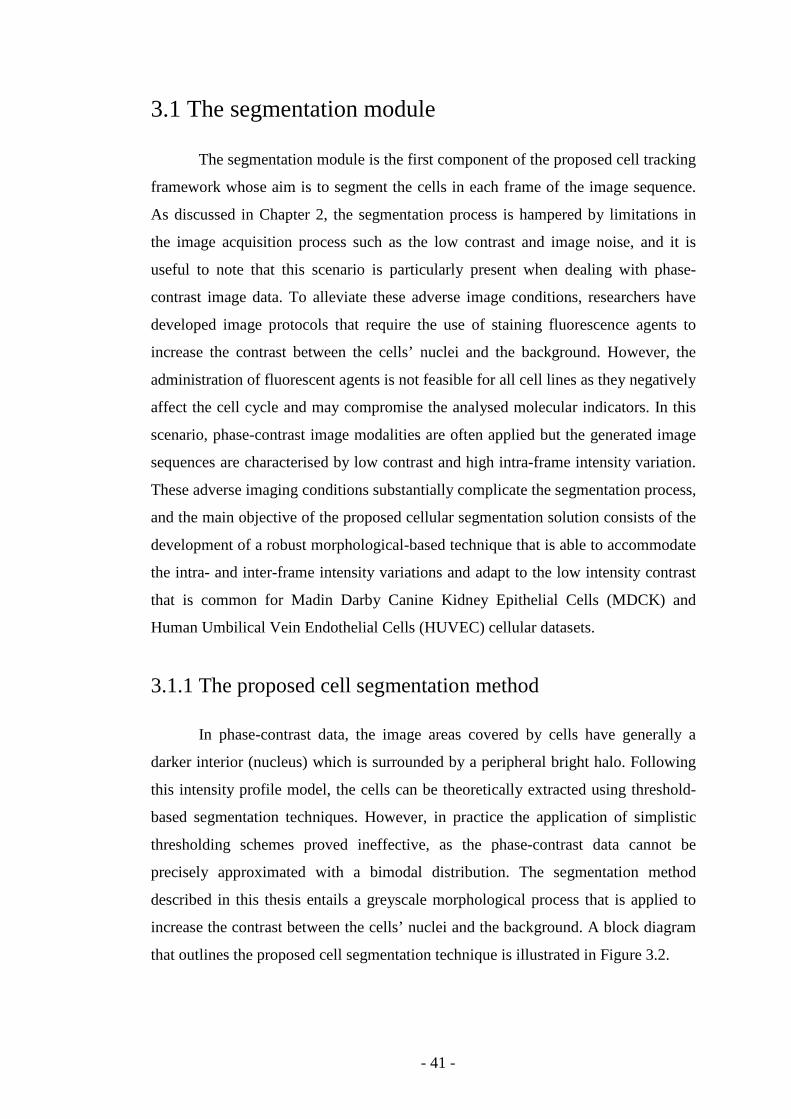
- 41 -
3.1 The segmentation module
The segmentation module is the first component of the proposed cell tracking
framework whose aim is to segment the cells in each frame of the image sequence.
As discussed in Chapter 2, the segmentation process is hampered by limitations in
the image acquisition process such as the low contrast and image noise, and it is
useful to note that this scenario is particularly present when dealing with phase-
contrast image data. To alleviate these adverse image conditions, researchers have
developed image protocols that require the use of staining fluorescence agents to
increase the contrast between the cells’ nuclei and the background. However, the
administration of fluorescent agents is not feasible for all cell lines as they negatively
affect the cell cycle and may compromise the analysed molecular indicators. In this
scenario, phase-contrast image modalities are often applied but the generated image
sequences are characterised by low contrast and high intra-frame intensity variation.
These adverse imaging conditions substantially complicate the segmentation process,
and the main objective of the proposed cellular segmentation solution consists of the
development of a robust morphological-based technique that is able to accommodate
the intra- and inter-frame intensity variations and adapt to the low intensity contrast
that is common for Madin Darby Canine Kidney Epithelial Cells (MDCK) and
Human Umbilical Vein Endothelial Cells (HUVEC) cellular datasets.
3.1.1 The proposed cell segmentation method
In phase-contrast data, the image areas covered by cells have generally a
darker interior (nucleus) which is surrounded by a peripheral bright halo. Following
this intensity profile model, the cells can be theoretically extracted using threshold-
based segmentation techniques. However, in practice the application of simplistic
thresholding schemes proved ineffective, as the phase-contrast data cannot be
precisely approximated with a bimodal distribution. The segmentation method
described in this thesis entails a greyscale morphological process that is applied to
increase the contrast between the cells’ nuclei and the background. A block diagram
that outlines the proposed cell segmentation technique is illustrated in Figure 3.2.
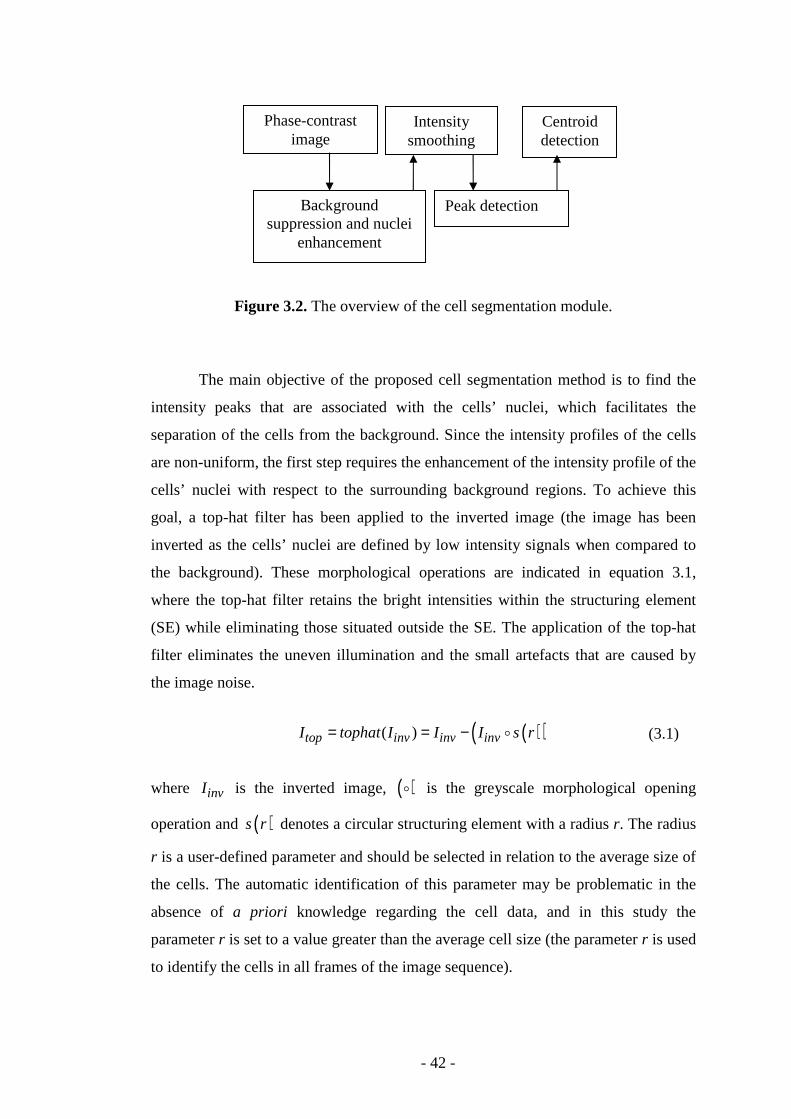
- 42 -
Figure 3.2. The overview of the cell segmentation module.
The main objective of the proposed cell segmentation method is to find the
intensity peaks that are associated with the cells’ nuclei, which facilitates the
separation of the cells from the background. Since the intensity profiles of the cells
are non-uniform, the first step requires the enhancement of the intensity profile of the
cells’ nuclei with respect to the surrounding background regions. To achieve this
goal, a top-hat filter has been applied to the inverted image (the image has been
inverted as the cells’ nuclei are defined by low intensity signals when compared to
the background). These morphological operations are indicated in equation 3.1,
where the top-hat filter retains the bright intensities within the structuring element
(SE) while eliminating those situated outside the SE. The application of the top-hat
filter eliminates the uneven illumination and the small artefacts that are caused by
the image noise.
( )( )( )top inv inv invI tophat I I I s r= = − �
where invI is the inverted image, ( )� is the greyscale morphological opening
operation and ( )s r denotes a circular structuring element with a radius r. The radius
r is a user-defined parameter and should be selected in relation to the average size of
the cells. The automatic identification of this parameter may be problematic in the
absence of a priori knowledge regarding the cell data, and in this study the
parameter r is set to a value greater than the average cell size (the parameter r is used
to identify the cells in all frames of the image sequence).
Phase-contrast image
Intensity smoothing
Centroid detection
Background suppression and nuclei
enhancement
Peak detection
(3.1)
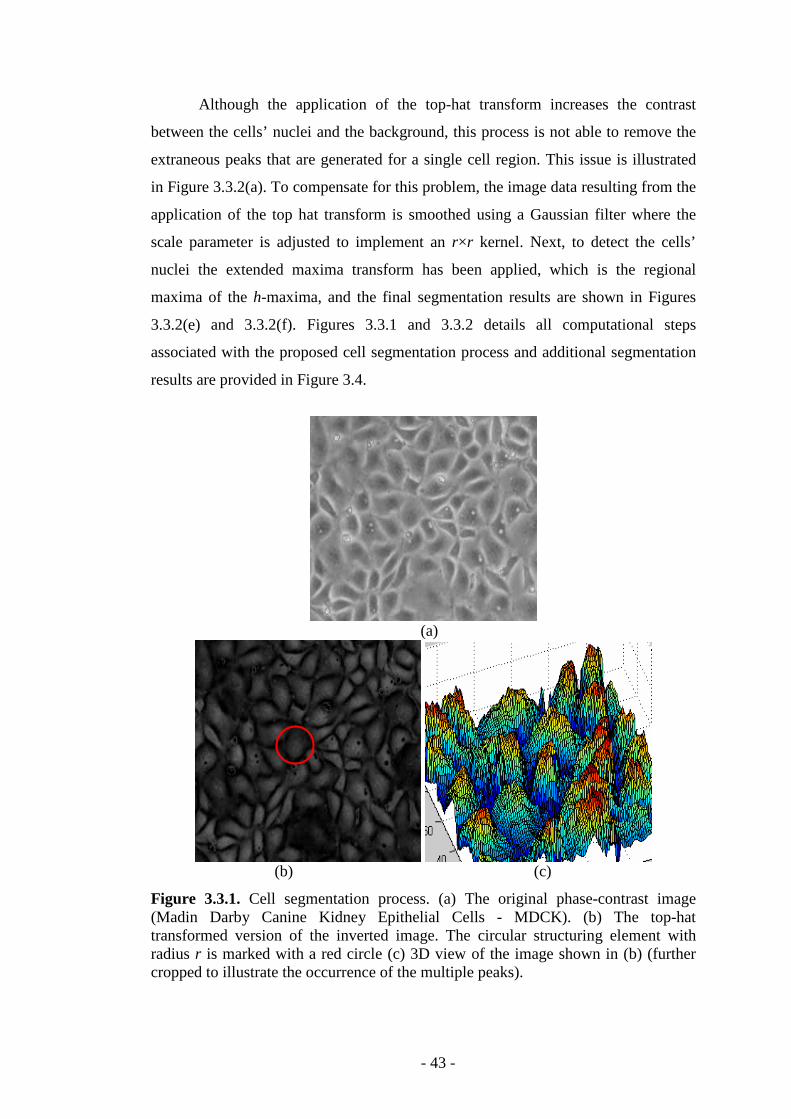
- 43 -
Although the application of the top-hat transform increases the contrast
between the cells’ nuclei and the background, this process is not able to remove the
extraneous peaks that are generated for a single cell region. This issue is illustrated
in Figure 3.3.2(a). To compensate for this problem, the image data resulting from the
application of the top hat transform is smoothed using a Gaussian filter where the
scale parameter is adjusted to implement an r×r kernel. Next, to detect the cells’
nuclei the extended maxima transform has been applied, which is the regional
maxima of the h-maxima, and the final segmentation results are shown in Figures
3.3.2(e) and 3.3.2(f). Figures 3.3.1 and 3.3.2 details all computational steps
associated with the proposed cell segmentation process and additional segmentation
results are provided in Figure 3.4.
(a)
(b) (c)
Figure 3.3.1. Cell segmentation process. (a) The original phase-contrast image (Madin Darby Canine Kidney Epithelial Cells - MDCK). (b) The top-hat transformed version of the inverted image. The circular structuring element with radius r is marked with a red circle (c) 3D view of the image shown in (b) (further cropped to illustrate the occurrence of the multiple peaks).
- 44 -
(a) (b)
(c) (d)
(e) (f)
Figure 3.3.2. Cell segmentation process. (a) The segmentation result from image (c) in Figure 3.3.1 using the h-maxima transform – note the issues caused by the multiple peaks which generate multiple responses for a cell region – marked with black circles. (b) The image resulting after filtering the image (b) in Figure 3.3.1 with a Gaussian filter. (c) 3D view of the Gaussian smoothed result shown in (b). (d) The segmentation results from the image (b), where a single peak defines a single cell region. (e) and (f) depict the final segmentation results, where the identified cells borders are super-imposed on the original image.
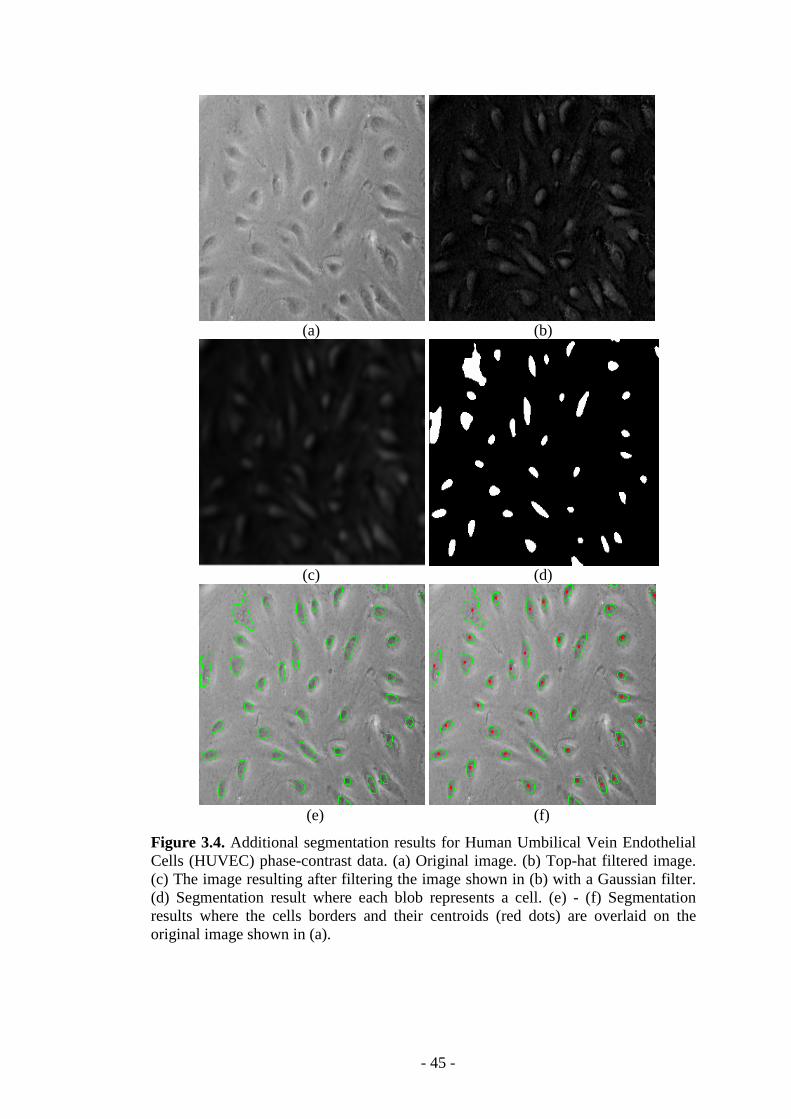
- 45 -
(a) (b)
(c) (d)
(e) (f)
Figure 3.4. Additional segmentation results for Human Umbilical Vein Endothelial Cells (HUVEC) phase-contrast data. (a) Original image. (b) Top-hat filtered image. (c) The image resulting after filtering the image shown in (b) with a Gaussian filter. (d) Segmentation result where each blob represents a cell. (e) - (f) Segmentation results where the cells borders and their centroids (red dots) are overlaid on the original image shown in (a).
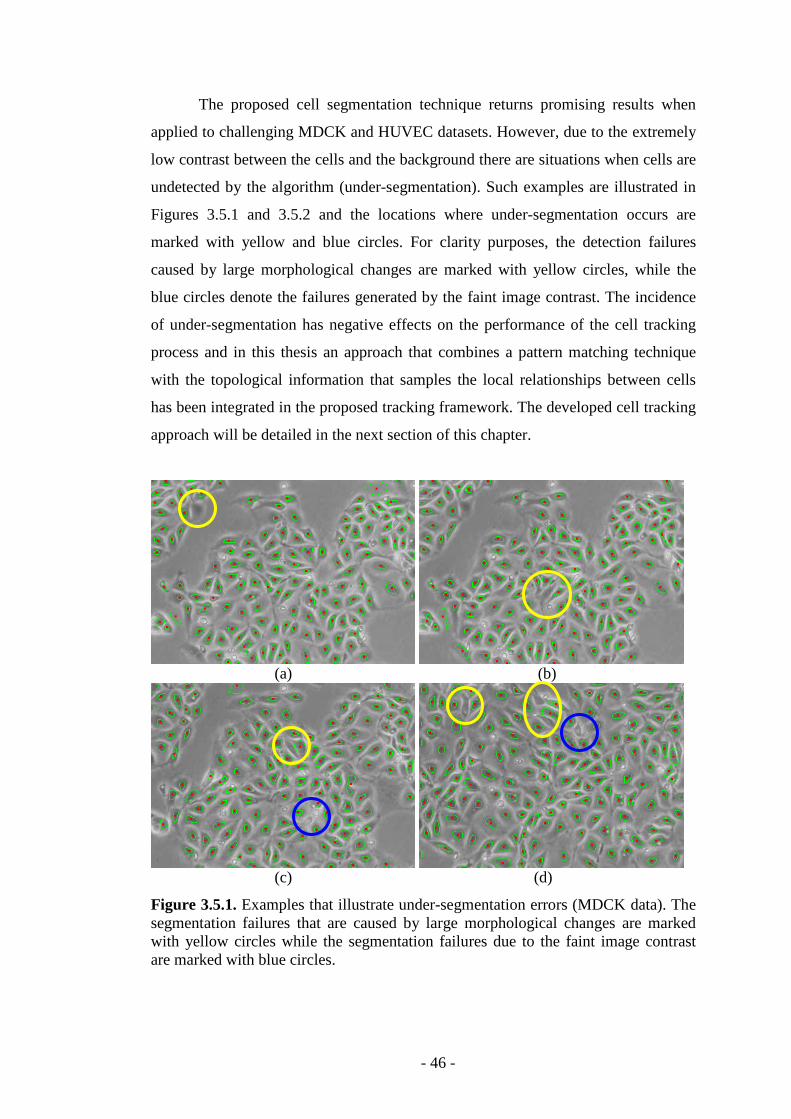
- 46 -
The proposed cell segmentation technique returns promising results when
applied to challenging MDCK and HUVEC datasets. However, due to the extremely
low contrast between the cells and the background there are situations when cells are
undetected by the algorithm (under-segmentation). Such examples are illustrated in
Figures 3.5.1 and 3.5.2 and the locations where under-segmentation occurs are
marked with yellow and blue circles. For clarity purposes, the detection failures
caused by large morphological changes are marked with yellow circles, while the
blue circles denote the failures generated by the faint image contrast. The incidence
of under-segmentation has negative effects on the performance of the cell tracking
process and in this thesis an approach that combines a pattern matching technique
with the topological information that samples the local relationships between cells
has been integrated in the proposed tracking framework. The developed cell tracking
approach will be detailed in the next section of this chapter.
(a) (b)
(c) (d)
Figure 3.5.1. Examples that illustrate under-segmentation errors (MDCK data). The segmentation failures that are caused by large morphological changes are marked with yellow circles while the segmentation failures due to the faint image contrast are marked with blue circles.
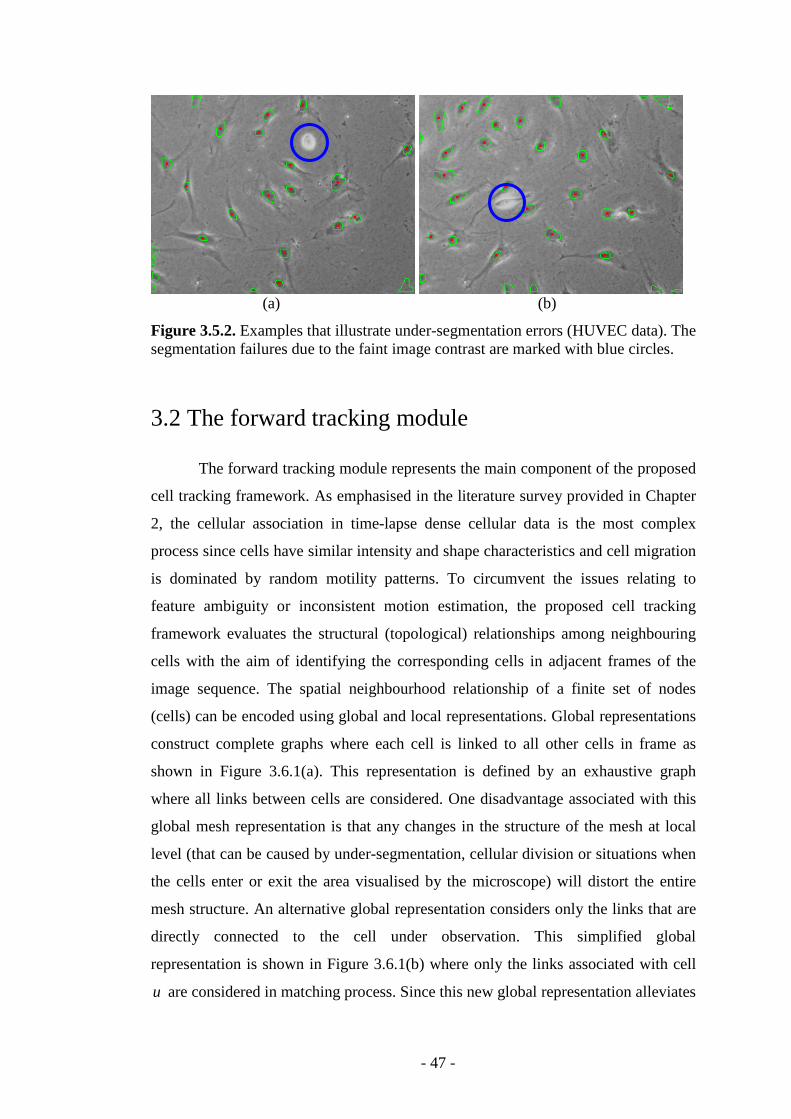
- 47 -
(a) (b)
Figure 3.5.2. Examples that illustrate under-segmentation errors (HUVEC data). The segmentation failures due to the faint image contrast are marked with blue circles.
3.2 The forward tracking module
The forward tracking module represents the main component of the proposed
cell tracking framework. As emphasised in the literature survey provided in Chapter
2, the cellular association in time-lapse dense cellular data is the most complex
process since cells have similar intensity and shape characteristics and cell migration
is dominated by random motility patterns. To circumvent the issues relating to
feature ambiguity or inconsistent motion estimation, the proposed cell tracking
framework evaluates the structural (topological) relationships among neighbouring
cells with the aim of identifying the corresponding cells in adjacent frames of the
image sequence. The spatial neighbourhood relationship of a finite set of nodes
(cells) can be encoded using global and local representations. Global representations
construct complete graphs where each cell is linked to all other cells in frame as
shown in Figure 3.6.1(a). This representation is defined by an exhaustive graph
where all links between cells are considered. One disadvantage associated with this
global mesh representation is that any changes in the structure of the mesh at local
level (that can be caused by under-segmentation, cellular division or situations when
the cells enter or exit the area visualised by the microscope) will distort the entire
mesh structure. An alternative global representation considers only the links that are
directly connected to the cell under observation. This simplified global
representation is shown in Figure 3.6.1(b) where only the links associated with cell
u are considered in matching process. Since this new global representation alleviates
- 48 -
several issues that are associated with the more complex exhaustive topological
representations, still is not well adapted to deal with problems that are generated by
local disturbances in the mesh structure. To further reduce the impact of the
problems generated by local disturbances, the graph associated with a cell u can be
constructed by considering only its neighbours situated inside a circular region RC
around it, as shown in Figure 3.6.1(c). While this approach substantially reduces the
number of links required to encode the local relationships between a cell and its
neighbouring cells, the structure of the resulting mesh largely depends on the
selection of the radius RC. Due to variations in cell density and different cell motility
patterns in consecutive frames, the optimal selection of the parameter RC is critical.
In this sense, a small RC value will result in disconnected graphs, while a large value
will generate a graph representation as shown in Figure 3.6.1(b). Due to changes in
cellular motility, an inappropriate selection for the parameter RC will insert
unpredictable changes in the structures associated with corresponding cells in
consecutive frames of the image sequence and this fact may compromise the
accuracy of the cell tracking process. Figure 3.6.1(d) illustrates such a situation
where a small migration of one cell will result in a very different structure that is
sampled within the radius RC. In this figure the red dots denote the position of the
cells in the previous frame (Figure 3.6.1(c)), while the black dots denote the position
of the cells in the current frame.
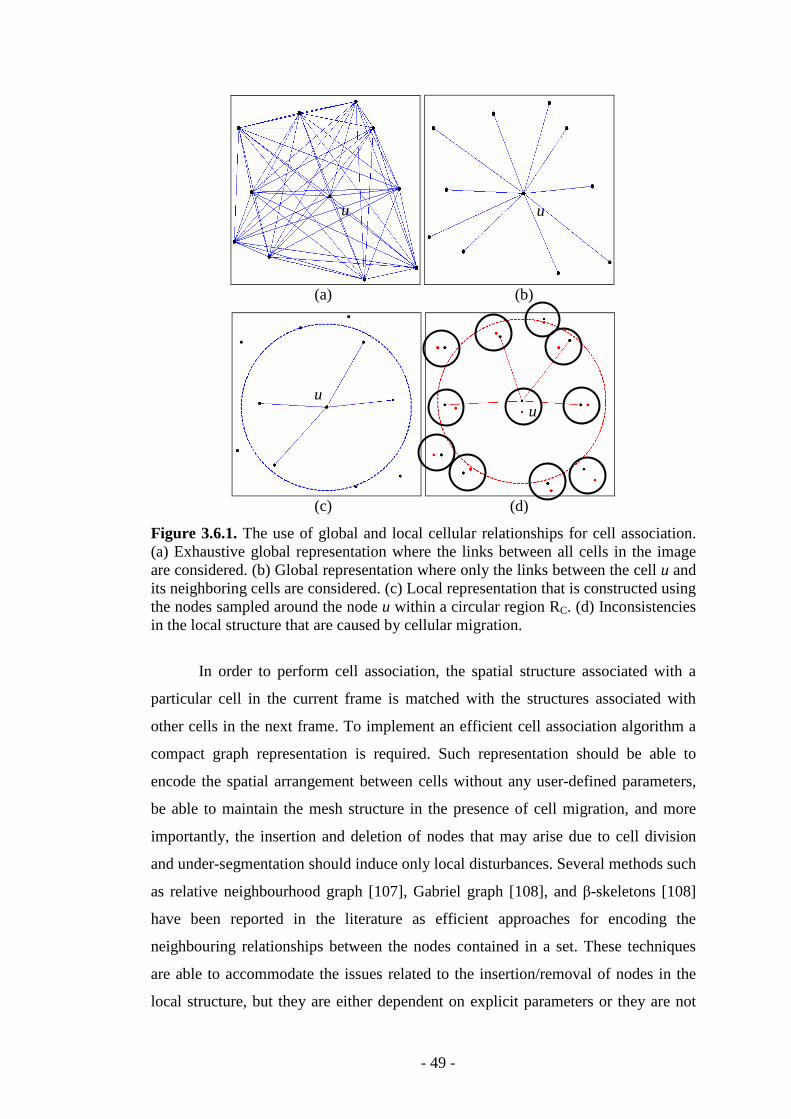
- 49 -
(a) (b)
(c) (d)
Figure 3.6.1. The use of global and local cellular relationships for cell association. (a) Exhaustive global representation where the links between all cells in the image are considered. (b) Global representation where only the links between the cell u and its neighboring cells are considered. (c) Local representation that is constructed using the nodes sampled around the node u within a circular region RC. (d) Inconsistencies in the local structure that are caused by cellular migration.
In order to perform cell association, the spatial structure associated with a
particular cell in the current frame is matched with the structures associated with
other cells in the next frame. To implement an efficient cell association algorithm a
compact graph representation is required. Such representation should be able to
encode the spatial arrangement between cells without any user-defined parameters,
be able to maintain the mesh structure in the presence of cell migration, and more
importantly, the insertion and deletion of nodes that may arise due to cell division
and under-segmentation should induce only local disturbances. Several methods such
as relative neighbourhood graph [107], Gabriel graph [108], and β-skeletons [108]
have been reported in the literature as efficient approaches for encoding the
neighbouring relationships between the nodes contained in a set. These techniques
are able to accommodate the issues related to the insertion/removal of nodes in the
local structure, but they are either dependent on explicit parameters or they are not
u u
u u
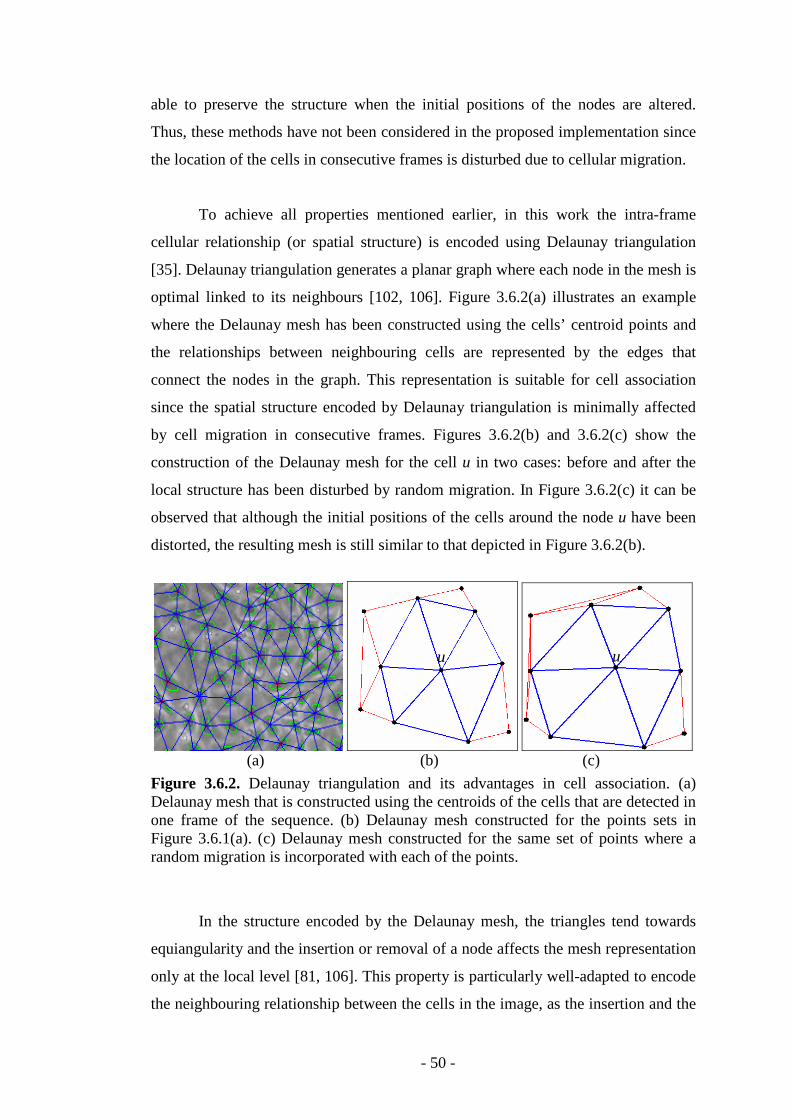
- 50 -
able to preserve the structure when the initial positions of the nodes are altered.
Thus, these methods have not been considered in the proposed implementation since
the location of the cells in consecutive frames is disturbed due to cellular migration.
To achieve all properties mentioned earlier, in this work the intra-frame
cellular relationship (or spatial structure) is encoded using Delaunay triangulation
[35]. Delaunay triangulation generates a planar graph where each node in the mesh is
optimal linked to its neighbours [102, 106]. Figure 3.6.2(a) illustrates an example
where the Delaunay mesh has been constructed using the cells’ centroid points and
the relationships between neighbouring cells are represented by the edges that
connect the nodes in the graph. This representation is suitable for cell association
since the spatial structure encoded by Delaunay triangulation is minimally affected
by cell migration in consecutive frames. Figures 3.6.2(b) and 3.6.2(c) show the
construction of the Delaunay mesh for the cell u in two cases: before and after the
local structure has been disturbed by random migration. In Figure 3.6.2(c) it can be
observed that although the initial positions of the cells around the node u have been
distorted, the resulting mesh is still similar to that depicted in Figure 3.6.2(b).
(a) (b) (c)
Figure 3.6.2. Delaunay triangulation and its advantages in cell association. (a) Delaunay mesh that is constructed using the centroids of the cells that are detected in one frame of the sequence. (b) Delaunay mesh constructed for the points sets in Figure 3.6.1(a). (c) Delaunay mesh constructed for the same set of points where a random migration is incorporated with each of the points.
In the structure encoded by the Delaunay mesh, the triangles tend towards
equiangularity and the insertion or removal of a node affects the mesh representation
only at the local level [81, 106]. This property is particularly well-adapted to encode
the neighbouring relationship between the cells in the image, as the insertion and the
u u
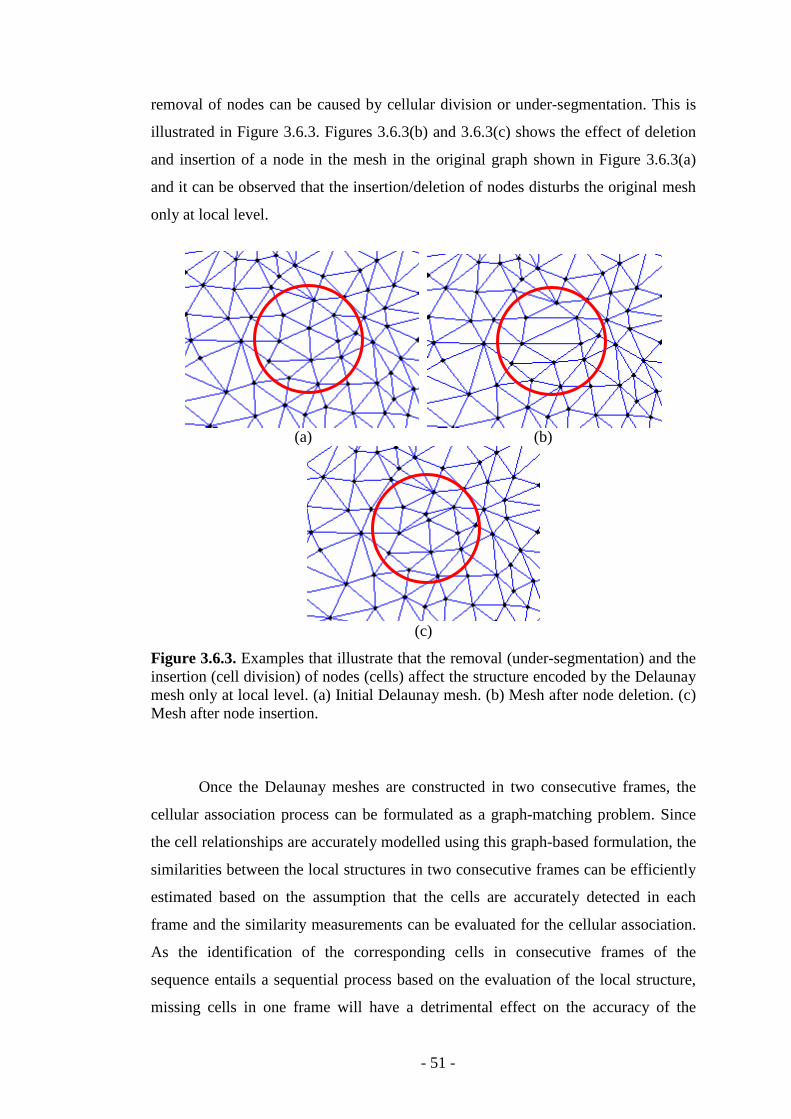
- 51 -
removal of nodes can be caused by cellular division or under-segmentation. This is
illustrated in Figure 3.6.3. Figures 3.6.3(b) and 3.6.3(c) shows the effect of deletion
and insertion of a node in the mesh in the original graph shown in Figure 3.6.3(a)
and it can be observed that the insertion/deletion of nodes disturbs the original mesh
only at local level.
(a) (b)
(c)
Figure 3.6.3. Examples that illustrate that the removal (under-segmentation) and the insertion (cell division) of nodes (cells) affect the structure encoded by the Delaunay mesh only at local level. (a) Initial Delaunay mesh. (b) Mesh after node deletion. (c) Mesh after node insertion.
Once the Delaunay meshes are constructed in two consecutive frames, the
cellular association process can be formulated as a graph-matching problem. Since
the cell relationships are accurately modelled using this graph-based formulation, the
similarities between the local structures in two consecutive frames can be efficiently
estimated based on the assumption that the cells are accurately detected in each
frame and the similarity measurements can be evaluated for the cellular association.
As the identification of the corresponding cells in consecutive frames of the
sequence entails a sequential process based on the evaluation of the local structure,
missing cells in one frame will have a detrimental effect on the accuracy of the
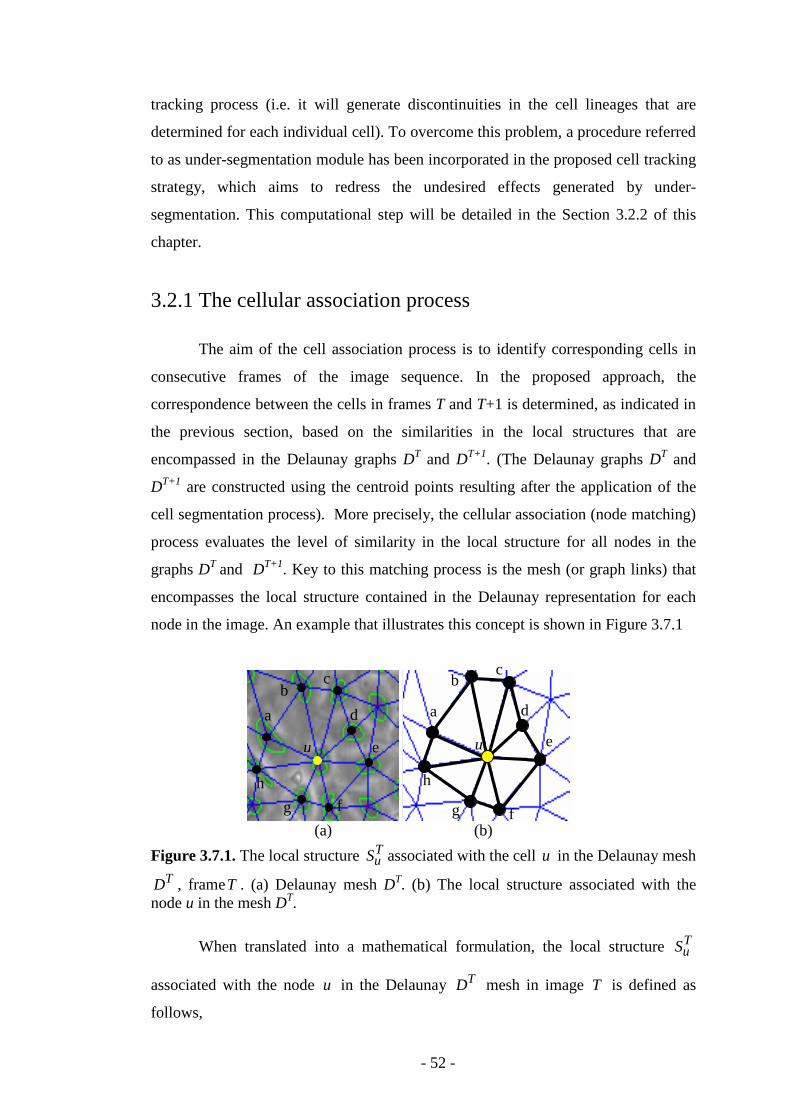
- 52 -
tracking process (i.e. it will generate discontinuities in the cell lineages that are
determined for each individual cell). To overcome this problem, a procedure referred
to as under-segmentation module has been incorporated in the proposed cell tracking
strategy, which aims to redress the undesired effects generated by under-
segmentation. This computational step will be detailed in the Section 3.2.2 of this
chapter.
3.2.1 The cellular association process
The aim of the cell association process is to identify corresponding cells in
consecutive frames of the image sequence. In the proposed approach, the
correspondence between the cells in frames T and T+1 is determined, as indicated in
the previous section, based on the similarities in the local structures that are
encompassed in the Delaunay graphs DT and DT+1. (The Delaunay graphs DT and
DT+1 are constructed using the centroid points resulting after the application of the
cell segmentation process). More precisely, the cellular association (node matching)
process evaluates the level of similarity in the local structure for all nodes in the
graphs DT and DT+1. Key to this matching process is the mesh (or graph links) that
encompasses the local structure contained in the Delaunay representation for each
node in the image. An example that illustrates this concept is shown in Figure 3.7.1
(a) (b)
Figure 3.7.1. The local structure TuS associated with the cell u in the Delaunay mesh TD , frameT . (a) Delaunay mesh DT. (b) The local structure associated with the
node u in the mesh DT.
When translated into a mathematical formulation, the local structure TuS
associated with the node u in the Delaunay TD mesh in image T is defined as
follows,
u
a
b c
e
g
h
a
b c
d
e
f g
h
u
d
f
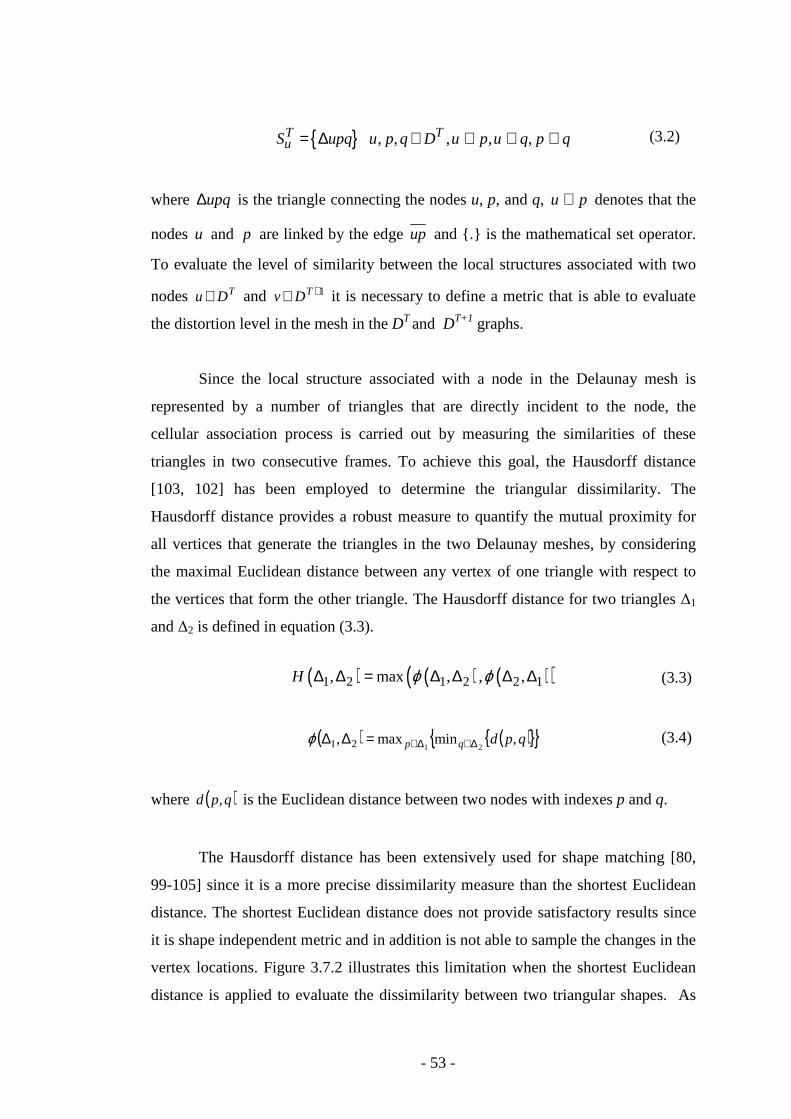
- 53 -
{ } , , , , ,T TuS upq u p q D u p u q p q= ∆ ∈ ⊥ ⊥ ⊥
where upq∆ is the triangle connecting the nodes u, p, and q, u p⊥ denotes that the
nodes u and p are linked by the edge up and {.} is the mathematical set operator.
To evaluate the level of similarity between the local structures associated with two
nodes TDu ∈ and 1+∈ TDv it is necessary to define a metric that is able to evaluate
the distortion level in the mesh in the DT and DT+1 graphs.
Since the local structure associated with a node in the Delaunay mesh is
represented by a number of triangles that are directly incident to the node, the
cellular association process is carried out by measuring the similarities of these
triangles in two consecutive frames. To achieve this goal, the Hausdorff distance
[103, 102] has been employed to determine the triangular dissimilarity. The
Hausdorff distance provides a robust measure to quantify the mutual proximity for
all vertices that generate the triangles in the two Delaunay meshes, by considering
the maximal Euclidean distance between any vertex of one triangle with respect to
the vertices that form the other triangle. The Hausdorff distance for two triangles ∆1
and ∆2 is defined in equation (3.3).
( ) ( ) ( )( )1 2 1 2 2 1, max , , ,H ϕ ϕ∆ ∆ = ∆ ∆ ∆ ∆
( ) ( ){ }{ }qpdqp ,minmax,2121 ∆∈∆∈=∆∆ϕ
where ( )qpd , is the Euclidean distance between two nodes with indexes p and q.
The Hausdorff distance has been extensively used for shape matching [80,
99-105] since it is a more precise dissimilarity measure than the shortest Euclidean
distance. The shortest Euclidean distance does not provide satisfactory results since
it is shape independent metric and in addition is not able to sample the changes in the
vertex locations. Figure 3.7.2 illustrates this limitation when the shortest Euclidean
distance is applied to evaluate the dissimilarity between two triangular shapes. As
(3.2)
(3.3)
(3.4)
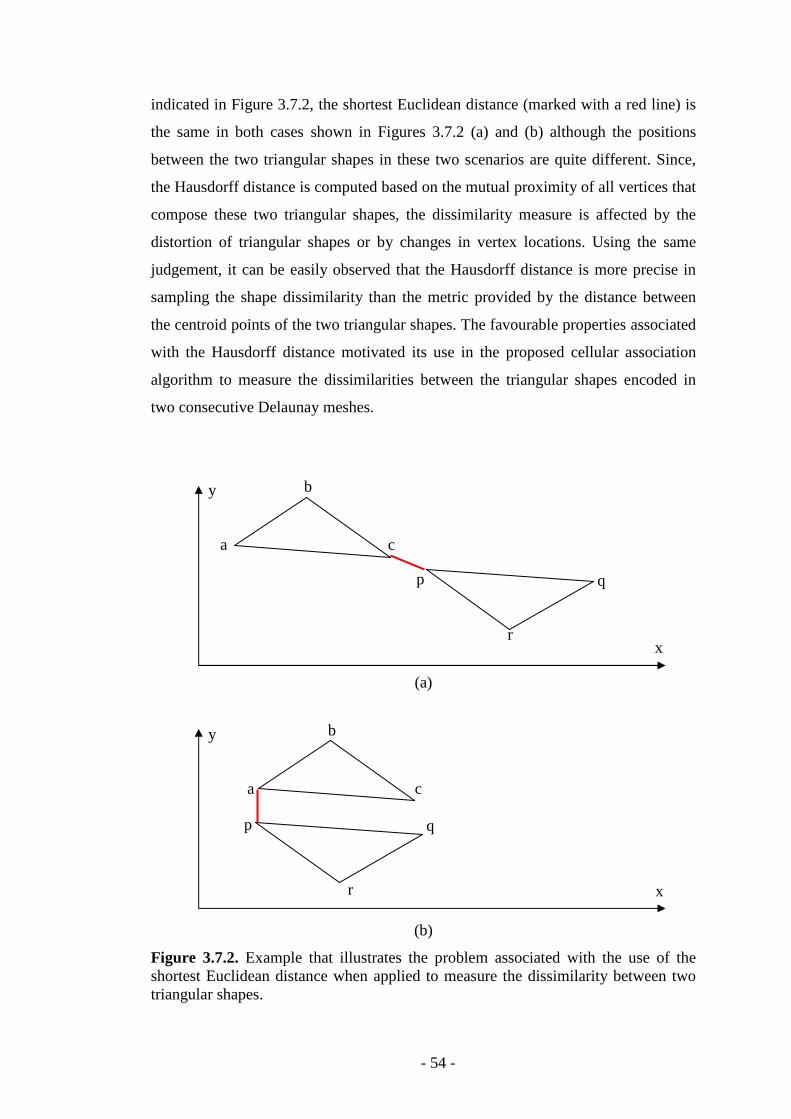
- 54 -
indicated in Figure 3.7.2, the shortest Euclidean distance (marked with a red line) is
the same in both cases shown in Figures 3.7.2 (a) and (b) although the positions
between the two triangular shapes in these two scenarios are quite different. Since,
the Hausdorff distance is computed based on the mutual proximity of all vertices that
compose these two triangular shapes, the dissimilarity measure is affected by the
distortion of triangular shapes or by changes in vertex locations. Using the same
judgement, it can be easily observed that the Hausdorff distance is more precise in
sampling the shape dissimilarity than the metric provided by the distance between
the centroid points of the two triangular shapes. The favourable properties associated
with the Hausdorff distance motivated its use in the proposed cellular association
algorithm to measure the dissimilarities between the triangular shapes encoded in
two consecutive Delaunay meshes.
(a)
(b)
Figure 3.7.2. Example that illustrates the problem associated with the use of the shortest Euclidean distance when applied to measure the dissimilarity between two triangular shapes.
y
y
x
x
a
b
c
p q
r
a
b
c
p q
r
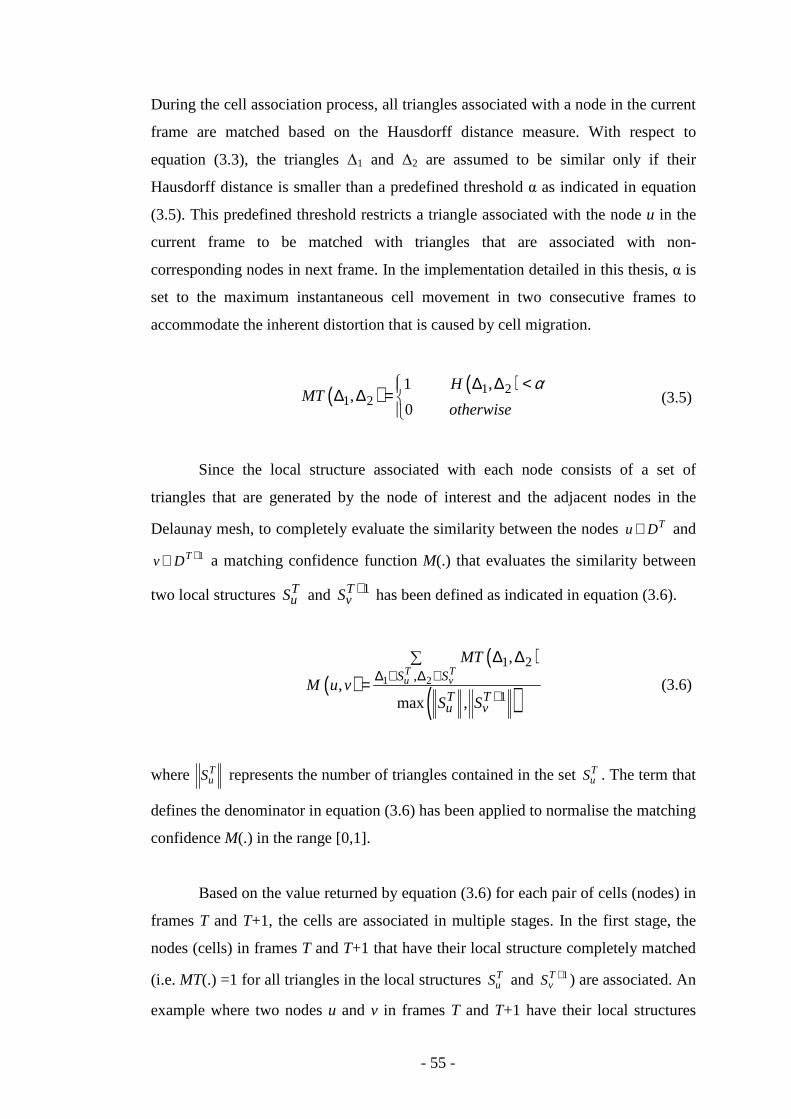
- 55 -
During the cell association process, all triangles associated with a node in the current
frame are matched based on the Hausdorff distance measure. With respect to
equation (3.3), the triangles ∆1 and ∆2 are assumed to be similar only if their
Hausdorff distance is smaller than a predefined threshold α as indicated in equation
(3.5). This predefined threshold restricts a triangle associated with the node u in the
current frame to be matched with triangles that are associated with non-
corresponding nodes in next frame. In the implementation detailed in this thesis, α is
set to the maximum instantaneous cell movement in two consecutive frames to
accommodate the inherent distortion that is caused by cell migration.
( ) ( )1 21 2
1 ,,
0
HMT
otherwise
α ∆ ∆ <∆ ∆ =
Since the local structure associated with each node consists of a set of
triangles that are generated by the node of interest and the adjacent nodes in the
Delaunay mesh, to completely evaluate the similarity between the nodes TDu ∈ and
1+∈ TDv a matching confidence function M(.) that evaluates the similarity between
two local structures TuS and 1TvS + has been defined as indicated in equation (3.6).
( )( )
( )1 2
1 2,
1
,
,max ,
T Tu vS S
T Tu v
MT
M u vS S
∆ ∈ ∆ ∈+
∆ ∆∑
=
where TuS represents the number of triangles contained in the set T
uS . The term that
defines the denominator in equation (3.6) has been applied to normalise the matching
confidence M(.) in the range [0,1].
Based on the value returned by equation (3.6) for each pair of cells (nodes) in
frames T and T+1, the cells are associated in multiple stages. In the first stage, the
nodes (cells) in frames T and T+1 that have their local structure completely matched
(i.e. MT(.) =1 for all triangles in the local structures TuS and 1+T
vS ) are associated. An
example where two nodes u and v in frames T and T+1 have their local structures
(3.5)
(3.6)
- 56 -
completely matched is shown in Figure 3.8, where the corresponding triangles in
meshes TD and 1+TD are shaded and indexed in agreement to the Hausdorff
distance. It is important to note that the nodes that are matched in the first stage of
the cellular association process are matched with the highest level of confidence and
they are included in a reference list R (refer to equation 3.7) that will be used to
guide the following steps that attempt to identify the corresponding nodes for which
the local structure was only partially matched.
( ){ }1, | ,T TR p q p D q D += ∈ ∈
where p and q form a pair of corresponding nodes in frames T and T+1, respectively
that are matched in the first stage of the cellular association process.
(a) (b)
Figure 3.8. An example that illustrates a case where the local structures for two nodes u and v in frames (a) T and (b) T+1 are completely matched with respect to equation (3.6).
A graphical example that illustrates the cells that are matched in the first
stage of the cellular association is presented in Figure 3.9. In this diagram, for clarity
purposes, the cells that have their local structures fully matched are marked with
white dots in the images corresponding to frames T and T+1, whereas the un-
associated cells are marked with small red dots. (To further emphasize the un-
associated nodes in Figure 3.9, the edges in the Delaunay graphs TD and 1+TD
corresponding to un-associated local structures are marked with red lines).
a
b
c
d
e
u 1
2 3
4 5
f
g
h
i j
1 v
2 3
4 5
(3.7)
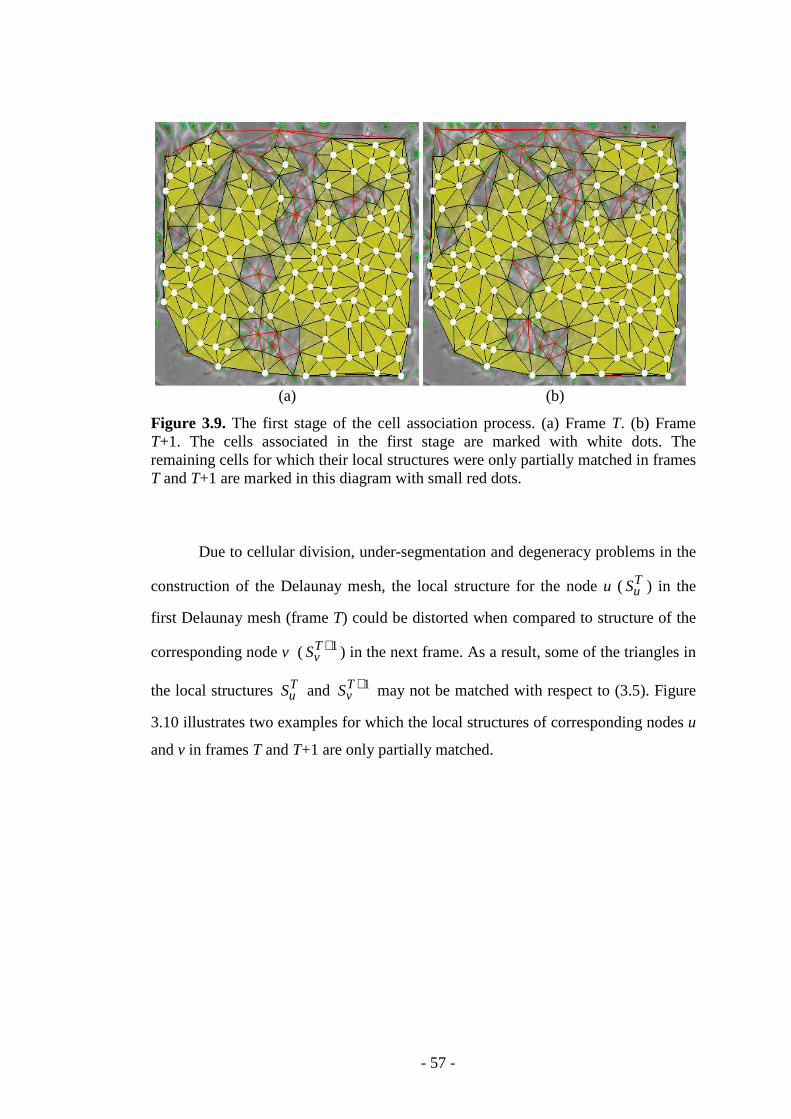
- 57 -
(a) (b)
Figure 3.9. The first stage of the cell association process. (a) Frame T. (b) Frame T+1. The cells associated in the first stage are marked with white dots. The remaining cells for which their local structures were only partially matched in frames T and T+1 are marked in this diagram with small red dots.
Due to cellular division, under-segmentation and degeneracy problems in the
construction of the Delaunay mesh, the local structure for the node u ( TuS ) in the
first Delaunay mesh (frame T) could be distorted when compared to structure of the
corresponding node v ( 1TvS + ) in the next frame. As a result, some of the triangles in
the local structures TuS and 1TvS + may not be matched with respect to (3.5). Figure
3.10 illustrates two examples for which the local structures of corresponding nodes u
and v in frames T and T+1 are only partially matched.
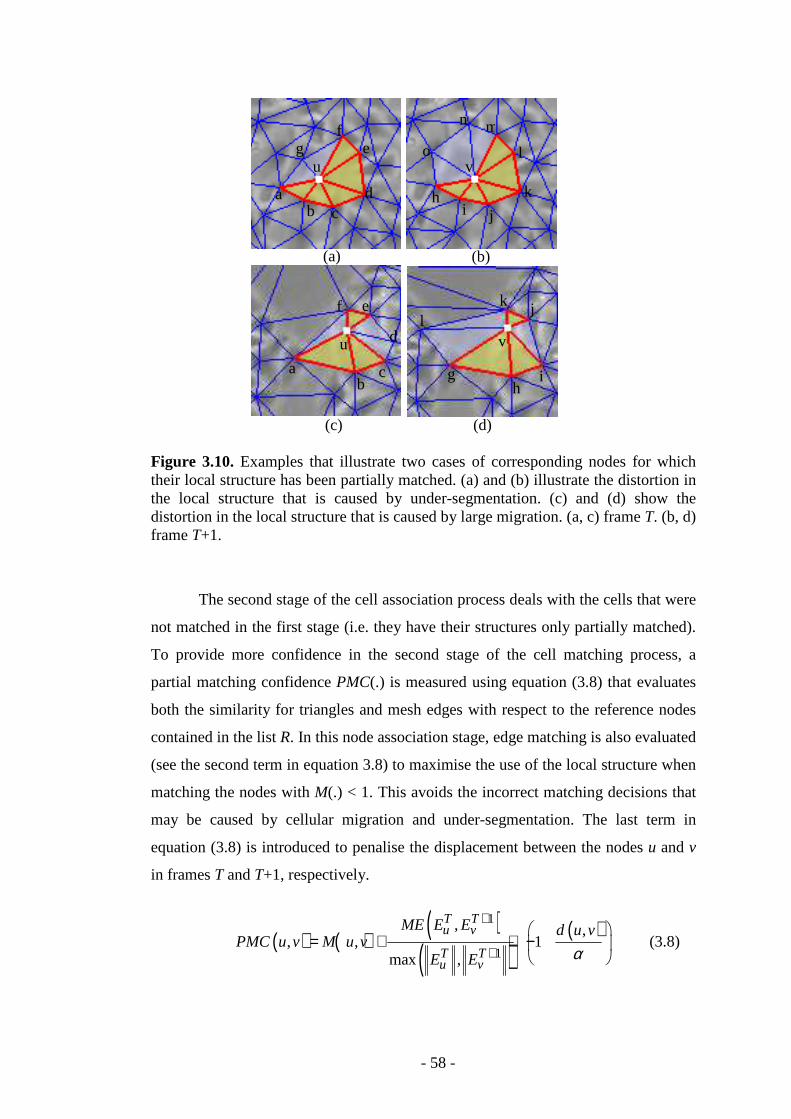
- 58 -
Figure 3.10. Examples that illustrate two cases of corresponding nodes for which their local structure has been partially matched. (a) and (b) illustrate the distortion in the local structure that is caused by under-segmentation. (c) and (d) show the distortion in the local structure that is caused by large migration. (a, c) frame T. (b, d) frame T+1.
The second stage of the cell association process deals with the cells that were
not matched in the first stage (i.e. they have their structures only partially matched).
To provide more confidence in the second stage of the cell matching process, a
partial matching confidence PMC(.) is measured using equation (3.8) that evaluates
both the similarity for triangles and mesh edges with respect to the reference nodes
contained in the list R. In this node association stage, edge matching is also evaluated
(see the second term in equation 3.8) to maximise the use of the local structure when
matching the nodes with M(.) < 1. This avoids the incorrect matching decisions that
may be caused by cellular migration and under-segmentation. The last term in
equation (3.8) is introduced to penalise the displacement between the nodes u and v
in frames T and T+1, respectively.
( ) ( )( )
( )( )1
1
, ,, , 1
max ,
T Tu v
T Tu v
ME E E d u vPMC u v M u v
E E α
+
+
= + + −
a b
c
d
e
u
f
v
g h
i
j k l
l
u
a b c
d
e f
g
h i j
k
n
o v
l
m
(a) (b)
(c) (d)
(3.8)
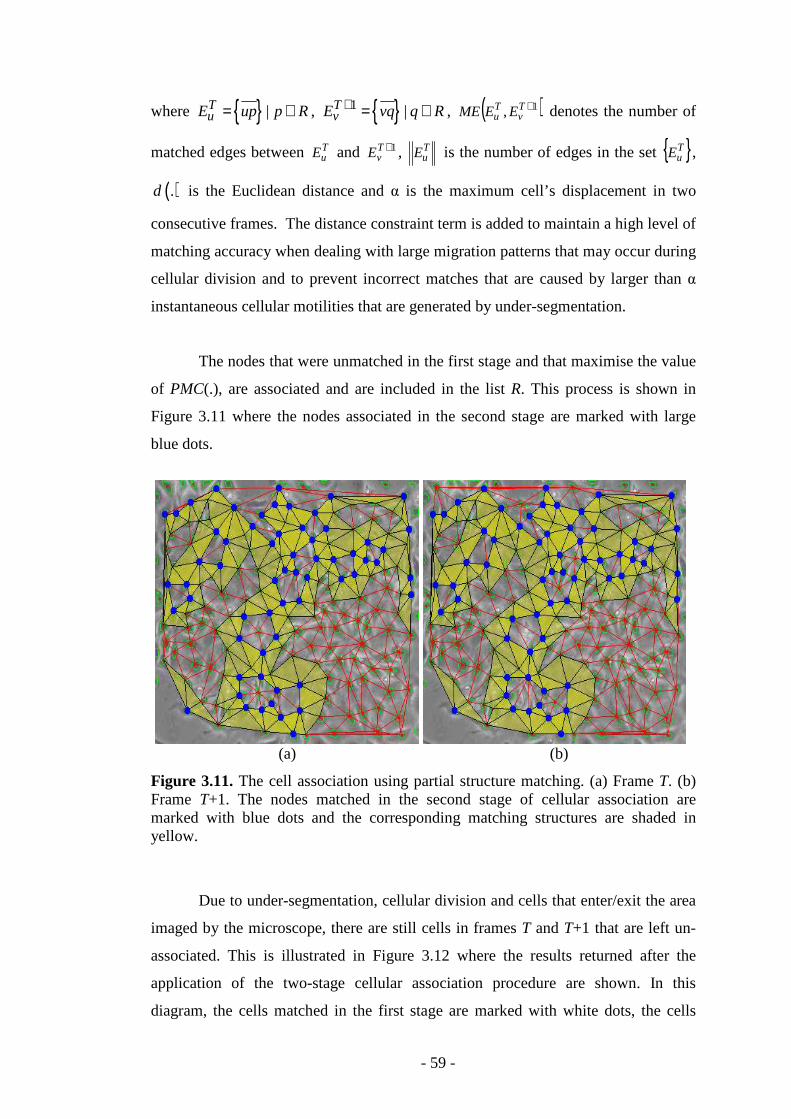
- 59 -
where { } |TuE up p R= ∈ , { }1 |T
vE vq q R+ = ∈ , ( )1, +Tv
Tu EEME denotes the number of
matched edges between TuE and 1+T
vE , TuE is the number of edges in the set { }T
uE ,
( ).d is the Euclidean distance and α is the maximum cell’s displacement in two
consecutive frames. The distance constraint term is added to maintain a high level of
matching accuracy when dealing with large migration patterns that may occur during
cellular division and to prevent incorrect matches that are caused by larger than α
instantaneous cellular motilities that are generated by under-segmentation.
The nodes that were unmatched in the first stage and that maximise the value
of PMC(.), are associated and are included in the list R. This process is shown in
Figure 3.11 where the nodes associated in the second stage are marked with large
blue dots.
(a) (b)
Figure 3.11. The cell association using partial structure matching. (a) Frame T. (b) Frame T+1. The nodes matched in the second stage of cellular association are marked with blue dots and the corresponding matching structures are shaded in yellow.
Due to under-segmentation, cellular division and cells that enter/exit the area
imaged by the microscope, there are still cells in frames T and T+1 that are left un-
associated. This is illustrated in Figure 3.12 where the results returned after the
application of the two-stage cellular association procedure are shown. In this
diagram, the cells matched in the first stage are marked with white dots, the cells
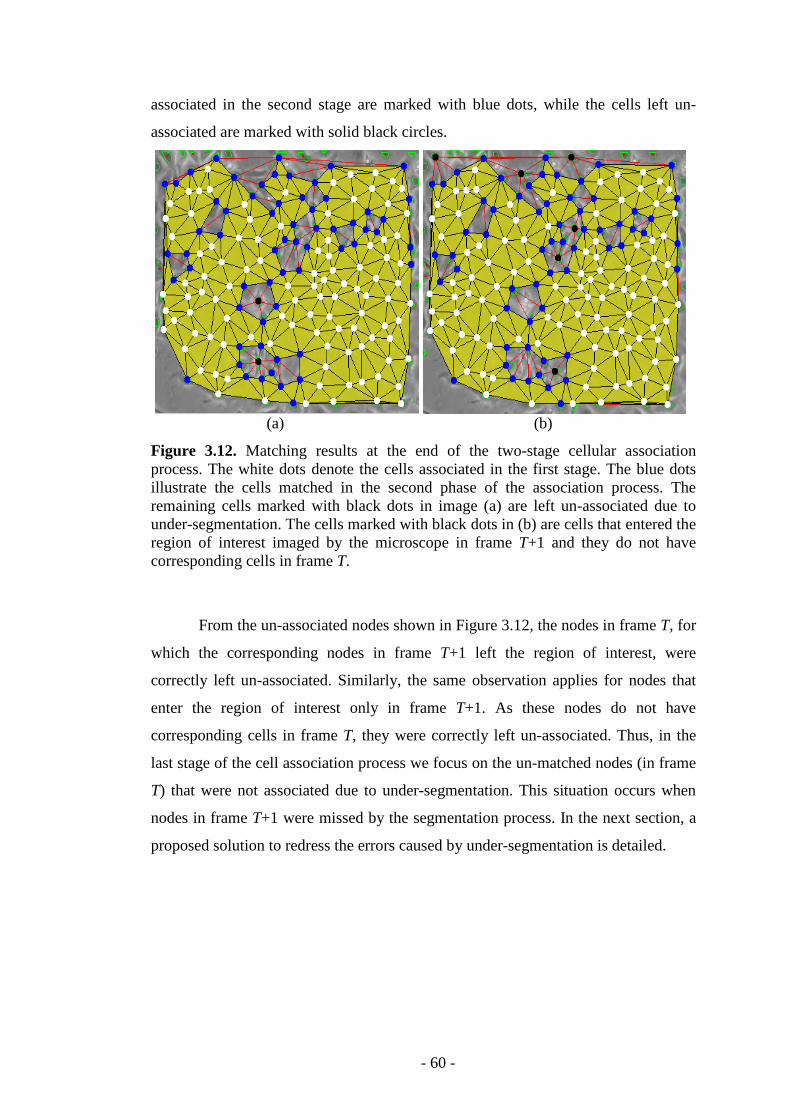
- 60 -
associated in the second stage are marked with blue dots, while the cells left un-
associated are marked with solid black circles.
(a) (b)
Figure 3.12. Matching results at the end of the two-stage cellular association process. The white dots denote the cells associated in the first stage. The blue dots illustrate the cells matched in the second phase of the association process. The remaining cells marked with black dots in image (a) are left un-associated due to under-segmentation. The cells marked with black dots in (b) are cells that entered the region of interest imaged by the microscope in frame T+1 and they do not have corresponding cells in frame T.
From the un-associated nodes shown in Figure 3.12, the nodes in frame T, for
which the corresponding nodes in frame T+1 left the region of interest, were
correctly left un-associated. Similarly, the same observation applies for nodes that
enter the region of interest only in frame T+1. As these nodes do not have
corresponding cells in frame T, they were correctly left un-associated. Thus, in the
last stage of the cell association process we focus on the un-matched nodes (in frame
T) that were not associated due to under-segmentation. This situation occurs when
nodes in frame T+1 were missed by the segmentation process. In the next section, a
proposed solution to redress the errors caused by under-segmentation is detailed.
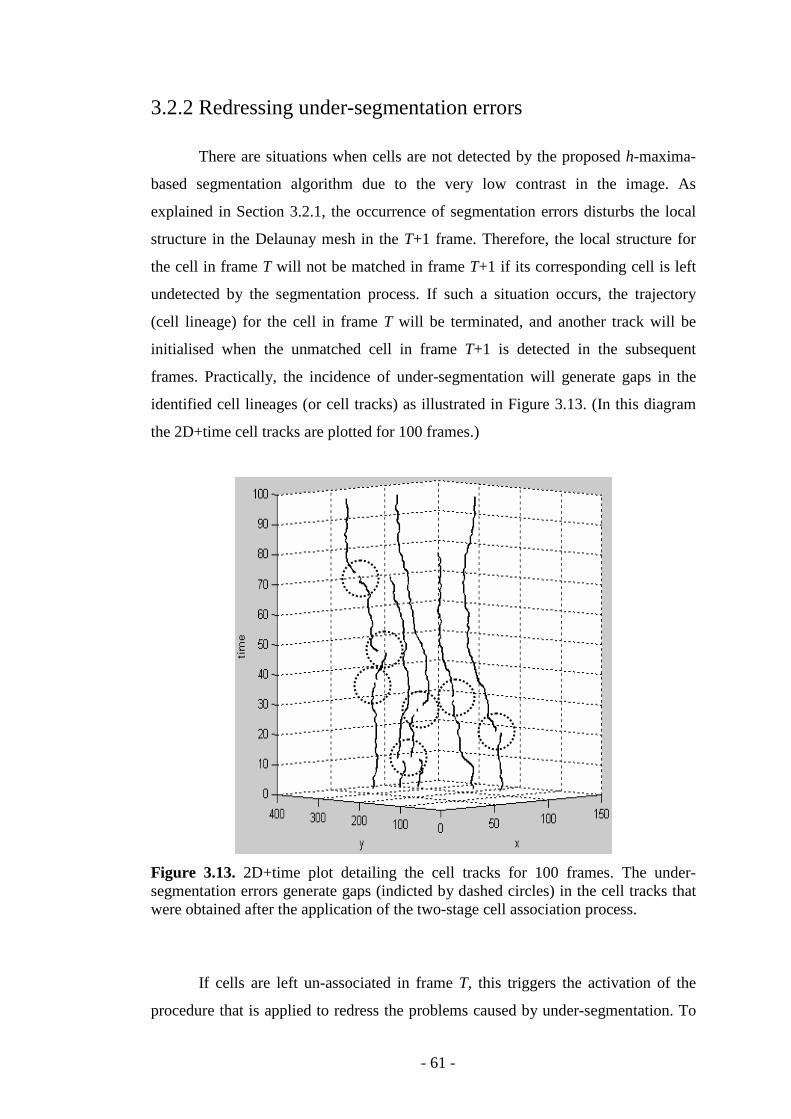
- 61 -
3.2.2 Redressing under-segmentation errors
There are situations when cells are not detected by the proposed h-maxima-
based segmentation algorithm due to the very low contrast in the image. As
explained in Section 3.2.1, the occurrence of segmentation errors disturbs the local
structure in the Delaunay mesh in the T+1 frame. Therefore, the local structure for
the cell in frame T will not be matched in frame T+1 if its corresponding cell is left
undetected by the segmentation process. If such a situation occurs, the trajectory
(cell lineage) for the cell in frame T will be terminated, and another track will be
initialised when the unmatched cell in frame T+1 is detected in the subsequent
frames. Practically, the incidence of under-segmentation will generate gaps in the
identified cell lineages (or cell tracks) as illustrated in Figure 3.13. (In this diagram
the 2D+time cell tracks are plotted for 100 frames.)
Figure 3.13. 2D+time plot detailing the cell tracks for 100 frames. The under-segmentation errors generate gaps (indicted by dashed circles) in the cell tracks that were obtained after the application of the two-stage cell association process.
If cells are left un-associated in frame T, this triggers the activation of the
procedure that is applied to redress the problems caused by under-segmentation. To
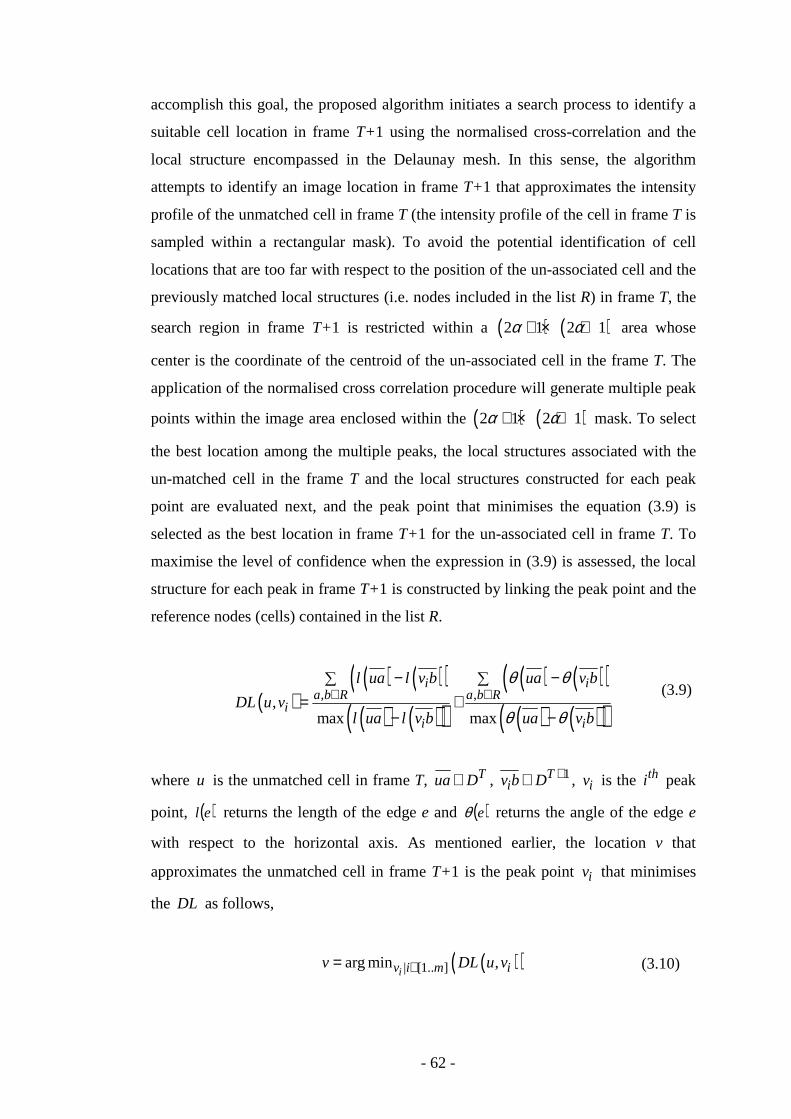
- 62 -
accomplish this goal, the proposed algorithm initiates a search process to identify a
suitable cell location in frame T+1 using the normalised cross-correlation and the
local structure encompassed in the Delaunay mesh. In this sense, the algorithm
attempts to identify an image location in frame T+1 that approximates the intensity
profile of the unmatched cell in frame T (the intensity profile of the cell in frame T is
sampled within a rectangular mask). To avoid the potential identification of cell
locations that are too far with respect to the position of the un-associated cell and the
previously matched local structures (i.e. nodes included in the list R) in frame T, the
search region in frame T+1 is restricted within a ( ) ( )2 1 2 1α α+ × + area whose
center is the coordinate of the centroid of the un-associated cell in the frame T. The
application of the normalised cross correlation procedure will generate multiple peak
points within the image area enclosed within the ( ) ( )2 1 2 1α α+ × + mask. To select
the best location among the multiple peaks, the local structures associated with the
un-matched cell in the frame T and the local structures constructed for each peak
point are evaluated next, and the peak point that minimises the equation (3.9) is
selected as the best location in frame T+1 for the un-associated cell in frame T. To
maximise the level of confidence when the expression in (3.9) is assessed, the local
structure for each peak in frame T+1 is constructed by linking the peak point and the
reference nodes (cells) contained in the list R.
( )( ) ( )( )( ) ( )( )
( ) ( )( )( ) ( )( )
, ,,max max
i ia b R a b R
ii i
l ua l v b ua v b
DL u vl ua l v b ua v b
θ θ
θ θ∈ ∈
− −∑ ∑
= +− −
where u is the unmatched cell in frame T, Tua D∈ , 1Tiv b D +∈ , iv is the thi peak
point, ( )el returns the length of the edge e and ( )eθ returns the angle of the edge e
with respect to the horizontal axis. As mentioned earlier, the location v that
approximates the unmatched cell in frame T+1 is the peak point iv that minimises
the DL as follows,
( )( )| [1.. ]arg min ,iv i m iv DL u v∈=
(3.9)
(3.10)
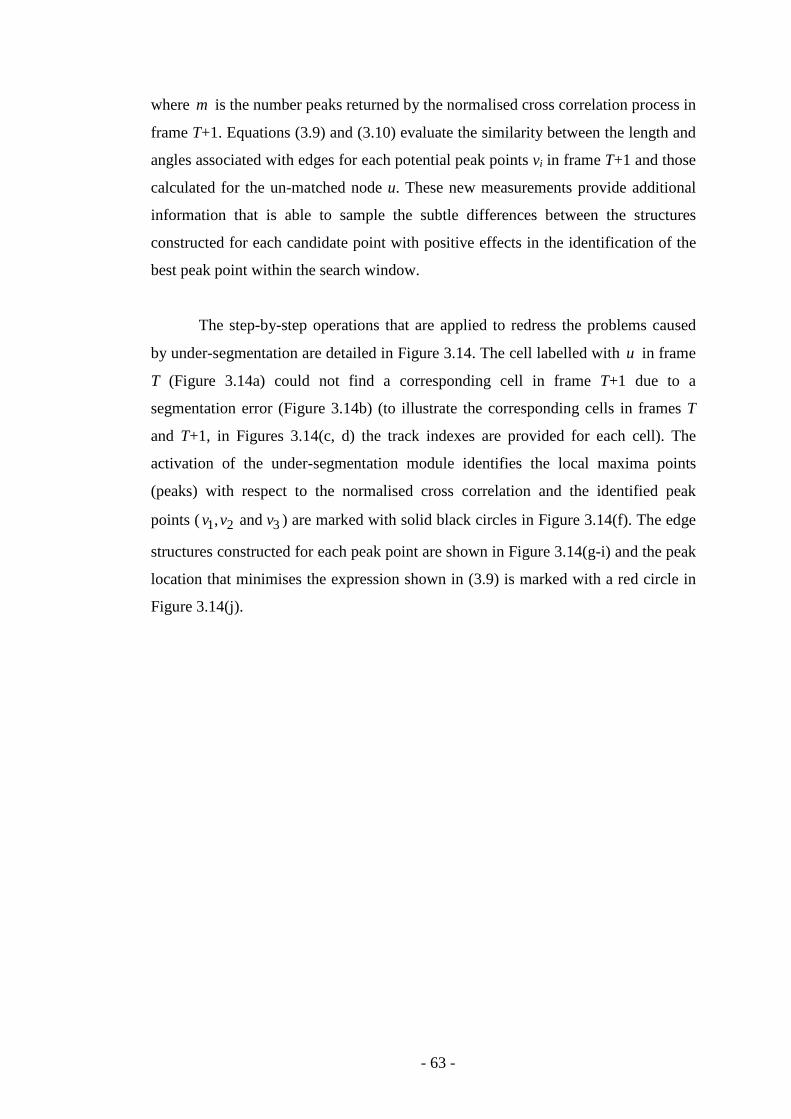
- 63 -
where m is the number peaks returned by the normalised cross correlation process in
frame T+1. Equations (3.9) and (3.10) evaluate the similarity between the length and
angles associated with edges for each potential peak points vi in frame T+1 and those
calculated for the un-matched node u. These new measurements provide additional
information that is able to sample the subtle differences between the structures
constructed for each candidate point with positive effects in the identification of the
best peak point within the search window.
The step-by-step operations that are applied to redress the problems caused
by under-segmentation are detailed in Figure 3.14. The cell labelled with u in frame
T (Figure 3.14a) could not find a corresponding cell in frame T+1 due to a
segmentation error (Figure 3.14b) (to illustrate the corresponding cells in frames T
and T+1, in Figures 3.14(c, d) the track indexes are provided for each cell). The
activation of the under-segmentation module identifies the local maxima points
(peaks) with respect to the normalised cross correlation and the identified peak
points ( 1 2 3, and v v v ) are marked with solid black circles in Figure 3.14(f). The edge
structures constructed for each peak point are shown in Figure 3.14(g-i) and the peak
location that minimises the expression shown in (3.9) is marked with a red circle in
Figure 3.14(j).
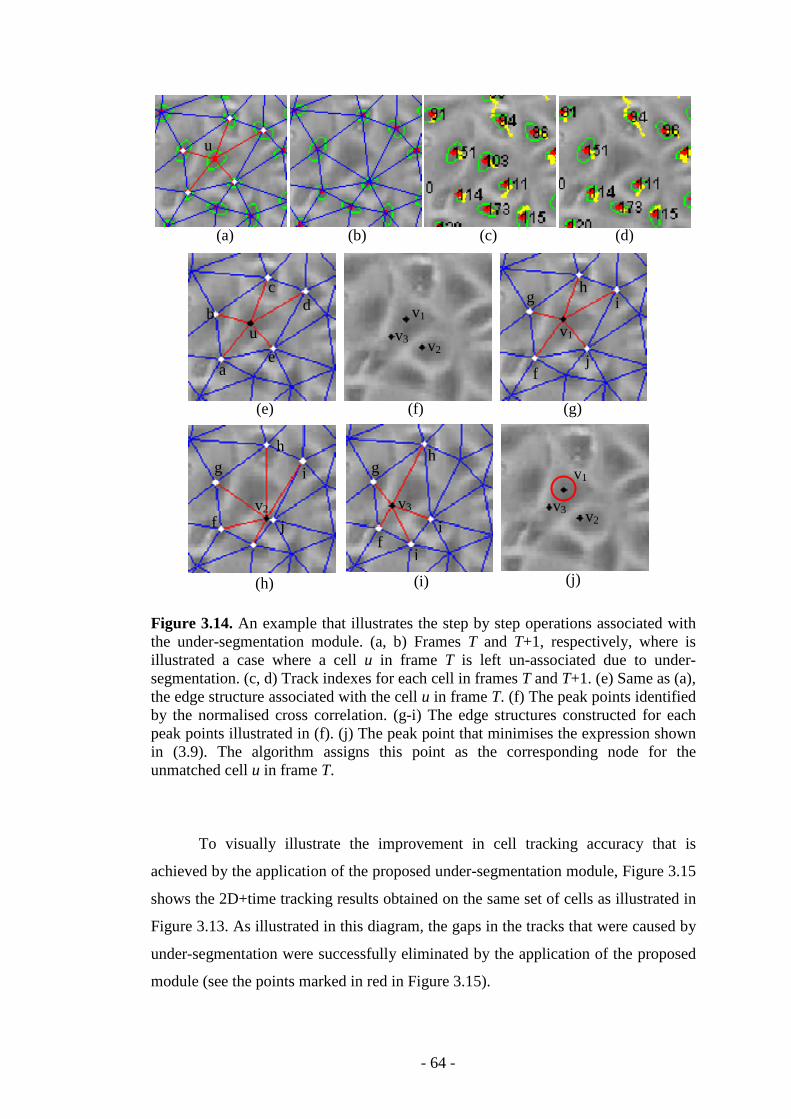
- 64 -
Figure 3.14. An example that illustrates the step by step operations associated with the under-segmentation module. (a, b) Frames T and T+1, respectively, where is illustrated a case where a cell u in frame T is left un-associated due to under-segmentation. (c, d) Track indexes for each cell in frames T and T+1. (e) Same as (a), the edge structure associated with the cell u in frame T. (f) The peak points identified by the normalised cross correlation. (g-i) The edge structures constructed for each peak points illustrated in (f). (j) The peak point that minimises the expression shown in (3.9). The algorithm assigns this point as the corresponding node for the unmatched cell u in frame T.
To visually illustrate the improvement in cell tracking accuracy that is
achieved by the application of the proposed under-segmentation module, Figure 3.15
shows the 2D+time tracking results obtained on the same set of cells as illustrated in
Figure 3.13. As illustrated in this diagram, the gaps in the tracks that were caused by
under-segmentation were successfully eliminated by the application of the proposed
module (see the points marked in red in Figure 3.15).
a
b d
e
v1
v2 v3 v1
f
g h
i
j
v2 f
g h
i
v3
f
g h
i
j
j
u
c
(a) (b) (c) (d)
(e) (f) (g)
(h) (i)
u
v1
v2 v3
(j)
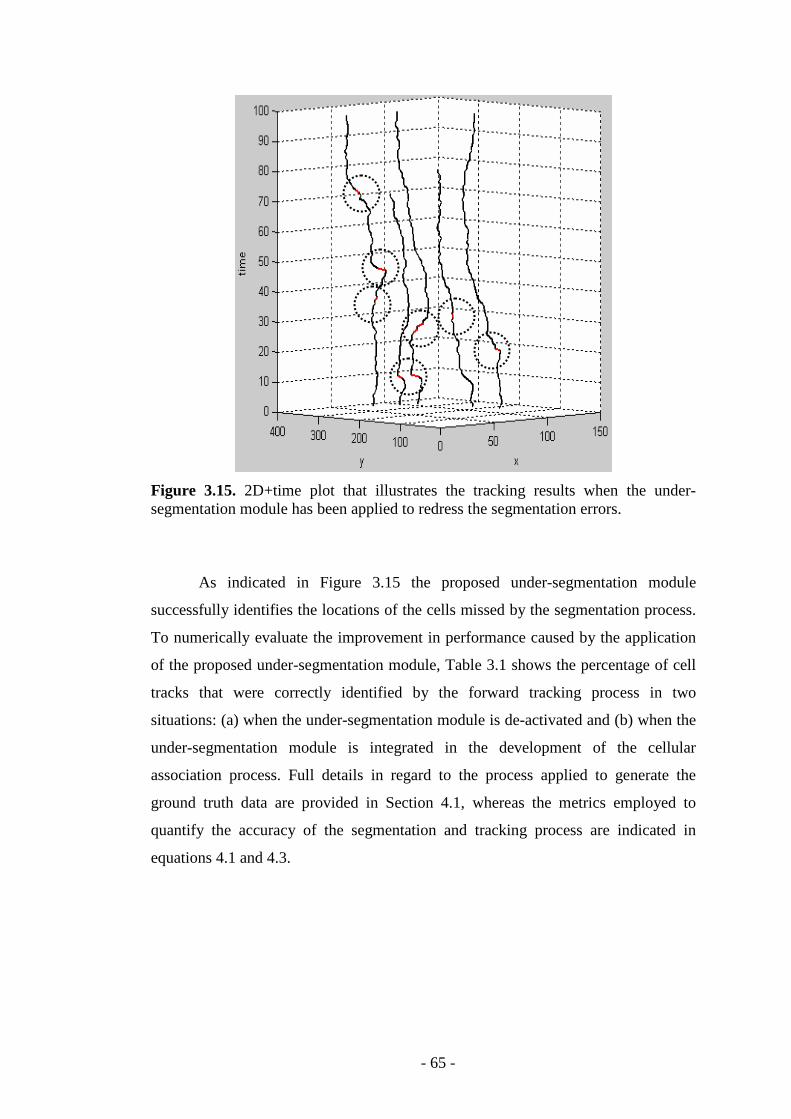
- 65 -
Figure 3.15. 2D+time plot that illustrates the tracking results when the under-segmentation module has been applied to redress the segmentation errors.
As indicated in Figure 3.15 the proposed under-segmentation module
successfully identifies the locations of the cells missed by the segmentation process.
To numerically evaluate the improvement in performance caused by the application
of the proposed under-segmentation module, Table 3.1 shows the percentage of cell
tracks that were correctly identified by the forward tracking process in two
situations: (a) when the under-segmentation module is de-activated and (b) when the
under-segmentation module is integrated in the development of the cellular
association process. Full details in regard to the process applied to generate the
ground truth data are provided in Section 4.1, whereas the metrics employed to
quantify the accuracy of the segmentation and tracking process are indicated in
equations 4.1 and 4.3.
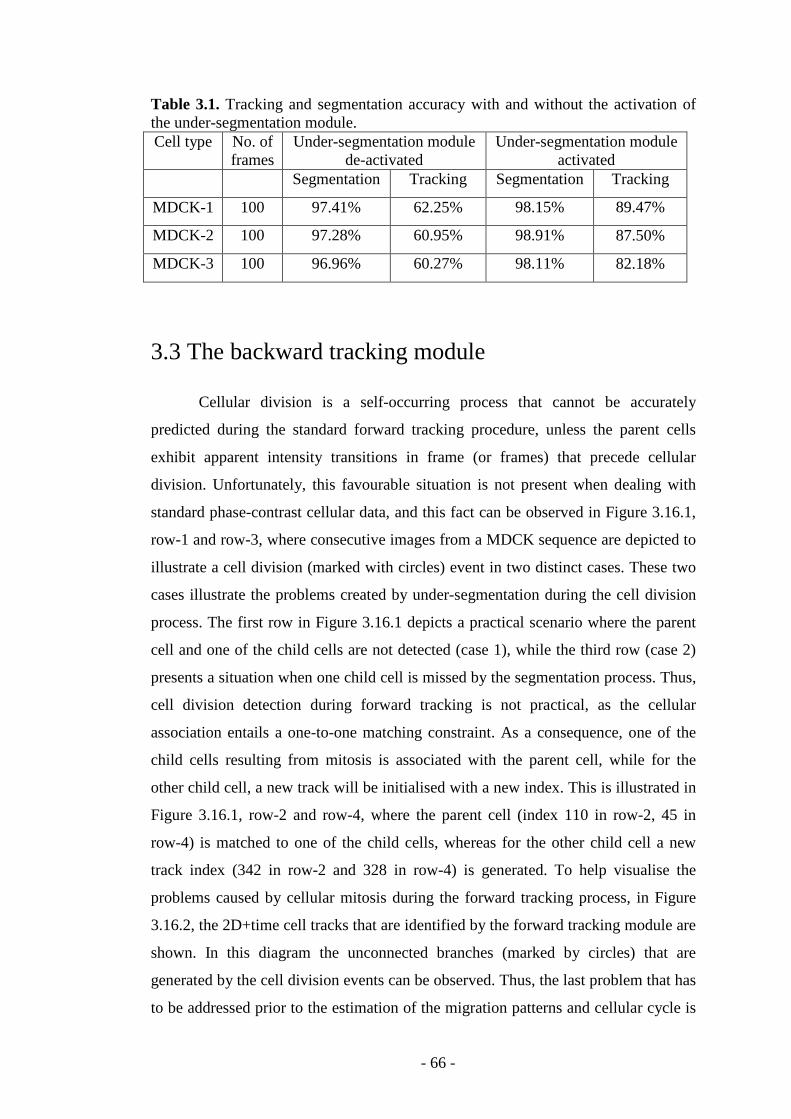
- 66 -
Table 3.1. Tracking and segmentation accuracy with and without the activation of the under-segmentation module. Cell type No. of
frames Under-segmentation module
de-activated Under-segmentation module
activated Segmentation Tracking Segmentation Tracking
MDCK-1 100 97.41% 62.25% 98.15% 89.47%
MDCK-2 100 97.28% 60.95% 98.91% 87.50%
MDCK-3 100 96.96% 60.27% 98.11% 82.18%
3.3 The backward tracking module
Cellular division is a self-occurring process that cannot be accurately
predicted during the standard forward tracking procedure, unless the parent cells
exhibit apparent intensity transitions in frame (or frames) that precede cellular
division. Unfortunately, this favourable situation is not present when dealing with
standard phase-contrast cellular data, and this fact can be observed in Figure 3.16.1,
row-1 and row-3, where consecutive images from a MDCK sequence are depicted to
illustrate a cell division (marked with circles) event in two distinct cases. These two
cases illustrate the problems created by under-segmentation during the cell division
process. The first row in Figure 3.16.1 depicts a practical scenario where the parent
cell and one of the child cells are not detected (case 1), while the third row (case 2)
presents a situation when one child cell is missed by the segmentation process. Thus,
cell division detection during forward tracking is not practical, as the cellular
association entails a one-to-one matching constraint. As a consequence, one of the
child cells resulting from mitosis is associated with the parent cell, while for the
other child cell, a new track will be initialised with a new index. This is illustrated in
Figure 3.16.1, row-2 and row-4, where the parent cell (index 110 in row-2, 45 in
row-4) is matched to one of the child cells, whereas for the other child cell a new
track index (342 in row-2 and 328 in row-4) is generated. To help visualise the
problems caused by cellular mitosis during the forward tracking process, in Figure
3.16.2, the 2D+time cell tracks that are identified by the forward tracking module are
shown. In this diagram the unconnected branches (marked by circles) that are
generated by the cell division events can be observed. Thus, the last problem that has
to be addressed prior to the estimation of the migration patterns and cellular cycle is
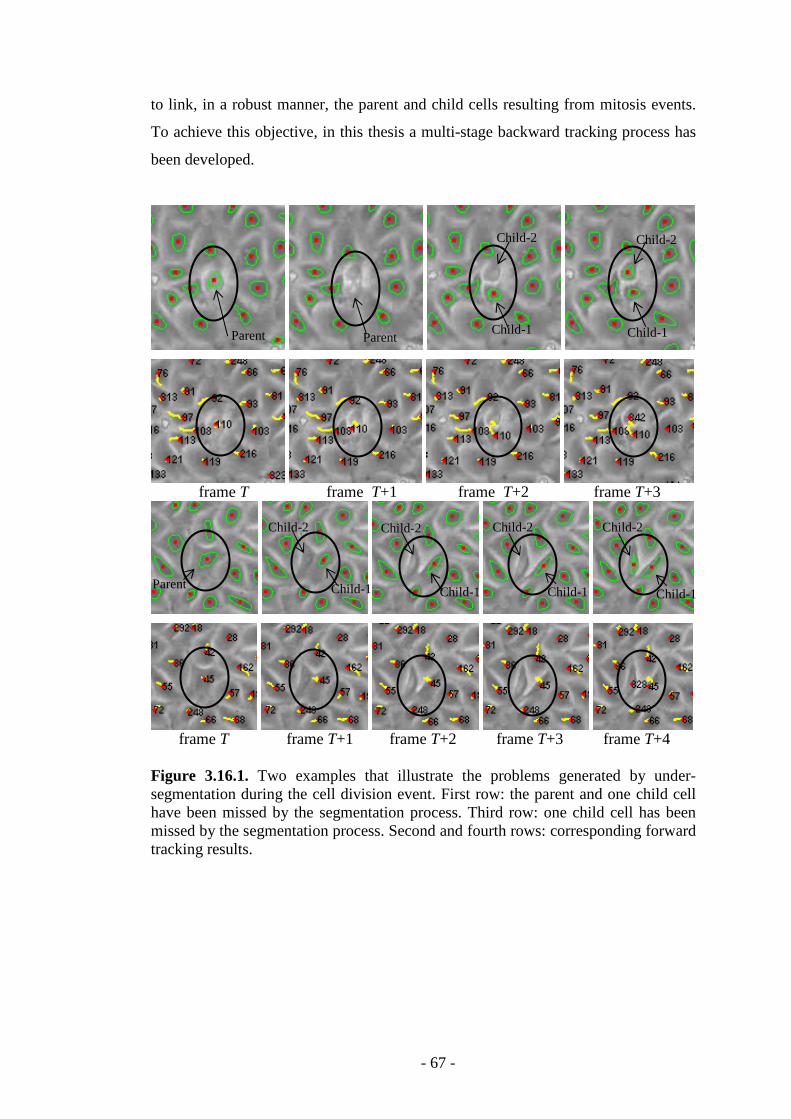
- 67 -
to link, in a robust manner, the parent and child cells resulting from mitosis events.
To achieve this objective, in this thesis a multi-stage backward tracking process has
been developed.
frame T frame T+1 frame T+2 frame T+3
frame T frame T+1 frame T+2 frame T+3 frame T+4 Figure 3.16.1. Two examples that illustrate the problems generated by under-segmentation during the cell division event. First row: the parent and one child cell have been missed by the segmentation process. Third row: one child cell has been missed by the segmentation process. Second and fourth rows: corresponding forward tracking results.
Parent Parent Child-1
Child-2
Child-1
Child-2
Parent Child-1 Child-1 Child-1 Child-1
Child-2 Child-2 Child-2 Child-2
- 68 -
Figure 3.16.2. 2D+time plot that illustrates the forward tracking results in the presence of cellular division. Full explanations in regard to this diagram are provided in the text.
The application of backward tracking is successful in detecting the mitosis
events only if all cells (parent and child cells) are correctly detected by the
segmentation process. Unfortunately, due to the low intensity contrast that is a
characteristic of phase-contrast images, there are situations when some child cells
resulting from cellular division events are missed by the segmentation algorithm.
This situation can be observed in the third row of Figure 3.16.1 where it is indicated
that the child cell-2 has not been identified by the proposed segmentation scheme.
Since the child cell-2 was not identified by the segmentation algorithm, this fact did
not trigger the activation of the under-segmentation procedure and the parent cell has
been associated with the child cell-1. The child cell-2 is detected by the algorithm
only in frame T+4 (see third row- Figure 3.16.1) and it will be further detected with a
new track index. Thus, this type of under-segmentation problems needs to be
addressed during backward tracking using a hybrid procedure that combines the
intensity model of the missed cell with the local structural information contained in
the Delaunay meshes.
In the proposed backward tracking scheme, for each cell track identified by
the forward tracking module, the backward tracking process is carried out from the
Track index 110 Track index 45
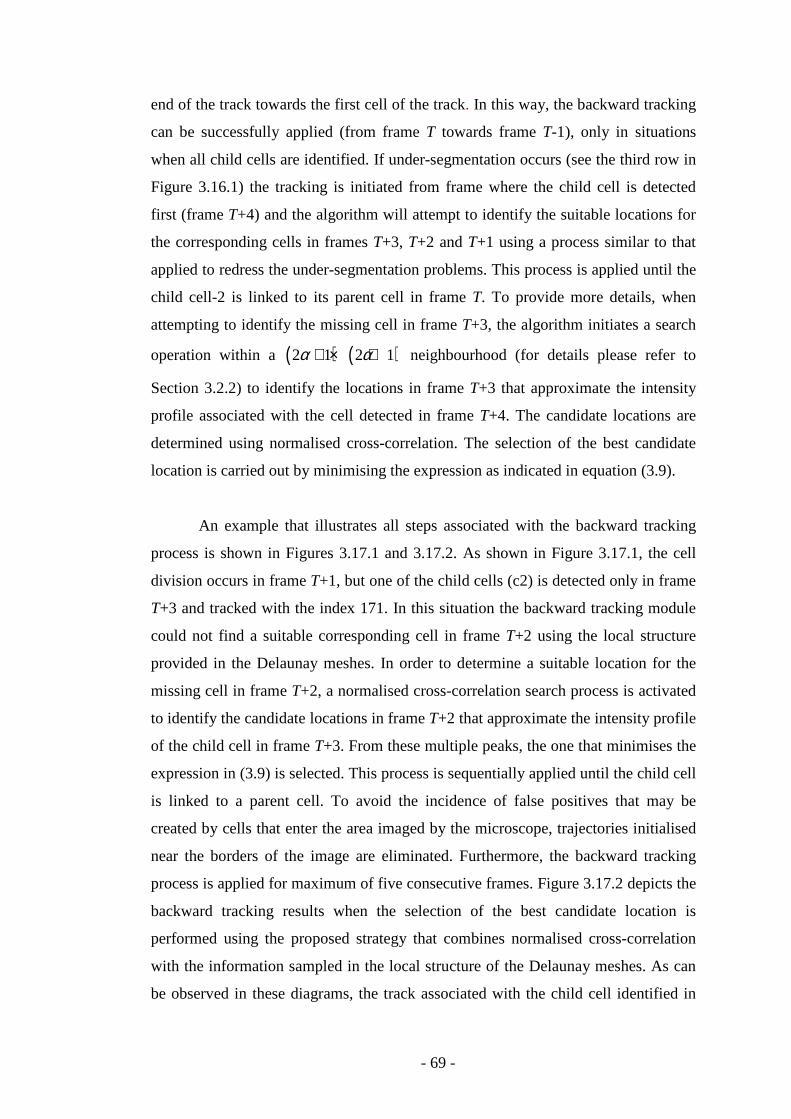
- 69 -
end of the track towards the first cell of the track. In this way, the backward tracking
can be successfully applied (from frame T towards frame T-1), only in situations
when all child cells are identified. If under-segmentation occurs (see the third row in
Figure 3.16.1) the tracking is initiated from frame where the child cell is detected
first (frame T+4) and the algorithm will attempt to identify the suitable locations for
the corresponding cells in frames T+3, T+2 and T+1 using a process similar to that
applied to redress the under-segmentation problems. This process is applied until the
child cell-2 is linked to its parent cell in frame T. To provide more details, when
attempting to identify the missing cell in frame T+3, the algorithm initiates a search
operation within a ( ) ( )2 1 2 1α α+ × + neighbourhood (for details please refer to
Section 3.2.2) to identify the locations in frame T+3 that approximate the intensity
profile associated with the cell detected in frame T+4. The candidate locations are
determined using normalised cross-correlation. The selection of the best candidate
location is carried out by minimising the expression as indicated in equation (3.9).
An example that illustrates all steps associated with the backward tracking
process is shown in Figures 3.17.1 and 3.17.2. As shown in Figure 3.17.1, the cell
division occurs in frame T+1, but one of the child cells (c2) is detected only in frame
T+3 and tracked with the index 171. In this situation the backward tracking module
could not find a suitable corresponding cell in frame T+2 using the local structure
provided in the Delaunay meshes. In order to determine a suitable location for the
missing cell in frame T+2, a normalised cross-correlation search process is activated
to identify the candidate locations in frame T+2 that approximate the intensity profile
of the child cell in frame T+3. From these multiple peaks, the one that minimises the
expression in (3.9) is selected. This process is sequentially applied until the child cell
is linked to a parent cell. To avoid the incidence of false positives that may be
created by cells that enter the area imaged by the microscope, trajectories initialised
near the borders of the image are eliminated. Furthermore, the backward tracking
process is applied for maximum of five consecutive frames. Figure 3.17.2 depicts the
backward tracking results when the selection of the best candidate location is
performed using the proposed strategy that combines normalised cross-correlation
with the information sampled in the local structure of the Delaunay meshes. As can
be observed in these diagrams, the track associated with the child cell identified in
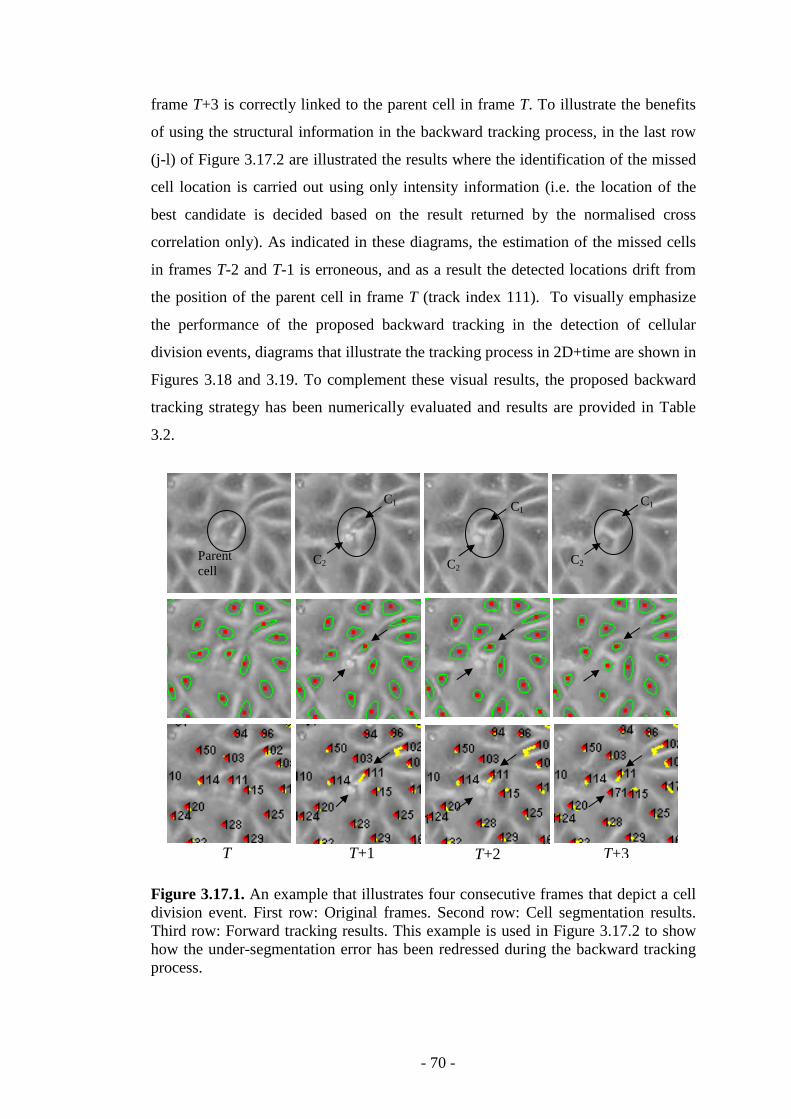
- 70 -
frame T+3 is correctly linked to the parent cell in frame T. To illustrate the benefits
of using the structural information in the backward tracking process, in the last row
(j-l) of Figure 3.17.2 are illustrated the results where the identification of the missed
cell location is carried out using only intensity information (i.e. the location of the
best candidate is decided based on the result returned by the normalised cross
correlation only). As indicated in these diagrams, the estimation of the missed cells
in frames T-2 and T-1 is erroneous, and as a result the detected locations drift from
the position of the parent cell in frame T (track index 111). To visually emphasize
the performance of the proposed backward tracking in the detection of cellular
division events, diagrams that illustrate the tracking process in 2D+time are shown in
Figures 3.18 and 3.19. To complement these visual results, the proposed backward
tracking strategy has been numerically evaluated and results are provided in Table
3.2.
Figure 3.17.1. An example that illustrates four consecutive frames that depict a cell division event. First row: Original frames. Second row: Cell segmentation results. Third row: Forward tracking results. This example is used in Figure 3.17.2 to show how the under-segmentation error has been redressed during the backward tracking process.
Parent cell
C1
C2
C1 C1
C2 C2
T T+1 T+2 T+3
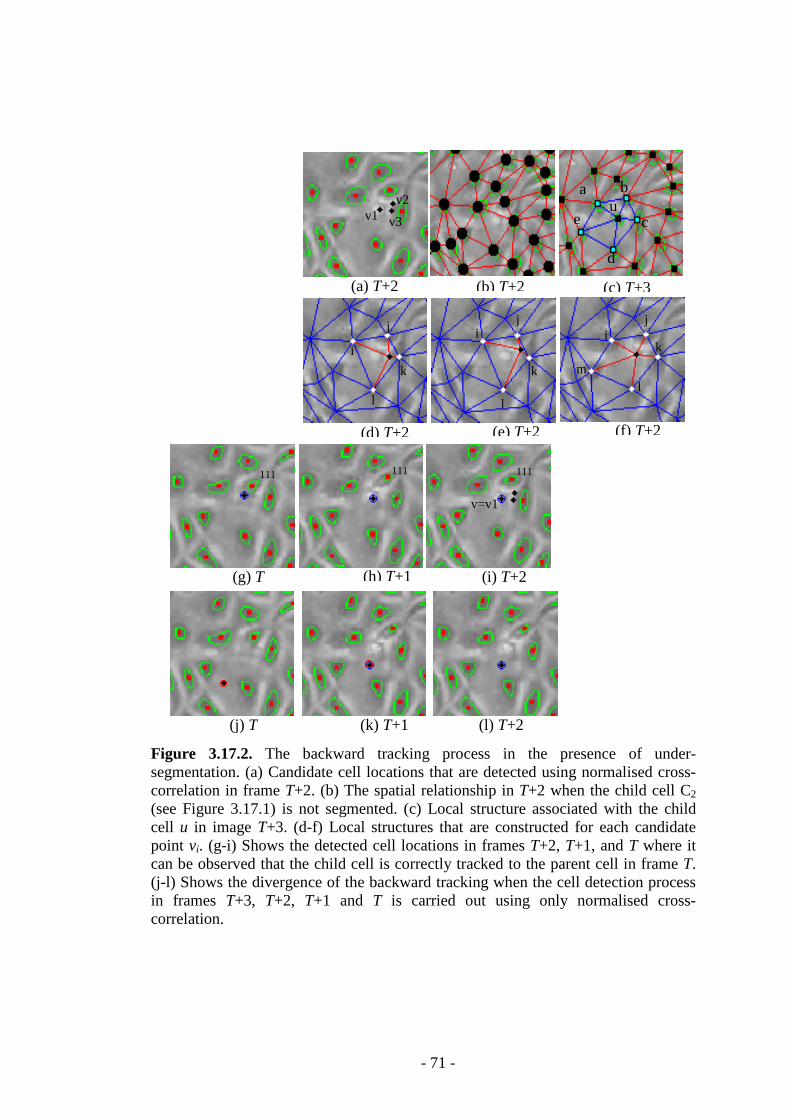
- 71 -
Figure 3.17.2. The backward tracking process in the presence of under-segmentation. (a) Candidate cell locations that are detected using normalised cross-correlation in frame T+2. (b) The spatial relationship in T+2 when the child cell C2 (see Figure 3.17.1) is not segmented. (c) Local structure associated with the child cell u in image T+3. (d-f) Local structures that are constructed for each candidate point vi. (g-i) Shows the detected cell locations in frames T+2, T+1, and T where it can be observed that the child cell is correctly tracked to the parent cell in frame T. (j-l) Shows the divergence of the backward tracking when the cell detection process in frames T+3, T+2, T+1 and T is carried out using only normalised cross-correlation.
u a b
c
d
e v1 v2
v3
i j
k
l m
i j
k
l
i
j
k
l
111
v=v1
(c) T+3 (b) T+2 (a) T+2
(f) T+2 (e) T+2 (d) T+2
(i) T+2 (h) T+1 (g) T
111 111
(l) T+2 (k) T+1 (j) T
- 72 -
Figure 3.18. Tracking results displayed in 2D+time plots. In these graphs the black points indicate forward tracking results. The backward tracking results are shown in green, while the red points indicate the identified tracks when the under-segmentation module is activated for both forward and backward tracking modules.
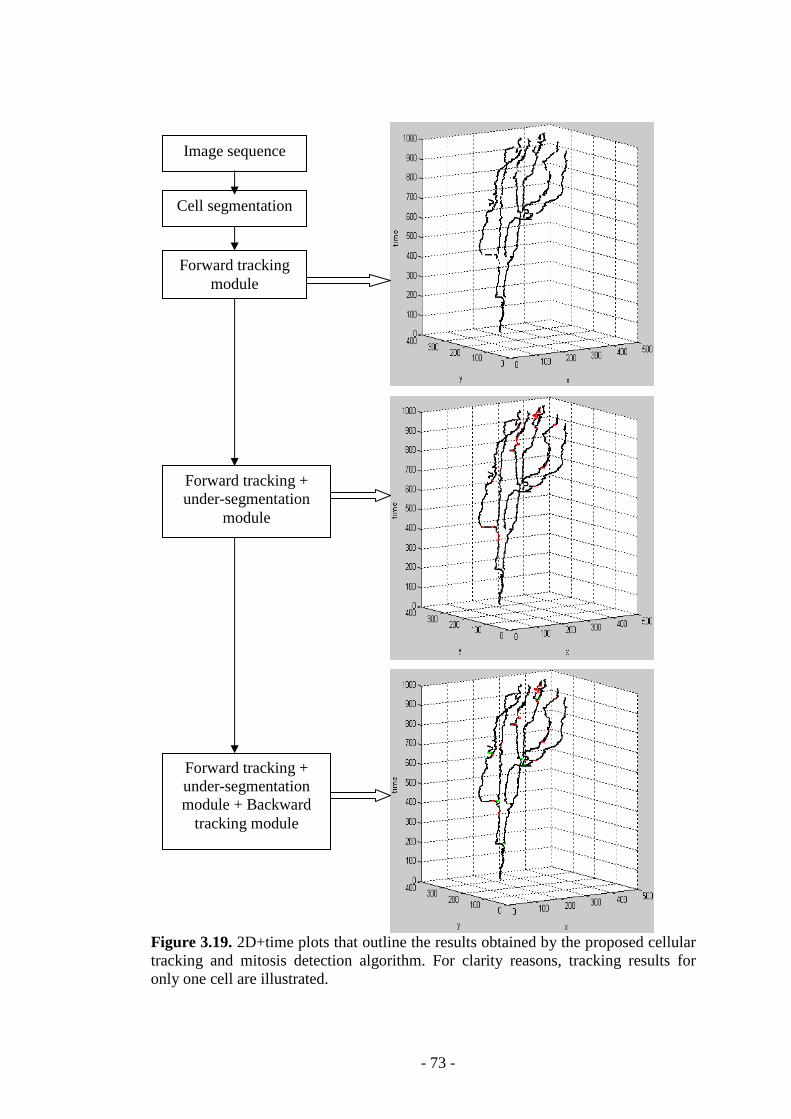
- 73 -
Figure 3.19. 2D+time plots that outline the results obtained by the proposed cellular tracking and mitosis detection algorithm. For clarity reasons, tracking results for only one cell are illustrated.
Forward tracking + under-segmentation
module
Forward tracking + under-segmentation module + Backward
tracking module
Forward tracking module
Cell segmentation
Image sequence
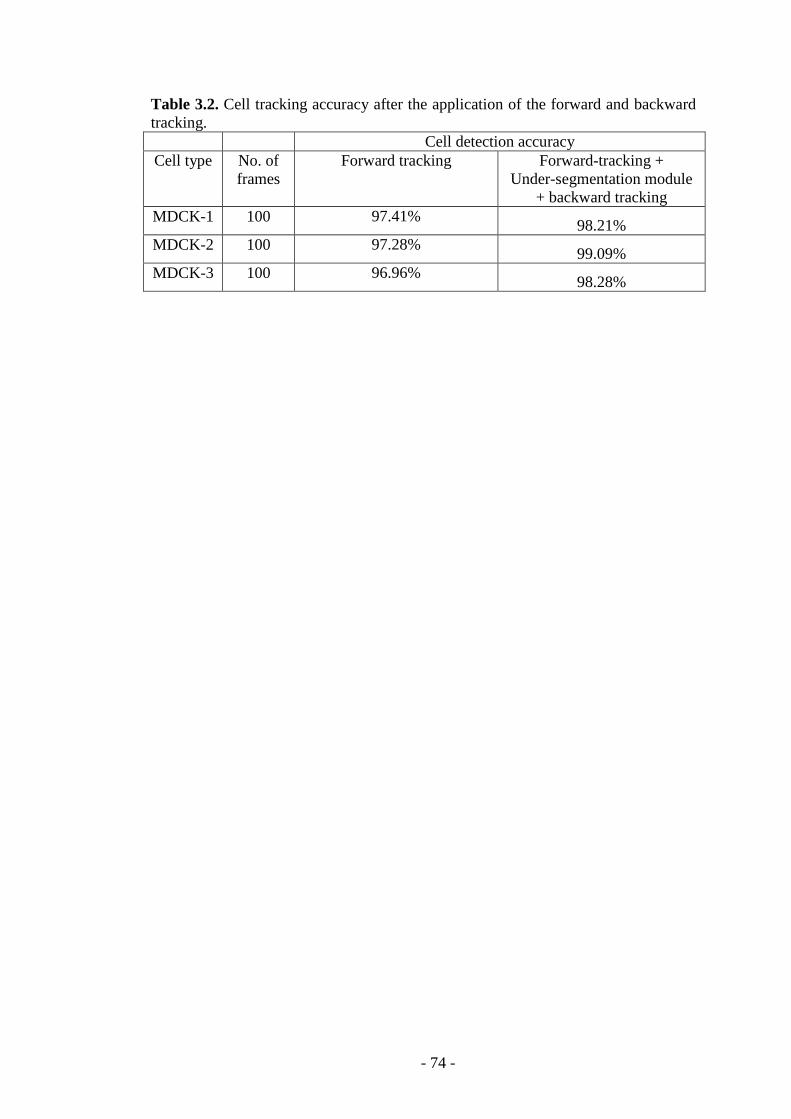
- 74 -
Table 3.2. Cell tracking accuracy after the application of the forward and backward tracking.
Cell detection accuracy Cell type No. of
frames Forward tracking Forward-tracking +
Under-segmentation module + backward tracking
MDCK-1 100 97.41% 98.21%
MDCK-2 100 97.28% 99.09%
MDCK-3 100 96.96% 98.28%
- 75 -
Chapter 4:
Experimental Results
This chapter provides an extensive evaluation of the proposed framework,
analyses the experimental results and compares the performances obtained by the
proposed cell tracking and mitosis detection algorithm to state-of-the-art
implementations. To allow for a comprehensive evaluation of the performance
attained by the proposed scheme, experimental results are reported to sample the
accuracy levels for both areas of interest: cellular tracking and identification of the
cellular division events. To facilitate the calculation of the performance indicators
that are able to numerically sample the accuracy of the proposed and state-of-the-art
cell tracking and mitosis detection algorithms, seven time-lapse video sequences
(three sequences of Madin Darby Canine Kidney Epithelial Cells - MDCK and four
sequences of Human Umbilical Vein Endothelial Cells - HUVEC cell data) were
employed in this study. The spatial resolution of these datasets varies from 0.87 to
1.3 µm/pixel and the temporal resolution is in the range 5 to 9 min/frame. These
seven video sequences were captured using phase-contrast microscopy image
acquisition modalities (for additional details refer to appendix B) and, as indicated in
Chapter 2, they are characterised by substantial intensity variations and a high level
of noise. The MDCK cell datasets contain dense cellular structures that undergo
frequent cell division, and these characteristics raised substantial challenges for all
computational components of the proposed algorithm, cellular segmentation, forward
tracking and mitosis detection. In addition, since the region of interest imaged by the
microscope is limited, there are frequent situations when the cells situated near the
border of the ROI exit and re-enter the area encompassed by the field of view. As
opposed to MDCK data, the cellular structures sampled in HUVEC image sequences
are relatively sparse and a distinct characteristic is the high level of mitosis events.
Since the number of cells contained in a HUVEC frame is relatively low, the
negative effects caused by the cells that exit and re-enter the ROI are more
noticeable than in the case of MDCK data. Similarly to MDCK data, the HUVEC
datasets exhibit substantial intra- and inter-frame intensity variations and is worth
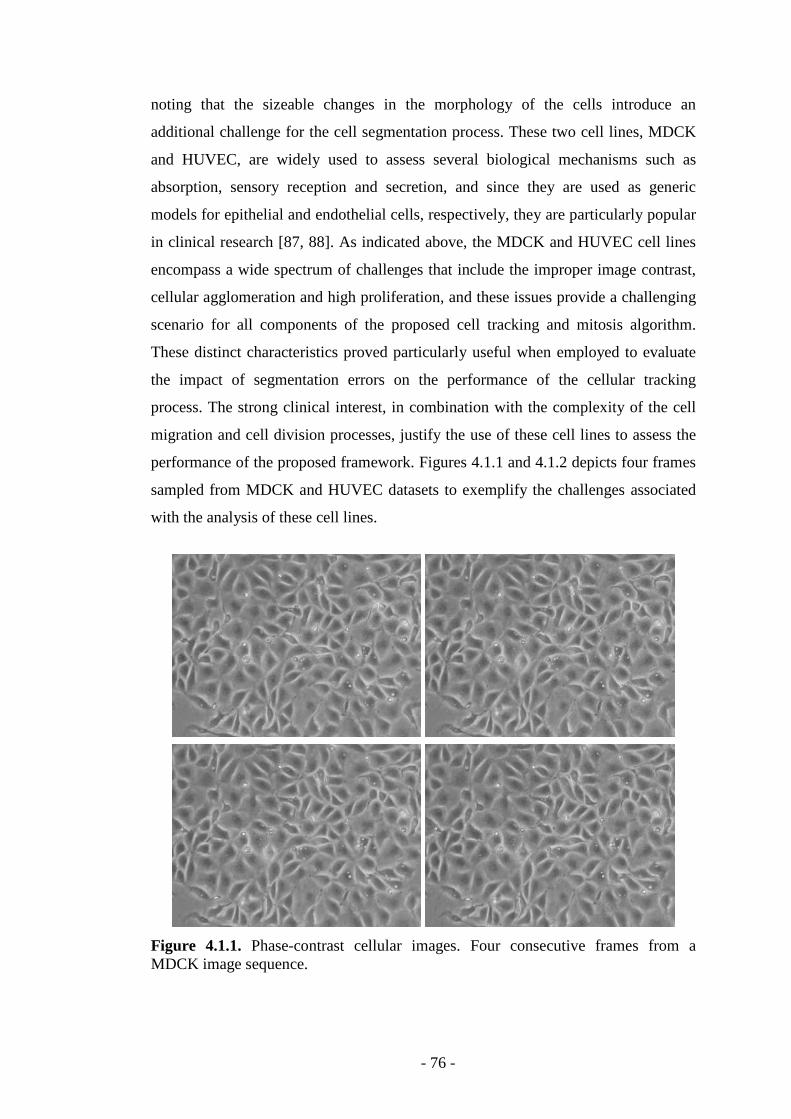
- 76 -
noting that the sizeable changes in the morphology of the cells introduce an
additional challenge for the cell segmentation process. These two cell lines, MDCK
and HUVEC, are widely used to assess several biological mechanisms such as
absorption, sensory reception and secretion, and since they are used as generic
models for epithelial and endothelial cells, respectively, they are particularly popular
in clinical research [87, 88]. As indicated above, the MDCK and HUVEC cell lines
encompass a wide spectrum of challenges that include the improper image contrast,
cellular agglomeration and high proliferation, and these issues provide a challenging
scenario for all components of the proposed cell tracking and mitosis algorithm.
These distinct characteristics proved particularly useful when employed to evaluate
the impact of segmentation errors on the performance of the cellular tracking
process. The strong clinical interest, in combination with the complexity of the cell
migration and cell division processes, justify the use of these cell lines to assess the
performance of the proposed framework. Figures 4.1.1 and 4.1.2 depicts four frames
sampled from MDCK and HUVEC datasets to exemplify the challenges associated
with the analysis of these cell lines.
Figure 4.1.1. Phase-contrast cellular images. Four consecutive frames from a MDCK image sequence.
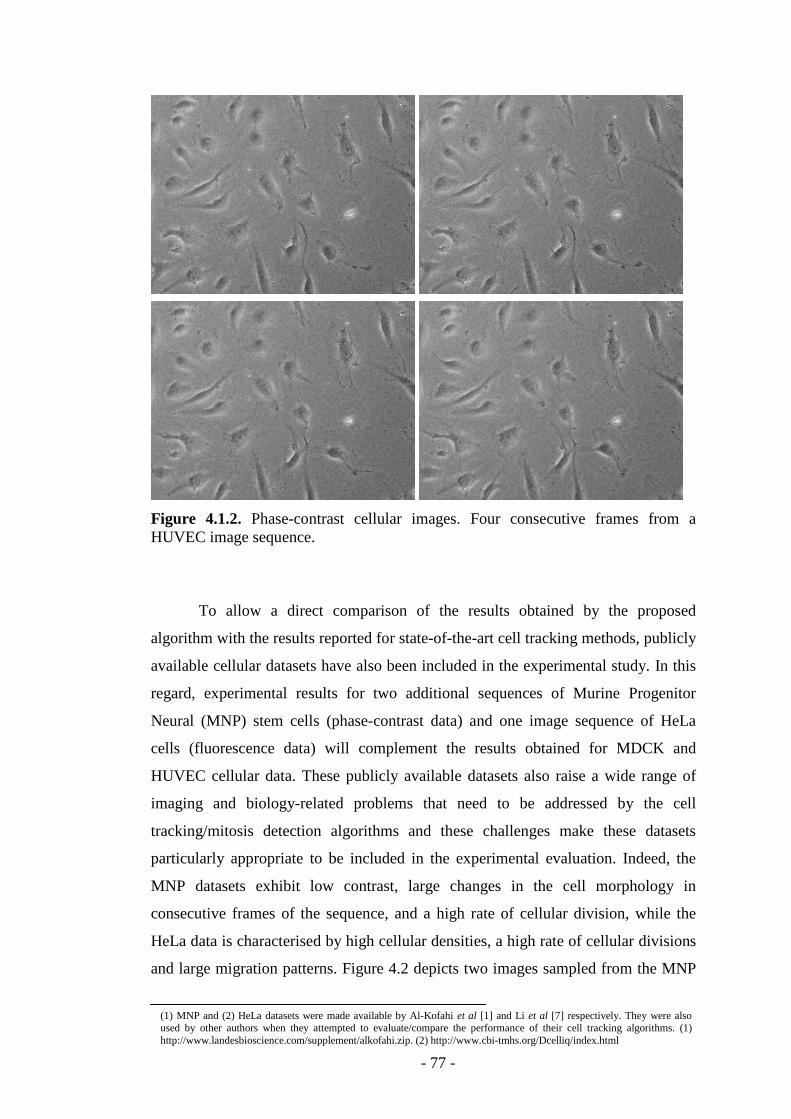
- 77 -
Figure 4.1.2. Phase-contrast cellular images. Four consecutive frames from a HUVEC image sequence.
To allow a direct comparison of the results obtained by the proposed
algorithm with the results reported for state-of-the-art cell tracking methods, publicly
available cellular datasets have also been included in the experimental study. In this
regard, experimental results for two additional sequences of Murine Progenitor
Neural (MNP) stem cells (phase-contrast data) and one image sequence of HeLa
cells (fluorescence data) will complement the results obtained for MDCK and
HUVEC cellular data. These publicly available datasets also raise a wide range of
imaging and biology-related problems that need to be addressed by the cell
tracking/mitosis detection algorithms and these challenges make these datasets
particularly appropriate to be included in the experimental evaluation. Indeed, the
MNP datasets exhibit low contrast, large changes in the cell morphology in
consecutive frames of the sequence, and a high rate of cellular division, while the
HeLa data is characterised by high cellular densities, a high rate of cellular divisions
and large migration patterns. Figure 4.2 depicts two images sampled from the MNP
(1) MNP and (2) HeLa datasets were made available by Al-Kofahi et al [1] and Li et al [7] respectively. They were also used by other authors when they attempted to evaluate/compare the performance of their cell tracking algorithms. (1) http://www.landesbioscience.com/supplement/alkofahi.zip. (2) http://www.cbi-tmhs.org/Dcelliq/index.html
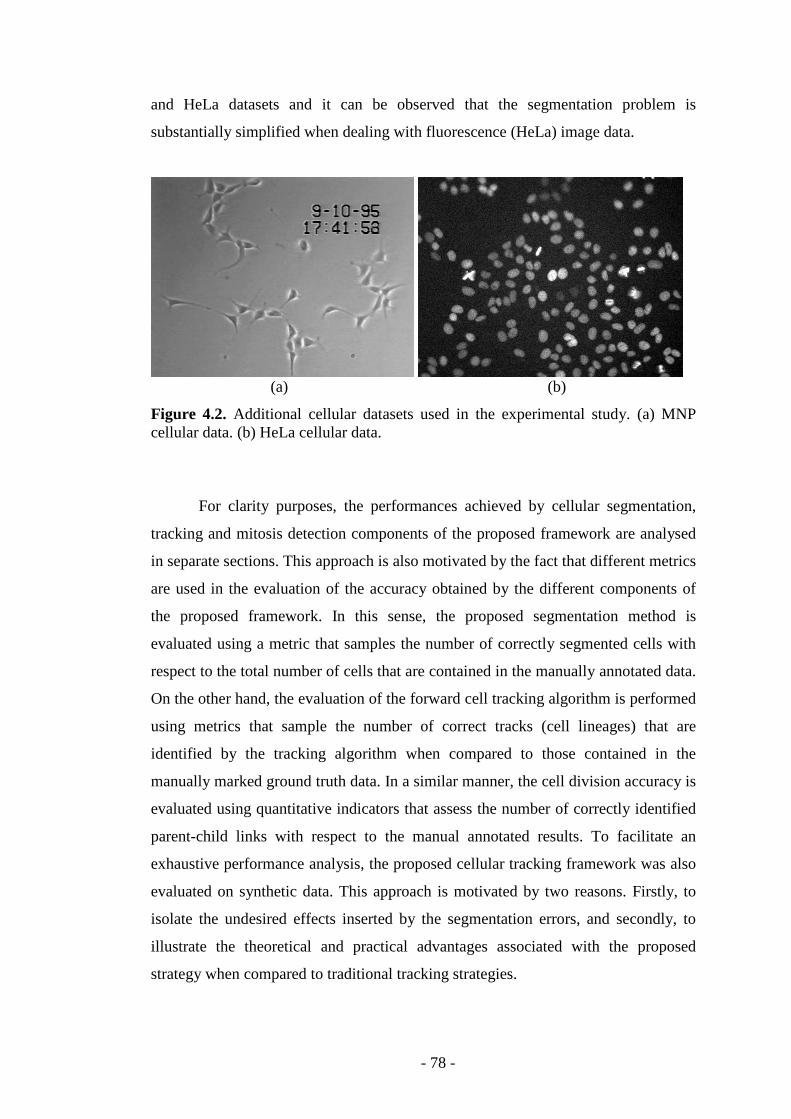
- 78 -
and HeLa datasets and it can be observed that the segmentation problem is
substantially simplified when dealing with fluorescence (HeLa) image data.
(a) (b)
Figure 4.2. Additional cellular datasets used in the experimental study. (a) MNP cellular data. (b) HeLa cellular data.
For clarity purposes, the performances achieved by cellular segmentation,
tracking and mitosis detection components of the proposed framework are analysed
in separate sections. This approach is also motivated by the fact that different metrics
are used in the evaluation of the accuracy obtained by the different components of
the proposed framework. In this sense, the proposed segmentation method is
evaluated using a metric that samples the number of correctly segmented cells with
respect to the total number of cells that are contained in the manually annotated data.
On the other hand, the evaluation of the forward cell tracking algorithm is performed
using metrics that sample the number of correct tracks (cell lineages) that are
identified by the tracking algorithm when compared to those contained in the
manually marked ground truth data. In a similar manner, the cell division accuracy is
evaluated using quantitative indicators that assess the number of correctly identified
parent-child links with respect to the manual annotated results. To facilitate an
exhaustive performance analysis, the proposed cellular tracking framework was also
evaluated on synthetic data. This approach is motivated by two reasons. Firstly, to
isolate the undesired effects inserted by the segmentation errors, and secondly, to
illustrate the theoretical and practical advantages associated with the proposed
strategy when compared to traditional tracking strategies.
- 79 -
4.1 Generation of the ground truth data
To facilitate the numeric quantification of the proposed cellular tracking and
mitosis detection framework, all datasets used in the experimental study were
manually annotated. In this process the data has been annotated to allow the
performance evaluation for each component of the developed framework: cell
segmentation, cell tracking and mitosis detection.
The manual annotation process has been conducted by the Centre for Image
Processing and Image Analysis (CIPA) researchers, and in this process, clinical
collaborators provided additional input to validate the annotated data. The manual
annotations include information regarding the location of the cells in each frame, i.e.
the (x,y,t) coordinates of the cells’ centroids, and this information is directly used to
calculate performance indicators that quantify the accuracy of the developed
segmentation technique (the metric employed to calculate the accuracy of the
segmentation process involves the identification of the true positives (TP), false
positive (FP) and false negatives (FN) and is introduced in the next section, equation
4.1. )
The next sets of annotations were conducted to generate ground truth data for
the numerical quantification of the cell tracking algorithm. To achieve this goal, cell
lineages (or cell tracks) were manually identified by analysing the migration patterns
for each cell in consecutive frames of the sequence. During this process a unique
index is generated for each identified track and this information is used in the
calculation of tracking accuracy indicators (the tracking indicators that are employed
to quantify the performance of the proposed cell tracking framework and state-of-
the-art implementations introduced in Sections 4.4 and 4.7, equations 4.3 to 4.5).
The last sets of annotations were generated to facilitate the quantification of
the mitosis detection process. In this sense, the manual tracking annotations were
evaluated in a forward and backward manner and the mitosis events were visually
validated by examining frames prior to and after the mitosis event. At the end of this
manual annotation process, the locations of the parent and child cells were recorded,
and this information was used to quantify the accuracy of the proposed mitosis
- 80 -
detection algorithm. The numerical evaluations carried out for each computational
component of the proposed cellular tracking and mitosis detection framework are
presented in detail in the following sections of this chapter.
4.2 Validation of the cellular segmentation algorithm
The proposed segmentation method has been evaluated on MDCK, HUVEC
and MNP cellular sequences. Thus, the proposed segmentation method has been
applied to nine different time-lapse phase-contrast sequences that consist of cellular
data with different densities (for more details please refer to the discussion provided
in the previous two sub-sections). As stated in Chapter 2, microscopy image analysis
entails the application of specific protocols that are tuned for specific cellular
applications. As a result, image data will have strong characteristics that are dictated
by the type of cells that are under observation. Thus, the development of generic cell
segmentation/detection methods that are able to accommodate the substantial
differences between the datasets captured using different imaging protocols is
extremely difficult. Therefore, in this work the main focus was on the development
of a segmentation strategy for robust cell detection in phase-contrast data. To
maximise the cell detection, the main idea associated with the proposed
segmentation method consists in the identification of the intensity peaks in the image
using the h-maxima transform. This approach proved efficient in increasing the
detection rate and to reduce the level of false positives in the presence of non-
uniform background and poor image contrast. The optimised values for the
parameters h, r and α for each type of image sequence are illustrated in Table 4.1. It
is useful to note that the parameterα does not have a direct role in the segmentation
process, since its purpose is to restrict the maximum instantaneous cell displacement
in two consecutive frames. This parameter has been included in Table 4.1 for clarity
purposes, as this allows a targeted discussion in regard to the role of each parameter
in the overall cellular tracking and mitosis detection framework.
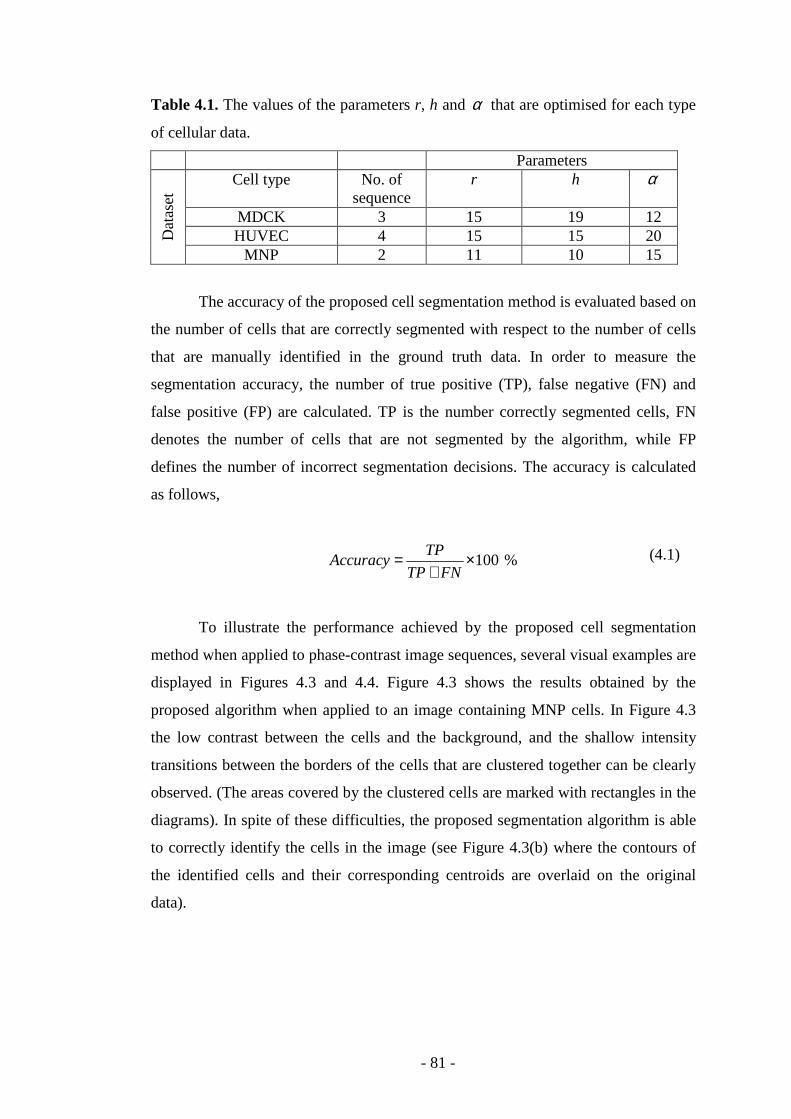
- 81 -
Table 4.1. The values of the parameters r, h and α that are optimised for each type
of cellular data.
Parameters Cell type No. of
sequence r h α
MDCK 3 15 19 12 HUVEC 4 15 15 20 D
atas
et
MNP 2 11 10 15
The accuracy of the proposed cell segmentation method is evaluated based on
the number of cells that are correctly segmented with respect to the number of cells
that are manually identified in the ground truth data. In order to measure the
segmentation accuracy, the number of true positive (TP), false negative (FN) and
false positive (FP) are calculated. TP is the number correctly segmented cells, FN
denotes the number of cells that are not segmented by the algorithm, while FP
defines the number of incorrect segmentation decisions. The accuracy is calculated
as follows,
100 %TP
AccuracyTP FN
= ×+
To illustrate the performance achieved by the proposed cell segmentation
method when applied to phase-contrast image sequences, several visual examples are
displayed in Figures 4.3 and 4.4. Figure 4.3 shows the results obtained by the
proposed algorithm when applied to an image containing MNP cells. In Figure 4.3
the low contrast between the cells and the background, and the shallow intensity
transitions between the borders of the cells that are clustered together can be clearly
observed. (The areas covered by the clustered cells are marked with rectangles in the
diagrams). In spite of these difficulties, the proposed segmentation algorithm is able
to correctly identify the cells in the image (see Figure 4.3(b) where the contours of
the identified cells and their corresponding centroids are overlaid on the original
data).
(4.1)
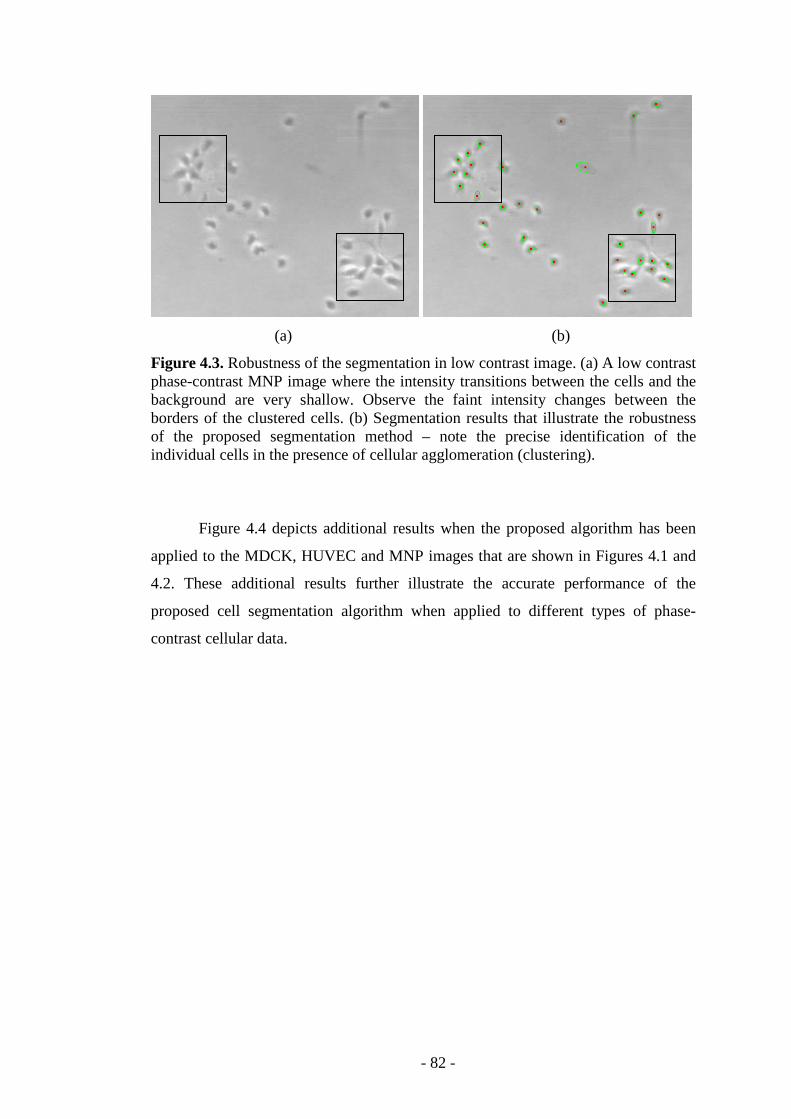
- 82 -
(a) (b)
Figure 4.3. Robustness of the segmentation in low contrast image. (a) A low contrast phase-contrast MNP image where the intensity transitions between the cells and the background are very shallow. Observe the faint intensity changes between the borders of the clustered cells. (b) Segmentation results that illustrate the robustness of the proposed segmentation method – note the precise identification of the individual cells in the presence of cellular agglomeration (clustering).
Figure 4.4 depicts additional results when the proposed algorithm has been
applied to the MDCK, HUVEC and MNP images that are shown in Figures 4.1 and
4.2. These additional results further illustrate the accurate performance of the
proposed cell segmentation algorithm when applied to different types of phase-
contrast cellular data.
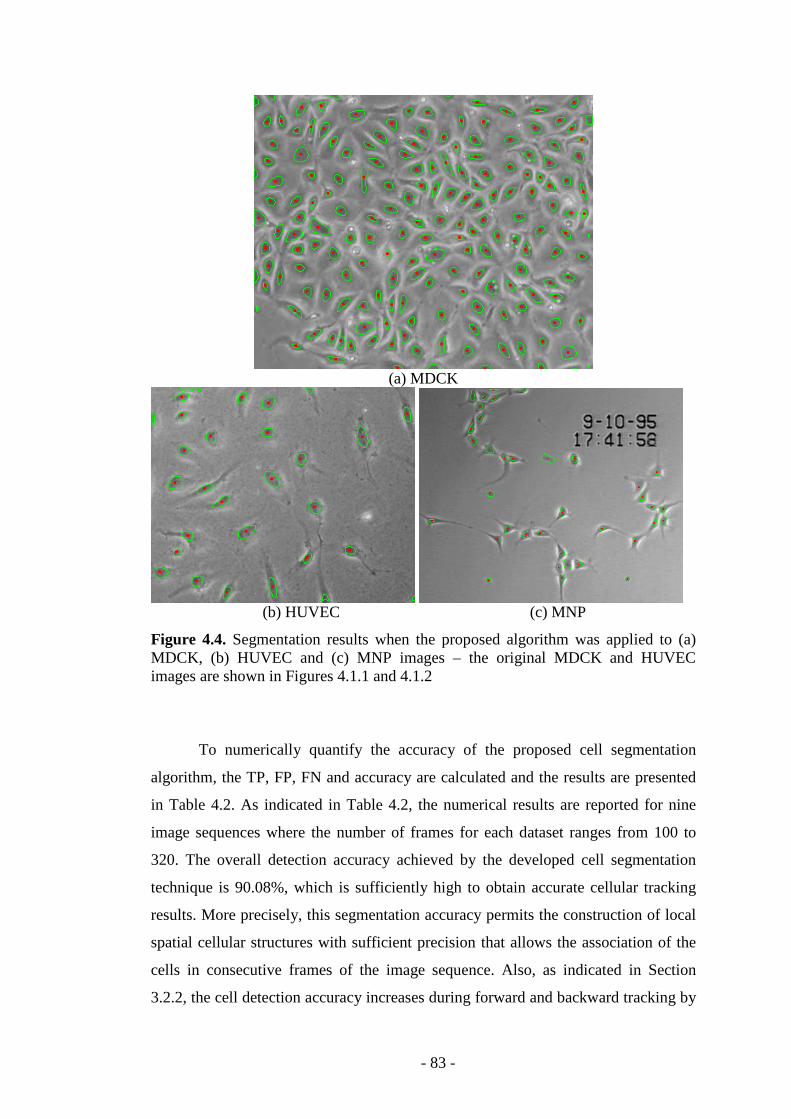
- 83 -
(a) MDCK
(b) HUVEC (c) MNP
Figure 4.4. Segmentation results when the proposed algorithm was applied to (a) MDCK, (b) HUVEC and (c) MNP images – the original MDCK and HUVEC images are shown in Figures 4.1.1 and 4.1.2
To numerically quantify the accuracy of the proposed cell segmentation
algorithm, the TP, FP, FN and accuracy are calculated and the results are presented
in Table 4.2. As indicated in Table 4.2, the numerical results are reported for nine
image sequences where the number of frames for each dataset ranges from 100 to
320. The overall detection accuracy achieved by the developed cell segmentation
technique is 90.08%, which is sufficiently high to obtain accurate cellular tracking
results. More precisely, this segmentation accuracy permits the construction of local
spatial cellular structures with sufficient precision that allows the association of the
cells in consecutive frames of the image sequence. Also, as indicated in Section
3.2.2, the cell detection accuracy increases during forward and backward tracking by
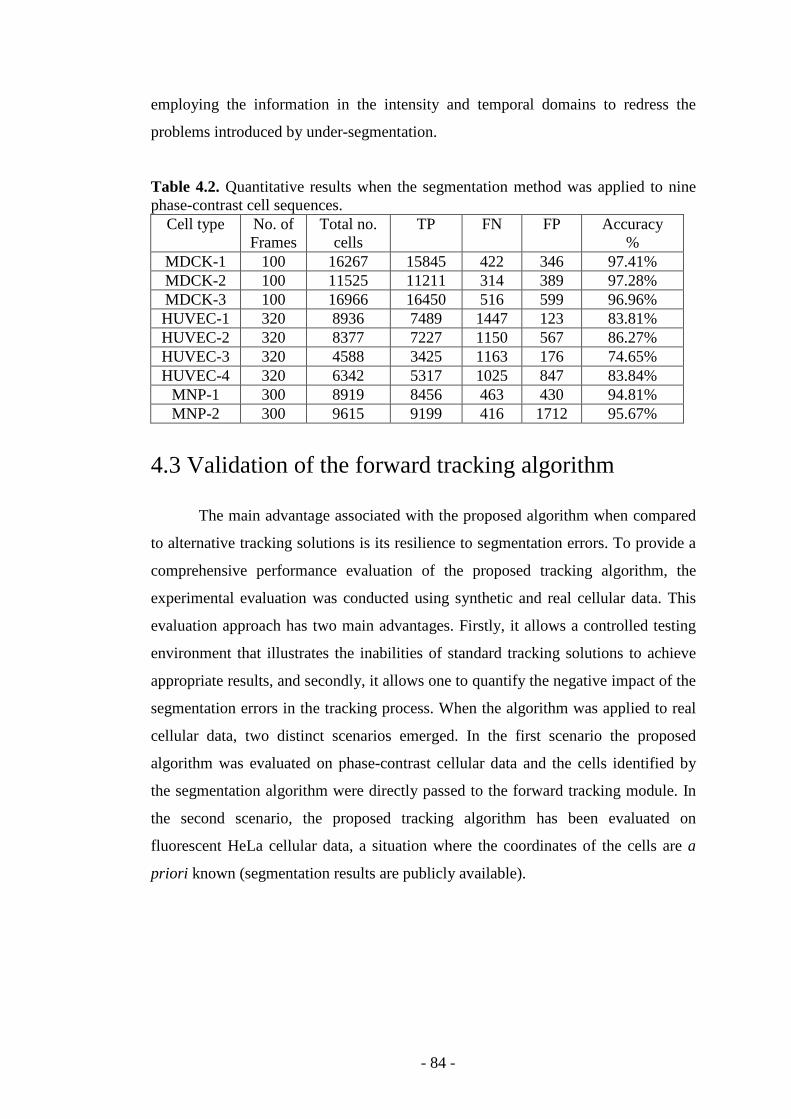
- 84 -
employing the information in the intensity and temporal domains to redress the
problems introduced by under-segmentation.
Table 4.2. Quantitative results when the segmentation method was applied to nine phase-contrast cell sequences.
Cell type No. of Frames
Total no. cells
TP FN FP Accuracy %
MDCK-1 100 16267 15845 422 346 97.41% MDCK-2 100 11525 11211 314 389 97.28% MDCK-3 100 16966 16450 516 599 96.96% HUVEC-1 320 8936 7489 1447 123 83.81% HUVEC-2 320 8377 7227 1150 567 86.27% HUVEC-3 320 4588 3425 1163 176 74.65% HUVEC-4 320 6342 5317 1025 847 83.84%
MNP-1 300 8919 8456 463 430 94.81% MNP-2 300 9615 9199 416 1712 95.67%
4.3 Validation of the forward tracking algorithm
The main advantage associated with the proposed algorithm when compared
to alternative tracking solutions is its resilience to segmentation errors. To provide a
comprehensive performance evaluation of the proposed tracking algorithm, the
experimental evaluation was conducted using synthetic and real cellular data. This
evaluation approach has two main advantages. Firstly, it allows a controlled testing
environment that illustrates the inabilities of standard tracking solutions to achieve
appropriate results, and secondly, it allows one to quantify the negative impact of the
segmentation errors in the tracking process. When the algorithm was applied to real
cellular data, two distinct scenarios emerged. In the first scenario the proposed
algorithm was evaluated on phase-contrast cellular data and the cells identified by
the segmentation algorithm were directly passed to the forward tracking module. In
the second scenario, the proposed tracking algorithm has been evaluated on
fluorescent HeLa cellular data, a situation where the coordinates of the cells are a
priori known (segmentation results are publicly available).
- 85 -
4.4 Experimental results using synthetic and manually
annotated data
Synthetic and manually annotated datasets have been independently
employed to evaluate the performance of the proposed cell association algorithm.
The use of synthetic data to validate the proposed algorithm is justified since the cell
tracking accuracy is not affected by errors that are introduced by other components
of the frameworks such as the segmentation module.
The cell association method described in this thesis relies on the proximity
and the local cellular structure and it is not dependent on other image features. To
provide a detailed evaluation, the tracking accuracy achieved by the proposed
method has been compared with the cell tracking accuracies obtained by two
standard distance-based cell association techniques using both synthetic and
manually annotated cellular data.
The synthetic data is generated using a set of random points that are
distributed over a 195×165 image that represents the first frame of the sequence. The
next frames are generated by applying a random motion to each cell in the previous
frame, and this approach is sequentially applied until the desired number of frames is
reached. The instantaneous (frame-to-frame) displacement tS of a newly generated
point tX is calculated using the following equation,
2
1
0.5* *t
t t t
S u Q f Q
X X S−
= ∗ +
= +
where the u and f are the velocity and acceleration, respectively, and the value of
the parameter Q is set to 2.0 in order to generate a small movement. The value of u
is set within the range of [0,1] and the value of f is randomly selected from the
normal distribution with zero mean and unit variance.
(4.2)
- 86 -
For evaluation purposes, two synthetic video sequences that contain 32 and
140 random points, respectively, were generated in agreement with equation (4.2).
The application of the proposed cellular association method to this synthetically
generated data indicates that the proposed tracking algorithm is able to achieve
correct cellular association. To illustrate the limitations of the standard tracking
solutions when applied to data that is characterised by random motion, a global
distance minimisation method (please refer to Figure 2.2 in Chapter 2) has also been
evaluated on the same data. In this method the nodes are associated based on the
minimisation of a global cost function. The experimental results indicate that this
minimisation process works reasonably well when the cells in the subsequent frames
undergo small migration. However, it returns inappropriate results in the presence of
significant cellular migration. To further illustrate the limitations of distance-based
tracking solutions, additional results are reported when the nearest neighbour
tracking algorithm is applied to the same data that was generated using (4.2).
To quantitatively assess the accuracy of the cellular tracking process, a metric
that evaluates the level of correct tracking decisions has been introduced (please
refer to Appendix A for additional qualitative results). In this regard, the tracking
accuracy is given by the number of correct tracks that are identified by the algorithm
with respect to the total number of tracks identified in the ground truth data (see
equation 4.3). A track is deemed valid if all the cells that form it are correctly
associated. Comparative results for all tracking methods evaluated in this study are
reported in Tables 4.3a and 4.3b. From Table 4.3a, it can be observed that the
proposed method returns 100% accuracy, while the tracking accuracies for the global
distance matching and the nearest neighbour methods are only 93.75% and 81.25%,
respectively when the algorithms were applied to the sequence that contains 32
points. Table 4.3b depicts the results when the analysed methods were applied to the
sequence that contains 140 points and the results were as follows: 97.86% -
proposed method, 82.86% - global minimum distance and 67.87% - nearest
neighbour algorithm. The results reported in Tables 4.3a and 4.3b show that the
proposed method substantially outperforms the standard tracking algorithms.
100%
Number of valid trackAccuracy
Total number of tracks= × (4.3)
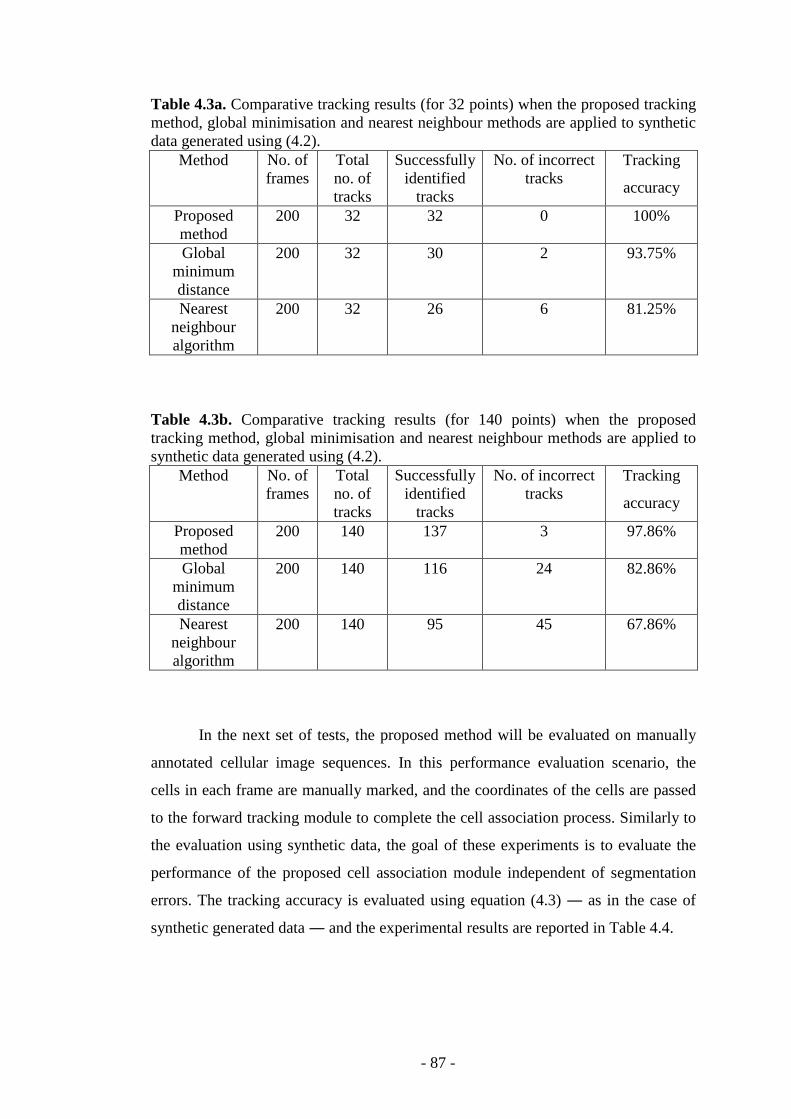
- 87 -
Table 4.3a. Comparative tracking results (for 32 points) when the proposed tracking method, global minimisation and nearest neighbour methods are applied to synthetic data generated using (4.2).
Method No. of frames
Total no. of tracks
Successfully identified
tracks
No. of incorrect tracks
Tracking
accuracy
Proposed method
200 32 32 0 100%
Global minimum distance
200 32 30 2 93.75%
Nearest neighbour algorithm
200 32 26 6 81.25%
Table 4.3b. Comparative tracking results (for 140 points) when the proposed tracking method, global minimisation and nearest neighbour methods are applied to synthetic data generated using (4.2).
Method No. of frames
Total no. of tracks
Successfully identified
tracks
No. of incorrect tracks
Tracking
accuracy
Proposed method
200 140 137 3 97.86%
Global minimum distance
200 140 116 24 82.86%
Nearest neighbour algorithm
200 140 95 45 67.86%
In the next set of tests, the proposed method will be evaluated on manually
annotated cellular image sequences. In this performance evaluation scenario, the
cells in each frame are manually marked, and the coordinates of the cells are passed
to the forward tracking module to complete the cell association process. Similarly to
the evaluation using synthetic data, the goal of these experiments is to evaluate the
performance of the proposed cell association module independent of segmentation
errors. The tracking accuracy is evaluated using equation (4.3) ― as in the case of
synthetic generated data ― and the experimental results are reported in Table 4.4.
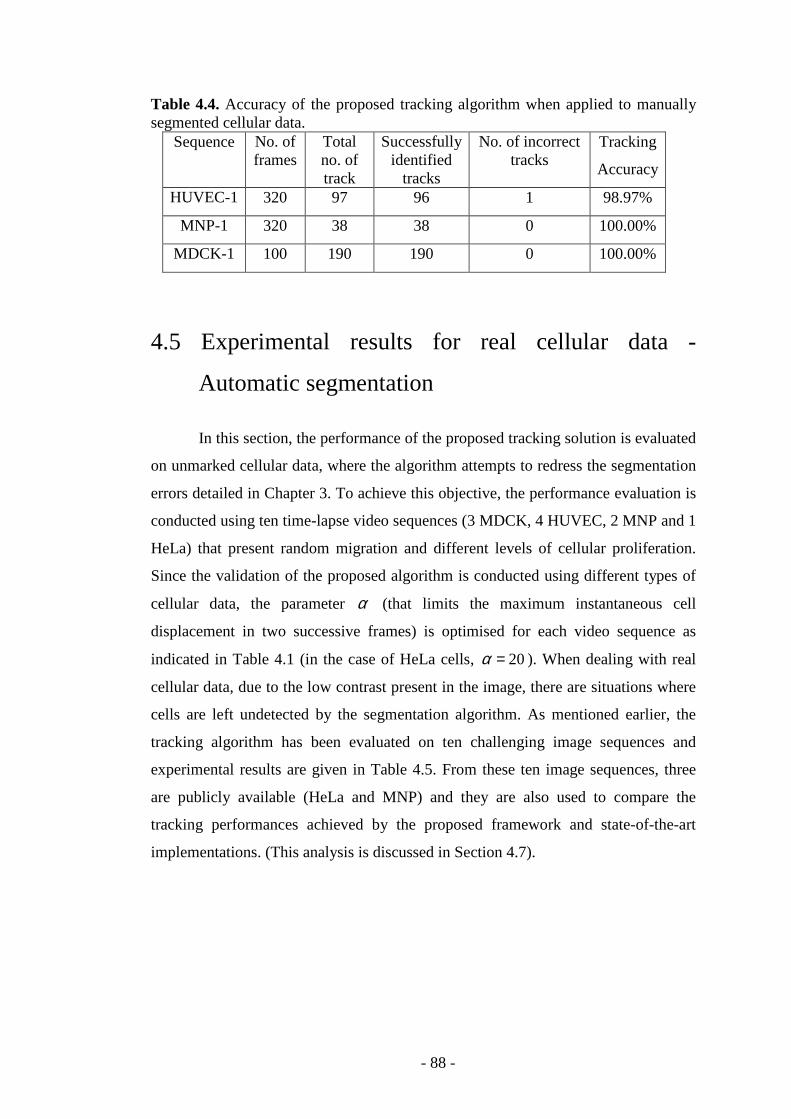
- 88 -
Table 4.4. Accuracy of the proposed tracking algorithm when applied to manually segmented cellular data.
Sequence No. of frames
Total no. of track
Successfully identified
tracks
No. of incorrect tracks
Tracking
Accuracy
HUVEC-1 320 97 96 1 98.97%
MNP-1 320 38 38 0 100.00%
MDCK-1 100 190 190 0 100.00%
4.5 Experimental results for real cellular data -
Automatic segmentation
In this section, the performance of the proposed tracking solution is evaluated
on unmarked cellular data, where the algorithm attempts to redress the segmentation
errors detailed in Chapter 3. To achieve this objective, the performance evaluation is
conducted using ten time-lapse video sequences (3 MDCK, 4 HUVEC, 2 MNP and 1
HeLa) that present random migration and different levels of cellular proliferation.
Since the validation of the proposed algorithm is conducted using different types of
cellular data, the parameter α (that limits the maximum instantaneous cell
displacement in two successive frames) is optimised for each video sequence as
indicated in Table 4.1 (in the case of HeLa cells, 20α = ). When dealing with real
cellular data, due to the low contrast present in the image, there are situations where
cells are left undetected by the segmentation algorithm. As mentioned earlier, the
tracking algorithm has been evaluated on ten challenging image sequences and
experimental results are given in Table 4.5. From these ten image sequences, three
are publicly available (HeLa and MNP) and they are also used to compare the
tracking performances achieved by the proposed framework and state-of-the-art
implementations. (This analysis is discussed in Section 4.7).
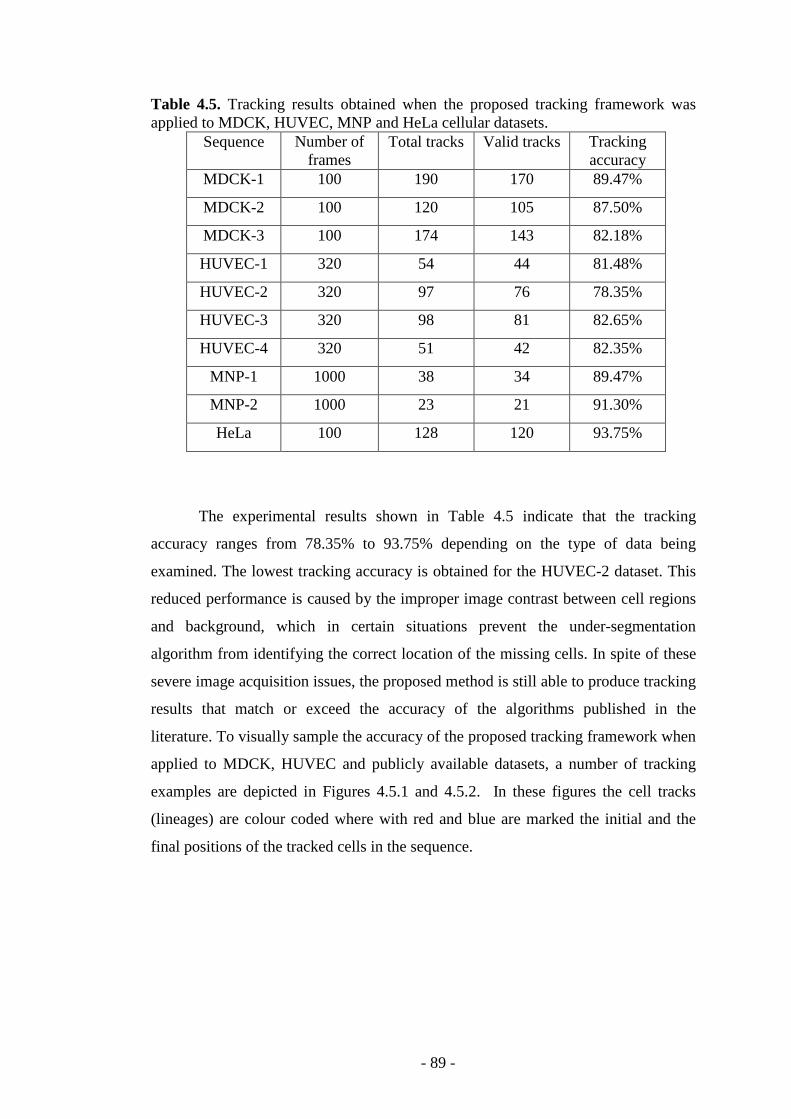
- 89 -
Table 4.5. Tracking results obtained when the proposed tracking framework was applied to MDCK, HUVEC, MNP and HeLa cellular datasets.
Sequence Number of frames
Total tracks Valid tracks Tracking accuracy
MDCK-1 100 190 170 89.47%
MDCK-2 100 120 105 87.50%
MDCK-3 100 174 143 82.18%
HUVEC-1 320 54 44 81.48%
HUVEC-2 320 97 76 78.35%
HUVEC-3 320 98 81 82.65%
HUVEC-4 320 51 42 82.35%
MNP-1 1000 38 34 89.47%
MNP-2 1000 23 21 91.30%
HeLa 100 128 120 93.75%
The experimental results shown in Table 4.5 indicate that the tracking
accuracy ranges from 78.35% to 93.75% depending on the type of data being
examined. The lowest tracking accuracy is obtained for the HUVEC-2 dataset. This
reduced performance is caused by the improper image contrast between cell regions
and background, which in certain situations prevent the under-segmentation
algorithm from identifying the correct location of the missing cells. In spite of these
severe image acquisition issues, the proposed method is still able to produce tracking
results that match or exceed the accuracy of the algorithms published in the
literature. To visually sample the accuracy of the proposed tracking framework when
applied to MDCK, HUVEC and publicly available datasets, a number of tracking
examples are depicted in Figures 4.5.1 and 4.5.2. In these figures the cell tracks
(lineages) are colour coded where with red and blue are marked the initial and the
final positions of the tracked cells in the sequence.
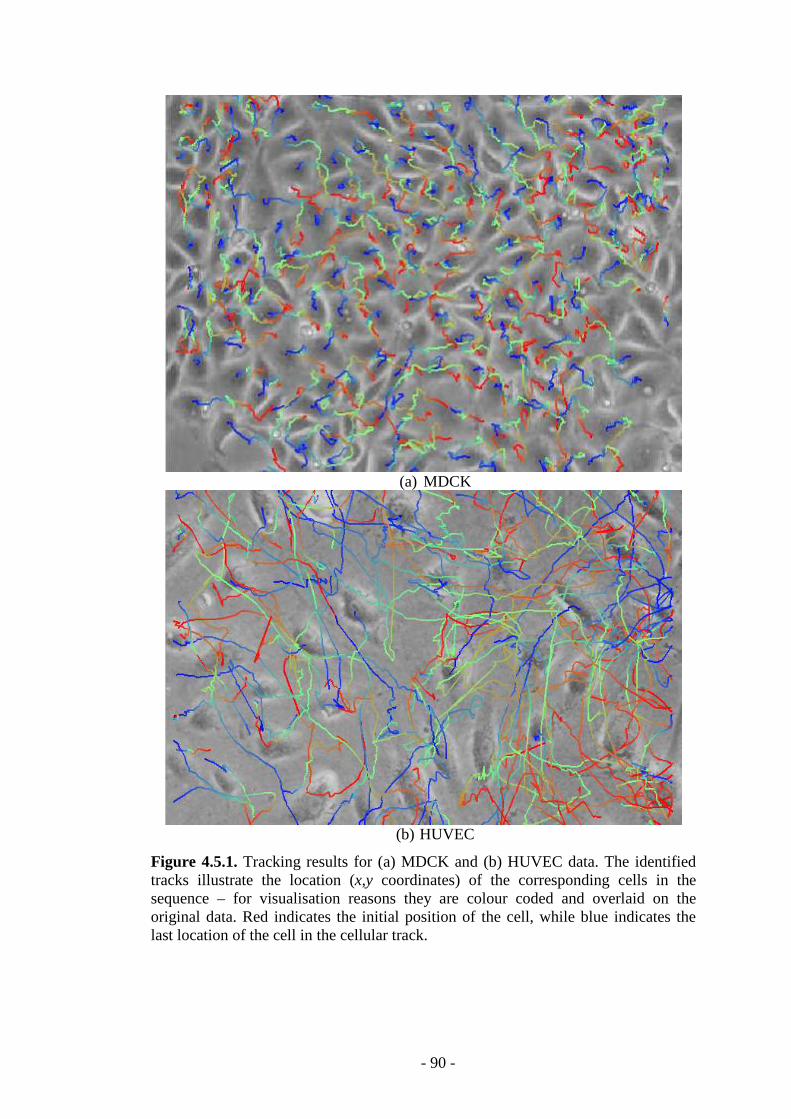
- 90 -
(a) MDCK
(b) HUVEC
Figure 4.5.1. Tracking results for (a) MDCK and (b) HUVEC data. The identified tracks illustrate the location (x,y coordinates) of the corresponding cells in the sequence – for visualisation reasons they are colour coded and overlaid on the original data. Red indicates the initial position of the cell, while blue indicates the last location of the cell in the cellular track.
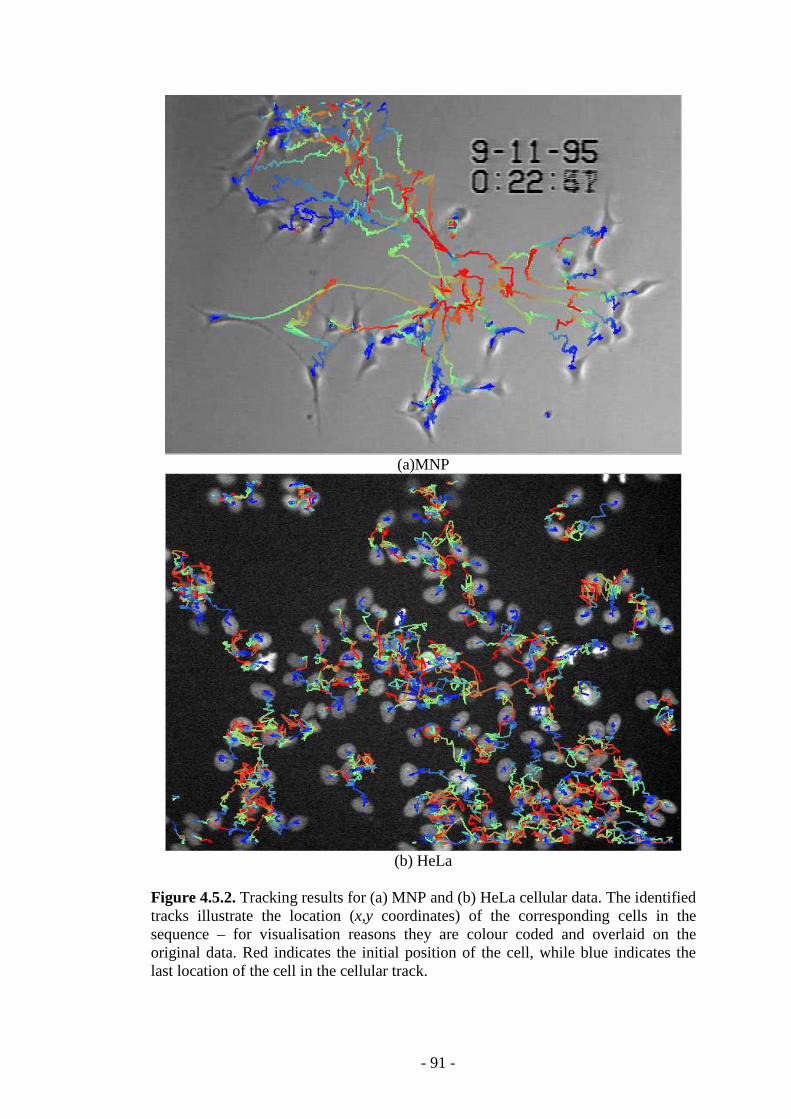
- 91 -
(a)MNP
(b) HeLa
Figure 4.5.2. Tracking results for (a) MNP and (b) HeLa cellular data. The identified tracks illustrate the location (x,y coordinates) of the corresponding cells in the sequence – for visualisation reasons they are colour coded and overlaid on the original data. Red indicates the initial position of the cell, while blue indicates the last location of the cell in the cellular track.
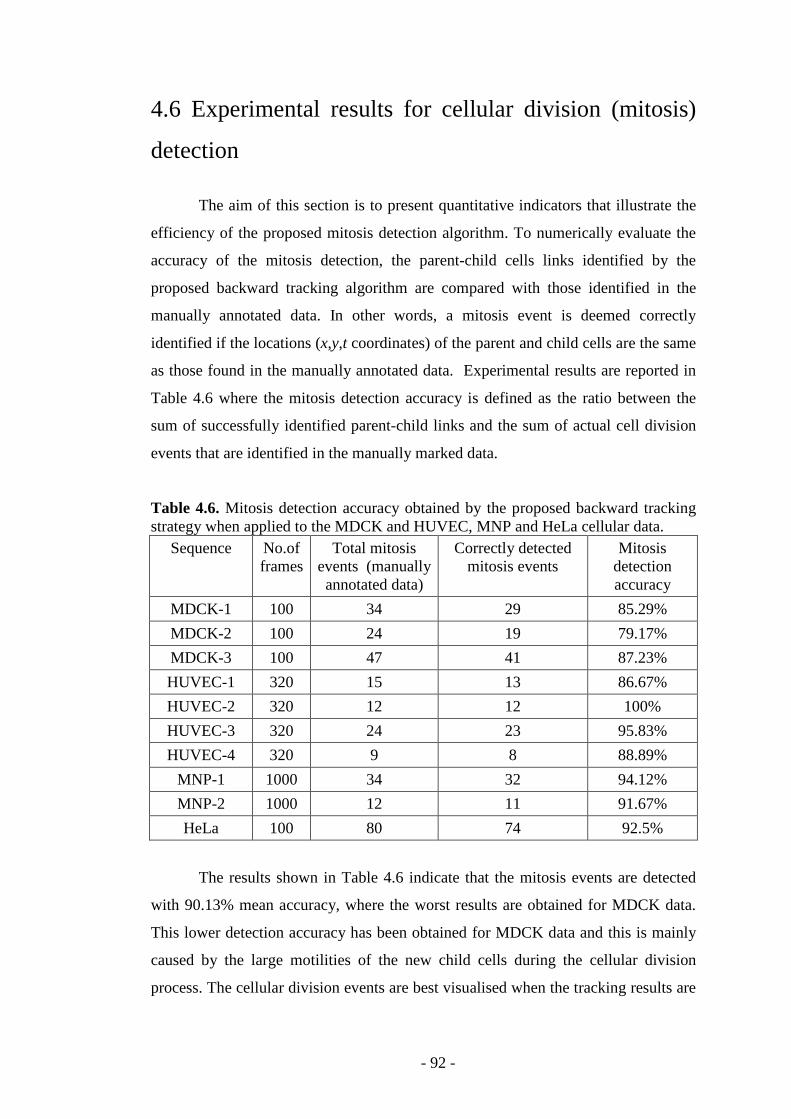
- 92 -
4.6 Experimental results for cellular division (mitosis)
detection
The aim of this section is to present quantitative indicators that illustrate the
efficiency of the proposed mitosis detection algorithm. To numerically evaluate the
accuracy of the mitosis detection, the parent-child cells links identified by the
proposed backward tracking algorithm are compared with those identified in the
manually annotated data. In other words, a mitosis event is deemed correctly
identified if the locations (x,y,t coordinates) of the parent and child cells are the same
as those found in the manually annotated data. Experimental results are reported in
Table 4.6 where the mitosis detection accuracy is defined as the ratio between the
sum of successfully identified parent-child links and the sum of actual cell division
events that are identified in the manually marked data.
Table 4.6. Mitosis detection accuracy obtained by the proposed backward tracking strategy when applied to the MDCK and HUVEC, MNP and HeLa cellular data.
Sequence No.of frames
Total mitosis events (manually annotated data)
Correctly detected mitosis events
Mitosis detection accuracy
MDCK-1 100 34 29 85.29%
MDCK-2 100 24 19 79.17%
MDCK-3 100 47 41 87.23%
HUVEC-1 320 15 13 86.67%
HUVEC-2 320 12 12 100%
HUVEC-3 320 24 23 95.83%
HUVEC-4 320 9 8 88.89%
MNP-1 1000 34 32 94.12%
MNP-2 1000 12 11 91.67%
HeLa 100 80 74 92.5%
The results shown in Table 4.6 indicate that the mitosis events are detected
with 90.13% mean accuracy, where the worst results are obtained for MDCK data.
This lower detection accuracy has been obtained for MDCK data and this is mainly
caused by the large motilities of the new child cells during the cellular division
process. The cellular division events are best visualised when the tracking results are
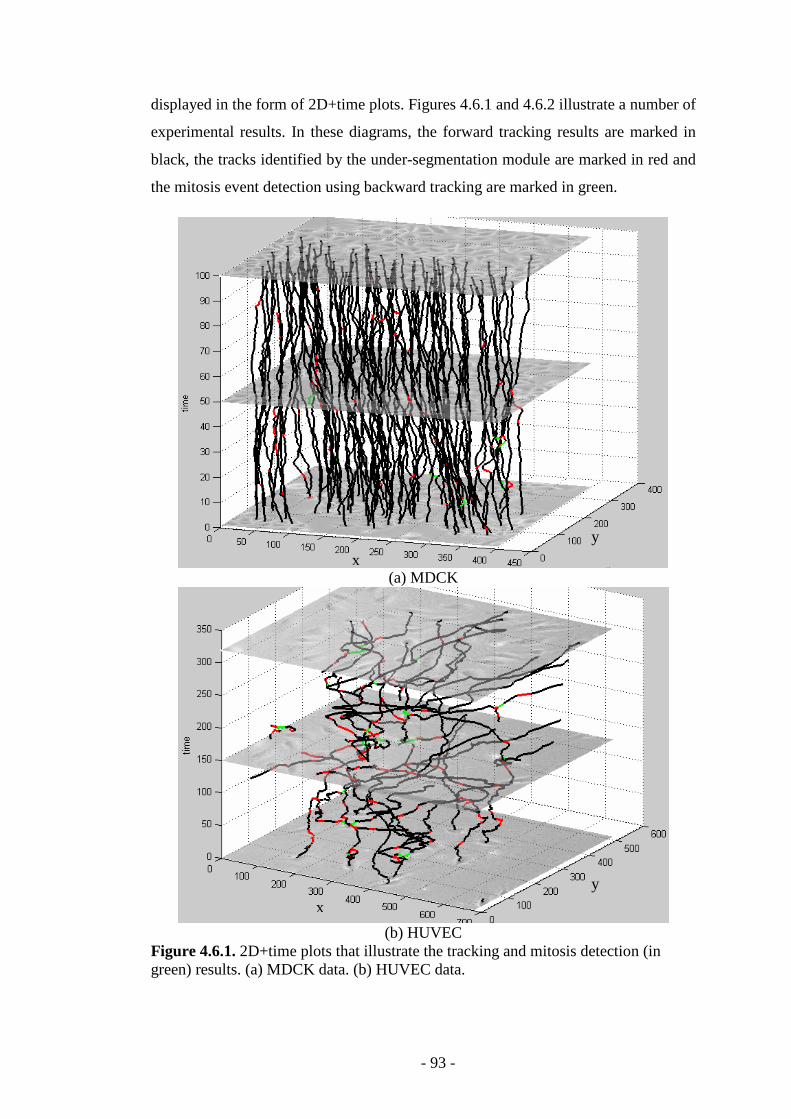
- 93 -
displayed in the form of 2D+time plots. Figures 4.6.1 and 4.6.2 illustrate a number of
experimental results. In these diagrams, the forward tracking results are marked in
black, the tracks identified by the under-segmentation module are marked in red and
the mitosis event detection using backward tracking are marked in green.
(a) MDCK
(b) HUVEC
Figure 4.6.1. 2D+time plots that illustrate the tracking and mitosis detection (in green) results. (a) MDCK data. (b) HUVEC data.
x
y
x
y
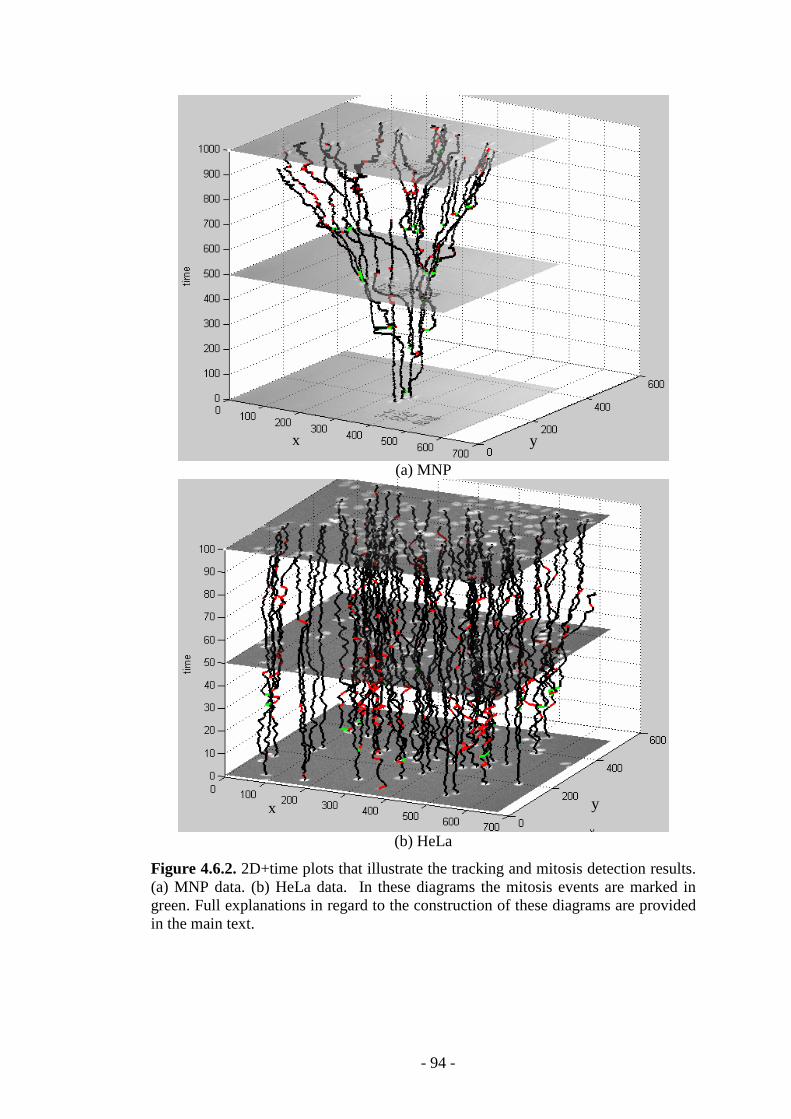
- 94 -
(a) MNP
(b) HeLa
Figure 4.6.2. 2D+time plots that illustrate the tracking and mitosis detection results. (a) MNP data. (b) HeLa data. In these diagrams the mitosis events are marked in green. Full explanations in regard to the construction of these diagrams are provided in the main text.
x y
x y
- 95 -
4.7 Comparative results obtained by the proposed
framework and state-of-the-art implementations
The aim of this section is to analyse the level of performance obtained by the
proposed cellular tracking and mitosis detection framework against the state-of-the-
art implementations that are published in the literature. In this regard, two state-of-
the-art algorithms that were detailed in [12] and [7] are investigated in detail with
respect to cellular tracking [7, 12] and mitosis detection [12] accuracy. To allow a
direct comparison between the performances obtained by the proposed framework
and the two state-of-the-art algorithms, the experimentation has been conducted
using publicly available cellular data, namely two sequences of Murine Progenitor
Neural (MNP) stem cells and one sequence of HeLa cells, data that was made
available by Al-Kofahi et al [1] and Li et al [7], respectively.
In [7] the authors evaluated their tracking algorithm using four video
sequences of HeLa cellular data, where each sequence contains 200 frames.
Although they reported experimental results for all four sequences, only one
sequence containing 100 frames was made publicly available. Thus, due to this
restriction, the proposed framework has been evaluated only on this publicly
available image sequence. To facilitate a fair comparison with the work detailed in
[7], performance metrics such as Error Trace Rate (ETR in equation 4.4) and Error
Matching Rate (EMR in equation 4.5) were calculated as indicated in the original
paper [7]. These metrics are expressed in % and the smaller their value the better the
performance of the algorithm. The comparative results obtained by the proposed
method and the algorithm detailed in [7] are shown in Table 4.7.
100
number of track errorETR
total track= ×
100
number of individual matching errorEMR
total track= ×
(4.4)
(4.5)
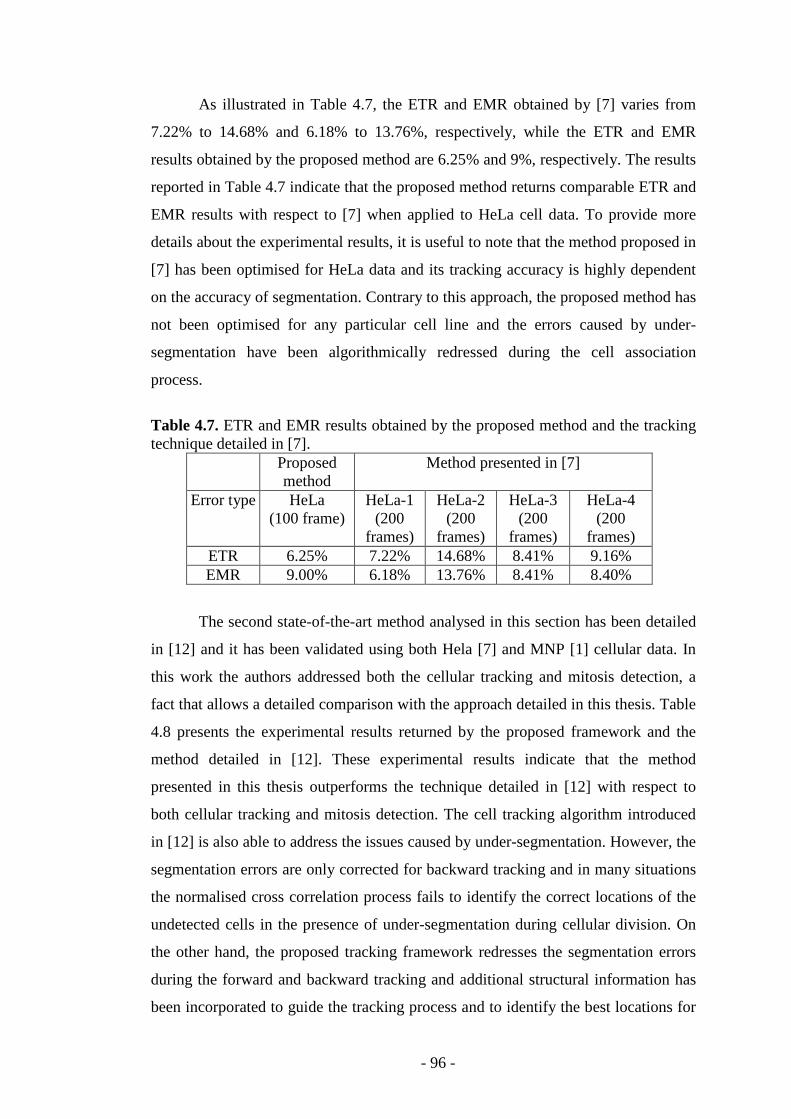
- 96 -
As illustrated in Table 4.7, the ETR and EMR obtained by [7] varies from
7.22% to 14.68% and 6.18% to 13.76%, respectively, while the ETR and EMR
results obtained by the proposed method are 6.25% and 9%, respectively. The results
reported in Table 4.7 indicate that the proposed method returns comparable ETR and
EMR results with respect to [7] when applied to HeLa cell data. To provide more
details about the experimental results, it is useful to note that the method proposed in
[7] has been optimised for HeLa data and its tracking accuracy is highly dependent
on the accuracy of segmentation. Contrary to this approach, the proposed method has
not been optimised for any particular cell line and the errors caused by under-
segmentation have been algorithmically redressed during the cell association
process.
Table 4.7. ETR and EMR results obtained by the proposed method and the tracking technique detailed in [7].
Proposed method
Method presented in [7]
Error type HeLa (100 frame)
HeLa-1 (200
frames)
HeLa-2 (200
frames)
HeLa-3 (200
frames)
HeLa-4 (200
frames) ETR 6.25% 7.22% 14.68% 8.41% 9.16% EMR 9.00% 6.18% 13.76% 8.41% 8.40%
The second state-of-the-art method analysed in this section has been detailed
in [12] and it has been validated using both Hela [7] and MNP [1] cellular data. In
this work the authors addressed both the cellular tracking and mitosis detection, a
fact that allows a detailed comparison with the approach detailed in this thesis. Table
4.8 presents the experimental results returned by the proposed framework and the
method detailed in [12]. These experimental results indicate that the method
presented in this thesis outperforms the technique detailed in [12] with respect to
both cellular tracking and mitosis detection. The cell tracking algorithm introduced
in [12] is also able to address the issues caused by under-segmentation. However, the
segmentation errors are only corrected for backward tracking and in many situations
the normalised cross correlation process fails to identify the correct locations of the
undetected cells in the presence of under-segmentation during cellular division. On
the other hand, the proposed tracking framework redresses the segmentation errors
during the forward and backward tracking and additional structural information has
been incorporated to guide the tracking process and to identify the best locations for
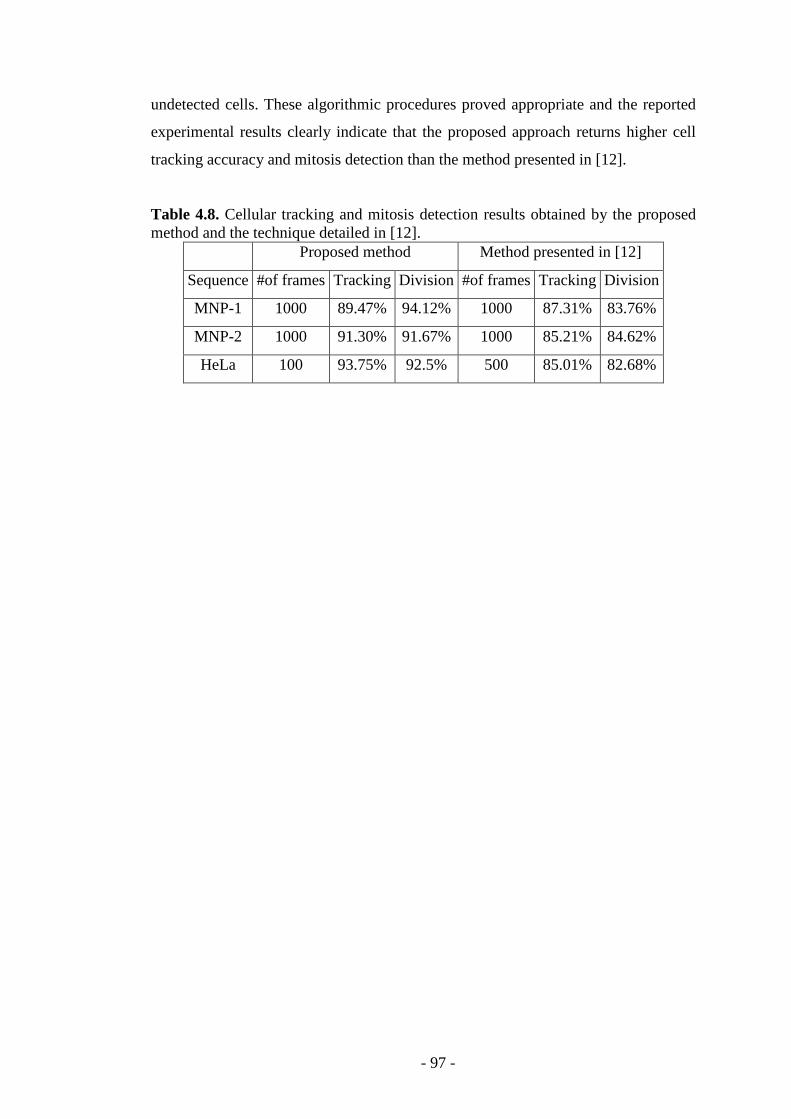
- 97 -
undetected cells. These algorithmic procedures proved appropriate and the reported
experimental results clearly indicate that the proposed approach returns higher cell
tracking accuracy and mitosis detection than the method presented in [12].
Table 4.8. Cellular tracking and mitosis detection results obtained by the proposed method and the technique detailed in [12].
Proposed method Method presented in [12]
Sequence #of frames Tracking Division #of frames Tracking Division
MNP-1 1000 89.47% 94.12% 1000 87.31% 83.76%
MNP-2 1000 91.30% 91.67% 1000 85.21% 84.62%
HeLa 100 93.75% 92.5% 500 85.01% 82.68%
- 98 -
Chapter 5:
Conclusions and Future Work
The major objective of this thesis was to detail the development of a novel
computational framework that was designed to track multiple cells and detect cell
division events in time-lapse image sequences. The automatic tracking of cells in
large datasets has recently draw the attention of computer vision researchers, as the
emergence of modern microscopy imaging rendered the manual annotation
procedure unfeasible in many clinical studies. This fact has been emphasised in
Chapter 2, where the most relevant algorithms on the topic of cell tracking and
mitosis detection are analysed. Arising from the literature survey, it can be
concluded that the most apparent characteristic of the published algorithms on the
topic of automatic cell tracking is their strong application context. This conclusion is
not unexpected since the imaging protocols are optimised for each type of cellular
data. One objective of the research work detailed in this thesis is to advance a more
flexible tracking and mitosis detection framework that can be successfully applied to
a wider range of time-lapse cellular datasets. Thus, the major contributions that result
from this thesis are located not only in the development of novel algorithms for
segmentation, tracking and mitosis detection. Additional important contributions are
associated with the exhaustive validation of the proposed framework on different
types of cellular data and in the evaluation of its performance when compared to
those offered by state-of-the-art cell tracking algorithms.
As indicated in Chapter 2, the robust identification of the corresponding cells
in time-lapse image sequences is a challenging task that cannot be accomplished by
applying standard feature-based tracking algorithms. This challenging scenario is
primarily motivated by the constrained nature of the image acquisition process that
prevents the acquisition of image data with good image contrast. Indeed, low image
contrast is a distinct characteristic of the phase-contrast cellular data, and in this
thesis several novel solutions have been advanced in order to achieve robust tracking
- 99 -
results. To this end, substantial research efforts were put into the development of a
flexible tracking framework where the main goal was the optimisation of each
computational step. In this sense, the cellular segmentation proved quite challenging,
as the phase-contrast images exhibit shallow intensity transitions between the
background and regions that define the cells’ nuclei. In addition, this data presents
noticeable intra- and inter- frame intensity variations. In the proposed approach, to
reduce as much as possible the incidence of segmentation errors, a morphological
algorithm based on the h-maxima has been developed. The experimental results
indicate that the proposed solution is accurate, but in the presence of large changes in
the cells’ shape and substantial intensity variation there are situations when cells are
not detected by the proposed algorithm. Thus, the lack of perfect segmentation
results motivated the development of a flexible cellular association procedure that is
able to identify the corresponding cells in the sequence in the presence of under-
segmentation. In this regard, the proposed cell association framework is based on the
evaluation of local structures that encode the neighbouring relationships between the
cells in pairs of consecutive frames of the sequence, where the identification of the
corresponding cells does not require any prior knowledge regarding the cell
morphology or migration patterns. These characteristics associated with the proposed
tracking methodology are particularly appropriate, as cell migration is often
characterised by random motility patterns that cannot be accurately modelled by a
priori motion estimators. As mentioned above, the occurrence of under-segmentation
introduced a substantial problem that has to be addressed during the cell association
process. A key issue was the embedding of a hybrid mechanism into the tracking
procedure that is able to detect and correct the errors caused by the undetected cells.
Full details about the proposed multi-stage cell tracking algorithm are
provided in Chapter 3. The availability of precise forward tracking results opened the
opportunity to develop a backward tracking strategy whose goal is the robust
identification of the mitosis events. During backward tracking, the cell tracks (or cell
lineages) identified during forward tracking are evaluated in a reverse manner to link
the child cells to the corresponding parent cells in all frames of the sequence.
Nonetheless, the incidence of under-segmentation substantially complicates the
mitosis detection, and again a pattern recognition driven mechanism has been
applied to identify the undetected child cells that were generated by the cellular
- 100 -
division events. The proposed cellular tracking and mitosis detection framework has
been tested on various types of cellular datasets and in-depth experimental results are
reported in Chapter 4.
The experimental results demonstrate that the proposed cell tracking and
mitosis detection framework has achieved the research objectives outlined in Chapter
1. In the next section, the major and minor contributions that are associated with this
investigation are outlined.
5.1 Contributions
The development of the proposed cellular tracking and mitosis detection
framework facilitated the investigation of a large spectrum of algorithms that
generated the major and minor contributions associated with this research work. In
this sense, the major contribution resulting from this investigation is the multi-stage
computational framework that is able to adapt to the challenging image conditions
that are associated with time-lapse phase-contrast data. Within this framework, the
algorithm devised for cellular association represents the most visible contribution of
this thesis. One particular novel element of this algorithm resides in the adaptive
integration of the cellular topological information in the tracking process. This
information proved particularly robust when tracking cellular structures in complex
situations that are generated by random migration. The modular design of this
computational component of the framework, and the optimal modality to encode and
analyse the spatial relationships between the cells during the inter frame tracking
process, opened the possibility of developing a flexible approach that was
implemented to efficiently identify and redress the segmentation errors that are
caused by improper image conditions. All these novel algorithmic solutions proved
key in achieving accurate tracking results.
The second major contribution resulting from this investigation is associated
with in the approach that has been developed to identify the cellular division events.
The robust mitosis detection is critically important in the estimation of molecular
indicators such as the cell cycle. In this thesis, a robust solution that entails a
backward tracking procedure has been proposed. Similar to the forward tracking
- 101 -
algorithm, the incidence of under-segmentation has detrimental effects on the
process that deals with the identification of the links between parent and child cells.
To address this problem, a hybrid approach that entails the combination of a pattern
recognition-based algorithm and the evaluation of the consistency of the local
cellular structures in a sequential manner has been developed. One particular
advantage of the proposed framework is the redressing of the segmentation errors for
both forward and backward tracking processes and this approach has several
theoretical and practical justifications. Firstly, it limits the possibility of incorrect
tracking decisions, as the mitotic cells cannot be robustly identified during forward
tracking, and secondly, it opened up the possibility of developing a multi-stage
association process where the use of topological information is maximised.
The final major contribution resulting from this thesis can be identified in the
comprehensive measurements of the performance of the proposed cellular tracking
and mitosis detection framework using several types of time-lapse cellular data. In
this regard, an enormous effort has been employed to generate the ground truth data
with all of the datasets used in the experimental study being manually annotated. In
this process, thousands of cells were manually annotated and their lineages (or cell
tracks) were also manually identified by analysing the migration patterns for each
cell in consecutive frames of the sequence. The ground truth data was used to
quantify the accuracy of the proposed tracking framework. To further enhance the
relevance of the experimental results, the proposed framework has been tested on
publicly available datasets and its performance has been compared to those achieved
by other relevant published algorithms. The comparative results indicate that the
proposed technique outperforms the state-of-the-art implementation with respect to
both cellular tracking and mitosis detection.
There are several minor contributions that are worth mentioning. The first is
located in the development of the cell segmentation process. The cell segmentation
proved a very challenging task and substantial efforts have been put into the
development of a strategy that minimises the incidence of segmentation errors. In
this research work several algorithms have been evaluated and the approach that
involves the application of h-maxima proved the most reliable. Other minor
contribution is associated with the identification of the most robust
- 102 -
features/methodology that can be applied in the identification of the segmentation
errors. In this regard, the proposed solution applies an intensity-based normalised
cross correlation process that aims to identify the location of the undetected cell that
minimises the local disturbances in the cellular structures encoded by the Delaunay
meshes.
5.2 Future directions of research
The main objective of this research work was to develop a robust cellular
tracking and mitosis detection framework that shows a higher degree of flexibility
and increased performance when compared to the most relevant state-of-the-art
implementations. Based on technical content that was detailed in this thesis and the
reported experimental results, it can be concluded that the overall outcome of this
investigation was successful. However, there are future directions of research that
can be investigated based on the main concepts that were studied in this thesis. One
possible development will focus on the investigation of alternative solutions that can
improve the accuracy of the cell association process in the presence of cell
interaction and large cellular migration. This may involve the inclusion of specific
features such as intensity information, cell overlap area and motility estimators to
enhance the matching confidence when identifying the corresponding cells in the
image sequence. Another interesting area of further research can include the
identification of the mitosis events using a priori probabilistic models, as this
information can be extremely useful when validating the parent-child cells links.
There is also a distinct future direction of research that may aim at the
extension of the functionality of the proposed framework to allow its application to
other biological studies such as the robust tracking of cells in in-vivo 3D data. This
will require (at least a partial) redesign of the cellular association process, but the
main theoretical developments detailed in this thesis can still be successfully applied
to this new tracking scenario.
Another possible future development can address the application of the
proposed tracking strategy to non-cellular application domains such as pedestrian
tracking in crowded conditions, robust player tracking in sports events, feature
- 103 -
tracking in the context of gesture analysis, etc. All these application scenarios require
the use of robust tracking solutions that can be potentially addressed by the proposed
tracking strategy.
- 104 -
Appendix A:
Statistical Indicators that Quantify Cell Migration Once the cellular tracking process is completed, the coordinates of the
corresponding cells (x,y,t) are available for the entire image sequence and they can
be used to calculate different statistics that describe the cell migration. Thus, the
objective of this section is to introduce a number of statistical indicators such as the
average speed, directional movement and distance travelled by the cells that can be
used to quantify the cell migration [69, 74]. These statistics are increasingly used by
the molecular scientists in the evaluation of biological processes related to cancer
research or in the development of new drugs and treatments. For instance, the
administration of various therapeutic agents/inhibitors has direct effects on the
cellular migration and the frequency of mitosis events, and these indicators are
particularly useful to assess the differences between the control and test specimens.
As indicated above three different measurements are usually calculated and
analysed. The first is the average speed avgS that is calculated for each cell using the
following formula,
12
1
1
Favg t t
tS X X
F −=
= −∑−
where F is the total number of frames and X ={x,y} is the 2D spatial coordinate.
The second indicator is the active movement also known as directional/vectorial
displacement that can be computed using the distance between the initial and the
final position of a cell. Figure A1 provides an example that illustrates the calculation
of the directional movement. The third indicator is the total cell displacement which
is given by the summation of all inter-frame instantaneous displacements, i.e. the
length of the path that was travelled by a cell as indicated in Figure A1.
(A.1)
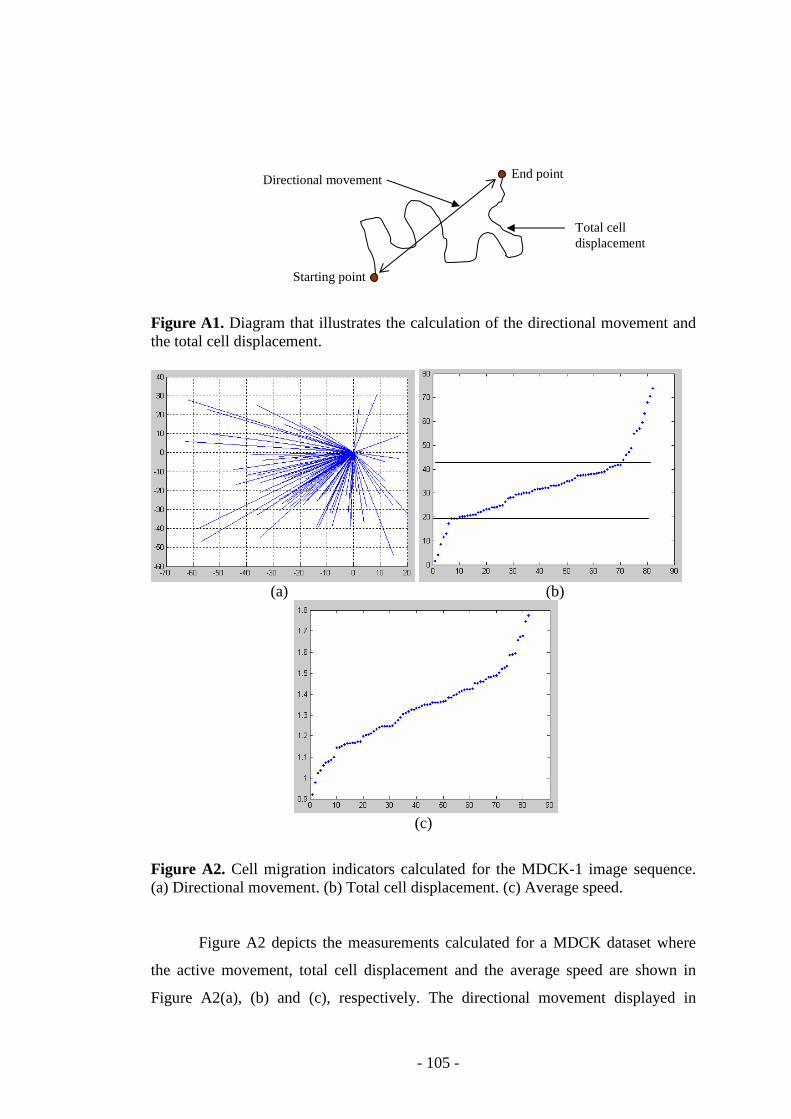
- 105 -
Figure A1. Diagram that illustrates the calculation of the directional movement and the total cell displacement.
(a) (b)
(c)
Figure A2. Cell migration indicators calculated for the MDCK-1 image sequence. (a) Directional movement. (b) Total cell displacement. (c) Average speed.
Figure A2 depicts the measurements calculated for a MDCK dataset where
the active movement, total cell displacement and the average speed are shown in
Figure A2(a), (b) and (c), respectively. The directional movement displayed in
Directional movement
Starting point
End point
Total cell displacement
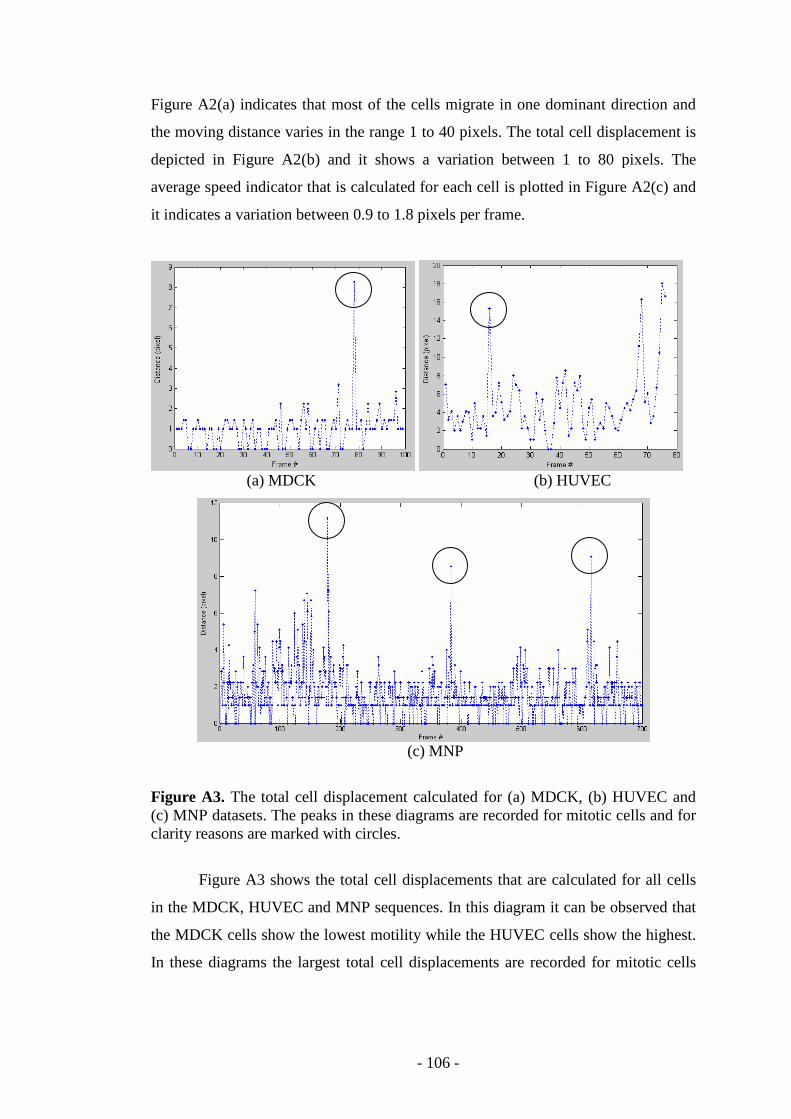
- 106 -
Figure A2(a) indicates that most of the cells migrate in one dominant direction and
the moving distance varies in the range 1 to 40 pixels. The total cell displacement is
depicted in Figure A2(b) and it shows a variation between 1 to 80 pixels. The
average speed indicator that is calculated for each cell is plotted in Figure A2(c) and
it indicates a variation between 0.9 to 1.8 pixels per frame.
(a) MDCK (b) HUVEC
(c) MNP
Figure A3. The total cell displacement calculated for (a) MDCK, (b) HUVEC and (c) MNP datasets. The peaks in these diagrams are recorded for mitotic cells and for clarity reasons are marked with circles.
Figure A3 shows the total cell displacements that are calculated for all cells
in the MDCK, HUVEC and MNP sequences. In this diagram it can be observed that
the MDCK cells show the lowest motility while the HUVEC cells show the highest.
In these diagrams the largest total cell displacements are recorded for mitotic cells
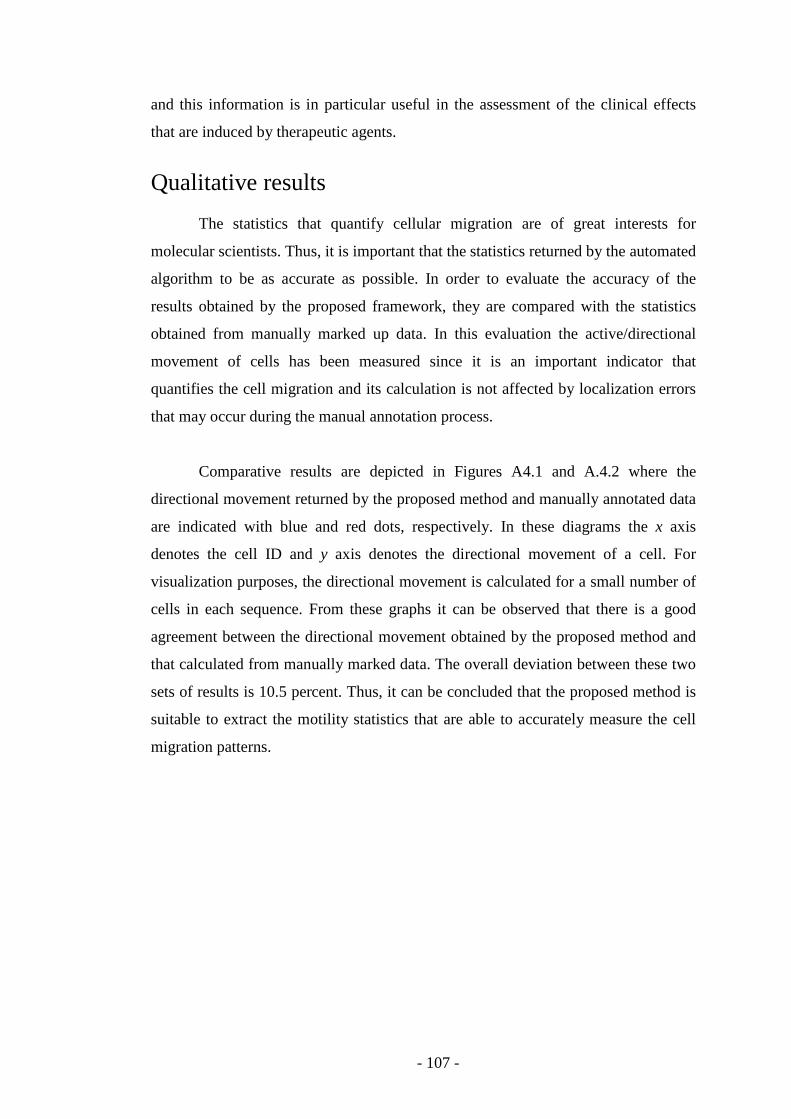
- 107 -
and this information is in particular useful in the assessment of the clinical effects
that are induced by therapeutic agents.
Qualitative results
The statistics that quantify cellular migration are of great interests for
molecular scientists. Thus, it is important that the statistics returned by the automated
algorithm to be as accurate as possible. In order to evaluate the accuracy of the
results obtained by the proposed framework, they are compared with the statistics
obtained from manually marked up data. In this evaluation the active/directional
movement of cells has been measured since it is an important indicator that
quantifies the cell migration and its calculation is not affected by localization errors
that may occur during the manual annotation process.
Comparative results are depicted in Figures A4.1 and A.4.2 where the
directional movement returned by the proposed method and manually annotated data
are indicated with blue and red dots, respectively. In these diagrams the x axis
denotes the cell ID and y axis denotes the directional movement of a cell. For
visualization purposes, the directional movement is calculated for a small number of
cells in each sequence. From these graphs it can be observed that there is a good
agreement between the directional movement obtained by the proposed method and
that calculated from manually marked data. The overall deviation between these two
sets of results is 10.5 percent. Thus, it can be concluded that the proposed method is
suitable to extract the motility statistics that are able to accurately measure the cell
migration patterns.
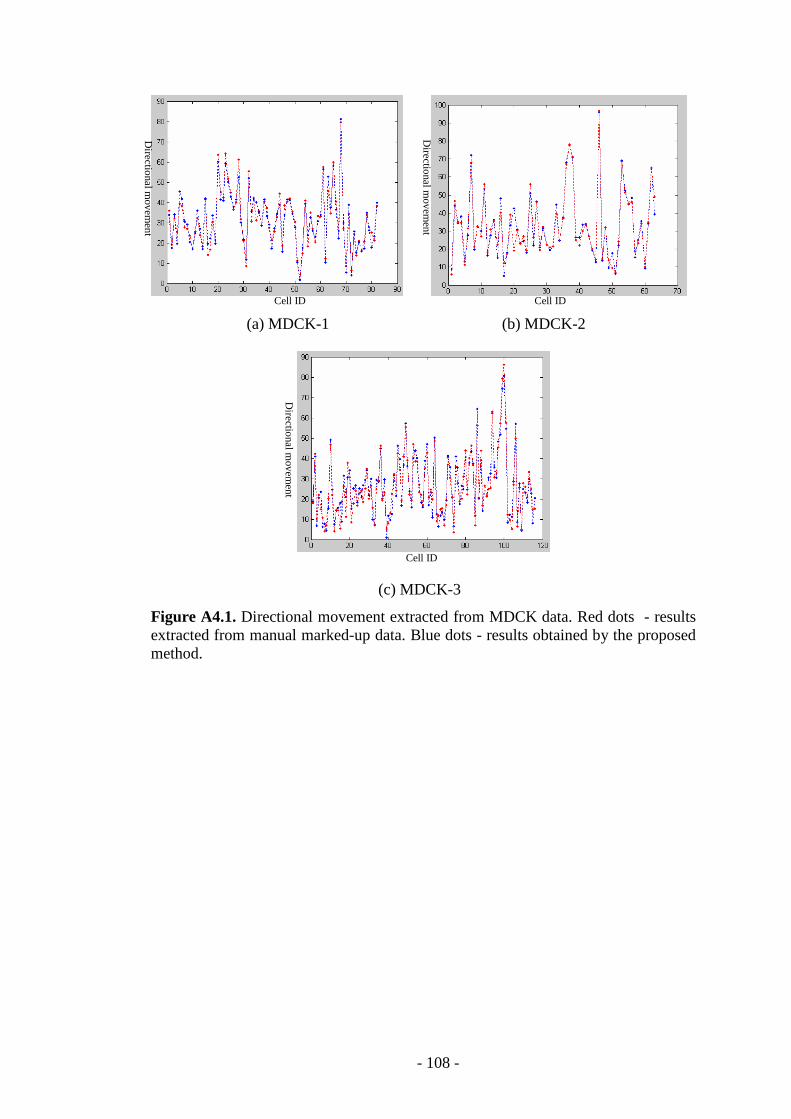
- 108 -
(a) MDCK-1 (b) MDCK-2
(c) MDCK-3
Figure A4.1. Directional movement extracted from MDCK data. Red dots - results extracted from manual marked-up data. Blue dots - results obtained by the proposed method.
Cell ID
Dire
ctiona
l move
men
t
Cell ID
Cell ID
Dire
ctiona
l move
men
t
Dire
ctiona
l move
men
t
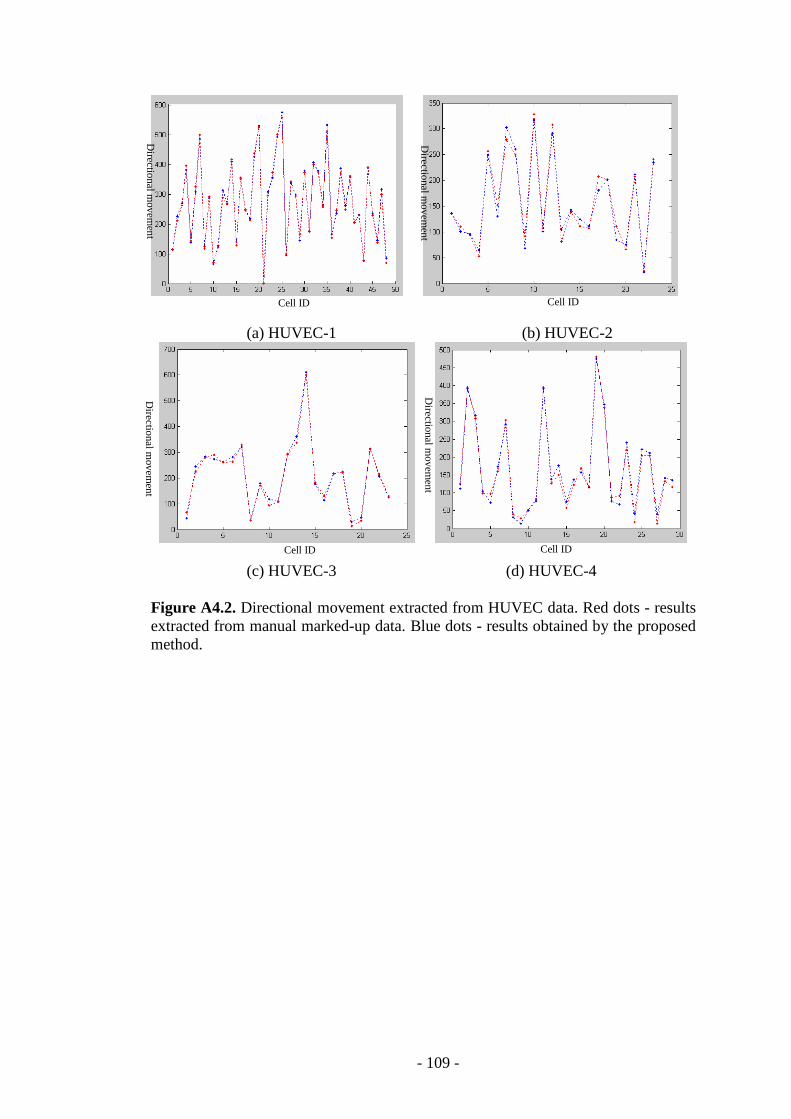
- 109 -
(a) HUVEC-1 (b) HUVEC-2
(c) HUVEC-3 (d) HUVEC-4 Figure A4.2. Directional movement extracted from HUVEC data. Red dots - results extracted from manual marked-up data. Blue dots - results obtained by the proposed method.
Dire
ctiona
l move
men
t
Cell ID
Cell ID
Dire
ctiona
l move
men
t
Dire
ctiona
l move
men
t
Dire
ctiona
l move
men
t
Cell ID
Cell ID
- 110 -
Appendix B:
Live Cell Image Acquisition
The objective of live cell imaging is to record key cellular events such as
migration, division, cellular interaction, apoptosis etc. that help in the process of
analyzing the biological mechanisms associated with various cellular events. Long
term monitoring of cells is required to compute key indicators that are able to
quantify the cell response to diverse stimuli. To facilitate this, live cells are grown in
a chamber (incubator) that is designed to maintain the cell culture conditions in
which cells remain in a healthy state for the duration of the experiments. To allow
the extraction of statistical indicators relating to cellular activity, the cells are
typically imaged by a microscope that is fitted with a computer-controlled digital
camera. In this process it is critical that the interaction between the imaging system
and cells to be maintained at minimal levels to avoid the insertion of undesired
factors that may impact on the cell health. When cells are monitored for long periods
of time, images are recorded at fixed intervals (normally few minutes) that are
sufficiently large to sample the changes induced by cell migration and the frequency
of cellular division and apoptosis with sufficient accuracy. This particular type of
image acquisition is known as time-lapse imaging.
In general, time-lapse microscopy imaging system consists of three major
components:
1) An incubator which is fitted to the stage of the microscope. The main role
of this device is to maintain a constant environment for cells with respect to
temperature, pressure and nutrition.
2) A microscope, which comprises optical components, an automated stage
and a digital camera that records sequences of cellular images.
3) Computing devices that control the microscopy parameters during the
time-lapse image acquisition process.
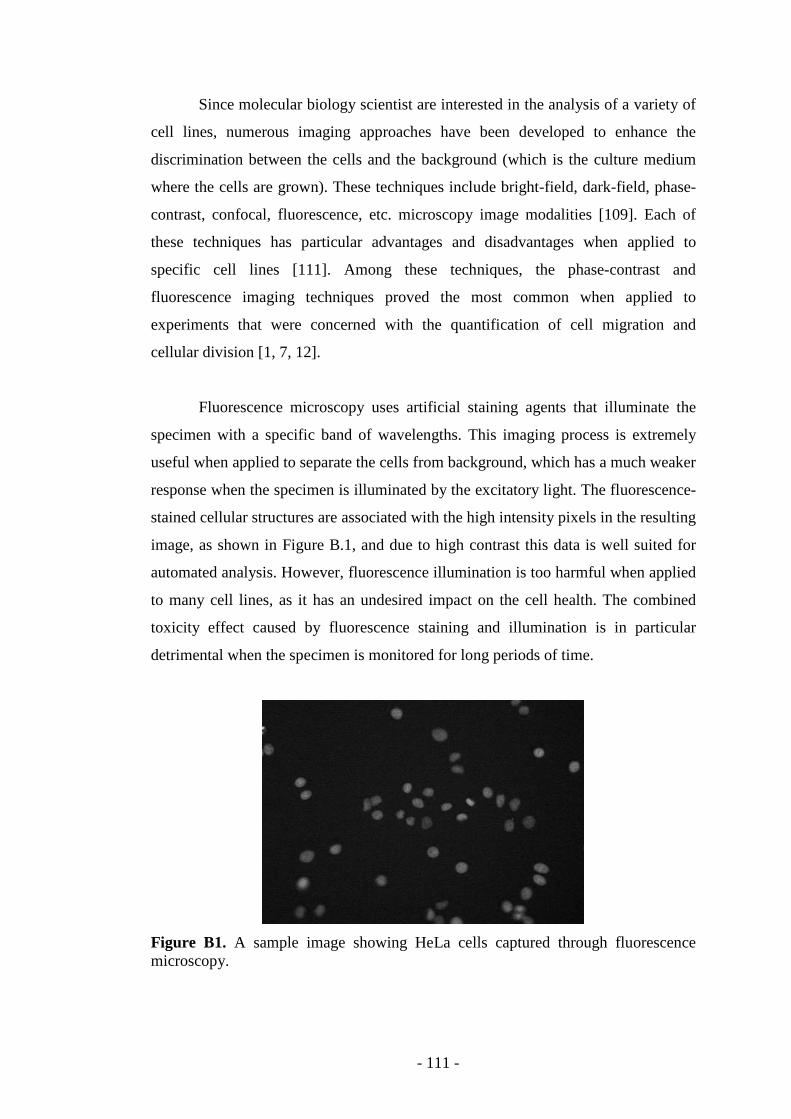
- 111 -
Since molecular biology scientist are interested in the analysis of a variety of
cell lines, numerous imaging approaches have been developed to enhance the
discrimination between the cells and the background (which is the culture medium
where the cells are grown). These techniques include bright-field, dark-field, phase-
contrast, confocal, fluorescence, etc. microscopy image modalities [109]. Each of
these techniques has particular advantages and disadvantages when applied to
specific cell lines [111]. Among these techniques, the phase-contrast and
fluorescence imaging techniques proved the most common when applied to
experiments that were concerned with the quantification of cell migration and
cellular division [1, 7, 12].
Fluorescence microscopy uses artificial staining agents that illuminate the
specimen with a specific band of wavelengths. This imaging process is extremely
useful when applied to separate the cells from background, which has a much weaker
response when the specimen is illuminated by the excitatory light. The fluorescence-
stained cellular structures are associated with the high intensity pixels in the resulting
image, as shown in Figure B.1, and due to high contrast this data is well suited for
automated analysis. However, fluorescence illumination is too harmful when applied
to many cell lines, as it has an undesired impact on the cell health. The combined
toxicity effect caused by fluorescence staining and illumination is in particular
detrimental when the specimen is monitored for long periods of time.
Figure B1. A sample image showing HeLa cells captured through fluorescence microscopy.
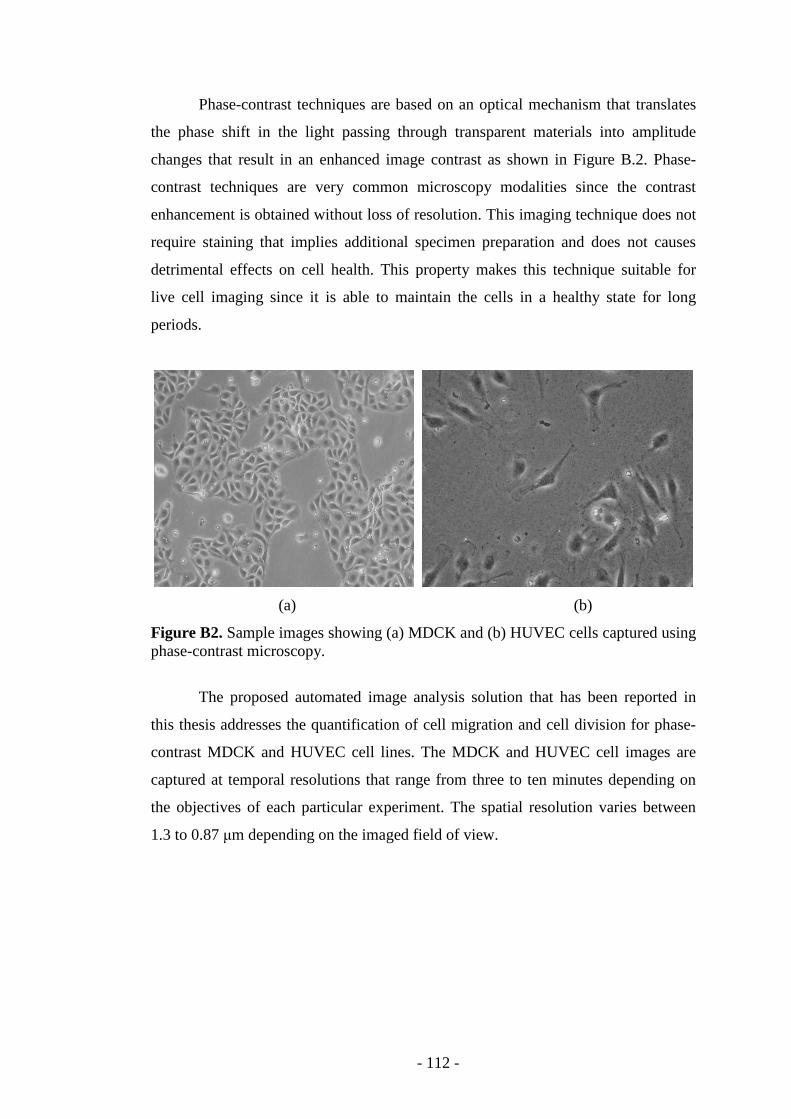
- 112 -
Phase-contrast techniques are based on an optical mechanism that translates
the phase shift in the light passing through transparent materials into amplitude
changes that result in an enhanced image contrast as shown in Figure B.2. Phase-
contrast techniques are very common microscopy modalities since the contrast
enhancement is obtained without loss of resolution. This imaging technique does not
require staining that implies additional specimen preparation and does not causes
detrimental effects on cell health. This property makes this technique suitable for
live cell imaging since it is able to maintain the cells in a healthy state for long
periods.
(a) (b)
Figure B2. Sample images showing (a) MDCK and (b) HUVEC cells captured using phase-contrast microscopy.
The proposed automated image analysis solution that has been reported in
this thesis addresses the quantification of cell migration and cell division for phase-
contrast MDCK and HUVEC cell lines. The MDCK and HUVEC cell images are
captured at temporal resolutions that range from three to ten minutes depending on
the objectives of each particular experiment. The spatial resolution varies between
1.3 to 0.87 µm depending on the imaged field of view.
- 113 -
References [1] O. Al-Kofahi, R. J. Radke, S. K. Goderie, Q. Shen, S. Temple, and B.
Roysam, “Automated cell lineage construction: A rapid method to analyze
clonal development established with murine neural progenitor cells,” Cell
Cycle, vol. 5, no. 3, pp. 327-335, February 2006.
[2] “Phase contrast microscope application in microscopy: Advantages and
disadvantages,” http://www.microscopemaster.com/phase-contrast-
microscope.html. (Last accessed Nov 2, 2011).
[3] Z. Yin, K. Li, T. Kanade, and M. Chen, “Understanding the optics to aid
microscopy image segmentation,” in Proceedings of the International
Conference on Medical Image Computing and Computer Assisted
Intervention (MICCAI), LNCS, Beijing, September 2010, pp. 209-217.
[4] D. Padfield, J. Rittscher, and B. Roysam, “Coupled minimum-cost flow cell
tracking for high-throughput quantitative analysis,” Medical Image Analysis,
vol. 15, no. 4, pp. 650-668, August 2011.
[5] O. Debeir, P. van Ham, R. Kiss, and C. Decaestecker, “Tracking of migrating
cells under phase-contrast video microscopy with combined mean-shift
processes,” IEEE Transaction on Medical Imaging, vol. 24, no. 6, pp. 697–
711, June 2005.
[6] O. Debeir, I. Camby, R. Kiss, P. van Ham, and C. Decaestecker, “A model-
based approach for automated in vitro cell tracking and chemotaxis
analyses,” Cytometry Part A, vol. 60, no. 1, pp. 29-40, July 2004.
[7] F. Li, X. Zhou, J. Ma, and S. T. C Wong, “Multiple nuclei tracking using
integer programming for quantitative cancer cell cycle analysis,” IEEE
Transaction on Medical Imaging, vol. 29, no. 1, pp. 96-105, January 2010.
[8] K. Li, E. D. Miller, M. Chen, T. Kanade, L. E. Weiss, and P. G. Campbell,
“Cell population tracking and lineage construction with spatiotemporal
context,” Medical Image Analysis, vol. 12, no. 5, pp. 546-566, October 2008.
- 114 -
[9] A. Mosig, S. Jäger, C. Wang, S. Nath, I. Ersoy, K. Palaniappan, and S. S.
Chen, “Tracking cells in life cell imaging videos using topological
alignments,” Algorithms for Molecular Biology, vol. 4, no. 10, pp. 1-9, July
2009.
[10] Q. Wang, J. Niemi, C. M. Tan, L. You, and M. West, “Image segmentation
and dynamic lineage analysis in single-cell fluorescence microscopy,”
Cytometry Part A, vol. 77A, no. 1, pp. 101-110, January 2010.
[11] N. Kharma, H. Moghnieh, J. Yao, Y.P. Guo, A. Abu-Baker, J. Laganiere, G.
Rouleau, and M. Cheriet, “Automatic segmentation of cells from microscopic
imagery using ellipse detection,” IET Image Processing, vol. 1, no. 1, pp. 39-
47, March 2007.
[12] M. A. A. Dewan, M. O. Ahmad, and M. N. S. Swamy, “Tracking biological
cells in time-lapse microscopy: An adaptive technique combining motion and
topological features,” IEEE Transaction on Biomedical Engineering, vol. 58,
no. 6, pp. 1637-1647, June 2011.
[13] K. Thirusittampalam, M. J. Hossain, O. Ghita, and P. F. Whelan, “A novel
framework for tracking in-vitro cells in time-lapse phase contrast data,” in
Proceedings of the British Machine Vision Conference, Aberystwyth,
September 2010, pp.69.1–69.11.
[14] D. P. Mukherjee, N. Ray, and S. T. Acton, “Level set analysis for leukocyte
detection and tracking,” IEEE Transaction on Image Processing, vol. 13, no.
4, pp. 562-572, April 2004.
[15] N. N. Kachouie, P. Fieguth, J. Ramunas and E. Jervis, “A model-based
hematopoietic stem cell tracker,” in Proceedings of the International
Conference on Image Analysis and Recognition, LNCS, Toronto, 2005, vol.
3656, pp. 861-868.
[16] K. Wu, D. Gauthier, and M. D. Levine, “Live cell image segmentation,”
IEEE Transaction on Biomedical Engineering, vol. 42, no. 1, pp. 1–12,
January 1995.
- 115 -
[17] C. Wählby, I. M. Sintorn, F. Erlandsson, G. Borgefors, and E. Bengtsson,
“Combining intensity, edge, and shape information for 2D and 3D
segmentation of cell nuclei in tissue sections,” Journal of Microscopy, vol.
215, no. 1, pp. 67–76, July 2004.
[18] A. Dufour, V. Shinin, S. Tajbakhsh, N. Guillén-Aghion, J. C. Olivo-Marin,
and C. Zimmer, “Segmenting and tracking fluorescent cells in dynamic 3-D
microscopy with coupled active surfaces,” IEEE Transaction on Image
Processing, vol. 14, no. 9, pp. 1396-1410, September 2005.
[19] D. Comaniciu and P. Meer, “Cell image segmentation for diagnostic
pathology,” Advanced Algorithmic Approaches to Medical Image
Segmentation: State-of-the-Art Applications in Cardiology, Neurology,
Mammography and Pathology, Springer-Verlag, vol. 0, pp. 541–558, 2002.
[20] J. C. Olivo-Marin, “Extraction of spots in biological images using multiscale
products,” Pattern Recognition, vol. 35, no. 9, pp. 1989–1996, September
2002.
[21] A. Genovesio, T. Liedl, V. Emiliani, W. J. Parak, M. Coppey-Moisan, and J.
C. Olivo-Marin, “Multiple particle tracking in 3-D+t microscopy: Method
and application to the tracking of endocytosed quantum dots,” IEEE
Transaction on Image Processing, vol. 25, no. 5, pp. 1062-1070, May 2006.
[22] N. Ray, S. T. Acton, and K. Ley, “Tracking leukocytes in vivo with shape
and size constrained active contours,” IEEE Transaction on Medical Imaging,
vol. 21, no. 10, pp. 1222-1235, October 2002.
[23] S. K. Nath, F. Bunyak, and K. Palaniappan, “Robust tracking of migrating
cells using four-color level set segmentation,” in Proceedings of the
International Conference on Advanced Concepts for Intelligent Vision
System, LNCS, Antwerp, September 2006, vol. 4179, pp. 920-932.
[24] R. M. Jiang, D. Crookes, N. Luo, and M. W. Davidson, “Live-cell tracking
using SIFT features in DIC microscopic videos,” IEEE Transaction on
Biomedical Engineering, vol. 57, no. 9, pp. 2219-2228, August 2010.
- 116 -
[25] I. Smal, E. Meijering, K. Draegestein, N. Galjart, I. Grigoriev, A.
Akhmanova, M. E. van Royen, A. B. Houtsmuller, and W. Niessen,
“Multiple object tracking in molecular bioimaging by Rao-blackwellized
marginal particle filtering,” Medical Image Analysis, vol. 12, no. 6, pp. 764-
777, December 2008.
[26] I. Smal, K. Draegestein, N. Galjart, W. Niessen, and E. Meijering, “Particle
filtering for multiple object tracking in dynamic fluorescence microscopy
images application to microtubule growth analysis,” IEEE Transaction on
Medical Imaging, vol. 27, no. 6, pp. 789-804, June 2008.
[27] L. Zhang, H. Xiong, K. Zhang, and X. Zhou, “Graph theory application in
cell nuleus segmentation, tracking and identification,” in Proceedings of the
IEEE International Conference on Bioinformatics and Bioengineering,
Boston, October 2007, pp. 226-232.
[28] J. Xie, S. Khan, and M. Shah, “Automatic tracking of escherichia coli in
phase-contrast microscopy video,” IEEE Transaction on Biomedical
Engineering, vol. 56, no. 2, pp. 390-399, February 2009.
[29] J. Apgar, Y. Tseng, E. Fedorov, M. B. Herwig, S. C. Almo, and D. Wirtz,
“Multiple-particle tracking measurements of heterogeneities in solutions of
actin filaments and actin bundles,” Biophysical Journal, vol. 79, no. 2, pp.
1095-1106, August 2000.
[30] S. Jaeger, Q. Song, and S. S. Chen, “DYNAMIK: A software environment
for cell dynamics, motility and information tracking, with an application to
Ras pathways,” Bioinformtics, vol. 25, no. 18, pp. 2383-2388, July 2009.
[31] J. Yan, X. Zhou, Q. Yang, N. Liu, Q. Cheng, and S. T. C. Wong, “An
effective system for optical microscopy cell image segmentation, tracking
and cell phase identification,” in Proceedings of the IEEE International
Conference on Image Processing, Atlanta, October 2006, pp. 1917-1920.
[32] X. Chen, X. Zhou, and S. T. C. Wong, “Automated segmentation,
classification, and tracking of cancer cell nuclei in time-lapse microscopy,”
- 117 -
IEEE Transaction on Biomedical Engineering, vol. 54, no. 4, pp. 762-766,
April 2006.
[33] T. Kirubarajan, Y. Bar-Shalom, and K. R. Pattipati, “Multiassignment for
tracking a large number of overlapping objects,” IEEE Transaction on
Aerospace and Electronic Systems, vol. 37, no. 1, pp. 2-21, January 2001.
[34] T. Kanade, Z. Yin, R. Bise, S. Huh, S. Eom, M. F. Sandbothe, and M. Chen,
“Cell image analysis: Algorithm, system and applications,” in Proceedings of
the IEEE Workshop on Application of Computer Vision, Kona, January
2011, pp. 374-381.
[35] M. de Berg, O. Cheong, M. van Kreveld, and M. Overmars, “Computational
geometry: Algorithms and applications,” Springer-3rd Ed, 2008, pp. 191-218.
[36] K. Thirusittampalam, M. J. Hossain, O. Ghita, and P. F. Whelan, “Cellular
tracking in time-lapse phase contrast images,” in Proceedings of the Irish
Machine Vision and Image Processing, Dublin, September 2009, pp. 77-82.
[37] M. Liu, R. K. Yadav, A. R. Chowdhury, and G. V. Reddy, “Automated
tracking of stem cell lineages of arabidopsis shoot apex using local graph
matching,” Plant Journal, vol. 62, no. 1, pp. 135-147, April 2010.
[38] M. Kass, A. Witkin, and D. Terzopoulos, “Snakes: Active contour models,”
International Journal of Computer Vision, vol. 1, no. 4, pp. 321-331, 1988.
[39] S. Osher and J. Sethian, “Fronts propagating with curvature-dependent speed:
Algorithms based on Hamilton–Jacobi formulations,” Journal of
Computational Physics, vol. 79, no. 1, pp. 12–49, November 1988.
[40] D. M. Tsai and C. T. Lin, “Fast normalized cross correlation for defect
detection,” Pattern Recognition Letters, vol. 24, no. 15, pp. 2625-2631,
November 2003.
[41] D. Comaniciu, V. Ramesh, and P. Meer, “Kernel-based object tracking,”
IEEE Transaction on Pattern Analysis and Machine Intelligence, vol. 25, no.
5, pp. 564-577, May 2003.
- 118 -
[42] F. Leymarie and M. D. Levine, “Tracking deformable objects in the plane
using an active contour model,” IEEE Transaction on Pattern Analysis and
Machine Intelligence, vol. 15, no. 6, pp. 617-634, June 1993.
[43] A. P. Goobic, M. E. Welser, S. T. Acton, and K. Ley, “Biomedical
application of target tracking in clutter,” in Proceedings of the 35th Asilomar
Conference on Signals, Systems and Computers, Pacific Grove, November
2001, vol. 1, pp. 88–92.
[44] C. Zimmer, E. Labruyère, V. Meas-Yedid, N. Guillén, and J. C. Olivo-Marin,
“Segmentation and tracking of migrating cells in videomicroscopy with
parametric active contours: A tool for cell-based drug testing,” IEEE
Transaction on Medical Imaging, vol. 21, no. 10, pp. 1212-1221, October
2002.
[45] X. Wang, W. He, D. Metaxas, R. Mathew, and E. White, “Cell segmentation
and tracking using texture-adaptive snakes,” in Proceedings of the IEEE
International Symposium on Biomedical Imaging: from Nano to Macro,
Arlington, April 2007, pp. 101-104.
[46] H. Delingette and J. Montagnat, “Shape and topology constraints on
parametric active contours,” Computer Vision and Image Understanding, vol.
83, no. 2, pp. 140–171, August 2001.
[47] N. Ray and S. T. Acton, “Motion gradient vector flow: An external force for
tracking rolling leukocytes with shape and size constrained active contours,”
IEEE Transaction on Medical Imaging, vol. 23, no. 12, pp. 1466-1478,
December 2004.
[48] D. Padfield, J. Rittscher, N. Thomas, and B. Roysam, “Spatio-temporal cell
cycle phase analysis using level sets and fast marching methods,” Medical
Image Analysis, vol. 13, no. 1, pp. 143-155, February 2009.
[49] B. Zhang, C. Zimmer, and J. C. Olivo-Marin, “Tracking fluorescent cells
with coupled geometric active contours,” in Proceedings of the IEEE
International Symposium on Biomedical Imaging: Nano to Macro, Arlington,
April 2004, vol. 1, pp. 476-479.
- 119 -
[50] L. Miroslaw, A. Chorazyczewski, F. Buchholz, and R. Kittler, “Correlation-
based method for automatic mitotic cell detection in phase contrast
microscopy,” in Proceedings of the International Conference on Computer
Recognition Systems, 2005, vol. 30, pp. 627-634.
[51] E. P. Careta, M. T. Cisneros, O. Debeir, J. S. Mondragón, J. G. A. Cervantes,
O. G. I. Manzano, D. M. Arrioja, E. P. Pantoja, and G. N. Romero, “Cell
tracking by normalized cross-correlation with image processing,” in
Proceedings of the IEEE Summer Topical Meetings, Acapulco, July 2008,
pp. 43-44.
[52] X. Yang, H. Li, and X. Zhou “Nuclei segmentation using marker-controlled
watershed, tracking using mean-shift, and Kalman filter in time-lapse
microscopy,” IEEE Transactions on Circuits and Systems I, vol. 53, no. 11,
pp. 2405-2414, November 2006.
[53] J. Cui, S. T. Acton, and Z. Lin, “A Monte Carlo approach to rolling leukocyte
tracking in vivo,” Medical Image Analysis, vol. 10, no. 4, pp. 598-610,
August 2006.
[54] W.J. Godinez, M. Lampe, S. Wörz, B. Müller, R. Eils, and K. Rohr,
“Deterministic and probabilistic approaches for tracking virus particles in
time-lapse fluorescence microscopy image sequences,” Medical Image
Analysis, vol. 13, no. 2, pp. 325-342, April 2009.
[55] R. E. Kalman, “A new approach to linear filtering and prediction problems,”
ASME Transaction on Basic Engineering, vol. 82, no. D, pp. 35-45, 1960.
[56] M. S. Arulampalam, S. Maskell, N. Gordon, and T. Clapp, “A tutorial on
particle filters for online nonlinear/non-Gaussian Bayesian tracking,” IEEE
Transaction on Signal Processing, vol. 50, no. 2, pp. 174-188, February 2002.
[57] N. H. Nguyen, S. Keller, E. Norris, T. T. Huynh, M. G. Clemens, and M. C.
Shin, “Tracking colliding cells in vivo microscopy,” IEEE Transaction on
Biomedical Engineering, vol. 58, no. 8, pp. 2391-2400, August 2011.
- 120 -
[58] N. N. Kachouie and P. W. Fieguth, “Extended-Hungarian-JPDA: Exact
single-frame stem cell tracking,” IEEE Transaction on Biomedical
Engineering, vol. 54, no. 11, pp. 2011-2019, November 2007.
[59] J. Cheng, E. G. L. Koh, S. Ahmed and J. C. Rajapakse, “Joint tracking of cell
morphology and motion,” in Proceedings of the IAPR International
Conference on Pattern Recognition in Bioinformatics, LNCS, Sheffield,
September 2009, vol. 5780, pp. 36-45.
[60] J. Degerman, T. Thorlin, J. Faijerson, K. Althoff, P. S. Eriksson, R. V. Put,
and T. Gustavsson, “An automatic system for in vitro cell migration studies,”
Journal of Microscopy, vol. 233, no. 1, pp. 178-191, January 2009.
[61] D. Padfield, J. Rittscher, and B. Roysam, “Spatio-temporal cell segmentation
and tracking for automated screening,” in Proceedings of the IEEE
International Symposium on Biomedical Imaging: from Nano to Macro,
Paris, May 2008, pp. 376 - 379.
[62] O. Debeir, V. Mégalizzi, N. Warzée, R. Kiss, and C. Decaestecker,
“Videomicroscopic extraction of specific information on cell proliferation
and migration in vitro,” Experimental Cell Research, vol. 314, no. 16, pp.
2985-2998, October 2008.
[63] S. Huh and M. Chen, “Detection of mitosis within a stem cell population of
high cell confluence in phase-contrast microscopy images,” in Proceedings of
the IEEE Conference on Computer Vision and Pattern Recognition,
Providence, June 2011, pp. 1033 - 1040.
[64] S. Huh, D. F. E. Ker, R. Bise, M. Chen, and T. Kanade “Automated mitosis
detection of stem cell populations in phase-contrast microscopy images,”
IEEE Transaction on Medical Imaging, vol. 30, no. 3, pp. 586-596, March
2011.
[65] A. A. Liu, K. Li, and T. Kanade, “Mitosis sequence detection using hidden
conditional random fields,” in Proceedings of the IEEE International
Symposium on Biomedical Imaging: Nano to Macro, Rotterdam, April 2010,
pp. 580-583.
- 121 -
[66] A. Quattoni, S. Wang, L. Morency, M. Collins, and T. Darrell, “Hidden
conditional random fields,” IEEE Transaction on Pattern Analysis and
Machine Intelligence, vol. 29, no. 10, pp. 1848–1852, October 2007.
[67] H. Geerts, M. D. Brabander, R. Nuydens, S. Geuens, M. Moeremans, J. D.
Mey, and P. Hollenbeck, “Nanovid tracking: A new automatic method for the
study of mobility in living cells based on colloidal gold and video
microscopy,” vol. 52, no. 5, pp. 775-782, November 1987.
[68] I. Adanja, O. Debeir, V. Megalizzi, R. Kiss, N. Warzee, and C. Decaestecker,
“Automated tracking of unmarked cells migrating in three-dimensional
matrices applied to anti-cancer drug screening,” Experimental Cell Research,
vol. 316, no. 2, pp. 181-193, January 2010.
[69] Y. Sato, G. Poynter, D. Huss, M. B. Filla, A. Czirok, B. J. Rongish, C. D.
Little, S. E. Fraser, and R. Lansford, “Dynamic analysis of vascular
morphogenesis using transgenic quail embryos,” PLOS ONE, vol. 5, no. 9,
September 2010.
[70] V. Sethuraman, A. French, D. Wells, K. Kenobi, and T. Pridmore, “Tissue-
level segmentation and tracking of cells in growing plant roots,” Machine
Vision and Applications, doi 10.1007/s00138-011-0329-9, March 2011.
[71] J. W. Mao, L. W. Wang, T. Jacob, X. R. Sun, H. Li, L. Y. Zhu, P. Li, P.
Zhong, S. H. Nie, and L. X. Chen, “Involvement of regulatory volume
decrease in the migration of nasopharyngeal carcinoma cells,” Cell Research,
vol. 15, pp. 371–378, 2005.
[72] M. Butenuth and C. Heipke, “Network snakes: Graph-based object
delineation with active contour models,” Machine Vision and Application,
doi: 10.1007/s00138-010-0294-8, August 2010.
[73] K. Thirusittampalam, M. J. Hossain, O. Ghita, and P. F. Whelan, “Cell
segmentation in time-lapse phase contrast data,” in Proceedings of the Irish
Machine Vision and Image Processing Conference (IMVIP), Dublin,
September 2011, pp. 120-121.
- 122 -
[74] M. J. Hossain, P. F. Whelan, A. Czirok, and O. Ghita, “An active particle-
based tracking framework for 2D and 3D time-lapse microscopy images,” in
Proceedings of the 33rd Annual International Conference of the IEEE
Engineering in Medicine and Biology Society (EMBC), Boston, August
2011, pp. 6613-6618.
[75] Z. Khan, T. Balch, and F. Dellaert, “MCMC-based particle filtering for
tracking a variable number of interacting targets,” IEEE Transaction on
Pattern Analysis and Machine Intelligence. vol. 27, no. 11, pp. 1805–1819,
November 2005.
[76] R. Fabbri, L. D. F. Costa, J. C. Torelli, and O. M. Bruno, “2D Euclidean
distance transform algorithms: A comparative survey,” ACM Computing
Surveys, vol. 40, no. 1, 2008.
[77] N. Otsu, “A threshold selection method from gray level histograms,” IEEE
Transactions on System, Man, and Cybernetics, vol. smc-9, no. 1, pp. 62–66,
1979.
[78] Y. Al-Kofahi, W. Lassoued, W. Lee, and B. Roysam, “Improved automatic
detection and segmentation of cell nuclei in histopathology images,” IEEE
Transaction on Biomedical Engineering, vol. 57, no. 4, pp. 841-852, April
2010.
[79] A. Dufour, R. Thibeaux, E. Labruyère, N. Guillén, and J. C. Olivo-Marin, “3-
D Active meshes: Fast discrete deformable models for cell tracking in 3-D
time-lapse microscopy,” IEEE Transaction on Image Processing, vol. 20, no.
7, pp. 1925-1937, July 2011.
[80] J. Cui, N. Ray, S. T. Acton, and Z. Lin, “An affine transformation invariance
approach to cell tracking,” Computerized Medical Imaging and Graphics,
vol.32, no. 7, pp. 554-565, July 2008.
[81] Y. Chen, P. Quelhas, and A. Campilho, “Low frame rate cell tracking: A
Delaunay graph matching approach,” in Proceedings of the IEEE
International Symposium on Biomedical Imaging: From Nano to Macro,
Chicago, March-April 2011, pp. 1015 – 1018.
- 123 -
[82] F. Li, X. Zhou, and S. T.C. Wong, “Optimal live cell tracking for cell cycle
study using time-lapse fluorescent microscopy images,” in Proceedings of the
International Workshop on Machine Learning in Medical Imaging, LNCS,
Beijing, September 2010, vol. 6357, pp. 124-131.
[83] R. Bise, Z. Yin, and T. Kanade “Reliable cell tracking by global data
association,” in Proceedings of the IEEE International Symposium on
Biomedical Imaging: From Nano to Macro, Chicago, March-April 2011, pp.
1004 - 1010.
[84] X. Zhou and Y. Lu, “Efficient mean shift particle filter for sperm cells
tracking,” in Proceedings of the International Conference on Computational
Intelligence and Security, Beijing, December 2009, pp. 335 – 339.
[85] T. Otaki, “Artifact halo reduction in phase contrast microscopy using
apodization,” Optical Review, vol. 7, no. 2, pp. 119-122, 2000.
[86] I. Ersoy, F. Bunyak, V. Chagin, M. C. Cardoso, and K. Palaniappan,
“Segmentation and classification of cell cycle phases in fluorescence
imaging,” in Proceedings of the Medical Image Computing and Computer-
Assisted Intervention (MICCAI), LNCS, London, 2009, vol. 5762, pp. 617-
624.
[87] “Madin-Darby Canine Kidney Epithelial Cells (MDCK Line),”
http://learn.hamamatsu.com/galleries/digitalimages/mdck/mdckcells.html,
(Last accessed Nov 7, 2011)
[88] E. T. Jordan, M. Collins, J. Terefe, L. Ugozzoli, and T. Rubio “Optimizing
electroporation conditions in primary and other difficult-to-transfect cells,”
Journal of Biomolecular Techniques, vol. 19, no. 5, pp. 328-334, December
2008.
[89] D. J. Stephens and V. J. Allan, “Light microscopy techniques for live cell
imaging,” Science Biological Imaging, vol. 300, no. 5616, pp. 82-86, April
2003.
- 124 -
[90] B. Isherwood, P. Timpson, E. J. McGhee, K. I. Anderson, M. Canel, A.
Serrels, V. G. Brunton, and N. O. Carragher, “Live cell in vitro and in vivo
imaging applications: Accelerating drug discovery,” Pharmaceutics, vol. 3,
no. 2, pp. 141-170, April 2011.
[91] S. Landry and P. L. McGhee, “Monitoring live cell viability: Comparative
study of fluorescence, oblique incidence reflection and phase contrast
microscopy imaging techniques,” Optics Express, vol. 12, no. 23, pp. 5754-
5759, November 2004.
[92] J. Cheng and J. C. Rajapase, “Segmentation of clustered nuclei with shape
markers and marking function,” IEEE Transactions on Biomedical
Engineering, vol. 56, no. 3, pp. 741-748, March 2009.
[93] U. Adiga, R. Malladi, R. Fernandez-Gonzalez, and C. O. D. Solorzano,
“High-throughput analysis of multispectral images of breast cancer tissue,”
IEEE Transactions on Image Processing, vol. 15, no. 8, pp. 2259-2268,
August 2006.
[94] K. Palaniappan, I. Ersoy, and K. Nath, “Moving object segmentation using
the flux tensor for biological video microscopy,” LNCS, no. 4810, pp. 483-
493, 2007.
[95] F. Li, X. Zhou, H. Zhao, and S. T. C. Wong, “Cell segmentation using front
vector flow guided active contours,” International Conference on Medical
Image Computing and Computer-Assisted Intervention, vol. 12, no. 2, pp.
609-616, 2009.
[96] X. Zhou, F. Li, J. Yan, and S. T. C. Wong, “A novel cell segmentation
method and cell phase identification using Markov model,” IEEE
Transactions on Information Technology in Biomedicine, vol. 13, no. 2, pp.
152-157, March 2009.
[97] F. Li, X. Zhou, J. Zhu, J. Ma, X. Huang, and S. T. C. Wong, “High content
image analysis for human H4 neuroglioma cells exposed to CuO
nanoparticles,” BMC Biotechnology, vol. 7, no. 66, October 2007.
- 125 -
[98] K. Shafique and M. Shah, “A noniterative greedy algorithm for multiframe
point correspondence,” IEEE Transaction on Pattern Analysis and Machine
Intelligence, vol. 27, no. 1, pp. 51-65, January 2005.
[99] A. Bouchemha, A. Nait-Ali, N. Doghmane, “A robust technique to
characterize the palmprint using radon transform and Delaunay
triangulation,” International Journal of Computer Applications, vol. 10, no.
10, pp. 35-42, November 2010.
[100] F. Hoffmann, K. Kriegel, and C. Wenk, “Matching 2D patterns of protein
spots,” in Proceedings of the 14th Annual Symposium on Computational
Geometry, 1998, pp.231-239.
[101] J. Dai, W. Luo, M. Jin, W. Zeng, Y. He, S. T Yau, and X. Gu, “Geometric
accuracy analysis for discrete surface approximation,” in Proceedings of the
4th International Conference on Geometric Modeling and Processing, vol. 24,
no. 6, August 2007, pp. 323-338.
[102] D. Shin and T. Tjahjadi, “Similarity invariant Delaunay graph matching,” in
Proceedings of the Joint IAPR International Workshop, SSPR & SPR,
Orlando, December 2008, vol. 5342, pp. 25-34.
[103] D. P. Huttenlocher, G. A. Klanderman, and W. J. Ruklidge, “Comparing
images using the Hausdorff distance,” IEEE Transactions on Pattern Analysis
and Machine Intelligence, vol. 15, no. 9, pp. 850-863, September 1993.
[104] B. Gunsel, A. M. Tekalp, and P. J. L.Van Beek, “Content-based access to
video objects: Temporal segmentation, visual summarization, and feature
extraction,” vol. 66, no. 2, pp. 261-280, April 1998.
[105] V. A. Sujan and M. P. Mulqueen, “Fingerprint identification using space
invariant transforms,” Pattern Recognition Letters, vol. 23, no. 5, pp. 609-
619, March 2002.
[106] A. M. Finch, R. C. Wilson, and E. R. Hancock, “Matching Delaunay graphs,”
Pattern Recognition, vol. 30, no. 1, pp. 123-140, January 1997.
- 126 -
[107] J. W. Jaromczyk and G. T. Toussaint, “Relative neighborhood graphs and
their relatives,” Proceedings of the IEEE, vol. 80, no. 9, pp. 1502-1517,
September 1992.
[108] P. Bose, L. Devroye, W. Evans, and D. Kirkpatrick “On the spanning ratio of
Gabriel graphs and β-skeletons,” in Proceedings of the 5th Latin American
Symposium on Theoretical Informatics, Cancun, April 2002, vol. 2286, pp.
479-493.
[109] D. B. Murphy, “Fundamentals of light microscopy and electronic imaging,”
John Wiley and Sons, October 2001.
[110] M. M. Frigault, J. Lacoste, J. L. Swift and C. M. Brown, “Live-cell
microscopy – tips and tools,” Journal of Cell Science, vol. 122, pp. 753-767,
2009.
[111] “Introduction to live-cell imaging techniques,”
http://www.microscopyu.com/articles/livecellimaging/index.html
(Last accessed Jan 26, 2012).