Embed Size (px)
Citation preview
Engineering Science and Technology, an International Journal 22 (2019) 767–776
Contents lists available at ScienceDirect
Engineering Science and Technology,an International Journal
journal homepage: www.elsevier .com/ locate / jestch
Full Length Article
Cellular-phone-based computer vision system to extract shapeproperties of coarse aggregate for asphalt mixtures
https://doi.org/10.1016/j.jestch.2019.02.0032215-0986/� 2019 Karabuk University. Publishing services by Elsevier B.V.This is an open access article under the CC BY-NC-ND license (http://creativecommons.org/licenses/by-nc-nd/4.0/).
⇑ Corresponding author.E-mail addresses: [email protected] (K.A. Ghuzlan), [email protected]
(M.T. Obaidat), [email protected] (M.M. Alawneh).
Peer review under responsibility of Karabuk University.1 On leave at: Ajman University, Ajman, United Arab Emirates.
Khalid A. Ghuzlan ⇑,1, Mohammed T. Obaidat, Mai M. AlawnehCivil Engineering Department, Faculty of Engineering, Jordan University of Science and Technology, P.O. Box 3030, Irbid 22110, Jordan
a r t i c l e i n f o a b s t r a c t
Article history:Received 26 October 2018Revised 18 January 2019Accepted 9 February 2019Available online 18 February 2019
Keywords:Coarse aggregateImage processing techniquesImageJ softwareFlatness and elongation indexRoundness index
A new computer-vision cellular-phone-based methodology and scheme was developed to determine theshape properties (Flatness Index, Elongation Index and Roundness Index) of coarse aggregate particles.This scheme utilizes cellular phones images and image processing techniques (IPT) in determining thecoarse aggregate particles shape properties. This methodology compared with the conventional methods,which need special laboratory technicians and are time consuming was faster and more accurate proce-dure. Fifty coarse aggregate particles were collected and their shape properties were measured manually(using caliper and AutoCAD) then computed using image processing procedure. To compute these shapeproperties using image processing, special data acquisition method was designed and implemented. Theaggregate particles were arranged on a grid of an apparatus designed specifically for this task, andmapped by the cellular phone from two views; top view and side view. Then cellular phones images wereanalyzed with ImageJ software.� 2019 Karabuk University. Publishing services by Elsevier B.V. This is an open access article under the CC
BY-NC-ND license (http://creativecommons.org/licenses/by-nc-nd/4.0/).
1. Introduction
Aggregates are the most important components in flexiblepavements, as it has a major role in deformation resistance, andit is used as the main material in the subbase layer. Aggregate con-tributes in bout 80–95 percent of the bituminous mixture volume.Asphalt concrete performance is highly affected by the aggregatesize, shape properties and gradation. Subsequently, the optimumasphalt content is influenced greatly by aggregate characteristics,which in turn affects all other HMA characteristics [1]. Naturalcrushed aggregate is commonly used in asphalt concrete mixtures.Recently, researchers start looking into using Recycled AggregateConcrete (RAC) as an alternative aggregate [2,3]. The mutual bondsbetween coarse aggregate particles and the interaction with theasphalt binder is related directly to the coarse aggregate character-istics (angularity, shape and texture). Aggregate shape propertiesmeasurement is crucial in good quality control of the aggregate.In addition, such measurements may help in better understandingof the effect of aggregate characteristics on the pavement structureperformance [4].
HMA strength and workability are effected by surface texture ofthe coarse aggregate. Strength of the HMA is increased with roughsurface texture of aggregate, which in turn requires higher asphaltcontent to provide the proper workability.
In addition, rough aggregate particles produce higher voids inthe compacted mixture. Stronger mechanical bond between roughaggregate surface and asphalt binder is produced compared tosmooth aggregate surface [5].
Cubical aggregate particles are desired in the Hot Mix Asphalt(HMA) rather than flat and elongated. Cubical aggregate causedstrong bonds in the hot mix asphalt, while the flat and elongatedaggregate create weak bonds and this cause segregation in thefuture [6]. Furthermore, Angular shape particles provides betterstability for the HMA through the higher internal friction andhigher aggregate interlock. Conversely, rounded aggregate parti-cles (such as natural sands and gravels) in HMA produce betterworkable mixture that needs less compaction effort to obtain thedesired density. Microstructure of HMA has great influence onmixture properties. The experimental characterization of themicrostructure of the HMA is highly related to the HMA macro-scopic behavior. Microstructure distribution influence on thematerial macroscopic reaction will be better quantified [7].
Flatness Index (FI), Elongation Index (EI), and Roundness Index(RI), are the most aggregate shape properties that affect the aggre-gate performance in the hot mix asphalt [8]. Rounded particles areexpected to have less stability and less particle to particle interlock
768 K.A. Ghuzlan et al. / Engineering Science and Technology, an International Journal 22 (2019) 767–776
than fractured aggregate particles. ASTM D 4791 [9] specifies thatthe aggregates, which are not flat nor elongated, will have highercompressive strength than flat or elongated particles of the samematerial.
2. Aim of the study
This research aims to investigate the image processing potentialin accurately determining the shape properties (Flatness Index,Elongation Index, and Roundness Index) of coarse aggregate parti-cles by using cellular phones images and IPT instead of the conven-tional methods. The conventional method for determination ofaggregate shape properties is considered to be time consumingsince it requires a series of exhaustive analytical and laboratorysteps. The new procedure saves the user’s time and gives accuratemeasurements of the aggregate particle shapes’ indices.
3. Literature review
Image processing techniques (IPT) described as performingsome operations on images to extract some useful informationby process the image through special software like ImageJ soft-ware. IPT used to determine the length, width and thickness of par-ticles. These measurements used to determine the flat andelongated particles. On the other hand, cellular Phone imagemeans the image that is captured using the Cellular phone in 2Dusing normal-based mapping technique.
The use of image processing came from the constraints and lim-itations that effect on the manual method. These traditional meth-ods need laboratory technicians and lots of time because it is slowtesting, and not significant to measure the large amount of coarseaggregate particles [10]. The manual procedure is not effective wayto measure the shape indices of large numbers of coarse aggregate.On the other hand, image processing can be used to arrange largenumber of coarse aggregate (25, 50, 75, 100 or more particles) onthe grid then map them using the cellular phone image after thisit can be analyzed to get the coarse aggregates’ shape properties.Image processing is the process of collecting the information fromthe image through studying the pixel array. This method has beenused in many applications, and one of these applications is theanalysis of the coarse aggregate particles images and extract flatand elongated particles ratio [11]. Image processing is donethrough using a digital camera and advanced lighting technologyto capture images with high accuracy. Maerz and Lusher [12] usedthe two perpendicular cameras fixed above the conveyor belt thatcontain flat and elongated particles. The images of the particleswere taken by two cameras at the same position to measure thedimensions of the flat and elongated particles. Weingart and Prow-ell [13] used the digital devices such as VDG-40 video grader tomeasure the gradation of coarse aggregate and to measure the flatand elongated particles. Image processing techniques used todetermine the length, width and thickness of particles. These mea-surements used to calculate the flat and elongated particles. Imageprocessing techniques used to determine the length, width andthickness of particles. These measurements used to calculate theflat and elongated particles. Moaveni et al. [14] evaluated theaggregate size and shape using an innovated field image-acquisition and image-processing techniques by using digital sin-gle lens reflex camera. Results indicates that this proposed systemcan be used to capture several aggregate particles in a single imagefor rapidly.
Kumara et al. [15] used ImageJ software and an image analysistechnique to investigate the gravel size distribution. Results showthat, aggregate gradation curve produced by this method is similarto that obtained from sieve analysis. The image analysis method is
simple in nature (needs only computer and camera), and it needsshort time (compared to sieve analysis).
Arasan et al. [16] investigated the effect of particles size andshape on the aggregate particle size distribution using image pro-cessing; ten aggregate samples with variations in properties weretreated with image processing using the ImageJ software andproper threshold value. The result showed that the classificationsof aggregates according to the automated method and mechanicalanalysis were almost the same. When image analysis is used ingrain size distribution, more accurate results were obtained fromfront views compared to the top views of the grain particles.
Breytenbach et al. [17] used 3D laser scanning method to studythe shape and texture of coarse aggregate (the angularity androundness). It was found that it is hard to distinguish between par-ticle shape and texture of coarse aggregate particles.
It was proven from the previous research that the image analy-sis techniques are simple and less time consuming compared toconventional methods. It needs only a computer and camera,therefore, it can be used as in situ method.
4. Methodology
Shape properties of coarse aggregate particles are measuredusing the image processing approach. Coarse aggregate are definedas aggregates with sizes more than 4.75 mm. In this study, theaggregate sizes of more than 12.5 mm were used. Fifty coarseaggregate particles were collected and their dimensions weredefined; twenty-five large size course aggregates retained on sieveNo. 1 (25 mm) and twenty-five medium size ones retained on sieveNo. 1/2 (12.5 mm). The shape properties (Flatness Index, Elonga-tion Index and Roundness Index) of these aggregate particles werecomputed using the manual procedure and using image processingprocedure and the results from the two procedures were comparedto each other.
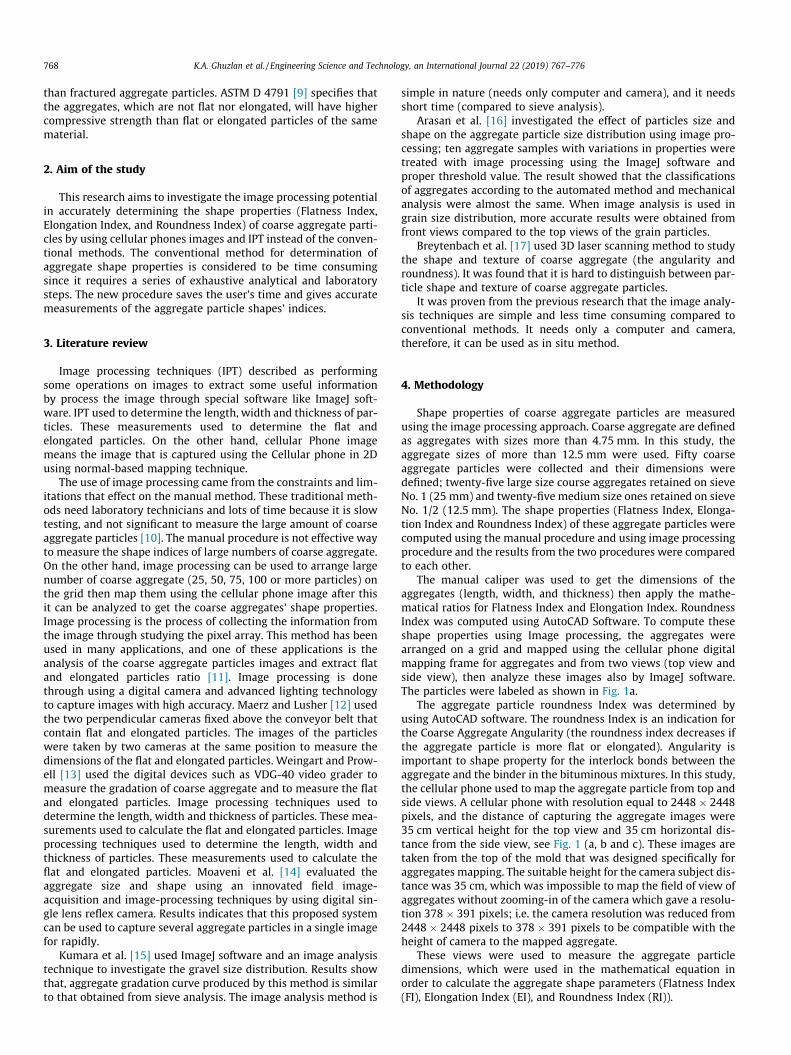
The manual caliper was used to get the dimensions of theaggregates (length, width, and thickness) then apply the mathe-matical ratios for Flatness Index and Elongation Index. RoundnessIndex was computed using AutoCAD Software. To compute theseshape properties using Image processing, the aggregates werearranged on a grid and mapped using the cellular phone digitalmapping frame for aggregates and from two views (top view andside view), then analyze these images also by ImageJ software.The particles were labeled as shown in Fig. 1a.
The aggregate particle roundness Index was determined byusing AutoCAD software. The roundness Index is an indication forthe Coarse Aggregate Angularity (the roundness index decreases ifthe aggregate particle is more flat or elongated). Angularity isimportant to shape property for the interlock bonds between theaggregate and the binder in the bituminous mixtures. In this study,the cellular phone used to map the aggregate particle from top andside views. A cellular phone with resolution equal to 2448 � 2448pixels, and the distance of capturing the aggregate images were35 cm vertical height for the top view and 35 cm horizontal dis-tance from the side view, see Fig. 1 (a, b and c). These images aretaken from the top of the mold that was designed specifically foraggregates mapping. The suitable height for the camera subject dis-tance was 35 cm, which was impossible to map the field of view ofaggregates without zooming-in of the camera which gave a resolu-tion 378 � 391 pixels; i.e. the camera resolution was reduced from2448 � 2448 pixels to 378 � 391 pixels to be compatible with theheight of camera to the mapped aggregate.
These views were used to measure the aggregate particledimensions, which were used in the mathematical equation inorder to calculate the aggregate shape parameters (Flatness Index(FI), Elongation Index (EI), and Roundness Index (RI)).
(a) two sizes for the aggregates
(b) top view
(c) side view
Fig. 1. Course aggregate.
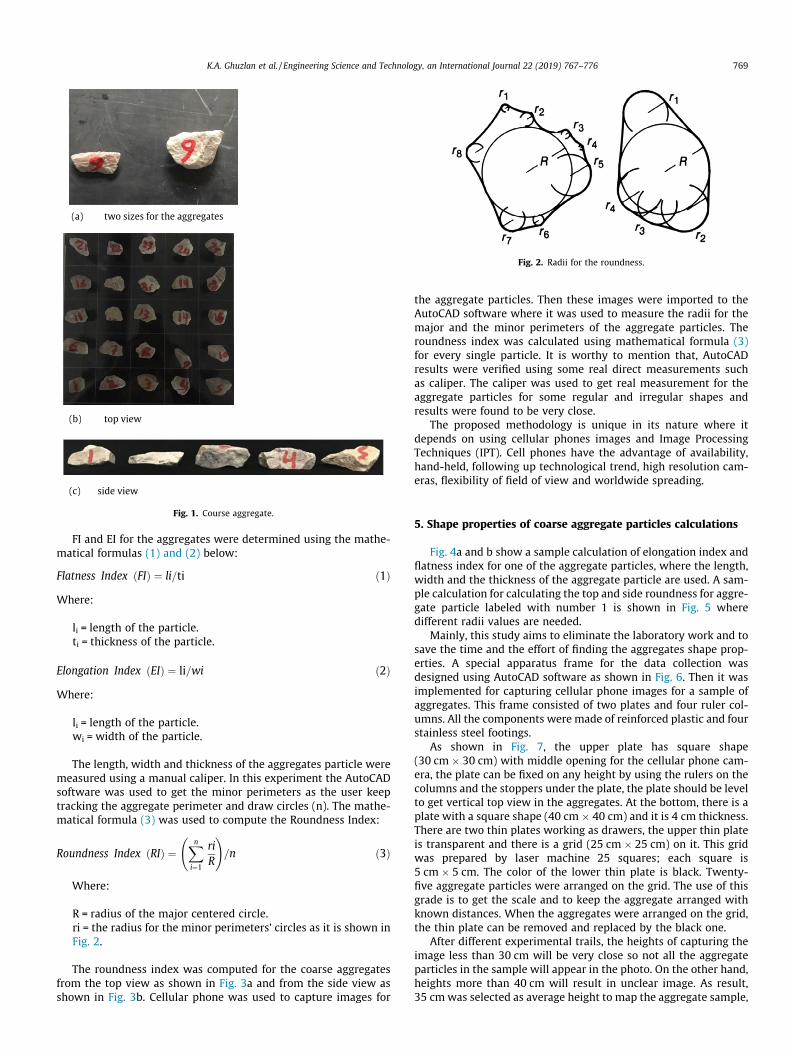
Fig. 2. Radii for the roundness.
K.A. Ghuzlan et al. / Engineering Science and Technology, an International Journal 22 (2019) 767–776 769
FI and EI for the aggregates were determined using the mathe-matical formulas (1) and (2) below:
Flatness Index FIð Þ ¼ li=ti ð1ÞWhere:
li = length of the particle.ti = thickness of the particle.
Elongation Index ðEIÞ ¼ li=wi ð2ÞWhere:
li = length of the particle.wi = width of the particle.
The length, width and thickness of the aggregates particle weremeasured using a manual caliper. In this experiment the AutoCADsoftware was used to get the minor perimeters as the user keeptracking the aggregate perimeter and draw circles (n). The mathe-matical formula (3) was used to compute the Roundness Index:
Roundness Index ðRIÞ ¼Xni¼1
riR
!=n ð3Þ
Where:
R = radius of the major centered circle.ri = the radius for the minor perimeters’ circles as it is shown inFig. 2.
The roundness index was computed for the coarse aggregatesfrom the top view as shown in Fig. 3a and from the side view asshown in Fig. 3b. Cellular phone was used to capture images for
the aggregate particles. Then these images were imported to theAutoCAD software where it was used to measure the radii for themajor and the minor perimeters of the aggregate particles. Theroundness index was calculated using mathematical formula (3)for every single particle. It is worthy to mention that, AutoCADresults were verified using some real direct measurements suchas caliper. The caliper was used to get real measurement for theaggregate particles for some regular and irregular shapes andresults were found to be very close.
The proposed methodology is unique in its nature where itdepends on using cellular phones images and Image ProcessingTechniques (IPT). Cell phones have the advantage of availability,hand-held, following up technological trend, high resolution cam-eras, flexibility of field of view and worldwide spreading.
5. Shape properties of coarse aggregate particles calculations
Fig. 4a and b show a sample calculation of elongation index andflatness index for one of the aggregate particles, where the length,width and the thickness of the aggregate particle are used. A sam-ple calculation for calculating the top and side roundness for aggre-gate particle labeled with number 1 is shown in Fig. 5 wheredifferent radii values are needed.
Mainly, this study aims to eliminate the laboratory work and tosave the time and the effort of finding the aggregates shape prop-erties. A special apparatus frame for the data collection wasdesigned using AutoCAD software as shown in Fig. 6. Then it wasimplemented for capturing cellular phone images for a sample ofaggregates. This frame consisted of two plates and four ruler col-umns. All the components were made of reinforced plastic and fourstainless steel footings.
As shown in Fig. 7, the upper plate has square shape(30 cm � 30 cm) with middle opening for the cellular phone cam-era, the plate can be fixed on any height by using the rulers on thecolumns and the stoppers under the plate, the plate should be levelto get vertical top view in the aggregates. At the bottom, there is aplate with a square shape (40 cm � 40 cm) and it is 4 cm thickness.There are two thin plates working as drawers, the upper thin plateis transparent and there is a grid (25 cm � 25 cm) on it. This gridwas prepared by laser machine 25 squares; each square is5 cm � 5 cm. The color of the lower thin plate is black. Twenty-five aggregate particles were arranged on the grid. The use of thisgrade is to get the scale and to keep the aggregate arranged withknown distances. When the aggregates were arranged on the grid,the thin plate can be removed and replaced by the black one.
After different experimental trails, the heights of capturing theimage less than 30 cm will be very close so not all the aggregateparticles in the sample will appear in the photo. On the other hand,heights more than 40 cm will result in unclear image. As result,35 cmwas selected as average height to map the aggregate sample,
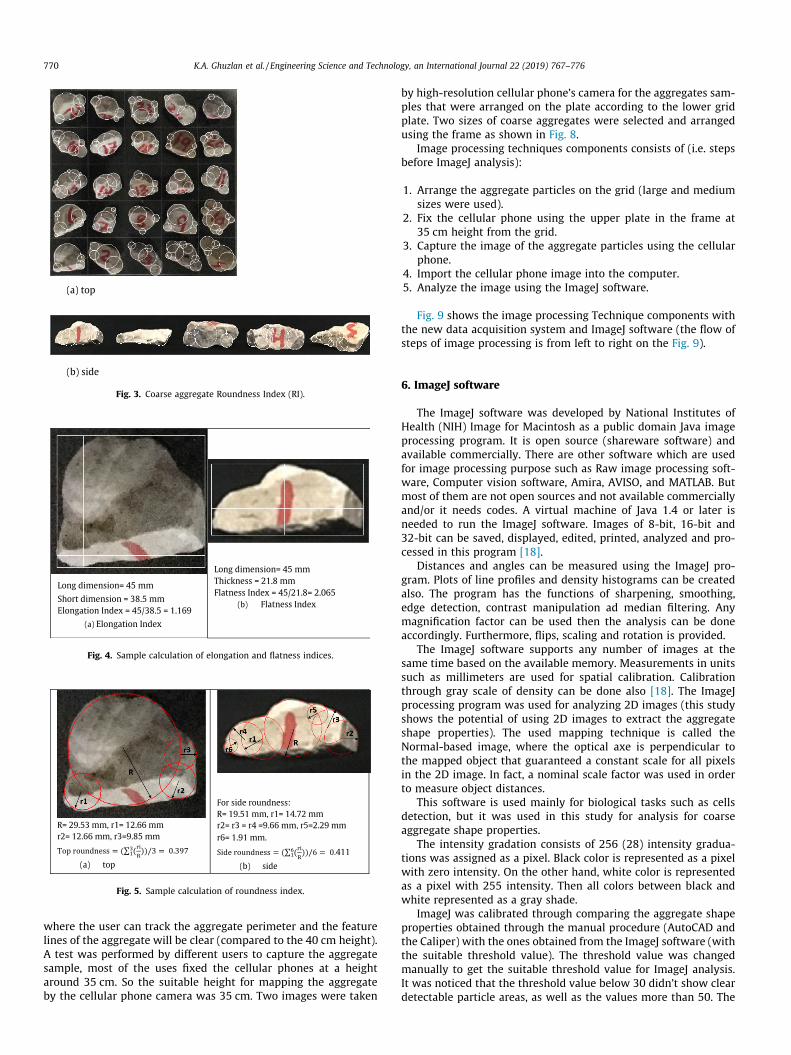
(a) top
(b) side
Fig. 3. Coarse aggregate Roundness Index (RI).
Long dimension= 45 mm
Short dimension = 38.5 mm
Elongation Index = 45/38.5 = 1.169
(a) Elongation Index
Long dimension= 45 mm
Thickness = 21.8 mm
Flatness Index = 45/21.8= 2.065
(b) Flatness Index
Fig. 4. Sample calculation of elongation and flatness indices.
R= 29.53 mm, r1= 12.66 mm
r2= 12.66 mm, r3=9.85 mm
(a) top
For side roundness:
R= 19.51 mm, r1= 14.72 mm
r2= r3 = r4 =9.66 mm, r5=2.29 mm
r6= 1.91 mm.
411
(b) side
Fig. 5. Sample calculation of roundness index.
770 K.A. Ghuzlan et al. / Engineering Science and Technology, an International Journal 22 (2019) 767–776
where the user can track the aggregate perimeter and the featurelines of the aggregate will be clear (compared to the 40 cm height).A test was performed by different users to capture the aggregatesample, most of the uses fixed the cellular phones at a heightaround 35 cm. So the suitable height for mapping the aggregateby the cellular phone camera was 35 cm. Two images were taken
by high-resolution cellular phone’s camera for the aggregates sam-ples that were arranged on the plate according to the lower gridplate. Two sizes of coarse aggregates were selected and arrangedusing the frame as shown in Fig. 8.
Image processing techniques components consists of (i.e. stepsbefore ImageJ analysis):
1. Arrange the aggregate particles on the grid (large and mediumsizes were used).
2. Fix the cellular phone using the upper plate in the frame at35 cm height from the grid.
3. Capture the image of the aggregate particles using the cellularphone.
4. Import the cellular phone image into the computer.5. Analyze the image using the ImageJ software.
Fig. 9 shows the image processing Technique components withthe new data acquisition system and ImageJ software (the flow ofsteps of image processing is from left to right on the Fig. 9).
6. ImageJ software
The ImageJ software was developed by National Institutes ofHealth (NIH) Image for Macintosh as a public domain Java imageprocessing program. It is open source (shareware software) andavailable commercially. There are other software which are usedfor image processing purpose such as Raw image processing soft-ware, Computer vision software, Amira, AVISO, and MATLAB. Butmost of them are not open sources and not available commerciallyand/or it needs codes. A virtual machine of Java 1.4 or later isneeded to run the ImageJ software. Images of 8-bit, 16-bit and32-bit can be saved, displayed, edited, printed, analyzed and pro-cessed in this program [18].
Distances and angles can be measured using the ImageJ pro-gram. Plots of line profiles and density histograms can be createdalso. The program has the functions of sharpening, smoothing,edge detection, contrast manipulation ad median filtering. Anymagnification factor can be used then the analysis can be doneaccordingly. Furthermore, flips, scaling and rotation is provided.
The ImageJ software supports any number of images at thesame time based on the available memory. Measurements in unitssuch as millimeters are used for spatial calibration. Calibrationthrough gray scale of density can be done also [18]. The ImageJprocessing program was used for analyzing 2D images (this studyshows the potential of using 2D images to extract the aggregateshape properties). The used mapping technique is called theNormal-based image, where the optical axe is perpendicular tothe mapped object that guaranteed a constant scale for all pixelsin the 2D image. In fact, a nominal scale factor was used in orderto measure object distances.
This software is used mainly for biological tasks such as cellsdetection, but it was used in this study for analysis for coarseaggregate shape properties.
The intensity gradation consists of 256 (28) intensity gradua-tions was assigned as a pixel. Black color is represented as a pixelwith zero intensity. On the other hand, white color is representedas a pixel with 255 intensity. Then all colors between black andwhite represented as a gray shade.
ImageJ was calibrated through comparing the aggregate shapeproperties obtained through the manual procedure (AutoCAD andthe Caliper) with the ones obtained from the ImageJ software (withthe suitable threshold value). The threshold value was changedmanually to get the suitable threshold value for ImageJ analysis.It was noticed that the threshold value below 30 didn’t show cleardetectable particle areas, as well as the values more than 50. The
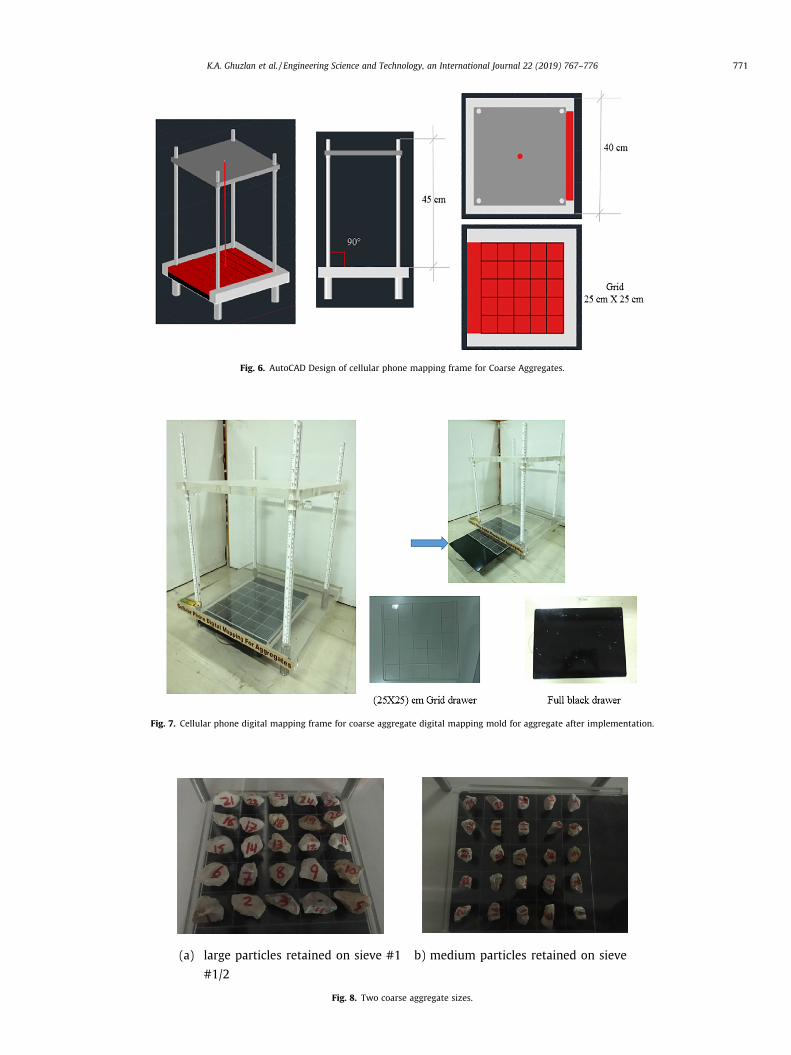
Fig. 6. AutoCAD Design of cellular phone mapping frame for Coarse Aggregates.
Fig. 7. Cellular phone digital mapping frame for coarse aggregate digital mapping mold for aggregate after implementation.
(a) large particles retained on sieve #1 b) medium particles retained on sieve
#1/2
Fig. 8. Two coarse aggregate sizes.
K.A. Ghuzlan et al. / Engineering Science and Technology, an International Journal 22 (2019) 767–776 771
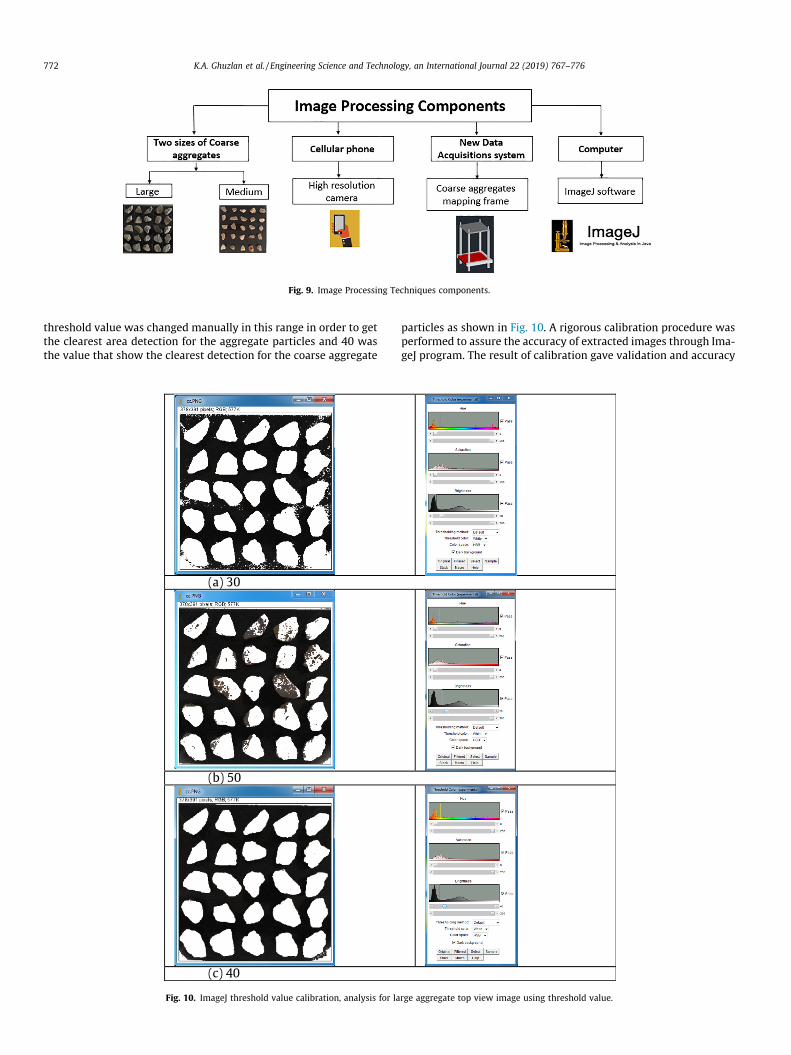
Fig. 9. Image Processing Techniques components.
772 K.A. Ghuzlan et al. / Engineering Science and Technology, an International Journal 22 (2019) 767–776
threshold value was changed manually in this range in order to getthe clearest area detection for the aggregate particles and 40 wasthe value that show the clearest detection for the coarse aggregate
(a) 30
(b) 50
(c) 40
Fig. 10. ImageJ threshold value calibration, analysis for la
particles as shown in Fig. 10. A rigorous calibration procedure wasperformed to assure the accuracy of extracted images through Ima-geJ program. The result of calibration gave validation and accuracy
rge aggregate top view image using threshold value.
K.A. Ghuzlan et al. / Engineering Science and Technology, an International Journal 22 (2019) 767–776 773
above 97% when compared to manual measurements. The bestcaptured images were taken from a height of 35 cm, where the bestresolution was given [19,20].
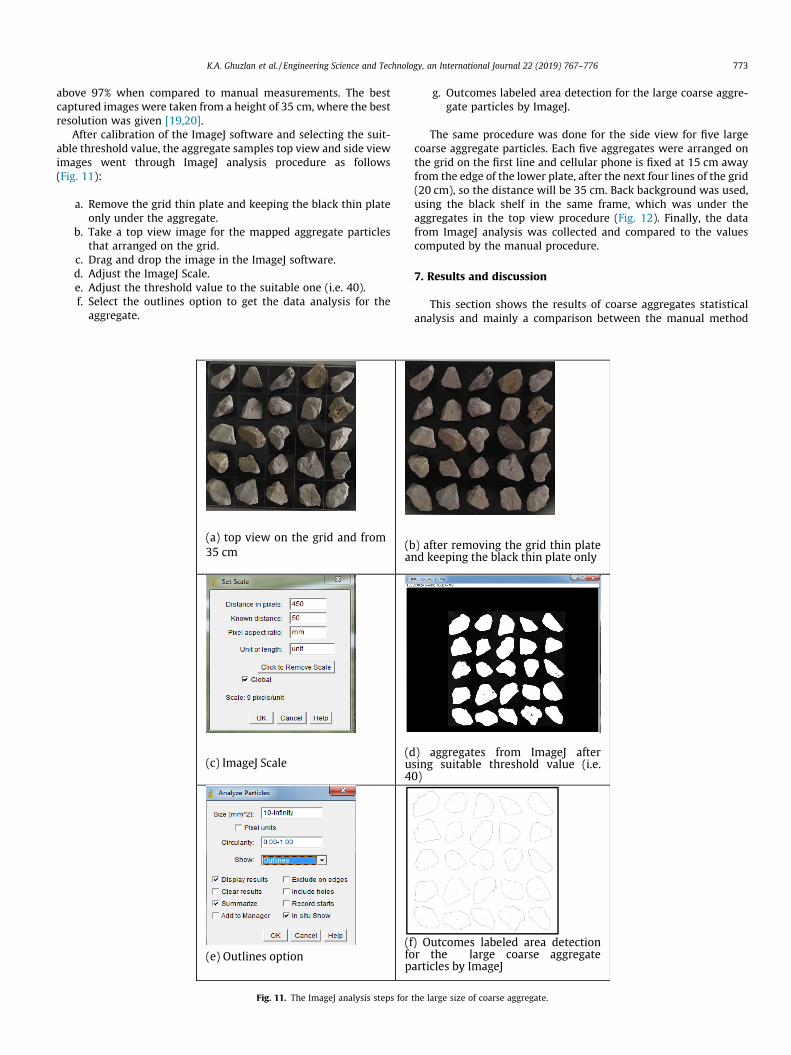
After calibration of the ImageJ software and selecting the suit-able threshold value, the aggregate samples top view and side viewimages went through ImageJ analysis procedure as follows(Fig. 11):
a. Remove the grid thin plate and keeping the black thin plateonly under the aggregate.
b. Take a top view image for the mapped aggregate particlesthat arranged on the grid.
c. Drag and drop the image in the ImageJ software.d. Adjust the ImageJ Scale.e. Adjust the threshold value to the suitable one (i.e. 40).f. Select the outlines option to get the data analysis for the
aggregate.
(a) top view on the grid and from
35 cm(ban
(c) ImageJ Scale(du4
(e) Outlines option
(ffop
Fig. 11. The ImageJ analysis steps for
g. Outcomes labeled area detection for the large coarse aggre-gate particles by ImageJ.
The same procedure was done for the side view for five largecoarse aggregate particles. Each five aggregates were arranged onthe grid on the first line and cellular phone is fixed at 15 cm awayfrom the edge of the lower plate, after the next four lines of the grid(20 cm), so the distance will be 35 cm. Back background was used,using the black shelf in the same frame, which was under theaggregates in the top view procedure (Fig. 12). Finally, the datafrom ImageJ analysis was collected and compared to the valuescomputed by the manual procedure.
7. Results and discussion
This section shows the results of coarse aggregates statisticalanalysis and mainly a comparison between the manual method
) after removing the grid thin plate d keeping the black thin plate only
) aggregates from ImageJ after sing suitable threshold value (i.e. 0)
) Outcomes labeled area detection r the large coarse aggregate
articles by ImageJ
the large size of coarse aggregate.
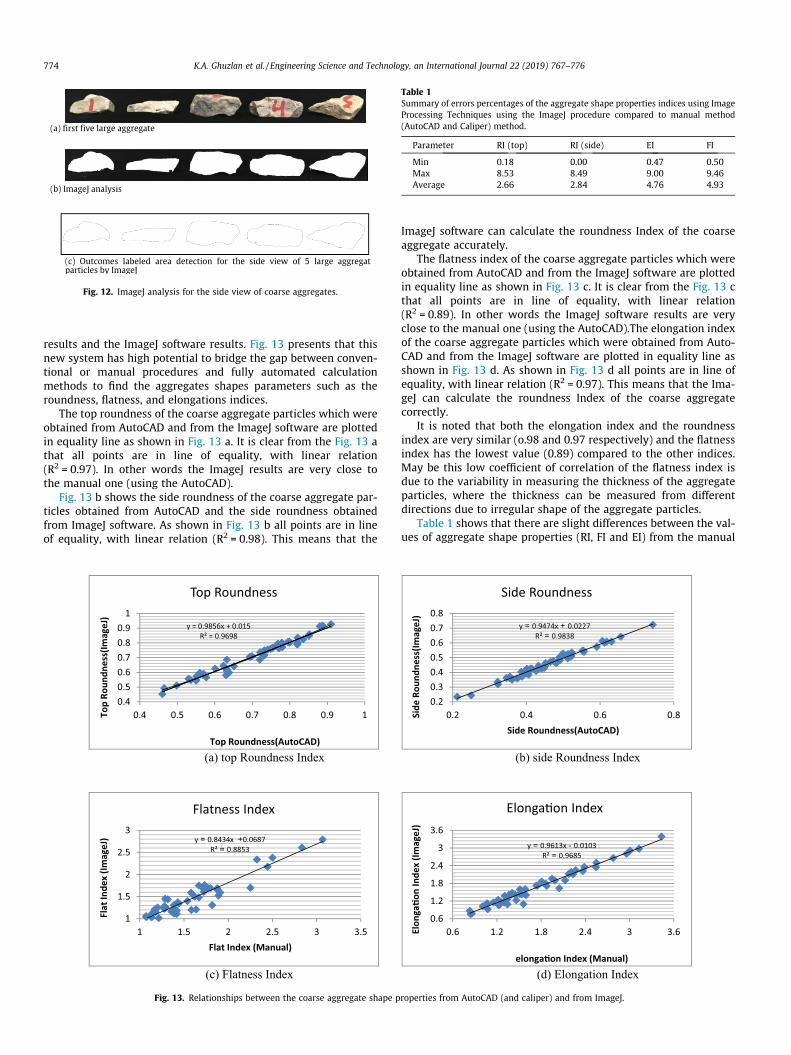
Table 1Summary of errors percentages of the aggregate shape properties indices using ImageProcessing Techniques using the ImageJ procedure compared to manual method(AutoCAD and Caliper) method.
Parameter RI (top) RI (side) EI FI
Min 0.18 0.00 0.47 0.50Max 8.53 8.49 9.00 9.46Average 2.66 2.84 4.76 4.93
(a) first five large aggregate
(b) ImageJ analysis
(c) Outcomes labeled area detection for the side view of 5 large aggregatparticles by ImageJ
Fig. 12. ImageJ analysis for the side view of coarse aggregates.
774 K.A. Ghuzlan et al. / Engineering Science and Technology, an International Journal 22 (2019) 767–776
results and the ImageJ software results. Fig. 13 presents that thisnew system has high potential to bridge the gap between conven-tional or manual procedures and fully automated calculationmethods to find the aggregates shapes parameters such as theroundness, flatness, and elongations indices.
The top roundness of the coarse aggregate particles which wereobtained from AutoCAD and from the ImageJ software are plottedin equality line as shown in Fig. 13 a. It is clear from the Fig. 13 athat all points are in line of equality, with linear relation(R2 = 0.97). In other words the ImageJ results are very close tothe manual one (using the AutoCAD).
Fig. 13 b shows the side roundness of the coarse aggregate par-ticles obtained from AutoCAD and the side roundness obtainedfrom ImageJ software. As shown in Fig. 13 b all points are in lineof equality, with linear relation (R2 = 0.98). This means that the
Fig. 13. Relationships between the coarse aggregate shape p
ImageJ software can calculate the roundness Index of the coarseaggregate accurately.
The flatness index of the coarse aggregate particles which wereobtained from AutoCAD and from the ImageJ software are plottedin equality line as shown in Fig. 13 c. It is clear from the Fig. 13 cthat all points are in line of equality, with linear relation(R2 = 0.89). In other words the ImageJ software results are veryclose to the manual one (using the AutoCAD).The elongation indexof the coarse aggregate particles which were obtained from Auto-CAD and from the ImageJ software are plotted in equality line asshown in Fig. 13 d. As shown in Fig. 13 d all points are in line ofequality, with linear relation (R2 = 0.97). This means that the Ima-geJ can calculate the roundness Index of the coarse aggregatecorrectly.
It is noted that both the elongation index and the roundnessindex are very similar (o.98 and 0.97 respectively) and the flatnessindex has the lowest value (0.89) compared to the other indices.May be this low coefficient of correlation of the flatness index isdue to the variability in measuring the thickness of the aggregateparticles, where the thickness can be measured from differentdirections due to irregular shape of the aggregate particles.
Table 1 shows that there are slight differences between the val-ues of aggregate shape properties (RI, FI and EI) from the manual
roperties from AutoCAD (and caliper) and from ImageJ.
30
20
10
0
10
20
30
0 10 20 30 40 50 60Error%
Aggregate Par�cle Number
Top Roundess Index
30
20
10
0
10
20
30
0 10 20 30 40 50 60Error%
Aggregate Par�cle Number
Side Roundess Index
(a) top Roundness Index (b) side Roundness Index
30
20
10
0
10
20
30
0 10 20 30 40 50 60Error%
Aggregate Par�cle Number
Elonga�on Index
(c) Flatness Index (d) Elongation Index
30
20
10
0
10
20
30
0 10 20 30 40 50 60Error%
Aggregate Par�cle Number
Flatness Index
Fig. 14. Error percentages between Manual Method and the Image Processing Techniques using the ImageJ method for all aggregate particles.
K.A. Ghuzlan et al. / Engineering Science and Technology, an International Journal 22 (2019) 767–776 775
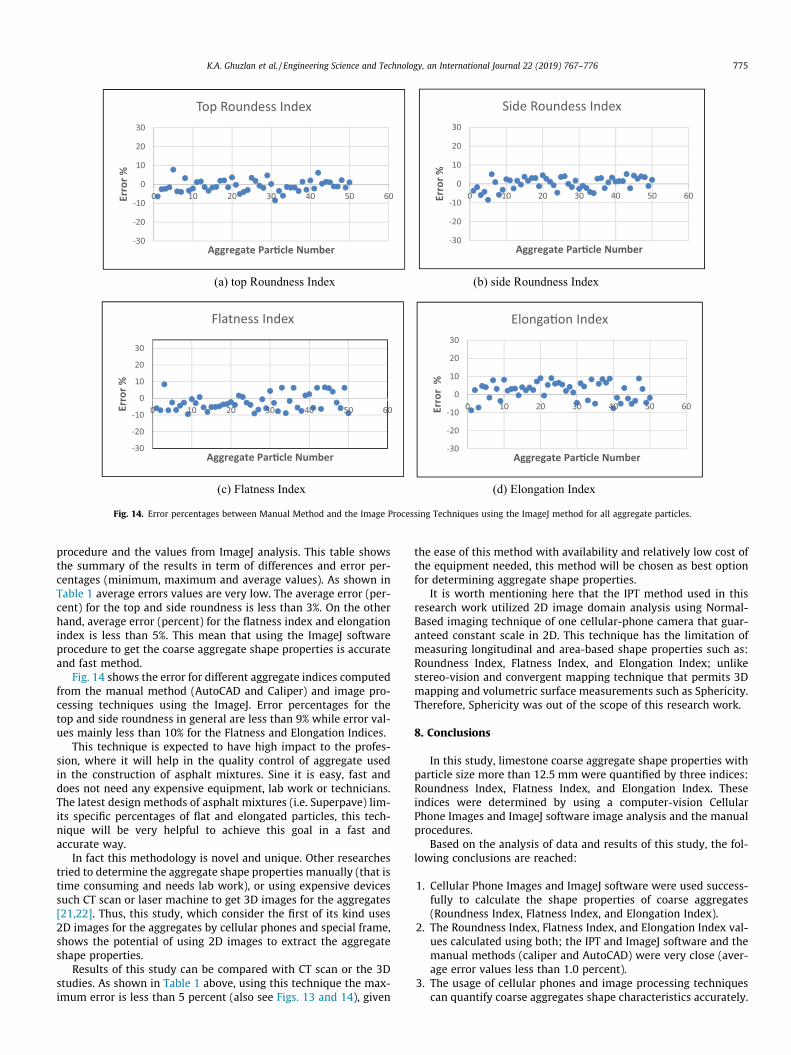
procedure and the values from ImageJ analysis. This table showsthe summary of the results in term of differences and error per-centages (minimum, maximum and average values). As shown inTable 1 average errors values are very low. The average error (per-cent) for the top and side roundness is less than 3%. On the otherhand, average error (percent) for the flatness index and elongationindex is less than 5%. This mean that using the ImageJ softwareprocedure to get the coarse aggregate shape properties is accurateand fast method.
Fig. 14 shows the error for different aggregate indices computedfrom the manual method (AutoCAD and Caliper) and image pro-cessing techniques using the ImageJ. Error percentages for thetop and side roundness in general are less than 9% while error val-ues mainly less than 10% for the Flatness and Elongation Indices.
This technique is expected to have high impact to the profes-sion, where it will help in the quality control of aggregate usedin the construction of asphalt mixtures. Sine it is easy, fast anddoes not need any expensive equipment, lab work or technicians.The latest design methods of asphalt mixtures (i.e. Superpave) lim-its specific percentages of flat and elongated particles, this tech-nique will be very helpful to achieve this goal in a fast andaccurate way.
In fact this methodology is novel and unique. Other researchestried to determine the aggregate shape properties manually (that istime consuming and needs lab work), or using expensive devicessuch CT scan or laser machine to get 3D images for the aggregates[21,22]. Thus, this study, which consider the first of its kind uses2D images for the aggregates by cellular phones and special frame,shows the potential of using 2D images to extract the aggregateshape properties.
Results of this study can be compared with CT scan or the 3Dstudies. As shown in Table 1 above, using this technique the max-imum error is less than 5 percent (also see Figs. 13 and 14), given
the ease of this method with availability and relatively low cost ofthe equipment needed, this method will be chosen as best optionfor determining aggregate shape properties.
It is worth mentioning here that the IPT method used in thisresearch work utilized 2D image domain analysis using Normal-Based imaging technique of one cellular-phone camera that guar-anteed constant scale in 2D. This technique has the limitation ofmeasuring longitudinal and area-based shape properties such as:Roundness Index, Flatness Index, and Elongation Index; unlikestereo-vision and convergent mapping technique that permits 3Dmapping and volumetric surface measurements such as Sphericity.Therefore, Sphericity was out of the scope of this research work.
8. Conclusions
In this study, limestone coarse aggregate shape properties withparticle size more than 12.5 mm were quantified by three indices:Roundness Index, Flatness Index, and Elongation Index. Theseindices were determined by using a computer-vision CellularPhone Images and ImageJ software image analysis and the manualprocedures.
Based on the analysis of data and results of this study, the fol-lowing conclusions are reached:
1. Cellular Phone Images and ImageJ software were used success-fully to calculate the shape properties of coarse aggregates(Roundness Index, Flatness Index, and Elongation Index).
2. The Roundness Index, Flatness Index, and Elongation Index val-ues calculated using both; the IPT and ImageJ software and themanual methods (caliper and AutoCAD) were very close (aver-age error values less than 1.0 percent).
3. The usage of cellular phones and image processing techniquescan quantify coarse aggregates shape characteristics accurately.
776 K.A. Ghuzlan et al. / Engineering Science and Technology, an International Journal 22 (2019) 767–776
Result of this research led to the conclusion that there is a highlypotential of using cellular phone image and image processing tech-nique for compute the coarse aggregate shape indices. This mayopen thedoor fornumerousmacro andmicromensuration andanal-ysis in the fields of bituminous mixtures, traffic engineering, trans-portation engineering, and other Civil Engineering applications.
The potential can most fully be exploited if further research isdirected to the following recommendations:
1. One type of aggregate (limestone) was used, it is recommendedto study other types of aggregate such as basalt.
2. Fine aggregate characterization by image processing were notdiscussed in this research, further research is recommendedfor discovering the potential of cellular phone images andimage processing to find the fine aggregate properties.
3. Further research is recommended for determination the aggre-gates gradation used in the mixtures by using cellular phoneimages and image processing to determine the percentage ofthe passing through or retained aggregates on each sieveaccording to the sieve size.
Acknowledgements
This article is a part of Master Degree Thesis in Civil Engineeringat Jordan University of Science and Technology (JUST); under thesupervision of Prof. Mohammed Taleb Obaidat and co-adviser Dr.Khalid A. Ghuzlan. A full report of the research work can be foundat Alawneh [20] at the College of Graduate Studies at JUST underthe title: ‘‘The Micro-Analysis of Bituminous Mixture Using Cellu-lar Phones and Image Processing Techniques” and this researchwas supported by the deanship of scientific research at JUST(Research No. 154/2015).
References
[1] Y.R. Kim, L.T. Souza, Effects of aggregate angularity on mix designcharacteristics and pavement performance. Final Reports & Technical Briefsfrom Mid-America Transportation Center. 25 MPM-10, 2009.
[2] J.J. Xu, Z.P. Chen, Y. Xiao, C. Demartino, J.H. Wang, Recycled aggregate concretein FRP-confined columns: a review of experimental results, Compos. Struct.174 (2017) 277–291.
[3] Jin-Jun Xu et al., A critical assessment of the compressive behavior ofreinforced recycled aggregate concrete columns, Eng. Struct. 161 (2018)161–175.
[4] T. Al-Rousan, E. Masad, E. Tutumluer, T. Pan, Evaluation of image analysistechniques for quantifying aggregate shape characteristics, Constr. Build.
Mater. 21 (5) (2007) 978–990, https://doi.org/10.1016/j.conbuildmat.2006.03.005.
[5] E.R. Brown, P.S. Kandhal, F.L. Roberts, Y.R. Kim, D.Y. Lee, and T.W. Kennedy."Hot mix asphalt materials, mixture design, and construction." NAPA Researchand Education Foundation, 2009.
[6] E. Tutumluer, T. Pan, S.H. Carpenter, Investigation of aggregate shape effects onhot mix performance using an image analysis approach. UILU-ENG-2005-2003,2005.
[7] L. Tashman, L. Wang, S. Thyagarajan, Microstructure characterization formodeling HMA behaviour using imaging technology, Road Mater. PavementDes. 8 (2) (2007) 207–238, https://doi.org/10.1080/14680629.2007.9690073.
[8] S. Arasan, A.S. Hasiloglu, S. Akbulut, Shape properties of natural and crushedaggregate using image analysis, Int. J. Civil Struct. Eng. 1 (2) (2010) 221–233,https://doi.org/10.6088/ijcser.00202010018.
[9] ASTM, D., 4791, Standard Test Method for Flat particles, Elongated Particles, orFlat and Elongated Particles in Coarse Aggregate. In American Society forTesting and Materials, 1999
[10] C. Rao, T. Pan, E. Tutumluer, Determination of coarse aggregate surface textureusing image analysis, 16th ASCE Engineering Mechanics Conference,University of Washington, Seattle, 2003.
[11] S.S. Jamkar, C.B.K. Rao, Index of aggregate particle shape and texture of coarseaggregate as a parameter for concrete mix proportioning, Cem. Concr. Res. 34(11) (2004) 2021–2027, https://doi.org/10.1016/j.cemconres.2004.03.010.
[12] N.H. Maerz, M. Lusher, Measurement of flat and elongation of coarse aggregateusing digital image processing, Transportation Research Board 80th AnnualMeeting, 2001.
[13] R.L. Weingart, B.D. Prowell, Flat and elongated aggregate tests: can the VDG-40videograder deliver the needed precision for particle shape and determinationand be economically viable?, Stone Rev (1998) 20–23.
[14] M. Moaveni, S. Wang, J. Hart, E. Tutumluer, N. Ahuja, Evaluation of aggregatesize and shape by means of segmentation techniques and aggregate imageprocessing algorithms, Transp. Res. Record: J. Transp. Res. Board 2335 (2013)50–59, https://doi.org/10.3141/2335-06.
[15] G.H.A. Kumara, K. Hayano, K. Ogiwara, Image analysis techniques onevaluation of particle size distribution of gravel, Int. J. Geomate 3 (1) (2012)290–297. ISSN:2186–2982(P), 2186–2990(O).
[16] S. Arasan, S. Akbulut, A.S. Hasiloglu, Effect of particle size and shape on thegrain-size distribution using Image analysis, Int. J. Civil Struct. Eng. 1 (4)(2011) 968–985, https://doi.org/10.6088/ijcser.00202010083.
[17] J. Breytenbach, J.K. Anochie-Boateng, P. Paige-Green, J.L. Van Rooy, Laser-basedassessment of road aggregate particle shape and texture properties with theaim of deriving comparative models, J. South African Inst. Civil Eng. 55 (3)(2013) 30–35. 3D scanning.
[18] W. Bailer, Writing ImageJ Plugins—A Tutorial, Upper Austria University ofApplied Sciences, Austria, 2006.
[19] M.T. Obaidat, K.A. Ghuzlan, M.M. Alawneh, Analysis of volumetric properties ofbituminous mixtures using cellular phones and image processing techniques,Can. J. Civ. Eng. 44 (9) (2017) 715–726, https://doi.org/10.1139/cjce-2017-0085.
[20] M.M. Alawneh, Micro-analysis of bituminous mixture using cellular phonesand image processing techniques MSc thesis, Jordan University of Science &Technology, Irbid, Jordan, 2016.
[21] C. Jin, X. Yang, Z. You, K. Liu, Aggregate shape characterization using virtualmeasurement of three-dimensional solid models constructed from X-Ray CTimages of aggregates, J. Mater. Civ. Eng. 30 (3) (2018) 04018026.
[22] J. Wu, L. Wang, Y. Hou, H. Xiong, Y. Lu, L. Zhang, A digital image analysis ofgravel aggregate using CT scanning technique, Int. J. Pavement Res. Technol. 11(2) (2018) 160–167.