Embed Size (px)
Citation preview

CELLULAR FUNCTIONS OF DNA GYRASE AND CONDITIONAL GENE REGULATION IN THE MALARIA PARASITE Plasmodium falciparum
By
TONYA DAVIDIAN BONILLA
A DISSERTATION PRESENTED TO THE GRADUATE SCHOOL OF THE UNIVERSITY OF FLORIDA IN PARTIAL FULFILLMENT
OF THE REQUIREMENTS FOR THE DEGREE OF DOCTOR OF PHILOSOPHY
UNIVERSITY OF FLORIDA
2008
1

© 2008 Tonya Davidian Bonilla
2

ACKNOWLEDGMENTS
I sincerely thank my major advisor Dr. John Dame for providing me with the opportunity,
resources, and support in which to conduct this work. I thank Dr. Dame for providing
mentorship, thoughtful scientific discussions, and for his enthusiasm and dedication to malaria
research. I also thank Dr. Dame for encouraging me to find independence as a researcher.
I extend the deepest gratitude to my husband Dr. Fred Bonilla for his mentorship in the
laboratory, and for working with me on numerous technical procedures. I thank Fred for his
excellent insight, thoughtful scientific discussions, and moral support throughout the years.
I gratefully thank my supervisory committee (Dr. David Allred, Dr. Anthony Barbet, Dr.
Ken Cline, and Dr. Tom Rowe) for contributing their time and expertise in guiding my research,
and for encouraging my growth as a scientist. I also thank Mr. Charles Yowell for providing
technical assistance and laboratory support.
3

TABLE OF CONTENTS page
ACKNOWLEDGMENTS ...............................................................................................................3
LIST OF TABLES...........................................................................................................................9
LIST OF FIGURES .......................................................................................................................10
ABSTRACT...................................................................................................................................13
CHAPTER
1 INTRODUCTION ..................................................................................................................15
Malaria Overview ...................................................................................................................15 Plasmodium Lifecycle ............................................................................................................16 The Apicoplast........................................................................................................................18
Origin of the Apicoplast ..................................................................................................18 The Apicoplast Genome ..................................................................................................19 Replication of the Apicoplast Genome............................................................................21 Protein Targeting to the Apicoplast.................................................................................21 Apicoplast Division .........................................................................................................22 Functions of the Apicoplast.............................................................................................25 Apicoplast as a Drug Target ............................................................................................26
DNA Gyrase ...........................................................................................................................29 Functions of the Bacterial Type II Topoiomserase .........................................................29 The type II Topoisomerase Reaction...............................................................................30 Inhibitors of Type II Topoisomerase...............................................................................31 Characterization of the Plasmodium DNA Gyrase .........................................................33
Conditional Gene Regulation .................................................................................................34 Study Rational and Specific Objectives .................................................................................36 Hypothesis ..............................................................................................................................37 Specific Aims..........................................................................................................................37
2 MATERIALS AND METHODS ...........................................................................................39
Parasite Culture.......................................................................................................................39 Synchronization of Asexual Parasite Stages...........................................................................39
Sorbitol Method...............................................................................................................39 Percoll / Sorbitol Density Gradient Centrifugation .........................................................39 Magnetic Isolation ...........................................................................................................40
Parasite Transfection ..............................................................................................................41 Direct Electroporation Method........................................................................................41 RBC-loading Method ......................................................................................................41
Drug Assays............................................................................................................................42 Parasitemia Counts ..........................................................................................................42
4

Parasite Growth Inhibition Measured by [3H]-hypoxanthine Incorporation...................43 Parasite Proliferation Rate by Flow Cytometry...............................................................43
Derivation of Plasmid Constructs...........................................................................................44 Southern Blot Analysis ...........................................................................................................45 Northern Blot Analysis ...........................................................................................................46 Western Blot Analysis ............................................................................................................46 Quantitative PCR and Quantitative Reverse-Transcriptase PCR ...........................................47 Fluorescent In Situ Hybridization (FISH) ..............................................................................48 Combined FISH / IFA ............................................................................................................49 FISH Probe Synthesis .............................................................................................................51 Production of DNA Gyrase Antibody ....................................................................................51 Immunoprecipitation of DNA.................................................................................................52
3 RESULTS ...............................................................................................................................61
Drug Studies ...........................................................................................................................61 Effect of DNA Gyrase Inhibitors on Parasite Proliferation.............................................61 Effects of Ciprofloxacin on Parasite Proliferation, Growth, and Viability .....................61
Organelle Genome Copy Number and DNA Loss with Drug Treatment ..............................62 Apicoplast and Mitochondrial Genome Copy Number...................................................62 Effects of Ciprofloxacin Treatment on Organellar DNA Replication.............................63 Effects of Ciprofloxacin on Organellar DNA Transcription...........................................64
Drug-induced Cleavage ..........................................................................................................65 Immunoprecipitation of DNA.................................................................................................66 Organellar DNA Segregation .................................................................................................67
Visualization of Apicoplast and Mitochondrial DNAs during Asexual Parasite Development ................................................................................................................67
Effects of Ciprofloxacin Treatment on Organellar DNA Division .................................67 Visualization of the Apicoplast and Apicoplast DNA during Asexual Parasite
Development ................................................................................................................68 Effects of Ciprofloxacin on the Apicoplast and Apicoplast DNA ..................................69
Conditional Gene Regulation .................................................................................................69 Analysis of Parasites Transformed with pTGPI-GFP .....................................................69 Targeted Genomic Insertion of the Tet-Operator / Min Cam Promoter..........................71 Creation and Characterization of the TA Parasite Lines .................................................71 Creation and Characterization of the C3-TA Parasite Line.............................................72
Summary of Conditional Gene Regulation Findings..............................................................74
4 DISCUSSION.......................................................................................................................120
DNA Gyrase and Apicoplast Studies ...................................................................................120 Conditional Gene Regulation ...............................................................................................131 Conclusions...........................................................................................................................138
APPENDIX
A PHYLOGENETIC ANALYSIS OF GYRA AND PARC...................................................140
5

B PHYLOGENETIC ANALYSIS OF TOPO III ....................................................................142
C CLUSTAL-W ALIGNMENT OF Plasmodium PEND-LIKE HOMOLOGUES................143
LIST OF REFERENCES.............................................................................................................144
BIOGRAPHICAL SKETCH .......................................................................................................160
6

LIST OF ABBREVIATIONS
ATc anhydrotetracyline
BDS blasticidin deaminase
C3 pTOCAM-∆pm4 transformant clone C3
C3TA-B1 pTOCAM-∆pm4 transformant clone C3 with piggyBac transposase-mediated insertion of the tati2 expression cassette using pGYBSD-TA
DAPI 4,6-diamidino-2-phenylindol
FACS fluorescence activated cell sorting
FISH fluorescent in situ hybridization
FISH/IFA fluorescent in situ hydridization / immunofluorescence assay
GFP green fluorescent protein
hDHFR human di-hydrofolate reductase
IP immunoprecipitation
K+-SDS potassium chloride / sodium dodecyl sulfate
Min. cam. minimal calmodulin promoter
PBS phosphate-buffered saline
PCR polymerase chain reaction
qPCR quantitative polymerase chain reaction
qRT-PCR quantitative reverse transcriptase polymerase chain reaction
TA-01 culture transformed with pGYBSD-TA using the piggyBac transformation system
TA-02 culture transformed with pGYBSD-TA using the piggyBac transformation system
TATK-03 culture transformed with pGYBSD-TATK using the piggyBac transformation system
TATK-04 culture transformed with pGYBSD-TATK using the piggyBac transformation system
7

TaTi2 transactivator
TetO tetracycline-inducible operator
VM-26 podophyllotoxin derivative tenoposide
VP-16 podophyllotoxin derivative etoposide
WR99210 Walter Reed compound 99210
8
LIST OF TABLES
Table page 3-1 Results of SDS/KCl precipitation from 3 different experiments listing the fold
enrichment of gene targets in drug treated parasites relative to controls...........................89
3-2 Fold enrichment of apicoplast and mitochondrial DNA gene targets relative to control DNA after VM26 treatment and immunoprecipitation with GyrA antibody ........89
3-3 Fold enrichment of apicoplast and mitochondrial DNA gene targets relative to control DNA after ciprofloxacin treatment and immunoprecipitation with GyrA antibody..............................................................................................................................89
9

LIST OF FIGURES
Figure page 2-1 Map of the 34,682 bp (‘35’ kb) Plasmodium falciparum apicoplast DNA. .....................55
2-2 Plasmid map of pTGPI-GFP ............................................................................................56
2-3 Plasmid map of pTOCAM-∆pm4.. ...................................................................................57
2-4 Plasmid maps of pGYBSD-TATK and pGYBSD-TA.. ...................................................58
2-5 Agarose gel electrophoresis of the PCR amplicons generated from the quantitative PCR (qPCR) primer and probe sets ...................................................................................59
2-6 Schematic representations of genomic loci containing Tet-transactivator elements ........60
3-1 Dosage-dependent response of P. falciparum proliferation in in vitro culture to DNA gyrase inhibitors using [3H]-hypoxanthine uptake assays. ...............................................76
3-2 Proliferation of parasites cultured in complete media with different concentrations of ciprofloxacin.. ....................................................................................................................77
3-3 Developmental delay in parasites treated with 5 µg/ml ciprofloxacin. ............................78
3-4 Parasite differentiation in untreated control cultures and cultures treated with 5 µg/ml ciprofloxacin............................................................................................................79
3-5 Apicoplast 35kb genome copy number determined by the ratio of apicoplast and nuclear DNA using quantitative PCR. ...............................................................................80
3-6 Copy number of apicoplast and mitochondrial DNA with and without ciprofloxacin treatment.. ..........................................................................................................................81
3-7 Analysis of nuclear, apicoplast, and mitochondrial DNA replication ..............................82
3-8 Selective loss of plastid DNA in P. falciparum cultures treated with ciprofloxacin determined by southern blot hybridization.. ......................................................................83
3-9 Effects of ciprofloxacin treatment on apicoplast RNA.....................................................84
3-10 Effect of ciprofloxacin treatment on mitochondrial RNA.. ..............................................85
3-11 Map of restriction enzyme sites used for cleavage analysis. ............................................86
3-12 DNA cleavage analysis of the apicoplast 35 kb DNA......................................................87
3-13 Analysis of the apicoplast 35 kb DNA inverted repeat topology. ....................................88
10

3-14 Morphology of the apicoplast in asexual stages of P. falciparum.. ..................................90
3-15 Morphology of the mitochondrion in asexual stages of P. falciparum.............................91
3-16 Analysis of apicoplast DNA segregation by fluorescence in situ hybridization (FISH). ...............................................................................................................................92
3-17 Analysis of mitochondrial DNA by fluorescence in situ hybridization............................93
3-18 Effects of ciprofloxacin on apicoplast and mitochondrial DNAs detected by FISH.. ......94
3-19 Visualization of the apicoplast DNA and the apicoplast in asexual stages of P. falciaprum by combined FISH / IFA.. ...............................................................................95
3-20 Combined FISH / IFA on control 24 h parasites.. ............................................................96
3-21 Combined FISH / IFA on control 72 h parasites.. ............................................................97
3-22 Combined FISH / IFA on ciprofloxacin treated parasites at 24 h.....................................98
3-23 Combined FISH / IFA on ciprofloxacin treated parasites at 72 h.....................................99
3-24 GFP expression in P. falciparum cells stably transformed with pTGPI-GFP. . ............100
3-25 Induction of GFP expression in a P. falciparum culture stably transformed with pTGPI-GFP.. ....................................................................................................................101
3-26 Counts of GFP expressing cells after the addition of ATc determined by flow cytometry.. .......................................................................................................................102
3-27 Analysis of plasmid copy number in parasites transformed with pTGPI-GFP. .............103
3-28 Southern blot analysis of transfectant pTOCAM-∆pm4.................................................104
3-29 PCR verification of the integration of the TetO/min cam promoter upstream of full length pfpm4 in uncloned cultures.. .................................................................................105
3-30 Flow cytometry results for a 264 hr growth study for wild type 3D7 and pTOCAM-∆pm4 clones B3 and C3. ................................................................................................106
3-31 Western blot analysis of PfPM4 protein expression in pTOCAM-∆pm4 clones.. .........107
3-32 Genomic integration of transactivator expression cassettes using piggyBac-mediated transformation.. ................................................................................................................108
3-33 Expression of transactivator (TaTi2) protein in piggyBac transformants by western blot.. .................................................................................................................................109
11

3-34 Analysis of piggyBac transformants TA-01 and TA-02 for transactivator expression cassette integration...........................................................................................................110
3-35 Western blot analysis of TaTi2 expression in TA-01 and TA-02 parasites....................111
3-36 Southern blot analysis of piggyBac insertion sites in culture C3TA.. ............................112
3-37 Analysis of protein regulation in C3TA-B1 cultured in the absence and presence of ATc.. ................................................................................................................................113
3-38 Analysis of steady-state pfpm4 RNA transcripts by qRT-PCR.. ....................................114
3-39 Analysis of steady-state pfpm4 3’ RNA and tati2 RNA by quantitative RT-PCR.. ......115
3-40 Southern blot analysis of the number of plasmid integrations in clones of pTOCAM-∆pm4 and C3TA.. ............................................................................................................116
3-41 Western blot analysis of PfPM1 and FP3 expression in C3TA washout experiments.. .117
3-42 Analysis of steady-state pfpm4 5’ and 3’RNA transcripts in 3D7 and pTOCAM-∆pm4 clone C3 by northern blot.. ....................................................................................118
3-43 Analysis of pfpm4 and tati2 RNA transcripts in 3D7, C3, and C3TA-B1 by northern blot.. .................................................................................................................................119
12

Abstract of Dissertation Presented to the Graduate School of the University of Florida in Partial Fulfillment of the Requirements for the Degree of Doctor of Philosophy
CELLULAR FUNCTIONS OF DNA GYRASE AND CONDITIONAL GENE REGULATION
IN THE MALARIA PARASITE Plasmodium falciparum
By
Tonya Davidian Bonilla
August 2008
Chair: John B. Dame Major: Veterinary Medical Sciences
Malaria is among the greatest disease threats to global public health. As part of the effort to
combat the disease, the development of new anti-malarials remains imperative. The causative
agent of malaria is a parasitic pathogen of the genus Plasmodium which is transmitted to humans
through the bite of an anopheline mosquito. The parasite contains a relic, non-photosynthetic
plastid (called the apicoplast) of red algal origin that was acquired by an ancestral form through a
secondary endosymbiotic event. The apicoplast supports critical biosynthetic processes in the
parasite that are divergent from the equivalent host pathway, providing substantial opportunity
for the identification of possible drug targets. The Plasmodium DNA gyrase is a eubacterial type
II topoisomerase that is expected to function within the apicoplast, with a principal role in
regulating the topological transitions of the 35 kb circular apicoplast genome. In this study, the
anti-bacterial ciprofloxacin was used to probe the cellular functions of DNA gyrase. For further
characterization of enzyme functions, transgenic parasites were generated to develop a system
for conditional gene regulation. Results from this study indicated that targeting DNA gyrase with
ciprofloxacin inhibited the replication of apicoplast DNA and the accumulation of apicoplast
RNA transcripts, and blocked the production of apicoplast ribosomal RNA. The apicoplast
nucleoid appeared reduced in size and did not segregate normally, and the apicoplast displayed
13

abnormal morphology. In contrast, mitochondrial DNA replication, transcription, and
segregation were unaffected. The DNA gyrase appeared to associate with the apicoplast DNA at
non-specific loci, implicating numerous functional roles for the enzyme. Results from the
conditional gene regulation studies indicated that the Tet-transactivator system has potential
applicability for controlling endogenous gene expression in P. falciparum. Artificial promoters
were successfully targeted to the pfpm4 genomic locus, and piggyBac insertion of transactivator
(TaTi2) expression cassettes resulted in stable TaTi2 expression. In washout studies, the
temporal pattern of pfpm4 RNA expression closely followed the expression of tati2. In the
induced state of target transgene expression the steady-state TaTi2 levels decreased, a
phenomenon that will be further investigated.
14

CHAPTER 1 INTRODUCTION
Malaria Overview
Malaria is among the greatest disease threats to global public health. Every year
an estimated 300-500 million episodes of malaria-related illness result in 700,000 –
2,700,000 deaths (National Center for Infectious Diseases 2004). Malaria is caused by
infection with the protozoan pathogen Plasmodium and is transmitted to humans by
anopheline mosquitoes (Tuteja 2007). There are over 100 identified species of
Plasmodium that infect diverse vertebrate life forms, including five species (P. malariae,
P. ovale, P. vivax, P. falciparum and P. knowlesi) that infect humans (CDC, Tuteja 2007,
White 2008). Ongoing endeavors to combat disease transmission include promoting the
use of insecticide-treated bed nets, increasing the application of potent insecticides,
improving water quality, and advancing social welfare and healthcare infrastructure
(Chareonviriyaphap et al. 2000, Tseng et al. 2008). Also, substantial effort has been
directed toward developing a vaccine for malaria (Vekemans and Ballou 2008). Some
vaccine candidates show promise in terms of reducing the severity of disease, however
protection rates are low and vaccination has not induced long-term immunity (Maher
2008).
With the emergence of multi-drug resistant parasites, the treatment of infection
with antimalarial drugs remains a challenge (van Es et al. 1993, Choi et al. 2008).
Resistance to the former first-line anti-malarial chloroquine, and the rapid loss in the
effectiveness of its replacement compound sulphadoxine-pyrimethamine had devastating
consequences for malaria endemic regions (White et al. 1999, Snow et al. 2001, Kublin et
al. 2002, Pickard et al. 2003, Sumawinata et al. 2003). Artemisinin-based combination
15

therapies (ACTs) are now widely used as a first-line anti-malarials and show great
promise for reducing malaria-related morbidity and mortality over the years to come
(Greenwood et al. 2008). However, the clinical failure of ACTs due to development of
resistance to the partner drug has been documented, and there are rising concerns about
artemisinin toxicity (Greenwood et al. 2008).
The global eradication of malaria is the ultimate goal of all the endeavors aimed at
preventing transmission, protecting against infection, and curing illness. As a part of this
effort, the development of new anti-malarials remains a high priority.
Plasmodium Lifecycle
Successful completion of the Plasmodium lifecycle requires passage through both
a vertebrate and invertebrate host where the parasite undergoes dramatic metamorphoses
into various distinctive, specialized forms. The deadliest of the human malaria parasites,
Plasmodium falciparum, initiates infection of its human host through the bite of an
infected anopheline mosquito. Parasites in the form of sporozoites are deposited into the
human dermis where they enter the circulatory system through blood vessels in the skin
(Ponnudurai et al. 1982). Within 30 minutes the sporozoites amass in the liver for the
exoerythrocytic stage of development, transiting through Kupffer cells ultimately residing
in hepatocytes (Druilhe et al. 1982, Kappe et al. 2003). Each sporozoite replicates
intracellularly within the hepatocyte by schizogony, forming thousands of merozoites
(Mazier et al. 1983). Between 6-16 days post inoculation, hepatocytes rupture and release
merosomes containing aggregates of merozoites that are released into the blood where
they invade mature erythrocytes to initiate the asexual blood-stage of infection (Mazier et
al. 1990). The parasite enters a vegetative trophozoite stage where it begins to degrade
hemoglobin, eventually consuming ~ 70 % of the hemoglobin within in infected
16
erythrocyte (Lew et al. 2003). The parasite then enters a replicative phase where nuclear
chromosomes undergo 3-5 mitotic replications by schizogony, producing multiple
discrete nuclei that emerge approximately 30-40 hours post erythrocytic invasion.
Schizogony is culminated around 44 hours post invasion by the formation of 8-32
daughter merozoites. Newly formed merozoite progeny rupture from the schizont and
rapidly invade fresh host erythrocytes to repeat the cycle of asexual multiplication
(Pinder et al. 2000). Concurrent with the asexual cycle, a small subset of P. falciparum
parasites suspends mitotic division and enters an alternative pathway of differentiation to
form sexual stage gametocytes (Smalley et al. 1981). There are five recognized stages of
gametogenesis that develop within 8-17 days and result in the formation of male (micro)
and female (macro) gamete precursors (Day et al. 1998). During a blood meal,
gametocytes are extracted from the human host by an anopheline mosquito (Lensen
1996). In the mosquito gut the gametocytes differentiate into male and female gametes,
and in the case of male gamete formation, additional mitotic replications occur rapidly in
the mosquito gut to produce up to 8 flagellated cells (Mendis et al. 1994). The male
gamete fertilizes the female gamete to produce a diploid zygote which elongates to form
an ookinete (Carter and Kaushal 1984). The ookinete burrows through the mosquito mid-
gut wall and attaches to the outside of the basil epithelium where it undergoes multiple
rounds of mitotic division during development of the oocyst (Vinetz 2005). The oocyst
becomes filled with thousands of haploid sporozoites (Carter et al. 2007), and finally the
sporozoites rupture from the oocyst and migrate through hemolymph to the mosquito
salivary glands, where they are poised to infect another human host (Ponnudurai et al.
1989, Vaughan et al. 1994, Al-Olayan et al. 2002).
17

The Apicoplast
Origin of the Apicoplast
Plasmodium falciparum contains a relic, non-photosynthetic plastid (McFadden et
al. 1996) (called the apicoplast) of red algal origin that was acquired by an ancestral form
through a secondary endosymbiotic event (Fast et al. 2001). Plastids are derived from a
primary endosymbiotic event where a phagotrophic eukaryote engulfed a photosynthetic
cyanobacterium (Gray 1993, Delwiche et al. 1995). In the case of apicomplexans, a
secondary endosymbiosis occurred where a eukaryotic phagotroph engulfed a eukaryotic
cell of the red algal lineage (Delwiche 1999, McFadden 1999, McFadden and van Dooren
2004). The apicomplexan lineages (Coccidia, Haemosporida, Gregarinia, and
Piroplasma) are believed to have a single origin, all evolving from the same secondary
endosymbiotic event (McFadden and Waller 1997). Furthermore, phylogenic analysis
suggests that all alveolates (apicomplexans, dinoflagellates, and ciliates) together with
the chromists (heterokonts), haptophytes, and cryptophytes evolved from the same
heterotrophic ancestor giving rise to all members of the supergroup chromalveolata
(Cavalier-Smith 1999, Fast et al. 2001). In apicomplexans, the 4 membranes bounding
the apicoplast attest to these evolutionary events (Kohler et al. 1997, McFadden and Roos
1999, Diniz et al. 2000), with each having a distinct evolutionary origin (Cavalier-Smith
2000). The innermost 2 membranes bounding the apicoplast stroma are derived from the
cyanobacterial envelope, the third bounding membrane is derived from the endosymbiont
plasma membrane, and the fourth bounding membrane is derived from the host
phagosome membrane (Cavalier-Smith 2000).
18
The Apicoplast Genome
The genome of Plasmodium falciparum is comprised of 14 nuclear chromosomes,
a tandemly repeated 6 kb mitochondrial DNA, and a circular 35 kb apicoplast DNA
(Gardner et al. 1988, Suplick et al. 1988, Feagin 1994, Wilson et al. 1996, Wilson and
Williamson 1997, Gardner et al. 2002). The nuclear genome undergoes genetic
recombination during diploid stages of the parasite lifecycle, whereas both the
mitochondrial and apicoplast DNA genomes are inherited directly from the female
gamete (Creasey et al. 1993, Vaidya et al. 1993).
The content and arrangement of genes encoded by the Plasmodium and
Toxoplasma 35 kb apicoplast genomes are nearly identical (Williamson et al. 2001).
However, the genome topology and the primary modes for apicoplast DNA replication
differ. In Plasmodium the apicoplast DNA is present as covalently closed circles and is
replicated by a twin displacement-loop (D-loop) mechanism (Williamson et al. 2002). In
Toxoplasma the apicoplast DNA is arranged in linear tandem arrays that occur in
multiples of one to twelve, which are the result of a rolling circle mode of DNA
replication (Williamson et al. 2001). The ends of the linear Toxoplasma 35 kb DNA
molecules begin and terminate within the center region of the inverted repeat
(Williamson et al. 2001).
Through evolution, the plastid genome was drastically reduced as the initial
cyanobacterial endosymbiont, followed by the secondary algal endosymbiont, lost
autonomy and became an organelle. Plastid genes were either transferred to the host cell
nucleus, replaced by a host cell homologue, or lost if the gene no longer conferred a
selective advantage (Martin and Schnarrenberger 1997, Delwiche 1999). Today, the 35
kb apicoplast genome primarily encodes genes required for protein translation and RNA
19

transcription (Wilson et al. 1996). There are 2 copies each of SSU and LSU rRNAs, 25
tRNAs, 17 ribosomal proteins, the elongation factor tufA, and subunits B, C1, and C2 of a
eubacterial RNA polymerase. The different tRNA species encoded in the 35 kb DNA are
expected to provide a complete set of tRNAs required for translation in the apicoplast
(Preiser et al. 1995). The apicoplast genome also encodes clpC, a stromal chaperone and
member of the Tic complex for protein import; sufB, a protein involved in iron
homeostasis and iron-sulfur cluster formation, and 7 additional putative open reading
frames with unassigned function. Figure 2-1 shows a map of the P. falciparum apicoplast
DNA.
Using in situ hybridization in combination with fluorescent or electron
microscopy, studies in Toxoplasma confirm that the 35 kb DNA localizes to the
apicoplast. In Toxoplasma the apicoplast DNA is visualized as discrete foci, indicating
that the DNA is organized into nucleoid compartments similar to what has been observed
for chloroplast DNA (Striepen et al. 2000, Matsuzaki et al. 2001). Chloroplast nucleoids
are organized by a bacterial-derived histone-like protein (HU) (Kobayashi et al. 2002)
and both Plasmodium and Toxoplasma contain an apicoplast targeted HU homologue
(Vaishnava and Striepen 2006, Arenas et al. 2008). The histone-like HU protein is likely
to play an important role in apicoplast genome organization, expression, and proper
segregation. During apicoplast segregation in Toxoplasma, the apicoplast DNA localizes
to the ends of the organelle near the centrosomes, perhaps indicating that nucleoid
positioning may be linked to an association with the centrosome (Vaishnava and Striepen
2006). Proteins such as histone-like HU could be important players in this association
(Vaishnava and Striepen 2006).
20
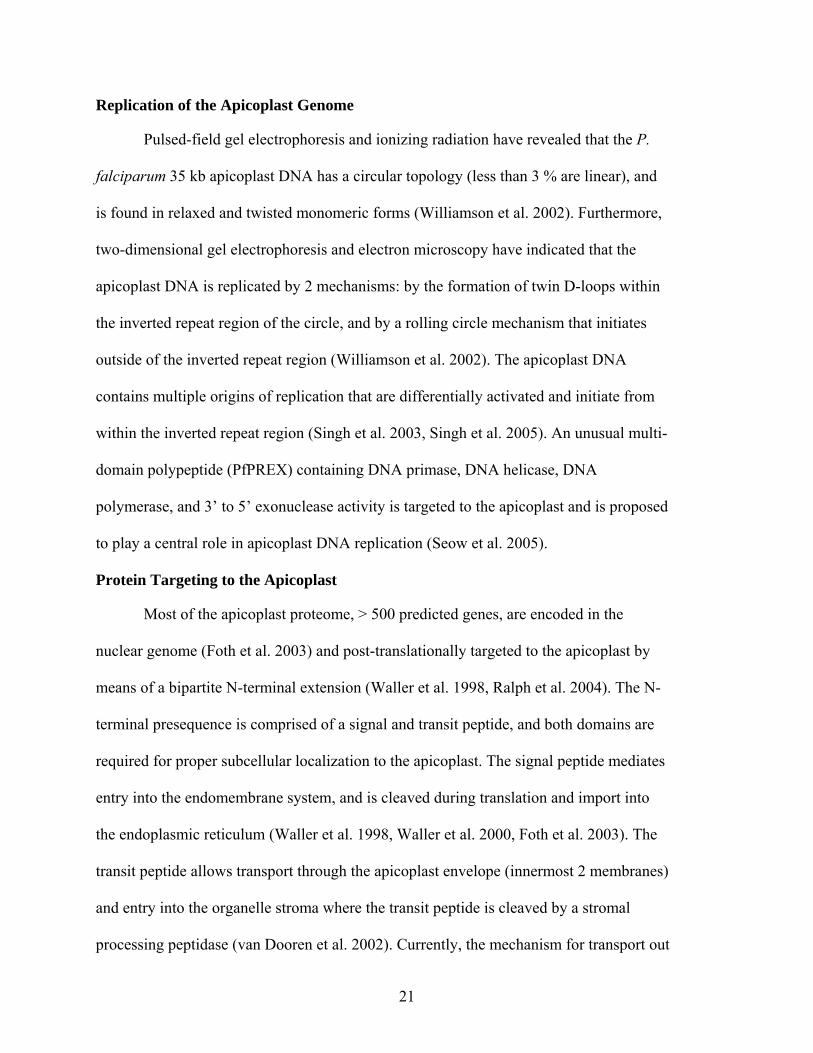
Replication of the Apicoplast Genome
Pulsed-field gel electrophoresis and ionizing radiation have revealed that the P.
falciparum 35 kb apicoplast DNA has a circular topology (less than 3 % are linear), and
is found in relaxed and twisted monomeric forms (Williamson et al. 2002). Furthermore,
two-dimensional gel electrophoresis and electron microscopy have indicated that the
apicoplast DNA is replicated by 2 mechanisms: by the formation of twin D-loops within
the inverted repeat region of the circle, and by a rolling circle mechanism that initiates
outside of the inverted repeat region (Williamson et al. 2002). The apicoplast DNA
contains multiple origins of replication that are differentially activated and initiate from
within the inverted repeat region (Singh et al. 2003, Singh et al. 2005). An unusual multi-
domain polypeptide (PfPREX) containing DNA primase, DNA helicase, DNA
polymerase, and 3’ to 5’ exonuclease activity is targeted to the apicoplast and is proposed
to play a central role in apicoplast DNA replication (Seow et al. 2005).
Protein Targeting to the Apicoplast
Most of the apicoplast proteome, > 500 predicted genes, are encoded in the
nuclear genome (Foth et al. 2003) and post-translationally targeted to the apicoplast by
means of a bipartite N-terminal extension (Waller et al. 1998, Ralph et al. 2004). The N-
terminal presequence is comprised of a signal and transit peptide, and both domains are
required for proper subcellular localization to the apicoplast. The signal peptide mediates
entry into the endomembrane system, and is cleaved during translation and import into
the endoplasmic reticulum (Waller et al. 1998, Waller et al. 2000, Foth et al. 2003). The
transit peptide allows transport through the apicoplast envelope (innermost 2 membranes)
and entry into the organelle stroma where the transit peptide is cleaved by a stromal
processing peptidase (van Dooren et al. 2002). Currently, the mechanism for transport out
21

of the endoplasmic reticulum and through the periplastid membrane is unknown (Foth
and McFadden 2003).
Studies have demonstrated that apicoplast trafficking is not affected by the Golgi-
disrupting agent Brefeldin A (DeRocher et al. 2005, Tonkin et al. 2006). Furthermore,
the addition of an ER retention signal (XDEL motif) to apicoplast targeted proteins does
not result in cis-Golgi mediated retrieval by ERD2 (Tonkin et al. 2006). These findings
strongly suggest that apicoplast targeting is independent of passage through the Golgi,
and thus proteins are transported directly from the ER to the apicoplast. There are three
primary models proposed for ER to apicoplast transport (Vaishnava and Striepen 2006).
Trafficking may occur by general vesicular transport from the ER to the apicoplast, there
maybe an extension of the ER that cradles the apicoplast where proteins are transported
in vesicles or through specialized tubules that span the ER and apicoplast membranes,
and/or the outermost membrane of the apicoplast is simply continuous with the ER and
proteins are directly imported. The latter scenario could imply that all secretory proteins
are subject to an initial apicoplast sorting step before processing by the Golgi, which
could be a fitting assumption since the apicoplast is the final destination for half of the
secreted proteins in Plasmodium (Tonkin et al. 2008).
Apicoplast Division
Most of what is known about plastid division comes from studies in Arabidopsis.
There are highly conserved proteins of cyanobacterial origin that govern the process of
plastid division, in addition to various eukaryotic players. In Arabidopsis, cyanobacterial
Ftz homologues (which are tubulin-like GTPases) form a ring-like structure (Z-ring) at
the plastid division site. Members of the cyanobacterial minicell gene family (min D and
min E) secure the positioning of the Z-ring for a symmetrical plastid division. Additional
22

cyanobacterial proteins such as Ftn2/ARC6 and the eukaryotic dynamin-related protein
ARC5 are also required for the division process. While FtsZ and ARC5 mediated division
is conserved in most plastid containing organisms, Plasmodium and Toxoplasma do not
contain genes with significant homology to any of the above plastid division proteins
(Vaishnava and Striepen 2006).
In the absence of conserved division proteins, it is proposed that apicoplast fission
is accomplished during the final period of pellicle formation in the daughter cell (Striepen
et al. 2000). The elongating apicoplast shows a clear association with the centrosomes in
Toxoplasma and Sarcosystis, raising the possibility that the apicoplast is pulled into
daughter buds via a connection to the mitotic spindle apparatus (Striepen et al. 2000,
Vaishnava et al. 2005). The simultaneous downward movement of the daughter cell
pellicle might further constrict the apicoplast, resulting in fission (Vaishnava et al. 2005).
Moreover, regions of apicoplast constriction in Toxoplasma co-localize with ring
structures containing membrane occupation recognition nexus protein (MORN1)
(Gubbels et al. 2006). Time lapse imaging studies have revealed that motile MORN1
rings move over the daughter cell bud and constrict the posterior end of the bud where
final cytokinesis occurs (Gubbels et al. 2006, Vaishnava and Striepen 2006).
The process of cell division in apicomplexans varies across species. While
Plasmodium, Eimeria, Babesia, and Theileria divide by schizogony, Toxoplasma utilizes
the process of endodyogeny for cell division, and Sarcocystis undergoes endopolygeny.
The shared characteristic between these different modes of cell division is the ultimate
formation of the apicomplexan daughter cell, termed the zoite, which contains the full
complement of cellular organelles, membranes, cytoskeletal elements, cytoplasmic
23
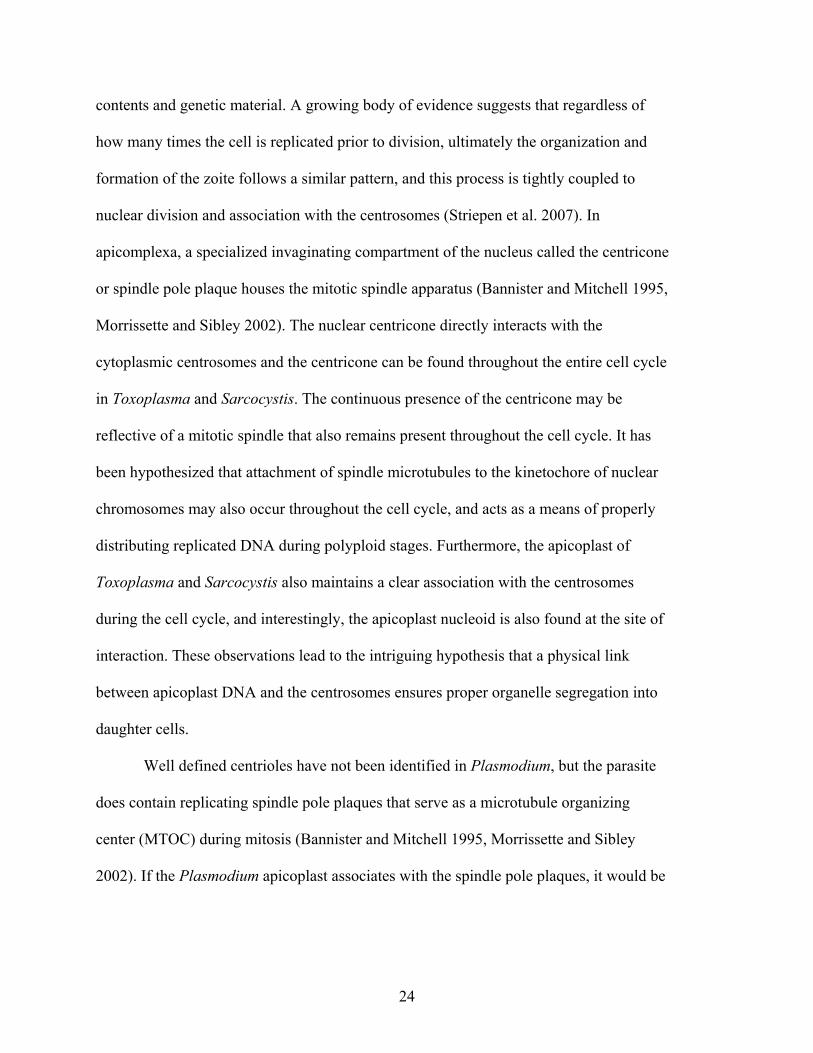
contents and genetic material. A growing body of evidence suggests that regardless of
how many times the cell is replicated prior to division, ultimately the organization and
formation of the zoite follows a similar pattern, and this process is tightly coupled to
nuclear division and association with the centrosomes (Striepen et al. 2007). In
apicomplexa, a specialized invaginating compartment of the nucleus called the centricone
or spindle pole plaque houses the mitotic spindle apparatus (Bannister and Mitchell 1995,
Morrissette and Sibley 2002). The nuclear centricone directly interacts with the
cytoplasmic centrosomes and the centricone can be found throughout the entire cell cycle
in Toxoplasma and Sarcocystis. The continuous presence of the centricone may be
reflective of a mitotic spindle that also remains present throughout the cell cycle. It has
been hypothesized that attachment of spindle microtubules to the kinetochore of nuclear
chromosomes may also occur throughout the cell cycle, and acts as a means of properly
distributing replicated DNA during polyploid stages. Furthermore, the apicoplast of
Toxoplasma and Sarcocystis also maintains a clear association with the centrosomes
during the cell cycle, and interestingly, the apicoplast nucleoid is also found at the site of
interaction. These observations lead to the intriguing hypothesis that a physical link
between apicoplast DNA and the centrosomes ensures proper organelle segregation into
daughter cells.
Well defined centrioles have not been identified in Plasmodium, but the parasite
does contain replicating spindle pole plaques that serve as a microtubule organizing
center (MTOC) during mitosis (Bannister and Mitchell 1995, Morrissette and Sibley
2002). If the Plasmodium apicoplast associates with the spindle pole plaques, it would be
24
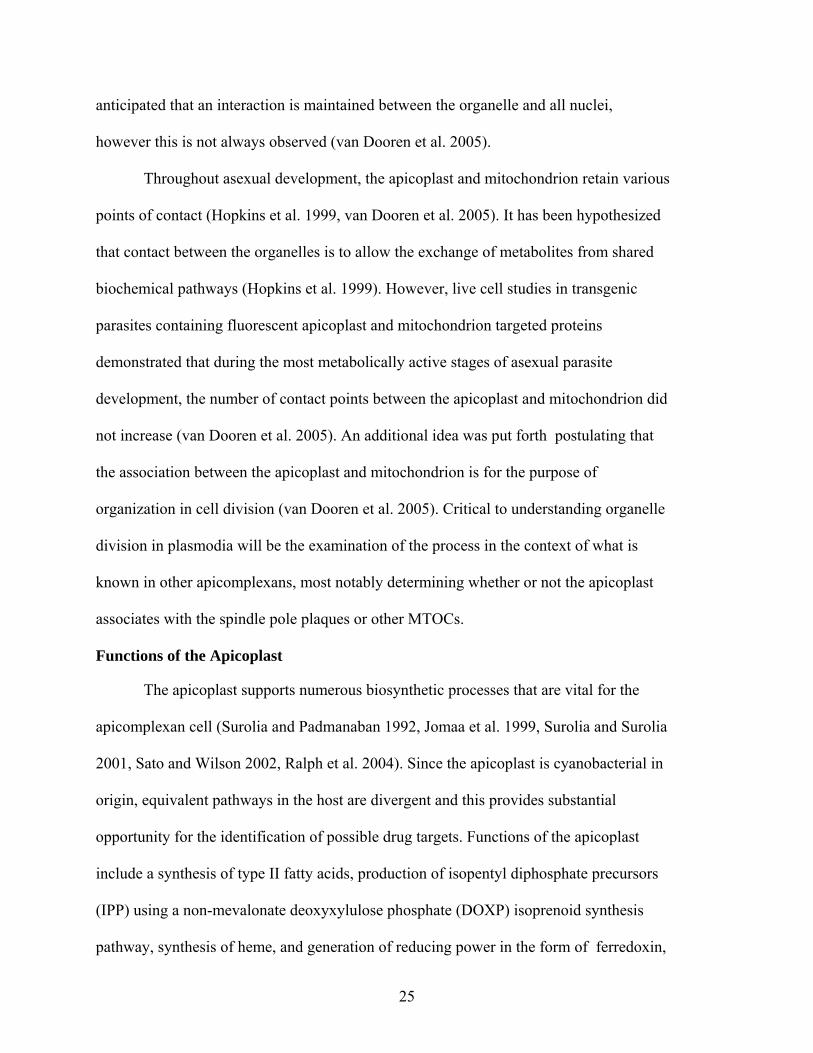
anticipated that an interaction is maintained between the organelle and all nuclei,
however this is not always observed (van Dooren et al. 2005).
Throughout asexual development, the apicoplast and mitochondrion retain various
points of contact (Hopkins et al. 1999, van Dooren et al. 2005). It has been hypothesized
that contact between the organelles is to allow the exchange of metabolites from shared
biochemical pathways (Hopkins et al. 1999). However, live cell studies in transgenic
parasites containing fluorescent apicoplast and mitochondrion targeted proteins
demonstrated that during the most metabolically active stages of asexual parasite
development, the number of contact points between the apicoplast and mitochondrion did
not increase (van Dooren et al. 2005). An additional idea was put forth postulating that
the association between the apicoplast and mitochondrion is for the purpose of
organization in cell division (van Dooren et al. 2005). Critical to understanding organelle
division in plasmodia will be the examination of the process in the context of what is
known in other apicomplexans, most notably determining whether or not the apicoplast
associates with the spindle pole plaques or other MTOCs.
Functions of the Apicoplast
The apicoplast supports numerous biosynthetic processes that are vital for the
apicomplexan cell (Surolia and Padmanaban 1992, Jomaa et al. 1999, Surolia and Surolia
2001, Sato and Wilson 2002, Ralph et al. 2004). Since the apicoplast is cyanobacterial in
origin, equivalent pathways in the host are divergent and this provides substantial
opportunity for the identification of possible drug targets. Functions of the apicoplast
include a synthesis of type II fatty acids, production of isopentyl diphosphate precursors
(IPP) using a non-mevalonate deoxyxylulose phosphate (DOXP) isoprenoid synthesis
pathway, synthesis of heme, and generation of reducing power in the form of ferredoxin,
25

an iron-sulfur protein that acts as an agent of electron transfer (Roos et al. 2002, Foth and
McFadden 2003, Waller et al. 2003, Ralph et al. 2004).
Apicoplast as a Drug Target
The Plasmodium apicoplast, being prokaryotic in origin, serves as an excellent
target for therapeutic intervention (Wiesner and Seeber 2005). Several anti-bacterial
compounds exert a parasiticidal effect against P. falciaprum in vitro, and studies have
validated that the apicoplast is the primary target of these drugs (Gardner et al. 1991b,
McConkey et al. 1997, Weissig et al. 1997, Jomaa et al. 1999, Williamson et al. 2002,
Dahl et al. 2006). In fact, some anti-bacterials such as doxycycline and clindamycin are
currently used for malaria prophylaxis and in combination with other drugs for malaria
treatment (Wiesner et al. 2003, Borrmann et al. 2005). Even anti-bacterials with limited
in vivo or in vitro efficacy are extremely valuable as lead compounds for the development
of more specific inhibitors. With rigorous validation of anti-bacterial drug targets at the
cellular and molecular level in Plasmodium, a framework can be established for future
pursuits in developing novel inhibitors against defined targets.
The anti-bacterials tested against Plasmodium can be divided into two broad
categories: those that target housekeeping functions of the apicoplast (e.g. DNA
replication, RNA transcription, and protein translation), and those that target metabolic
pathways of the apicoplast (e.g. type II fatty acid synthesis, non-mevalonate isopentenyl
diphosphate synthesis, and components of the heme biosynthesis pathway). The efficacy
of anti-bacterials against P. falciparum is quite variable in terms of the period of time it
takes to kill the parasite. Many of the anti-bacterials that target housekeeping functions of
the apicoplast show a dramatic increase in potency when drug inhibition is evaluated at
96 h instead of 48 h, following a 48 h drug treatment. Most notably, when parasite counts
26
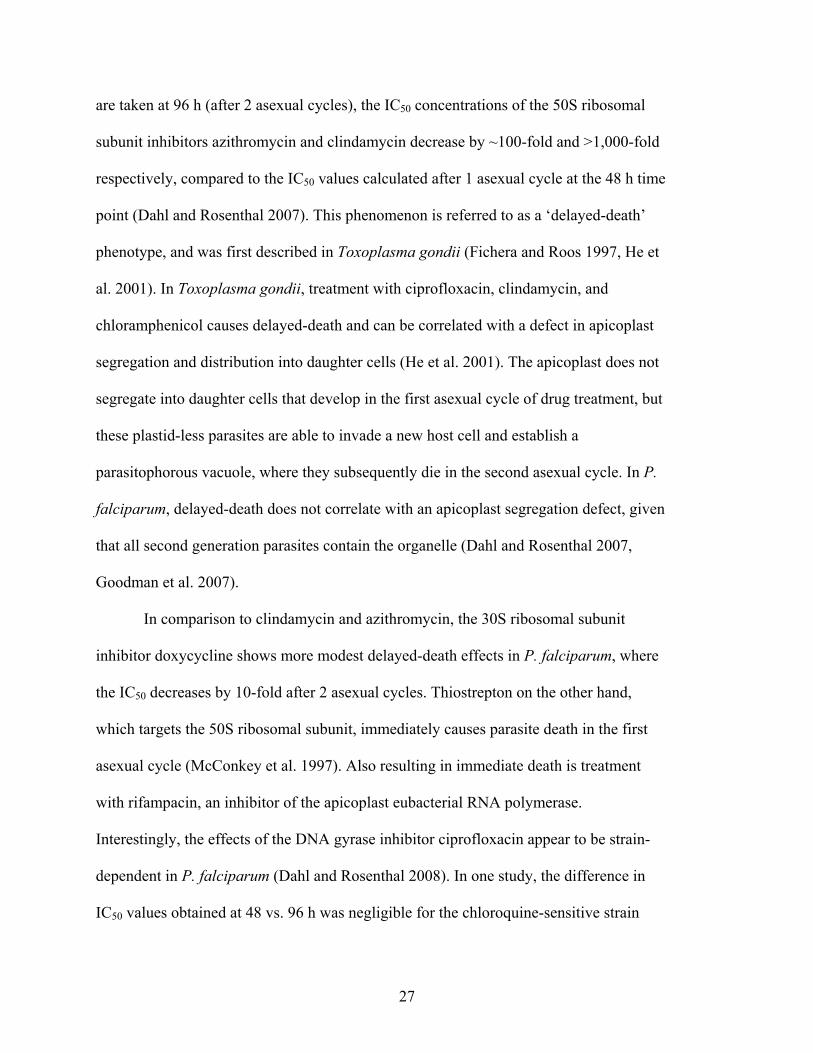
are taken at 96 h (after 2 asexual cycles), the IC50 concentrations of the 50S ribosomal
subunit inhibitors azithromycin and clindamycin decrease by ~100-fold and >1,000-fold
respectively, compared to the IC50 values calculated after 1 asexual cycle at the 48 h time
point (Dahl and Rosenthal 2007). This phenomenon is referred to as a ‘delayed-death’
phenotype, and was first described in Toxoplasma gondii (Fichera and Roos 1997, He et
al. 2001). In Toxoplasma gondii, treatment with ciprofloxacin, clindamycin, and
chloramphenicol causes delayed-death and can be correlated with a defect in apicoplast
segregation and distribution into daughter cells (He et al. 2001). The apicoplast does not
segregate into daughter cells that develop in the first asexual cycle of drug treatment, but
these plastid-less parasites are able to invade a new host cell and establish a
parasitophorous vacuole, where they subsequently die in the second asexual cycle. In P.
falciparum, delayed-death does not correlate with an apicoplast segregation defect, given
that all second generation parasites contain the organelle (Dahl and Rosenthal 2007,
Goodman et al. 2007).
In comparison to clindamycin and azithromycin, the 30S ribosomal subunit
inhibitor doxycycline shows more modest delayed-death effects in P. falciparum, where
the IC50 decreases by 10-fold after 2 asexual cycles. Thiostrepton on the other hand,
which targets the 50S ribosomal subunit, immediately causes parasite death in the first
asexual cycle (McConkey et al. 1997). Also resulting in immediate death is treatment
with rifampacin, an inhibitor of the apicoplast eubacterial RNA polymerase.
Interestingly, the effects of the DNA gyrase inhibitor ciprofloxacin appear to be strain-
dependent in P. falciparum (Dahl and Rosenthal 2008). In one study, the difference in
IC50 values obtained at 48 vs. 96 h was negligible for the chloroquine-sensitive strain
27

3D7, while in the chloroquine resistant strain W2 the drug was 10-fold more potent at 96
h (Dahl and Rosenthal 2007). Chloroquine targets the parasite digestive vacuole and
interferes with heme polymerization (Slater and Cerami 1992). In another report testing
ciprofloxacin against the chloroquine-resistant strain D10, the difference in IC50 values
obtained at 48 vs. 96 h could also be considered negligible (Goodman et al. 2007). The
latter report defined a specific set of criteria to define delayed-death (treatment with 10
times the 96 h IC50 concentration should not inhibit growth after 48 h, and the growth
inhibition should not be affected by the presence or absence of drug in the second asexual
cycle). With these criteria it was determined that treatment with ciprofloxacin as well as
thiostrepton and rifampacin resulted in immediate death, whereas treatment with
clindamycin and tetracycline resulted in a delayed death response (Goodman et al. 2007).
In contrast with the parasite response to anti-bacterials that target housekeeping
functions of the apicoplast where delayed-death is sometimes an outcome, anti-bacterials
that target metabolic functions of the apicoplast result in immediate death within the first
asexual cycle (Waller et al. 2003, Goodman and McFadden 2007, Ramya et al. 2007,
Wiesner and Jomaa 2007). For example, the anti-bacterial triclosan targets the enoyl-acyl
carrier protein (ACP) reductase of the fatty acid biosynthesis pathway and treatment of
Plasmodium and Toxoplasma with triclosan results in inhibition during the first asexual
cycle of treatment (McLeod et al. 2001, Ramya et al. 2007). The use of fosmidomycin to
target DOXP reductoisomerase of the isoprenoid synthesis pathway also results in
parasite inhibition during the first asexual cycle of treatment (Jomaa et al. 1999, Wiesner
et al. 2002)
28

DNA Gyrase
DNA gyrase is a eubacterial type II topoisomerase that functions in regulating the
topological transitions of circular DNA molecules. The regulation of DNA topology by
DNA gyrase is required for the processes of DNA replication, DNA segregation, and
RNA transcription (Wang 2002). Plasmodium falciparum contains nuclear gene
sequences encoding both subunits of this bacterial enzyme, gyrA and gyrB, each of which
share good homology with its E. coli orthologue (42 % and 51 % amino acid similarity,
respectively). The DNA gyrase sequences contain an apicoplast targeting element located
at their amino terminus, whereas other putative topoisomerase genes in P. falciparum
lack this feature (Khor et al. 2005) (PlasmoDB). Since this putative gyrase is the only
type II topoisomerase that is predicted to function within the apicoplast, this enzyme is
likely to play a central role in maintaining a functional structure of the apicoplast DNA
that may be required for DNA replication, DNA segregation, and RNA transcription.
Functions of the Bacterial Type II Topoiomserase
Two eubacterial type II topoisomerases have been identified, DNA gyrase and
topoisomerase IV, and each of these enzymes functions as a heterotetramer (Champoux
2001). DNA gyrase is comprised of two A subunits and two B subunits (gyrA2gyrB2),
and topoisomerase IV is comprised of two very similar subunits (parC2parE2). Both
enzymes create transient double stranded breaks in DNA to allow for the passage of
another segment of duplex DNA through the break (Wang 1996, Champoux 2001). The
DNA break is stabilized by the formation of a protein bridge created by the covalent
attachment of the active site tyrosine to both 5’ phosphoryl ends of the broken DNA (Liu
and Wang 1979, Been and Champoux 1980, Liu et al. 1980). The process of strand
29

passage is required for the resolution of topological problems that occur as a result of
DNA replication, recombination, and RNA transcription
DNA gyrase is the only type II topoisomerase that is capable of generating
negative supercoils in DNA, and this is an ATP-dependent process that is essential for
maintenance of circular genomes (Bates and Maxwell 1989, Maxwell 1997, Champoux
2001). During DNA replication, topoisomerase IV plays an important role in unlinking
precatenanes that form behind the replication fork, whereas gyrase relieves positive
supercoiling that accumulates in front of the replication fork (Liu and Wang 1987, Wu et
al. 1988). Topoisomerase IV is also responsible for resolving the catenanes that result
from failure of gyrase to completely remove positive supercoils that accumulate between
two converging replication forks, and also helps to relax excessive negative supercoiling
induced by DNA gyrase (Wang 2002, Wang and Shapiro 2004).
The type II Topoisomerase Reaction
All type II topoisomerases are predicted to work using a two-gated mechanism
(Roca and Wang 1994, Kampranis et al. 1999, Champoux 2001). Below is a description
of the process as described in (Roca and Wang 1994, Kampranis et al. 1999, Champoux
2001). The enzyme has two gated cavities, one on either side of the G-segment (gated
segment) of the DNA substrate. The N-gate is comprised of the B subunits and ATPase
domains. The exit gate is called the C-gate and is comprised of the N-terminal portions of
gyrA. The DNA capture domains lie in a cavity of the N-gated region, where positively
charged amino acid residues in this area facilitate the binding of DNA. It is thought that
binding of ATP to one of the ATPase domains induces a local conformation change
which results in closing of the N-gate and also allows for the binding of a second ATP
molecule. ATP hydrolysis is required to open the gate, and free forms of topoisomerase II
30
are thought to oscillate between N-gate open and closed forms. The first step in the
topoisomerase reaction process is capture of G-segment DNA through the DNA capture
domains that line the base of the N-gated cavity and extend over the CAP-like regions of
the protein which contain the active site. Once the G-segment DNA is bound,
conformation changes induce an increased rate of N-gate opening and closing using the
ATP dependent mechanism described above. Next, another segment of DNA (T-segment)
is trapped within the N-gated cavity (perhaps by topology recognition and interactions
with the DNA binding domains), and through binding to ATP the N-gate is closed. The
G-segment is then cleaved by nucleophilic attack of the active site tyrosine on the DNA
phosphate backbone. Cleavage of the G-DNA induces a conformation change and the
CAP regions are pulled apart to allow passage of the T-segment DNA into the lower
cavity. Another conformation change thought to result from the hydrolysis of ATP
enhances the transport of the T-segment to open the G-segment DNA gate. Following
strand passage the G-DNA gate is closed and the G-DNA is re-ligated, which causes the
C-gate to open and release the T-segment. A second ATP is hydrolyzed to facilitate the
closing of the N-gate. In the case of DNA gyrase, the negative supercoiling reaction is
dependent upon the C-terminal wrapping function of the A subunit which wraps DNA in
a right-handed orientation to ensure that the nodal arrangement of G and T segments is
positive, thus giving rise to a reaction that produces predominantly negative supercoils.
Inhibitors of Type II Topoisomerase
The two major classes of inhibitors that target the bacterial topoisomerases DNA
gyrase and topoisomerase IV are 1) the fluoroquinolone compounds which are
derivatives of the quinolone nalidixic acid, and 2) the coumerin compounds which are
derived from Streptomyces species (Maxwell 1999, Drlica and Malik 2003). Examples of
31

the fluoroquinolones include: norfloxacin, biprofloxacin, levofloxacin, gemifloxacin, and
moxifloxacin. Examples of the coumerins include: novobiocin, chlorobiocin, and
coumermycin A1. A commonly used and potent fluoroquinolone against the bacterial
type II topoisomerases is ciprofloxacin which is made of a nalidixic acid quinolone core
molecule containing fluorine at C-6 position, a piperazinyl ring at the C7 position, a
substituted carbon for the position 8 nitrogen, and an N-1 cyclopropyl. The most
commonly discussed coumerin derivative is novobiocin, which consists of a 3-amino-4,7-
dihydroxy-coumerin core attached to the sugar novoise. The fluoroquinolones, like the
mammalian topoisomerase II inhibitors, are considered poisons. These inhibitors promote
the rate at which covalent enzyme-DNA reaction intermediates are formed through
causing distortions in the DNA where topoisomerases are bound (Wilstermann and
Osheroff 2003). Replication forks and transcription complexes are unable to bypass these
trapped ternary complexes. Ultimately, it is thought that the cytotoxic action of these
inhibitors is the accumulation of double stranded lesions in the DNA that cannot be
overcome by the DNA repair machinery (Wilstermann and Osheroff 2001). In
mammalian cells these events trigger apoptosis. Coumerins directly inhibit topoisomerase
II activity by competing for binding sites in the ATPase regions. With the exception of
DNA gyrase relaxing activity, without the energy from ATP the conformation changes in
the enzyme required to drive DNA relaxation, catenation/ decatenation, induction of
negative supercoils (by DNA gyrase) do not occur. Bacterial and mammalian type II
topoisomerases are largely inhibited by the same mechanism which is by inducing
cytotoxic lesions in the DNA by stabilizing protein-DNA covalent bonds (Chen et al.
1984, Ross et al. 1984, Rowe et al. 1984, Rowe et al. 1986, Byl et al. 2001). Mammalian
32

enzymes however are sensitive to different classes of topoisomerase poisons including
VP-16/VM-26 etoposides, amsacrine, and ellipticines.
Characterization of the Plasmodium DNA Gyrase
Plasmodium falciparum contains two pharmacologically distinguishable type II
topoisomerase activities, one of which is sensitive to ciprofloxacin and is specific to the
apicoplast DNA (Weissig et al. 1997). Furthermore, proliferation of P. falciparum in
vitro is inhibited by the fluoroquinolone compound ciprofloxacin and coumerin drug
novobiocin (Dahl and Rosenthal 2007, Goodman et al. 2007, Raghu Ram et al. 2007).
Parasites treated with ciprofloxacin also show characteristic molecular effects of DNA
cleavage and protein linked 5' DNA ends that are specific to the apicoplast DNA
(Weissig et al. 1997). Recently a report was published where GyrA and GyrB subunits
were detected by western blot from P. falciparum lysates using antisera generated against
recombinant portions of the two polypeptides (Raghu Ram et al. 2007). In addition, the
sub-cellular location of PfGyrA and PfGryB appear to be within the apicoplast (Dar et al.
2007, Raghu Ram et al. 2007). Analysis of recombinant P. falciparum and P. vivax GyrB
has revealed that the ATPase activity of GyrB increases linearly with the concentration of
enzyme (Khor et al. 2005, Raghu Ram et al. 2007). The ATPase activity of recombinant
PfGyrB is further stimulated in the presence of a segment of plasmid DNA containing a
strong DNA gyrase binding site (Raghu Ram et al. 2007). Treatment of P. falciparum
with novobiocin results in a selective loss of apicoplast DNA (compared to nuclear and
mitochondrial DNA) in the second asexual cycle after treatment (Raghu Ram et al. 2007).
However, the recombinant enzyme has a reduced sensitivity to novobiocin (compared to
E. coli) and it has been suggested that the Plasmodium GyrB may be able to dimerize in
the absence of ATP, which could explain this reduced sensitivity since novobiocin binds
33
monomeric GyrB forms (Khor et al. 2005, Dar et al. 2007, Raghu Ram et al. 2007). Even
with these differences, PfGyrB is able to complement E. coli temperature sensitive strains
(Dar et al. 2007). Furthermore, recombinant PfGyrB in combination with E. coli GyrA or
an N-terminal segment of PfGyrA shows cleavage activity that increases in the presence
of ciprofloxacin in a dose-dependent manner (Dar et al. 2007). The complex of PfGyrB
with E. coli GyrA can also transform relaxed DNA into a supercoiled state, however this
activity is not very robust (Dar et al. 2007).
Conditional Gene Regulation
The complete sequencing of the Plasmodium falciparum genome provides a
starting platform for efforts to develop vaccines and drugs by providing detailed
molecular information about the genetic resources and metabolic pathways of the
parasite. Although the complete P. falciparum genome sequence is available (Gardner et
al. 2002), few methods for genetic manipulation have proven successful. Interruption or
deletion of gene coding sequences through the use of single and double cross-over vector
systems is currently the most common approach used to screen for essential P.
falciparum gene products. The inability to successfully establish parasite culture
following targeted gene knockout experiments provides weak, negative evidence that a
gene is essential, and this is unsatisfactory as the foundation for a major project to
undertake rational drug design. Unfortunately, the key enzymes enabling the RNA
interference (RNAi) pathway are not present in the malarial genome, rendering this
approach to gene knockdown unfeasible. Although there are a few isolated reports of
some success with this approach (McRobert and McConkey 2002), the RNAi method is
generally considered unreliable in identifying essential genes in the malaria parasite. New
and robust methods employing alternative reverse genetic technologies are urgently
34

needed to identify proteins required by the parasite to perform critical cellular functions.
Recent reports of functional tetracycline (Tet)-regulated gene expression and high-
efficiency transposon-based transformation in P. falciparum demonstrate that alternative
approaches for genetic manipulation of the parasite may be feasible (Balu et al. 2005,
Meissner et al. 2005).
Episomal transgene expression can be conditionally regulated in Plasmodium
falciparum through the use of a Tet-transactivator system (Meissner et al. 2005). The
transactivator was created by random genomic insertion of the tetracycline repressor
(TetR) gene in the apicomplexan T. gondii which was used to trap a transactivator
sequence motif at the C-terminus of the TetR gene (Meissner et al. 2002). In combination
with a TetR-responsive operator sequence (TetO) and minimal promoter, the resulting
functional tetracycline-responsive transactivator (TaTi2) allowed conditional regulation
of a green fluorescent protein (GFP) reporter gene in P. falciparum
Expression of TaTi2 was under the control of the 5’ region of msp2, the gene
encoding merozoite surface protein 2, and follows the temporal pattern of msp2
expression. In the absence of the tetracycline analogue anhydrotetracycline (ATc), TaTi2
binds the TetO and stimulates transcription of a downstream transgene. When ATc is
present, it binds TaTi2 causing a conformational change in TaTi2 that does not allow it to
bind TetO, thus transcription is minimal. In plasmid pTGPI-GFP, seven tandem repeats
of the TetO sequence are positioned 5' to the minimal CAM promoter sequence forming a
tet-responsive expression cassette, which lies 5' of the transgene insertion site containing
GFP (Meissner et al. 2005). A concentration of 0.5µg/ml ATc was non toxic to P.
falciparum and allowed 50-fold regulation of GFP protein expression. (Meissner et al.
35

2005). A potential application of this technology is the conditional regulation of native
Plasmodium gene transcription.
Study Rationale and Specific Objectives
Prevention and treatment of human malaria is heavily dependent upon the
availability of effective antimalarial drugs, since there are no effective vaccines currently
available. Unfortunately, the repertoire of antimalarial drugs effective against
Plasmodium falciparum, the principal causative agent of human malaria, is dwindling
due to widespread drug resistance. Gene products that perform an essential cellular
function in the asexual blood stage have the greatest potential as targets for novel drugs.
Target verification, the initial required step in rational drug development, is greatly
hampered without the proper genetic tools. Numerous presumptive targets for rational
drug design may be proposed among the ~5,300 predicted gene sequences from the P.
falciparum genome, but the currently available methods for identifying essential gene
products in P. falciparum are inefficient and for the present purpose yield inconclusive
negative results.
In Plasmodium spp., apicoplast function is essential for parasite survival as it
supports numerous biochemical pathways such as fatty acid, heme and isoprenoid
biosynthesis (Ralph et al. 2001, Foth and McFadden 2003). Accordingly, preservation of
the apicoplast genome by enzymes such as DNA gyrase are expected to be essential for
survival, since they may be required for maintenance of the organelle (Fichera and Roos
1997, Weissig et al. 1997, Dar et al. 2007). It is especially urgent to investigate the
importance of enzymes in Plasmodium that are already established drug targets of
bacterial pathogens, such as DNA gyrase. DNA gyrase has no mammalian counterpart,
and is the target of the clinically important quinolone and coumerin antibiotics.
36

The goals of this study were to further characterize the cellular and molecular
functions of the P. falciparum DNA gyrase using ciprofloxacin as a pharmacological
probe, and to define parameters of Tet-regulated gene expression in P. falciparum with
the intent of developing an inducible gene-knockdown system that will allow the
conditional regulation of endogenous genes. Conditional gene regulation will serve as an
independent and important means for specifically probing gene functions, and enable the
positive identification of genes that are essential for the growth of the asexual,
intraerythrocytic parasite.
Hypothesis
I hypothesize that DNA gyrase inhibition by ciprofloxacin in Plasmodium
falciparum selectively targets the normal remodeling of apicoplast DNA topology, which
elicits cytotoxic effects due to apicoplast dysfunction that result in an immediate rather
than a delayed arrest in the cell cycle.
Specific Aims
Aim 1: Utilize the DNA gyrase inhibitor ciprofloxacin to characterize the role of
the P. falciparum DNA gyrase in the malaria parasite. a) Determine whether the DNA
gyrase acts on the apicoplast DNA and/or whether it acts on the mitochondrial DNA. b)
Examine the effects of drug treatment on organellar DNA replication, organellar RNA
transcription and organellar DNA segregation. c) Determine whether the DNA gyrase
interacts with the plastid DNA at specific locations.
Aim 2: Demonstrate the feasibility of converting the Plasmodium falciparum Tet-
transactivator system into a tool that will allow the conditional regulation of gene
expression within a gene’s native locus. a) Replace the native 5' regulatory sequences of
the non-essential gene pfpm4 with a tetracycline-analogue-regulated promoter by single-
37
crossover homologous recombination. b) Use the piggyBac transformation system to
stably integrate single-copy transactivator (tati2) expression cassettes into the P.
falciparum genome. c) Demonstrate stable transgene expression of TaTi2 in the piggyBac
transformants. d) Use the piggyBac transformation system to integrate tati2 expression
cassettes into parasites where pfpm4 is under the regulation of the TetO / min. cam
promoter. e) Conditionally regulate the expression of pfpm4. f) Measure the range of
control that is afforded by utilizing a genomic integration strategy to demonstrate Atc-
regulation of gene expression in P. falciparum
38

CHAPTER 2 MATERIALS AND METHODS
Parasite Culture
Asexual stages of Plasmodium falciparum (strain 3D7) were cultured in vitro within
human red blood cells (RBCs) at 4-5 % hematocrit in complete medium [RPMI 1640, 0.005 %
hypoxanthine, 0.225 % sodium bicarbonate, 25 mM Hepes, 0.5 % Albumax (Invitrogen), 0.01
mg/ml gentamycin, sterile deionized water; pH 6.8 and 0.22 µM filtered] (Trager and Jensen
1976). Cultures were maintained at 37 ºC in a controlled atmoshpere of 1% O2, 5% CO2, and
94% N2. ºC
Synchronization of Asexual Parasite Stages
Sorbitol Method
Culture medium was aspirated and replaced with the same volume of sorbitol solution (5
% sorbitol in sterile deionized water; 0.22 µM filtered) (Lambros and Vanderberg 1979).
Parasites were resuspended in the sorbitol solution, transferred to 50 ml conical tubes, and
incubated at room temperature for 15 minutes. Cells were collected by centrifugation at 800 x g
for 5 minutes and the supernatant was poured off. Cells were washed twice with 30 – 50 ml of
complete medium and collected by centrifugation. Fresh RBCs were added to adjust the
parasitemia and cultures were re-plated with complete medium and incubated as previously
described. The procedure was repeated at 2 days and 4 days after the first treatment to obtain
synchronous parasites.
Percoll / Sorbitol Density Gradient Centrifugation
Percoll was diluted to the desired concentration with deionized water with a 1X final
concentration of incomplete media (RPMI 1640, 0.005 % hypoxanthine, 0.6 % Hepes, sterile
39

deionized water; pH 6.8 and 0.22 µM filtered) and with a final concentration of 6 % (w/v)
sorbitol (Fernandez et al. 1998). Five ml of a 70 % solution of percoll was first pipetted into a 15
ml conical tube and an equal volume of the 40 % solution was carefully overlaid, taking care not
to introduce any bubbles. Parasite suspension was carefully layered over the 40 % solution.
Tubes were centrifuged at 1000 x g for 10 minutes and the parasite layer at the interface of the
40 % and 70 % solutions was recovered to isolate late stage parasites, and/or the pellet was
collected to recover ring stage parasites. For preparation of highly synchronized cultures, the late
stage parasites were allowed to invade fresh RBCs for a 3 h period, after which cultures were
treated with one round of sorbitol lysis as described above to leave only the newly invaded rings
Magnetic Isolation
Twenty milliliters of culture (3-5 % parasitemia, 4 % hematocrit) containing
predominately schizont-stage parasites (obtained by 2-3 successive sorbitol treatments) were
concentrated to 4 ml in complete medium. The magnetic column (type LS, Miltenyi Biotec) was
pre-conditioned with 4 ml of complete medium. Next, the column was attached to a
MidiMACS™ magnet and the parasite concentrate was applied to the column reservoir and
allowed to pass by gravity flow (Balu et al. 2005). The column was washed 2 times with 5 ml of
incomplete medium. The column was detached from the magnet and the late-stage parasites were
eluted with 2 ml of complete medium. The parasites in the column eluent were collected by
centrifugation, and transferred back into culture with fresh RBCs for 3 hours to allow for re-
invasion. Cultures were treated with sorbitol once as described above to eliminate any remaining
schizonts, leaving only newly-invaded ring forms.
40

Parasite Transfection
Direct Electroporation Method
Predominately ring-stage cultures at 5-6 % parasitemia were obtained by successive
sorbitol treatments. Cells and plasmid DNA were resuspended in cytomix solution [120 mM
KCl; 0.15 mM CaCl2; 10 mM K2HPO4/KH2PO4, pH 7.6; 25 mM Hepes, pH 7.6; 2 mM EGTA,
pH 7.6; 5mM MgCl2; pH adjusted with KOH] (Wu et al. 1995). A volume of 400 µl containing
cells and plasmid DNA (100 µg) was loaded into pre-chilled (-20 ºC) 2 mm cuvettes and
electroporated under low voltage, high capacitance (0.31 kV, 960 µF) conditions using a Gene
Pulser II (BioRad) (Fidock and Wellems 1997). Cells were immediately transferred into culture
and media was changed after 1 hour, and daily thereafter. Drug selection was started at 2 days
post-transfection. Parasites were stably transformed with pSSPF2/PfACP-GFP (plasmid kindly
provided by Shigeharu Sato, National Institute for Medical Research, London, UK) to generate
culture ACP-GFP. Parasites were stably transformed with pTGPI-GFP (plasmid kindly provided
by Brendon Crabb, The Walter and Eliza Hall Institute of Medical Research, Melbourne,
Australia) to generate culture pTGPI-GFP. In cultures ACP-GFP and pTGPI-GFP, plasmid
DNA was maintained extrachromosomally and selection was conducted with 2.5 nM WR99210.
For pTGPI-GFP, anhydrotetracycline (1 µg/ml) was added to the culture medium. Parasites were
stably transformed with pTOCAM-∆pm4 which was targeted for integration by single-crossover
homologous recombination. Selection was conducted with 5 nM WR99210. Plasmid maps are
shown in Figures 2-1, 2-2, & 2-3. Clonal parasite lines were obtained by limiting dilution
(Rosario 1981).
RBC-loading Method
The RBC-loading method (Deitsch et al. 2001) was used for piggyBac transformation.
Plasmid pGYBSD-TA or pGYBSD-TATK (300 µg) containing the ITR recognition sequences,
41

and 150 µg of helper plasmid were combined and precipitated in 0.3M sodium acetate pH 5.2,
67% ethanol. The pellet was washed with 70 % ethanol, air dried, and resuspended in 50 uL TE
buffer. For each transformation 1.5 ml of 50 % (packed cell volume) RBCs was washed with 1.5
ml of cytomix solution, the volume was brought back to 3 ml with cytomix, and plasmid DNA
was added. RBCs were electroporated as described above and washed with complete medium.
Plasmid-loaded RBCs were brought to a 5 % hematocrit with complete medium. Approximately
1 x 10⁶ schizonts isolated from the magnetic column were added to the plasmid-loaded RBCs
and the cells were placed in culture (Balu et al. 2005). After two days in culture, the media was
replaced with selective media containing 2.5 µg / ml blasticidin-S and maintained with daily
media changes for 5 days. Selective media was then removed and cultures were maintained with
daily media changes without drug selection until parasites were detected in thin smears prepared
from the cultures. Selective media containing blasticidin-S was used for an additional 5 days.
This procedure of alternately culturing in the presence and absence of drug was continued until
episomal plasmid was lost and only parasites with chromosomally-integrated plasmid remained.
Cultures pGYBSD-TA, pGYBSD-TATK, and C3TA were generated using this method. Clonal
parasite lines were obtained by limiting dilution (Rosario 1981).
Drug Assays
Parasitemia Counts
Ciprofloxacin (5 µg/ml, 10 µg/ml, and 25 µg/ml) was added to highly synchronous
cultures at the newly-invaded ring stage. Parasitemia was determined approximately every 12
hours by counting stained blood smears. At least 10 fields of view were counted, with a
minimum of 1000 cells counted.
42

Parasite Growth Inhibition Measured by [3H]-hypoxanthine Incorporation
Drug dilutions were added to P. falciparum 3D7 asynchronous culture (0.5-1.0%
parasitemia, 1.5-2.0% hematocrit) in triplicate, in 96-well plates at a final volume of 200 µl /
well. The parasites were cultured in low-hypoxanthine (2.5 mg/L) containing medium for 48 h.
After 48 h, 100 µl of medium was removed and replaced with 100 µl of ‘low-hypoxanthine’
medium containing [3H]-hypoxanthine at a concentration of 0.5 µCi/mL (Chulay et al. 1983,
Fidock et al. 1998). After an additional 24 h, cells were harvested onto glass fiber filters and
washed thoroughly with distilled water. Dried filters were placed in sample bags and immersed
in scintillation fluid (PerkinElmer), and radioactive emissions were counted in a 1450 MicroBeta
reader (PerkinElmer). Percentage reduction in hypoxanthine uptake (a marker of growth
inhibition) was calculated as follows: reduction = 100 × [(geometric mean cpm of no-drug
samples)-(geometric mean cpm of test samples)] / (geometric mean cpm of no-drug samples).
The percentage reductions were plotted as a function of drug concentration using the variable-
slope sigmoidal dose-response nonlinear regression equation (Systat Software Inc.).
Parasite Proliferation Rate by Flow Cytometry
The proliferation rate for parasite clones 3D7, C3 and B3 were determined in duplicate
cultures and were sampled every 24 hours for 12 days. For collection, 100 µL of well-mixed
parasite culture was gently pelleted by centrifugation for 3 minutes at 800 x g. The parasite pellet
was washed with PBS and resuspended in 500 µL of 2% paraformaldehyde in PBS. Samples
were stored at 4 ºC. Twenty-four hours prior to flow cytometry analysis, the fixative solution was
replaced with 500 nM Cyto24 (Molecular Probes) in PBS and samples were stored at 4 ºC. Fifty
thousand cells from each sample were sorted based on fluorescence, and the geometrical mean of
duplicate series 1 and 2 were plotted with the standard deviation.
43

Derivation of Plasmid Constructs
Plasmid pTGPI-GFP (described in Meissner et al 2005) was the kind gift of Brendan
Crabb of The Walter and Eliza Hall Institute of Medical Research, Melbourne, Australia (Figure
2-1), plasmid pXLBacII derivative #352 was the kind gift of Alfred Handler (USDA, ARS,
CMAVE, Gainesville, FL). Plasmids pBSD-CAM and pHHT-TK were the kind gift of David
Fidock (Columbia University, New York, NY). All PCR products and digested fragments were
gel isolated and extracted using the QiaQuick gel extraction kit (Qiagen). All PCR products were
sub-cloned into the pCR2.1 vector from the TOPO-TA cloning kit (Invitrogen), transformed into
chemically-competent E. coli (TOP10 cells), and sequenced. Large plasmids were transformed
into chemically-competent XL10-Gold cells (Stratagene). Restriction enzymes were purchased
from NEB, and DNA ligase was purchased from Invitrogen.
To create plasmid pTOCAM-∆pm4 (Figure 2-2), the first 727 bp of pfpm4 were amplified
from 3D7 gDNA by PCR and the fragment was cloned into pCR2.1. The fragment was re-
amplified with primers containing restriction enzyme linkers for Pst I and Bgl II and re-cloned
into pCR2.1. Both the pfpm4-pCR2.1 plasmid and pTGPI-GFP were digested with Pst I and Bgl
II and fragments were gel isolated and purified. The pfpm4 fragment was ligated into pTGPI-
GFP, replacing GFP and the transactivator expression cassette
To create plasmids pGYBSD-TATK and pGYBSD-TA (Figure 2-3), first the 5’ UTR from
msp2 was PCR amplified from plasmid pTGPI-GFP, using primers containing Sac II and Not I
restriction sites, and cloned into the Sac II / Not I cloning site in plasmid pBSD-CAM. The
tati2/Pbdhfr 3’ UTR was PCR amplified with primers containing Age I and Not I restriction sites,
and cloned into the Age I / Not I cloning site of pBSD-CAM-5’msp2 to make plasmid pBSD-TA.
Next, the 5’ ITR from pXLBacII was PCR amplified to contain Bgl II and Sac II restriction
linkers and the 5’ ITR was cloned into the Bgl II / Sac II restriction sites in pXLBacII to create
44
pXLBacII-5’2X. Plasmids pXLBacII-5’2X and pHHT-TK were digested with Spe I and Not I
and the 4.1 kb and 2.9 kb fragments were isolated respectively and cloned together to make
pGYTK. Plasmid pBSD-TA was digested with Kpn I and Cla I and the 4.1 kb fragment was
isolated and cloned into the Kpn I / Cla I site in pGYTK to create plasmid pGYBSD-TATK. To
create pGYBSD-TA, pGYBSD-TATK was digested with EcoR I and the large fragment was re-
ligated and cloned.
Quantitative PCR standards were generated by cloning one target amplicon into the TA
cloning site of pCR2.1, and the other target amplicon into the Pst I site of the pCR2.1 plasmid.
Southern Blot Analysis
Parasites were treated with 0.05% saponin and DNA was released by SDS lysis. Lysates
were incubated in the presence of 100 µg/ml proteinase K for 2 – 15 h at 65 ºC. DNA was
purified by phenol-chloroform extraction, precipitated with isopropanol, and resuspended with
nuclease-free water. DNA was digested with restriction enzymes overnight, and 5µg of the
digested DNA was electrophoresed in a 0.75 % agarose gel for 6 hours at 60 V. The gel was
exposed to UV light for 5 minutes to nick DNA, and was denatured with 1.5 M NaCl, 0.5 N
NaOH (2 x 20 min). The gel was neutralized with 1 M Tris-HCl (pH 7.5), 1.5 M NaCl (2 x 20
min), and soaked in 10 X SSC (2 x 15 min). DNA was transferred to positively-charged nylon
membranes and UV cross-linked for 2 minutes (Brown 1999). Membranes were blocked with 2
% casein, 0.2 % SDS, 0.1 % Sarkosyl, 5X SSC for 2 hrs at 50 ºC – 60 ºC depending on which
probe was used (Roche 2000). Membranes were hybridized overnight (at 50 ºC – 60 ºC) with
DIG-labeled DNA probes. The membrane was washed 2 × 5 min with 2 × SSC / 0.1 % SDS at
room temperature and 2 × 20 min with 0.1 × SSC / 0.1 % SDS at 55 ºC – 60 ºC. Membranes
were blocked with 4 % casein in 100 mM maleic acid and 150 mM NaCl for 2 hours and alkaline
phosphatase-conjugated anti-DIG was added at a 1:10,000 dilution in the same blocking solution
45
for 1 hour (Roche 2000). Membranes were washed with 2 × 30 minutes with 0.3 % Tween-20 in
100 mM maleic acid and 150 mM NaCl and equilibrated with detection buffer (100 mM Tris-
HCl, 100 mM NaCl, and 50 mM MgCl2, pH 9.5). The chemiluminescent substrate CDP-Star
(Roche) was applied and the membrane was exposed to film.
Northern Blot Analysis
RNA was extracted from saponin-lysed cultures using Trizol (Invitrogen) according to the
manufacturer’s protocol. Purified RNA was added to 3 volumes of loading buffer (Sigma),
heated at 60 ºC for 10 minutes then placed on ice. Approximately 5 µg of RNA was
electrophoresed at 50 V through a 1 % agarose gel containing formaldehyde (Brown et al. 2004).
The gel was soaked in 20 X SSC for 2 x 15 minutes then the RNA was blotted to positively-
charged nylon membrane overnight by capillary transfer (Brown et al. 2004). RNA was cross-
linked to the membrane by exposure to UV-light for 2 minutes. The membranes were pre-
hybridized for 1 hour in DIG Easy Hyb (Roche) at 50 ºC. The membranes were hybridized with
DIG-labeled probe overnight at 50 ºC. DIG-labeled DNA probes that were generated using gene-
specific primers, DIG-labeled dUTP (Roche), and exo(-) Klenow DNA polymerase (Stratagene).
Membranes were washed with 2X SSC and 0.1 % SDS for 2 x 5 minutes at room temperature
then with 0.2 X SSC and 0.1 % SDS for 2 x 20 minutes at 50 ºC. For detection, the membranes
were further processed with the DIG wash and block buffer set (Roche) according to
manufacturer’s instructions. The chemiluminescent substrate CDP-Star (Roche) was applied and
the membrane was exposed to film.
Western Blot Analysis
Asynchronous parasites were saponin treated (final 0.05%, w/v) for 5 min and washed 3
times with PBS to remove RBC ghosts. All centrifugations were performed at 10,000 X g for 10
minutes. Extracellular parasites were resuspended in SDS sample buffer [100 mM Tris-Cl (pH
46
6.8); 10% glycerol; 2% SDS; 100 mM 2-mercaptoethanol] and boiled for 5 min (Coligan 1996).
Parasite lysates were electrophoresed through either 10 % or 12 % SDS-PAGE gels and
transferred by electroblotting onto a PVDF (0.22 µM) membrane (Coligan 1996). Membranes
were blocked for 1- 8 hours with 100 mM Tris, 150 mM NaCl, pH 7.5, 0.1% Tween-20, 5 %
skim milk and probed with dilutions of antisera (1:10,000 of α-PfPM4, 1:10,000 of α-BIP, 1:800
of α-TetR, 1:1000 of α-GFP, 1:6,000 of α-FP3, or 1:6,000 of α-PfPM1 ) in 100 mM Tris, 150
mM NaCl, pH 7.5, 2 % skim milk overnight at 4 ºC. After incubation with primary antibody,
membranes were washed 10 times with 25 ml of 100 mM Tris, 150 mM NaCl and 0.1% Tween-
20 over 2 hrs. Secondary antibody (1:150,000 HRP-conjugated goat anti-rabbit or HRP-
conjugated goat anti-rat was added in 100 mM Tris, 150 mM NaCl, pH 7.5, 2 % skim milk. After
1.5-hours of incubation with secondary antibody, membranes were washed 10 times with 25 ml
of 100 mM Tris, 150 mM NaCl and 0.1% Tween-20 over 1-2 hours. Membranes were soaked in
SuperSignal West Dura chemiluminescent substrate (Pierce/Thermo Scientific) for 5 minutes and
exposed to film.
Quantitative PCR and Quantitative Reverse-Transcriptase PCR
Parasites were synchronized to obtain a population of parasites proceeding through the
asexual development cycle within a 3 h window of development. Initially cultures were treated
with 5 % sorbitol every 40 – 48 hours, for three consecutive treatments. Late schizont-stage
parasites were then isolated by percoll / sorbitol density gradient centrifugation, introduced to red
blood cells and cultured for 3 hours to allow merozoites to re-invade. Cultures were next treated
with 5 % sorbitol to leave only the newly invaded ring-stages. Parasites were cultured both in the
presence and absence of 5 µg/ml ciprofloxacin and samples were collected at specific
developmental time points based upon the development of the untreated controls (t0 = newly-
invaded rings). DNA was released from saponin-lysed parasites using 1 % Triton X-100, 1 mM
47

EDTA, and 10 mM Tris-HCl (pH 7.5). The lysates were incubated at 65 ºC for 2 hours in the
presence of 60 µg/ml proteinase K, boiled for 10 minutes and immediately placed in an ice bath.
The samples were diluted 1:10 in deionized water for quantitative PCR analysis. RNA was
isolated from saponin-lysed parasites using Trizol (Invitrogen) following the manufacturer’s
protocol. Purified RNA was treated with DNAse I (Promega), and reverse-transcribed using
random hexamers and SuperScript III reverse transcriptase (Invitrogen). The cDNA synthesis
reactions were seeded with an RNA transcript generated in vitro off the T7 promoter from a
pCR2.1 cloned segment of the Cryptosporidium parvum COWP gene. The RNA transcript
served as an inhibition control. Cryptosporidium DNA was the kind gift of Michael Riggs
(University of Arizona, Tucson).
Quantitative PCR analysis was performed using a DNA Engine Opticon 2 continuous
fluorescence detection thermocycler. Quantities of target gene were calculated based on a
titration of recombinant plasmid DNA containing both a segment of a single copy nuclear gene
(pm4) and a segment of either a plastid gene (clpC or LSU) or mitochondrial gene (cytB or cox1).
Samples of DNase treated RNA were run for each cDNA sample to verify DNA removal. Data
plots are representative of 5 separate experiments. In the case of the qPCR analysis for the GFP
FACS experiment, the plasmid standard contained all 4 gene targets (tati2, pfpm4, gfp, β-
lactamase) to allow for normalization of primer amplification efficiencies. For analysis of pfpm4
5’ and 3’ cDNA, data was normalized to apicoplast LSU cDNA levels.
Fluorescent in situ Hybridization (FISH)
Parasites were saponin-treated, washed with PBS and deposited as monolayers on
microscope slides (Bond-Rite, Richard-Allan Scientific). A hydrophobic barrier was drawn
around the cell monolayer using a PAP-PEN and slides were air-dried at room temperature
overnight. Cells were fixed for 15 min with 4 % paraformaldehyde and permeabilized with 0.1 %
48
NP-40. Ice-cold acetone was used to clear lipids and cells were treated with 20 µg/ml RNase in
2X SSC at 37 ºC for 30 minutes. Slides were washed 3 times for 3 minutes in PBS after each of
the above steps. The cell monolayers were denatured then hybridized overnight at 37 ºC in the
presence of 2X SSC, 10 % dextran sulphate, 50 % deionized formamide, 250 ng/ml herring
sperm DNA, and 1 ng of DIG-labeled probe (Mancio-Silva et al. 2004). The hybridization
solution was sealed on the monolayer by a coverslip placed over the hydrophobic barrier. Slides
were washed in 2X SSC at 50 ºC for 10 minutes, 2X SSC at 55 ºC for 10 minutes, and 4X SSC at
22C for 10 minutes (Mancio-Silva et al. 2004). Slides were blocked with 1% Roche blocking
reagent and 4% bovine albumin then incubated at for 2 hours at 22 ºC with 1 µg/ml sheep anti-
DIG. Secondary antibody (Alexa 594 goat anti-sheep) was applied at 2 µg/ml for 45 minutes.
Slides were washed 3 times in 100 mM Tris, 150 mM NaCl and 0.3% tween-20 (Mancio-Silva et
al. 2004) and counterstained with 1 µg/ml Hoechst 33342.
Combined FISH / IFA
Ten milliliters of 1-3 % parasitemia culture was washed 3 times with PBS and the cells
were resuspended in 3-4 ml of PBS. Saponin (5 %, w/v stock in PBS) was added to a final
concentration of 0.05 % and tubes were immediately centrifuged at >10,000 x g for 10 min. The
parasite pellet was washed 3 times with PBS, taking care to remove the residual RBC ghosts.
The pellet was finally resuspended in 20 – 60 ul of PBS. Approximately 2 ul of the suspension
was spread onto a Bond-Rite slide (Richard-Allan Scientific) to distribute cells as a monolayer.
The slide was air dried for 30 min to overnight. A hydrophobic barrier was drawn around the
monolayer using a PAP pen. Slides were fixed in with 4 % ultra pure formaldehyde (16 % stock
from Polysciences Inc., No:18814-20) in PBS for 15 min, and washed 3 x 5 min with PBS. Next,
cells were permeabilized with 0.05 % Triton-X in PBS for 15 min, and washed 3 x 5 min with
PBS (no agitation in Coplin jar). The slides were gently blotted dry with Kimwipes. The
49

monolayers were blocked for 1 hour with blocking buffer (1 % w/v Roche blocking reagent in
100 mM maleic acid, 150 mM NaCl, pH 7.5) and incubated with anti-GFP rabbit polyclonal
antibodies (1:100 dilution) in blocking buffer overnight at 4 ºC in a moist chamber. Primary
antibody solution (15-20 µl) was added to the monolayer, and a coverslip was used to seal liquid
within the PAP pen markings. Slides were washed 3 x 20 min in washing buffer (100 mM maleic
acid, 150 mM NaCl, pH 7.5, 0.5 % v/v Tween-20) in Coplin jars. Next, the monolayers were
blocked for 1 hour with blocking buffer and incubated with goat anti-rabbit Alexa Fluor 488 or
568 (1:400 dilution) for 1-2 hours at room temperature. Slides were washed 3 x 20 min in
washing buffer with no agitation in Coplin jars and gently blotted dry. Slides were fixed again
with 4 % ultra pure formaldehyde in PBS for 15 min, washed 3 x 5 min with PBS, and gently
blotted dry. Next, slides were incubated with 70 % deionized formamide in 2X SSC at 70 ºC for
10 min (~ 20 ul of solution was added to the monolayer and sealed with coverslip) (Freitas-
Junior et al. 2005). The coverslip was quickly and gently removed and the slide was immediately
dehydrated in an ice-cold ethanol series (50 %, 70 %, 90 %, 100 % EtOH for 1 minute each) and
the slides were air-dried (Freitas-Junior et al. 2005). FISH probes were denatured for 5 min at 95
ºC in hybridization solution (50 % deionized formamide v/v, 10 % dextran sulphate w/v, 2X
SSC, 250 µg/ml herring sperm DNA). While the probe was denaturing, slides were briefly
heated to 70 ºC. Hybridization solution (10 µl) was added to the monolayer and the area was
sealed with cover slip. Slides were incubated at 70 ºC for 7 min, then overnight at 37 ºC in dark
(Freitas-Junior et al. 2005). The coverslips were gently removed and the monolayers were
incubated with 50 % v/v deionized formamide in 2 X SSC for 30 min at 37 ºC. Slides were
washed with 2× SSC for 10 min at 55 ºC, 2× SSC for 15 min at 60 ºC, and 4× SSC for 10 min at
room temperature. For DIG-labeled FISH probes, the monolayers were blocked for 15 min with
50

blocking buffer, and incubated with sheep anti-DIG (1:200) in blocking buffer for 1.5 hours at
room temperature in the dark. Slides were washed 3 x 20 min with washing buffer in a 50 ml
conical centrifuge tube with periodic inversion. The monolayers were incubated with donkey
anti-sheep Alexa Fluor 594 (1:400) in blocking buffer for 1 hour at room temperature in dark.
The slides were washed 3 x 20 min with washing buffer in a 50 ml conical centrifuge tube with
periodic inversion. The slides were gently blotted dry and mounted with Vectashield with DAPI.
FISH Probe Synthesis
Sixteen gene segments from different regions of the apicoplast DNA were PCR amplified
and gel extracted. The gene regions encompassed 7 kb of sequence and included both LSU
rRNA genes of the inverted repeat, both SSU rRNA genes of the inverted repeat, sufB, ORF 51,
rpoB, rpoC, rpoC2, ORF 79, clpC, tufA, rps7, rps12, rps3, rps19 (Figure 2-1). The amplicons
were either pooled or individually labeled with DIG-dUTP using exo – Klenow and specific
primers. The labeled amplicons were sonicated to an average fragment size of 300 bp.
Plasmid clone #410 was the kind gift of Akhil Vaidya (Drexel University, Philadelphia,
PA) and contained 5.8 kb of the P. falciparum mitochondrial DNA. The plasmid was digested
with EcoRI and BamHI, the mitochondrial DNA sequence was isolated and was DIG-labeled
with random hexamers. The labeled DNA was sonicated to produce fragments with an average
size of 300 bp.
Production of DNA Gyrase Antibody
Anti-GyrA rabbit antiserum was generated against the peptide VEYIKNFDGNEREPK by
Sigma-Aldrich. Serum was collected from the immunized rabbit (#887) every 3 – 4 weeks, and
booster immunizations were administered between each collection. Anti-GyrA antibody was
affinity purified against the immunizing peptide using the SulfoLink Immobilization Kit for
Peptides (Pierce/Thermo-Scientific).
51

Immunoprecipitation of Protein-DNA complexes
Parasites were cultured in the presence of drug for 3 hours (ciprofloxacin: 25 µg/ml, VP16:
50 µM, VM26 25 µg/ml), and control cultures received the equivalent volume of dH20 or
DMSO. Cells were collected and treated with saponin (0.05% w/v) for 10 min at room
temperature and centrifuged at 10,000 x g for 10 min. The parasite pellet was washed 2 times
with complete medium and resuspended in drug (ciprofloxacin: 1 µg/ml, VP16: 10 mM, VM26
10 µg/ml), dH20, or DMSO for 15 min at 37 ºC. One milliliter of preheated (65 ºC) lysis solution
(1 % SDS, 0.4 mg/ml herring sperm DNA, 5 mM EDTA, pH 8) was added to the parasite pellet
and lysates were incubated for 10 min at 65 ºC (Rowe et al. 2001). Next, KCl was added to a
final concentration of 65 mM and the lysates were vigorously vortexed for 10 s to fragment DNA
(Rowe et al. 2001). Samples were placed on ice for 10 min to separate the DNA covalently
bound to protein (precipitate), from the protein-free DNA (supernatant) (Rowe et al. 2001).
Samples were centrifuged at 10,000 x g for 10 min at 4 ºC. The supernatant was transferred to a
clean microcentrifuge tube and placed on ice for later. The pellet was resuspended in wash
solution (10 mM Tris-HCl, 0.1 mg/ml herring sperm DNA, 5 mM EDTA, pH 8.0) and incubated
at 65 ºC for 10 min (Rowe et al. 2001). Samples were placed back on ice for 10 min to allow
precipitation to occur, and centrifuged at 10,000 x g for 10 min at 4 ºC. The wash step was
repeated. A portion of the supernatant and pellet fraction (1/6th total volume) was transferred to a
clean microcentrifuge tube for direct extraction and analysis. For direct extraction, samples were
adjusted to contain a final concentration of 1 % SDS, 100 mM NaCl, and 60 mM EDTA with
500 µg/ml proteinase-K in 500 ul, and were incubated at 65 ºC overnight. DNA was extracted by
phenol/chloroform/isoamyl 25:24:1 followed by chloroform/isoamyl 24:1. DNA was precipitated
with a final concentration of 0.3 M sodium acetate and 2 volumes of 100 % ethanol at -20 ºC for
52

1 hour. The DNA pellet was washed with 70 % ethanol and resuspended in 40 ul of H20. The
DNA (2.5 µl of a 1:10 dilution) was analyzed in duplicate by quantitative PCR.
For immunoprecipitation, the SDS-KCl pellet was resuspended in 1 ml of non-denaturing
lysis buffer [1 % Triton X-100, 50 mM Tris-HCl pH 7.4, 300 mM NaCl, 5 mM EDTA, protease
inhibitor cocktail (complete, Mini; Roche)] (Bonifacino and Dell'Angelica 1998). Recombinant
protein G agarose beads (Invitrogen) were washed 5 times with PBS and equilibrated in non-
denaturing lysis buffer for 30 min at room temperature on a rotating wheel. To reduce non-
specific binding to protein G agarose, 50 µl of a 50 % agarose bead slurry in non-denaturing
buffer was added to the 1 ml sample lysate (Bonifacino and Dell'Angelica 1998). The mixture
was incubated at room temperature for 3 hours with constant mixing using a rotating wheel.
After the pre-clearing step, samples were centrifuged at 10,000 x g for 10 minutes to pellet the
agarose beads and other cellular debris. The supernatant was taken and divided equally into 3
new microcentrifuge tubes. Samples received one of the following: 10 µg of affinity purified
gyrase subunit A antibody (anti-GyrA #887), 10 µg of pre-immune sera (Pre-I #887), or no
antibody. Tubes were affixed to a rotating wheel to supply constant mixing for 1 hour at room
temperature, and were kept at 12 ºC overnight. Fifty microliters of a 50 % suspension of protein
G agarose with herring sperm DNA was added to the samples and tubes were incubated at room
temperature for 1 hour on a rotating wheel (Bonifacino and Dell'Angelica 1998). The protein-G
beads were collected by centrifugation at 8,000 x g for 2 minutes. The beads were washed 2
times with ChIP lysis buffer [50 mM HEPES-KOH, pH 7.5, 140 mM NaCl, 1 mM EDTA, 1 %
Triton X-100, 0.1 % SDS, protease inhibitor (complete, Mini; Roche)] (Yan et al. 2004), 2 times
with TE buffer with protease inhibitors, and 2 times with ice-cold TE (Bonifacino and
Dell'Angelica 1998). The agarose beads were resuspended in 30 ul of PCR lysis buffer (1 %
53

Triton X-100, 1 mM EDTA, and 10 mM Tris-HCl, pH 7.5), and incubated for 2 hours with 200
µg/ml proteinase-K. Samples were boiled for 10 minutes and placed on ice. The samples were
directly analyzed by quantitative PCR.
54

SSU rRNA
Figure 2-1. Map of the 34,682 bp (‘35’ kb) Plasmodium falciparum apicoplast DNA. Gene
sequences were obtained from PlasmoDB (plastid IRA and IRB) and the circle was constructed in Vector NTI (Invitrogen) based on information published in Wilson et al 1996. Xba I and Hind III restriction sites are shown
sufB
ORF51ORF101
rpoB
rpoC
rps2ORF105
ORF79ClpCORF129ORF78tufA
rps7rps12
rpl4rpl23
rpl2
rps3rpl16rps17rpl14rps8
rpl6rps5
ORF91
rps11
rps4
LSU rRNAtRNA-ANLRVRM
rpl36
rps19
SSU rRNA
LSU rRNAtRNA-ANLRVRM
H H
H
H
H
HH
H
H
H
H H
X
X
X
P. falciparum plDNA
rpoC2
sufB
ORF51ORF101
rpoB
rpoC
rps2ORF105
ORF79ClpCORF129ORF78tufA
rps7rps12
rpl4rpl23
rpl2
rps3rpl16rps17rpl14rps8
rpl6rps5
ORF91
rps11
rps4
SSU rRNA
LSU rRNAtRNA-ANLRVRM
rpl36
rps19
SSU rRNA
LSU rRNAtRNA-ANLRVRM
H H
H
H
H
HH
H
H
H
H H
X
X
X
P. falciparum plDNA
rpoC2
55
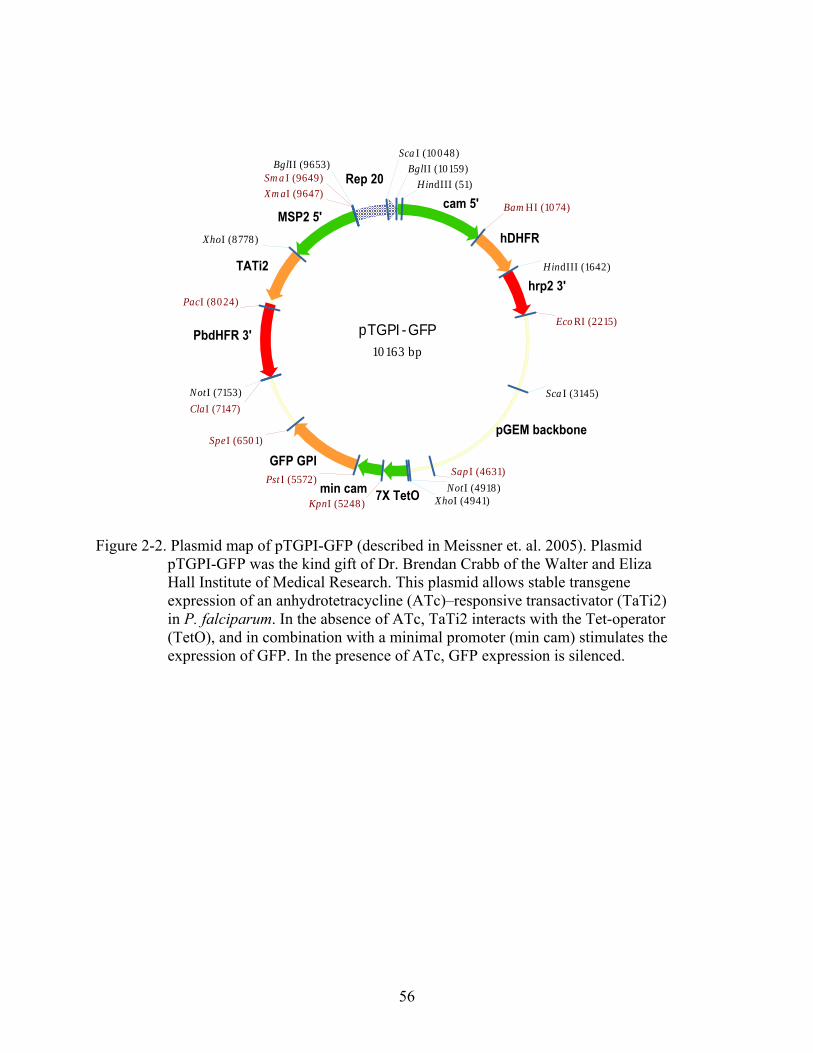
pTGPI-GFP10163 bp
hDHFR
GFP GPI
TATi2
pGEM backbone
cam 5'
7X TetOmin cam
MSP2 5'
Rep 20
hrp2 3'
PbdHFR 3'
BamHI (1074)
ClaI (7147)
EcoRI (2215)
PstI (5572)
SmaI (9649)
XmaI (9647)
KpnI (5248)
PacI (8024)
SapI (4631)
SpeI (6501)
HindIII (51)
HindIII (1642)
BglII (9653) BglII (10159)
NotI (4918)
NotI (7153)
XhoI (4941)
XhoI (8778)
ScaI (3145)
ScaI (10048)
Figure 2-2. Plasmid map of pTGPI-GFP (described in Meissner et. al. 2005). Plasmid
pTGPI-GFP was the kind gift of Dr. Brendan Crabb of the Walter and Eliza Hall Institute of Medical Research. This plasmid allows stable transgene expression of an anhydrotetracycline (ATc)–responsive transactivator (TaTi2) in P. falciparum. In the absence of ATc, TaTi2 interacts with the Tet-operator (TetO), and in combination with a minimal promoter (min cam) stimulates the expression of GFP. In the presence of ATc, GFP expression is silenced.
56
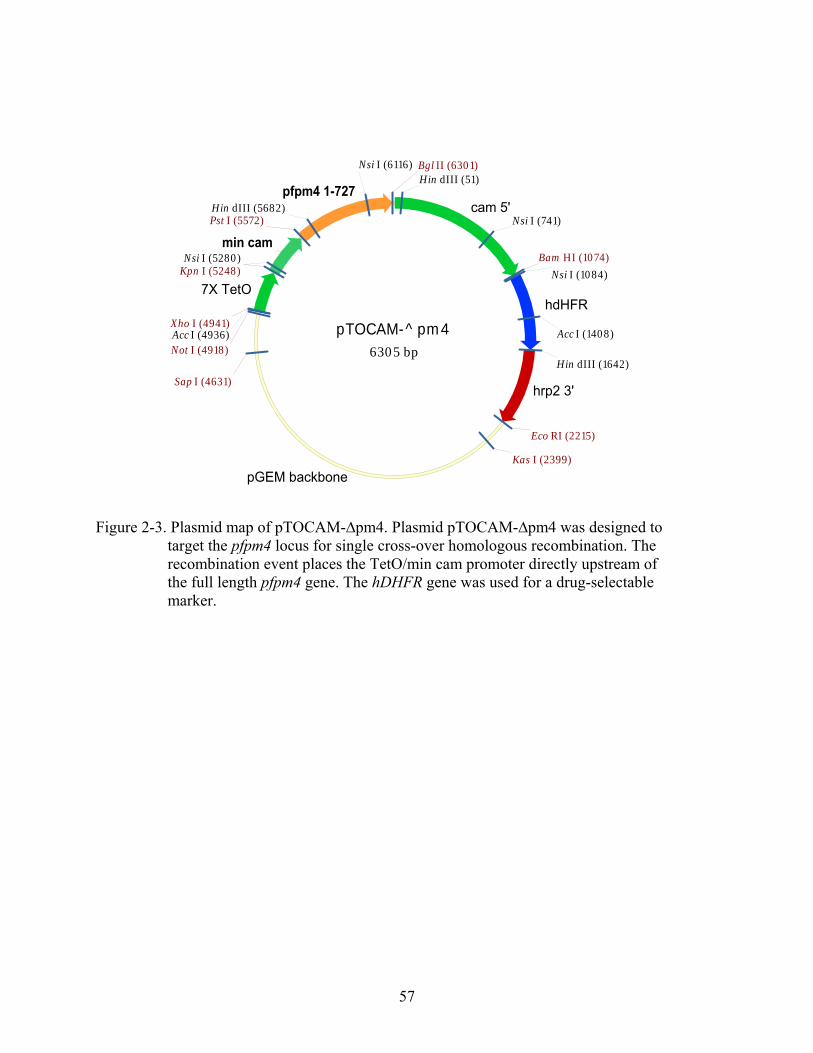
pTOCAM-^pm46305 bp
hdHFR
pGEM backbone
7X TetO
cam 5'
hrp2 3'
min cam
pfpm4 1-727
Bam HI (1074)
Bgl II (6301)
Eco RI (2215)
Kas I (2399)
Kpn I (5248)
Not I (4918)
Pst I (5572)
Sap I (4631)
Xho I (4941)Acc I (1408)Acc I (4936)
Hin dIII (51)
Hin dIII (1642)
Hin dIII (5682)Nsi I (741)
Nsi I (1084)
Nsi I (5280)
Nsi I (6116)
Figure 2-3. Plasmid map of pTOCAM-∆pm4. Plasmid pTOCAM-∆pm4 was designed to
target the pfpm4 locus for single cross-over homologous recombination. The recombination event places the TetO/min cam promoter directly upstream of the full length pfpm4 gene. The hDHFR gene was used for a drug-selectable marker.
57

3' ITRSca I (10888)
Bam HI (1005)
Eco RI (987)
Spe I (1011)Sac II (1025)
Fi
A.
pGYBSD-TA11322 bp
thymidine kinase
tati2 transactivator
blasticidin deaminase
5' ITR
5' ITR
Pbdhfr 3'
Pbdhfr 3'
hrp2 3'
msp2 5'
cam 5'
hsp86 5'
Afe I (8359)
Bgl II (4187)Kpn I (4224)
Sap I (9399)
Xba I (5844)
Age I (7475)
Cla I (8364)
Nco I (4226)
Bam HI (5832)
Eco RI (4232)
Not I (3863)
Not I (5851)
Spe I (5838)
Sac II (3875)
Hin dIII (5254)
Hin dIII (8369)pGYBSD-TATK
3' ITRSca I (7648)
B.
58
pGYBSD-TA8082 bp
tati2 transactivator
blasticidin deaminase
5' ITR
Pbdhfr 3'
hrp2 3'
msp2 5'
cam 5'
Afe I (5119)
Age I (4235)
Bam HI (2592)
Cla I (5124)
Eco RI (987)
Not I (2611)
Sap I (6159)
Spe I (2598)Xba I (2604)
Xho I (4241)
Hin dIII (2014)
Hin dIII (5129)
Xma I (2586)
Xma I (5110)
gure 2-4. Plasmid maps of pGYBSD-TATK and pGYBSD-TA. Plasmids pGYBSD-TATK (A) and pGYBSD-TA (B) were engineered with the piggyBac transposase inverted terminal repeat sequences (5’ and 3’ ITR), the BSD gene for a drug-selectable marker, and the tati2 expression cassette. When transfected with a helper plasmid encoding the piggyBac transposase, the sequence elements flanked by the ITRs in pGYBSD-TATK and pGYBSD-TA are randomly integrated into TTAA genomic sites. pGYBSD-TATK was further engineered with a second 5’ ITR to allow re-mobilization of the thymidine kinase expression cassette, leaving the remaining integrated sequence unable to re-mobilize.
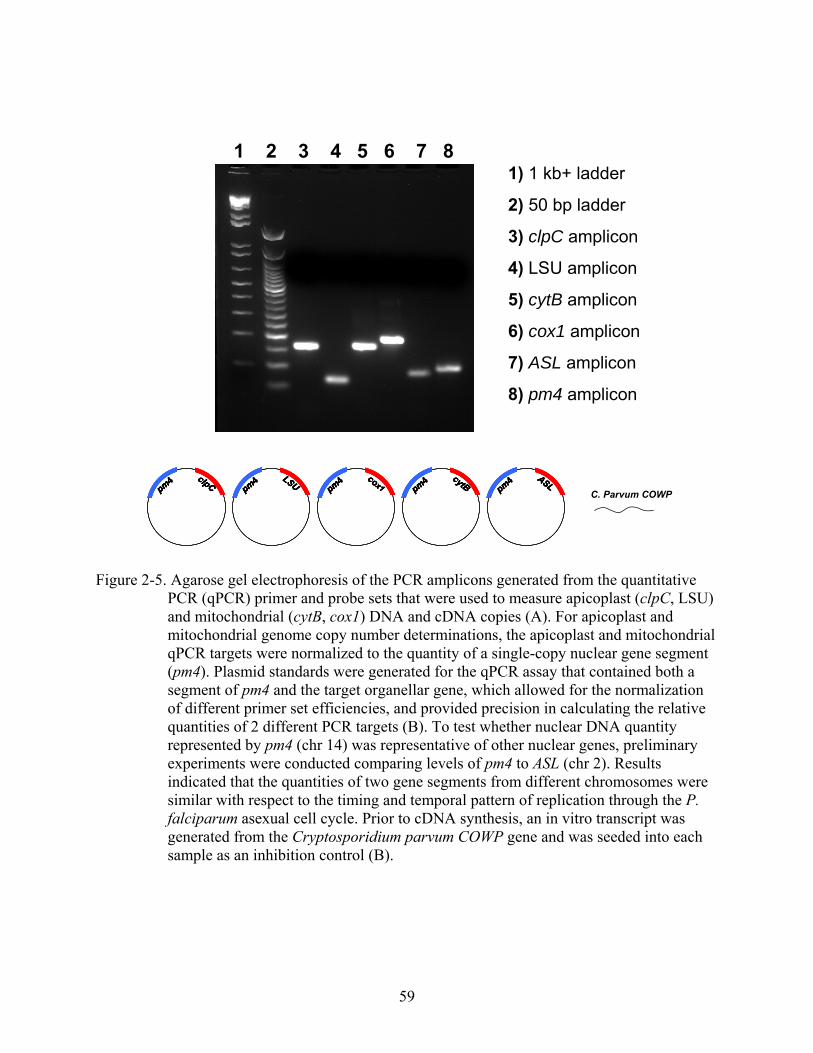
1 2 3 4 5 6 7 81) 1 kb+ ladder
2) 50 bp ladder
3) clpC amplicon
4) LSU amplicon
5) cytB amplicon
6) cox1 amplicon
7) ASL amplicon
8) pm4 amplicon
pm4 clpCpm4 clpC pm4 LSUpm4 LSU pm4 cytBpm4 cytBpm4 cox1pm4 cox1 pm4 ASLpm4 ASLpm4 clpCpm4 clpC pm4 LSUpm4 LSU pm4 cytBpm4 cytBpm4 cox1pm4 cox1 pm4 ASLpm4 ASLC. Parvum COWP
Figure 2-5. Agarose gel electrophoresis of the PCR amplicons generated from the quantitative
PCR (qPCR) primer and probe sets that were used to measure apicoplast (clpC, LSU) and mitochondrial (cytB, cox1) DNA and cDNA copies (A). For apicoplast and mitochondrial genome copy number determinations, the apicoplast and mitochondrial qPCR targets were normalized to the quantity of a single-copy nuclear gene segment (pm4). Plasmid standards were generated for the qPCR assay that contained both a segment of pm4 and the target organellar gene, which allowed for the normalization of different primer set efficiencies, and provided precision in calculating the relative quantities of 2 different PCR targets (B). To test whether nuclear DNA quantity represented by pm4 (chr 14) was representative of other nuclear genes, preliminary experiments were conducted comparing levels of pm4 to ASL (chr 2). Results indicated that the quantities of two gene segments from different chromosomes were similar with respect to the timing and temporal pattern of replication through the P. falciparum asexual cell cycle. Prior to cDNA synthesis, an in vitro transcript was generated from the Cryptosporidium parvum COWP gene and was seeded into each sample as an inhibition control (B).
59

Min.CAM
pm4 ∆3'TetO
hDH
FR
Min.CAM
pm4 ∆3'TetO
hDH
FR
pm4 ∆3'TetO
hDH
FRhD
HFR
Xpm4 genomic sequencepm4 genomic sequence
MinimalCAM
promoterTetO
pm4 full-length sequencehDHFR //pm4 5’sequence
MinimalCAM
promoterTetO
pm4 full-length sequencepm4 full-length sequencehDHFR ////pm4 5’sequence
MinimalCAM
promoterTetO
pm4 full-length sequencehDHFR //pm4 5’sequence
MinimalCAM
promoterTetO
pm4 full-length sequencepm4 full-length sequencehDHFR ////pm4 5’sequence
TetO
bsdtati2 3'ITR5'ITR
-Atc
MinimalCAM
promoterTetO
pm4 full-length sequencehDHFR //pm4 5’sequence
MinimalCAM
promoterTetO
pm4 full-length sequencepm4 full-length sequencehDHFR ////pm4 5’sequence
TetO
bsdtati2 3'ITR5'ITR
-Atc
MinimalCAM promoter
TetOpm4 full-length sequencehDHFR //
pm4 5’sequence
MinimalCAM promoter
TetOpm4 full-length sequencepm4 full-length sequencehDHFR ////
pm4 5’sequence
TetO
bsdtati2 3'ITR5'ITR
χ+Atc
MinimalCAM promoter
TetOpm4 full-length sequencehDHFR //
pm4 5’sequence
MinimalCAM promoter
TetOpm4 full-length sequencepm4 full-length sequencehDHFR ////
pm4 5’sequence
TetO
bsdtati2 3'ITR5'ITR
χ+Atc
ON
OFF C.
B.
A.
Figure 2-6. Schematic representations of genomic loci containing Tet-transactivator elements
showing the anticipated transgene affect of TaTi2 in the absence and presence of anhydrotetracycline (ATc). (A) Single crossover homologous recombination event using plasmid pTOCAM-∆pm4. (B) In the absence of ATc, TaTi2 binds the operator (TetO) turning expression of pfpm4 ON. (C) In the presence of ATc, TaTi2 does not bind the TetO maintaining transcription of pfpm4 OFF.
60

CHAPTER 3 RESULTS
Drug Studies
Effect of DNA Gyrase Inhibitors on Parasite Proliferation
Proliferation of P. falciparum in vitro (measured by 3H-hypoxanthine uptake) was
inhibited by the fluoroquinolone compound ciprofloxacin in a dose-dependent fashion with an
IC50 value of 4.9 µg/ml ± 1.3 (Figure 3-1A). Parasite proliferation was similarly inhibited in a
dose-dependent fashion by coumermycin with an IC50 value of 5.2 µg/ml (Figure 3-1B); and
novobiocin with an IC50 value of 15.8 µM (Figure 3-1C).
Effects of Ciprofloxacin on Parasite Proliferation, Growth, and Viability
Results of the 3H-incorporation assay were confirmed by following the parasitemia of
synchronous parasite cultures treated with ciprofloxacin at three different concentrations (5
µg/ml, 10 µg/ml and 25 µg/ml). At 5 µg/ml ciprofloxacin, approximately half the numbers of
newly invaded rings (compared to control) were present in the second asexual cycle (Figures 3-2
and 3-3). At a concentration of 25 µg/ml ciprofloxacin, parasites were immediately inhibited
within the first asexual cycle and did not produce new progeny over the next 60 hours that were
followed (Figure 3-2). Even in cultures treated with 5 µg/ml ciprofloxacin (which approximates
the IC50) an immediate effect of the drug was observed as asexual development was delayed
(Figure 3-3). Differential counts of all asexual parasite stages revealed that ciprofloxacin induced
a developmental delay during the trophozoite growth stage (Figure 3-4A). Subsequent entry into
the replicative stage (schizont) was delayed (5 µg/ml and 10 µg/ml) or arrested (25 µg/ml)
(Figure 3-4A). The arrested parasites in the 25 µg/ml treatment accumulated as trophozoites
were not viable as assessed by the microscopic identification of energized mitochondria
61

following 1 h incubation with 5 nM DIOC6. Gametocytes were only observed with the 5 µg/ml
ciprofloxacin treatment.
After 34 hours in culture, a portion of culture from the control and 5 µg/ml ciprofloxacin
treated parasites was taken and mature (schizonts) and less mature (trophozoites) forms were
separated using percoll/sorbitol density gradient centrifugation. The parasites were placed back
into culture with drug and after 86 hours were assessed for viability using DIOC6 staining. A
significantly greater proportion of the developmentally-delayed parasites were viable (45 %)
compared to the parasites that continued developing along the prescribed developmental path (10
%) as if drug were not present (i.e. developing similar to the control culture at the time of
collection) (Figure 3-4B).
Organelle Genome Copy Number and DNA Loss with Drug Treatment
Apicoplast and Mitochondrial Genome Copy Number
The determination of apicoplast DNA copy number was initially calculated from data
obtained with different apicoplast genes which were selected based on their proximity to the 35
kb DNA origin of replication: clpC (distant from the origin of replication) and LSU (near the
origin of replication) (Figure 2-1). The ratios of apicoplast to nuclear DNA were approximately 4
fold greater based on the LSU gene as compared to ratios based on the clpC gene (Figure 3-5).
There are 2 copies of the LSU gene and 1 copy of clpC per apicoplast genome, which in part
explains the higher copy number determined by LSU. The LSU genes are also in close proximity
to the origins of replication, and the gene copies may be present at higher numbers due to the
formation of replication intermediates within that region.
Based on ratios of the clpC gene to a single copy nuclear encoded gene (pfpm4),
Plasmodium falciparum contains on average 2 copies of the 35 kb apicoplast DNA per every
nuclear genome copy in non-replicating ring forms (Figures 3-5 & 3-6A). This is an average of
62
the total population and greater variability may be present in individual cells. The copy number
of the mitochondrial DNA was more variable, ranging from 10 – 30 copies in the ring stage
(Figure 3-6B). Each parasite contains a single apicoplast and a single mitochondrion in
trophozoite stages, and a single apicoplast or mitochondrial network in schizont stages (Figures
3-14 & 3-15).
Effects of Ciprofloxacin Treatment on Organellar DNA Replication
Apicoplast DNA was selectively lost in P. falciparum cultures treated with a 50%
inhibitory concentration of ciprofloxacin. Using the ratio of clpC / pm4 the copy number of the
apicoplast DNA was determined to be 2 copies per parasite in non-replicating ring forms. After
96 h in culture with 5 µg/ml ciprofloxacin the copy number of the apicoplast DNA was reduced
to 0.5 copies per parasite (Figure 3-6A). The ratio of cytB / pm4 was used to calculate the
mitochondrial DNA copy number, which did not decrease after 96 h in culture with 5 µg/ml
ciprofloxacin (Figure 3-6B).
The relative quantities of apicoplast, mitochondrial and nuclear gene targets were also
determined and these data are presented in Figure 3-7. The apicoplast-encoded gene segment
(clpC) showed a >100 fold decrease in the ciprofloxacin-treated parasites compared to the
control after 120 h in culture (Figure 3-7B). In contrast, the quantity of the single copy nuclear-
encoded gene segment (pm4) decreased by approximately 10-fold (Figure 3-7A). Like the
nuclear gene, a similar 10-fold loss was observed in the quantity of a mitochondria-encoded gene
segment (cytB) (Figure 3-7C).
Southern blot analysis was also used to follow the time course of the DNA loss with
ciprofloxacin treatment. Both copies of the LSU gene within the inverted repeat region of the
apicoplast DNA were detected with the same probe. Two other genes that are distal from the
origin of replication were also probed (clpC and tufA). By 72 hours, parasites treated with
63
ciprofloxacin showed a decrease in the hybridization intensity of the apicoplast targets. By 108
hours, the apicoplast signal from each of the 4 genes was almost completely lost (Figure 3-8).
The possibility that the P. falciparum DNA gyrase interacts with the mitochondrial DNA was
also considered. The mitochondrial DNA was probed by southern blot and in contrast to the
apicoplast DNA, there was no loss of mitochondrial DNA over 144 hours (Figure 3-8). Further,
in the 5 µg/ml drug treatment there was no loss observed with a nuclear encoded gene (pm4) and
no loss of plastid, mitochondrial or nuclear gene targets when parasites accumulated as pycnotic
forms in hyperparasitemic culture (Figure 3-8). The latter result demonstrated that parasite death
by an alternative manner did not result in the selective loss of apicoplast DNA.
Effects of Ciprofloxacin on Organellar DNA Transcription Accumulation
To examine whether DNA gyrase activity is involved in RNA transcription processes,
levels of LSU rRNA and clpC were determined in synchronous parasites every 12 h over 2
asexual cycles of ciprofloxacin (5 µg/ml) treatment. The RNA levels were normalized to nuclear
DNA copies and the data was reported as rRNA or transcripts / nuclear genome. Both LSU and
clpC showed a temporal pattern of RNA expression where levels were highest in late
trophozoites and lowest in rings (Figure 3-9). With drug treatment, both LSU and clpC RNA
showed a significant decrease (~ 2 log) in the second asexual cycle. In the first asexual cycle,
clpC transcript levels were not significantly different from the control (Figure 3-9B); however
there was a significant decrease in LSU rRNA observed after 12 h and LSU rRNA steadily
decreased over the 96 h experiment (Figure 3-9A). Two mitochondrial transcripts were also
analyzed. The cytB and cox1 transcripts also displayed stage-specific expression where levels
were highest during the late trophozoite stage and lowest during the ring stage (Figure 3-10).
Unlike the apicoplast RNAs, in the second asexual cycle of drug treatment, both cytB and cox1
RNA levels increased (Figure 3-10). There was an approximate 24 h delay in the accumulation
64

of mitochondrial RNA which most likely reflected the developmental delay in the drug treated
parasites (Figures 3-10 and 3-3).
Drug-induced Cleavage
Extensive Southern blot analysis was conducted to determine whether DNA gyrase was
associated with specific regions of the apicoplast 35 kb DNA. Ex vivo parasites were treated with
ciprofloxacin, VP16/VM26, or for controls dH20 and DMSO. SDS denaturant was used to
irreversibly trap DNA cleavage at sites of type II topoisomerase-DNA interactions (Liu et al.
1983, Chen et al. 1984). DNA was treated with 200 µg/ml proteinase-K overnight and isolated
by phenol-chloroform extraction and ethanol precipitation. The purified DNA was digested with
either EcoR I, Nsi I, Hpa I, Xba I, or Hind III and analyzed by southern blotting using a DIG-
labeled mixed apicoplast target probe (same as FISH probe described in Materials and Methods).
The locations of the restriction sites are shown in Figure 3-11. Restriction digests that produced
linear apicoplast DNA (EcoR I, Nsi I) showed a distinctive smear in ciprofloxacin treated
parasites that was not present in the control (Figure 3-12). The DNA smear was also present in
the VP16 treated parasites in the Nsi I digest. In the Nsi I digest the smear extended to
approximately 13 kb, and in the Eco RI digest the smear extended to somewhat lower molecular
weight bands reaching 11 kb (Figure 3-12). There was no smearing observed in probed
fragments that were 22.5 kb and smaller in size. The blot was also hybridized with a specific
probe for the SSU rRNA gene which also detected the smear (Figure 3-12). In a different
experiment, Hpa I digests were specifically probed with SSU and LSU. Results indicated that
either one or both of the Hpa I sites within the inverted repeat region was blocked from digestion
(Figure 3-13).
65

Immunoprecipitation of DNA
Affinity purified GyrA rabbit antibodies were used to immunoprecipitate DNA that was
covalently bound to GyrA through drug-induced cleavable complex formation and subsequent
addition of protein denaturant. The procedure first entailed precipitation of covalent protein-
DNA complexes using the K+-SDS precipitation method (Rowe et al. 2001). Results from three
K+-SDS precipitation experiments are listed in Table 1. Treatment with VM26 resulted in the
precipitation of nuclear, apicoplast and mitochondrial DNA targets. Treatment with ciprofloxacin
did not result in precipitation of nuclear DNA, but resulted in a small enrichment of apicoplast
DNA and to a lesser extent mitochondrial DNA.
Immunoprecipitated DNA was analyzed by quantitative PCR for apicoplast (clpC and
LSU), mitochondrial (cytB and cox1) and nuclear gene (pfpm4) targets and the data is presented
as the fold increase in gene target relative to the control. Table 2 lists the results from VM26
treated cells and Table 3 lists the results from ciprofloxacin treated cells. The percentage of input
DNA for each target after immunoprecipitation (IP) was calculated, and the data was normalized
to no antibody controls and the IP data from non-drug treated samples, and finally a ratio of IP
by specific GyrA antibody to IP by pre-immune antibodies was calculated. After VM26
treatment and immunoprecipitation, the fold enrichment of apicoplast DNA targets relative to
untreated controls in one experiment was 7-fold for LSU and 20-fold for clpC, while the
mitochondrial and nuclear DNA targets were enriched by less than 3-fold. In another experiment
with VM26 treatment, IP resulted in a greater enrichment of apicoplast DNA targets compared to
mitochondrial and nuclear DNAs, although the enrichment was less dramatic. IP of ciprofloxacin
treated cells did not result in good enrichment of DNA targets.
66

Organellar DNA Segregation
Visualization of Apicoplast and Mitochondrial DNAs during Asexual Parasite Development
The morphology of the apicoplast and mitochondrion was observed during asexual
development. Images of the organelles in different stage parasites are shown in Figures 3-14 and
3-15. Fluorescent in situ hybridization was used to visualize the apicoplast and mitochondrial
DNAs throughout asexual parasite development. The apicoplast DNA was localized to a single
punctuate spot in trophozoites. In mature trophozoites the intensity of the hybridization signal
increased and during schizogony numerous hybridization foci were observed (Figure 3-16). The
mitochondrial DNA was also observed as a single punctuate spot in early trophozoites and the
number of hybridization foci steadily increased during schizogony (Figure 3-17). It was
observed that the first apicoplast and mitochondrial DNA segregations commonly preceded the
onset of nuclear DNA segregation. Interestingly, the apicoplast and mitochondrial DNAs did not
show a clear association with the developing nuclei until the culmination of schizogony when
organellar division was complete and for each only a single punctuate spot corresponding to the
nidus of a minimal organelle was observed within each daughter merozoite.
Effects of Ciprofloxacin Treatment on Organellar DNA Division
The effects of DNA gyrase inhibition by ciprofloxacin were studied on an individual
cellular level by using fluorescent in situ hybridization (FISH). Parasites that were subjected to a
24 hour treatment with 5 µg/ml ciprofloxacin showed a dramatic reduction in the intensity and
number of plastid DNA hybridization foci. Typically 8 – 10 foci were seen in 36-hour schizonts,
however just 1-2 foci were seen in the drug treated schizonts (Figure 3-18). Conversely,
mitochondrial DNA segregation was unaffected (Figure 3-18). A concentration of 50 µg/ml
ciprofloxacin was added to ring stage parasites and the in situ effects of drug treatment were
examined 24 h later. The plastid DNA signal was not detected in most cells, whereas the
67

mitochondrial DNA was clearly visible and even appeared to have undergone 1 or more rounds
of replication and division (Figure 3-18).
Visualization of the Apicoplast and Apicoplast DNA during Asexual Parasite Development
Combined immunofluorescence and fluorescent in situ hybridization were used to follow
both organellar morphology and nucleoid distribution in asexual stages of P. falciparum. Figure
3-19 shows representative images from different parasite stages. As was observed in the FISH
studies described above, the apicoplast DNA was predominately organized as single discrete
nucleoid structures in non-replicating rings and trophozoites. In trophozoites the apicoplast DNA
signal colocalized with a large proportion of the apicoplast as defined by the signal from
antibody binding to apicoplast GFP (Figure 3-19A & B). In maturing trophozoite stages when
the apicoplast began to elongate, the nucleoid was often visualized as semi-discrete foci at both
ends of the elongating apicoplast (Figure 3-19C). As the apicoplast elaborated and began to
branch, multiple nucleoids were observed within the apicoplast that varied in shape, size and
hybridization intensity, and often appeared to encompass the entire stromal compartment (Figure
3-19D, E & F). In mature and segmenting schizonts the nucleoid signal was smaller and discrete
PDHF were associated with nuclei (Figure 3-19G & H).
The increased luminal staining observed in combined FISH/IFA as compared to FISH
alone could be a result of hybridization to rRNAs. By electron microscopy analysis, the texture
of the apicoplast stroma usually appears to be homogeneous, showing a fine granular texture that
is indicative of plastid 70S ribosomes (McFadden et al. 1996, McFadden and Waller 1997). By
FISH alone in which the protocol included an RNase treatment step, the apicoplast DNA signals
were more commonly visualized as discrete foci
68
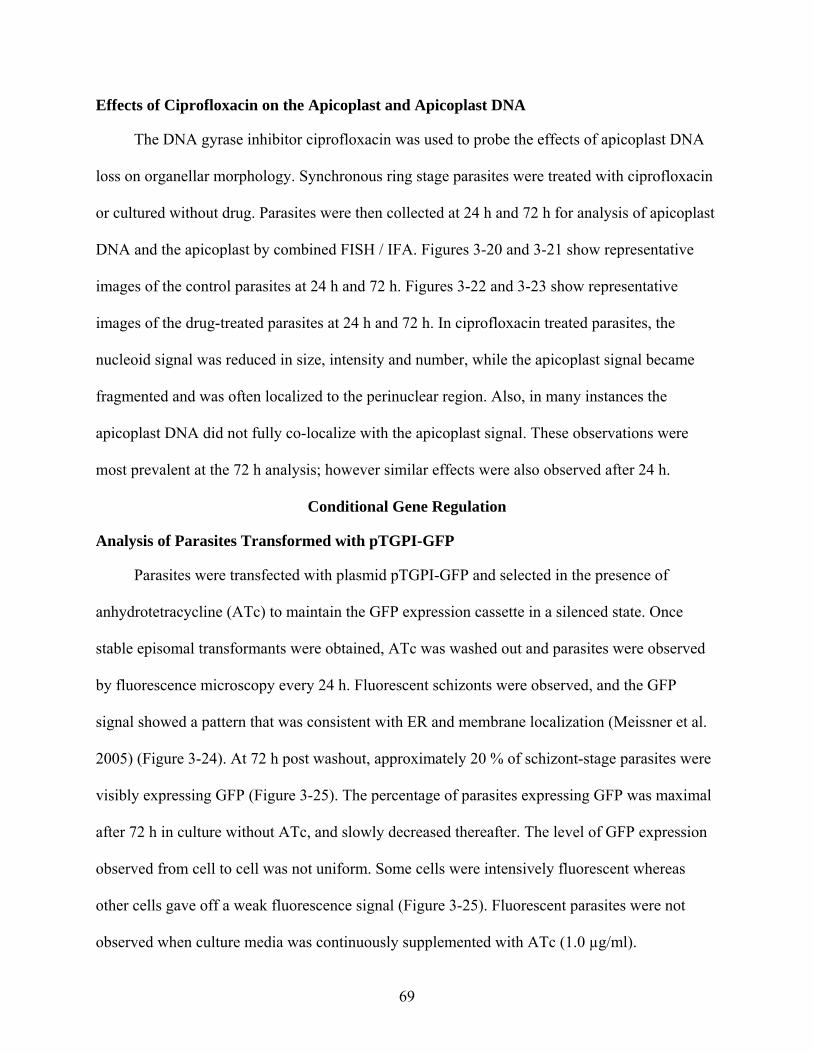
Effects of Ciprofloxacin on the Apicoplast and Apicoplast DNA
The DNA gyrase inhibitor ciprofloxacin was used to probe the effects of apicoplast DNA
loss on organellar morphology. Synchronous ring stage parasites were treated with ciprofloxacin
or cultured without drug. Parasites were then collected at 24 h and 72 h for analysis of apicoplast
DNA and the apicoplast by combined FISH / IFA. Figures 3-20 and 3-21 show representative
images of the control parasites at 24 h and 72 h. Figures 3-22 and 3-23 show representative
images of the drug-treated parasites at 24 h and 72 h. In ciprofloxacin treated parasites, the
nucleoid signal was reduced in size, intensity and number, while the apicoplast signal became
fragmented and was often localized to the perinuclear region. Also, in many instances the
apicoplast DNA did not fully co-localize with the apicoplast signal. These observations were
most prevalent at the 72 h analysis; however similar effects were also observed after 24 h.
Conditional Gene Regulation
Analysis of Parasites Transformed with pTGPI-GFP
Parasites were transfected with plasmid pTGPI-GFP and selected in the presence of
anhydrotetracycline (ATc) to maintain the GFP expression cassette in a silenced state. Once
stable episomal transformants were obtained, ATc was washed out and parasites were observed
by fluorescence microscopy every 24 h. Fluorescent schizonts were observed, and the GFP
signal showed a pattern that was consistent with ER and membrane localization (Meissner et al.
2005) (Figure 3-24). At 72 h post washout, approximately 20 % of schizont-stage parasites were
visibly expressing GFP (Figure 3-25). The percentage of parasites expressing GFP was maximal
after 72 h in culture without ATc, and slowly decreased thereafter. The level of GFP expression
observed from cell to cell was not uniform. Some cells were intensively fluorescent whereas
other cells gave off a weak fluorescence signal (Figure 3-25). Fluorescent parasites were not
observed when culture media was continuously supplemented with ATc (1.0 µg/ml).
69

FACS analysis was used to assess how rapidly expression of GFP was silenced upon
addition of ATc. Asynchronous cultures were propagated in the absence of ATc for 72 hours and
the number of GFP-expressing parasites was counted (Day 0) from 1 million sorted cells. ATc (1
µg/ml) was applied to cultures after the initial count on Day 0 and the number of GFP-expressing
parasites were counted from 1 million sorted cells every 24 hours for 3 days. When ATc was
added to the culture for as little as 24 hrs, there was a 10 fold decrease in the percentage of
fluorescent parasites reaching background levels observed with parasites in continuous culture
with ATc (Figure 3-26).
Fluorescently sorted parasites were also analyzed by quantitative PCR to determine the
copy number of pTGPI-GFP in GFP-expressing vs. GFP non-expressing cells. At 90 days and
180 days post-transfection, ATc was washed out and the GFP-expressing parasites and the non
GFP-expressing parasites were sorted from the mixed culture by FACS. For both time points,
8,000 GFP positive cells were collected. Quantitative PCR was used to determine the plasmid
copy number in GFP +, GFP -, and unsorted parasites. The plasmid standard for the qPCR assay
contained gene segments for each of the 3 plasmid targets (tati2, gfp, B-lactamase) and a gene
segment of a single-copy nuclear gene used for normalization. At 90 d post-transfection, the
GFP+ cells contained on average 1 copy plasmid per parasite (Figure 3-27A) while at 180 d
post-transfection the GFP + cells contained roughly between 10 – 30 copies of plasmid (Figure
3-27B). The range of fluorescent intensity in the GFP + parasites at 90d and 180 d did not
appear dramatically different when viewed by fluorescent microscopy. FACS data indicated that
Further, the percentage of parasites that expressed GFP only slightly increased at 180 d.
Additional fluorescent sorts were used to isolate the GFP-expressing cells which were then
placed back into culture. The progeny of these parasites were not uniformly fluorescent and
70

number of fluorescent parasites gradually decreased as observed when ATc was removed from
the unsorted culture. The GFP sorted parasites were also placed back into culture in the presence
of ATc for 14 d. Upon washout of ATc, the number of GFP expressing parasites was similar to
what was observed for the washout experiments using unsorted cells (i.e. ~ 20 % of schizonts).
Targeted Genomic Insertion of the Tet-Operator / Min Cam Promoter
The pfpm4 gene was targeted by single-crossover homologous recombination using
plasmid pTOCAM-∆pm4. Clonal parasite lines were obtained by limiting dilution. Southern blot
analysis and PCR for integration verified that pfpm4 was partially duplicated in the clones which
resulted in the insertion of a 7X repeat of the tet-operator sequence and a truncated segment of
the P. falciparum calmodulin promoter immediately 5’ to the full length copy of pfpm4 and
natural pfpm4 3’-UTR (Figures 3-28 and 3-39). PCR products were cloned and sequenced to
verify that pfpm4 remained in frame. Southern blot analysis also indicated that one or more extra
copies of the plasmid were integrated in the pTOCAM-∆pm4 clones (Figure 3-28). Clones C3
and B3 initially appeared to contain the stoichiometric equivalent of one extra plasmid copy and
thus C3 was selected as the parasite line in which to introduce transactivator expression
cassettes. The proliferation characteristics of clones C3 and B3 were very similar to that of the
parental 3D7 strain (Figure 3-30). By western blot, PfPM4 protein expression was not detected in
any of the pTOCAM-∆pm4 clones analyzed (Figure 3-31). Furthermore, 3D7 protein lysates
were diluted in C3 protein lysates and by western blot it was determined that PfPM4 levels in C3
were at least 16-fold less than in 3D7 (Figure 3-31).
Creation and Characterization of the TA Parasite Lines
In other parasites, the piggyBac transformation system was utilized to stably integrate
transactivator (tati2) expression cassettes into the P. falciparum genome to create cultures TA-
01, TA-02, TATK-03, and TATK-04. Southern blot analysis revealed that there were
71

approximately 20 unique insertion events in the uncloned piggyBac transformants (Figure 3-32).
The level of transactivator expression in the uncloned lines was analyzed by western blotting and
compared to TaTi2 expression from episomally transformed pTGPI-GFP. Most of the piggyBac
lines with integrated tati2 copies showed steady-state TaTi2 levels that appeared to be similar to
those expressed by parasites carrying pTGPI-GFP as episomal copies (Figure 3-33). Cultures
were cloned by limiting dilution and southern blot and quantitative PCR analysis indicated that
most TA-01 parasites contained either 2 or 3 copies of tati2, while TA-02, TATK-03, and
TATK-04 parasites contained 1 copy of tati2 (Figure 3-34). Clones containing more than 1
integration of tati2 showed correspondingly greater steady-state expression of TaTi2 protein
(Figures 3-34 and 3-35). Furthermore, the transactivator-expressing parasites were always
cultured in the absence of anhydrotetracycline (ATc) and still maintained apparently stable
expression of TaTi2, suggesting that TaTi2 alone was not toxic for the cell.
Creation and Characterization of the C3-TA Parasite Line
The piggyBac transformation system was next used to introduce transactivator expression
cassettes into pTOCAM-∆pm4 (clone C3) to produce culture C3TA. Post-transfection, cultures
C3TA-B1 and C3TA-B2 were selected in the absence of ATc to allow for expression of pfpm4.
Stable transformants were selected and verified for tati2 integration by southern blot (Figure 3-
36). By western blot however, PfPM4 and TaTi2 protein expression were not initially detected.
After C3TA-B1 was cultured for 96h and 196h in the presence of ATc, expression of TaTi2
protein was readily detected at each time point. TaTi2 levels did not appear to increase between
96 and 196 hours, indicating that parasites achieved maximum steady-state TaTi2 expression
levels within 96 hours of culture with ATc (data not shown).
For subsequent experiments, C3TA-B1 parasites were cultured in the presence of ATc and
a drug wash-out approach was used in an effort to regulate the expression of pfpm4. Even upon
72

accumulation of TaTi2 and subsequent wash-out of ATc, induction of PfPM4 protein expression
was only potentially detected upon over-exposure of the western blot (data not shown). The
expression of two functionally related proteins (PfPM1 and FP3) was not affected during the
washout experiments (Figure 3-41). Numerous antibodies were used for western blot detection of
PfPM4: rabbit antiserum generated to both N-terminal and internal regions of PfPM4 both before
and after affinity purification, and PfPM4 monoclonal antibodies that were the kind gift of Dan
Goldberg (Washington University, St. Louis, MO). TaTi2 protein levels remained consistently
less in C3TA-B1 cultured without ATc (Figure 3-37A, B, & C). To examine whether the nature
of this effect was extended to other genes under the control of the TetO, parasites transformed
with pTGPI-GFP were analyzed after culture without ATc for 40 days. The same TaTi2
silencing phenomenon was observed with these parasites (Figure 3-37D).
The regulation of pfpm4 expression in the wash-out studies was also investigated at the
RNA level. By quantitative RT-PCR it was found that pfpm4 3‘ transcripts were reduced by 100-
fold in pTOCAM-∆pm4 clone C3, but the 5’ pfpfm4 transcript levels were essentially the same
as wild-type 3D7 (Figure 3-38). The 5’ pfpm4 transcripts in C3TA-B1 (in continuous culture
with and without ATc) were also detected at similar levels to C3 and 3D7, however the 3’
transcripts were on average 50-fold less than 3D7 (Figure 3-38). In the first of three separate
experiments, upon wash-out of ATc from culture C3TA-B1 there was a 12.7-fold increase of 3’
pfpm4 transcripts and a 6.8-fold increase in 5’ transcripts was detected by qPCR after 72 h
(Figure 3-38A). By northern blot analysis, the increase in the 5’ transcripts was readily observed
(Figure 3-43A). However, even upon induction, pfpm4 3’ transcripts remained below the
detection limits of the northern blot. The following 2 washout experiments did not result in an
induction of pfpm4 3’ RNA expression. Nevertheless an important observation was made. The
73

temporal pattern of pfpm4 3’ RNA expression closely followed tati2 expression, while 5’ pfpm4
expression varied independently (Figures 3-38 & 3-39).
The C3 and C3TA parasite lines were analyzed by southern blot using a restriction enzyme
(Bsr GI) flanking the pfpm4 locus to determine how many plasmid copies of pTOCAM-∆pm4
were integrated. Prior to the introduction of tati2 expression cassettes, pTOCAM-∆pm4 clone C3
was comprised mostly of parasites with either 1 or 2 extra plasmid copies integrated at the pfpm4
locus. After introduction of tati2 expression cassettes by piggyBac transformation, parasite line
C3TA-B1 mostly contained parasites with 3 extra plasmid copies integrated (Figure 3-40).
Parasite lines C3TA-B2 and –A1 mostly contained 4 or more extra plasmid copies while C3TA-
A2 contained approximately equal numbers of parasites with either no extra copies, 1 extra copy,
or 2 extra plasmid copies (Figure 3-40). pTOCAM-∆pm4 clone B3 started with parasites
containing either no extra plasmid copies or 2 extra copies, and following additional rounds of
selection after attempted piggyBac transformation one of the resulting parasite lines contained no
extra copies, but the other parasite line mostly contained 1 extra integrated copy (Figure 3-40).
These data demonstrate that DNA integrated by single-crossover recombination was prone to
expansion and contraction, and the copy number did not remain stable over time in culture.
Summary of Conditional Gene Regulation Findings
In summary, efforts to configure the Tet-transactivator system into a tool that will provide
conditional regulation of endogenous P. falciparum genes have led to the following key findings:
1) A single copy of tati2 is sufficient to regulate transgene expression in parasites episomally
transformed with pTGPI-GFP; 2) Higher steady-state transactivator expression is achieved in
parasites that contain more than 1 integrated copy of the expression cassette; 3) Transactivator
protein is stably expressed in the absence of the Tet-operator / minimal calmodulin promoter
sequence; 4) In the absence of ATc, transactivator expression is silenced in parasites that contain
74

the Tet-operator / minimal calmodulin promoter sequence; 5) Transactivator silencing in the
presence of Tet-operator / minimal calmodulin promoter is apparently independent of the
chromosomal positioning of Tet-transactivator elements in cis; 6) Continual stimulation of pfpm4
expression using the Tet-transactivator system was not achieved and was confounded by the
silencing of TaTi2; 7) Only a slight induction of pfpm4 occurred upon transient stimulation of
expression.
75

Ciprofloxacin
Log [µg/mL]
-1 0 1 2
% In
hibi
tion
0
20
40
60
80
100Sigmoidal RegressionLog [Cipro] vs 3D7
Figure 3-1. Dosage-dependent response of P. falciparum proliferation in in vitro culture to DNA gyrase inhibitors using [3H]-hypoxanthine uptake assays. A variable-slope sigmoidal dose-response nonlinear regression equation (Systat Software Inc.) was used to generate the fifty-percent inhibitory concentrations (IC50) for each drug. DNA gyrase is a heterotetramer (2 gyrA: 2 gyrB) and ciprofloxacin targets the active site of gyrA while coumermycin and novobiocin target the ATPase domain on gyrB. The IC50 values for gyrase inhibitors were as follows: ciprofloxacin, 4.9 µg/ml (Panel A); coumermycin, 5.2 µg/ml (Panel B); novobiocin, 15.8 µM (Panel C). The percentage reductions were plotted as a function of drug concentration where the concentrations of ciprofloxacin used were 40 µg/ml, 20 µg/ml, 10 µg/ml, 5.0 µg/ml, 2.5 µg/ml, 1.25 µg/ml, 0.625 µg/ml; the concentrations of coumermycin used were 50 µg/ml, 25 µg/ml, 12.5 µg/ml, 6.25 µg/ml, 3.125 µg/ml, 1.56 µg/ml, 0.781 µg/ml and the concentrations of novobiocin were 400 µM, 200 µM, 100 µM, 50 µM, 25 µM, 12.5 µM, 6.25 µM.
IC50 = 4.9 µg/mL
A.Ciprofloxacin
Log [µg/mL]
-1 0 1 2
% In
hibi
tion
0
20
40
60
80
100Sigmoidal RegressionLog [Cipro] vs 3D7 IC50 = 4.9 µg/mL
A.Coumermycin
Log [ug/mL]
-1 0 1 2
% In
hibi
tion
0
20
40
60
80
100Sigmoidal regressionLog [ug/mL] vs %inhibition IC50 = 5.2 ug/mL
B.Coumermycin
Log [ug/mL]
-1 0 1 2
% In
hibi
tion
0
20
40
60
80
100Sigmoidal regressionLog [ug/mL] vs %inhibition
B.
Log [uM]
IC50 = 5.2 ug/mL
NovobiacinNovobiacinNovobiocin C.C.
0.0 0.5 1.0 1.5 2.0
% In
hibi
tion
0
20
40
60
80
100Sigmoidal RegressionLog [uM] vs %inhibition IC50 = 15.8 µM
Log [uM]
0.0 0.5 1.0 1.5 2.0
% In
hibi
tion
0
20
40
60
80
100Sigmoidal RegressionLog [uM] vs %inhibition IC50 = 15.8 µM
76

Time (hours)
0 20 40 60 80 100 120
Par
asite
mia
(%)
0
1
2
3
4
5
6
7ControlCipro 5 µg/ml Cipro 10 µg/ml Cipro 25 µg/ml
A. B.
0
0.1
0.2
0.3
0.4
0.5
0.6
0.7
0.8
0.9
0 12 24 36 48 60 72 84 96 108 120Time (hours)
Pm4
Am
plic
on (p
g)
ControlCipro 5 ug/mlCipro 10 ug/mlCipro 25 ug/ml
Figure 3-2. Proliferation of parasites cultured in complete media with different concentrations of ciprofloxacin. Percent parasitemia (% of number of infected red blood cells/total number of red blood cells) is shown in (A). Counts were determined from microscopic analysis of Hema 3 stained blood smears. Parasitemia did not increase over 110 h with the 25 µg/ml ciprofloxacin treatment. DNA quantity determined by qPCR of a single-copy gene is shown in (B).
77
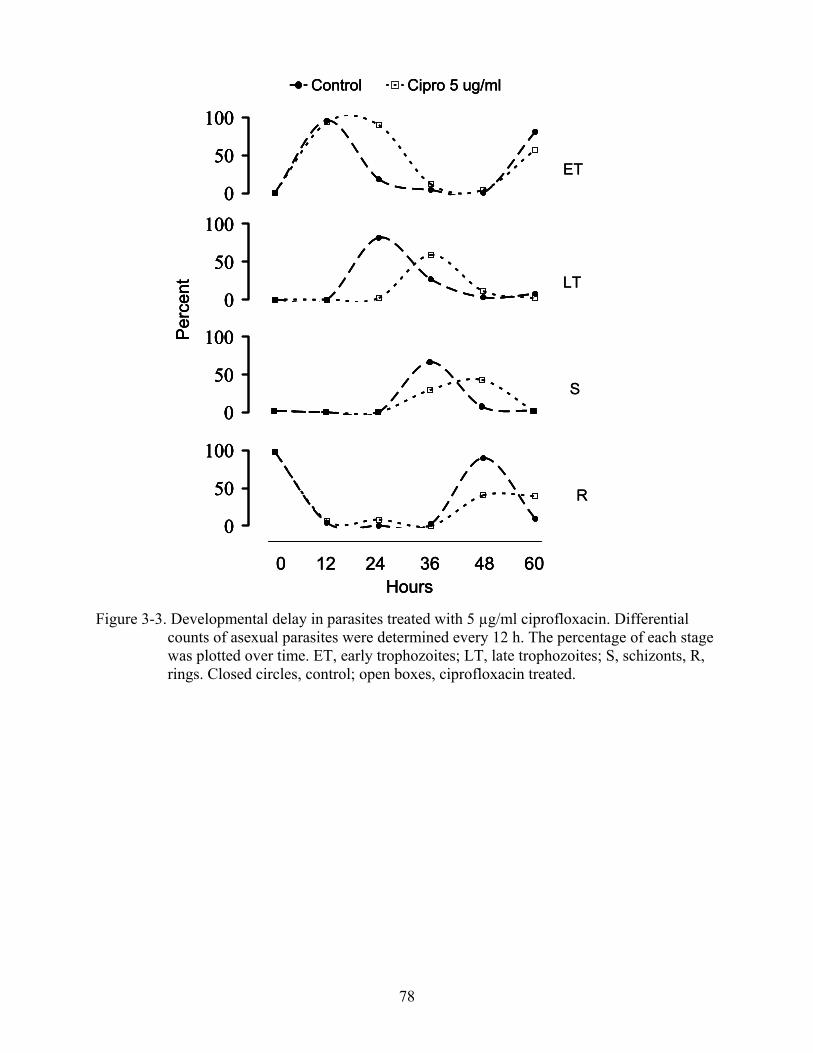
78
ET
LT
S
R
Per
cent
0
50
100
0
50
1000
50
100
0
50
100
Control Cipro 5 ug/ml
0 12 24 36 48 60Hours
ET
LT
S
R
Per
cent
0
50
100
0
50
1000
50
100
0
50
100
Control Cipro 5 ug/ml
0 12 24 36 48 60Hours
Per
cent
0
50
100
0
50
1000
50
100
0
50
100
0
50
100
0
50
1000
50
100
0
50
100
Control Cipro 5 ug/ml
0 12 24 36 48 60Hours
Figure 3-3. Developmental delay in parasites treated with 5 µg/ml ciprofloxacin. Differential
counts of asexual parasites were determined every 12 h. The percentage of each stage was plotted over time. ET, early trophozoites; LT, late trophozoites; S, schizonts, R, rings. Closed circles, control; open boxes, ciprofloxacin treated.

A. Ring Trophozoite Mature Trophozoite Schizont Gametocyte
0
20
40
60
80
100
0 20 40 60 80 100
Time (Hours)
Perc
ent
0
20
40
60
80
100
0 20 40 60 80 100
Perc
ent
0
20
40
60
80
100
0 20 40 60 80 100
Perc
ent
0
20
40
60
80
100
0 20 40 60 80 100
Perc
ent
Ring Trophozoite Mature Trophozoite Schizont Gametocyte
0
20
40
60
80
100
0 20 40 60 80 100
Time (Hours)
Perc
ent
0
20
40
60
80
100
0 20 40 60 80 100
Perc
ent
0
20
40
60
80
100
0 20 40 60 80 100
Perc
ent
0
20
40
60
80
100
0 20 40 60 80 100
Perc
ent
0
20
40
60
80
100
0 20 40 60 80 100
Time (Hours)
Perc
ent
0
20
40
60
80
100
0 20 40 60 80 100
Perc
ent
0
20
40
60
80
100
0 20 40 60 80 100
Perc
ent
0
20
40
60
80
100
0 20 40 60 80 100
Perc
ent
Time (Hours)
Control Cipro 5 ug/ml
Cipro 10 ug/ml Cipro 25 ug/ml
0
25
50
75
100
Control Cipro 5 ug/ml
Via
ble
para
sites
aft
er 2
Ase
xual
Cyc
les (
%)
Total cultureDelayed Development at 34 hrsRegular Development at 34 hrs
B. Figure 3-4. Parasite differentiation in untreated control cultures and cultures treated with 5 µg/ml
ciprofloxacin (A). Highly synchronized parasites at the newly invaded ring stage were used to initiate cultures at t0 with or without addition of ciprofloxacin. Differential counts of parasites in each of the morphologically recognized stages of development in the asexual cycle were counted at each of 9 time points over a 120 hr period and expressed as a percent of the total. Data is representative of 5 separate experiments. Arrows indicate time point during drug treatment (34 h) at which a portion of the culture was taken and mature and immature forms separated by density gradient centrifugation and used to establish separate cultures under continued drug treatment. Viability of the isolated mature and immature parasites was assessed by DIOC6 staining after an additional 86 h in culture and results of microscopic counts from 20 fields of view are shown in (B).
79
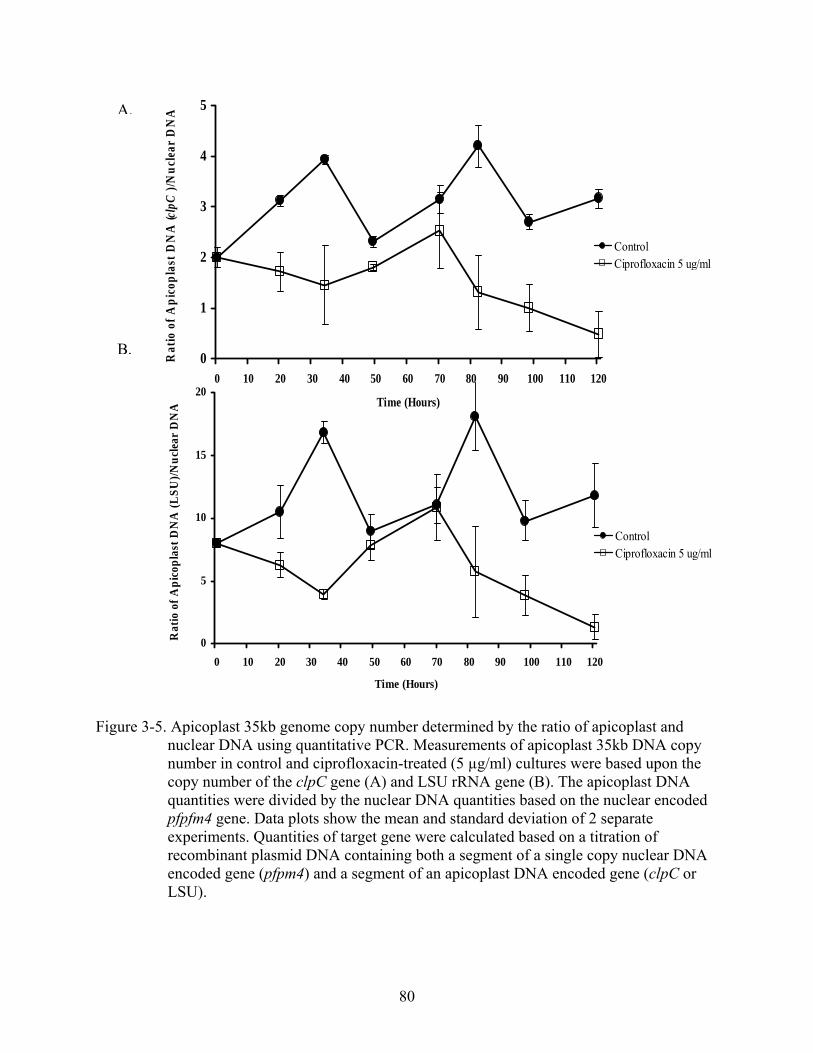
80
0
5
10
15
20
0 10 20 30 40 50 60 70 80 90 100 110 120
Time (Hours)
Rat
io o
f Api
copl
ast D
NA
(LSU
)/Nuc
lear
DN
A
Control Ciprofloxacin 5 ug/ml
Control Ciprofloxacin 5 ug/ml
0
1
2
3
5
0 10 20 30 40 50 60 70 80 90 100 110 120
Time (Hours)
Rat
io o
f Api
copl
ast D
NA
(clp
C)/N
r D
NAA.
4uc
lea
B.
Figure 3-5. Apicoplast 35kb genome copy number determined by the ratio of apicoplast and nuclear DNA using quantitative PCR. Measurements of apicoplast 35kb DNA copy number in control and ciprofloxacin-treated (5 µg/ml) cultures were based upon the copy number of the clpC gene (A) and LSU rRNA gene (B). The apicoplast DNA quantities were divided by the nuclear DNA quantities based on the nuclear encoded pfpfm4 gene. Data plots show the mean and standard deviation of 2 separate experiments. Quantities of target gene were calculated based on a titration of recombinant plasmid DNA containing both a segment of a single copy nuclear DNA encoded gene (pfpm4) and a segment of an apicoplast DNA encoded gene (clpC or LSU).

Rat
io c
lpC
/ pm
4 D
NA
0
1
2
3
4
5
12 24 36 48 60 72 84 96Time (hours)
ControlCipro 5 ug/ml
Rat
io c
lpC
/ pm
4 D
NA
0
1
2
3
4
5
12 24 36 48 60 72 84 96Time (hours)
ControlCipro 5 ug/ml
plDNA copy number n = 5
0
10
20
30
40
12 24 36 48 60 72 84 96Time (hours)
Rat
io c
ytB
/ pm
4
ControlCipro 5 ug/ml
mtDNA copy number n = 5
A.
B.
Figure 3-6. Copy number of apicoplast and mitochondrial DNA with and without ciprofloxacin
treatment. Data is reported as the average of five separate experiments and error bars represent the standard deviation of the mean. Copy number was calculated based on the ratio of clpC and pm4 for apicoplast DNA or cytB and pm4 for mitochondrial DNA. Highly synchronous rings were used to initiate the experiment and samples were collected every 12 h over 2 asexual cycles. Drug was added to the ring stage parasites and maintained in culture throughout the experiment. Time points correspond to the following developmental stages in the control samples: 12 & 60 h, mid-trophozoites; 24 & 72 h, late-trophozoites; 36 & 84 h, schizonts; 48 & 96 h, rings.
81

Time (hours)0 20 40 60 80 100 120
Log
pm4
DN
A (p
g)
0.1
1
10
100
1000ControlCipro 5 µg/ml
Nuclear DNAA.
Time (hours)0 20 40 60 80 100 120
Log
clpC
DN
A (p
g)
1
10
100
1000Control Cipro 5 µg/ml
Plastid DNAB.
C.
Time (hours)0 20 40 60 80 100 120
Log
cytB
DN
A (p
g)
1
10
100
1000ControlCipro 5 µg/ml
Mitochondrial DNA Figure 3-7. Analysis of nuclear, apicoplast, and mitochondrial DNA replication and selective
loss of apicoplast DNA in P. falciparum cultures treated with ciprofloxacin. Highly synchronous rings were used to initiate the experiment and 8 samples were taken over 120 h and analyzed by quantitative PCR.The copy number of a nuclear-encoded gene segment (pm4) decreased by ~10-fold in ciprofloxacin-treated parasites (A). A similar fold loss was observed in the copy number of a mitochondrial gene segment (cytB) (C). The copy number of an apicoplast gene segment (clpC) showed >100-fold decrease in ciprofloxacin-treated parasites (B). Data plots represent similar data obtained from 5 separate experiments.
82

1 36 72 108 144
Control Cipro 5 µg/ml Cipro 10 µg/ml
1 36 72 108 144 1 36 72 108 144
Death by hyperparasitemia
clpC
LSU-IRA
LSU-IRB
pm4
cytb/ cox1
tufA
coxI/ coxIII
1 36 72 108 144
plD
NA
mtD
NA
ncD
NA
1 36 72 108 144
Control Cipro 5 µg/ml Cipro 10 µg/ml
1 36 72 108 144 1 36 72 108 144
Death by hyperparasitemia
clpC
LSU-IRA
LSU-IRB
pm4
cytb/ cox1
tufA
coxI/ coxIII
1 36 72 108 144
plD
NA
mtD
NA
ncD
NA
Figure 3-8. Selective loss of plastid DNA in P. falciparum cultures treated with ciprofloxacin determined by southern blot hybridization. Cultures treated with a 50 % inhibitory concentration of ciprofloxacin (5 µg/ml) showed a depletion of plastid DNA targets while the mitochondrial and nuclear signals were not lost. Parasites were stage synchronized by sorbitol and cultured with no drug (control), 5 µg/ml ciprofloxacin, or 10 µg/ml ciprofloxacin. Samples were collected every 36 hours. DNA was released from saponin-treated parasites by SDS lysis and lysates were incubated in the presence of 100 µg/ml proteinase K for 2 hours at 65 ºC. DNA was purified by phenol-chloroform extraction and digested overnight with Hind III. DNA (5 µg) was electrophoresed for 6 hours at 60 V and transferred to a nylon membrane. Membranes were hybridized with DIG-labeled DNA probes for apicoplast DNA targets (clpC, tufA LSU IRA, LSU IRB), mitochondrial DNA targets (cytB, cox1, coxIII) and a nuclear DNA target (pm4).
83
A.
10
100
1000
10000
0 12 24 36 48 60 72 96Time (hours)
Log
Plas
tid L
SU rR
NA
/ pa
rasi
te
(LSU
cD
NA
/ pm
4 D
NA
)
ControlCipro 5 ug/ml
B.
0.001
0.01
0.1
1
0 12 24 36 48 60 72 96Time (hours)
Log
clpC
RN
A tr
ansc
ripts
/ pa
rasi
te
(clp
C c
DN
A /
pm4
DN
A)
ControlCipro 5 ug/ml
Figure 3-9. Effects of ciprofloxacin treatment on apicoplast RNA. Highly synchronous parasites were cultured with or without ciprofloxacin were sampled every 12 hours. The levels of LSU rRNA (A) and clpC transcripts (B) were determined by qRT-PCR and normalized the quantity of the genomic DNA target pfpm4. Data is plotted as the mean of 2 separate experiments, and error bars reflect the standard deviation of the mean.
84
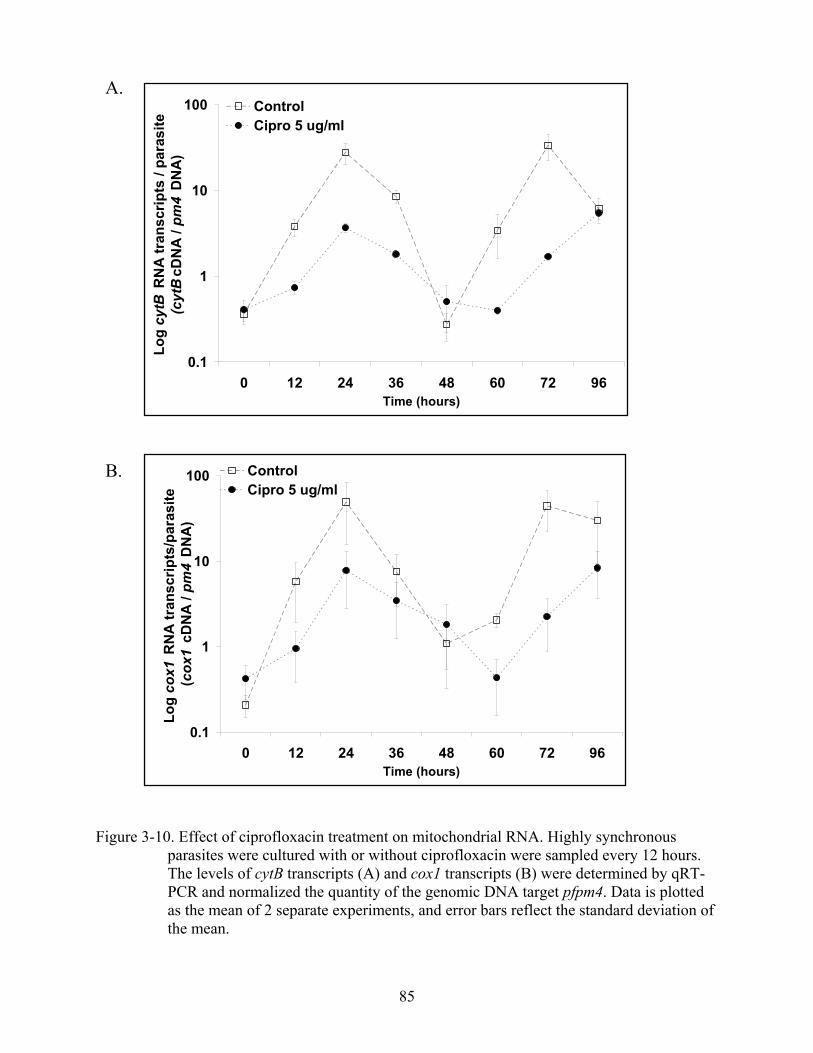
A.
0.1
1
10
100
0 12 24 36 48 60 72 96Time (hours)
Log
cytB
RN
A tr
ansc
ripts
/ pa
rasi
te
(cyt
BcD
NA
/ pm
4 D
NA
)
ControlCipro 5 ug/ml
0.1
1
10
100
0 12 24 36 48 60 72 96Time (hours)
Log
cox1
RN
A tr
ansc
ripts
/par
asite
(cox
1 cD
NA
/ pm
4 D
NA
)
ControlCipro 5 ug/ml
B. Figure 3-10. Effect of ciprofloxacin treatment on mitochondrial RNA. Highly synchronous
parasites were cultured with or without ciprofloxacin were sampled every 12 hours. The levels of cytB transcripts (A) and cox1 transcripts (B) were determined by qRT-PCR and normalized the quantity of the genomic DNA target pfpm4. Data is plotted as the mean of 2 separate experiments, and error bars reflect the standard deviation of the mean.
85

Plasmodium falciparumplDNA 35 kb
Plasmodium falciparumplDNA 35 kb
Figure 3-11. Map of restriction enzyme sites used for cleavage analysis on the apicoplast DNA. Black bars inside the circle denote the locations of the amplicons used to generate the FISH probe and mixed apicoplast DNA probe used for southern blotting.
86

87
Figure 3-12. DNA cleavage analysis of the apicoplast 35 kb DNA. DNA from drug-treated and control parasites was digested and hybridized to a mixed apicoplast DNA probe detecting 7 kb of the 35 kb circle (see Figure 3-11 for location of the probe fragments) (A). The EcoRI and NsiI digests linearized the 35 kb DNA and a region of smearing was observed below the linear 35 kb in the ciprofloxacin treatment. VP16 treatment produced a similar smear in the NsiI digest. The same blot was hybridized with a probe for SSU (B)
Con
tC
ipro
VP16
Con
tC
ipro
VP16
Con
tC
ipro
VP16
Con
tC
ipro
VP16
Con
tC
ipro
VP16
XbaI HindIII HpaI EcoRI NsiI
8.67.46.14.9
3.6
2.8
21.2
2.0
1.5
1.0
0.71
kb
linear 35 kb
NsiI digest smearEcoRI digest smear
Con
tC
ipro
VP16
Con
tC
ipro
VP16
Con
tC
ipro
VP16
Con
tC
ipro
VP16
Con
tC
ipro
VP16
XbaI HindIII HpaI EcoRI NsiI
8.67.46.14.9
3.6
2.8
21.2
2.0
1.5
1.0
0.71
kb
linear 35 kb
A.
NsiI digest smearEcoRI digest smear
Mixed Apicoplast Probe
Con
tC
ipro
VP16
Con
tC
ipro
VP16
Con
tC
ipro
VP16
Con
tC
ipro
VP16
Con
tC
ipro
VP16
XbaI HindIII HpaI EcoRI NsiI
8.67.46.14.9
3.6
2.8
21.2
2.0
1.5
1.0
0.71
kb
linear 35 kb
Con
tC
ipro
VP16
Con
tC
ipro
VP16
Con
tC
ipro
VP16
Con
tC
ipro
VP16
Con
tC
ipro
VP16
XbaI HindIII HpaI EcoRI NsiI
8.67.46.14.9
3.6
2.8
21.2
2.0
1.5
1.0
0.71
kb
linear 35 kb
Con
tC
ipro
VP16
Con
tC
ipro
VP16
Con
tC
ipro
VP16
Con
tC
ipro
VP16
Con
tC
ipro
VP16
XbaI HindIII HpaI EcoRI NsiI
8.67.46.14.9
3.6
2.8
21.2
2.0
1.5
1.0
0.71
kb
linear 35 kb
B.
SSU Probe

19.7
Digest : Hpa I
Con
t
Cip
ro
VP
16
Hea
t
Cip
ro
Cip
ro
VP
16
VP
16
Mixed culture SchizTroph/Schiz
Probe : LSU
21.2
5.14.3
2.01.61.4
0.9
0.6
3.5
10.819.7
Digest : Hpa I
Con
t
Cip
ro
VP
16
Hea
t
Cip
ro
Cip
ro
VP
16
VP
16
Mixed culture SchizTroph/SchizTroph/Schiz
Probe : LSU
21.2
5.14.3
2.01.61.4
0.9
0.6
3.5
10.8
A.
Con
t
Cip
ro
VP
16
Hea
t
Cip
ro
Cip
ro
VP
16
VP
16
Mixed culture SchizTroph/Schiz
Digest : Hpa I
Probe : SSU
21.2
5.14.3
2.01.61.4
0.9
0.6
3.7
12.5
Con
t
Cip
ro
VP
16
Hea
t
Cip
ro
Cip
ro
VP
16
VP
16
Mixed culture SchizTroph/Schiz
Digest : Hpa I
Probe : SSU
Con
t
Cip
ro
VP
16
Hea
t
Cip
ro
Cip
ro
VP
16
VP
16
Mixed culture SchizTroph/SchizTroph/Schiz
Digest : Hpa I
Probe : SSU
21.2
5.14.3
2.01.61.4
0.9
0.6
3.7
12.5
B.
Figure 3-13. Analysis of the apicoplast 35 kb DNA inverted repeat topology. DNA from drug-treated and control parasites was digested with HpaI and hybridized to a probe for the LSU (A) or SSU (B) rRNA genes. Treatments were conducted on an asynchronous culture (mixed culture), late trophozoites/early schizonts (Troph/Schiz), and schizonts (Schiz). The higher molecular weight bands observed in the SSU blot correspond to a block in digestion of one or more HpaI sites located in the inverted repeat. In the LSU blot an additional distinct band was observed in the VP16 treated Troph/Schiz sample corresponding to a block in the IRB HpaI site of the inverted repeat.
88

Table 3-1. Results of SDS/KCl precipitation from 3 different experiments listing the fold enrichment of gene targets in drug treated parasites relative to controls. Data for both the pellet and supernatant fractions are shown
Exp 1 Exp 2 Exp 3
Pellet Supernatent Pellet Supernatent Pellet t
VM26pm4 187 <1 54.8 <1 142 <1LSU 5.7 1.1 7.8 <1 22.3 <1clpC 8.4 <1 6.1 1.0 18.6 <1cox1 3.1 <1 2.2 <1 25.2 <1cytB 4.8 <1 3.2 <1 19.6 1.1
Cipropm4 1.0 <1 1.0 <1 <1 <1LSU 1.8 1.0 4.2 <1 1.1 <1clpC 2.7 1.2 1.1 <1 1.2 <1cox1 1.2 1.5 1.2 <1 <1 <1cytB 2.2 <1 1.6 <1 <1 <1
SupernatenSupernatantSupernatant Supernatant
Table 3-2. Fold enrichment of apicoplast and mitochondrial DNA gene targets relative to control
DNA after VM26 treatment and immunoprecipitation with GyrA antibody
Apicoplast DNA Mitochondrial DNA nuclear DNA
LSU clpC cytB cox1 pm4
Exp 1 7.0 19.9 2.4 2.9 2.7
Exp 2 4.0 4.6 1.9 1.6 2.4
Table 3-3. Fold enrichment of apicoplast and mitochondrial DNA gene targets relative to control
DNA after ciprofloxacin treatment and immunoprecipitation with GyrA antibody
Apicoplast DNA Mitochondrial DNA nuclear DNA
LSU clpC cytB cox1 pm4
Exp 1 1.2 1.6 0.6 0.9 1.2
Exp 2 0.5 1.8 1.1 0.7 0.5
89

ACP-GFP ACP-GFP / DIC
A.
E.
D.
A.
C.
B.
ACP-GFP ACP-GFP / DIC
A.
E.
D.
A.
C.
B.
E.
D.
A.
C.
B.
ACP-GFP ACP-GFP / DIC
F.
G.
H.
I.
ACP-GFP ACP-GFP / DICACP-GFP ACP-GFP / DIC
F.
G.
H.
I.
F.
G.
H.
I.
Figure 3-14. Morphology of the apicoplast in asexual stages of P. falciparum. Parasites (strain
3D7) were transformed with plasmid ACP-GFP (plasmid DNA kindly provided by S. Sato) to target GFP to the plastid. Fluorescent images show the plastid in green (left panel) and the right panel shows the fluorescence merged with a differential interference contrast image of the parasite-infected erythrocyte. The apicoplast is visible as a small oval shaped structure in rings (Panel A) and takes on a more spherical shape in young trophozoites (Panel B). In maturing trophozoites the plastid elongates and forms looped structures (Panels C, D, and E). As the parasite enters schizogony the plastid branches (Panels F and G) and segments of the organelle are distributed to daughter merozoites in mature, segmented schizonts (Panel H). At the time of schizont rupture, plastids are seen as small ovals within merozoites (Panel I).
90
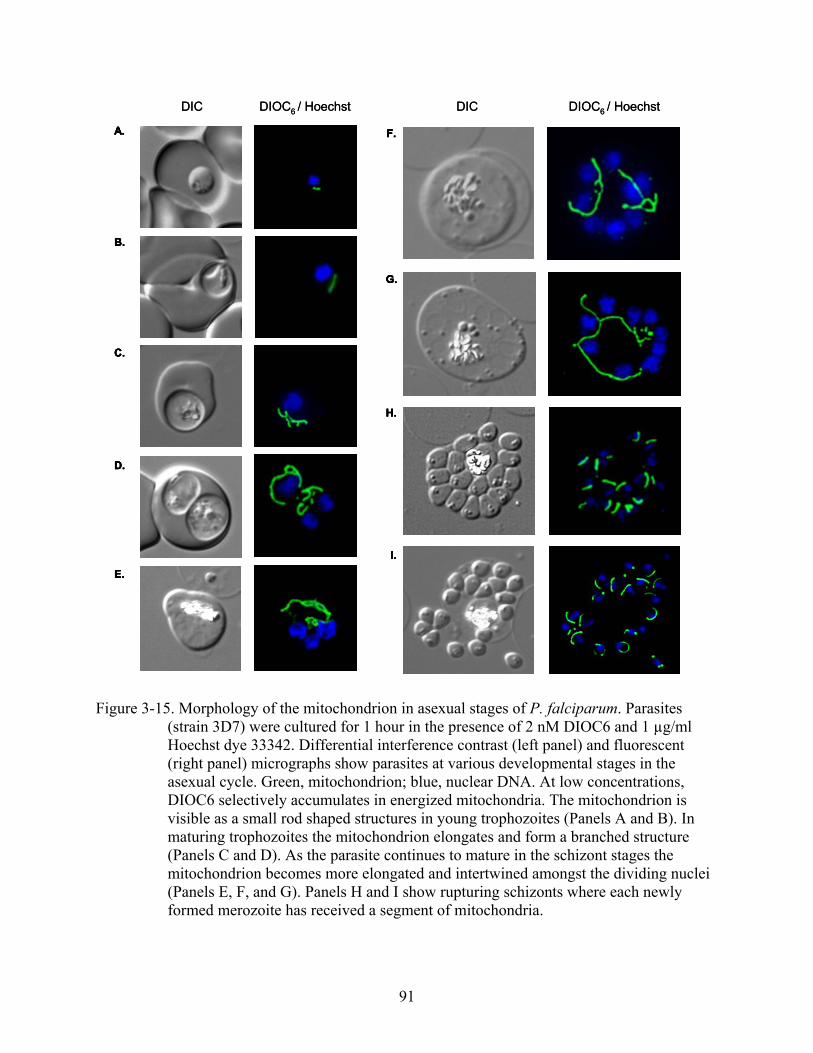
E.
D.
A.
C.
B.
F.
G.
H.
I.
DIC DIOC6 / Hoechst DIC DIOC6 / Hoechst
E.
D.
C.
B.
A.
E.
D.
C.
B.
E.
D.
C.
B.
A.A. F.
G.
H.
I.
F.F.
G.
H.
I.
G.
H.
I.
DIC DIOC6 / Hoechst DIC DIOC6 / Hoechst
Figure 3-15. Morphology of the mitochondrion in asexual stages of P. falciparum. Parasites (strain 3D7) were cultured for 1 hour in the presence of 2 nM DIOC6 and 1 µg/ml Hoechst dye 33342. Differential interference contrast (left panel) and fluorescent (right panel) micrographs show parasites at various developmental stages in the asexual cycle. Green, mitochondrion; blue, nuclear DNA. At low concentrations, DIOC6 selectively accumulates in energized mitochondria. The mitochondrion is visible as a small rod shaped structures in young trophozoites (Panels A and B). In maturing trophozoites the mitochondrion elongates and form a branched structure (Panels C and D). As the parasite continues to mature in the schizont stages the mitochondrion becomes more elongated and intertwined amongst the dividing nuclei (Panels E, F, and G). Panels H and I show rupturing schizonts where each newly formed merozoite has received a segment of mitochondria.
91

A.
plDNA (red) /ncDNA (blue)
phase merge
B.
plDNA (red) /ncDNA (blue)
phase merge
C.
phase merge
D.
plDNA (red) /ncDNA (blue)
phase merge
A.
plDNA (red) /ncDNA (blue)
phase merge
B.
plDNA (red) /ncDNA (blue)
phase merge
C.
phase merge
A.
plDNA (red) /ncDNA (blue)
phase merge
A.
plDNA (red) /ncDNA (blue)
phase merge
B.
plDNA (red) /ncDNA (blue)
phase merge
B.
plDNA (red)
/ncDNA (blue)phase merge
C.
phase merge
D.
plDNA (red) /ncDNA (blue)
phase merge
D.
plDNA (red) /ncDNA (blue)
phase merge
Figure 3-16. Analysis of apicoplast DNA segregation by fluorescence in situ hybridization
(FISH). Red is the hybridization signal from the apicoplast DNA probe and nuclear DNA in blue was counterstained with 1 µg/ml Hoechst 33342. A) The apicoplast DNA is visible as a single punctate spot in trophozoites. B) and C) The apicoplast DNA segregates independently of nuclear DNA during schizogony. D) In segmented schizonts the apicoplast DNA is distributed amongst daughter merozoites.
92

Figure 3-17. Analysis of mitochondrial DNA by fluorescence in situ hybridization. A)
Mitochondrial DNA (red signal) was visible as single spots in merozoites with the nuclear DNA in blue labeled with Hoechst Dye 33258. B) Mitochondrial DNA segregating prior to nuclear DNA segregation in a trophozoite, C) Early in schizogony the mitochondrial DNA was actively segregated. D) and E) Mitochondrial DNA was distributed to daughter merozoites in mature and segmented schizonts.
I.
mtDNA (red)/ncDNA (blue)
Merge w/ phase
H. D.
mtDNA (red)/ncDNA (blue)
Merge w/ phase
G.
F.
mtDNA (red)/ncDNA (blue)
Merge w/ phase
E. A.
mtDNA (red)/ncDNA (blue)
Merge w/ phase
B. E.
C.
93

plDNA (red)/ncDNA (blue) Merge w/ phase
Ciprofloxacin 5 µg/ml
Plastid DNA FISH
A.
B.
mtDNA (red)/ncDNA (blue) Merge w/ phase
Mitochondrial DNA FISH
C.
D.
CONTROL
CONTROL
plDNA (red)/ncDNA (blue) Merge w/ phaseplDNA (red)/ncDNA (blue) Merge w/ phase
Ciprofloxacin 5 µg/ml
Plastid DNA FISH
A.
B.
mtDNA (red)/ncDNA (blue) Merge w/ phase
Mitochondrial DNA FISH
C.
D.
CONTROL
CONTROL
mtDNA (red)/ncDNA (blue)
Ciprofloxacin 50 µg/ml
plDNA FISH mtDNA FISH
plDNA (red)/ncDNA (blue)Merge w/ phase Merge w/ phase
B.
mtDNA (red)/ncDNA (blue)
C.
D.
Ciprofloxacin 50 µg/ml
plDNA FISH mtDNA FISH
plDNA (red)/ncDNA (blue)Merge w/ phase Merge w/ phase
mtDNA (red)/ncDNA (blue)
Ciprofloxacin 50 µg/ml
plDNA FISH mtDNA FISH
plDNA (red)/ncDNA (blue)Merge w/ phase Merge w/ phase
Ciprofloxacin 50 µg/ml
plDNA FISH mtDNA FISH
plDNA (red)/ncDNA (blue)Merge w/ phase Merge w/ phase
. D.H
C.G
BF
E
Figure 3-18. Effects of ciprofloxacin on apicoplast and mitochondrial DNAs detected by FISH. Parasite cultures were treated for 24 hours in culture with a 50 % inhibitory concentration of ciprofloxacin (5 µg/ml) or a completely inhibitory concentration of ciprofloxacin (50 ug/ml) and analyzed by FISH. In parasites treated with 5 µg/ml ciprofloxacin there was a significant decrease in the apicoplast DNA signal (panels A & B) which was most pronounced in later stage parasites, while the signal for mitochondrial DNA was not reduced (panels C & D). Mitochondrial DNA was still detected as multiple spots in parasites treated with high dosages of ciprofloxacin for 24 hours ( panels G and H), whereas apicoplast DNA was only seen as a single spot in ≤10% of parasites (panels E & F).
94

GFP FISHGFP / FISH Merge
GFP / DAPI Merge
FISH / DAPI Merge
Merge All
Merge w/ PhaseGFP FISH
GFP / FISH Merge
GFP / DAPI Merge
FISH / DAPI Merge
Merge All
Merge w/ PhaseGFP FISH
GFP / FISH Merge
GFP / DAPI Merge
FISH / DAPI Merge
Merge All
Merge w/ PhaseGFP FISH
GFP / FISH Merge
GFP / DAPI Merge
FISH / DAPI Merge
Merge All
Merge w/ Phase
A. B. C. D. E. F. G. H.
Figure 3-19. Visualization of the apicoplast DNA and the apicoplast in asexual stages of P. falciaprum by combined FISH / IFA. The apicoplast signal is delineated by IFA for GFP (green), the apicoplast DNA was detected by FISH (red). Parasite nuclei were stained with DAPI (blue). Trophozoites (A & B), Early Schizont (C), Schizont (D, E, F), Mature Schizont (G), Segmenting Schizont (H).
95
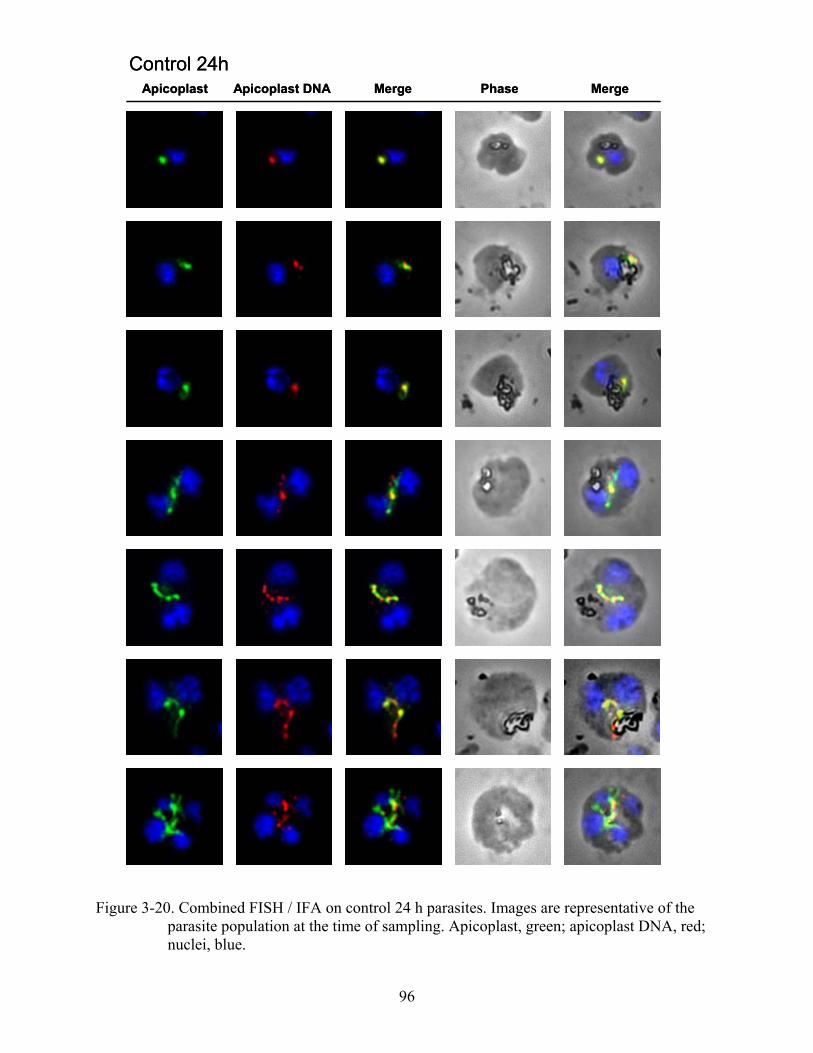
96
Control 24hApicoplast Apicoplast DNA Merge Phase Merge
Control 24hApicoplast Apicoplast DNA Merge Phase Merge
Figure 3-20. Combined FISH / IFA on control 24 h parasites. Images are representative of the
parasite population at the time of sampling. Apicoplast, green; apicoplast DNA, red; nuclei, blue.

97
Control 72 hApicoplast Apicoplast DNA Merge Phase Merge
Control 72 hApicoplast Apicoplast DNA Merge Phase Merge
Figure 3-21. Combined FISH / IFA on control 72 h parasites. Images are representative of the
parasite population at the time of sampling. Apicoplast, green; apicoplast DNA, red; nuclei, blue.

98
Cipro 24 hApicoplast Apicoplast DNA Merge Phase Merge
Cipro 24 hApicoplast Apicoplast DNA Merge Phase Merge
Figure 3-22. Combined FISH / IFA on ciprofloxacin treated parasites at 24 h. Images are
representative of the parasite population at the time of sampling. Apicoplast, green; apicoplast DNA, red; nuclei, blue.

99
Cipro 72 hApicoplast Apicoplast DNA Merge Phase Merge
Cipro 72 hApicoplast Apicoplast DNA Merge Phase Merge
Figure 3-23. Combined FISH / IFA on ciprofloxacin treated parasites at 72 h. Images are
representative of the parasite population at the time of sampling. Apicoplast, green; apicoplast DNA, red; nuclei, blue.

GFP Phase Merge
A.
B.
C.
GFP Phase MergeGFP Phase Merge
A.
B.
C.
A.
B.
C.
Figure 3-24. GFP expression in P. falciparum cells stably transformed with pTGPI-GFP. The
3D7 clone of P. falciparum was transfected with pTGPI-GFP and stably transformed parasites were selected with 2.5 nM WR99210. Culture medium was supplemented with ATc (0.5 µg/ml) for the duration of the selection process. When ATc was removed, GFP expressing parasites were observed by fluorescence microscopy within 48 hours. Only schizont stages were fluorescent which is consistent with transactivator (TaTi2) expression being regulated by the stage-specific promoter of msp2. Images of GFP fluorescence, phase contrast, and GFP merged with phase contrast are shown of A) an early schizont, B) a developing schizont, C) a mature and segmented schizont.
100

GFP Hoechst Merge w/ Phase
Figure 3-25. Induction of GFP expression in a P. falciparum culture stably transformed with pTGPI-GFP. Parasites were cultured in the absence of ATc for 72 hours to show GFP expression (A), or continuously in presence of ATc (B). Cells were counterstained with Hoechst, saponin-treated, and viewed at 400X magnification. Approximately 20% of schizont-stage parasites became fluorescent when ATc was removed (A), while fluorescence was not observed in parasites that were in continuous culture with ATc (B).
B.
GFP Hoechst Merge w/ PhaseGFP Hoechst Merge w/ Phase
A.A.
B.
101

Day 0 Day 1Day 0Day 0 Day 1Day 1 Day 2 Day 3Day 2Day 2 Day 3Day 3Day 0 Day 1Day 0Day 0 Day 1Day 1 Day 2 Day 3Day 2Day 2 Day 3Day 3
Figure 3-26. Counts of GFP expressing cells after the addition of ATc determined by flow
cytometry. Asynchronous cultures were propagated in the absence of ATc for 72 hours and the number of GFP-expressing parasites was counted (Day 0) from 1 million sorted cells. ATc (1 µg/ml) was applied to cultures after the initial count on Day 0 and the number of GFP-expressing parasites was counted from 1 million sorted cells every 24 hours for 3 days. Flow cytometry data is shown in (A) where R1 indicates the counted cell population. Parasitemia was also determined by flow cytometry using Paraformaldehyde-fixed cells stained with 250 ng/ml Syto 24. The cell sorting results were normalized to parasitemia and compared to control non-transfected parasites (B). The number of fluorescent parasites is reduced by approximately 10 fold.
A.
0100200300400500600700800900
1000
0 24 48 72 ControlTime (hours)
# Fl
uore
scen
t Par
asite
s ON to OFFB.
Control
Day 0 Day 1Day 0Day 0 Day 1Day 1 Day 2 Day 3Day 2Day 2 Day 3Day 3Day 0 Day 1Day 0Day 0 Day 1Day 1 Day 2 Day 3Day 2Day 2 Day 3Day 3 Day 0 Day 1Day 0Day 0 Day 1Day 1 Day 2 Day 3Day 2Day 2 Day 3Day 3Day 0 Day 1Day 0Day 0 Day 1Day 1 Day 2 Day 3Day 2Day 2 Day 3Day 3 A.A.
B. B. B.
0100200300400500600700800900
1000
0 24 48 72 ControlTime (hours)
# Fl
uore
scen
t Par
asite
s ON to OFF Control
0100200300400500600700800900
1000
0 24 48 72 ControlTime (hours)
# Fl
uore
scen
t Par
asite
s ON to OFF
0100200300400500600700800900
1000
0 24 48 72 ControlTime (hours)
# Fl
uore
scen
t Par
asite
s ON to OFF ControlControl
102

Figure 3-27. Analysis of plasmid copy number in parasites transformed with pTGPI-GFP after
time in culture. Plasmodium falciparum (strain 3D7) was transformed with pTGPI-GFP and selected with 2.5 nM WR99210 and cultured with ATc. At 90 days and 180 days post-transfection, ATc was washed out. The GFP-expressing parasites and the non GFP-expressing parasites were sorted from the mixed culture by FACS. For both time points, 8,000 GFP positive cells were collected. Quantitative PCR was used to determine the plasmid copy number in GFP +, GFP -, and unsorted parasites. At 90 d post-tranfection, the GFP + cells contained on average 1 copy plasmid (A) per parasite while at 180 d post-transfection the GFP + cells contained roughly between 10 – 30 copies of plasmid (B)
A.
B.
05
10152025303540
FACS GFP Positive FACS GFP Negative
Tati2GFPB-lactamase
0
2
4
6
8
10
12
14
16
FACS GFP positive FACS GFP negative
Tati2GFPB-lactamase
GFP-A
FSC
-A
-101 102 103 104 1050
65536
131072
196608
262144
Gate 2
Gate 2 72 0.09 0.07
1
1C
opy
Num
ber 1
1C
opy
Num
ber
1
1
Cop
y N
umbe
r 11
Cop
y N
umbe
r
pm4
gfpΒ-lact
tati2pm4
gfpΒ-lact
tati2
05
10152025303540
FACS GFP Positive FACS GFP Negative
Tati2GFPB-lactamase
0
2
4
6
8
10
12
14
16
FACS GFP positive FACS GFP negative
Tati2GFPB-lactamase
GFP-A
FSC
-A
-101 102 103 104 1050
65536
131072
196608
262144
Gate 2
Gate 2 72 0.09 0.07Gate 2 72 0.09 0.07
1
1C
opy
Num
ber 1
1C
opy
Num
ber
1
1
Cop
y N
umbe
r 11
Cop
y N
umbe
r
pm4
gfpΒ-lact
tati2pm4
gfpΒ-lact
tati2
103

hDHFRpm4delta3' pm4
pGEM backbone
cam 5'7X TetO
min camhrp2 3' pm4 3'pm4 5'
NotI (7254)EcoRI (123) EcoRI (4551) EcoRI (9049)EcoRI (9088)
P1 P1
P2 P2
Probe: hDHFRProbe: pro-pm4 Probe: pro-pm4
pro-pm4 - 1.8 kbpro-pm4 – 4.4 kb
hDHFR - 4.4 kb Expected fragments
hDHFRpm4delta3' pm4
pGEM backbone
cam 5'7X TetO
min camhrp2 3' pm4 3'pm4 5'
NotI (7254)EcoRI (123) EcoRI (4551) EcoRI (9049)EcoRI (9088)
P1 P1
P2 P2
Probe: hDHFRProbe: pro-pm4 Probe: pro-pm4
hDHFRpm4delta3' pm4
pGEM backbone
cam 5'7X TetO
min camhrp2 3' pm4 3'pm4 5'
NotI (7254)EcoRI (123) EcoRI (4551) EcoRI (9049)EcoRI (9088)
P1 P1
P2 P2hDHFRpm4delta3' pm4
pGEM backbone
cam 5'7X TetO
min camhrp2 3' pm4 3'pm4 5'
NotI (7254)EcoRI (123) EcoRI (4551) EcoRI (9049)EcoRI (9088)
P1 P1
P2 P2
P1 P1
P2 P2
Probe: hDHFRProbe: pro-pm4 Probe: pro-pm4Probe: hDHFRProbe: pro-pm4 Probe: pro-pm4
pro-pm4 - 1.8 kbpro-pm4 – 4.4 kb
hDHFR - 4.4 kb Expected fragments pro-pm4 - 1.8 kbpro-pm4 – 4.4 kb
hDHFR - 4.4 kb Expected fragments
wild-type
3D7 C3 B3 G6 A1 B4 C2 PL
pTOCAM-∆pm4 clones plasmid wild-type
3D7 C3 B3 G6 A1 B4 C2 PL
pTOCAM-∆pm4 clones plasmid
Probe: pro-pm4 Digest: EcoRI / NotI Probe: hdhfr Digest: EcoRI / NotI
5.14.23.5
2.0
1.0
kb
wild-type
3D7 C3 B3 G6 A1 B4 C2 PL
pTOCAM-∆pm4 clones plasmidwild-type
3D7 C3 B3 G6 A1 B4 C2 PL
pTOCAM-∆pm4 clones plasmid wild-type
3D7 C3 B3 G6 A1 B4 C2 PL
pTOCAM-∆pm4 clones plasmidwild-type
3D7 C3 B3 G6 A1 B4 C2 PL
pTOCAM-∆pm4 clones plasmid
Probe: pro-pm4 Digest: EcoRI / NotI Probe: hdhfr Digest: EcoRI / NotI
5.14.23.5
2.0
1.0
kb Figure 3-28. Southern blot analysis of transfectant pTOCAM-∆pm4. Analysis showed that the
expected 5‘ and 3‘ integration occurred at the pfpm4 locus. Probing with sequences from the pro-region of pfpm4, the EcoR I / Not I digest produced a 4.4 kb fragment indicating 5‘ integration and produced a 1.8 kb fragment indicating 3‘ integration. Hybridization of the EcoR I / Not I digest with hDHFR similarly yielded a 4.4 kb fragment which was expected to co-localize with the 4.4 kb fragment probed with pro-pfpm4. Wild-type pfpm4 produced a band at 2.6 kb and plasmid produced a 3.6 kb band. TF, transfected parasites; WT, wild-type non-transfected parasites; PL, plasmid.
104
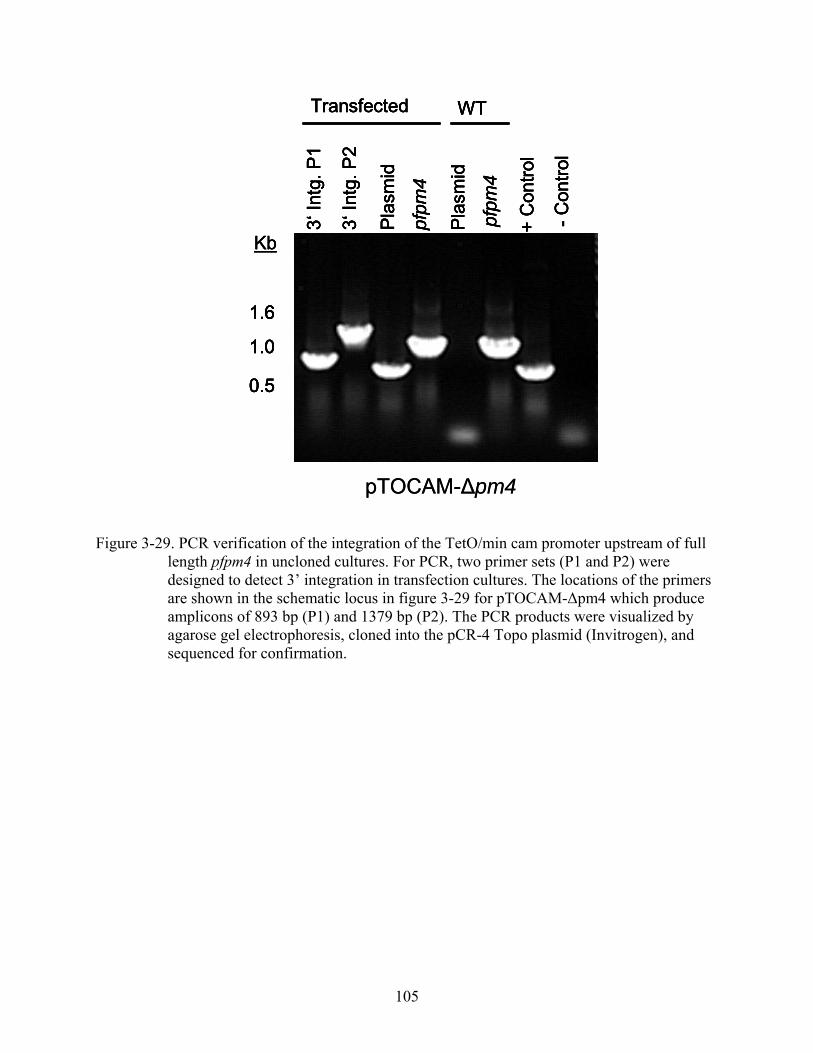
105
3‘In
tg. P
1
3‘In
tg. P
2
+ C
ontro
l
-Con
trol
Pla
smid
pfpm
4
pfpm
4
Pla
smid
WTTransfected
1.6
1.0
0.5
Kb
pTOCAM-∆pm4
3‘In
tg. P
1
3‘In
tg. P
2
+ C
ontro
l
-Con
trol
Pla
smid
pfpm
4
pfpm
4
Pla
smid
WTTransfected
1.6
1.0
0.5
Kb
3‘In
tg. P
1
3‘In
tg. P
2
+ C
ontro
l
-Con
trol
Pla
smid
pfpm
4
pfpm
4
Pla
smid
WTTransfected
3‘In
tg. P
1
3‘In
tg. P
2
+ C
ontro
l
-Con
trol
Pla
smid
pfpm
4
pfpm
4
Pla
smid
WTTransfected
1.6
1.0
0.5
1.6
1.0
0.5
1.6
1.0
0.5
Kb
pTOCAM-∆pm4
Figure 3-29. PCR verification of the integration of the TetO/min cam promoter upstream of full
length pfpm4 in uncloned cultures. For PCR, two primer sets (P1 and P2) were designed to detect 3’ integration in transfection cultures. The locations of the primers are shown in the schematic locus in figure 3-29 for pTOCAM-∆pm4 which produce amplicons of 893 bp (P1) and 1379 bp (P2). The PCR products were visualized by agarose gel electrophoresis, cloned into the pCR-4 Topo plasmid (Invitrogen), and sequenced for confirmation.

1
10
100
1000
10000
100000
0 24 48 72 96 120 144 168 192 216 240 264Time (hours)
Log
para
site
mia
pa
3D7 wild-typepTOCAM-∆pm4 clone B3pTOCAM-∆pm4 clone C3
1
10
100
1000
10000
100000
0 24 48 72 96 120 144 168 192 216 240 264Time (hours)
Log
para
site
mia
pa
3D7 wild-typepTOCAM-∆pm4 clone B3pTOCAM-∆pm4 clone C3
Figure 3-30. Flow cytometry results for a 264 hr growth study (12 days) for wild type 3D7 and
pTOCAM-∆pm4 clones B3 and C3. Growth study was conducted with duplicate cultures using 24 well plates. Cultures were split 1/10 at 24 hrs, 96 hrs, 168 hrs, and 216 hrs. At each collection time period, 100 µL of sample was added to a 1.5 mL microcentrifuge tube and centrifuged for 5 minutes at 2,000 rpm. Slides were made (2 µL) and the remaining sample was resuspended in 500 µL of 2% paraformaldehyde. Samples were stored at 4oC. At 24 hrs before Flow cytometry analysis, Cyto24 dye (500 nM) was added to each sample. The flow cytometer was set to sort 50,000 cells. Samples were done in duplicate, series 1 (B) and series 2 (C). The geometrical mean from series 1 and 2 were used for graph (A), with standard deviation bars shown.
106

wild-type
3D7 C3 B3 G6 A1 B4 C2 TX4
37
7055
pTOCAM-∆pm4 clones ∆pfpm4
α-PfPM4
α-BiP
kDa
wild-type
3D7 C3 B3 G6 A1 B4 C2 TX4
37
7055
pTOCAM-∆pm4 clones ∆pfpm4
α-PfPM4
α-BiP
kDa
3D7 1:6 1:8 1:10 1:12 1:14 1:16 C3
Dilutions of 3D7 in C3
α-PM4
α-BiP7055
kDa
35
3D7 1:6 1:8 1:10 1:12 1:14 1:16 C3
Dilutions of 3D7 in C3
α-PM4
α-BiP7055
kDa
35
Figure 3-31. Western blot analysis of PfPM4 protein expression in pTOCAM-∆pm4 clones. PfPM4 protein expression was not detected in any clones analyzed (A). 3D7 was run as a positive control and a pfpm4 knockout parasite line (TX4) was run for a negative control. By the detection limits of western blotting, PFPM4 protein levels in clone C3 were at least 16-fold less than PfPM4 levels in wild-type 3D7 (B).
107

22.1
3.5
4.2
5.1
2.0
1.0
22.1
3.5
4.2
5.1
2.0
1.0
22.1
3.5
4.2
5.1
2.0
1.0
TA-0
1
TA-0
2
TATK
-03
TATK
-04
22.1
3.5
4.2
5.1
2.0
1.0
22.1
3.5
4.2
5.1
2.0
1.0
22.1
3.5
4.2
5.1
2.0
1.0
TA-0
1
TA-0
2
TATK
-03
TATK
-04
TA-0
1
TA-0
2
TATK
-03
TATK
-04
TA-0
1
TA-0
2
TATK
-03
TATK
-04
BSD tati2
EcoR I EcoR I
22.1
3.5
4.2
5.1
2.0
1.0
22.1
3.5
4.2
5.1
2.0
1.0
22.1
3.5
4.2
5.1
2.0
1.0
TA-0
1
TA-0
2
TATK
-03
TATK
-04
22.1
3.5
4.2
5.1
2.0
1.0
22.1
3.5
4.2
5.1
2.0
1.0
22.1
3.5
4.2
5.1
2.0
1.0
TA-0
1
TA-0
2
TATK
-03
TATK
-04
TA-0
1
TA-0
2
TATK
-03
TATK
-04
TA-0
1
TA-0
2
TATK
-03
TATK
-04
TA-0
1
TA-0
2
TATK
-03
TATK
-04
TA-0
1
TA-0
2
TATK
-03
TATK
-04
BSD tati2
EcoR I EcoR I
Figure 3-32. Genomic integration of transactivator expression cassettes using piggyBac-mediated transformation. Two plasmids (pGYBSD-TA and pGYBSD-TATK) were engineered to integrate tati2 using the piggyBac transformation system. Mature asexual-stage parasites were isolated on a magnetic column, introduced to plasmid-loaded red blood cells and selected with 2.5 µg/ml blasticidin-S. Parasite DNA from transformed cultures was digested with EcoR I and hybridized with DIG-labeled probes for the blasticidin deaminase gene (BSD) and for tati2. Cultures TA-01 and TA-02 contain multiple integrations while a single integration site predominates in cultures TATK-03 and TATK-04 (B). Episomal plasmid would be detected as an 8.1 kb fragment.
108

TA-0
1
TA-0
2
TATK
-03
TATK
-04
Non
-tra
nsfe
cted
pTG
PI-G
FPα-TetR
α-BiPTA
-01
TA-0
2
TATK
-03
TATK
-04
Non
-tra
nsfe
cted
pTG
PI-G
FPα-TetR
α-BiP
Figure 3-33. Expression of transactivator (TaTi2) protein in piggyBac transformants by western
blot. Parasite lysates prepared from asynchronous cultures were probed with α-TetR to detect TaTi2 expression, and α-BIP for a measure of protein loading. TaTi2 was detected in both parasites transformed with episomal copies of tati2 (pTGPI-GFP), and in parasites cultures transformed with integrated tati2 by piggyBac (TA-01, TA-02, TATK-03, TATK-04). Non-transfected parasites were also probed as a control. Both the episomal and integrated tati2 are under control of the msp2 promoter. TaTi2 expression levels appear to differ among the various piggyBac transformants and the levels of TaTi2 in the piggyBac transformants was similar to what was observed in the episomally transformed parasites.
109

UC = uncloned, PL = plasmid, EcoR I digest, tati2 probe
UC A1 A6 B1 C2 F4 F5 G1 H6 PLUC A2 B4 E2 F2 F3 G5 H3 H4 PL
012345
012345
TA-01 clones/subcultures TA-02 clones/subcultures
tati2
py mber
22.1
5.1
kb
conu
UC A1 A6 B1 C2 F4 F5 G1 H6 PLUC A2 B4 E2 F2 F3 G5 H3 H4 PL
012345
012345
TA-01 clones/subcultures TA-02 clones/subcultures
tati2 py mber
22.1
5.1
kb
conu
Figure 3-34. Analysis of piggyBac transformants TA-01 and TA-02 for transactivator expression
cassette integration. Putative clones and subcultures of TA-01 and TA-02 were analyzed by southern blotting and quantitative PCR which revealed that the majority of the TA-01 parasites contained 2 or even 3 copies of tati2 inserted into each genome, whereas the TA-02 parasites contained 1 copy of tati2 inserted in the genome.
110

α-TetR α-BiP
3D7 G5 H3 F5 H6 04 TetRwild-type controlTA clones
22
7050
kDa 3D7 G5 H3 F5 H6 04 TetRwild-type controlTA clones
22
7050
kDa
Figure 3-35. Western blot analysis of TaTi2 expression in TA-01 and TA-02 parasites with BiP
detection for a loading control. Clones containing differential copy numbers of integrated tati2 showed that those parasites with more than one insertion of the transactivator expression cassettes contained correspondingly higher levels of transactivator protein. Also, all transformations were selected in the absence of ATc and parasites were still able to maintain stable TaTi2 expression suggesting that TaTi2 alone is not toxic for the cell.
111
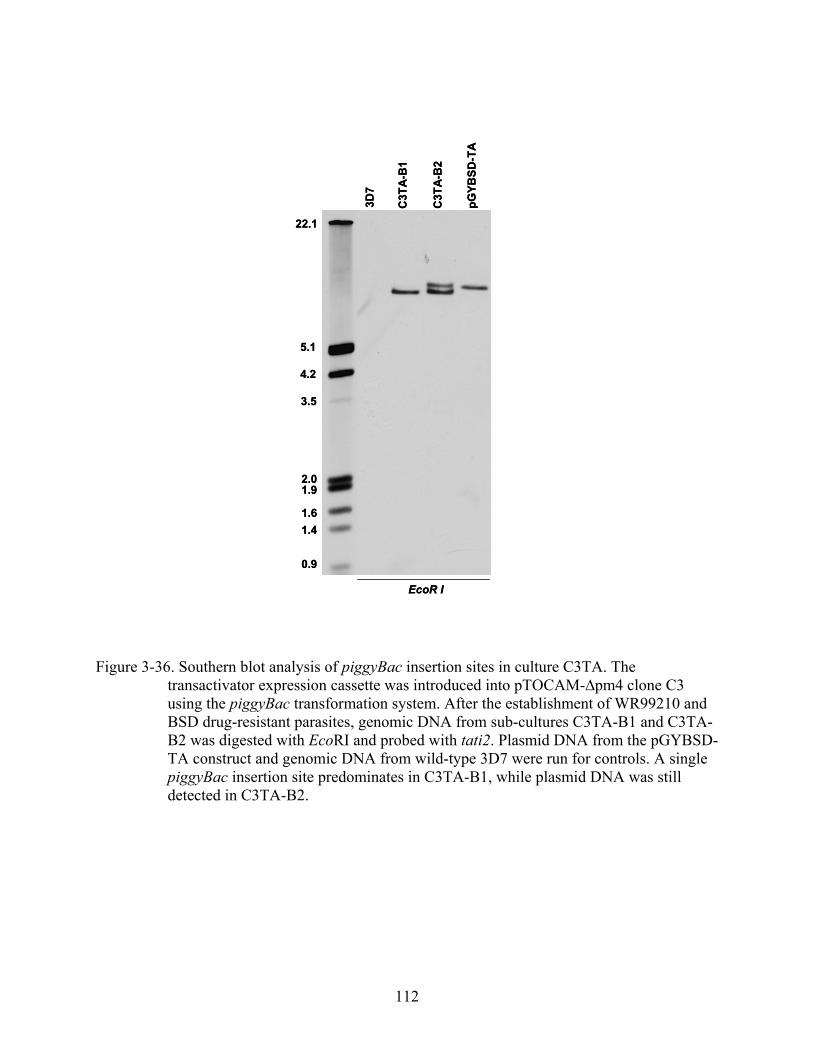
3D7
22.1
C3T
A-B
1
C3T
A-B
2
pGYB
SD-T
A
5.1
4.2
3.5
2.0
0.9
1.9
1.61.4
EcoR I
3D7
22.1
C3T
A-B
1
C3T
A-B
2
pGYB
SD-T
A
5.1
4.2
3.5
2.0
0.9
1.9
1.61.4
EcoR I
Figure 3-36. Southern blot analysis of piggyBac insertion sites in culture C3TA. The transactivator expression cassette was introduced into pTOCAM-∆pm4 clone C3 using the piggyBac transformation system. After the establishment of WR99210 and BSD drug-resistant parasites, genomic DNA from sub-cultures C3TA-B1 and C3TA-B2 was digested with EcoRI and probed with tati2. Plasmid DNA from the pGYBSD-TA construct and genomic DNA from wild-type 3D7 were run for controls. A single piggyBac insertion site predominates in C3TA-B1, while plasmid DNA was still detected in C3TA-B2.
112

A. C3 -Atc
22
kDa
C3-TA-B1
35
3D7 +Atc TetR48h 72h
α-TetR Figure 3-37. Analysis of protein regulation in C3TA-B1 cultured in the absence and presence of
ATc. C3TA-B1 was continuously cultured in the absence of ATc (-ATc), and in the presence of ATc (+ATc). ATc was washed out of the +ATc culture and parasites were sampled after 24h, 48h and 72h in the absence of ATc. PfPM4 protein expression was not detected in 3 separate experiments (A, B, & C). TaTi2 expression was silenced in C3TA-B1 (-ATc) (A, B, C), and TaTi2 expression was similarly silenced in pTGPI-GFP (–ATc) (D).
7055
α-BiP
α-PfPM4
C3 -Atc
22
kDa
C3-TA-B1
35
3D7 +Atc TetR48h 72h
α-TetR
D.
22
70
3D7 -Atc +Atc 72hpTGPI-GFP
kDa
22
70
3D7 -Atc +Atc 72hpTGPI-GFP
kDa
22
70
3D7 -Atc +Atc 72hpTGPI-GFP
kDa
22
70
3D7 -Atc +Atc 72hpTGPI-GFP
kDa
α-TetR
α-BiP7055
α-BiP
α-PfPM4
B.
35 α-PfPM4
70 α-BiP
α-TetR
C3 -Atc
22
C3TA-B13D7 +Atc 72h24h 48h TetRkDa
35 α-PfPM435 α-PfPM4
70 α-BiP70 α-BiP
α-TetR
C3 -Atc
22
C3TA-B13D7 +Atc 72h24h 48h TetRkDa
α-TetR
C3 -Atc
22
C3TA-B13D7 +Atc 72h24h 48h TetRkDa
C.
α-TetR
70 α-BiP
22
α-PfPM435
C3 -AtcC3TAm-B1
3D7 +Atc 72h24h 48h TetR+Atc72h
α-TetR
70 α-BiP
22
α-PfPM435
C3 -AtcC3TAm-B1
3D7 +Atc 72h24h 48h TetR+Atc72h
113
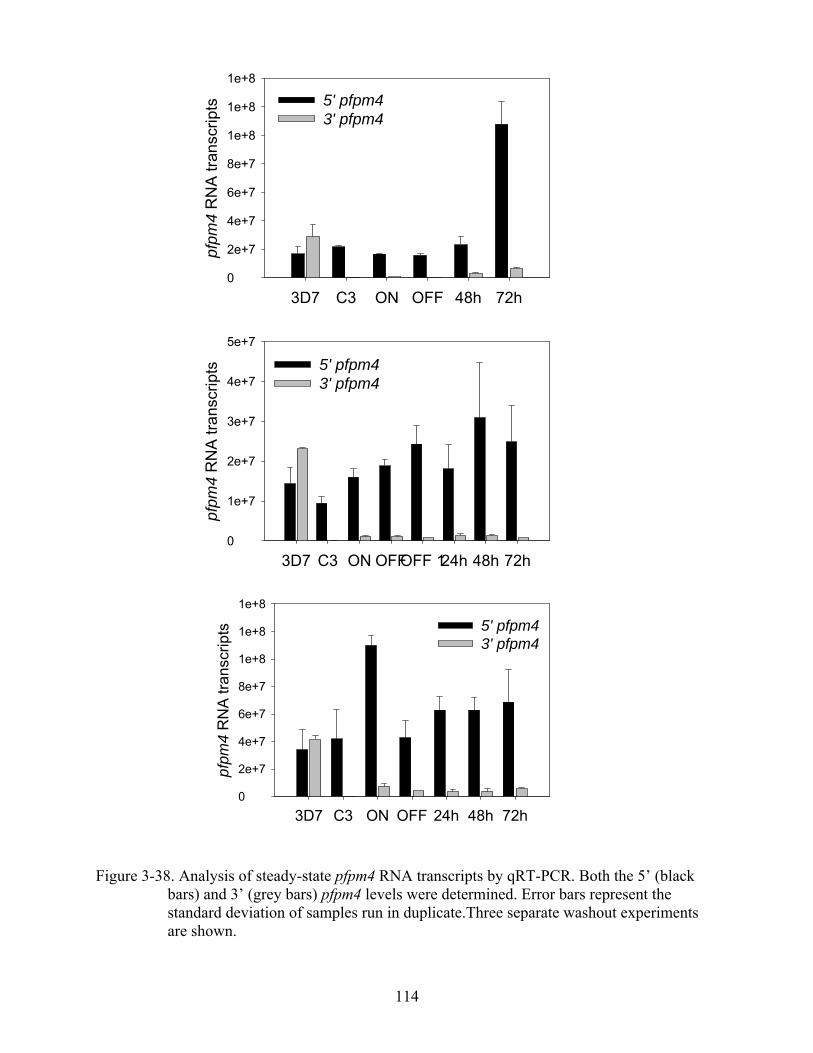
3D7 C3 ON OFF 48h 72h
pfpm
4 R
NA
trans
crip
ts
0
2e+7
4e+7
6e+7
8e+7
1e+8
1e+8
1e+8
5' pfpm43' pfpm4
3D7 C3 ON OFFOFF 124h 48h 72h
pfpm
4 R
NA
tran
scrip
ts
0
1e+7
2e+7
3e+7
4e+7
5e+7
5' pfpm43' pfpm4
3D7 C3 ON OFF 24h 48h 72h
pfpm
4 R
NA
trans
crip
ts
0
2e+7
4e+7
6e+7
8e+7
1e+8
1e+8
1e+8
5' pfpm43' pfpm4
Figure 3-38. Analysis of steady-state pfpm4 RNA transcripts by qRT-PCR. Both the 5’ (black bars) and 3’ (grey bars) pfpm4 levels were determined. Error bars represent the standard deviation of samples run in duplicate.Three separate washout experiments are shown.
114

3D7 C3 ON OFF 48h 72h
pfpm
4 R
NA
tran
scrip
ts
0
2e+6
4e+6
6e+6
8e+6
3e+7
4e+7
3' pfpm4
3D7 C3 ON OFF 48h 72h
tati2
RN
A tra
nscr
ipts
0
2e+9
4e+9
6e+9
8e+9
1e+10 tati2
3D7 C3 ON OFF 24h 48h 72h
pfpm
4 R
NA
tran
scrip
ts
02e+64e+66e+68e+6
4e+7
5e+73' pfpm4
3D7 C3 ON OFFOFF 1 24h 48h 72h
pfpm
4 R
NA
tran
scrip
ts
0.0
5.0e+5
1.0e+6
1.5e+6
2.3e+7
2.5e+7
3' pfpm4
3D7 C3 ON OFFOFF 1 24h 48h 72h
tati2
RN
A tr
ansc
ripts
0.0
5.0e+7
1.0e+8
1.5e+8
2.0e+8
2.5e+8
3.0e+8
tati2
3D7 C3 ON OFF 24h 48h 72h
tati2
RN
A tr
ansc
ripts
0.0
5.0e+9
1.0e+10
1.5e+10
2.0e+10
tati2
Figure 3-39. Analysis of steady-state pfpm4 3’ RNA and tati2 RNA by quantitative RT-PCR. Steady-state levels of pfpm4 3‘ RNA (light grey bars) fluctuate similarly to tati2 RNA (dark grey bars). Error bars represent the standard deviation of duplicate samples. Three separate washout experiments are shown.
115

A.
pro-pm4 – 8.7 kb
hDHFR pm4pm4delta3'
pGEM backbone
cam 5'7X TetO
min camhrp2 3'
Bsr GI (792) Bsr GI (9497)
pro-pm4 – 8.7 kb
hDHFR pm4pm4delta3'
pGEM backbone
cam 5'7X TetO
min camhrp2 3'
Bsr GI (792) Bsr GI (9497)
hDHFR pm4pm4delta3'
pGEM backbone
cam 5'7X TetO
min camhrp2 3'
Bsr GI (792) Bsr GI (9497) B. Bsr GI digest results
pTOCAM-∆pm4 locus w/ 1 plasmid integration = 8.7 kb
“ + 1 extra plasmid copy = 15 kb
“ + 2 extra plasmid copies = 21.3 kb
“ + 3 extra plasmid copies = 27.6 kb
Bsr GI digest results
pTOCAM-∆pm4 locus w/ 1 plasmid integration = 8.7 kb
“ + 1 extra plasmid copy = 15 kb
“ + 2 extra plasmid copies = 21.3 kb
“ + 3 extra plasmid copies = 27.6 kb
C. D.
kb
6.1
21.2
4.9
3.6
2.8
1.5
2.0
1.2
8.6
C3 B3 A1 C2 3D7
Digest : Bsr GI
pTOCAM-∆pm4
8.7 kb
15 kb21.3 kb
kb
6.1
21.2
4.9
3.6
2.8
1.5
2.0
1.2
8.6
6.1
21.2
4.9
3.6
2.8
1.5
2.0
1.2
8.6
C3 B3 A1 C2 3D7
Digest : Bsr GI
pTOCAM-∆pm4
8.7 kb
15 kb21.3 kb
21.2
6.14.9
3.6
2.8
1.5
2.0
1.2
8.6
Digest : Bsr GI
C3-TAmB1 B2 A1 A2 1 2 3D7 PL
B3-TAh
21.2
6.14.9
3.6
2.8
1.5
2.0
1.2
8.6
6.14.9
3.6
2.8
1.5
2.0
1.2
8.6
Digest : Bsr GI
C3-TAmB1 B2 A1 A2 1 2 3D7 PL
B3-TAh
Figure 3-40. Southern blot analysis of the number of plasmid integrations in clones of pTOCAM-∆pm4 and C3TA. A) Illustration of the pfpm4 locus after a single plasmid integration showing BsrGI restriction sites, and the gene segment probed for during southern blotting in blue. B) DNA fragment sizes from the BsrGI digest resulting from the integration of extra plasmid copies. C) & D) Southern blots revealing that the majority of parasites in these clones contain extra plasmid copies integrated at the pfpm4 locus. The non-transfected parental line 3D7 is also shown.
116
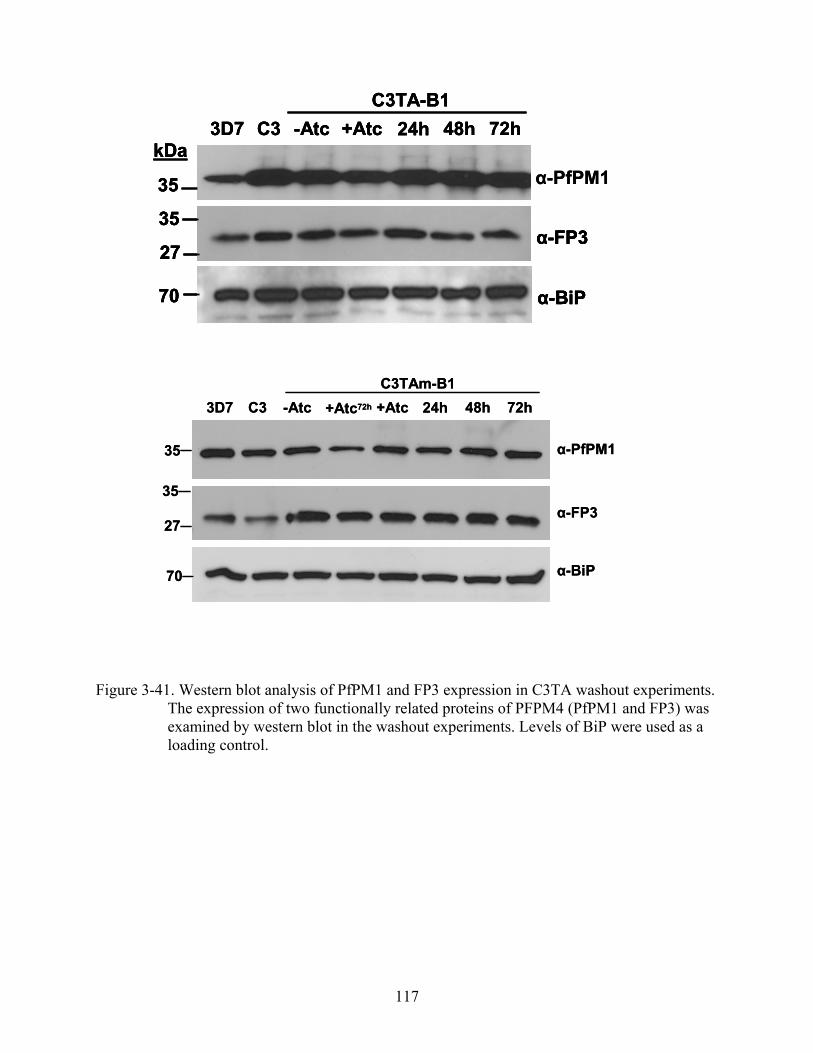
α-PfPM1
70 α-BiP
α-FP327
35
35
C3 -AtcC3TA-B1
3D7 +Atc 72h24h 48hkDa
α-PfPM1
70 α-BiP
α-FP327
35
35
C3 -AtcC3TA-B1
3D7 +Atc 72h24h 48hkDa
70 α-BiP70 α-BiP
α-FP327
35α-FP3
27
35
35
C3 -AtcC3TA-B1
3D7 +Atc 72h24h 48hkDa
70 α-BiP
C3 -AtcC3TAm-B1
3D7 +Atc 72h24h 48h+Atc72h
27
35
35α-FP3
α-PfPM1
70 α-BiP
C3 -AtcC3TAm-B1
3D7 +Atc 72h24h 48h+Atc72h
27
35
35α-FP3
α-PfPM1
Figure 3-41. Western blot analysis of PfPM1 and FP3 expression in C3TA washout experiments.
The expression of two functionally related proteins of PFPM4 (PfPM1 and FP3) was examined by western blot in the washout experiments. Levels of BiP were used as a loading control.
117

0.6
6.9
0.3
4.7
2.6
1.5
1.0
0.6
6.9
0.3
4.7
2.6
1.5
1.0
3D7 C3 3D7 C3
pfpm4 5' pfpm4 3'
kb kb
1.6
1.0
1.6
1.0
0.6
6.9
0.3
4.7
2.6
1.5
1.0
0.6
6.9
0.3
4.7
2.6
1.5
1.0
0.6
6.9
0.3
4.7
2.6
1.5
1.0
3D7 C3 3D7 C3
pfpm4 5' pfpm4 3'
kb kb
1.6
1.0
1.6
1.0
Figure 3-42. Analysis of steady-state pfpm4 5’ and 3’RNA transcripts in 3D7 and pTOCAM-∆pm4 clone C3 by northern blot. Nuclear rRNA is shown as a loading control. Total cellular RNA was blotted and hybridized to a probe for the 5’ end of pfpm4 and the 3’ end of pfpm4. In 3D7 a dominate transcript at ~ 3.3 kb and two smaller bands were detected by both probes. Three transcripts were detected in C3 with the 5’ probe, and two faint transcripts were detected by the 3’ probe in C3.
118
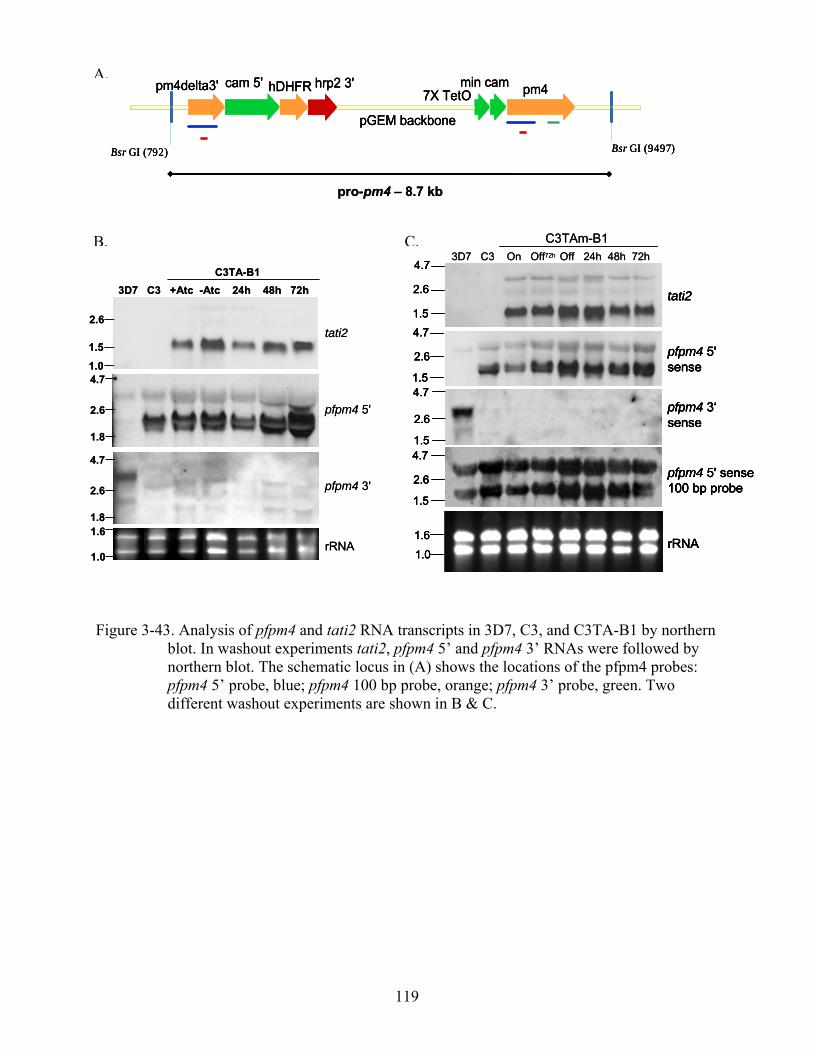
pro-pm4 – 8.7 kb
hDHFR pm4pm4delta3'
pGEM backbone
cam 5'7X TetO
min camhrp2 3'
Bsr GI (792) Bsr GI (9497)
pro-pm4 – 8.7 kb
hDHFR pm4pm4delta3'
pGEM backbone
cam 5'7X TetO
min camhrp2 3'
Bsr GI (792) Bsr GI (9497)
hDHFR pm4pm4delta3'
pGEM backbone
cam 5'7X TetO
min camhrp2 3'
Bsr GI (792) Bsr GI (9497)
A.
B.
3D7 C3 On Off72h Off 24h 48h 72hC3TAm-B1
4.7
2.6
1.54.7
2.6
1.54.7
2.6
1.54.7
2.6
1.5
1.6
1.0
tati2
pfpm4 5'sense
pfpm4 3‘sense
pfpm4 5' sense 100 bp probe
rRNA
4.7
2.6
1.54.7
2.6
1.54.7
2.6
1.54.7
2.6
1.5
1.6
1.0
tati2
pfpm4 5'sense
pfpm4 3‘sense
pfpm4 5' sense 100 bp probe
rRNA
3D7 C3 On Off72h Off 24h 48h 72hC3TAm-B1
4.7
2.6
1.54.7
2.6
1.54.7
2.6
1.54.7
2.6
1.5
1.6
1.0
tati2
pfpm4 5'sense
pfpm4 3‘sense
pfpm4 5' sense 100 bp probe
rRNA
4.7
2.6
1.54.7
2.6
1.54.7
2.6
1.54.7
2.6
1.5
1.6
1.0
tati2
pfpm4 5'sense
pfpm4 3‘sense
pfpm4 5' sense 100 bp probe
rRNA
C.
4.7
2.6
1.8
4.7
2.6
1.8
3D7 C3 +Atc -Atc 24h 48h 72h C3TA-B1
2.6
1.5
1.0
1.6
1.0
tati2
pfpm4 5'
pfpm4 3'
rRNA
4.7
2.6
1.8
4.7
2.6
1.8
3D7 C3 +Atc -Atc 24h 48h 72h C3TA-B1
2.6
1.5
1.0
1.6
1.0
tati2
pfpm4 5'
pfpm4 3'
rRNA
Figure 3-43. Analysis of pfpm4 and tati2 RNA transcripts in 3D7, C3, and C3TA-B1 by northern blot. In washout experiments tati2, pfpm4 5’ and pfpm4 3’ RNAs were followed by northern blot. The schematic locus in (A) shows the locations of the pfpm4 probes: pfpm4 5’ probe, blue; pfpm4 100 bp probe, orange; pfpm4 3’ probe, green. Two different washout experiments are shown in B & C.
119

CHAPTER 4 DISCUSSION
DNA Gyrase and Apicoplast Studies
The cellular and molecular response of P. falciparum to ciprofloxacin confirms that a
prokaryotic type II topoisomerase activity in the apicoplast is a target of this drug. While
cyanobacteria utilize both DNA gyrase and topoisomerase IV enzymes, available sequence data
indicates that apicomplexans retained only one of these enzymes (NCBI, NLM). Similarly, the
green algae Clamydomonas and Ostreococcus retained only 1 enzyme; and the Cryptomonad
Guillardia theta has just one nucleomorph-encoded eubacterial type II topoisomerase (NCBI,
NLM). Based on phylogenetic analysis, it is uncertain whether the apicomplexan DNA
gyrase/Topo IV enzyme evolved from a DNA gyrase or Topoisomerase IV precursor (Appendix
A). Most of the apicomplexan orthologues are annotated as DNA gyrase, although this enzyme
may have more diverse functional roles and/or perform additional specialized functions.
Functional analysis will be required to define the origin and provide classification of the
apicomplexan DNA gyrase/Topo IV enzyme.
The two major classes of DNA gyrase inhibitors caused a dosage-dependent inhibition of
P. falciparum proliferation in in vitro culture. Fluoroquinolones (e.g. ciprofloxacin) are
derivatives of the quinolone nalidixic acid, and coumerins (e.g. coumermycin and novobiocin)
are natural products of Streptomyces spp. The fluoroquinolones promote the rate at which
covalent enzyme-DNA reaction intermediates are formed by causing distortions in the DNA
where DNA gyrase is bound. The trapped enzyme complex interferes with the passage of
replication forks and transcription complexes (Drlica and Malik 2003). Coumerins directly
inhibit DNA gyrase activity by competing for binding sites in the ATPase regions (Maxwell
1999). The energy from ATP induces conformation changes in type II topoisomerases that are
120

required to drive DNA relaxation (with the exception of DNA gyrase which has an ATP-
independent relaxation activity), catenation/ decatenation, and in the case of DNA gyrase,
induction of negative supercoils (Liu et al. 1980). Ultimately, it is thought that the cytotoxic
action of these inhibitors is the accumulation of double stranded lesions in the DNA that cannot
be overcome by the DNA repair machinery. Interestingly, parasites which were
developmentally-delayed after 34 h of treatment with the IC50 of ciprofloxacin showed greater
viability after 120 h compared to parasites that showed developmental progression similar to the
control population after 34 h of drug treatment. This developmental delay may provide an
opportunity for a small subset of parasites to enter a quiescent state and undergo apicoplast DNA
repair and remodeling in response to the drug.
In contrast to the delayed-death phenotype that occurs with ciprofloxacin treatment in the
closely related apicomplexan parasite Toxoplasma gondii (Fichera and Roos 1997), ciprofloxacin
caused immediate death in Plasmodium falciparum. While the T. gondii and P. falciaprum 35 kb
plastid genomes are extremely similar in nucleotide sequence and gene organization, the
topology and mode in which the plastid genomes are replicated are very different. The T. gondii
plastid is present as mostly linear tandem arrays and is replicated through a rolling circle
mechanism (Williamson et al. 2001). The P. falciparum apicoplast DNA is present primarily as
covalently closed circular monomers in either relaxed or twisted forms, with a small proportion
of highly twisted forms (Williamson et al. 2002). The apicoplast DNA is replicated by 2
mechanisms: the formation of twin displacement-loops (D-loops) within the inverted repeat
region of the circle, and by a rolling circle mechanism that initiates outside of the inverted repeat
region (Williamson et al. 2002). Of these 2 modes of apicoplast DNA replication, the twin D-
loop mechanism was found to be considerably more sensitive to ciprofloxacin (Williamson et al.
121

2002). It was found in this study that mitochondrial DNA replication was not affected by
ciprofloxacin. Like the Toxoplasma apicoplast DNA, the Plasmodium mitochondrial DNA is
present as linear tandem arrays and utilizes a rolling circle method of DNA replication. However,
Toxoplasma has an apicoplast targeted DNA gyrase, and treatment with ciprofloxacin results in a
selective loss of apicoplast DNA (Fichera and Roos 1997). The P. falciparum DNA gyrase is
specifically localized to the apicoplast and not the mitochondrion (Raghu Ram et al. 2007). A
type I topoisomerase (topoisomerase III, PlasmoDB ID PF13_0251) encoded in the nucleus
contains putative N-terminal transit peptide, suggesting it could be targeted to the mitochondrion
(Appendix B). Presence of a type I topo in the mitochondrion further explains the lack of
mitochondrial sensitivity to both bacterial (ciprofloxacin) and eukaryotic (VP-16/VM-26) topo
poisons. While in the land plants Arabadopsis thaliana and Nicotiana benthamiana there is a
DNA gyrase which is targeted to both the plastid and mitochondrion (Cho et al. 2004, Wall et al.
2004), this may not be the case in more ancient plastid-harboring organisms. For example,
treatment of the red alga Cyanidioschyzon merolae with the gyrase subunit A inhibitor naladixic
acid results in unequal distribution of the plastid nucleoid in divided chloroplasts, whereas the
mitochondrial DNA remained unaffected by the drug treatment (Itoh et al. 1997). In P.
falciparum, a recent study that followed the morphology of the apicoplast and mitochondrion
after treatment with a lethal dosage of ciprofloxacin showed that the apicoplast never elongated,
while normal elongation and branching of the mitochondrion was observed in some cells
(Goodman et al. 2007). Results from this study support the findings of Goodman et al. (2007).
Loss of DNA with fluoroquinolone treatment is a characteristic molecular phenotype of
DNA Gyrase-DNA interactions and in this study ciprofloxacin treatment resulted in a selective
loss of apicoplast DNA. The loss of apicoplast DNA did not preferentially occur in the inverted
122

repeat region as may have been expected based on previous work demonstrating that DNA
replication of the inverted repeat region is sensitive to ciprofloxacin (Williamson et al. 2002). A
similar trend in the loss of apicoplast DNA was observed for both LSU genes of the inverted
repeat and two genes that are distant from the inverted repeat (clpC and tufA). This result can be
explained by an increased reliance on the rolling circle method of DNA replication. Eventually
however, once the circular template from which the linear multimers are generated during rolling
circle replication is depleted as a result of drug-induced cleavage, replication would cease. In
fact, DNA gyrase activity may be required for regenerating the circular templates from the linear
DNA (Williamson et al. 2002), and this could further inhibit DNA replication.
In this study the effects of ciprofloxacin on the steady-state RNA levels of a protein coding
gene (clpC) and the rRNA gene (LSU) were examined over a 96 hour time course in
synchronous parasites. For these experiments the IC50 concentration of ciprofloxacin (5 µg/ml)
was used. Both clpC transcripts and LSU rRNA showed a significant decrease in the second
asexual cycle (~ 100-fold) compared to the untreated controls. However, the effects of drug
treatment on clpC transcripts were less pronounced in the first asexual cycle, and the temporal
pattern of clpC expression appeared normal, with the highest abundance of transcripts
accumulating in the late trophozoite stage. Conversely, drug treatment resulted in an immediate
effect on LSU rRNA levels, which were detected at levels significantly lower than the controls
after just 12 h of drug treatment. The abundance of LSU rRNA steadily decreased over the next
84 h.
Protein coding genes of the apicoplast DNA are actively transcribed in polycistronic units
and it proposed that at least 4 primary transcripts originate from the inverted repeat region
(Gardner et al. 1991b, Feagin and Drew 1995, Preiser et al. 1995, Wilson et al. 1996). By
123
probing with rpoB and rpo C, Feagin and Drew detected four low abundance transcripts at
approximately15 kb, 12.5 kb, 11 kb, and 7.8 kb which were reproducibly found within a smear
of transcripts (1995). It has also been found that probing with tuf A gives a smear, and rpl2 and
rpl23, and rps3 and rps19 transcripts are linked (Wilson et al. 1996). In contrast, the ribosomal
RNAs are detected as discrete bands. Reports indicate that the LSU rRNA is detected as a single
band at 2.9 kb, and the SSU rRNA is detected as 3 bands at 1.7 kb, 1.35 kb, and 1.2 kb (Gardner
et al. 1991a, Feagin and Drew 1995). Based on this published information, it can be deduced that
RNA expression of the apicoplast ribosomal genes occurs independently of the protein coding
genes. Further, results from this study indicate that rRNA expression and/or accumulation was
sensitive to ciprofloxacin, whereas protein coding transcripts were less sensitive. The decrease in
clpC transcripts could be mostly attributed to a cognate loss of DNA template resulting from the
inhibition of DNA replication.
Among the most striking sub-cellular morphological features of the P. falciparum cell are
the elaborate configurations taken on by the developing apicoplast and mitochondrion. During
the asexual cycle, a segment of each organelle is segregated into all newly formed daughter
merozoites just before rupture of the schizont. On average 16 merozoites are produced during
schizogony, and in addition to orchestrating organelle segregation, a mechanism for organellar
genome segregation must be in place. This process is expected to be directed in part by
components of the eukaryotic division apparatus, and may also be linked to the structural
characteristics and positioning of the nucleoid, to ensure proper segregation of the apicoplast
genome. DNA gyrase is expected to play a critical role in maintaining the fidelity of apicoplast
DNA segregation into new apicoplasts. There are two global systems that govern binary fission
in bacteria: 1) Min system-regulated positioning of the Z-ring at the midcell, and 2) inhibition of
124

septation by either the SOS-mediated SulA division inhibitor, or more specific septation
inhibition by nucleoid exclusion (Rothfield et al. 2005). In bacteria, when DNA replication
and/or segregation are blocked, the system of nucleoid exclusion (NO) prevents septation from
occurring over the nucleoid, but allows division to take place in a different area of the cell
(Woldringh et al. 1991, Bernhardt and de Boer 2005). If the Plasmodium DNA gyrase is required
for DNA replication and nucleoid segregation, it could be anticipated that ciprofloxacin
treatment would give rise to DNA-deficient apicoplasts (that appear otherwise normal) in
daughter cells. However, results from the FISH/IFA analysis strongly suggest that apicoplasts
did not develop normally in drug treated cells. Results from qRT-PCR experiments showed that
the accumulation of ribosomal RNA was immediately inhibited with ciprofloxacin treatment.
Whereas LSU rRNA levels climbed to 505 ± 142 molecules per nuclear genome during the first
asexual cycle in untreated parasites, in ciprofloxacin treated cultures the number of LSU rRNA
molecules per nuclear genome levels reached a maximum of 64 ± 24. The reduction in rRNA
would immediately affect translation of apicoplast encoded genes. The additive consequences of
impaired protein translation of apicoplast encoded genes (further reduction of translation from
lack of ribosomal proteins, reduction in transcription, and decreased protein import) would result
in dysfunctional and morphologically abnormal apicoplasts.
Two 50S ribosomal inhibitors (clindamycin and azithromycin) and a 30S ribosomal
inhibitor (doxycycline) cause delayed-death in P. falciparum, whereas another 50S ribosomal
inhibitor (thiostrepton) causes immediate death. The variation in the potencies of these different
inhibitors may be a result of where they bind the rRNA, how well inhibitors gain access to the
apicoplast stroma, different half-lives, etc. In the case of the delayed-death inhibitors, washout
studies have demonstrated that the ultimate lethality was due to consequences of drug treatment
125

within the first asexual cycle. The precise reason for the delayed death remains unknown. It is
proposed that thiostrepton (which causes immediate death) interferes with the association of
elongation factors with the ribosome (Jonker et al. 2007). Thiostrepton is a thiopeptide anti-
bacterial that binds both the 23S rRNA and the L11 ribosomal protein, and inhibits ribosome-
mediated GTP hydrolysis and peptidyltransferase activity (Harms et al. 2008). Conversely,
another thiopeptide inhibitor micrococcin stimulates GTPase activity of the ribosome, yet it is
extremely potent against P. falciparum with a low nM IC50 (Rogers et al. 1998). Interestingly,
thiostrepton causes an immediate reduction in the levels of apicoplast rpoB/rpoC transcripts and
the reduction is similar to what is observed for the eubacterial RNA polymerase inhibitor
rifampicin, which causes immediate death (McConkey et al. 1997). Therefore, inhibiting
apicoplast RNA transcription, whether directly or indirectly, may be a common thread in anti-
bacterials that cause immediate death target in P. falciparum. While ciprofloxacin did not cause
an immediate reduction in the transcript levels of the protein coding gene clpC, the levels of
rRNA were significantly reduced, and the drug caused immediate parasite death. The cytotoxic
action of ciprofloxacin may be a result of inhibiting rRNA production and thus protein
translation. FISH studies demonstrated that the apicoplast nucleoid signal was reduced both in
size and intensity in parasites cultured with ciprofloxacin. After 72 h in culture with
ciprofloxacin (5 µg/ml) there was a significant reduction in the quantity of apicoplast DNA and
RNA, which would result in disruption of protein synthesis of apicoplast encoded genes. In the
absence of apicoplast encoded proteins, in particular the molecular chaperone and member of the
Tic protein import complex CLPC, protein transport into the apicoplast would be severely
impeded. Indeed, studies have shown that inhibition of apicoplast translation with anti-bacterial
126
drugs leads to the accumulation of unprocessed apicoplast-targeted protein (Goodman et al.
2007).
However, compared to thiostrepton the inhibitory effect of ciprofloxacin on protein
translation was not immediate. The finding that clpC transcription (an indirect measure of
apicoplast protein translation based on affecting the translation of the apicoplast DNA encoded
RNA polymerase subunit genes rpoB, rpoC, and rpoC2) was not significantly reduced within the
first cycle of ciprofloxacin treatment could indicate that apicoplast ribosome function was not
completely inhibited. It is also possible that the remaining pool of RNA polymerase was able to
continue transcription.
If inhibiting protein translation in the apicoplast is a major cytotoxic consequence of
ciprofloxacin, it may be difficult to uncover other DNA gyrase functions using ciprofloxacin as a
probe. Also, during schizogony DNA replication and segregation can not be delineated into
specific time frames where one process was occurring exclusively of the other, leaving it
difficult to assess the effect of DNA gyrase inhibition by ciprofloxacin solely on one process in
the absence of the other.
The in situ analysis of ciprofloxacin treated parasites by combined FISH / IFA provided
important insight into the mechanism of DNA gyrase inhibition by the drug. In many cells the
apicoplast signal from GFP became fragmented and was localized to the perinuclear region.
Furthermore, in many instances the apicoplast DNA did not fully co-localize with the GFP
signal. If a consequence of ciprofloxacin treatment is inhibition of protein transport into the
apicoplast, then GFP detected in the drug treated cells may have been trapped within the
apicoplast membranes. In addition, the observation that the GFP signal was perinuclear raised
the possibility that apicoplast targeted proteins were trapped in the membranes of the ER. It is
127
also possible that the fragmented appearance of the GFP delineated structures indicates that the
apicoplast was disintegrating and this could result in the release of the apicoplast DNA. If protein
import was also impeded in the apicoplast disintegration scenario, this would results in a lack of
proper structural organization of the nucleoid by DNA associated proteins such as the apicoplast
targeted HU-like proteins.
Typically in a dividing eukaryotic cell, the nuclear membrane dissolves into vesicles
following karyokinesis (Anderson and Hetzer 2008). In apicomplexa a unique situation exists
where the nuclear membrane persists throughout the cell cycle (Striepen et al. 2007). The nuclear
lamina coating the inside of the nuclear membrane is essential in orchestrating chromatin
organization, DNA replication, and cell cycle regulation (Gruenbaum et al. 2005). Like the
nuclear membrane, the inner plastidic membrane and associated components could serve as an
attachment point for the apicoplast nucleoid. In spinach chloroplasts the nucleoid is bound to the
chloroplast envelope early in development and to the thykaloid membrane later in development,
with the attachment sites residing near the inverted repeat region containing 16S and 23S rRNA
genes (Liu and Rose 1992). In this study a novel transmembrane and DNA binding protein was
identified with predicted apicoplast targeting sequences (PFL1055c, Appendix C). This protein
has structural features that indicate it is a PEND-like protein found in chloroplasts (N-terminal
bzip-like DNA binding domain, C-terminal transmembrane domains, internal repeat sequences).
In chloroplasts this protein is predicted to bind the chloroplast DNA, and to attach to the inner
plastidic membrane through its transmembrane domains (Sato et al. 1999, Sato and Ohta 2001).
The PEND protein binds specifically to the canonical sequence TAAGAAGT (Sato and Ohta
2001), and the P. falciparum apicoplast DNA contains 2 copies of this sequence in each side of
the inverted repeat (total of 4 copies). Furthermore, the P. falciparum PEND-like protein
128

contains a predicted bipartite apicoplast targeting sequence (Appendix C). In the absence of a
protein such as the PEND-like homologue and other membrane bound proteins to provide the
scaffolding for the PEND-like homologue, the apicoplast DNA could become disassociated from
the apicoplast envelope.
Like nuclear chromatin, the bacterial nucleoid has functional structure (Razin 1999,
Dorman and Deighan 2003, Thanbichler et al. 2005, Cremer et al. 2006). The bacterial nucleoid
is comprised of short-range structures that are governed by histone-like proteins and long range
structures in the form of looped domains radiating from the inner bacterial membrane (Kavenoff
and Ryder 1976, Brunetti et al. 2001, van Noort et al. 2004). DNA segments that are
compartmentalized in long-range loop domains exhibit independent supercoiling topology, and
in eukaryotic cells nuclear topoisomerase II is found at the chromosomal loop anchorage sites
associated with the nuclear matrix/scaffold (Adachi et al. 1989, Laemmli et al. 1992). Drug-
induced DNA cleavage by topoisomerase II results in excision of DNA loops and is used as an
important tool for understanding the higher order structure of chromatin. Similarly, in bacteria
drug-induced cleavage by DNA gyrase and topoisomerase IV results in excision of loop-sized
DNA fragments (Hsu et al. 2006).
In the present study, DNA cleavage analysis was performed to further characterize the
potential sites that DNA gyrase associates with the apicoplast DNA. The topoisomerase poisons
ciprofloxacin and VM26/VP-16 were used to stabilize potential ‘cleavable complexes’. SDS,
which induces double stranded breaks in the DNA of the cleavable complex (Liu et al. 1983,
Rowe et al. 1984) was added after drug treatment. The DNA remains attached at the 5'
phosphoryl end to the active site tyrosine of GyrA, and this property was exploited for
129

immunoprecipitation experiments using GyrA antibody. For cleavage analysis DNA was treated
overnight with proteinase-K.
Results from the cleavage analysis indicated that the DNA gyrase did not associate with
highly specific regions of the apicoplast DNA, as discrete bands were not observed in the vast
majority of experiments conducted. Instead, a smearing of apicoplast DNA was observed in the
ciprofloxacin treated samples that were digested with single cutting enzymes (EcoRI and NsiI).
In the Nsi I digest, the smearing was similarly produced in the VM26 treated sample. A typical
feature of inverted repeats is the formation of cruciform structures, and cruciform structures have
been identified in P. falciparum apicoplast DNA by electron microscopy (Williamson et al.
2002). Cruciform structures often coincide with origins of replication and typically exhibit
independent supercoiling topology (Pearson et al. 1996). Furthermore, type II topoisomerases
can interact with specific recognition sites based on secondary structure (Froelich-Ammon et al.
1994), raising the possibility that the cruciform structure of the apicoplast DNA could act as a
preferential substrate for DNA gyrase. However, in the present study preferential sites of
interaction were not identified. Of note were the results of the Hpa I digest, where either one or
both of the Hpa I sites located within the inverted repeat appeared to be blocked in a subset of
DNA. The blockage was most pronounced in drug-treated late trophozoite / early schizont
stages. A potential explanation for the blocked DNA digestion is the formation of transient
single-stranded extensions within the inverted repeat region, which are characteristic of D-loop
replication. Drug treatment may have resulted in an accumulation of replication intermediates by
obstructing movement of the replication complex. A similar obstruction may have led to lack of
LSU rRNA accumulation.
130

Conditional Gene Regulation
Prior to attempting the conditional regulation of DNA gyrase expression, efforts were
focused on demonstrating that conditional regulation of a characterized non-essential gene within
its native locus would be feasible. The plasmepsin 4 gene was selected for this investigation after
considering previous work demonstrating that a) the plasmepsin locus is permissive to
homologous recombination, and b) disruption/deletion of pfpm4 is not lethal for blood-stage P.
falciparum cultured in vitro (Omara-Opyene et al. 2004, Bonilla et al. 2007a, Bonilla et al.
2007b).
FACS analysis of parasites transformed with pTGPI-GFP indicated that a single copy of
the transgene under the TetO / min. cam and a single copy of transactivator were sufficient to
control GFP expression. Also encouraging was the finding that GFP expression was silenced
within 24 h of adding ATc. However, the finding that the progeny of GFP expressing parasites
did not uniformly express GFP raised some concern. Initially it was thought that some instability
could arise due to the fact that the Tet-transactivator elements were being expressed from an
episome. Plasmid episomes in P. falciparum can form large concatamers that may be subject to
spurious recombination events, and episomes are not equally segregated into daughter cells
(O'Donnell et al. 2001, O'Donnell et al. 2002). The toxic effects of the GPI-anchor fused to the
C-terminus of GFP (to promote turnover) were also considered as a potential explanation for the
phenotypic instability (Meissner et al. 2005). In the present study, the regulatory elements of the
Tet-transactivator system were integrated into the P. falciparum genome to confer greater
genetic stability. First, the TetO/min.cam promoter was successfully targeted for integration
immediately upstream of pfpm4 to create the pTOCAM-∆pm4 parasite lines. Insertion of the
artificial promoter reduced the level of full-length pfpm4 RNA expression by > 100-fold
compared to the wild-type pfpm4 levels, and PfPM4 protein was not detected by western blot.
131
Next, piggyBac transformation was used to insert the tati2 expression cassette into the genome
and parasites were selected in the absence of ATc to create parasite line C3TA. If restoration of
PfPM4 expression was advantageous for parasite development, perhaps this would promote the
selection of parasites where the Tet-transactivator system was properly functioning. However,
the proliferation rates of two pTOCAM-∆pm4 clones tested did not differ from the wild-type
3D7 strain, leaving little opportunity to select C3TA parasites based on increased proliferation.
In fact, after the successful introduction of the tati2 expression cassette, PfPM4 expression was
not restored in culture C3TA. It was also found that although tati2 RNA was in high abundance,
TaTi2 protein was not correspondingly high. Interestingly however, when C3TA was cultured in
the presence of ATc for as little as 96 h, TaTi2 protein expression was restored to near maximum
steady-state levels.
In subsequent experiments, C3TA-B1 parasites were cultured in the presence of ATc and a
drug wash-out approach was used in an effort to regulate the expression of pfpm4. Western blot
analysis of the wash-out experiments revealed that TaTi2 protein levels remained consistently
less in C3TA-B1 cultured without ATc, and the same TaTi2 silencing phenomenon was observed
with pTGPI-GFP transformed parasites in which gfp was the transgene under the regulation of
the TetO/min. cam promoter. However, TaTi2 expression was stable in the absence of ATc in
parasite clones that did not contain a TetO/min. cam promoter (TA-01, TA-02, and TATK-04
parasite lines). The reduction in TaTi2 protein in C3TA-B1 in the absence of ATc was unlikely
attributable only to transcriptional silencing, since the RNA levels of tati2 differed by less than
2-fold while the protein levels differed on average by 10-fold. Furthermore, the silencing effect
on the transactivator appeared to be dependent upon a trans interaction of TaTi2 with the
operator sequence, and was not dependent on the nuclear location of TaTi2 or the TetO
132

sequence, and was not dependent on the particular gene that is placed under control of the TetO.
The rapid accumulation of TaTi2 in the presence of ATc (where TaTi2 cannot bind the TetO)
additionally supports the reasoning that TaTi2 silencing results as a consequence of interaction
with the TetO.
Binding of the transactivator to the TetO induces a conformational change in the protein
(Orth et al. 2000), and perhaps in this conformation the protein is less stable when released from
the DNA. Alternatively, perhaps the protein is more readily degraded if bound to the TetO. There
is an intimate association between the potency of transactivators, ubiquitination, and proteasome
activity, (Kodadek et al. 2006). Proteosome mediated turnover of transactivators can restrict
promoter activity, or keep gene transcription in a potentiated state to continuously respond to
environmental or cellular stimuli (Reid et al. 2003, Szutorisz et al. 2006). In future studies, to
investigate whether the nature of the silencing affect was caused by increased TaTi2 turnover,
experiments may be conducted with C3TA-B1 parasites using proteasome inhibitors in the
absence and presence of ATc. Experiments may also be conducted to compare the degree of
ubiquitination of TaTi2 in C3TA-B1 in the presence and absence of ATc and compare the result
to the level of TaTi2 ubiquitination in the absence and presence of ATc in one of the TA parasite
lines.
In the washout experiments, pfpm4 expression was expected to be stimulated upon
washout of ATc. TaTi2 was first allowed to accumulate by culturing in the presence of ATc, and
then the drug was washed out to permit binding of the protein to the operator sequence. It was
encouraging that 3’ pfpm4 RNA levels closely followed the levels of tati2 RNA, as it would be
expected that the temporal pattern of TaTi2 expression would directly influence the expression
of the gene under regulation of the TetO. These results indicate that at least some TaTi2 was
133
binding the TetO to stimulate transcription, although the process was not robust enough to
restore PfPM4 protein production to detectable levels. The lack of robust stimulation could be
the result of numerous factors. First, three extra plasmid copies of pTOCAM-∆pm4 were
integrated in clone C3TA-B1, and it may be the configuration of the locus that was interfering
with the capacity to regulate pfpm4 expression. While a single pfpm4 RNA transcript
predominated in wild-type 3D7, there were three dominant RNA transcripts detected in C3 and
C3TA-B1. Northern blot and qRT-PCT data indicated that all three transcripts in C3 and C3TA-
B1 originated from the natural pfpm4 promoter and the smaller two transcripts were break-down
products of the larger transcript. The absence of a 3’ UTR and associated stabilizing elements
was likely responsible for increased rate of RNA breakdown of pfpm4 transcripts originating
from the natural promoter. Very little RNA was detected from the full length copy of pfpm4
under the control of TetO / min. cam promoter. The additional pfpm4 copies that were truncated
at the 3‘end and under the regulation of TetO/min. cam promoter were likely to be similarly
minimally active. Further supporting that all TetO/min. cam promoters were very minimally
active were the findings that regardless of how many additional plasmid copies were integrated
the same three transcripts were detected by northern blot, the transcripts were in the sense strand
orientation, and levels of 5’ pfpm4 RNA determined by qRT-PCR were not statistically
significantly different in 3D7, C3 and C3TA-B1 (Figures 3-43 & 3-44).
The majority of the eukaryotic genome is transcribed (Cheng et al. 2005, Kapranov et al.
2005). Non-coding RNAs regulate chromatin structure and the epigenome in the eukaryotic cell,
and can directly regulate transcription processes (Amaral et al. 2008). Also, alternatively spliced
RNA transcripts from protein coding genes, and antisense transcripts are also much more
common than previously thought (Mendes Soares and Valcarcel 2006). Although the functional
134

diversity of alternative mRNA isoforms remains to be discovered, studies are beginning to link
the presence of alternative mRNAs with specific biological functions (Relogio et al. 2005, Ule et
al. 2005, Mendes Soares and Valcarcel 2006). The natural 5’ promoter in the pTOCAM-∆pm4
and C3TA parasite lines created in this study remained pervasively active. The activity of the
pfpm4 natural promoter and the presence of abundant 5’ pfpm4 RNA and its breakdown products
originating from this promoter might negatively impact the potential of inducing expression of
the additional pfpm4 copies under the TetO/min. cam promoter. Other potential explanations
may also need to be examined. The minimal cam promoter could be lacking sequence that is
required for RNA polymerase to be in a poised state for transcription. In eukaryotic cells RNA
transcription requires recruitment of RNA polymerase and the pre-initiation complex,
transcription initiation, and pause at promoter proximal sites prior to escape from the pause sites
and elongation (Core and Lis 2008). Perhaps, for the Tet-transactivator system to be functional
additional sequence elements may need to be present in close proximity to the TetO.
Recombination of episomal DNA that commonly occurs in P. falciparum (K. Deitsch, pers.
comm.), may lead to the occasional association of required elements with the TetO min CAM
promoter for the operator/promoter to work as expected, and this may explain why only 20% of
the pTGPI-GFP transformed clones express GFP. Other potential explanations for the lack of
induction could be that TaTi2 does not contain a sufficiently strong transactivating domain and
that proximity to a strong promoter (such as 5’ pfpm4 or in pTGPI-GFP msp2) could be
detrimental for target transgene expression as the strong promoter could titrate out transcriptional
factors.
Consideration must also be given to the timing of tati2 expression and the subcellular
localization of TaTi2. The expression of tati2 is under the regulation of the msp2 promoter,
135

which peaks in activity during the late-trophozoite and early schizont stages (Wickham et al.
2003). The peak of pfpm4 expression however is during the early ring stages. This difference in
the timing of expression may result in deficient co-localization of the pfpm4 locus with TaTi2,
and TaTi2 may localize to the nucleus in a time frame where the pfpm4 locus is not poised for
transcriptional stimulation. Furthermore, the timing of transactivator expression may result in
trafficking of the protein to a specific subcellular location other than the nucleus. Studies have
demonstrated that the timing of transgene expression in Plasmodium is critical for appropriate
sub-cellular localization (Kocken et al. 1998, Triglia et al. 2000). In future studies, the N-
terminal 90 bases of the P. falciparum histone H2B containing a predicated 17 amino acid
nuclear targeting sequence may be appended to the N-terminus of the transactivator protein. It is
possible that both proper timing of expression and the addition of the appropriate targeting
sequence may be required to achieve superior nuclear localization. Once in the nucleus however,
the transactivator must also reach the appropriate nuclear compartment also containing the gene
under the regulation of the TetO promoter. To properly achieve so many concerted levels of
cellular regulation will be difficult using a cogent approach, and thus future efforts will focus on
setting up functional screens.
As illustrated by P. falciparum episomally transformed with pTGPI-GFP, the level of
Tet-transactivator regulated transgene expression is highly variable among individual cells.
Experiments targeting non-essential endogenous loci for conditional regulation may prove to be
even more problematic. Because the protein product of a non-essential gene is dispensable for
the parasite, pressure to maintain stable expression of this gene may be more costly (perhaps by
affecting the timing and levels of expression of nearby genes) than not expressing the gene.
However, it remains critical to evaluate how robustly the system works when applied to an
136
essential gene, since in this case the parasite is under pressure to consistently drive the cascade of
events required to maintain stable gene expression.
For future studies, a functional approach will be used to select for parasites where Tet-
regulated gene expression is most uniformly operational and persists over generations. In one set
of experiments, a hDHFR expression cassette under the regulation of the TetO/min. cam
promoter will be randomly integrated by piggyBac transformation into the genome of low,
medium, and high TaTi2-expressing lines. Cultures will be selected with WR99210 at a range of
concentrations to obtain parasites where the Tet-transactivator system is able to drive hDHFR
expression. Mapping of the integration site, combined FISH / IFA, and chromatin
immunoprecipitation will be used to examine the configuration of nuclear environments that are
permissive and non-permissive for Tet-regulated expression.
In another approach, parasites may first be randomly transformed by piggyBac with a
plasmid construct containing the hDHFR with TetO/min. cam promoter expression cassette and
BSD as a selectable marker. Next, piggyBac transformation will be used to introduce
transactivator expression cassettes lacking a selectable marker. Instead, WR99210 will be used to
select, thus only parasites with functional Tet-regulation driving hDHFR expression will emerge
from the population pool. Also, tati2 expression cassettes lacking a promoter sequence and/or
terminator sequence will be used. Once the transgenic parasite lines are produced, ATc will be
added to the culture medium to turn off hDHFR expression, and hDHFR protein and RNA levels
will be followed.
In a third approach to determine whether the reduction in TATi-2 levels can be overcome
by increased expression, a plasmid construct with a bidirectional promoter will be used to drive
both tati2 and bsd expression cassettes. By increasing the selective concentration of blasticidin-
137

S, the plasmid copy number will increase to drive bsd expression which will also increase tati2
transcription.
Conclusion
In conclusion, results from this study indicated that targeting DNA gyrase with
ciprofloxacin inhibited the replication of apicoplast DNA and the accumulation of apicoplast
RNA transcripts, and blocked the production of apicoplast ribosomal RNA. Also, with
ciprofloxacin treatment the apicoplast nucleoid appeared reduced in size and did not segregate
normally, and the apicoplast displayed abnormal morphology. In contrast, mitochondrial DNA
replication, transcription, and segregation were unaffected. The DNA gyrase appeared to
associate with the apicoplast DNA at non-specific loci, implicating numerous functional roles for
the enzyme. For further characterization of the Plasmodium DNA gyrase cellular functions
independent of probing with drug, efforts were focused on developing a system for conditional
gene regulation. Results from the conditional gene regulation studies indicated that the Tet-
transactivator system has potential applicability for controlling endogenous gene expression in P.
falciparum, but must be further optimized. Artificial promoters were successfully targeted to the
pfpm4 genomic locus, and piggyBac insertion of transactivator (TaTi2) expression cassettes
resulted in stable TaTi2 expression. In washout studies, the temporal pattern of pfpm4 RNA
expression closely followed the expression of tati2. In the induced state of target transgene
expression the steady-state TaTi2 levels decreased, a phenomenon that will be further
investigated. Attention will also be given to optimizing the configuration of the locus containing
the ATc-responsive promoter, and providing optimal timing of transactivator expression and
nuclear localization. The ultimate goal of these studies is to establish a system for conditional
gene regulation in P. falciparum to characterize the cellular functions of parasite proteins such as
DNA gyrase, and other potential drug targets. These studies will also help to illuminate the
138

mechanisms of gene regulation utilized by Plasmodium falciparum, one of the world’s deadliest
pathogens.
139

APPENDIX A PHYLOGENETIC ANALYSIS OF GYRA AND PARC
.
Anabaena variabilis ATCC 29413 GyA
Nostoc punctiforme PCC 73102 GyrA
Microsystis aeruginosa NIES-843 GyrA
Synechococcus sp. WH 8102 GyrA
Prochlorococcus marinus MIT 9312 ParC
Trichodesmium erythraeum ParC
Synechococccus sp. ParC
Cyanidoschyzon merolae GyrA
Arabidopsis thaliana GyrA
Guillardia theta nucleomorph GyrA
Babesia bovis T2Bo GyrA
Theileria annulata GyrA
Plasmodium falciparum 3D7 GyrA
Toxoplasma gondii GyrA
Ostreococcus tauri OTTH0595 GyrA
Chlamydomonas reinhardtii GyrA
Staphylococcus aureus aureus ParC
Staphylococcus epidermidis 12228 ParC
Listeria monocytogenes HPB2262 ParC
Bordatella pertussis Tohama I ParC
Enterococcus faecalis ParC
Streptococcus pneumoniae ParC
Bacillus anthracis Ames GyrA
Lysteria monocytogenes EGD-e GyrA
Staphylococcus aureus Mu50 GyrA
Streptococcus pneumoniae TIGR4 GyrA
Clostridium perfringens 13 GyrA
Mycobacterium tuberculosis H37Rv GyrA
Rickettsia typhi Wilmington GyrA
Coxiella burnetii RSA 493 GyrA
Vibro cholerae O1 eltor GyrA
Yersinia pestis CO92 GyrA
Salmonella enterica Typhi CT18 GyrA
Escherichia coli K12 MG165 GyrA
Shigella flexneri 2a 301 GyrA
Salmonella enterica enterica ParC
Escherichia coli K12 MG1655 ParC
Haemophilus influenzae Rd KW20 ParC
Rickettsii rickettsii Sheila Smith ParC
Helicobacter pylori Shi470 ParC
Campylobacter jejuni NCTC 11168 GyrA
99
99
99
99
75
69
99
99
69
99
52
99
99
99
99
78
98
98
71
99
99
96
79
91
73
66
99
85
93
79
86
92
0.05
Maximum parsimony tree showing the phylogenetic relatedness of DNA gyrase GyrA and Topo IV ParC. Tree was created in Mega 3.1 using a CLUSTAL-W alignment and numbers at the nodes were derived from an interior branch test (5,000 replicates).
140

Shigella flexneri 2a 301 GyrA
Escherichia coli K12 MG165 GyrA
Salmonella enterica Typhi CT18 GyrA
Yersinia pestis CO92 GyrA
Vibro cholerae O1 eltor GyrA
Coxiella burnetii RSA 493 GyrA
Rickettsia typhi Wilmington GyrA
Clostridium perfringens 13 GyrA
Streptococcus pneumoniae TIGR4 GyrA
Staphylococcus aureus Mu50 GyrA
Lysteria monocytogenes EGD-e GyrA
Bacillus anthracis Ames GyrA
Campylobacter jejuni NCTC 11168 GyrA
Helicobacter pylori Shi470 ParC
Mycobacterium tuberculosis H37Rv GyrA
Streptococcus pneumoniae ParC
Enterococcus faecalis ParC
Bordatella pertussis Tohama I ParC
Listeria monocytogenes HPB2262 ParC
Staphylococcus epidermidis 12228 ParC
Staphylococcus aureus aureus ParC
Rickettsii rickettsii Sheila Smith ParC
Haemophilus influenzae Rd KW20 ParC
Escherichia coli K12 MG1655 ParC
Salmonella enterica enterica ParC
Guillardia theta nucleomorph GyrA
Arabidopsis thaliana GyrA
Cyanidoschyzon merolae GyrA
Synechococccus sp. ParC
Trichodesmium erythraeum ParC
Prochlorococcus marinus MIT 9312 ParC
Synechococcus sp. WH 8102 GyrA
Microsystis aeruginosa NIES-843 GyrA
Nostoc punctiforme PCC 73102 GyrA
Anabaena variabilis ATCC 29413 GyA
Chlamydomonas reinhardtii GyrA
Ostreococcus tauri OTTH0595 GyrA
Plasmodium falciparum 3D7 GyrA
Toxoplasma gondii GyrA
Theileria annulata GyrA
Babesia bovis T2Bo GyrA
99
99
99
99
75
69
99
99
69
99
52
99
99
99
99
78
98
99
70
99
99
96
65
88
79
99
59
79
93
79
85
92
0.05
Minimum evolution tree showing the phylogenetic relatedness of DNA gyrase GyrA and Topo IV ParC. Tree was created in Mega 3.1 using a CLUSTAL-W alignment and numbers at the nodes were derived from an interior branch test (5,000 replicates).

APPENDIX B PHYLOGENETIC ANALYSIS OF TOPO III
Plasmodium falciparum 3D7
Plasmodium vivax SaI-1
Tetrahymena thermophila SB210
Cryptosporidium parvum Iowa II
Babesia bovis T2Bo
Theileria parva Muguga
Dictyostelium discoideum AX4
Toxoplasma gondii
Arabidopsis thaliana
Schizosaccharomyces pombe 972h
Saccharomyces cerevisiae S288C
Trypanosoma brucei TREU927
Giardia lamblia ATCC 50803
Entamoeba histolytica HM-1:IMSS
Leishmania major
Chlamydomonas reinhardtii
D
rosophila melanogaster
R
attus norvegicus
Homo sapiens
Staphylococcus aureus aureus Mu50
Campylobacter hominis ATCC BAA-381
Escherichia coli W3110
Haemophilus influenzae 86-028NP99
93
99
99
99
85
99
96
99
99
99
99
90
96
95
84
97
99
55
0.2
Minimum evolution tree of topoisomerase III created with Mega 3.1 using a CLUSTAL-W alignment. Numbers at the nodes generated by an interior branch test (5,000 replicates)

APPENDIX C CLUSTAL-W ALIGNMENT OF Plasmodium PEND-LIKE HOMOLOGUES
10 20 30 40 50 60 70 80 90 100 ....|....|....|....
|.. ..E D D E D DD EE D D E D E D
D D E D E DD D D E D DDD D D E D D
EE E D D E D E D
. . . ..| . . . .D E E E D D D E E E
D E DD E E E E D D D DD E DD E E D D D D E
D DD D E ED DDDDD D D E E
D E DD E E D E D D D
.. ..| ..| ... .|.D E D E E E ED E
E E E DE D DE E E DE D D
D D D E EDD D E DE ED
E E E DE D E
. . .. . .. ... . | | . | . . | |.. . .DS K F E K MDE E D D E EDE E D DED EE ED EE E D ED E E E E E
E E E EE E E E DE E D ED E E E
..|.. |.. ..|.. ..|.. ... ... .|...D E D D D E E D EE E D D EE D DE DEE E DE DE E D E E E E D EE D D E E EE DE E D E ED D EE E EE EE EE EE EE EEE EE EEEEE EEEEA R E A EK E A E E P Q E G QE D D E EE E E D E E E E D E
..|....|....|....|....|....| ..|....|....|....|....|....|....|....|....|....| P_falciparum 1 -----MAQ ST IILSVII F IYIIIFILLVYFATKKIHKII SNFYN KLFKRLSKHFYIA VSAYFSPFRYIFQSAVYHSYYFLTIFILIYIFRLY 95 P_berghei_PB 1 -----ML LVI FILTLIV I LYI IFILLVYLVNNKINKVTKFNFYKS SLLKKLAKNFYIV LKA FSPTKYVFKNILYHIYYSIVIFTLIYLFRLY 95 P_chabau_diP 1 ---------MI FVFTLFL I LYI IFIILVYLVNNKINKVTKYNFHKS ALLKKLAKNFYIV LKA FSPIKYVFKNILYHIYYSIVIFTLIYLFRLY 91 P_knowlesi_P 1 -----MAN VI LVFSLIL T IYL AFLLLTYVTSKKINKIIQSNFYQK TLLNRLSKHFYIV VKATFSPLKYMLKSALYHTYYFSTLLFLIYLFRLY 95 P_vivax_Pv12 1 -----MT AI FVFSLIL T IYL AFVLLTYFTTKKINKIIQSNFYQN ALLNRLSKHFYIV VKAYFSPLKYMFKTALYHTYYFSSLLFLIYWFRLY 95 P_yoelii_PY0 1 MK ML LVI FILTLIV I LYI IFILLVYLVNNKINKVTKFNFYKS SLLKKLAKNFYIV LKA FSPTKYVFKNILYHIYYSIVIFTLIYLFRLY 100 110 120 130 140 150 160 170 180 190 200 ....|....|....|....|... |. . |.. ...|....|....|.. .|....|.... ....| ...|....|....|. . |.. .|. ..| P_falciparum 96 SSYKKWMRQYFLSYFNFSNLNTP IN P NIR Y LH-----VTFIISFVL NFASFYFYKYL NIFKR SRRYI MKRTNVLKY V LAK AYN FLK 190 P_berghei_PB 96 TINTK IQNPY S YFSV T YTN NNS LHSII S -----MVHFLAFIF SIISV FYTNI KLFKRN-KKYVSIQKYNLLKYSM IAKA FK YLK 189 P_chabau_diP 92 TINTK I YPYAS YFL N YLN N LYSII S -----IVYFLAFTF SIISV FYKNI KLFNRN-KRYVSIQKYNLLKYSM IVKA FN YLK 185 P_knowlesi_P 96 ASYKLWIKVYFFSLFNIAT QSTIS NFYT -YYN KSNKFLLSYLVAFIS VTISFIYYKYL RVFK K-HKYVTVHKSSLLHY F LAKINF YVK 193 P_vivax_Pv12 96 T YKRWIKYYFFSLFNISI PSLLS S AYHH SAS F ISYVVAFIL VIISFIYYKYL RVFR K-HKYVTLHKSSLLHY F LAKVNFR YVK 194 P_yoelii_PY0 101 TINTK IQNPY S YFS N NVN N N LHSIANS -----IVYFLAFIF SIISV FYTNI KLFKRN-KKYVSIQKYNLLKYSM IAKA FR YLK 194 * * * ** * * * ** * * 210 220 230 240 250 260 270 280 290 300 ....|....|....|....|....|....|....| ..|.. .. ....|....| .|....|....|....|....|. .|... ...| P_falciparum 191 NQLQKKKKNSKNSKNKKNKKNKKIPKFKF LNANP TLIINS INTY PSQ----NNV P IKLKKKNNILFKMLNIVYINTHVLH NTLY RPLKK 286 P_berghei_PB 190 KPTF K TKFKLNL KTLKISHKINS FNKQIKNASA SKN -----------------------IMKLSISSIFYILFTKKHVLY QFLY SSTN NA 266 P_chabau_diP 186 NPSF K TKFKLNL KTLKKSHKISS FNRQIKSAST SKR -----------------------FMKLSISSIFYILFIKNHVLY HFLY SSTN SA 262 P_knowlesi_P 194 VK-PKK SKFRFIL TSIKVHSTFS SAATK SST N K N R V -------SSIPNAVTPKAKRNFLFRIFSI YFKKHVLY Q VLY HLQKKW 285 P_vivax_Pv12 195 VK-PKK SKFRF L TNIKAHSTFSN STTTK S TAS TS NARAA NARAA STTTPSAAAPKPKRNILFRIFNIVYVKKHVLY NVLY HLKNKW 293 P_yoelii_PY0 195 KPTF K TKFKLNL KTLKRSHKINS FNRQIKNASA SKN -----------------------VMKLSILSIFYILFTKKHVLY QFLY SSTN ST 271 * * ** ** * 310 320 330 340 350 360 370 380 390 400 . ..| ...|....|....| ...|....|.. |... .. |....| . .. . . .. . ..|. .. . . |. . . .. . |. . |P_falciparum 287 N KFDS K LL LLK LWNCIMALRKIQTTK VKVVDGTKEDLPNKMVDKENGTTDKENGTTDKE---NGMTD ESG TDKEN TDKESGTTDKENG 383 P_berghei_PB 267 K NQLK K KL VVF MISKVIMKKRSLKTN TN-------------------------------------TK VNA -VSTY NK----------- 317 P_chabau_diP 263 Q NKLK K KL VVF IISNVIMKKRSLKA TN-------------------------------------TK NA VSTSA NK----------- 314 P_knowlesi_P 286 QV QKNKWSFTLMLIKLM KIIQAMMNSINV NNVT K AS KT QAPT------TAPTTTTATA ------T KAPQTVSA V TQQV TNT VN 373 P_vivax_Pv12 294 QPPQKNK SFRLMLIKLM RLV ALINSIN K A K ASSKT QAAT QAAT QAAT QAAT QAPT QTATSQ PQTAAA ATPQ VKQPV 393 P_yoelii_PY0 272 KN NKSK K KLSIIF MISKVIMRK SLKTN TN-------------------------------------TK VNA VSTS NK----------- 323 * ** * * 410 420 430 440 450 460 470 480 490 500 .. .. ..|....|....|.. ..|....|.. ..|....|....| .|....| .|... .|... ...|...P_falciparum 384 TK K N TT K NITT K Y IN VK MS SINNTNNMNNI NI NLNNSYNTNSTTN HISPSININ IKINNN T AKYTPQ STISNISIN N 483 P_berghei_PB 317 -- FNQPNSHTT KI TNKN IN T KNQ HK TN----------- NSTKL T FK KIN---------------------------M NVLN--- 374 P_chabau_diP 314 -- F QP Q T TI TSKN IN A KNQ HKQPN----------- SIKT TIYK KIN---------------------------M NILN--- 371 P_knowlesi_P 374 QA APK VTKV APK ATT KQQK AT K-------QSK KQP PK--------------------------- HN-RK 438 P_vivax_Pv12 394 VA E KP GEA TE KPDG AT E KQP GE TAQEQSGQPPAQG SSEPLSQ QS QPP---------------------------A GQSGESP 466 P_yoelii_PY0 323 -- F QS HTT KI TNKN IN T KNQ HK TK----------- ISTQLST FK KIN---------------------------I NVLN--- 380
CCCCC
| .C CCCC C
C C CC
.KCC
CC C
EC
G
. .G G
G G GG G GG G G G
G G G GG G G G
G G G G G
..G G
G G GG G GG G G G G GG G G G GG G G G G G GG G G
| | . . . . . L D T GG G G GG
G G G G G G GG G G G G G G G G G GG G GG
G G G G
.|. .| G G G
GGG G G G GE GG G
510 520 530 540 550 560 570 580 590 600
. | . .. . . . . .. . . .E D D EE D D E E E D D D E
E E E D D D D D ED E EE E EE D E D D D D ED E E
E E D E E E E D E D D EE E E E D E D D E
E E E D D D D D D ED E E
. . . .. .|
... ... |....|....| ..|....|....|. ..|....|....| ...| ...| ...| . | ... ... .. .|. ..|....|....| P_falciparum 484 KYA KVT KNNILMSSLNA LKKNQNNIINTNNN NNNNNNNINNNNV NLKN VVNT NTTA S YT INL IKS HH VYV NSHYQFKSII IL P_berghei_PB 374 ----------N LII QVKK L MKNKKNIIA ---------------------- IKNAQNM VKLTINNIKL IN IK VYN YSYYYFKSPV I P_chabau_diP 371 ----------N LII KVK L A NKKNII ---------------------- IKNAQNM VKLALNNIKL IN IK VYN NSHYYFKSLV I 439 P_knowlesi_P 439 A PI V PPLQKQLN QPPQ QSQ KTNPTSMT---------------------- IKV TQKSS IPYS IKL L LRPY IFL NSHYQFKSIL VL 516 P_vivax_Pv12 467 PQAQS TPPQAQS TPPQ QPQ KVNSTSLA----------------------QMK AALNS TSYK INL L LNPY VFV NSHYQFKSIL VL 544 P_yoelii_PY0 380 ----------N LII QVKK L M NKKNIIT ---------------------- IKNAQNM VKLAI NIKL IN IK VYN YSYYYFKSPV I 610 620 630 640 650 660 670 680 690 700 ....|....|....|....|....|....|....|....|....|....|... |....|. ..| . |....|.. .| ..|....|... ....|
. |G G
GG
G G G G GG
.
| .C C 583C C C 442C C C
C C CC CC C C 448
..P_falciparum 584 MLNLPIYFFFKNKLYVKTSFTIMLYILNFIIWNIITLLSMIKPSLLVYYYIIN HISQILT NIN F KKIMLHFFY FF SSLIYLKYYFKI FKLIKI 683 E E E E EG C
P_berghei_PB 443 MLYLPMFFFFKNKLYLKLFFTLWLYIINWIVWNIITFMSMLMPSLYAYYYLFN HIISILS NISQQ KNTMLQFFF FFVSSLVYFKYYLNT FKLIKN 542 E E E EGP_chabau_diP 440 MLYLPMFFLFKNKLYLKLLFNMWLYIINWVIWNTIVILSMFSPSLYAYYYIFN HIISILS NISQQ KNTMMQFFF FFVSSLVYFKYYLNA FKLIKN 539 D E E EGP_knowlesi_P 517 MLHIPIYFMFKNKVYVKT FTIAMYLVNYLLWNFITILAMIKPSLFVYYYVLN HINNILTKNIN H KNIILHFFY FFFASLIYLKYHFNM FKLIKV 616 C E D E EGP_vivax_Pv12 545 MLHIPIYFLFKNKLYVKT FTIAMYIANYLLWNIITFLAMIKPSLFVYYYVLN HINHILT SIN Q KNIILHFFY FFFASLIYLKYHFNM FKLIKV 644 C E E D E EG
P_yoelii_PY0 449 MLYLPMFFFFKNKLYLKLFFTLWLYIINWILWNIITFMSMFKPSLYAYYYLFN HIINILS NISQQ KNTMLQFFF FFVSSLVYLKYYLNT FKLIKN 548 710 720 730 740 750 760 770 780 790 800 ...|. ..|....| ...|....|.... ....|.... .... ... |....|.. . ...|....| .. | ...|.... . .|. ..|....| P_falciparum 684 HMNNI RMINNSLK AHKLKLRKMIKNY KLKIFPLLL YQKN IYV KTLLKNNK I LIKLRKLKN QL L NINQIAKY K TAN LLKKIKNI 783 P_berghei_PB 543 SHV YFQALIATLL YKLRSQKIIKNF NLKIFPLNI YQNK IFL KSLLLTPK L KL QKQLRKNTMLLKNI KIAKY KNTANQIA QIKLV 642 P_chabau_diP 540 SHI YFQSLITSLL YKLRSQKIIKNF NLKVFPLNI YQNKAIFL KSLLRTPK L KI-------------------------------------- 601 P_knowlesi_P 617 HMNHFHRII R IA ANKLKSR IIKNF AMKVFPL I YKNK IFI R LLRTTA L LVLKQRKLKNIKI FRNVRQIAKY TAM MFRRLKFV 716 P_vivax_Pv12 645 HMNHFHRLINR IA ANKLKSR IIKNY AMKIFPL I YKSK ILI R LLRTAA I LVLKQRKLKNAKI FRNVRQIAKH TSL LFRRLKFV 744 P_yoelii_PY0 549 SHV YFQALI TLL YKLRSQKIIKNF NLKIFPLNI YQNK IFL KSLLRTPK L KL QKQVRKNTIYLILK--------NSSFVFF TFLHIY 640 810 820 830 840 850 860 870 880 890 ....|. |....|.... ...|....|....|....|....|....|. |....|.... ...|. |....|....|....|....| P_falciparum 784 LLN LP RLTNNLTQKLT IY SMKK HLSS K NNNSTSSSSFSPLKK -----LIQRFIH RKVNKN LNNNSKY-------------- 859 P_berghei_PB 643 LLK VPQKVALNISHHISH IYTKIKNN KL SHINTFLN ISLTI PKK-------------------------------------------- 693 P_chabau_diP 601 ----------------------------------------------------------------------------------------------- 601 P_knowlesi_P 717 LVN LPHRVALNLSRIIS MY RIKKNSI SSSS QLKKHPP L MLKNTVIH FIK TM T KFNA K I HT QAYV TS NK A KK-- 809 P_vivax_Pv12 745 LVN LPHRVALNLSLMIS MY KIKRNAI SSSS Q KKHPP L TLKKTAIH FIKAAM V KPSA N PA P K SANTP NK AKKNK 839 P_yoelii_PY0 641 MYA VY TLFY IINLIKH---------------------------------------------------------------------------- 659
E E E E
. . . | | . . |. . . . . .E D E D D E E EE E E D E E
E DE E D D E E EE D E E DE E D D E E D D E E D D E E DED E D E E D D E E DED E
E DE E D D E E EE
... |. ...E E DE D E ED E DEDE E DD E D D
E DE D E D E D E E E E E DE DE D D E E D E D D D E D D D DD D
G
G G
G G GG G G
G G
... |.G G
G G G GG G G
| . |C C C
C CC
C C C CC C C C
C C
C C C CC C
C
Clustal-W alignment of the PEND-like homologue in Plasmodium spp. showing putative structural features. The signal peptide (red box) and transit peptide (green box) were identified using the PATS server. A bZIP-like domain with a basic region (purple box) and leucine repeats (asterisks) comprise a potential DNA binding region. Transmembrane helices were identified with TMHMM and are highlighted in yellow. Tandem repeats were identified with XSTREAM (small black boxes).

LIST OF REFERENCES
Adachi, Y., E. Kas, and U. K. Laemmli. 1989. Preferential, cooperative binding of DNA topoisomerase II to scaffold-associated regions. Embo J 8:3997-4006.
Al-Olayan, E. M., A. L. Beetsma, G. A. Butcher, R. E. Sinden, and H. Hurd. 2002. Complete
development of mosquito phases of the malaria parasite in vitro. Science 295:677-679. Amaral, P. P., M. E. Dinger, T. R. Mercer, and J. S. Mattick. 2008. The eukaryotic genome as an
RNA machine. Science 319:1787-1789. Anderson, D. J., and M. W. Hetzer. 2008. The life cycle of the metazoan nuclear envelope. Curr
Opin Cell Biol. Arenas, A. F., A. J. Escobar, and J. E. Gomez-Marin. 2008. Evolutionary Origin of the Protozoan
Parasites Histone-like Proteins (HU). In Silico Biol 8:15-20. Balu, B., D. A. Shoue, M. J. Fraser, Jr., and J. H. Adams. 2005. High-efficiency transformation
of Plasmodium falciparum by the lepidopteran transposable element piggyBac. Proc Natl Acad Sci U S A 102:16391-16396.
Bannister, L. H., and G. H. Mitchell. 1995. The role of the cytoskeleton in Plasmodium
falciparum merozoite biology: an electron-microscopic view. Ann Trop Med Parasitol 89:105-111.
Bates, A. D., and A. Maxwell. 1989. DNA gyrase can supercoil DNA circles as small as 174
base pairs. Embo J 8:1861-1866. Been, M. D., and J. J. Champoux. 1980. Breakage of single-stranded DNA by rat liver nicking-
closing enzyme with the formation of a DNA-enzyme complex. Nucleic Acids Res 8:6129-6142.
Bernhardt, T. G., and P. A. de Boer. 2005. SlmA, a nucleoid-associated, FtsZ binding protein
required for blocking septal ring assembly over Chromosomes in E. coli. Mol Cell 18:555-564.
Bonifacino, J. S., and E. C. Dell'Angelica. 1998. Immunoprecipitation. Current protocols in cell
biology. John Wiley & Sons, Inc. Bonilla, J. A., T. D. Bonilla, C. A. Yowell, H. Fujioka, and J. B. Dame. 2007a. Critical roles for
the digestive vacuole plasmepsins of Plasmodium falciparum in vacuolar function. Mol Microbiol 65:64-75.
Bonilla, J. A., P. A. Moura, T. D. Bonilla, C. A. Yowell, D. A. Fidock, and J. B. Dame. 2007b.
Effects on growth, hemoglobin metabolism and paralogous gene expression resulting from disruption of genes encoding the digestive vacuole plasmepsins of Plasmodium falciparum. Int J Parasitol 37:317-327.

Borrmann, S., A. A. Adegnika, F. Moussavou, S. Oyakhirome, G. Esser, P. B. Matsiegui, M. Ramharter, I. Lundgren, M. Kombila, S. Issifou, D. Hutchinson, J. Wiesner, H. Jomaa, and P. G. Kremsner. 2005. Short-course regimens of artesunate-fosmidomycin in treatment of uncomplicated Plasmodium falciparum malaria. Antimicrob Agents Chemother 49:3749-3754.
Brown, T. 1999. Analysis of DNA sequences by blotting and hybridization. Current protocols in
molecular biology. John Wiley & Sons, Inc. Brown, T., K. Mackey, and T. Du. 2004. Analysis of RNA by northern and slot blot
hybridization. Current protocols in molecular biology. John Wiley & Sons, Inc. Brunetti, R., G. Prosseda, E. Beghetto, B. Colonna, and G. Micheli. 2001. The looped domain
organization of the nucleoid in histone-like protein defective Escherichia coli strains. Biochimie 83:873-882.
Byl, J. A., S. D. Cline, T. Utsugi, T. Kobunai, Y. Yamada, and N. Osheroff. 2001. DNA
topoisomerase II as the target for the anticancer drug TOP-53: mechanistic basis for drug action. Biochemistry 40:712-718.
Carter, R., and D. C. Kaushal. 1984. Characterization of antigens on mosquito midgut stages of
Plasmodium gallinaceum. III. Changes in zygote surface proteins during transformation to mature ookinete. Mol Biochem Parasitol 13:235-241.
Carter, V., A. M. Nacer, A. Underhill, R. E. Sinden, and H. Hurd. 2007. Minimum requirements
for ookinete to oocyst transformation in Plasmodium. Int J Parasitol 37:1221-1232. Cavalier-Smith, T. 1999. Principles of protein and lipid targeting in secondary symbiogenesis:
euglenoid, dinoflagellate, and sporozoan plastid origins and the eukaryote family tree. J Eukaryot Microbiol 46:347-366.
Cavalier-Smith, T. 2000. Membrane heredity and early chloroplast evolution. Trends Plant Sci
5:174-182. Champoux, J. J. 2001. DNA topoisomerases: structure, function, and mechanism. Annu Rev
Biochem 70:369-413. Chareonviriyaphap, T., M. J. Bangs, and S. Ratanatham. 2000. Status of malaria in Thailand.
Southeast Asian J Trop Med Public Health 31:225-237. Chen, G. L., L. Yang, T. C. Rowe, B. D. Halligan, K. M. Tewey, and L. F. Liu. 1984.
Nonintercalative antitumor drugs interfere with the breakage-reunion reaction of mammalian DNA topoisomerase II. J Biol Chem 259:13560-13566.
Cheng, J., P. Kapranov, J. Drenkow, S. Dike, S. Brubaker, S. Patel, J. Long, D. Stern, H.
Tammana, G. Helt, V. Sementchenko, A. Piccolboni, S. Bekiranov, D. K. Bailey, M.

Ganesh, S. Ghosh, I. Bell, D. S. Gerhard, and T. R. Gingeras. 2005. Transcriptional maps of 10 human chromosomes at 5-nucleotide resolution. Science 308:1149-1154.
Cho, H. S., S. S. Lee, K. D. Kim, I. Hwang, J. S. Lim, Y. I. Park, and H. S. Pai. 2004. DNA
gyrase is involved in chloroplast nucleoid partitioning. Plant Cell 16:2665-2682. Choi, S. R., P. Mukherjee, and M. A. Avery. 2008. The fight against drug-resistant malaria:
novel plasmodial targets and antimalarial drugs. Curr Med Chem 15:161-171. Chulay, J. D., J. D. Haynes, and C. L. Diggs. 1983. Plasmodium falciparum: assessment of in
vitro growth by [3H]hypoxanthine incorporation. Exp Parasitol 55:138-146. Coligan, J. E. 1996. Current protocols in protein science. John Wiley & Sons, Inc., Brooklyn,
NY. Core, L. J., and J. T. Lis. 2008. Transcription regulation through promoter-proximal pausing of
RNA polymerase II. Science 319:1791-1792. Creasey, A. M., L. C. Ranford-Cartwright, D. J. Moore, D. H. Williamson, R. J. Wilson, D.
Walliker, and R. Carter. 1993. Uniparental inheritance of the mitochondrial gene cytochrome b in Plasmodium falciparum. Curr Genet 23:360-364.
Cremer, T., M. Cremer, S. Dietzel, S. Muller, I. Solovei, and S. Fakan. 2006. Chromosome
territories--a functional nuclear landscape. Curr Opin Cell Biol 18:307-316. Dahl, E. L., and P. J. Rosenthal. 2007. Multiple antibiotics exert delayed effects against the
Plasmodium falciparum apicoplast. Antimicrob Agents Chemother 51:3485-3490. Dahl, E. L., and P. J. Rosenthal. 2008. Apicoplast translation, transcription and genome
replication: targets for antimalarial antibiotics. Trends Parasitol 24:279-284. Dahl, E. L., J. L. Shock, B. R. Shenai, J. Gut, J. L. DeRisi, and P. J. Rosenthal. 2006.
Tetracyclines specifically target the apicoplast of the malaria parasite Plasmodium falciparum. Antimicrob Agents Chemother 50:3124-3131.
Dar, M. A., A. Sharma, N. Mondal, and S. K. Dhar. 2007. Molecular cloning of apicoplast-
targeted Plasmodium falciparum DNA gyrase genes: unique intrinsic ATPase activity and ATP-independent dimerization of PfGyrB subunit. Eukaryot Cell 6:398-412.
Day, K. P., R. E. Hayward, and M. Dyer. 1998. The biology of Plasmodium falciparum
transmission stages. Parasitology 116 Suppl:S95-109. Deitsch, K., C. Driskill, and T. Wellems. 2001. Transformation of malaria parasites by the
spontaneous uptake and expression of DNA from human erythrocytes. Nucleic Acids Res 29:850-853.

Delwiche, C. F. 1999. Tracing the Thread of Plastid Diversity through the Tapestry of Life. Am Nat 154:S164-S177.
Delwiche, C. F., M. Kuhsel, and J. D. Palmer. 1995. Phylogenetic analysis of tufA sequences
indicates a cyanobacterial origin of all plastids. Mol Phylogenet Evol 4:110-128. DeRocher, A., B. Gilbert, J. E. Feagin, and M. Parsons. 2005. Dissection of brefeldin A-sensitive
and -insensitive steps in apicoplast protein targeting. J Cell Sci 118:565-574. Diniz, J. A., E. O. Silva, R. Lainson, and W. de Souza. 2000. The fine structure of Garnia
gonadati and its association with the host cell. Parasitol Res 86:971-977. Dorman, C. J., and P. Deighan. 2003. Regulation of gene expression by histone-like proteins in
bacteria. Curr Opin Genet Dev 13:179-184. Drlica, K., and M. Malik. 2003. Fluoroquinolones: action and resistance. Curr Top Med Chem
3:249-282. Druilhe, P., F. Miltgen, I. Landau, J. Rinjard, and M. Gentilini. 1982. [Exo-erythrocytic
schizogony of plasmodium falciparum in the monkey Cebus apella (author's transl)]. C R Seances Acad Sci III 294:511-513.
Fast, N. M., J. C. Kissinger, D. S. Roos, and P. J. Keeling. 2001. Nuclear-encoded, plastid-
targeted genes suggest a single common origin for apicomplexan and dinoflagellate plastids. Mol Biol Evol 18:418-426.
Feagin, J. E. 1994. The extrachromosomal DNAs of apicomplexan parasites. Annu Rev
Microbiol 48:81-104. Feagin, J. E., and M. E. Drew. 1995. Plasmodium falciparum: alterations in organelle transcript
abundance during the erythrocytic cycle. Exp Parasitol 80:430-440. Fernandez, V., C. J. Treutiger, G. B. Nash, and M. Wahlgren. 1998. Multiple adhesive
phenotypes linked to rosetting binding of erythrocytes in Plasmodium falciparum malaria. Infect Immun 66:2969-2975.
Fichera, M. E., and D. S. Roos. 1997. A plastid organelle as a drug target in apicomplexan
parasites. Nature 390:407-409. Fidock, D. A., T. Nomura, and T. E. Wellems. 1998. Cycloguanil and its parent compound
proguanil demonstrate distinct activities against Plasmodium falciparum malaria parasites transformed with human dihydrofolate reductase. Mol Pharmacol 54:1140-1147.
Fidock, D. A., and T. E. Wellems. 1997. Transformation with human dihydrofolate reductase
renders malaria parasites insensitive to WR99210 but does not affect the intrinsic activity of proguanil. Proc Natl Acad Sci U S A 94:10931-10936.

Foth, B. J., and G. I. McFadden. 2003. The apicoplast: a plastid in Plasmodium falciparum and other Apicomplexan parasites. Int Rev Cytol 224:57-110.
Foth, B. J., S. A. Ralph, C. J. Tonkin, N. S. Struck, M. Fraunholz, D. S. Roos, A. F. Cowman,
and G. I. McFadden. 2003. Dissecting apicoplast targeting in the malaria parasite Plasmodium falciparum. Science 299:705-708.
Freitas-Junior, L. H., R. Hernandez-Rivas, S. A. Ralph, D. Montiel-Condado, O. K. Ruvalcaba-
Salazar, A. P. Rojas-Meza, L. Mancio-Silva, R. J. Leal-Silvestre, A. M. Gontijo, S. Shorte, and A. Scherf. 2005. Telomeric heterochromatin propagation and histone acetylation control mutually exclusive expression of antigenic variation genes in malaria parasites. Cell 121:25-36.
Froelich-Ammon, S. J., K. C. Gale, and N. Osheroff. 1994. Site-specific cleavage of a DNA
hairpin by topoisomerase II. DNA secondary structure as a determinant of enzyme recognition/cleavage. J Biol Chem 269:7719-7725.
Gardner, M. J., P. A. Bates, I. T. Ling, D. J. Moore, S. McCready, M. B. Gunasekera, R. J.
Wilson, and D. H. Williamson. 1988. Mitochondrial DNA of the human malarial parasite Plasmodium falciparum. Mol Biochem Parasitol 31:11-17.
Gardner, M. J., J. E. Feagin, D. J. Moore, D. F. Spencer, M. W. Gray, D. H. Williamson, and R.
J. Wilson. 1991a. Organisation and expression of small subunit ribosomal RNA genes encoded by a 35-kilobase circular DNA in Plasmodium falciparum. Mol Biochem Parasitol 48:77-88.
Gardner, M. J., N. Hall, E. Fung, O. White, M. Berriman, R. W. Hyman, J. M. Carlton, A. Pain,
K. E. Nelson, S. Bowman, I. T. Paulsen, K. James, J. A. Eisen, K. Rutherford, S. L. Salzberg, A. Craig, S. Kyes, M. S. Chan, V. Nene, S. J. Shallom, B. Suh, J. Peterson, S. Angiuoli, M. Pertea, J. Allen, J. Selengut, D. Haft, M. W. Mather, A. B. Vaidya, D. M. Martin, A. H. Fairlamb, M. J. Fraunholz, D. S. Roos, S. A. Ralph, G. I. McFadden, L. M. Cummings, G. M. Subramanian, C. Mungall, J. C. Venter, D. J. Carucci, S. L. Hoffman, C. Newbold, R. W. Davis, C. M. Fraser, and B. Barrell. 2002. Genome sequence of the human malaria parasite Plasmodium falciparum. Nature 419:498-511.
Gardner, M. J., D. H. Williamson, and R. J. Wilson. 1991b. A circular DNA in malaria parasites
encodes an RNA polymerase like that of prokaryotes and chloroplasts. Mol Biochem Parasitol 44:115-123.
Goodman, C. D., and G. I. McFadden. 2007. Fatty acid biosynthesis as a drug target in
apicomplexan parasites. Curr Drug Targets 8:15-30. Goodman, C. D., V. Su, and G. I. McFadden. 2007. The effects of anti-bacterials on the malaria
parasite Plasmodium falciparum. Mol Biochem Parasitol 152:181-191. Gray, M. W. 1993. Origin and evolution of organelle genomes. Curr Opin Genet Dev 3:884-890.

Greenwood, B. M., D. A. Fidock, D. E. Kyle, S. H. Kappe, P. L. Alonso, F. H. Collins, and P. E. Duffy. 2008. Malaria: progress, perils, and prospects for eradication. J Clin Invest 118:1266-1276.
Gruenbaum, Y., A. Margalit, R. D. Goldman, D. K. Shumaker, and K. L. Wilson. 2005. The
nuclear lamina comes of age. Nat Rev Mol Cell Biol 6:21-31. Gubbels, M. J., S. Vaishnava, N. Boot, J. F. Dubremetz, and B. Striepen. 2006. A MORN-repeat
protein is a dynamic component of the Toxoplasma gondii cell division apparatus. J Cell Sci 119:2236-2245.
Harms, J. M., D. N. Wilson, F. Schluenzen, S. R. Connell, T. Stachelhaus, Z. Zaborowska, C. M.
Spahn, and P. Fucini. 2008. Translational regulation via L11: molecular switches on the ribosome turned on and off by thiostrepton and micrococcin. Mol Cell 30:26-38.
He, C. Y., M. K. Shaw, C. H. Pletcher, B. Striepen, L. G. Tilney, and D. S. Roos. 2001. A plastid
segregation defect in the protozoan parasite Toxoplasma gondii. Embo J 20:330-339. Hopkins, J., R. Fowler, S. Krishna, I. Wilson, G. Mitchell, and L. Bannister. 1999. The plastid in
Plasmodium falciparum asexual blood stages: a three-dimensional ultrastructural analysis. Protist 150:283-295.
Hsu, Y. H., M. W. Chung, and T. K. Li. 2006. Distribution of gyrase and topoisomerase IV on
bacterial nucleoid: implications for nucleoid organization. Nucleic Acids Res 34:3128-3138.
Itoh, R., H. Takahashi, K. Toda, H. Kuroiwa, and T. Kuroiwa. 1997. DNA gyrase involvement in
chloroplast-nucleoid division in Cyanidioschyzon merolae. Eur J Cell Biol 73:252-258. Jomaa, H., J. Wiesner, S. Sanderbrand, B. Altincicek, C. Weidemeyer, M. Hintz, I. Turbachova,
M. Eberl, J. Zeidler, H. K. Lichtenthaler, D. Soldati, and E. Beck. 1999. Inhibitors of the nonmevalonate pathway of isoprenoid biosynthesis as antimalarial drugs. Science 285:1573-1576.
Jonker, H. R., S. Ilin, S. K. Grimm, J. Wohnert, and H. Schwalbe. 2007. L11 domain
rearrangement upon binding to RNA and thiostrepton studied by NMR spectroscopy. Nucleic Acids Res 35:441-454.
Kampranis, S. C., A. D. Bates, and A. Maxwell. 1999. A model for the mechanism of strand
passage by DNA gyrase. Proc Natl Acad Sci U S A 96:8414-8419. Kappe, S. H., K. Kaiser, and K. Matuschewski. 2003. The Plasmodium sporozoite journey: a rite
of passage. Trends Parasitol 19:135-143.

Kapranov, P., J. Drenkow, J. Cheng, J. Long, G. Helt, S. Dike, and T. R. Gingeras. 2005. Examples of the complex architecture of the human transcriptome revealed by RACE and high-density tiling arrays. Genome Res 15:987-997.
Kavenoff, R., and O. A. Ryder. 1976. Electron microscopy of membrane-associated folded
chromosomes of Escherichia coli. Chromosoma 55:13-25. Khor, V., C. Yowell, J. B. Dame, and T. C. Rowe. 2005. Expression and characterization of the
ATP-binding domain of a malarial Plasmodium vivax gene homologous to the B-subunit of the bacterial topoisomerase DNA gyrase. Mol Biochem Parasitol 140:107-117.
Kobayashi, T., M. Takahara, S. Y. Miyagishima, H. Kuroiwa, N. Sasaki, N. Ohta, M. Matsuzaki,
and T. Kuroiwa. 2002. Detection and localization of a chloroplast-encoded HU-like protein that organizes chloroplast nucleoids. Plant Cell 14:1579-1589.
Kocken, C. H., A. M. van der Wel, M. A. Dubbeld, D. L. Narum, F. M. van de Rijke, G. J. van
Gemert, X. van der Linde, L. H. Bannister, C. Janse, A. P. Waters, and A. W. Thomas. 1998. Precise timing of expression of a Plasmodium falciparum-derived transgene in Plasmodium berghei is a critical determinant of subsequent subcellular localization. J Biol Chem 273:15119-15124.
Kodadek, T., D. Sikder, and K. Nalley. 2006. Keeping transcriptional activators under control.
Cell 127:261-264. Kohler, S., C. F. Delwiche, P. W. Denny, L. G. Tilney, P. Webster, R. J. Wilson, J. D. Palmer,
and D. S. Roos. 1997. A plastid of probable green algal origin in Apicomplexan parasites. Science 275:1485-1489.
Kublin, J. G., F. K. Dzinjalamala, D. D. Kamwendo, E. M. Malkin, J. F. Cortese, L. M. Martino,
R. A. Mukadam, S. J. Rogerson, A. G. Lescano, M. E. Molyneux, P. A. Winstanley, P. Chimpeni, T. E. Taylor, and C. V. Plowe. 2002. Molecular markers for failure of sulfadoxine-pyrimethamine and chlorproguanil-dapsone treatment of Plasmodium falciparum malaria. J Infect Dis 185:380-388.
Laemmli, U. K., E. Kas, L. Poljak, and Y. Adachi. 1992. Scaffold-associated regions: cis-acting
determinants of chromatin structural loops and functional domains. Curr Opin Genet Dev 2:275-285.
Lambros, C., and J. P. Vanderberg. 1979. Synchronization of Plasmodium falciparum
erythrocytic stages in culture. J Parasitol 65:418-420. Lensen, A. H. 1996. Infectivity of malarial parasites to mosquitoes: 'the interdependent roles of
parasite, vector and host'. Ann Trop Med Parasitol 90:359-365. Lew, V. L., T. Tiffert, and H. Ginsburg. 2003. Excess hemoglobin digestion and the osmotic
stability of Plasmodium falciparum-infected red blood cells. Blood 101:4189-4194.

Liu, J. W., and R. J. Rose. 1992. The spinach chloroplast chromosome is bound to the thylakoid membrane in the region of the inverted repeat. Biochem Biophys Res Commun 184:993-1000.
Liu, L. F., C. C. Liu, and B. M. Alberts. 1980. Type II DNA topoisomerases: enzymes that can
unknot a topologically knotted DNA molecule via a reversible double-strand break. Cell 19:697-707.
Liu, L. F., T. C. Rowe, L. Yang, K. M. Tewey, and G. L. Chen. 1983. Cleavage of DNA by
mammalian DNA topoisomerase II. J Biol Chem 258:15365-15370. Liu, L. F., and J. C. Wang. 1979. Interaction between DNA and Escherichia coli DNA
topoisomerase I. Formation of complexes between the protein and superhelical and nonsuperhelical duplex DNAs. J Biol Chem 254:11082-11088.
Liu, L. F., and J. C. Wang. 1987. Supercoiling of the DNA template during transcription. Proc
Natl Acad Sci U S A 84:7024-7027. Maher, B. 2008. Malaria: the end of the beginning. Nature 451:1042-1046. Mancio-Silva, L., L. Freitas-Junior, and A. Scherf. 2004. Fluorescent in situ hybridization
(FISH) DNA-DNA for Plasmodium falciparum. Methods in malaria research. MR4/ATCC.
Martin, W., and C. Schnarrenberger. 1997. The evolution of the Calvin cycle from prokaryotic to
eukaryotic chromosomes: a case study of functional redundancy in ancient pathways through endosymbiosis. Curr Genet 32:1-18.
Matsuzaki, M., T. Kikuchi, K. Kita, S. Kojima, and T. Kuroiwa. 2001. Large amounts of
apicoplast nucleoid DNA and its segregation in Toxoplasma gondii. Protoplasma 218:180-191.
Maxwell, A. 1997. DNA gyrase as a drug target. Trends Microbiol 5:102-109. Maxwell, A. 1999. DNA gyrase as a drug target. Biochem Soc Trans 27:48-53. Mazier, D., J. Goma, S. Pied, L. Renia, A. Nussler, F. Miltgen, D. Mattei, and G. Grau. 1990.
Hepatic phase of malaria: a crucial role as "go-between" with other stages. Bull World Health Organ 68 Suppl:126-131.
Mazier, D., I. Landau, F. Miltgen, P. Druilhe, C. Guguen-Guillouzo, D. Baccam, J. Baxter, J. P.
Chigot, and M. Gentilini. 1983. [In vitro infestation of human hepatocytes by sporozoites of Plasmodium vivax: schizogony and liberation of merozoites capable of infesting human erythrocytes]. Ann Parasitol Hum Comp 58:405-406.

McConkey, G. A., M. J. Rogers, and T. F. McCutchan. 1997. Inhibition of Plasmodium falciparum protein synthesis. Targeting the plastid-like organelle with thiostrepton. J Biol Chem 272:2046-2049.
McFadden, G. I. 1999. Endosymbiosis and evolution of the plant cell. Curr Opin Plant Biol
2:513-519. McFadden, G. I., M. E. Reith, J. Munholland, and N. Lang-Unnasch. 1996. Plastid in human
parasites. Nature 381:482. McFadden, G. I., and D. S. Roos. 1999. Apicomplexan plastids as drug targets. Trends Microbiol
7:328-333. McFadden, G. I., and G. G. van Dooren. 2004. Evolution: red algal genome affirms a common
origin of all plastids. Curr Biol 14:R514-516. McFadden, G. I., and R. F. Waller. 1997. Plastids in parasites of humans. Bioessays 19:1033-
1040. McLeod, R., S. P. Muench, J. B. Rafferty, D. E. Kyle, E. J. Mui, M. J. Kirisits, D. G. Mack, C.
W. Roberts, B. U. Samuel, R. E. Lyons, M. Dorris, W. K. Milhous, and D. W. Rice. 2001. Triclosan inhibits the growth of Plasmodium falciparum and Toxoplasma gondii by inhibition of apicomplexan Fab I. Int J Parasitol 31:109-113.
McRobert, L., and G. A. McConkey. 2002. RNA interference (RNAi) inhibits growth of
Plasmodium falciparum. Mol Biochem Parasitol 119:273-278. Meissner, M., E. Krejany, P. R. Gilson, T. F. de Koning-Ward, D. Soldati, and B. S. Crabb.
2005. Tetracycline analogue-regulated transgene expression in Plasmodium falciparum blood stages using Toxoplasma gondii transactivators. Proc Natl Acad Sci U S A 102:2980-2985.
Meissner, M., D. Schluter, and D. Soldati. 2002. Role of Toxoplasma gondii myosin A in
powering parasite gliding and host cell invasion. Science 298:837-840. Mendes Soares, L. M., and J. Valcarcel. 2006. The expanding transcriptome: the genome as the
'Book of Sand'. Embo J 25:923-931. Mendis, C., B. H. Noden, and J. C. Beier. 1994. Exflagellation responses of cultured
Plasmodium falciparum (Haemosporida: Plasmodiidae) gametocytes to human sera and midguts of anopheline mosquitoes (Diptera: Culicidae). J Med Entomol 31:767-769.
Morrissette, N. S., and L. D. Sibley. 2002. Cytoskeleton of apicomplexan parasites. Microbiol
Mol Biol Rev 66:21-38; table of contents.

National Center for Infectious Diseases, D. o. P. D. 2004. Malaria Biology: Malaria Parasites. in. Centers for Disease Control and Prevention.
O'Donnell, R. A., L. H. Freitas-Junior, P. R. Preiser, D. H. Williamson, M. Duraisingh, T. F.
McElwain, A. Scherf, A. F. Cowman, and B. S. Crabb. 2002. A genetic screen for improved plasmid segregation reveals a role for Rep20 in the interaction of Plasmodium falciparum chromosomes. Embo J 21:1231-1239.
O'Donnell, R. A., P. R. Preiser, D. H. Williamson, P. W. Moore, A. F. Cowman, and B. S.
Crabb. 2001. An alteration in concatameric structure is associated with efficient segregation of plasmids in transfected Plasmodium falciparum parasites. Nucleic Acids Res 29:716-724.
Omara-Opyene, A. L., P. A. Moura, C. R. Sulsona, J. A. Bonilla, C. A. Yowell, H. Fujioka, D.
A. Fidock, and J. B. Dame. 2004. Genetic disruption of the Plasmodium falciparum digestive vacuole plasmepsins demonstrates their functional redundancy. J Biol Chem 279:54088-54096.
Orth, P., D. Schnappinger, W. Hillen, W. Saenger, and W. Hinrichs. 2000. Structural basis of
gene regulation by the tetracycline inducible Tet repressor-operator system. Nat Struct Biol 7:215-219.
Pearson, C. E., H. Zorbas, G. B. Price, and M. Zannis-Hadjopoulos. 1996. Inverted repeats,
stem-loops, and cruciforms: significance for initiation of DNA replication. J Cell Biochem 63:1-22.
Pickard, A. L., C. Wongsrichanalai, A. Purfield, D. Kamwendo, K. Emery, C. Zalewski, F.
Kawamoto, R. S. Miller, and S. R. Meshnick. 2003. Resistance to antimalarials in Southeast Asia and genetic polymorphisms in pfmdr1. Antimicrob Agents Chemother 47:2418-2423.
Pinder, J., R. Fowler, L. Bannister, A. Dluzewski, and G. H. Mitchell. 2000. Motile systems in
malaria merozoites: how is the red blood cell invaded? Parasitol Today 16:240-245. Ponnudurai, T., A. H. Lensen, G. J. van Gemert, M. P. Bensink, M. Bolmer, and J. H.
Meuwissen. 1989. Sporozoite load of mosquitoes infected with Plasmodium falciparum. Trans R Soc Trop Med Hyg 83:67-70.
Ponnudurai, T., J. P. Verhave, and J. H. Meuwissen. 1982. Mosquito transmission of cultured
Plasmodium falciparum. Trans R Soc Trop Med Hyg 76:278-279. Preiser, P., D. H. Williamson, and R. J. Wilson. 1995. tRNA genes transcribed from the plastid-
like DNA of Plasmodium falciparum. Nucleic Acids Res 23:4329-4336.

Raghu Ram, E. V., A. Kumar, S. Biswas, S. Chaubey, M. I. Siddiqi, and S. Habib. 2007. Nuclear gyrB encodes a functional subunit of the Plasmodium falciparum gyrase that is involved in apicoplast DNA replication. Mol Biochem Parasitol 154:30-39.
Ralph, S. A., M. C. D'Ombrain, and G. I. McFadden. 2001. The apicoplast as an antimalarial
drug target. Drug Resist Updat 4:145-151. Ralph, S. A., G. G. van Dooren, R. F. Waller, M. J. Crawford, M. J. Fraunholz, B. J. Foth, C. J.
Tonkin, D. S. Roos, and G. I. McFadden. 2004. Tropical infectious diseases: metabolic maps and functions of the Plasmodium falciparum apicoplast. Nat Rev Microbiol 2:203-216.
Ramya, T. N., S. Mishra, K. Karmodiya, N. Surolia, and A. Surolia. 2007. Inhibitors of
nonhousekeeping functions of the apicoplast defy delayed death in Plasmodium falciparum. Antimicrob Agents Chemother 51:307-316.
Razin, S. V. 1999. Chromosomal DNA loops may constitute basic units of the eukaryotic
genome organization and evolution. Crit Rev Eukaryot Gene Expr 9:279-283. Reid, G., M. R. Hubner, R. Metivier, H. Brand, S. Denger, D. Manu, J. Beaudouin, J. Ellenberg,
and F. Gannon. 2003. Cyclic, proteasome-mediated turnover of unliganded and liganded ERalpha on responsive promoters is an integral feature of estrogen signaling. Mol Cell 11:695-707.
Relogio, A., C. Ben-Dov, M. Baum, M. Ruggiu, C. Gemund, V. Benes, R. B. Darnell, and J.
Valcarcel. 2005. Alternative splicing microarrays reveal functional expression of neuron-specific regulators in Hodgkin lymphoma cells. J Biol Chem 280:4779-4784.
Roca, J., and J. C. Wang. 1994. DNA transport by a type II DNA topoisomerase: evidence in
favor of a two-gate mechanism. Cell 77:609-616. Roche. 2000. DIG application manual for filter hybridization. Roche Diagnostics, Germany. Rogers, M. J., E. Cundliffe, and T. F. McCutchan. 1998. The antibiotic micrococcin is a potent
inhibitor of growth and protein synthesis in the malaria parasite. Antimicrob Agents Chemother 42:715-716.
Roos, D. S., M. J. Crawford, R. G. Donald, M. Fraunholz, O. S. Harb, C. Y. He, J. C. Kissinger,
M. K. Shaw, and B. Striepen. 2002. Mining the Plasmodium genome database to define organellar function: what does the apicoplast do? Philos Trans R Soc Lond B Biol Sci 357:35-46.
Rosario, V. 1981. Cloning of naturally occurring mixed infections of malaria parasites. Science
212:1037-1038.

Ross, W., T. Rowe, B. Glisson, J. Yalowich, and L. Liu. 1984. Role of topoisomerase II in mediating epipodophyllotoxin-induced DNA cleavage. Cancer Res 44:5857-5860.
Rothfield, L., A. Taghbalout, and Y. L. Shih. 2005. Spatial control of bacterial division-site
placement. Nat Rev Microbiol 3:959-968. Rowe, T. C., G. L. Chen, Y. H. Hsiang, and L. F. Liu. 1986. DNA damage by antitumor
acridines mediated by mammalian DNA topoisomerase II. Cancer Res 46:2021-2026. Rowe, T. C., D. Grabowski, and R. Ganapathi. 2001. Isolation of covalent enzyme-DNA
complexes. Methods Mol Biol 95:129-135. Rowe, T. C., K. M. Tewey, and L. F. Liu. 1984. Identification of the breakage-reunion subunit of
T4 DNA topoisomerase. J Biol Chem 259:9177-9181. Sato, N., and N. Ohta. 2001. DNA-binding specificity and dimerization of the DNA-binding
domain of the PEND protein in the chloroplast envelope membrane. Nucleic Acids Res 29:2244-2250.
Sato, N., N. Rolland, M. A. Block, and J. Joyard. 1999. Do plastid envelope membranes play a
role in the expression of the plastid genome? Biochimie 81:619-629. Sato, S., and R. J. Wilson. 2002. The genome of Plasmodium falciparum encodes an active delta-
aminolevulinic acid dehydratase. Curr Genet 40:391-398. Seow, F., S. Sato, C. S. Janssen, M. O. Riehle, A. Mukhopadhyay, R. S. Phillips, R. J. Wilson,
and M. P. Barrett. 2005. The plastidic DNA replication enzyme complex of Plasmodium falciparum. Mol Biochem Parasitol 141:145-153.
Singh, D., S. Chaubey, and S. Habib. 2003. Replication of the Plasmodium falciparum apicoplast
DNA initiates within the inverted repeat region. Mol Biochem Parasitol 126:9-14. Singh, D., A. Kumar, E. V. Raghu Ram, and S. Habib. 2005. Multiple replication origins within
the inverted repeat region of the Plasmodium falciparum apicoplast genome are differentially activated. Mol Biochem Parasitol 139:99-106.
Slater, A. F., and A. Cerami. 1992. Inhibition by chloroquine of a novel haem polymerase
enzyme activity in malaria trophozoites. Nature 355:167-169. Smalley, M. E., J. Brown, and N. M. Bassett. 1981. The rate of production of Plasmodium
falciparum gametocytes during natural infections. Trans R Soc Trop Med Hyg 75:318-319.
Snow, R. W., J. F. Trape, and K. Marsh. 2001. The past, present and future of childhood malaria
mortality in Africa. Trends Parasitol 17:593-597.
Striepen, B., M. J. Crawford, M. K. Shaw, L. G. Tilney, F. Seeber, and D. S. Roos. 2000. The plastid of Toxoplasma gondii is divided by association with the centrosomes. J Cell Biol 151:1423-1434.
Striepen, B., C. N. Jordan, S. Reiff, and G. G. van Dooren. 2007. Building the perfect parasite:
cell division in apicomplexa. PLoS Pathog 3:e78. Sumawinata, I. W., Bernadeta, B. Leksana, A. Sutamihardja, Purnomo, B. Subianto, Sekartuti,
D. J. Fryauff, and J. K. Baird. 2003. Very high risk of therapeutic failure with chloroquine for uncomplicated Plasmodium falciparum and P. vivax malaria in Indonesian Papua. Am J Trop Med Hyg 68:416-420.
Suplick, K., R. Akella, A. Saul, and A. B. Vaidya. 1988. Molecular cloning and partial sequence
of a 5.8 kilobase pair repetitive DNA from Plasmodium falciparum. Mol Biochem Parasitol 30:289-290.
Surolia, N., and G. Padmanaban. 1992. de novo biosynthesis of heme offers a new
chemotherapeutic target in the human malarial parasite. Biochem Biophys Res Commun 187:744-750.
Surolia, N., and A. Surolia. 2001. Triclosan offers protection against blood stages of malaria by
inhibiting enoyl-ACP reductase of Plasmodium falciparum. Nat Med 7:167-173. Szutorisz, H., A. Georgiou, L. Tora, and N. Dillon. 2006. The proteasome restricts permissive
transcription at tissue-specific gene loci in embryonic stem cells. Cell 127:1375-1388. Thanbichler, M., S. C. Wang, and L. Shapiro. 2005. The bacterial nucleoid: a highly organized
and dynamic structure. J Cell Biochem 96:506-521. Tonkin, C. J., M. Kalanon, and G. I. McFadden. 2008. Protein targeting to the malaria parasite
plastid. Traffic 9:166-175. Tonkin, C. J., N. S. Struck, K. A. Mullin, L. M. Stimmler, and G. I. McFadden. 2006. Evidence
for Golgi-independent transport from the early secretory pathway to the plastid in malaria parasites. Mol Microbiol 61:614-630.
Trager, W., and J. B. Jensen. 1976. Human malaria parasites in continuous culture. Science
193:673-675. Triglia, T., J. Healer, S. R. Caruana, A. N. Hodder, R. F. Anders, B. S. Crabb, and A. F.
Cowman. 2000. Apical membrane antigen 1 plays a central role in erythrocyte invasion by Plasmodium species. Mol Microbiol 38:706-718.
Tseng, L. F., W. C. Chang, M. C. Ferreira, C. H. Wu, H. S. Rampao, and J. C. Lien. 2008. Rapid
control of malaria by means of indoor residual spraying of alphacypermethrin in the Democratic Republic of Sao Tome and Principe. Am J Trop Med Hyg 78:248-250.

Tuteja, R. 2007. Malaria - an overview. Febs J 274:4670-4679. Ule, J., A. Ule, J. Spencer, A. Williams, J. S. Hu, M. Cline, H. Wang, T. Clark, C. Fraser, M.
Ruggiu, B. R. Zeeberg, D. Kane, J. N. Weinstein, J. Blume, and R. B. Darnell. 2005. Nova regulates brain-specific splicing to shape the synapse. Nat Genet 37:844-852.
Vaidya, A. B., J. Morrisey, C. V. Plowe, D. C. Kaslow, and T. E. Wellems. 1993. Unidirectional
dominance of cytoplasmic inheritance in two genetic crosses of Plasmodium falciparum. Mol Cell Biol 13:7349-7357.
Vaishnava, S., D. P. Morrison, R. Y. Gaji, J. M. Murray, R. Entzeroth, D. K. Howe, and B.
Striepen. 2005. Plastid segregation and cell division in the apicomplexan parasite Sarcocystis neurona. J Cell Sci 118:3397-3407.
Vaishnava, S., and B. Striepen. 2006. The cell biology of secondary endosymbiosis--how
parasites build, divide and segregate the apicoplast. Mol Microbiol 61:1380-1387. van Dooren, G. G., M. Marti, C. J. Tonkin, L. M. Stimmler, A. F. Cowman, and G. I. McFadden.
2005. Development of the endoplasmic reticulum, mitochondrion and apicoplast during the asexual life cycle of Plasmodium falciparum. Mol Microbiol 57:405-419.
van Dooren, G. G., V. Su, M. C. D'Ombrain, and G. I. McFadden. 2002. Processing of an
apicoplast leader sequence in Plasmodium falciparum and the identification of a putative leader cleavage enzyme. J Biol Chem 277:23612-23619.
van Es, H. H., E. Skamene, and E. Schurr. 1993. Chemotherapy of malaria: a battle against all
odds? Clin Invest Med 16:285-293. van Noort, J., S. Verbrugge, N. Goosen, C. Dekker, and R. T. Dame. 2004. Dual architectural
roles of HU: formation of flexible hinges and rigid filaments. Proc Natl Acad Sci U S A 101:6969-6974.
Vaughan, J. A., B. H. Noden, and J. C. Beier. 1994. Sporogonic development of cultured
Plasmodium falciparum in six species of laboratory-reared Anopheles mosquitoes. Am J Trop Med Hyg 51:233-243.
Vekemans, J., and W. R. Ballou. 2008. Plasmodium falciparum malaria vaccines in
development. Expert Rev Vaccines 7:223-240. Vinetz, J. M. 2005. Plasmodium ookinete invasion of the mosquito midgut. Curr Top Microbiol
Immunol 295:357-382. Wall, M. K., L. A. Mitchenall, and A. Maxwell. 2004. Arabidopsis thaliana DNA gyrase is
targeted to chloroplasts and mitochondria. Proc Natl Acad Sci U S A 101:7821-7826.
Waller, R. F., P. J. Keeling, R. G. Donald, B. Striepen, E. Handman, N. Lang-Unnasch, A. F. Cowman, G. S. Besra, D. S. Roos, and G. I. McFadden. 1998. Nuclear-encoded proteins target to the plastid in Toxoplasma gondii and Plasmodium falciparum. Proc Natl Acad Sci U S A 95:12352-12357.
Waller, R. F., S. A. Ralph, M. B. Reed, V. Su, J. D. Douglas, D. E. Minnikin, A. F. Cowman, G.
S. Besra, and G. I. McFadden. 2003. A type II pathway for fatty acid biosynthesis presents drug targets in Plasmodium falciparum. Antimicrob Agents Chemother 47:297-301.
Waller, R. F., M. B. Reed, A. F. Cowman, and G. I. McFadden. 2000. Protein trafficking to the
plastid of Plasmodium falciparum is via the secretory pathway. Embo J 19:1794-1802. Wang, J. C. 1996. DNA topoisomerases. Annu Rev Biochem 65:635-692. Wang, J. C. 2002. Cellular roles of DNA topoisomerases: a molecular perspective. Nat Rev Mol
Cell Biol 3:430-440. Wang, S. C., and L. Shapiro. 2004. The topoisomerase IV ParC subunit colocalizes with the
Caulobacter replisome and is required for polar localization of replication origins. Proc Natl Acad Sci U S A 101:9251-9256.
Weissig, V., T. S. Vetro-Widenhouse, and T. C. Rowe. 1997. Topoisomerase II inhibitors induce
cleavage of nuclear and 35-kb plastid DNAs in the malarial parasite Plasmodium falciparum. DNA Cell Biol 16:1483-1492.
White, N. J. 2008. Plasmodium knowlesi: the fifth human malaria parasite. Clin Infect Dis
46:172-173. White, N. J., F. Nosten, S. Looareesuwan, W. M. Watkins, K. Marsh, R. W. Snow, G. Kokwaro,
J. Ouma, T. T. Hien, M. E. Molyneux, T. E. Taylor, C. I. Newbold, T. K. Ruebush, 2nd, M. Danis, B. M. Greenwood, R. M. Anderson, and P. Olliaro. 1999. Averting a malaria disaster. Lancet 353:1965-1967.
Wickham, M. E., J. K. Thompson, and A. F. Cowman. 2003. Characterisation of the merozoite
surface protein-2 promoter using stable and transient transfection in Plasmodium falciparum. Mol Biochem Parasitol 129:147-156.
Wiesner, J., D. Henschker, D. B. Hutchinson, E. Beck, and H. Jomaa. 2002. In vitro and in vivo
synergy of fosmidomycin, a novel antimalarial drug, with clindamycin. Antimicrob Agents Chemother 46:2889-2894.
Wiesner, J., and H. Jomaa. 2007. Isoprenoid biosynthesis of the apicoplast as drug target. Curr
Drug Targets 8:3-13.

Wiesner, J., R. Ortmann, H. Jomaa, and M. Schlitzer. 2003. New antimalarial drugs. Angew Chem Int Ed Engl 42:5274-5293.
Wiesner, J., and F. Seeber. 2005. The plastid-derived organelle of protozoan human parasites as
a target of established and emerging drugs. Expert Opin Ther Targets 9:23-44. Williamson, D. H., P. W. Denny, P. W. Moore, S. Sato, S. McCready, and R. J. Wilson. 2001.
The in vivo conformation of the plastid DNA of Toxoplasma gondii: implications for replication. J Mol Biol 306:159-168.
Williamson, D. H., P. R. Preiser, P. W. Moore, S. McCready, M. Strath, and R. J. Wilson. 2002.
The plastid DNA of the malaria parasite Plasmodium falciparum is replicated by two mechanisms. Mol Microbiol 45:533-542.
Wilson, R. J., P. W. Denny, P. R. Preiser, K. Rangachari, K. Roberts, A. Roy, A. Whyte, M.
Strath, D. J. Moore, P. W. Moore, and D. H. Williamson. 1996. Complete gene map of the plastid-like DNA of the malaria parasite Plasmodium falciparum. J Mol Biol 261:155-172.
Wilson, R. J., and D. H. Williamson. 1997. Extrachromosomal DNA in the Apicomplexa.
Microbiol Mol Biol Rev 61:1-16. Wilstermann, A. M., and N. Osheroff. 2001. Base excision repair intermediates as topoisomerase
II poisons. J Biol Chem 276:46290-46296. Wilstermann, A. M., and N. Osheroff. 2003. Stabilization of eukaryotic topoisomerase II-DNA
cleavage complexes. Curr Top Med Chem 3:321-338. Woldringh, C. L., E. Mulder, P. G. Huls, and N. Vischer. 1991. Toporegulation of bacterial
division according to the nucleoid occlusion model. Res Microbiol 142:309-320. Wu, H. Y., S. H. Shyy, J. C. Wang, and L. F. Liu. 1988. Transcription generates positively and
negatively supercoiled domains in the template. Cell 53:433-440. Wu, Y., C. D. Sifri, H. H. Lei, X. Z. Su, and T. E. Wellems. 1995. Transfection of Plasmodium
falciparum within human red blood cells. Proc Natl Acad Sci U S A 92:973-977. Yan, Y., H. Chen, and M. Costa. 2004. Chromatin immunoprecipitation assays. Methods Mol
Biol 287:9-19.

BIOGRAPHICAL SKETCH
Tonya Bonilla earned a Bachelor of Science in biology from the University of Minnesota.
She moved to south Florida and earned a Master of Science degree in marine biology from Nova
Southeastern University. Tonya next attended the University of Florida where she earned a
Doctor of Philosophy in infectious diseases and pathology.