Embed Size (px)
Citation preview
UNCORRECTED PROOF
ARTICLE
Cellular and gene signatures of tumor-infiltratingdendritic cells and natural-killer cells predictprognosis of neuroblastomaOmbretta Melaiu1, Marco Chierici 2, Valeria Lucarini1, Giuseppe Jurman 2, Libenzio Adrian Conti 3,
Rita De Vito4, Renata Boldrini4, Loredana Cifaldi5, Aurora Castellano1, Cesare Furlanello 2,6,
Vincenzo Barnaba 7,8, Franco Locatelli1,9 & Doriana Fruci 1✉
Tumor-infiltrating lymphocytes play an essential role in improving clinical outcome of neu-
roblastoma (NB) patients, but their relationship with other tumor-infiltrating immune cells in
the T cell-inflamed tumors remains poorly investigated. Here we show that dendritic cells
(DCs) and natural-killer (NK) cells are positively correlated with T-cell infiltration in human
NB, both at transcriptional and protein levels, and associate with a favorable prognosis.
Multiplex imaging displays DC/NK/T cell conjugates in the tumor microenvironment of low-
risk NB. Remarkably, this connection is further strengthened by the identification of gene
signatures related to DCs and NK cells able to predict survival of NB patients and strongly
correlate with the expression of PD-1 and PD-L1. In summary, our findings unveil a key
prognostic role of DCs and NK cells and indicate their related gene signatures as promising
tools for the identification of clinical biomarkers to better define risk stratification and survival
of NB patients.
https://doi.org/10.1038/s41467-020-19781-y OPEN
1 Department of Paediatric Haematology/Oncology and of Cell and Gene Therapy, Ospedale Pediatrico Bambino Gesù, IRCCS, 00146 Rome, Italy.2 Fondazione Bruno Kessler, 38122 Trento, Italy. 3 Confocal microscopy, Core Facility, Research Laboratories, Ospedale Pediatrico Bambino Gesù, IRCCS,00146 Rome, Italy. 4 Department of Pathology, Bambino Gesù Children’s Hospital, 00165 Rome, Italy. 5 Academic Department of Pediatrics (DPUO),Ospedale Pediatrico Bambino Gesù, IRCCS, 00146 Rome, Italy. 6 HK3 Lab, 20129 Milan, Italy. 7 Cellular and Molecular Immunology Unit, Dipartimento diScienze Cliniche, Internistiche, Anestesiologiche e Cardiovascolari, Sapienza University of Rome, 00161 Rome, Italy. 8 Istituto Pasteur Italia-Fondazione CenciBolognetti, 00161 Rome, Italy. 9 Department of Pediatrics, Sapienza University of Rome, 00161 Rome, Italy. ✉email: [email protected]
NATURE COMMUNICATIONS | _#####################_ | https://doi.org/10.1038/s41467-020-19781-y | www.nature.com/naturecommunications 1
1234
5678
90():,;

UNCORRECTED PROOF
The tumor microenvironment (TME) is a complex networkof malignant and non-malignant cells, including stromalcells and immune cells, playing a relevant role in cancer
development. Histological analyses on a large collection of humantumors allowed the identification of immune T-cell subsets witheither favorable or deleterious effects on clinical outcome1–3. Thehigh density of tumor-infiltrating CD8+ T cells has been asso-ciated with improved clinical outcomes in many types of solidcancers4,5.Q1Q1 �Q2�Q2�Q3�Q3�Q4�Q4
A robust infiltration of cytotoxic T cells has been associatedwith the abundance of conventional type 1 dendritic cells(cDC1s), a subset of DC able to stimulate naive tumor antigen-specific CD8+ T cells inside the tumor6. This immune cell sub-type expresses typical markers of DCs and specific transcriptionalsignatures enriched of genes involved in the tumor antigen pro-cessing and cross-presentation, co-stimulation, and expression ofchemokines promoting recruitment of tumor-reactive CD8+
T cells7. Within tumors, cDC1s stimulate and expand tumor-specific effector T cells, supporting their reactivation by secretinginterleukin-12 (IL-12)8,9. Consistently, a high number of cDC1shas been detected in spontaneous regressing tumor models,suggesting that they may be critical for robust tumor control.
The importance of cDC1s in T-cell-mediated antitumorimmunity has been established in different experimental mousetumor models. Indeed, the absence of cDC1s in mice lacking thetranscription factor Batf310 abolished the ability to reject trans-plantable immunogenic tumors and to support adoptive T-celltherapy and immune-checkpoint blockade8,11–14. Despite theinvolvement of cDC1s in antitumor immunity6,8,12,14, theirprognostic role has been poorly investigated in humans8,15–18.
We have previously reported that tumor-infiltrating T cells(TILs) have a prognostic value in neuroblastoma (NB)19, the mostcommon extracranial solid tumor of childhood, which accountsfor 15% of pediatric cancer deaths20. NBs associated with goodprognosis were characterized by a higher number of proliferatingT cells and a more structured T-cell organization, which wasgradually lost in highly aggressive tumors19. However, the rela-tionship of these cells with other tumor-infiltrating immune cellpopulations in the T-cell-inflamed NB remains poorlyinvestigated.
Given the importance of cDC1s in cancer immunity, we soughtto evaluate whether these or other immune cell populations havea prognostic role in NB patients. Here, we show that T-cellinfiltrated NBs are enriched with both DCs and NK cells, and thattheir abundance is positively correlated with favorable clinicaloutcome of NB patients. In addition, by exploring our Nanostringand public RNA SEQC expression profiles, we identified twospecific gene signatures related to DCs and NK cells able tostrongly predict the survival of NB patients. These latter resultswere also supported by data obtained across multiple adultcancer types.
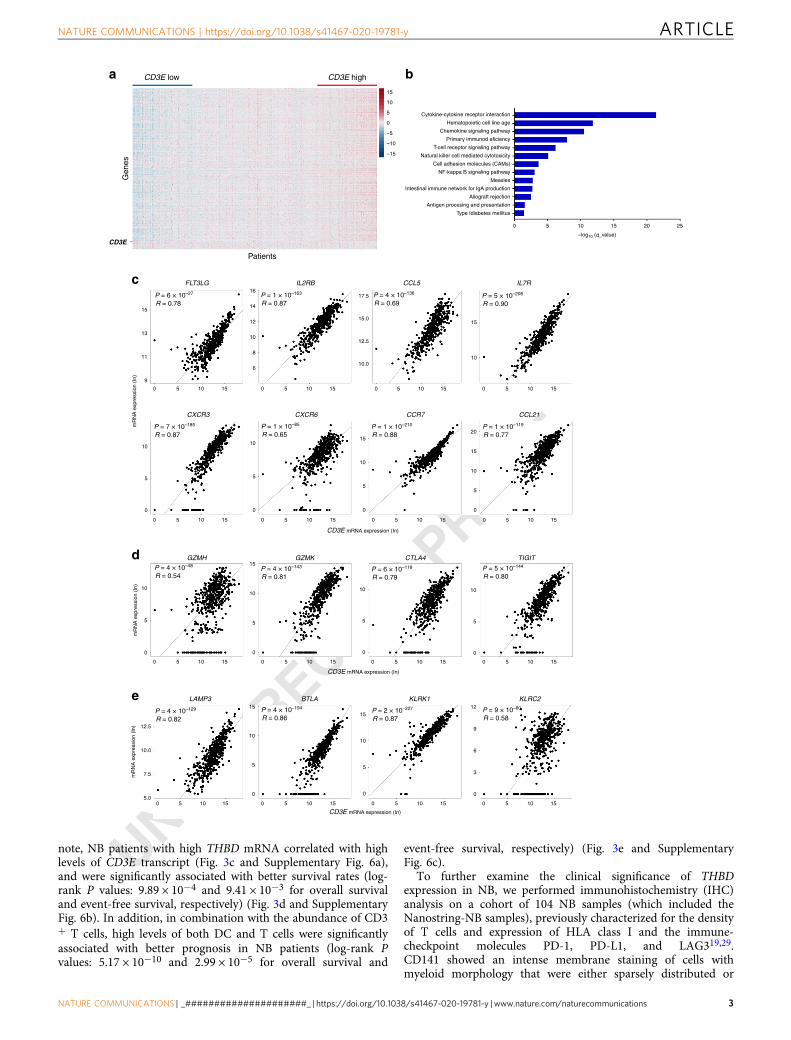
ResultsCD3E expression correlates with enrichment of immune-stimulatory molecules in human neuroblastoma. To identifypotential targets that stimulate T-cell-mediated antitumorimmune responses in NB, we assessed the transcriptomes of 498human primary NB patients from the US-FDA SEQC Project(SEQC-NB) available in the Gene Expression Omnibus (GEO)repository21. We found that most of the 757 analyzed immunegenes were differently expressed (Supplementary Data 1) bothwith varying CD3E expression and based on hierarchical clus-tering of NB patients (Fig. 1a and Supplementary Fig. 1a).Reactome pathway analysis uncovered a vast number of func-tional categories significantly associated with both innate and
adaptive immune responses, including interleukin signaling, Toll-like receptor cascade, and immunoregulatory interactionsbetween lymphoid and non-lymphoid cells (SupplementaryFig. 1b and c, Supplementary Data 2). Similarly, Gene Ontologyenrichment analysis performed on transcripts upregulated intumor samples with high CD3E expression revealed an over-representation in genes controlling TCR signaling, T-cell activa-tion, co-stimulation, and cell adhesion molecules signaling(Fig. 1b). Among those genes, CD3E mRNA was strongly asso-ciated with gene transcripts that control the trafficking of intra-tumoral DCs and effector T and NK cells, including FLT3LG,IL2RB, CCL5, IL7R, CXCR3, CXCR6, CCR7, andCCL216,15,16,22–25 (Fig. 1c). Consistently, further analysesrevealed a positive correlation between CD3E mRNA and indi-vidual transcripts related to T-cell activity, including GZMH,GZMK, CTLA4, and TIGIT6 (Fig. 1d), and those controlling thefunction of intratumoral DCs (LAMP3 and BTLA)8,26 and NKcells (KLRK1 and KLRC2)27 (Fig. 1e). These gene associationswere validated in our independent cohort of 36 primary NBsamples (Nanostring-NB) by Nanostring gene expression analysis(Supplementary Fig. 2, Supplementary Data 1 and 2).
Altogether, these data indicate that the relative levels of CD3Eexpression, as an estimate of the abundance of T cells, correlatewith enrichment of immunostimulatory cytokines and chemo-kines involved in the recruitment of DCs and NK cells inthe TME.
CD3E expression correlates with the levels of intratumoral DCand NK gene signatures in human neuroblastoma. Using pre-viously validated specific immune gene signatures28 as an esti-mate of the immune cell abundance, we found that NB sampleswith high levels of CD3E (median split) of both Nanostring-NBand SEQC-NB cohorts were significantly enriched of differentlymphoid and myeloid cell populations (Fig. 2 and Supplemen-tary Fig. 3, Supplementary Data 3). As expected, immune genesignatures of T-cell subsets including (cytotoxic) CD8+ T cells,(helper) CD4+ T cells, gamma delta T cells, and memory T cellswere significantly more abundant in CD3Ehigh than in CD3Elow
NB samples. In addition, the gene signatures of DCs andCD56dim NK cells were also significantly associated with CD3Eexpression. By contrast, gene signatures of macrophages andneutrophils were weakly abundant in CD3Ehigh NB samples,whereas those associated with Tregs, eosinophils, or mast cellsdisplayed discordant results in the two cohorts analyzed (Fig. 2and Supplementary Fig. 3). Notably, with the exception of mac-rophages, the gene expression of all immune cell populationsenriched in CD3Ehigh NB samples was abundant in samplesexpressing CD8A (Supplementary Fig. 4). Differently, NB sampleswith high CD4 expression were enriched in gamma delta T-cell-,DC-, macrophage-, neutrophil-, and mast cell-related geneexpression (Supplementary Fig. 5).
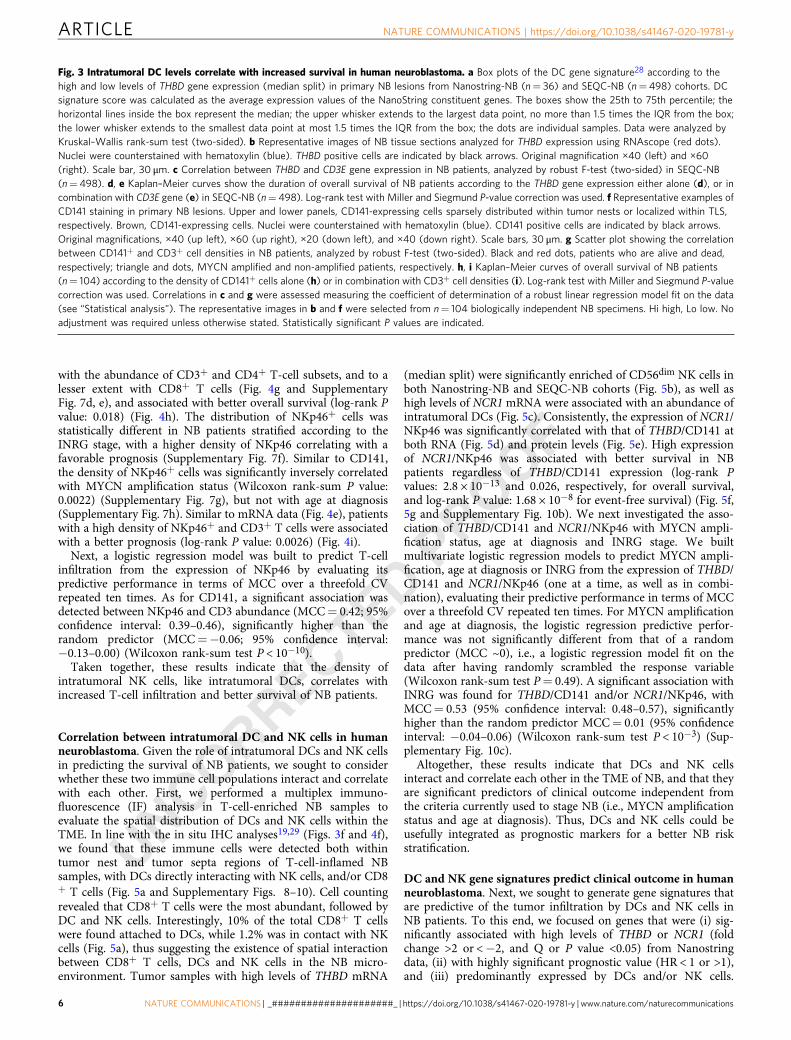
Intratumoral DCs correlate with increased T-cell infiltrationand survival in human neuroblastoma. Given the strong asso-ciation between CD3E and the DC gene signature (Fig. 2), wesought to determine the prognostic role of tumor-infiltrating DCsin NB patients. Intratumoral DCs have been previously char-acterized for the expression of the integrin CD103 in mice andThrombomodulin (THBD, encoding CD141) in humans7,11. Asignificant correlation was detected between the expression ofTHBD and the DC gene signature in both Nanostring-NB andSEQC-NB cohorts (Fig. 3a). RNAscope analysis, performed tovisualize the cell types expressing THBD, showed that THBDtranscript was highly expressed in tumor-infiltrating immunecells resembling myeloid morphology in NB tissues (Fig. 3b). Of
ARTICLE NATURE COMMUNICATIONS | https://doi.org/10.1038/s41467-020-19781-y
2 NATURE COMMUNICATIONS | _#####################_ | https://doi.org/10.1038/s41467-020-19781-y | www.nature.com/naturecommunications
UNCORRECTED PROOF
note, NB patients with high THBD mRNA correlated with highlevels of CD3E transcript (Fig. 3c and Supplementary Fig. 6a),and were significantly associated with better survival rates (log-rank P values: 9.89 × 10⁻⁴ and 9.41 × 10⁻³ for overall survivaland event-free survival, respectively) (Fig. 3d and SupplementaryFig. 6b). In addition, in combination with the abundance of CD3+ T cells, high levels of both DC and T cells were significantlyassociated with better prognosis in NB patients (log-rank Pvalues: 5.17 × 10⁻¹⁰ and 2.99 × 10⁻⁵ for overall survival and
event-free survival, respectively) (Fig. 3e and SupplementaryFig. 6c).
To further examine the clinical significance of THBDexpression in NB, we performed immunohistochemistry (IHC)analysis on a cohort of 104 NB samples (which included theNanostring-NB samples), previously characterized for the densityof T cells and expression of HLA class I and the immune-checkpoint molecules PD-1, PD-L1, and LAG319,29.CD141 showed an intense membrane staining of cells withmyeloid morphology that were either sparsely distributed or
CD3E low
FLT3LG
CXCR3 CXCR6
IL2RB CCL5 IL7R
Gen
es
CD3E high
Patients
15
P = 6 × 10–27
R = 0.78
13
11
mR
NA
exp
ress
ion
(In)
CD3E mRNA expression (In)
9
14
16
10
12
8
6
0 5 10 15 0 5 10 15 0 5 10 15 0 5 10 15
0 5 10 15 0 5 10 15 0 5 10 15 0 5 10 15
0 5 10 15 0 5 10 15 0 5 10 15 0 5 10 15
15
Cytokine-cytokine receptor interaction
Type Idiabetes mellitus
0 5 10 15
–log10 (q_value)
20 25
Antigen procesing and presentation
Allograft rejection
Intestinal immune network for IgA production
Measles
NF-kappa B signaling pathway
Cell adhesion molecules (CAMs)
Natural killer cell mediated cytotoxicity
T-cell receptor signaling pathway
Primary immunod eficiency
Hematopoietic cell line age
Chemokine signaling pathway
10
5
0
–5
–10
–15
CD3E
0 5 10 15 0 5 10 15 0 5 10 15 0 5 10 15
17.5
15.0
12.5
15
1010.0
10
5
0
10
5
0
10
15
5
0
10
15
20
5
0
10
15
5
0
10
5
0
10
5
0
6
9
12
3
0
10
15
5
0
10
15
5
0
10.0
12.5
7.5
5.0
mR
NA
exp
ress
ion
(In) 10
5
0
mR
NA
exp
ress
ion
(In)
P = 1 × 10–163
R = 0.87P = 4 × 10–136
R = 0.69P = 5 × 10–208
R = 0.90
P = 1 × 10–119
R = 0.77P = 1 × 10–210
R = 0.88P = 1 × 10–85
R = 0.65P = 7 × 10–185
R = 0.87
P = 4 × 10–48
R = 0.54P = 4 × 10–143
R = 0.81P = 6 × 10–118
R = 0.79P = 5 × 10–144
R = 0.80
P = 9 × 10–60
R = 0.58P = 2 × 10–227
R = 0.87P = 4 × 10–194
R = 0.86P = 4 × 10–129
R = 0.82
CCR7 CCL21
GZMH GZMK CTLA4 TIGIT
LAMP3 BTLA KLRK1 KLRC2
CD3E mRNA expression (In)
CD3E mRNA expression (In)
a b
c
d
e
NATURE COMMUNICATIONS | https://doi.org/10.1038/s41467-020-19781-y ARTICLE
NATURE COMMUNICATIONS | _#####################_ | https://doi.org/10.1038/s41467-020-19781-y | www.nature.com/naturecommunications 3

UNCORRECTED PROOF
localized within the tumor-associated tertiary lymphoid struc-tures (TLS) (Fig. 3f). Fifty-three specimens (51%) had, on average,less than one CD141+ immune cell per mm2 (SupplementaryFig. 6d). Among them, 60% (32 samples) belong to the group ofhigh-risk NB patients (with aggressive features including MYCNamplification, presence of metastasis, age at diagnosis >18 monthsand unfavorable histology) (Supplementary Table 1). Of note,90% of the deceased patients (16 out of 18) felled within thisgroup (Supplementary Fig. 6d). Consistently with mRNA data,the density of CD141+ cells significantly correlated with theabundance of CD3+, CD8+, and CD4+ T-cell subsets (Fig. 3g andSupplementary Fig. 6e, f), as well as with patient outcome (log-rank P value 0.029) (Fig. 3h). The distribution of CD141+ cellswas significantly different in NB patients stratified according tothe INRG stage, with higher CD141+ cell density correlating withfavorable clinical outcomes (Supplementary Fig. 6g). A significant
inverse correlation was detected between CD141+ cell densityand MYCN amplification status (Wilcoxon rank-sum P value:0.0039), but not with age at diagnosis (Supplementary Fig. 6h, i).Similar to transcriptomic data (Fig. 3e), a high density of CD141+
and CD3+ T cells were significantly associated with improvedclinical outcomes of NB patients (log-rank P value: 0.0025)(Fig. 3i). In addition, a logistic regression model was built topredict T-cell infiltration from the expression of CD141 byevaluating the predictive performance in terms of MatthewsCorrelation Coefficient (MCC) over threefold cross-validation(CV) repeated ten times. A significant association was detectedbetween CD141 and CD3 abundance with MCC= 0.50 (95%confidence interval: 0.46–0.55) significantly higher than therandom predictor (i.e., a logistic regression model trained afterhaving randomly permuted the target variable; MCC=−0.02;95% confidence interval: −0.06–0.01) (Wilcoxon rank-sum test P
Fig. 1 CD3E expression is associated with antitumor immune responses in human neuroblastoma. a Heatmap of the normalized expression ofimmune genes ordered from left to right by increasing levels of CD3E expression of 498 NB patients from the SEQC-NB available in the GEOdatabase. b Gene ontology term enrichment analysis performed by DAVID Bioinformatics Resources (https://david.ncifcrf.gov/) reveals 13 statisticallysignificant (Benjamini–Hochberg adjusted P value <0.05) biological processes controlled by upregulated genes among patients with high CD3E expression.c–e Correlation of CD3E expression with the indicated genes in NB patients. Gene transcripts reported to be associated with increased immune cellinfiltration, immune cell trafficking, and immune functional status15,80–82 were studied in the SEQC-NB dataset. Genes that met the following criteria: (i) acorrelation coefficient (R) greater than or equal to at least 0.4 with statistical significance (P < 0.05), (ii) a significantly different expression betweenpatients with high and low CD3E expression, and (iii) showing consensus in the Nanostring cohort, were displayed. Robust F-test (two-sided) on the robustregression fit of a linear model was used for data analysis. c Cytokines and chemokines involved in immune cell trafficking. d Activation and exhaustionmolecules. e DC and NK-cell function markers. Correlations were assessed measuring the coefficient of determination of a robust linear regression modelfit on the data (see “Statistical analysis”). No adjustment was required unless otherwise stated. Statistically significant P values are indicated.
Cytotoxic CD8
6
4
2
Lo Hi Lo Hi Lo Hi Lo Hi
6
4
5
4
6
4
6
10
10
10
15
3
Helper T cells
Nanostring
SEQC
Nanostring
SEQC
DC CD56 dim NK Macrophages
CD3E CD3E CD3E CD3E
CD3E CD3E CD3E CD3E
Neutrophils
P = 3 × 10
Imm
une
gene
s (lo
g 2)
–5 P = 2 × 10⁻⁴
P = 2 × 10–78 P = 5 × 10–56
P = 1 × 10⁻⁴ P = 1 × 10⁻³ P = 2 × 10⁻² P = 4 × 10⁻²
P = 3 × 10⁻⁴ P = 5 × 10⁻⁷P = 4 × 10–30 P = 3 × 10–43
P = 3 × 10⁻³
P = 2 × 10–29
Memory T cells
P = 2 × 10⁻⁴
P = 5 × 10–51
Gamma Delta
10
15
Lo Hi Lo Hi Lo Hi Lo Hi
Lo Hi Lo Hi Lo Hi Lo Hi
Lo Hi Lo Hi Lo Hi Lo Hi
5
4
3
2
1
10
5
15
10
15
10
5
10
5
6
4
2
0
Imm
une
gene
s (lo
g 2)
6
4
6
4
Fig. 2 Intratumoral DCs and NK cells correlate with CD3E gene expression in human neuroblastoma. Box plots of metagene expression values for theindicated immune cell types28 according to the high (Hi) and low (Lo) levels of CD3E mRNA (median split) in primary NB patients from Nanostring-NB(n= 36) and the SEQC-NB (n= 498) cohorts. The immune cell type scores were calculated as the average expression values of the NanoString constituentgenes. The boxes show the 25th to 75th percentile; the horizontal lines inside the box represent the median; the upper whisker extends to the largest datapoint, no more than 1.5 times the IQR from the box; the lower whisker extends to the smallest data point at most 1.5 times the IQR from the box; the dotsare individual samples. Data were analyzed by Kruskal–Wallis rank-sum test (two-sided). No adjustment was required. Statistically significant P values areindicated.
ARTICLE NATURE COMMUNICATIONS | https://doi.org/10.1038/s41467-020-19781-y
4 NATURE COMMUNICATIONS | _#####################_ | https://doi.org/10.1038/s41467-020-19781-y | www.nature.com/naturecommunications

UNCORRECTED PROOF
< 10−10). Altogether, these results indicate that the relative levelsof intratumoral DCs correlate with increased T-cell infiltrationand better survival of NB patients.
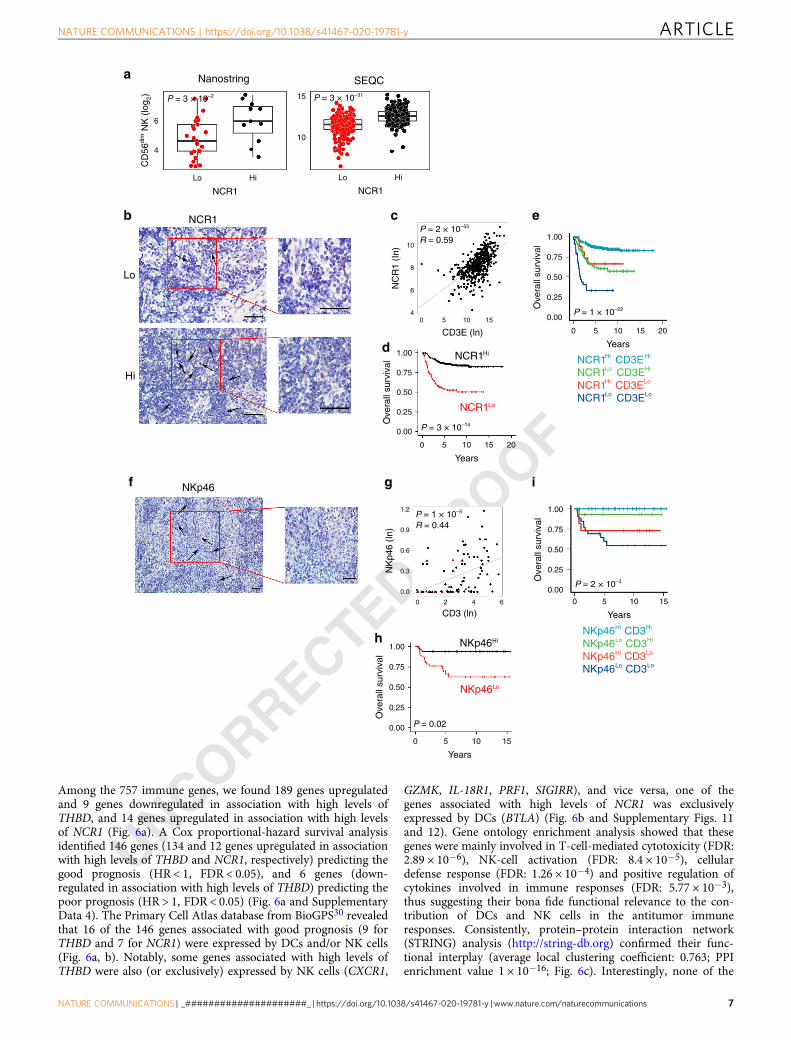
Intratumoral NK cells correlate with increased T-cell infiltra-tion and survival in human neuroblastoma. Then, we sought todetermine whether the density of intratumoral NK cells can alsopredict NB outcome. Expression of the natural cytotoxicity trig-gering receptor 1 (NCR1), a gene encoding the activating receptorNKp46 specific for NK cells (median split), showed a significantcorrelation with the NK-CD56dim signature (Fig. 4a). RNAscopeanalysis showed a high expression of the NCR1 transcript in theimmune cells infiltrating NB samples (Fig. 4b). NB patientsexpressing high NCR1 mRNA displayed high levels of CD3Etranscript (Fig. 4c), and better survival (log-rank P values: 3.33 ×10⁻¹⁴ and 4.29 × 10⁻⁹ for overall survival and event-free survival,respectively (Fig. 4d and Supplementary Fig. 7a). As for THBD,
high levels of NK and T cells were significantly associated withbetter clinical outcome of NB patients (log-rank P values: 1.06 ×10⁻²² and 1.71 × 10⁻¹⁰ for overall survival and event-free sur-vival, respectively) (Fig. 4e and Supplementary Fig. 7b). UnlikeTHBD, high levels of NCR1 were associated with better prognosisin patients with either high or low CD3+ T-cell abundance(NCR1highCD3Ehigh vs NCR1lowCD3Ehigh pairwise log-rankP value= 2.5 × 10⁻⁸ and NCR1highCD3Elow vs NCR1lowCD3Elow
pairwise log-rank P value= 0.017) (Fig. 4e). These data wereconfirmed at the protein levels (Fig. 4f–i and SupplementaryFig. 7c–h). IHC analysis on the cohort of 104 NB samplesrevealed an intense membrane staining of NKp46 in NK cellssparsely distributed within the tumor nests (Fig. 4f). Seventy-twospecimens (69%) had less than one NKp46+ cell per mm2.Among them, 51% (37 samples) belong to high-risk NB patients(Supplementary Table 1). Similar to DCs, the majority of thedeceased patients (16 out of 18) fell in this group (SupplementaryFig. 7c). The density of NKp46+ cells was significantly correlated
a
b
d
ec
f g
h
i
THBDHi THBDHi CD3EHi
THBD Lo CD3EHi
THBDHi CD3ELo
THBD Lo CD3ELo
CD141Hi CD3Hi
CD141Lo CD3Hi
CD141Hi CD3Lo
CD141Lo CD3Lo
CD3E (ln)
THBD
Nanostring SEQC
Years
Years
Years
CD141
THBD Lo
CD141Hi
CD141Lo
P = 1 × 10⁻³
THBD
Lo
Hi
5
4 10
5
DC
(lo
g 2)
3
2
1
Lo Hi
THBD
TH
BD
(In
)
Lo Hi
16
14
12
10
1.00
0.75
Ove
rall
surv
ival
0.50
0.25
0.00
0 5 10 15 20
8
0 5 10 15
1.00
0.75
Ove
rall
surv
ival
0.50
0.25
0.00
0 5 10 15 20
1.00
0.75
Ove
rall
surv
ival
0.50
0.25
0.00
0 5 10 15
CD3 (ln)0 2 4 6
CD
141
(In)
3
2
1
0
1.00
0.75
Ove
rall
surv
ival
0.50
0.25
0.00
Years0 5 10 15
P = 2 × 10–43
P = 9 × 10–42
R = 0.55
p = 5 × 10⁻¹⁰
P = 9 × 10⁻⁴
P = 1 × 10⁻⁸
R = 0.55
P = 0.03
P = 2 × 10⁻³
NATURE COMMUNICATIONS | https://doi.org/10.1038/s41467-020-19781-y ARTICLE
NATURE COMMUNICATIONS | _#####################_ | https://doi.org/10.1038/s41467-020-19781-y | www.nature.com/naturecommunications 5
UNCORRECTED PROOF
with the abundance of CD3+ and CD4+ T-cell subsets, and to alesser extent with CD8+ T cells (Fig. 4g and SupplementaryFig. 7d, e), and associated with better overall survival (log-rank Pvalue: 0.018) (Fig. 4h). The distribution of NKp46+ cells wasstatistically different in NB patients stratified according to theINRG stage, with a higher density of NKp46 correlating with afavorable prognosis (Supplementary Fig. 7f). Similar to CD141,the density of NKp46+ cells was significantly inversely correlatedwith MYCN amplification status (Wilcoxon rank-sum P value:0.0022) (Supplementary Fig. 7g), but not with age at diagnosis(Supplementary Fig. 7h). Similar to mRNA data (Fig. 4e), patientswith a high density of NKp46+ and CD3+ T cells were associatedwith a better prognosis (log-rank P value: 0.0026) (Fig. 4i).
Next, a logistic regression model was built to predict T-cellinfiltration from the expression of NKp46 by evaluating itspredictive performance in terms of MCC over a threefold CVrepeated ten times. As for CD141, a significant association wasdetected between NKp46 and CD3 abundance (MCC= 0.42; 95%confidence interval: 0.39–0.46), significantly higher than therandom predictor (MCC=−0.06; 95% confidence interval:−0.13–0.00) (Wilcoxon rank-sum test P < 10−10).
Taken together, these results indicate that the density ofintratumoral NK cells, like intratumoral DCs, correlates withincreased T-cell infiltration and better survival of NB patients.
Correlation between intratumoral DC and NK cells in humanneuroblastoma. Given the role of intratumoral DCs and NK cellsin predicting the survival of NB patients, we sought to considerwhether these two immune cell populations interact and correlatewith each other. First, we performed a multiplex immuno-fluorescence (IF) analysis in T-cell-enriched NB samples toevaluate the spatial distribution of DCs and NK cells within theTME. In line with the in situ IHC analyses19,29 (Figs. 3f and 4f),we found that these immune cells were detected both withintumor nest and tumor septa regions of T-cell-inflamed NBsamples, with DCs directly interacting with NK cells, and/or CD8+ T cells (Fig. 5a and Supplementary Figs. 8–10). Cell countingrevealed that CD8+ T cells were the most abundant, followed byDC and NK cells. Interestingly, 10% of the total CD8+ T cellswere found attached to DCs, while 1.2% was in contact with NKcells (Fig. 5a), thus suggesting the existence of spatial interactionbetween CD8+ T cells, DCs and NK cells in the NB micro-environment. Tumor samples with high levels of THBD mRNA
(median split) were significantly enriched of CD56dim NK cells inboth Nanostring-NB and SEQC-NB cohorts (Fig. 5b), as well ashigh levels of NCR1 mRNA were associated with an abundance ofintratumoral DCs (Fig. 5c). Consistently, the expression of NCR1/NKp46 was significantly correlated with that of THBD/CD141 atboth RNA (Fig. 5d) and protein levels (Fig. 5e). High expressionof NCR1/NKp46 was associated with better survival in NBpatients regardless of THBD/CD141 expression (log-rank Pvalues: 2.8 × 10⁻¹³ and 0.026, respectively, for overall survival,and log-rank P value: 1.68 × 10⁻⁸ for event-free survival) (Fig. 5f,5g and Supplementary Fig. 10b). We next investigated the asso-ciation of THBD/CD141 and NCR1/NKp46 with MYCN ampli-fication status, age at diagnosis and INRG stage. We builtmultivariate logistic regression models to predict MYCN ampli-fication, age at diagnosis or INRG from the expression of THBD/CD141 and NCR1/NKp46 (one at a time, as well as in combi-nation), evaluating their predictive performance in terms of MCCover a threefold CV repeated ten times. For MYCN amplificationand age at diagnosis, the logistic regression predictive perfor-mance was not significantly different from that of a randompredictor (MCC ~0), i.e., a logistic regression model fit on thedata after having randomly scrambled the response variable(Wilcoxon rank-sum test P= 0.49). A significant association withINRG was found for THBD/CD141 and/or NCR1/NKp46, withMCC= 0.53 (95% confidence interval: 0.48–0.57), significantlyhigher than the random predictor MCC= 0.01 (95% confidenceinterval: −0.04–0.06) (Wilcoxon rank-sum test P < 10−3) (Sup-plementary Fig. 10c).
Altogether, these results indicate that DCs and NK cellsinteract and correlate each other in the TME of NB, and that theyare significant predictors of clinical outcome independent fromthe criteria currently used to stage NB (i.e., MYCN amplificationstatus and age at diagnosis). Thus, DCs and NK cells could beusefully integrated as prognostic markers for a better NB riskstratification.
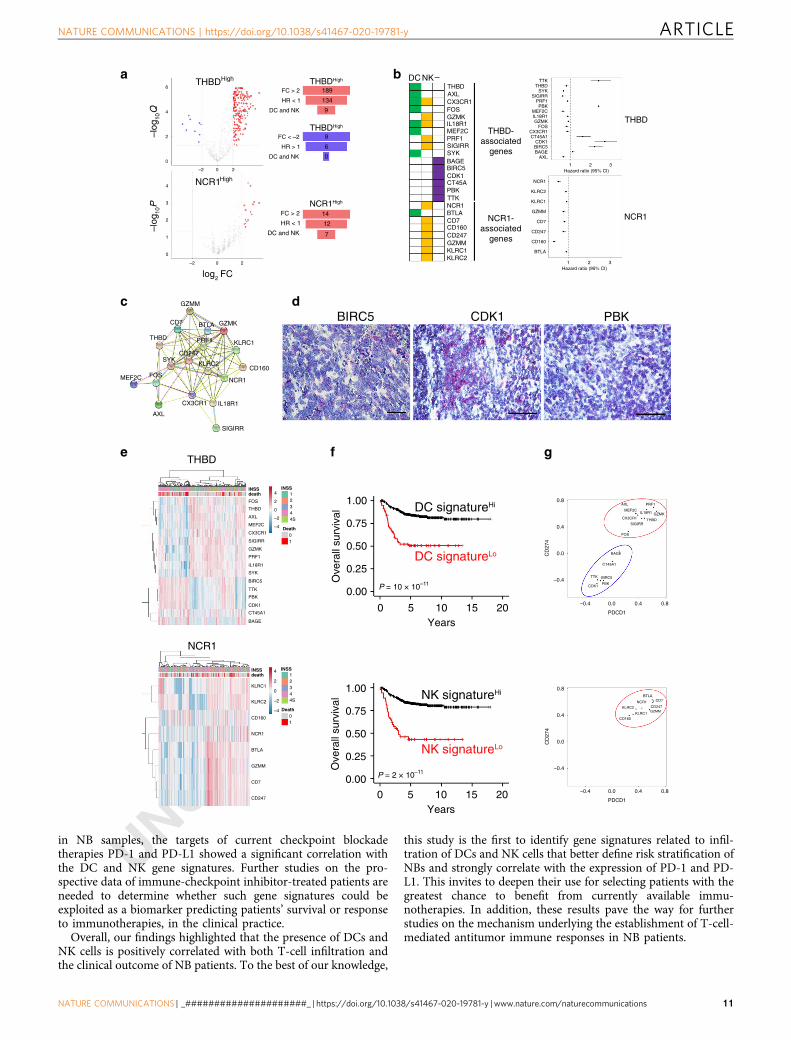
DC and NK gene signatures predict clinical outcome in humanneuroblastoma. Next, we sought to generate gene signatures thatare predictive of the tumor infiltration by DCs and NK cells inNB patients. To this end, we focused on genes that were (i) sig-nificantly associated with high levels of THBD or NCR1 (foldchange >2 or <−2, and Q or P value <0.05) from Nanostringdata, (ii) with highly significant prognostic value (HR < 1 or >1),and (iii) predominantly expressed by DCs and/or NK cells.
Fig. 3 Intratumoral DC levels correlate with increased survival in human neuroblastoma. a Box plots of the DC gene signature28 according to thehigh and low levels of THBD gene expression (median split) in primary NB lesions from Nanostring-NB (n= 36) and SEQC-NB (n= 498) cohorts. DCsignature score was calculated as the average expression values of the NanoString constituent genes. The boxes show the 25th to 75th percentile; thehorizontal lines inside the box represent the median; the upper whisker extends to the largest data point, no more than 1.5 times the IQR from the box;the lower whisker extends to the smallest data point at most 1.5 times the IQR from the box; the dots are individual samples. Data were analyzed byKruskal–Wallis rank-sum test (two-sided). b Representative images of NB tissue sections analyzed for THBD expression using RNAscope (red dots).Nuclei were counterstained with hematoxylin (blue). THBD positive cells are indicated by black arrows. Original magnification ×40 (left) and ×60(right). Scale bar, 30 μm. c Correlation between THBD and CD3E gene expression in NB patients, analyzed by robust F-test (two-sided) in SEQC-NB(n= 498). d, e Kaplan–Meier curves show the duration of overall survival of NB patients according to the THBD gene expression either alone (d), or incombination with CD3E gene (e) in SEQC-NB (n= 498). Log-rank test with Miller and Siegmund P-value correction was used. f Representative examples ofCD141 staining in primary NB lesions. Upper and lower panels, CD141-expressing cells sparsely distributed within tumor nests or localized within TLS,respectively. Brown, CD141-expressing cells. Nuclei were counterstained with hematoxylin (blue). CD141 positive cells are indicated by black arrows.Original magnifications, ×40 (up left), ×60 (up right), ×20 (down left), and ×40 (down right). Scale bars, 30 μm. g Scatter plot showing the correlationbetween CD141+ and CD3+ cell densities in NB patients, analyzed by robust F-test (two-sided). Black and red dots, patients who are alive and dead,respectively; triangle and dots, MYCN amplified and non-amplified patients, respectively. h, i Kaplan–Meier curves of overall survival of NB patients(n= 104) according to the density of CD141+ cells alone (h) or in combination with CD3+ cell densities (i). Log-rank test with Miller and Siegmund P-valuecorrection was used. Correlations in c and g were assessed measuring the coefficient of determination of a robust linear regression model fit on the data(see “Statistical analysis"). The representative images in b and f were selected from n= 104 biologically independent NB specimens. Hi high, Lo low. Noadjustment was required unless otherwise stated. Statistically significant P values are indicated.
ARTICLE NATURE COMMUNICATIONS | https://doi.org/10.1038/s41467-020-19781-y
6 NATURE COMMUNICATIONS | _#####################_ | https://doi.org/10.1038/s41467-020-19781-y | www.nature.com/naturecommunications
UNCORRECTED PROOF
Among the 757 immune genes, we found 189 genes upregulatedand 9 genes downregulated in association with high levels ofTHBD, and 14 genes upregulated in association with high levelsof NCR1 (Fig. 6a). A Cox proportional-hazard survival analysisidentified 146 genes (134 and 12 genes upregulated in associationwith high levels of THBD and NCR1, respectively) predicting thegood prognosis (HR < 1, FDR < 0.05), and 6 genes (down-regulated in association with high levels of THBD) predicting thepoor prognosis (HR > 1, FDR < 0.05) (Fig. 6a and SupplementaryData 4). The Primary Cell Atlas database from BioGPS30 revealedthat 16 of the 146 genes associated with good prognosis (9 forTHBD and 7 for NCR1) were expressed by DCs and/or NK cells(Fig. 6a, b). Notably, some genes associated with high levels ofTHBD were also (or exclusively) expressed by NK cells (CXCR1,
GZMK, IL-18R1, PRF1, SIGIRR), and vice versa, one of thegenes associated with high levels of NCR1 was exclusivelyexpressed by DCs (BTLA) (Fig. 6b and Supplementary Figs. 11and 12). Gene ontology enrichment analysis showed that thesegenes were mainly involved in T-cell-mediated cytotoxicity (FDR:2.89 × 10⁻⁶), NK-cell activation (FDR: 8.4 × 10⁻⁵), cellulardefense response (FDR: 1.26 × 10⁻⁴) and positive regulation ofcytokines involved in immune responses (FDR: 5.77 × 10⁻³),thus suggesting their bona fide functional relevance to the con-tribution of DCs and NK cells in the antitumor immuneresponses. Consistently, protein–protein interaction network(STRING) analysis (http://string-db.org) confirmed their func-tional interplay (average local clustering coefficient: 0.763; PPIenrichment value 1 × 10⁻¹⁶; Fig. 6c). Interestingly, none of the
a
b c
d
e
f g
h
i
NKp46Hi
NKp46Lo
CD3 (ln)
NK
p46
(In)
NCR1Hi
NCR1Lo
NCR1Hi CD3EHi
NCR1Lo CD3EHi
NCR1Hi CD3ELo
NCR1Lo CD3ELo
NKp46Hi CD3Hi
NKp46Lo CD3Hi
NKp46Hi CD3Lo
NKp46Lo CD3Lo
CD3E (ln)
P = 3 × 10⁻² P = 3 × 10–31
Nanostring
NCR1
SEQC
Years
NCR1
NKp46
Lo
Hi
6
CD
56di
m N
K (
log 2
)4
15
10
Lo Hi
NCR1
Lo Hi
10
NC
R1
(In)
8
6
40 5 10 15
0
1.00
0.75
0.50
0.25
0.00
5 10 15 20
Ove
rall
surv
ival
1.00
0.75
0.50
0.25
0.00
Ove
rall
surv
ival
Years
0 5 10 15 20
0
1.2
0.9
0.6
0.3
0.0
2 4 6
Years
0 5 10 15
1.00
0.75
0.50
0.25
0.00
Ove
rall
surv
ival
1.00
0.75
0.50
0.25
0.00
Ove
rall
surv
ival
Years
0 5 10 15
P = 2 × 10–55
R = 0.59
P = 3 × 10–14
P = 1 × 10–22
P = 2 × 10⁻³
P = 0.02
P = 1 × 10⁻⁵
R = 0.44
NATURE COMMUNICATIONS | https://doi.org/10.1038/s41467-020-19781-y ARTICLE
NATURE COMMUNICATIONS | _#####################_ | https://doi.org/10.1038/s41467-020-19781-y | www.nature.com/naturecommunications 7

UNCORRECTED PROOF
six genes predicting poor prognosis was expressed by DCs and/orNK cells (Fig. 6b and Supplementary Fig. 11). This was confirmedby RNAscope analysis performed on three out of six genes(BIRC5, CDK1, and PBK), showing their predominant expressionon tumor cells of NB patients (Fig. 6d). Gene ontology enrich-ment analysis revealed that BIRC5, CDK1, PBK, and TTK wereinvolved in the cell cycle regulation (FDR: 1.74 × 10⁻⁵). Inter-estingly, PBK, TTK, BAGE, and CT45A encode proteins termedcancer/testis antigens known to confer a selective advantage totumor cells by promoting oncogenic processes or permittingevasion of tumor-suppressive mechanisms31.
Unsupervised clustering analysis on THBD- and NCR1-associated genes allowed the identification of patients withdistinct gene expression profiles and clinical outcome (Fig. 6e).We evaluated the patient survival status after combining theexpression of THBD- and NCR1-associated genes and found thathigh expression of both gene clusters was associated withincreased survival in the SEQC-NB dataset, employed as thetraining set for the signature discovery (log-rank P values: 3.24 ×10⁻¹⁰ and 1.55 × 10⁻¹¹ for overall survival of THBD- and NCR1-associated genes, respectively, and log-rank P values: 4.62 × 10⁻⁶
and 5.57 × 10⁻⁵ for event-free survival of THBD- and NCR1-associated genes, respectively) (Fig. 6f and SupplementaryFig. 13a). In addition, fivefold CV revealed that high expressionof both DC and NK gene signatures continues to be significantlyassociated with better OS (Supplementary Fig. 13b). Of note,when ten iterations of fivefold CV (10 × 5-fold) were furtheremployed to enhance the robustness of the results, OS remainsstatistically significant for DC and NK gene signatures in 82 and78% of cases, respectively, and showed the same trend in theremaining cases (Supplementary Data 5)21.
Next, we assessed the prognostic improvement of THBD- andNCR1-associated genes with respect to classical predictors such asINRG stage, MYCN amplification status, age at diagnosis, and T-cell infiltration. To this aim, we evaluated the MCC, sensitivity(sens), and specificity (spec) of three logistic regression modelspredicting the binary outcome OS > 2/OS < 2 yrs on the SEQC-NB cohort, using the classical predictors alone (MCC= 0.503,sens= 0.692, spec= 0.790) as well as in combination with the DCsignature (MCC= 0.525, sens= 0.717, spec= 0.799) and the NKsignature (MCC= 0.552, sens= 0.741, spec= 0.806). The per-formance metrics improve with the addition of the DC and NKsignatures, thus suggesting their prognostic improvement withrespect to classical predictors (Supplementary Fig. 13c andSupplementary Data 6). The extent of the prognostic value of
DC and NK signatures was verified on both a further NB dataset(SEQC-NB2)32 (Supplementary Fig. 14a) and across multipleadult cancer models, including colorectal cancer33, skin cuta-neous melanoma (SKCM), head-neck squamous cell carcinoma(HNSC), and breast cancer34 (Supplementary Fig. 14b–e). Thesefindings provide evidence that genes associated with high levels ofTHBD and NCR1 expression represent robust immune genesignatures predicting both infiltration of DCs and NK cells intumors and survival of cancer patients.
Notably, the expression of THBD- and NCR1-associated geneswas significantly correlated with genes encoding immunecheckpoints PD-L1 and PD-1 in NB samples (Fig. 6g andSupplementary Figs. 15 and 16). Specifically, CD274 and PDCD1genes showed a direct correlation with all the individual genesbelonging to the two immune signatures having a protective role(HR < 1), and an inverse correlation with those associated withpoor prognosis (HR > 1) (Supplementary Figs. 15 and 16).
Finally, to dissect the relative contribution of the two genesignatures as compared to the other variables known to associatewith patient survival in univariate analysis (namely, INRG L1, L2,and MS, absence of MYCN amplification, age <18 months, highT-cell infiltration and high expression of THBD and NCR1 genesignatures), a multivariate Cox regression analysis was performed.High expression of THBD and NCR1 gene signatures remainedstatistically associated with better survival (HR, 0.4; 95%confidence interval, 0.27–0.61; P= 1.4 × 10⁻⁵, and HR, 0.36;95% confidence interval, 0.23–0.55; P= 4.0 × 10⁻⁶ for THBD andNCR1 signatures, respectively), similarly to the T-cell abundance(HR, 0.35; 95% confidence interval, 0.22–0.55; P= 5.4 × 10⁻⁶).
These results indicate that both THBD and NCR1 genesignatures represent novel prognostic variables able to predictoverall survival in NB patients.
DiscussionWe previously reported that T-cell infiltration was positivelyassociated with a better prognosis of NB19,29. Since T cells are notautonomous in their effector functions, depending on interactionwith other cells for the onset and maintenance of T-cellresponses, herein, we investigated which other immune cellpopulations could correlate with the survival of NB patients. Weshow that tumors highly infiltrated by T cells are also enriched ofintratumoral DCs and NK cells that, similarly to T cells, areassociated with a favorable clinical outcome of NB patients.Although less abundant than T cells, both DCs and NK cells arespatially distributed within the nest tumor regions interacting
Fig. 4 Intratumoral NK-cell levels correlate with increased survival in human neuroblastoma. a Box plots of the NK gene signature28 according to thehigh and low levels of NCR1 gene expression (median split) in primary NB lesions from Nanostring-NB (n= 36) and SEQC-NB (n= 498) cohorts. CD56dim
NK-cell signature score was calculated as the average expression values of the NanoString constituent genes. The boxes show the 25th to 75th percentile;the horizontal lines inside the box represent the median; the upper whisker extends to the largest data point, no more than 1.5 times the IQR from the box;the lower whisker extends to the smallest data point at most 1.5 times the IQR from the box; the dots are individual samples. Data were analyzed byKruskal–Wallis rank-sum test (two-sided). b Representative images of NB tissue sections probed for NCR1 expression using RNAscope (Red dots).Nuclei were counterstained with hematoxylin (blue). NCR1-positive cells are indicated by black arrows. Magnification with ×40 (left) and ×60 (right).Scale bar, 30 μm. c Correlation between NCR1 and CD3E gene expression in NB patients, analyzed by robust F-test (two-sided) in SEQC-NB (n= 498).d, e Kaplan–Meier curves of overall survival of NB patients according to the NCR1 gene expression either alone (d) or in combination with CD3E gene (e) inSEQC-NB (n= 498). Log-rank test with Miller and Siegmund P value correction was used. f Representative example of NKp46 cell staining in primary NBlesion. Red, NKp46-expressing cells. Nuclei are counterstained with hematoxylin (blue). NKp46-positive cells are indicated by black arrows. Magnificationwith ×20 (left) and ×40 (right). Scale bar, 30 μm. g Scatter plot showing the correlation between NKp46+ and CD3+ cell densities in NB patients, analyzedby robust F-test (two-sided). Black and red dots, patients who are alive and dead, respectively; triangle and dots, MYCN amplified and non-amplified NBpatients, respectively. h, i Kaplan–Meier curves of overall survival of NB patients according to the NKp46 protein expression either alone (h) or incombination with CD3+ cell densities (i). Log-rank test with Miller and Siegmund p-value correction was used. Correlations in c and g were assessedmeasuring the coefficient of determination of a robust linear regression model fit on the data (see “Statistical analysis”). The representative images in b andf were selected from n= 104 biologically independent NB specimens. Hi high. Lo low. No adjustment was required unless otherwise stated. Statisticallysignificant P values are indicated.
ARTICLE NATURE COMMUNICATIONS | https://doi.org/10.1038/s41467-020-19781-y
8 NATURE COMMUNICATIONS | _#####################_ | https://doi.org/10.1038/s41467-020-19781-y | www.nature.com/naturecommunications

UNCORRECTED PROOF
with each other, and with CD8+ T cells. In addition, we foundthat DCs and NK cells are predictors independent from thosecurrently used to stage and stratify treatment of patients with NB(i.e., MYCN amplification status and age at diagnosis). Notably,by exploring both our Nanostring and public RNA SEQCexpression profiles, we identified gene signatures related to DCsand NK cells, which are strongly associated with the survival ofNB patients. Intratumoral DCs are particularly important forcancer immunity for their ability in taking up antigens inside thetumor bed, trafficking to the nearest tumor-draining lymphnodes, and performing the cross-priming to activate cytotoxic T-cell responses and eliminate the tumor6. Indeed, no tumor-specific CD8+ T cells can be generated in murine models lacking
intratumoral DCs. Experimental cancer models revealed thataccumulation and activation of tumor-infiltrating effector CD8+
T cells are dependent on the presence of intratumoral CD103+
DCs8, suggesting that the limited infiltration of CD8+ T cellsobserved in many tumor lesions could be a consequence of thereduced accumulation of this DC subset. Our findings in thecontext of NB support this concept, showing a direct correlationbetween the abundance of TILs and DCs both at mRNA andprotein levels.
In addition to T cells and DCs, also intratumoral NK cells havea prognostic role in NB patients. NK cells are well known tocontribute to antitumor immunity and predict good prognosis inseveral human cancer patients35. Interestingly, we found that
a
c
db
e
f g
n.s.
NKp46 (ln)
NCR1 (ln)
P = 2 × 10–21
P = 0.16
P = 0.032
Years
THBD
NCR1
CD8CD141NKp46
1
3
2
4
Nanostring SEQC
Nanostring SEQC
40
30
20
10
0.75
0.00
CD
8
CD
141
NK
p46
CD
8/C
D14
1
CD
8/N
Kp4
6
CD
141/
NK
p46
CD
8/C
D14
1/N
Kp4
6
1.50
Num
ber
of c
ells
/mm
2
NCR1Hi THBDHi
NCR1Lo THBDHi
NCR1Hi THBDLo
NCR1Lo THBDLo
NKp46Hi CD141Hi
NKp46Hi CD141Lo
NKp46Lo CD141Lo
16
14
12
10
8
4 6 8 10
TH
BD
(In
)
3
2
1
0
0.0 0.3 0.6 0.9 1.2
CD
141
(In)
1.00
0.75
0.50
0.25
0.00
Ove
rall
surv
ival
0 5 10 15
Years
0 5 10 15 20
1.00
0.75
0.50
0.25
0.00
Ove
rall
surv
ival
5
4 10
5
3
DC
(lo
g 2)
2
1
Lo Hi
NCR1
Lo Hi
6
CD
56di
m N
K (
log 2
)
4
Lo Hi
THBD
Lo Hi
15
10
P = 2 × 10⁻⁹
R = 0.46
P = 3 × 10–24
P = 0.026
P = 3 × 10⁻² P = 5 × 10–26
P = 3 × 10–13
NATURE COMMUNICATIONS | https://doi.org/10.1038/s41467-020-19781-y ARTICLE
NATURE COMMUNICATIONS | _#####################_ | https://doi.org/10.1038/s41467-020-19781-y | www.nature.com/naturecommunications 9

UNCORRECTED PROOF
tumors with low NK-cell density were also devoid of intratumoralDCs and associated with poor prognosis. Furthermore, theabundance of intratumoral DCs was associated with better sur-vival mainly in patients whose samples were enriched in NK cells.Of note, recent studies have highlighted the existence of the NK-DC axis in adult tumors, including melanoma, breast cancer, lungcancer, and head and neck squamous cell carcinoma15,16, andthat these innate immune cells correlate with responsiveness toanti-PD-1 immunotherapy15. In this context, we found thatFLT3LG and CCL5 genes, encoding the related proteins con-tributing to the recruitment of intratumoral DCs by NK cells15,16,are both strongly correlated with CD3E (Fig. 1), THBD and NCR1(Supplementary Fig. 17a), thus further validating the existence ofthe DC–NK axis in NB. Consistently, a direct interaction betweenthe number of TILs, DCs, and NK cells was detected in NB.Indeed, multiplexed immunofluorescence imaging clearly showedthat DCs and NK cells interact with each other within tumor nestregions and in proximity to the TLS. Interestingly, previous stu-dies reported that DC–NK crosstalk depends on both cell-to-cellcontact and soluble factors36,37. Activated NK cells stronglyenhance DCs maturation, and improve their ability to stimulateallogeneic naive CD4+ T cells in a cell contact-dependent man-ner, together with a relevant secretion of IFN-γ and TNF-α38,39.Accordingly, several studies have also shown that the presence ofmature DCs and T cells within tumor-associated TLS is necessaryto orchestrate cytotoxic and immune contexture and that they areassociated with good clinical outcome28,40–44 and response totherapeutic vaccines45,46.
The existence of the DC–NK axis in NB was furtherstrengthened by the identification of the 16 gene DC (THBD,AXL, CX3CR1, FOS, GZMK, IL-18R1, MEF2C, PRF1, SIGIRR,SYK, BAGE, BIRC5, CDK1, CT45A, PBK, and TTK) and 8 geneNK (NCR1, BTLA, CD7, CD160, CD247, GZMM, KLRC1, andKLRC2) cell signatures. Indeed, we found that the DC gene sig-nature is enriched of transcripts typically expressed by NK cells(CX3CR1, GZMK, IL-18R1, PRF1, and SIGIRR), and that viceversa the NK gene signature includes the BTLA transcriptexpressed on DCs47. Importantly, the detection of the single-genetranscript belonging to the two signatures, taken individually, wassufficient to discriminate between patients with a better or worseprognosis. The prognostic value further increased when geneswere clustered all together.
In addition to the genes already known to be associated with T-cell infiltration (CD7, CD247, and SYK), and DC and NK-cell
functions (BTLA for DC8, and CD160, PRF1, GZMK, GZMM,KLRC1, and KLRC2 for NK cells48), the two signatures includegenes predicting a prognostic benefit in different types of cancer.In particular, high expression of SIGIRR has been reported tohave a protective role in malignancies that thrive on inflamma-tion49, including human diffuse large B-cell lymphoma50, andchronic lymphocytic leukemia51. Similarly, an increase of IL-18R1 reduced tumor burden in liver cancer mouse models52.Moreover, the use of IL-18 has been proposed as a novelapproach to increase DC recruitment to the inflammation site ofIL-18R1 expressing tumors53. This evidence supports our find-ings, providing a proof of principle that both DC and NK genesignatures may serve as clinical biomarkers in NB at the sameextent of prognostic tools routinely used to stratify NB patients(including T-cell infiltration).
Although infiltration of human cancers by T cells is generallyinterpreted as a sign of good prognosis, the number of intratu-moral CD8+ T cells able to recognize tumor antigens is verylimited and variable54. Thus, to identify patients potentiallybenefiting from immunotherapy protocols, it should be con-sidered a more comprehensive scenario by evaluating not only thetotal T-cell content but also the abundance of DCs and NK cells.In this regard, increasing the recruitment and activation of DCsand NK cells within the TME may represent a successful strategyto restore effector T-cell accumulation and improve the effec-tiveness of checkpoint blockades and other immunotherapies intumors not infiltrated by T cells. Consistently, we found a sig-nificant overrepresentation of genes encoding for activation andcytotoxicity molecules, such as IFNG, PRF1, GZMB, GZMH,GZMK, GZMA, IL7R, and ICOS, among patients with high levelsof CD3E, THBD, and NCR1, as compared to those with lowexpression of these genes (Supplementary Fig. 17b, c).
Besides T-cell infiltrate and neoantigen load55,56, other factorshave recently been proposed as biomarkers to predict the effec-tiveness of immunotherapy, including PD-L1 expression57, anti-gen presentation defects58, interferon signaling59, mismatchrepair deficiency60, tumor aneuploidy61, and gut microbiota62.However, none of these factors is sufficient individually to achieveaccurate outcome prediction57. In this context, the identificationof specific transcriptome signatures to be employed as reliableimmunotherapeutic biomarkers may represent a major chal-lenge63. To date, specific gene-panels, such as Oncotype DX64,MammaPrint65, and Prosigna66, have demonstrated clinical uti-lity in predicting treatment benefits in breast cancer. Interestingly,
Fig. 5 Cross-correlation between intratumoral DCs and NK cells in human neuroblastoma. a Multiple immunofluorescence staining of NB tumor lesionsfor CD8 (white), CD141 (green), and NKp46 (red), shown at magnification ×60 (zoom), scale bar 30 μm. Four representative scenarios of these cellswithin the tumor are shown: (1) CD8+, CD141+ and NKp46+ cells in close proximity to each other; (2) CD141+ cells interacting with NKp46+ cells;(3) CD141+ cells interacting with CD8+ T cells; (4) CD141+ cells interacting with both CD8+ and NKp46+ cells. Images with nuclei (Hoechst) areshown on the right of each panel. Red blood cells are indicated by yellow arrows. Quantitative analysis of the indicated immune cells from n= 7 biologicallyindependent highly infiltrated NBs is shown on the right. Plotted as mean ± S.D. and analyzed by Kruskal–Wallis test to generate two-tailed P values.b, c Box plots of the NK gene signature according to the high and low levels of THBD gene expression (median split) (b), and of the DC gene signatureaccording to the high and low levels of NCR1 gene expression (median split) (c) in primary NB lesions from Nanostring-NB (n= 36) and SEQC-NB(n= 498) cohorts. DC and CD56dim NK-cell signature scores were calculated as the average expression values of the NanoString constituent genes.Kruskal–Wallis rank-sum test (two-sided) was used. The boxes show the 25th to 75th percentile; the horizontal lines inside the box represent the median;the upper whisker extends to the largest data point, no more than 1.5 times the IQR from the box; the lower whisker extends to the smallest data point atmost 1.5 times the IQR from the box; the dots are individual samples. d, e Correlation between NCR1 and THBD gene expression on SEQC-NB dataset(n= 498) (d) and NKp46+ and CD141+ cell densities (n= 104 independent biological specimens) (e) in NB patients. In e, black and red dots, patients whoare alive and dead, respectively; triangle and dots, MYCN amplified and non-amplified patients, respectively. Robust F-test (two-sided) was used for dataanalysis. f, g Kaplan–Meier curves of overall survival of NB patients according to the combined expression of THBD and NCR1 gene (f) and CD141 andNKp46 protein (g) levels on 498 and 104 NB independent biological specimens, respectively. In g, due to its low frequency, the group NKp46Low-CD141High was omitted. Log-rank test with Miller and Siegmund P-value correction was used. Correlations in d and e were assessed measuring thecoefficient of determination of a robust linear regression model fit on the data (see “Statistical analysis”). Hi high, Lo low. No adjustment was requiredunless otherwise stated. Statistically significant P values are indicated. n.s = not significant.
ARTICLE NATURE COMMUNICATIONS | https://doi.org/10.1038/s41467-020-19781-y
10 NATURE COMMUNICATIONS | _#####################_ | https://doi.org/10.1038/s41467-020-19781-y | www.nature.com/naturecommunications
UNCORRECTED PROOF
in NB samples, the targets of current checkpoint blockadetherapies PD-1 and PD-L1 showed a significant correlation withthe DC and NK gene signatures. Further studies on the pro-spective data of immune-checkpoint inhibitor-treated patients areneeded to determine whether such gene signatures could beexploited as a biomarker predicting patients’ survival or responseto immunotherapies, in the clinical practice.
Overall, our findings highlighted that the presence of DCs andNK cells is positively correlated with both T-cell infiltration andthe clinical outcome of NB patients. To the best of our knowledge,
this study is the first to identify gene signatures related to infil-tration of DCs and NK cells that better define risk stratification ofNBs and strongly correlate with the expression of PD-1 and PD-L1. This invites to deepen their use for selecting patients with thegreatest chance to benefit from currently available immu-notherapies. In addition, these results pave the way for furtherstudies on the mechanism underlying the establishment of T-cell-mediated antitumor immune responses in NB patients.
a b
PBK
THBDHigh
THBDHigh
THBDDC
THBD-associated
genes
THBD
NCR1NCR1-associated
genes
NK–
CX3CR1FOSGZMKIL18R1MEF2CPRF1SIGIRRSYKBAGEBIRC5CDK1CT45APBKTTKNCR1BTLACD7CD160CD247GZMMKLRC1KLRC2
AXL
NCR1High
THBDHigh
NCR1High
THBD
NCR1
HR < 1
FC > 2
DC and NK
HR < 1
FC > 2
DC and NK
HR > 1
FC < –2
DC and NK
log2 FC
189
14
12
7
134
9
9
6
0
NK signatureHi
NK signatureLo
DC signatureHi0.8
0.8
0.4
0.4
PDCD1
0.0
0.0
BAGE
AXL PRF1
MEF2CIL18R1 GZMK
THBDSIGIRR
FOS
CX3CR1
CT45A1
TTK BIRC5
PBKCDK1
–0.4
–0.4
CD
274
DC signatureLo
e f g
dcBIRC5 CDK1
GZMM
CD7 BTLA GZMK
KLRC1PRF1THBD
SYKCD247
KLRC2
NCR1
IL18R1
SIGIRR
CX3CR1
FOS
AXL
MEF2C
CD160
P = 2 × 10–11
6
4
–log
10Q
2
0
–2 0 2
4
3
2
–log
10P
1
0
–2 0 2
TTKTHBD
SYKSIGIRR
PRF1PBK
MEF2CIL18R1GZMK
FOSCX3CR1CT45A1
CDK1BIRC5BAGE
AXL
NCR1
KLRC2
KLRC1
GZMM
CD7
CD247
CD160
BTLA
1 2Hazard ratio (95% CI)
3
1 2Hazard ratio (95% CI)
3
INSS INSSdeath
Death
FOS
4
2
0
–2
–4
12344S
01
THBD
AXL
MEF2C
CX3CR1
SIGIRR
GZMK
PRF1
IL18R1
SYK
BIRC5
TTK
PBK
CDK1
CT45A1
BAGE
INSSdeath
KLRC1
KLRC2
CD160
NCR1
BTLA
GZMM
CD7
CD247
INSS
Death
4
2
0
–2
–4
12344S
01
1.00
0.75
0.50
0.25
0.00
Ove
rall
surv
ival
Years0 5 10 15 20
Years0 5 10 15 20
1.00
0.75
0.50
0.25
0.00
Ove
rall
surv
ival
BTLACD7
CD247GZMM
NCR1
KLRC1CD160
KLRC2
0.80.4
PDCD1
0.0–0.4
0.8
0.4
0.0
–0.4
CD
274
P = 10 × 10–11
NATURE COMMUNICATIONS | https://doi.org/10.1038/s41467-020-19781-y ARTICLE
NATURE COMMUNICATIONS | _#####################_ | https://doi.org/10.1038/s41467-020-19781-y | www.nature.com/naturecommunications 11

UNCORRECTED PROOF
MethodsPatients and samples. Tumor samples from 104 NB patients diagnosed between2002 and 2017 at the Bambino Gesù Children’s Hospital (Rome, Italy) were used.All samples were collected at diagnosis and prior to any therapy. For each patient,written informed parental consent was in accordance with the Declaration ofHelsinki. The study was approved by the Ethical Committee of the Institution.Clinical pathological details of each sample are shown in Supplementary Table 1.Diagnosis and histology definition were performed according to the InternationalNeuroblastoma Risk Group (INRG) and the International NeuroblastomaPathology Classification (INPC)67,68, respectively. MYCN and 1p status wereevaluated following current guidelines69. Patients were treated according to pro-tocols active for the different risk groups70–73.
Antibodies for immunostaining. The following antibodies were used: mousemonoclonal CD141 (15C8, Leica Biosystems), and mouse monoclonal HumanNKp46/NCR1 antibodies (195314, R&D Systems) for IHC staining. Mousemonoclonal Alexa Fluor® 647 anti-human CD8a (C8/144B, BioLegend), mousemonoclonal Thrombomodulin (141C01-1009, Invitrogen), and rabbit polyclonalCD335 (NKp46, Invitrogen) antibodies were used for immunofluorescence stain-ing. F(ab’)2-goat anti-rabbit IgG (H+ L, Alexa Fluor 555, Invitrogen), and F(ab’)2-goat anti-mouse IgG (H+ L, Alexa Fluor 488, Invitrogen) were used as cross-adsorbed secondary antibodies.
Immunohistochemistry and acquisition. Formaldehyde-fixed paraffin-embedded(FFPE) blocks available from 104 NB patients were cut in sections of 3-μm andbaked for 60 min at 56 °C in a dehydration oven. Antigen retrieval and depar-affinization were carried out on a PT-Link (Dako) using the EnVision FLEX TargetRetrieval Solution kits at high or low pH (Dako), as per the manufacturer’sinstruction. Following unmasking, slides were subjected to either the FLEX Per-oxidases blocking reagent (Dako) for CD141 staining (1:70 dilution) or the avidin/biotin blocking system (Thermo Fisher Scientific) for NKp46 staining (1:100dilution) and then incubated overnight at 4 °C with primary antibodies. This stepwas followed by incubation with secondary antibodies coupled with either per-oxidase (Dako) for CD141 or streptavidin alkaline phosphatase (Dako) for NKp46detection. Bound peroxidase and streptavidin were detected with diaminobenzidine(DAB) solution (Dako) or Fast Red chromogen substrate (Dako), respectively.Tissue staining was counterstained with EnVision FLEX Haematoxylin (Dako).Sections of normal tonsils were used as positive controls. Isotype-matched mousemAbs were used as negative controls. Slides were analyzed using an image analysisworkstation (D-SIGHT Menarini Diagnostic). Stained slides were also scannedusing the NanoZoomer S60 Digital slide scanner C13210-01 (Hamamatsu Photo-nics). Scanned images were viewed and captured with Hamamatsu Photonics’simage viewer software (NDP.view2 Viewing software U12388-01). The density ofCD141+ and NKp46+ cells was recorded by two blinded examiners as the numberof positive cells per unit tissue surface area (mm2). Each raw count was normalizedto the tumor cellularity (ranging from 400 to 700 cells per field). The naturallogarithm of the mean density of ten representative fields for each sample was usedfor the downstream statistical analysis. Each quantity x was converted to the logscale with the formula y= ln (x+ 1/(1+ x)) to allow the transformation of 0values.
Multiplex immunofluorescence staining. Following unmasking, FFPE slides wereblocked for 60 min with 1% BSA and 5% normal goat serum and then eachantibody was added consecutively as follows. First, sections were incubated withanti-thrombomodulin (CD141) mAb in 1:20 dilution overnight at 4 °C, followed by
60-min incubation with Alexa Fluor 488 goat anti-mouse IgG in 1:500 dilution.Next, slides were incubated with anti-CD335 (NKp46) Ab in 1:100 dilutionovernight at 4 °C, followed by 60-min incubation with Alexa Fluor 555 goat anti-rabbit IgG in 1:500 dilution. Finally, after a 40-min incubation with mouse IgG,slides were incubated for 60 min with Alexa Fluor 647 anti-CD8 mAb in 1:600dilution. After staining, slides were counterstained for 5 min with Hoechst (H3570,Invitrogen) and coverslipped with 60% glycerol in PBS. Confocal imaging wasperformed using an Olympus Fluoview FV1000 confocal microscope equippedwith FV10-ASW 4.1 software, Multi Ar (458–488 and 515 nm), 2 × He/Ne (543and 633 nm), 405-nm diode lasers and a ×60 (numerical aperture 1.42) oil objectivewith an electronic zoom at 2.0. Optical sections were acquired with a resolution of1024 × 1024 pixels, a sampling speed of 12.5 µs/pixel, and 12 bits/pixel images. Thedensity of CD8+, CD141+, and NKp46+ cells, either alone or interacting with eachother, was recorded by two blinded examiners as the number of positive cells perunit tissue surface area (mm2). The mean of positive cells detected in five fields foreach sample was used in the statistical analysis.
Nanostring analysis. Fresh-frozen NB samples available from 36 out of 104 IHC-stained NB patients were used for immune gene expression analysis. They included11 samples of stage I, 5 stage II, 3 stage III, 14 stage IV, and 3 stage IVS. The totalRNA was extracted using Total RNA Purification Plus Kit (Norgen, Biotek Corp.Thorold), and purified with RNA Cleanup and Concentration kit (Norgen, BiotekCorp. Thorold). Nanodrop 2000 (Thermo-Scientific) was used to quantify RNAconcentration, whereas RNA integrity and purity were assessed with RNA Bioa-nalyzer kit (Agilent Technologies). Only samples having an RNA Integrity Number(RIN) at least seven were considered for further analysis. The expression of 730immune-related genes and 40 housekeeping genes were assessed using the Nano-string PanCancer Immune Profiling assay (https://www.nanostring.com/products/gene-expression-panels/gene-expression-panels-overview/hallmarks-cancer-gene-expression-panel-collection/pancancer-immune-profiling-panel), loading 100 ng oftotal RNA for each patient according to manufacturer’s protocol (NanoStringTechnologies). The R/Bioconductor library NanoStringNorm74 was used to pre-process raw Nanostring RCC files. We used the geometric mean to normalize fortechnical assay variation, the mean plus 2 standard deviations to estimate thebackground count level, and the geometric mean of the housekeeping genes tonormalize for RNA content, following the manufacturer’s recommendations andcommon practices75. Normalized expression values were log2-transformed. Geneswere grouped into 11 immune cell type signatures (Cytotoxic CD8, Helper T cells,Dendritic cells, NK, Macrophages, Neutrophils, Memory T cells, Gamma Delta,Treg, Eosinophils, and Mast cells), derived from Bindea et al.28. The metagenescores for each immune cell type were calculated by taking the geometric mean ofthe normalized/transformed expression values of genes defined in the corre-sponding gene signature (log2 mean). Immune metagene scores were comparedbetween CD3Ehigh and CD3Elow NB samples using the Kruskal–Wallis test. Sincethe immune metagenes were averaged over the signature genes, the P values werenot adjusted for multiple comparisons.
RNAscope technology. FFPE blocks were cut in sections of 5 µm and subject toin situ detection of BIRC5, CDK1, NCR1, PBK, and THBD transcripts using theRNAscope assay with the corresponding probes (cat. nos. 465361, 476991, 312651,551871, and 481241, respectively, Advanced Cell Diagnostics). The positive controlprobe PPIB (cat no. 313901) was included. RNAscope Intro Pack 2.5 HD ReagentKit (red, cat no. 322372, Advanced Cell Diagnostics), was used for signal ampli-fication and RNA molecule visualization, following the manufacturer’s recom-mendations. Digital images of the stained slides were acquired with NanoZoomer
Fig. 6 DC and NK gene signatures positively correlate with increased neuroblastoma patient survival. a Volcano plots displaying the expression levels ofimmune genes according to THBDhigh and NCR1high (left panels). Genes significantly upregulated are shown in red (fold change >2, Q or P values <0.05).Genes significantly downregulated are shown in blue (fold change < - 2, Q value <0.05). A summary of the selected genes is shown in the right panels.b Heatmap of the genes expressed on DCs, NK cells, and other (−) cell types (left panel). Prognostic value of the indicated genes using SEQC-NB(n= 498) cohort in multivariate Cox proportional hazards survival analyses (right panels). Data are expressed as a hazard ratio with 95% confidenceintervals (CI); a value <1 means increased overall survival, and >1 means decreased overall survival. c Protein–protein interaction network for protectivegenes associated with either THBD or NCR1 expressed by DCs and/or NK cells detected with STRING database (http://string-db.org/). The network nodesand the lines represent each protein and protein–protein associations, respectively. The color of the line indicates the type of interaction, i.e., black lineshighlight the co-expression between most of the genes analyzed; the pink, blue, and green lines delineate the protein interactions validated experimentally,in silico or identified by literature, respectively. d Representative images selected from n= 104 biologically independent NB specimens. Tissue sectionswere probed for BIRC5, CDK1, and PBK expression using RNAscope (red dots). Nuclei were counterstained with hematoxylin (blue). Original magnification,×40. Scale bar, 30 μm. e Heatmaps showing the normalized expression values of the protective and risky genes associated with either THBD or NCR1 andexpressed by DCs and/or NK cells in NB patients. f Kaplan–Meier curves for overall survival of NB patients in SEQC-NB (n= 498) cohort. Log-rank testwith Miller and Siegmund P-value correction was used. g Correlation of CD274, PDCD1 expression with the indicated genes in SEQC-NB patients; red circleindicates the protective genes (FC > 2 and HR < 1), blue circle indicates the risky genes (FC <−2 and HR > 1). Correlations were assessed measuring thecoefficient of determination of a robust linear regression model fit on the data (see “Statistical analysis”). Hi high, Lo low. Statistically significant P valuesare indicated.
ARTICLE NATURE COMMUNICATIONS | https://doi.org/10.1038/s41467-020-19781-y
12 NATURE COMMUNICATIONS | _#####################_ | https://doi.org/10.1038/s41467-020-19781-y | www.nature.com/naturecommunications
UNCORRECTED PROOF
S60 Digital slide scanner C13210-01 (Hamamatsu Photonics) and the imageanalysis workstation (D-SIGHT Menarini Diagnostic).
RNA sequencing analysis. A publicly available (GEO accession GSE62564)21
independent cohort of 498 NB patients transcriptionally profiled by RNAsequencing (SEQC-NB) was employed for validation of Nanostring data and as atraining set for gene signatures discovery. Gene expression data were quantile-normalized using the limma R package, then corrected for batch effects by theComBat R package before downstream analysis.
Validation cohort analysis. Further bioinformatics investigation was performedby querying gene expression data from publicly available gene expression cancerdatasets. Independent cohorts of 649 NB (SEQC-NB-2, GEO accession GSE45547)32, 160 colorectal cancers (GEO accession GSE24551)33, and 266 breast cancers(GEO accession GSE21653)34 tissue samples, transcriptionally profiled by 44 Koligonucleotide microarrays, Affymetrix Human Exon 1.0 ST platform, and Affy-metrix Human Genome U133 Plus 2.0 Array, respectively, were downloaded fromthe R2 Genomics Analysis and Visualization Platform (http://r2.amc.nl). Clinicalexpression analysis using genome-wide mRNA levels (Illumina mRNA-seq) andcurated survival data were also downloaded from UCSC Xena hub (https://xenabrowser.net/) for TCGA SKCM and HNSC. After merging gene expressionwith survival data and removing samples without overall survival information, thesample sizes were 454 for SKCM and 520 for HNSC, respectively.
Statistical analysis. The false-discovery rate (FDR) was controlled to ≤5% usingP values adjusted by the Benjamini–Hochberg method. Unsupervised complete-linkage hierarchical clustering of the log2-transformed normalized gene expressionvalues was carried out using Pearson correlation as distance measure. Clusteringresults were displayed as heatmaps using log2-transformed, normalized expressionvalues scaled to have zero mean and unit variance. Reactome pathway analysis wasperformed using the ReactomePA R library76. Differences in the distribution ofgene expression between two groups of a stratifying variable were assessed by theKruskal–Wallis H test; comparisons involving more than two groups were assessedby Dunn’s multiple comparison post hoc test. The relationship between gene pairswas assessed by fitting a robust linear regression model (RLM) (R library MASS),measuring the coefficient of determination (R2) and computing P values by arobust F-test. Overall and event-free survival curves for groups stratified by dif-ferent criteria (see main text) were generated using the Kaplan–-Meier method asimplemented in the survival R library. Overall and event-free survival curves werecompared using a log-rank test19,77. The survival analysis reported in Supple-mentary Fig. 13b and Supplementary Data 5 was conducted by splitting the SEQC-NB cohort according to a fivefold cross-validation schema repeated ten times;Kaplan–Meier survival analysis was performed on each of the held-out portions,testing for significant differences between the patient strata defined by high/lowlevels of the DC or NK signatures (cut points were determined by maximallyselected rank statistics). Hazard ratios were estimated by Cox proportional hazardsmodeling (optionally with stratification by INRG) as implemented in the survival Rlibrary. The gene interaction network is based on gene–gene interaction infor-mation of the STRING database (http://string-db.org) and was generated via thequery interface on their webpage. The THBD and NCR1 gene signatures wererefined by selecting genes predominantly expressed in DCs and NK cells using thePrimary Cell Atlas database from BioGPS30. To assess the association betweenTHBD/CD141 and NCR1/NKp46 expression and high/low expression of CD3E/CD3, a logistic regression model was trained and evaluated in a three- or fivefoldCV (for IHC and SEQC-NB data) repeated ten times, assessing performance interms of MCC. To assess the association between CD141/NKp46 expression andage at diagnosis, MYCN amplification, or INRG staging, predictive models weretrained and evaluated in a threefold cross-validation schema iterated ten times.Logistic regression (for binary outcomes age at diagnosis, MYCN amplification) ormultinomial logistic regression models (for multiclass outcome INRG) were usedas classifiers, using R’s stats::glm (with option family=binomial) and nnet::multi-nom functions, respectively. Predictive performance was assessed in terms of theMCC78, which combines accuracy and precision in a single metric that has beenshown to be more reliable than accuracy and F1 score79. MCC ranges from −1(inverse prediction) to 1 (perfect prediction), with 0 meaning random guess. Thepredictive performance using the true outcome labels was compared with that of arandom predictor, obtained by training the models after a random permutation ofoutcome labels (random labels mode). To assess the prognostic improvementachieved by the addition of the DC and NK signatures, a logistic regression modelwas trained with OS > 2, OS < 2 yrs as the binary outcome variable, and INRGstage, MYCN amplification status, age at diagnosis (>18 mo, <18 mo), high/lowexpression of CD3E as baseline predictors; additionally, two more models weretrained by adding the DC and NK signatures. Model performance was assessed byMCC, sensitivity, and specificity. The models were trained and evaluated on theSEQC cohort in a 10 × 5-fold CV, downsampling the majority class to avoid dataunbalancing. Preprocessing of raw data as well as all subsequent statistical andsurvival analyses were performed in the R environment for statistical computing(version 3.6.2), using libraries available on CRAN or Bioconductor repositories.
Reporting summary. Further information on research design is available in the NatureResearch Reporting Summary linked to this article.
Data availabilityThe authors declare that all data supporting the findings of this study are available withinthe paper and its supplementary information files. The bioinformatic investigation wasperformed by querying gene expression cancer datasets from GEO GSE625664 andGSE45547 for NB (DOIs: https://doi.org/10.1186/s13059-015-0694-1 and https://doi.org/10.1038/cddis.2013.84, respectively), GSE24551 for colorectal cancers (DOI: https://doi.org/10.1136/gutjnl-2011-301179), GSE21653 for breast cancers (DOI: https://doi.org/10.1007/s10549-010-0897-9), and from TCGA Research Network (https://www.cancer.gov/tcga) for SKCM and HNSC. The gene interaction network is based on gene–geneinteraction information of the STRING database and was generated via the queryinterface on the webpage (http://string-db.org). The Primary Cell Atlas database fromBioGPS (http://biogps.org) was used to refine the DC and NK-cell gene signatures. Anyother relevant data and code are available from the corresponding authors uponreasonable request.
Received: 14 January 2020; Accepted: 26 October 2020;Published online: xx xxx 2020
References1. Fridman, W. H., Pages, F., Sautes-Fridman, C. & Galon, J. The immune
contexture in human tumours: impact on clinical outcome. Nat. Rev. Cancer12, 298–306 (2012).
2. Chen, D. S. & Mellman, I. Elements of cancer immunity and the cancer-immune set point. Nature 541, 321–330 (2017).
3. Galon, J. & Bruni, D. Approaches to treat immune hot, altered and coldtumours with combination immunotherapies. Nat. Rev. Drug Discov. 18,197–218 (2019).
4. Galon, J. et al. Type, density, and location of immune cells within humancolorectal tumors predict clinical outcome. Science 313, 1960–1964 (2006).
5. Pages, F. et al. Effector memory T cells, early metastasis, and survival incolorectal cancer. N. Engl. J. Med. 353, 2654–2666 (2005).
6. Roberts, E. W. et al. Critical role for CD103(+)/CD141(+) dendritic cellsbearing CCR7 for tumor antigen trafficking and priming of T cell immunity inmelanoma. Cancer Cell 30, 324–336 (2016).
7. Spranger, S., Dai, D., Horton, B. & Gajewski, T. F. Tumor-residing Batf3dendritic cells are required for effector T cell trafficking and adoptive T celltherapy. Cancer Cell 31, 711–723 e714 (2017).
8. Broz, M. L. et al. Dissecting the tumor myeloid compartment reveals rareactivating antigen-presenting cells critical for T cell immunity. Cancer Cell 26,638–652 (2014).
9. Ruffell, B. et al. Macrophage IL-10 blocks CD8+ T cell-dependent responsesto chemotherapy by suppressing IL-12 expression in intratumoral dendriticcells. Cancer Cell 26, 623–637 (2014).
10. Edelson, B. T. et al. Peripheral CD103+ dendritic cells form a unified subsetdevelopmentally related to CD8alpha+ conventional dendritic cells. J. Exp.Med. 207, 823–836 (2010).
11. Hildner, K. et al. Batf3 deficiency reveals a critical role for CD8alpha+dendritic cells in cytotoxic T cell immunity. Science 322, 1097–1100 (2008).
12. Salmon, H. et al. Expansion and activation of CD103(+) dendritic cellprogenitors at the tumor site enhances tumor responses to therapeutic PD-L1and BRAF inhibition. Immunity 44, 924–938 (2016).
13. Sanchez-Paulete, A. R. et al. Cancer immunotherapy with immunomodulatoryanti-CD137 and anti-PD-1 monoclonal antibodies requires BATF3-dependentdendritic cells. Cancer Discov. 6, 71–79 (2016).
14. Spranger, S., Bao, R. & Gajewski, T. F. Melanoma-intrinsic beta-cateninsignalling prevents anti-tumour immunity. Nature 523, 231–235 (2015).
15. Barry, K. C. et al. A natural killer-dendritic cell axis defines checkpointtherapy-responsive tumor microenvironments. Nat. Med. 24, 1178–1191(2018).
16. Bottcher, J. P. et al. NK cells stimulate recruitment of cDC1 into the tumormicroenvironment promoting cancer immune control. Cell 172, 1022–1037e1014 (2018).
17. Mittal, D. et al. Interleukin-12 from CD103(+) Batf3-dependent dendriticcells required for NK-cell suppression of metastasis. Cancer Immunol. Res. 5,1098–1108 (2017).
18. Michea, P. et al. Adjustment of dendritic cells to the breast-cancermicroenvironment is subset specific. Nat. Immunol. 19, 885–897 (2018).
19. Mina, M. et al. Tumor-infiltrating T lymphocytes improve clinical outcome oftherapy-resistant neuroblastoma. Oncoimmunology 4, e1019981 (2015).
20. Maris, J. M. Recent advances in neuroblastoma. N. Engl. J. Med. 362,2202–2211 (2010).
NATURE COMMUNICATIONS | https://doi.org/10.1038/s41467-020-19781-y ARTICLE
NATURE COMMUNICATIONS | _#####################_ | https://doi.org/10.1038/s41467-020-19781-y | www.nature.com/naturecommunications 13
UNCORRECTED PROOF
21. Zhang, W. et al. Comparison of RNA-seq and microarray-based models forclinical endpoint prediction. Genome Biol. 16, 133 (2015).
22. Parsonage, G. et al. CXCR6 and CCR5 localize T lymphocyte subsets innasopharyngeal carcinoma. Am. J. Pathol. 180, 1215–1222 (2012).
23. Nagarsheth, N., Wicha, M. S. & Zou, W. Chemokines in the cancermicroenvironment and their relevance in cancer immunotherapy. Nat. Rev.Immunol. 17, 559–572 (2017).
24. Slaney, C. Y., Kershaw, M. H. & Darcy, P. K. Trafficking of T cells into tumors.Cancer Res. 74, 7168–7174 (2014).
25. Fernandez, I. Z. et al. A novel human IL2RB mutation results in T and NKcell-driven immune dysregulation. The. J. Exp. Med. 216, 1255–1267 (2019).
26. Malaguarnera, L. et al. Vitamin D3 regulates LAMP3 expression in monocytederived dendritic cells. Cell Immunol. 311, 13–21 (2017).
27. Cohen, N. R. et al. Shared and distinct transcriptional programs underlie thehybrid nature of iNKT cells. Nat. Immunol. 14, 90–99 (2013).
28. Bindea, G. et al. Spatiotemporal dynamics of intratumoral immune cells revealthe immune landscape in human cancer. Immunity 39, 782–795 (2013).
29. Melaiu, O. et al. PD-L1 is a therapeutic target of the bromodomain inhibitorJQ1 and, combined with HLA class I, a promising prognostic biomarker inneuroblastoma. Clin. Cancer Res. 23, 4462–4472 (2017).
30. Wu, C., Jin, X., Tsueng, G., Afrasiabi, C. & Su, A. I. BioGPS: building yourown mash-up of gene annotations and expression profiles. Nucleic Acids Res.44, D313–D316 (2016).
31. Gibbs, Z. A. & Whitehurst, A. W. Emerging contributions of cancer/testisantigens to neoplastic behaviors. Trends Cancer 4, 701–712 (2018).
32. Kocak, H. et al. Hox-C9 activates the intrinsic pathway of apoptosis and isassociated with spontaneous regression in neuroblastoma. Cell Death Dis. 4,e586 (2013).
33. Agesen, T. H. et al. ColoGuideEx: a robust gene classifier specific for stage IIcolorectal cancer prognosis. Gut 61, 1560–1567 (2012).
34. Sabatier, R. et al. A gene expression signature identifies two prognosticsubgroups of basal breast cancer. Breast Cancer Res. Treat. 126, 407–420(2011).
35. Melaiu, O., Lucarini, V., Cifaldi, L. & Fruci, D. Influence of the tumormicroenvironment on NK cell function in solid tumors. Front. Immunol. 10,
Q5Q5 (2020).36. Fernandez, N. C. et al. Dendritic cells directly trigger NK cell functions: cross-
talk relevant in innate anti-tumor immune responses in vivo. Nat. Med. 5,405–411 (1999).
37. Yu, Y. et al. Enhancement of human cord blood CD34+ cell-derived NK cellcytotoxicity by dendritic cells. J. Immunol. 166, 1590–1600 (2001).
38. Gerosa, F. et al. Reciprocal activating interaction between natural killer cellsand dendritic cells. J. Exp. Med. 195, 327–333 (2002).
39. Vitale, M. et al. NK-dependent DC maturation is mediated by TNFalpha andIFNgamma released upon engagement of the NKp30 triggering receptor.Blood 106, 566–571 (2005).
40. Dieu-Nosjean, M. C. et al. Long-term survival for patients with non-small-celllung cancer with intratumoral lymphoid structures. J. Clin. Oncol. 26,4410–4417 (2008).
41. Goc, J. et al. Dendritic cells in tumor-associated tertiary lymphoid structuressignal a Th1 cytotoxic immune contexture and license the positive prognosticvalue of infiltrating CD8+ T cells. Cancer Res. 74, 705–715 (2014).
42. Dieu-Nosjean, M. C., Goc, J., Giraldo, N. A., Sautes-Fridman, C. & Fridman,W. H. Tertiary lymphoid structures in cancer and beyond. Trends Immunol.35, 571–580 (2014).
43. Gu-Trantien, C. et al. CD4(+) follicular helper T cell infiltration predictsbreast cancer survival. J. Clin. Investig. 123, 2873–2892 (2013).
44. Becht, E. et al. Shaping of an effective immune microenvironment to and bycancer cells. Cancer Immunol. Immunother. 63, 991–997 (2014).
45. Maldonado, L. et al. Intramuscular therapeutic vaccination targeting HPV16induces T cell responses that localize in mucosal lesions. Sci. Transl. Med. 6,221ra213 (2014).
46. Lutz, E. R. & Jaffee, E. M. Can we predict mutant neoepitopes in humancancers for patient-specific vaccine therapy? Cancer Immunol. Res. 2, 518–521(2014).
47. Jones, A. et al. Immunomodulatory functions of BTLA and HVEM governinduction of extrathymic regulatory T cells and tolerance by dendritic cells.Immunity 45, 1066–1077 (2016).
48. Voskoboinik, I., Whisstock, J. C. & Trapani, J. A. Perforin and granzymes:function, dysfunction and human pathology. Nat. Rev. Immunol. 15, 388–400(2015).
49. Barrow, A. D. & Colonna, M. Exploiting NK cell surveillance pathways forcancer therapy. Cancers 11, 55 (2019).
50. Riva, F. et al. IL1R8 deficiency drives autoimmunity-associated lymphomadevelopment. Cancer Immunol. Res 7, 874–885 (2019).
51. Muzio, M. et al. Expression and function of toll like receptors in chroniclymphocytic leukaemia cells. Br. J. Haematol. 144, 507–516 (2009).
52. Markowitz, G. J. et al. Inflammation-dependent IL18 signaling restrictshepatocellular carcinoma growth by enhancing the accumulation and activityof tumor-infiltrating lymphocytes. Cancer Res. 76, 2394–2405 (2016).
53. Gutzmer, R. et al. Human dendritic cells express the IL-18R and arechemoattracted to IL-18. J. Immunol. 171, 6363–6371 (2003).
54. Scheper, W. et al. Low and variable tumor reactivity of the intratumoral TCRrepertoire in human cancers. Nat. Med. 25, 89–94 (2019).
55. Van Allen, E. M. et al. Genomic correlates of response to CTLA-4 blockade inmetastatic melanoma. Science 350, 207–211 (2015).
56. Snyder, A. et al. Genetic basis for clinical response to CTLA-4 blockade inmelanoma. N. Engl. J. Med. 371, 2189–2199 (2014).
57. Nishino, M., Ramaiya, N. H., Hatabu, H. & Hodi, F. S. Monitoring immune-checkpoint blockade: response evaluation and biomarker development. Nat.Rev. Clin. Oncol. 14, 655–668 (2017).
58. Zaretsky, J. M. et al. Mutations associated with acquired resistance to PD-1blockade in melanoma. N. Engl. J. Med. 375, 819–829 (2016).
59. Ayers, M. et al. IFN-gamma-related mRNA profile predicts clinical responseto PD-1 blockade. J. Clin. Invest. 127, 2930–2940 (2017).
60. Le, D. T. et al. PD-1 Blockade in Tumors with Mismatch-Repair Deficiency. N.Engl. J. Med 372, 2509–2520 (2015).
61. Davoli, T., Uno, H., Wooten E. C. & Elledge, S. J. Tumor aneuploidy correlateswith markers of immune evasion and with reduced response toimmunotherapy. Science 355, Q6Q6(2017).
62. Kroemer, G. & Zitvogel, L. Cancer immunotherapy in 2017: the breakthroughof the microbiota. Nat. Rev. Immunol. 18, 87–88 (2018).
63. Jiang, P. et al. Signatures of T cell dysfunction and exclusion predict cancerimmunotherapy response. Nat. Med. 24, 1550–1558 (2018).
64. Paik, S. et al. A multigene assay to predict recurrence of tamoxifen-treated,node-negative breast cancer. N. Engl. J. Med. 351, 2817–2826 (2004).
65. van ‘t Veer, L. J. et al. Gene expression profiling predicts clinical outcome ofbreast cancer. Nature 415, 530–536 (2002).
66. Parker, J. S. et al. Supervised risk predictor of breast cancer based on intrinsicsubtypes. J. Clin. Oncol. 27, 1160–1167 (2009).
67. Cohn, S. L. et al. The international neuroblastoma risk group (INRG)classification system: an INRG task force report. J. Clin. Oncol. 27, 289–297(2009).
68. Shimada, H. et al. The international neuroblastoma pathology classification(the Shimada system). Cancer 86, 364–372 (1999).
69. Mathew, P. et al. Detection of MYCN gene amplification in neuroblastoma byfluorescence in situ hybridization: a pediatric oncology group study. Neoplasia3, 105–109 (2001).
70. Kohler, J. A. et al. Treatment of children over the age of one year withunresectable localised neuroblastoma without MYCN amplification: results ofthe SIOPEN study. Eur. J. Cancer 49, 3671–3679 (2013).
71. Rubie, H. et al. Excellent outcome with reduced treatment in infants withnonmetastatic and unresectable neuroblastoma without MYCN amplification:results of the prospective INES 99.1. J. Clin. Oncol. 29, 449–455 (2011).
72. De Bernardi, B. et al. Treatment of localised resectable neuroblastoma. Resultsof the LNESG1 study by the SIOP Europe Neuroblastoma Group. Br. J. Cancer99, 1027–1033 (2008).
73. De Ioris, M. A. et al. Short topotecan-based induction regimen in newlydiagnosed high-risk neuroblastoma. Eur. J. Cancer 47, 572–578 (2011).
74. Waggott, D. et al. NanoStringNorm: an extensible R package for the pre-processing of NanoString mRNA and miRNA data. Bioinformatics 28,1546–1548 (2012).
75. Stricker, T. P. et al. Validation of a prognostic multi-gene signature in high-risk neuroblastoma using the high throughput digital NanoString nCountersystem. Mol. Oncol. 8, 669–678 (2014).
76. Yu, G. & He, Q. Y. ReactomePA: an R/Bioconductor package for Reactomepathway analysis and visualization. Mol. Biosyst. 12, 477–479 (2016).
77. Altman, D. G., Lausen, B., Sauerbrei, W. & Schumacher, M. Dangers of using“optimal” cutpoints in the evaluation of prognostic factors. J. Natl Cancer Inst.86, 829–835 (1994).
78. Baldi, P., Brunak, S., Chauvin, Y., Andersen, C. A. & Nielsen, H. Assessing theaccuracy of prediction algorithms for classification: an overview.Bioinformatics 16, 412–424 (2000).
79. Chicco, D. & Jurman, G. The advantages of the Matthews correlationcoefficient (MCC) over F1 score and accuracy in binary classificationevaluation. BMC Genomics 21, 6 (2020).
80. Cheng, W. C. et al. Uncoupling protein 2 reprograms the tumormicroenvironment to support the anti-tumor immune cycle. Nat. Immunol.20, 206–217 (2019).
81. Szekely, B. et al. Immunological differences between primary and metastaticbreast cancer. Ann. Oncol. 29, 2232–2239 (2018).
82. Wherry, E. J. & Kurachi, M. Molecular and cellular insights into T cellexhaustion. Nat. Rev. Immunol. 15, 486–499 (2015).
ARTICLE NATURE COMMUNICATIONS | https://doi.org/10.1038/s41467-020-19781-y
14 NATURE COMMUNICATIONS | _#####################_ | https://doi.org/10.1038/s41467-020-19781-y | www.nature.com/naturecommunications
UNCORRECTED PROOF
AcknowledgementsThis work was supported by grants awarded by Fondazione AIRC per la Ricerca sulCancro AIRC IG 2016 id. 18495 (D. Fruci), Special Project 5 × 1000 n. 9962 (F. Locatelli)and AIRC IG 2018 id. 21724 (F. Locatelli), Ministero della Salute Ricerca Finalizzata PE-2011-02351866 (D. Fruci) and RF-2016-02364388 (F. Locatelli), CAR T RCR-2019-23669115 (F. Locatelli) and Ricerca Corrente (D. Fruci and F. Locatelli), Ministerodell’Università e della Ricerca PRIN 2017WC8499_004 (to F. Locatelli), IndependentResearch grant AIFA 2016 (F. Locatelli). This research was also supported by two fel-lowships from the Fondazione Veronesi (O. Melaiu and V. Lucarini). The results shownin this study are in part based upon data generated by the TCGA Research Network:https://www.cancer.gov/tcga.
Author contributionsD.F. coordinated the project. D.F. and O.M. conceived and designed experiments,developed methodologies, acquired, analyzed and interpreted the data, contributed toadministrative, technical, or material support, and wrote the paper. O.M. performed allthe experiments. M.C. preprocessed the datasets, performed statistical analyses, andgenerated plots. G.J. provided critical support for statistical analyses and contributed toplot generation. C.F. supervised the statistical analysis and contributed to drafting thepaper. V.L. contributed to RNAscope experiments. R.B., R.D.V., A.C., and F.L. contributeto acquire and manage patients. L.A.C. contributed to acquire confocal images. V.L., L.C.,V.B., and F.L. discussed the results and provided critical comments. All authors criticallyrevised and edited the paper.
Competing interestsThe authors declare no competing interests.
Additional informationSupplementary information is available for this paper at https://doi.org/10.1038/s41467-020-19781-y.
Correspondence and requests for materials should be addressed to D.F.
Peer review information Nature Communications thanks the anonymous reviewer(s) fortheir contribution to the peer review of this work. Peer reviewer reports are available.
Reprints and permission information is available at http://www.nature.com/reprints
Publisher’s note Springer Nature remains neutral with regard to jurisdictional claims inpublished maps and institutional affiliations.
Open Access This article is licensed under a Creative CommonsAttribution 4.0 International License, which permits use, sharing,
adaptation, distribution and reproduction in any medium or format, as long as you giveappropriate credit to the original author(s) and the source, provide a link to the CreativeCommons license, and indicate if changes were made. The images or other third partymaterial in this article are included in the article’s Creative Commons license, unlessindicated otherwise in a credit line to the material. If material is not included in thearticle’s Creative Commons license and your intended use is not permitted by statutoryregulation or exceeds the permitted use, you will need to obtain permission directly fromthe copyright holder. To view a copy of this license, visit http://creativecommons.org/licenses/by/4.0/.
© The Author(s) 2020
NATURE COMMUNICATIONS | https://doi.org/10.1038/s41467-020-19781-y ARTICLE
NATURE COMMUNICATIONS | _#####################_ | https://doi.org/10.1038/s41467-020-19781-y | www.nature.com/naturecommunications 15

UNCORRECTED PROOF
AOP
QUERY FORM
NATURECOMMUNICATIONS
Manuscript ID [Art. Id: 19781]
Author
Editor
Publisher
Journal: NATURECOMMUNICATIONS
Author :- The following queries have arisen during the editing of your manuscript. Please answer by makingthe requisite corrections directly in the e.proofing tool rather than marking them up on the PDF. This willensure that your corrections are incorporated accurately and that your paper is published as quickly aspossible.
QueryNo.
Description Author’s Response
AQ1 Please check your article carefully, coordinate with any co-authors and enter all finaledits clearly in the eproof, remembering to save frequently. Once corrections aresubmitted, we cannot routinely make further changes to the article.
AQ2 Note that the eproof should be amended in only one browser window at any one time;otherwise changes will be overwritten.
AQ3 Author surnames have been highlighted. Please check these carefully and adjust if thefirst name or surname is marked up incorrectly. Note that changes here will affectindexing of your article in public repositories such as PubMed. Also, carefully checkthe spelling and numbering of all author names and affiliations, and the correspondingemail address(es).
AQ4 You cannot alter accepted Supplementary Information files except for critical changesto scientific content. If you do resupply any files, please also provide a brief (butcomplete) list of changes. If these are not considered scientific changes, any alteredSupplementary files will not be used, only the originally accepted version will bepublished.
AQ5 Please provide page range in reference 35, if available.
AQ6 Please provide page range in reference 61, if available.