Embed Size (px)
Citation preview

Cello
Gro
up p
lc Annual Rep
ort 2009
Annual ReportYear Ended 31 December 2009
Cello Group plc11-13 Charterhouse BuildingsLondon EC1M 7APtel: +44 (0)20 7812 8460www.cellogroup.co.uk
Company Registration No. 05120150

Page
Financial Highlights 1
Positioning and Strategy 2-3
Chairman’s Statement 4-9
Cello Research and Consulting 10-11
Tangible Group 12-13
Directors’ Report 14-17
Corporate Governance 18-19
Report of the Remuneration Committee 20-22
Independent Auditors’ Report 23
Consolidated Income Statement 24-25
Consolidated Statement of Comprehensive Income 25
Consolidated Balance Sheet 26
Consolidated Cash Flow Statement 27
Consolidated Statement of Changes in Equity 28
Consolidated Financial Statements – Accounting Policies 29-34
Notes to the Consolidated Financial Statements 35-68
Company Balance Sheet 69
Company Financial Statements – Accounting Policies 70
Notes to the Company Financial Statements 71-77
Notice of Annual General Meeting 78-83
Directors 84-85
Advisers 86
Group Directory 87-88
Contents
The Cello Annual Report 2009 is made from Naturalis Recycled Smooth paper, sourced from 50% FSC-certified recycled, 20% FSC virgin pulp and 30% mill broke. It is manufactured in Scotland.

1
Financial Highlights
• Like-for-like operating income £60.5m (2008: £65.4m)
• Research H2 2.6% growth
• Headline operating profit £5.9m (2008: £8.2m)
• Basic headline earnings per share 7.28p (2008: 13.08p)
• Full year dividend up 4% at 1.30p (2008: 1.25p)
• Strong cash management and generation held down net debt to £11.5m (2008: £9.9m), after cash earn out payments of £3.2m
• Banking facilities successfully renewed until 2013
• Solid second half performance in Research continues in 2010
• 6th largest UK research operation1 (2008: 9th) and 19th globally2 (2008: 21st)
• Good start to 2010 momentum in Q4 2009 continued into Q1 2010
• Robust pipelines of non-UK work in Research and Consulting
• Simon Dannatt appointed Managing Director, Cello USA
1source: Marketing Market Research Leagues September 20092source: Inside Research published August 2009

2
Against a very challenging backdrop in 2009,
Cello Group plc has continued to consolidate its
position in the specialist research and response
communications markets. Cello is now the 6th
largest research organisation domiciled in the
UK and the 19th largest globally. In Response we
remain number 6 in the UK. In both areas we
are the only business that is not part of a much
larger group.
Both research and response markets have
continued to evolve down the path of client sector
specialisation and Cello has benefitted from
structuring its offering along these lines. Healthcare
research and consulting has continued to develop
into our largest area of specialism, accounting
for approaching a third of our revenue. The
broader area of health in its various manifestations
accounts for a further 20% of our activities, and
has remained resilient during the downturn.
Cello’s business has been expanding most
rapidly in international markets, which account
for approaching half of our research revenues.
International revenue flows have shown resilience,
and pressure on gross margins in this area has
been more moderate than in domestic areas of
client activity. We are expanding our operations in
the US market, with a healthcare focus in particular,
and in due course will seek to grow our business in
Asia and the Far East.
The growing relevance of the internet to research
and response has continued unabated. We are
investing behind the growth of online research
communities, which are enjoying a rapid uptake
by clients, both in FMCG and healthcare markets.
Our Face brand has made particular headway in
this new evolving market under the banner of “co-
creation”. We continue to migrate our general data
collection capability online, as a complement to
our more traditional field force capability. Online
communications techniques are now core to the
daily activities of Tangible.
Our strategy as a Group remains to further
reinforce our positioning in research and response
during 2010 and beyond. In particular, we plan to
Positioning and Strategy

3
expand the international servicing capability of our
research business, with a focus on the US market
where we already have a profitable presence
in New York and San Francisco and a broad set
of client relationships, particularly in healthcare.
Asia is also a priority region for us where we have
strong client relationships on which we can readily
build. In the UK we continue to consolidate our
servicing capability so that we can compete more
effectively against our much larger rivals.
Operating Income by Industry Sector
Group Operating Board
Healthcare
5%
0
10%
15%
20%
25%
PublicSector
FinancialServices
Telecoms Leisure Charity Retail FMCG Food &Drink
Industrials Media Utilities Other
R & C 2009
R & C 2008
Tangible 2009
Tangible 2008
back row, L to R – John Rowley, Vincent Nolan, Richard Gilmore, Jane Shirley, Paul Walton, Stephen Highleyfront row, L to R – Andy Carolan, Mark Scott, Allan Rich, Mark Bentley, Owen Williams

4
Overview
2009 has been a demanding year for Cello with the
Group reporting headline operating profit of £5.9m
(2008: £8.2m) on operating income of £60.5m
(2008: £65.4m). However, the final quarter showed
clear signs of stabilisation and improving spend by
clients in the Group’s core areas of expertise.
The decline in income was not evenly spread
across the Group, nor across the year. A stronger
second half from Cello (Research) meant that
full year like-for-like income improved from the
half year decline of 10.4% to a full year decline
of 4.1% (H2 up by 2.6%). The rate of decline in
Tangible, the Group’s direct marketing arm also
improved slightly from 12.5% at the half year to a
full year decline of 11.7%.
These variations reflect the marked slowing in
H1 2009 of ad-hoc qualitative and quantitative
market research activity, which subsequently
recovered to more normal levels as clients
renewed their activity in the latter part of the year.
The rate of decline in certain parts of Tangible’s
business also slowed by year end.
As detailed in the interim results, the Group acted
rapidly to the market conditions by reducing
professional resource as well as property and
other administrative costs. Before discontinued
operations, the full year cost base for 2009 was
£4.3m lower than 2008 with a substantially
lower professional year end headcount of 760
(2008: 830). The Group has also taken action to
consolidate its property commitments and will exit
at least five leases over the next two years, reducing
annual property costs by a further £0.5m.
Cello continues to benefit from its client sector
focus and increasing orientation towards large
contracts. Performance remained particularly
strong in healthcare which now accounts for 38%
of operating income in Research (2008: 34%).
The fact that the top 20 Group clients remained
largely unchanged is a clear demonstration of the
Group’s ability to manage long term relationships.
They accounted for 38% of Cello’s total operating
income. At the same time the Group has achieved
significant new client wins.
In Cello (Research), the emphasis on international
activity has continued to yield good returns, with
overseas revenue now accounting for over 46%
of divisional revenue (2008: 42%). Overseas
revenue declined by 1.5%, at a significantly
slower rate of decline than UK domiciled income.
This has been achieved by continuing to target
multi-national client contracts which represent
higher growth opportunities outside the relatively
mature UK market.
Following continued strong operating cash
generation, net debt at year end was £11.5m
(2008: £9.9m) after £3.2m of earn out payments.
In March 2010, the Group secured new three year
debt facilities.
Financial Review
Total Group operating income was £60.5m
(2008: £65.4m). Headline profit before tax was
£5.1m (2008: £7.3m). The Group’s overall results
mask continued success in the core activities of
healthcare research, specialist FMCG research and
direct marketing. Within these areas, quantitative
research, where the Group has larger contract
sizes, has continued to prove particularly resilient.
The continued reduction in client activity in the
London-based financial services focused agency
and the business intelligence consulting business,
Chairman’s Statement

5
as well as weakness in parts of the charities activities
and in Tangible’s London communications market,
all impacted operating income. The Group headline
operating margin, before head office costs, was
12.4% (2008: 15.6%).
In all underperforming areas quick action was taken
to adjust the cost structure to an appropriate level,
resulting in an exceptional charge of £1.9m. This
charge relates to employee termination payments
and surplus space provisions. All of these were
deemed prudent actions to protect the medium
term profitability of the Group.
The net interest charge was £0.9m (2008: £0.9m).
The Group’s tax charge in the year was £0.2m
(2008: £1.0m). This reduction is as a result of
a decrease in headline operating profit; tax
deductible exceptional costs; deferred tax credits
occurring as a consequence of amortisation and
impairment of intangible assets, and recognition of
certain non-recurring tax credits from prior years.
Headline basic earnings per share were 7.28p
(2008: 13.08p) and headline fully diluted earnings
per share were 5.89p (2008: 8.41p). Fully diluted
earnings per share reflects the impact of the
anticipated future issuance of shares to vendors
of companies acquired by the Group under earn
out arrangements.
The Board is proposing a final dividend of 0.80p per
share, giving a total dividend per share for the year
ended 31 December 2009 of 1.30p (2008: 1.25p),
an increase of 4.0%. This dividend will be paid,
subject to shareholder approval, on 16 June 2010
to all shareholders on the register at 21 May 2010.
The Group’s net debt position at 31 December
2009 was £11.5m (2008: £9.9m), after earn out
payments of £3.2m. Operating cash flow of £5.2m
during the year represented an 87% conversion of
headline operating profit.
In March 2010, the Group renewed its banking
facility with The Royal Bank of Scotland. This new

66
facility consists of a £10.0m term loan and a
£7.0m Revolving Credit Facility. The facility expires
in March 2013. The multi-currency overdraft facility
of £2.0m was also renewed. Interest margin
is between 250pts and 325pts above LIBOR.
Increases in interest margins incurred under this
new facility are expected to be offset by ongoing
reduction in net debt through internally generated
cash during 2010 and beyond.
In April 2009, £7.8m of earn out liabilities were
settled, which is a very substantial part of the
Group’s outstanding earn out liabilities. These
were settled by £3.2m in cash and loan notes,
and £4.6m in shares issued at an average issue
price of 32.4p per share. Following a detailed
review of further liabilities, earn out commitments
now expected are £6.1m at 31 December 2009,
to be paid over the period from 2010 to 2013,
compared with £7.4m for the equivalent period
at 31 December 2008. The minimum cash or loan
note element of these liabilities is £2.8m. Shares
issued under these arrangements will be subject
to contractual trading lock-ins for up to three years
after their issue. The Board retains discretion to pay
a larger proportion of this in the form of loan notes
or cash.
Future earn out commitments including future
acquisition related employee expenses are
therefore expected to be as follows:
Year
Cash/Loan
notes
£m
Shares
£m
Total
£m
2010 1.4 1.1 2.5
2011 0.9 1.8 2.7
2012+ 0.5 0.4 0.9
Total 2.8 3.3 6.1
(continued)Chairman’s Statement

7
The Group incurs a number of non cash P&L
charges, detailed below. Deemed remuneration
of £0.2m (2008: £0.6m) and notional interest of
£0.1m (2008: £0.3m) have both dropped as a
large proportion of related earn outs have been
settled during the year. Impairment charges of
£8.4m, including £5.5m in the first half of the year,
relate to the write down in the carried balance sheet
value of Tangible Financial, SMT, TMI and Oomph
following their reduced performance in 2009, as
well as investment in a small research start-up which
failed to thrive.
2009
£’000
2008
£’000
Headline operating profit 5,943 8,168
Net interest payable (887) (891)
Headline profit before tax 5,056 7,277
Exceptional costs (1,949) (1,285)
Fair value gain/(loss) on
financial instruments
155 (444)
Deemed remuneration (163) (647)
Share option credit – 450
Impairment of investments (207) -
Impairment of intangibles (8,161) -
Amortisation of intangibles (455) (858)
Notional interest (104) (291)
Reported (loss)/profit before tax (5,828) 4,202
The Group examines the above financial indicators
and as such they can be considered to be key
performance indicators.
Divisional Review
Cello (Research)
The strong position of Cello in the international market
research industry enabled the Group to successfully
defend client revenues in a challenging and highly
competitive market. The Group has been able to
demonstrate greater scale and a broader range
of skills and services with clients as it competes for
larger contracts with existing and new clients.
In addition, the Group has continued to consolidate
our operations into shared facilities as leases come
up for renewal, enabling it to create clusters of
professional resource which are both more vibrant
and efficient. As a result of continued consolidation
in the market research sector, it has risen to become
the 6th largest research operation in the UK (2008:
9th), and 19th globally (2008: 21st).
Cello (Research) had a solid year given the
economic context, delivering a headline
operating profit of £5.6m (2008: £6.5m) from
operating income of £36.3m (2008: £37.9m).
With an employee base of 415 (2008: 460) and
revenue of £59.8m (2008: £64.9m), Cello ranks
firmly in the top ten of market research businesses
based in the UK and is the only business which is
not part of a much larger Group.
Operating margins were 15.4% (2008: 17.2%) as a
result of reduced profit performance in its business
intelligence business and in aspects of its public
sector market research activity which has come
under long anticipated pressure. The general hiatus
in market research activity which occurred in the
middle of 2009 has now been replaced by more
normal levels of client activity.

8
Healthcare research has shown particular resilience,
representing approximately 38% of operating
income in this division (2008: 36%). As well as
continued strength in the pharmaceutical core, the
Group has successfully extended into the growing
OTC and brand orientated market for drugs and
therapies, particularly in the USA.
The Group has continued to more closely integrate
its research and consulting capability and achieve
competitive advantage against the much larger
networks with which it is now directly competing.
The Group has also continued to consolidate its
field force and online data capture capacity to
improve utilisation levels and to position itself as
a competitive outsourcing solution for larger
research networks.
The research business has continued to grow
worldwide, with international work now accounting
for 46.4% of divisional activity (2008: 42.3%). The
Group plan to expand its US presence organically
in 2010, building on its successful existing operation
in New York. The Group has appointed Simon
Dannatt as Managing Director, Cello USA. Simon
was previously Chief Executive of Optimisa PLC.
Top clients during the year included GSK, Novartis, HP,
Tesco, EA Games and Nokia. All these clients are long
standing and reflect the first class blue chip nature of
the Group’s client base. Significant new client wins
in 2009 include; Sandoz, Mundipharma, Bupa, Kraft,
Kimberly Clark, L’Oreal, Boden, HP, Cadburys, Coors,
Nestle, Eurostar, Tesco Bank, Swiss Re and Bayer.
Tangible
Tangible (Response) had a more challenging
time than Cello (Research), delivering a headline
operating profit of £1.8m (2008: £3.7m) on
operating income of £24.2m (2008: £27.5m).
Headline operating margins in this business were
7.4% (2008: 13.5%), reflecting the continued
declines in financial services income, as well as a
challenging context for charities related work and
general agency activity in London.
The Edinburgh hub of Tangible had an excellent
year, as did the Cheltenham and London core
operations with their focus on direct marketing with
strong digital capability. The integration of online
capability with more traditional direct marketing
approaches has proved a successful strategy as
clients look to reduce risks. This is expected to put
the business in a good position to capitalise on the
recovery in client activity. The Groups pioneering
carbon footprinting tool for marketers, Footmark, has
successfully established its carbon management
offer with clients such as Unicef, Christian Aid, Lloyds
TSB and Cafod.
The Group continues to invest in developing digital
applications. Our online communities’ proposition,
trading as Face, continued to flourish as part of
the co-creation methodology which underpins our
unique client proposition.
Tangible remains the 6th largest UK direct marketing
company in the UK. Top clients of Tangible include
the Scottish Government, Coors, AGBarr, The Royal
British Legion and the British Heart Foundation.
Significant new client wins in 2009 include; Axiom,
Endsleigh Insurance, Shelter, Oxfam, Christian Aid,
Motability, Sony, HSBC GAM, EBRD, Baillie Gifford,
Platform, Energy Savings Trust, Tesco Bank, Scottish
Enterprise, BBC, Nandos, Which?, BT, Cancer
Research, Save the Children, Clorex, Nokia, Danone,
Aegon and Reckitt Benckiser.
(continued)Chairman’s Statement

9
Current Trading
The Group is optimistic that the higher levels of client
activity, particularly in the research sector, seen in
the last quarter of 2009 and in the early months
of 2010, will continue. Cello has strong revenue
pipelines in Research and Consulting and Tangible
has also seen a marked increase in levels of new
business activity.
At this early stage of the year, with its substantially
lower cost base, improved market position and
strong presence in healthcare research, the Group
is well positioned to benefit from more normal levels
of ongoing client activity and will materially benefit
from any upturn in the UK or internationally.
Allan Rich
Non-Executive Chairman
15 March 2010

10
Cello Research and Consulting
Cello Research and Consulting is now a significant
player in the global market research and advisory
sector, ranked 6th largest in the UK and 19th
globally. It is the only independent agency of this
scale that is not part of a larger holding company.
Cello derives competitive advantage from the
combination of its market research and consultant
capability, which allows it to deliver, clients strategic
direction, based on real world insight.
Our largest area of focus is the healthcare market
which accounts for 38% of divisional revenue.
FMCG, public sector, business to business and
technology applications account for a further 40% of
income. Whilst largely an ad-hoc business, the bulk
of revenues come from long term, blue chip client
relationships. There is an even balance between
quantitative and qualitative work.
We continue to invest in developing digital
applications. Our online communities research offer
through the Face brand has developed strongly.
The year saw good progress in the international
development of the business. International
work now accounts for 46% of divisional
income and we retain a physical presence in New
York, Chicago and San Francisco.
2010 will see continued implementation of a three
year strategy to establish Cello as the leading
research and consulting brand across a number
of identified priority ‘vertical’ industry sectors, most
notably healthcare, consumer products and
technology.
Healthcare: Insight Research Group,
MSI, Leapfrog
• Insight’s New York office experienced sustained
growth where bookings have nearly tripled from
those seen in 2008 and at higher margins than in
previous years.
• The number of online projects continues to rise,
with international work tripling since 2008 (nearly
a fifth of Insight’s business).
• There has been sustained growth and broadening
of our international client base which has risen
from 22 at the end of 2008 to more than 30
different healthcare focused clients in 2009.
• MSI had a strong year and continued to extend its
client base with significant new wins with Sandoz
and Mundipharma.
• MSI Marketing Sciences showed continued
rapid growth and now represents a significant
proportion of MSI business.
• Leapfrog’s health and wellbeing research offer
had a very strong year, with major projects for
GSK, SC Johnson, Kimberly Clark and Bayer.
FMCG and Retail: The Value Engineers, Leapfrog,
2CV, Rosenblatt, TMI
• The Value Engineers continued to perform
strongly in 2009 with new clients including
Advent International, Bupa, Kraft, and the return
of some previous clients such as Heineken and
Dairy Crest.
• Leapfrog continued to build on client relationships
with Carphone Warehouse, Cadbury, SC Johnson,
Bayer, Comic Relief and new clients, including
Kimberly Clark, L’Oreal, Boden, Laithwaites, ABRSM,
McCanns.
• Global business more than doubled, with many
multi-market projects across Australia, America,
the BRIC economies, Japan and Europe.
• 2CV’s focus on international, mission critical
product development and marketing evaluation
enabled it to perform strongly in 2009 with clients
such as COI, TfL and ITV.
• The 2CV US office established itself, winning a
major global tracking study with local technology
giant, HP, and increased activity from EA.
• During 2009 Rosenblatt consolidated its
relationship with Philips, the COI, the BBC and
Mitchells & Butlers, and formed new (or revived)

11
relationships with Cadbury, Coors Brewers, Digital
UK, Millie’s Cookies, Nestle/Cereal Partners, Turner
Broadcasting and Unilever.
• TMI worked with a wide range of clients including
Eurostar, BHS, The Home Office, Harley Medical
Group and the Dorchester Hotels Group.
Public Sector: RS Group, CELLO mruk research
• The RS Group’s public policy team successfully
increased its revenue with projects for both
Government Departments and the NHS.
• CELLO mruk research’s global business more than
doubled behind healthcare activity.
• The number of Government Framework contracts
won during the year increased by around 50%
to 34 contracts including Office of Fair Trading,
Central Office of Information, Competition
Commission, National Archives, Ofcom and the
Welsh Assembly.
Technology: RS Group, SMT, Kudos
• In RS’s core technology and logistics sectors there
were significant commissions from HP, Canon,
Brother and DHL, while its financial services division
delivered major new account wins including
Tesco Bank and Swiss Re.
• Significant investment in online research tools
has allowed the group to successfully market
both on qualitative and quantitative projects to
an increasing proportion of its customer base.
• 2009 saw SMT strengthen and build upon its
position in the utilities sector which contributed
over 50% of SMT’s revenue in 2009.
• Kudos saw an increase in revenue in the
pharma and wellbeing sectors, with health and
environmental strategy studies accounting for
15% of overall revenue in 2009.

12
Tangible Group
In 2009 tangible group made significant steps
toward organising itself into three hubs - London,
Edinburgh and Cheltenham. Shifting businesses into
shared offices reduces property and management
costs but also ensures better cross selling and
more effective use of senior, vocational staff. This
approach has been in place in Edinburgh since
2008, and 2009 saw that hub produce a record
profit and high levels of net profit margin compared
to industry norms. Overall the group’s emphasis
remains on results orientated and customer focused
marketing. Its strength in direct marketing has seen the
group reach 6th place in Marketing’s Direct League
table, making it the largest UK specific group.
The group has a significant client base in Financial
Services, Charities, Public Sector, FMCG/Drinks, Retail
and Utilities. Performance in 2009 was significantly
influenced by the downturn in Financial Services
and Charity marketing although these showed signs
of recovery towards the end of 2009.
tangible group is now organised around three
primary functions within the three hubs – insight,
marketing delivery and production.
Insight
Face, tangible data, Leithal Thinking.
• Face, continued to grow strongly with revenue
up by 50% on 2009 with client wins from Unilever,
Nokia, Clorox, SAB Miller, Danone and Reckitt
Benckiser in the US, Argentina, Mexico, Brazil,
China, Indonesia, Russia and Europe.
• Continued growth of our online communities
offering including the successful launch of
Mindbubble – a co-creation community for
women.
• The data division continues to provide cutting
edge analysis and research solutions and
segmentations, working closely with clients such
as British Gas, Help the Aged, and Business
Stream, as well as with new clients including
Tesco Bank, Which?, BT, Cancer Research UK,
Kidney Research UK, Save the Children.
• Clients such as VW/SEAT, Energy Saving Trust and
Calor continue to use Magellan, the proprietary
online marketing platform which supports on and
offline campaigns.
• The Leithal Thinking brand consultancy broke the
£1 million revenue mark with a number of wins
including Scottish Wildlife Trust, Kasteel Cru and
Historic Scotland.
Marketing Delivery
tangible, Leith, Farm, Blonde, Stripe
• Tangible’s increased emphasis on strategic
communications planning produced significant
new clients wins including Oxfam, Shelter,
Christian Aid (Present Aid), Beatson and Motability
in Charities, COI Energy Savings Trust, Scottish
Development International, Consumer Focus
Scotland, and Glasgow University roster in Public
Sector.
• Significant new financial client wins in 2009
included Tesco Bank, HSBC Global Asset
Management, European Bank for Reconstruction
and Development, Baillie Gifford and Platform.
• Tangible was awarded several industry awards
including a DMA award for Business to Consumer
Direct Marketing, a Silver for the Best Use of Direct
Mail in the Cream Awards and the Institute of
Fundraising Award for the Best use of Direct Mail.
• Tangible also received awards recognition from
Money Marketing – 2 x gold, 2 x silver and 1 x
bronze, and the Financial Services Forum (Most
Effective New Product, Service or Innovation –
MGM and tangible).

13
• 2009 saw a record operating profit performance
for Leith, driven by strong incremental growth in
existing clients and a number of new business
wins, predominantly in the public sector
(including Scottish Enterprise, See Me, Scottish
Natural Heritage and The Public Health Agency
for Northern Ireland).
• Farm strengthened its position on the Nestle
roster with wins from both the Confectionery and
Beverages divisions, as well as major projects with
the BBC, Nandos and Last Minute.com.
• New clients for Blonde included Nokia, Lloyds TSB,
Bank of Scotland Corporate, Rice Dream, Harrison
Parrot, SCO, Creative Scotland and AEGON.
• Stripe PR crowned a year of significant growth by
being awarded the IPR’s PR consultancy of the
year. They also cemented their position on the
Scottish Government roster with briefs for Alcohol
Awareness and Community and Road Safety.
Production
Brightsource, Magnetic
• Brightsource extended its track record of profit
growth for the 8th successive year. All top 15
clients increased their spend, compared with
2008, a reflection of the widening portfolio of
services. New clients for 2009 included Axiom,
Endsleigh Insurance and Shelter.
• Brightsource’s pioneering carbon footprinting
tool, Footmark, has successfully established the
carbon management offer with leading clients
such as Unicef, Christian Aid, Lloyds TSB, and
Cafod.
• Magnetic launched two new products – Standout
Covers and Proxi packs – the latter has been
picked up by Sony for worldwide use in their
Playstation 3 point of sale.

14
The directors present their report and the financial
statements of Cello Group plc for the year to 31
December 2009. To the best of their knowledge
the Directors’ Report includes a fair view of the
business and position of the Group, together with
a description of the principal risks and uncertainties
faced by the Group.
Principal Activities
The principal activity of the Group during the year
under review is that of research, consulting and
direct marketing.
Review of the Business and Future Developments
The results for the year ended 31 December 2009
are set out in the Group income statement on
pages 24 and 25. These show a loss attributable
to shareholders of £6,359,000. An interim dividend
of 0.50p per share was paid during the year and a
final dividend of 0.80p per share is proposed.
A review of the development and future prospects
of the business is given in the Chairman’s Statement
on pages 4 to 9. Key performance indicators are
also commented on within the Financial Review
section of the Chairman’s Statement.
Company law requires the Company to report on
principal risks and uncertainties facing the business,
which the directors believe to be as follows:
1. UK economy
The Group’s business is domiciled in the UK but 22%
of the Group’s revenues are from clients based
overseas. It is clear that the current economic
downturn has adversely affected the Group and
there is a risk that further economic downturn in
any of our markets will have an additional affect.
However, the mix of services we are offering is
proving resilient as the economy stabilises.
2. Loss of the Group’s key clients
Client relationships are crucial to the Group, and
the strength of them is key to its continued success.
The risk is mitigated by our client base being broadly
spread, but the loss of any large client would
require replacement. The Group’s client review
programmes help mitigate this risk.
3. Loss of key staff
The Group’s directors and staff are critical to the
servicing of existing business and the winning of new
accounts, departure of key staff could be a risk to
maintaining client service. With that risk in mind all
senior staff are subject to financial lock-ins and long-
term incentive arrangements, as well as being under
contractual non-compete and non-solicit clauses.
Directors
The following directors have held office since
1 January 2009:
Mark Scott
Mark Bentley
Paul Hamilton
Will David
Allan Rich
Chris Outram
Biographical details of the directors at the date of
this report are set out on pages 84 to 85.
Directors’ Report

15
Directors’ Interests in Shares and Options
Directors’ interests in the shares of the Company were as follows:
Number of ordinary
shares of 10p each
At 31 December 2009
Number of ordinary
shares of 10p each
At 31 December 2008
Mark Scott 724,010 714,010
Mark Bentley 15,000 15,000
Paul Hamilton 50,000 50,000
Will David 15,000 15,000
Allan Rich 444,595 415,184
Chris Outram 83,782 48,705
Under the rules of the Enterprise Management Incentive Scheme and the Unapproved Share Option
Scheme, the Executive Directors have been granted an interest in options over ordinary shares of 10p
each as follows:
At 1 January
2009 number of
ordinary shares of
10p each
Granted
in the year number of
ordinary shares of
10p each
Lapsed in
the year number of
ordinary shares of
10p each
At 31 December
2009 number of
ordinary shares of
10p each
Date from which
exercisable
Expiry date
Exercise price
(pence)
Mark Scott (1) 100,000 – – 100,000 Nov 2004 Nov 2014 100
Mark Scott (2) 200,000 – – 200,000 Nov 2004 Nov 2014 100
Mark Bentley (1) 81,633 – – 81,633 Jun 2008 Jun 2015 122.5
Mark Bentley (2) 81,633 – – 81,633 Jun 2008 Jun 2015 122.5
(1) Granted under the EMI Share Option Scheme
(2) Granted under the Unapproved Share Option Scheme
None of the options that have been granted were exercised in the year.

16
Share Capital
Changes to the Company’s share capital during
the year are given in note 22 to the consolidated
financial statements.
Treasury Shares
During the year the Company purchased 157,000
(0.29% of the issued share capital) ordinary shares
of 10p each for a total consideration of £53,000.
The total number of shares in treasury at 31
December 2009 was 237,000 (0.40% of the issued
share capital). The purpose of the acquisition was
to satisfy future earn out payments and/or option
awards.
Statement of Directors’ Responsibilities
The directors are responsible for preparing the
Directors’ Report and the financial statements in
accordance with applicable law and regulations.
Company law requires the directors to prepare
group and company financial statements for each
financial year. The directors are required by the AIM
rules of the London Stock Exchange to prepare
group financial statements in accordance with
International Financial Reporting Standards (“IFRS”)
as adopted by the European Union (“EU”) and
have elected under company law to prepare the
company financial statements in accordance with
United Kingdom Generally accepted Accounting
Practice (United Kingdom Accounting Standards
and applicable law).
The Group financial statements are required by law
and IFRS as adopted by the EU to present fairly the
financial position and performance of the Group,
the Companies Act 2006 provides in relation to
such financial statements that references in the
relevant part of that Act to financial statements
giving a true and fair view are references to their
achieving a fair presentation.
Under company law the directors must not approve
the financial statements unless they are satisfied
that they give a true and fair view of the state of
affairs of the Group and the Company and of the
profit or loss of the Group for that period.
In preparing each of the Group and Company
financial statements, the directors are required to:
a. Select suitable accounting policies and then
apply them consistently;
b. Make judgements and estimates that are
reasonable and prudent;
c. For the Group financial statements, state whether
they have been prepared in accordance with
IFRSs adopted by the EU; and for the Company
financial statements state whether applicable
UK accounting standards have been followed,
subject to any material departures disclosed and
explained in the Company financial statements;
d. Prepare the financial statements on the going
concern basis unless it is inappropriate to
presume that the Group and the Company will
continue in business.
Directors’ Report (continued)
Substantial Shareholdings
Other than the directors’ interests disclosed above, the Company is aware of the following shareholdings
of 3% or more in the issued share capital at 28 February 2010:
No. of shares %
Octopus Asset Management Limited 5,200,290 8.85
Richard Gilmore 3,214,144 5.47
Universities Superannuation Scheme 2,047,000 3.48
Paul Walton 1,869,680 3.18

17
The directors are responsible for keeping adequate
accounting records that are sufficient to show and
explain the Group’s and the Company’s transactions
and disclose with reasonable accuracy at any time
the financial position of the Company and enable
them to ensure that the financial statements
comply with the Companies Act 2006. They are
also responsible for safeguarding the assets of the
Group and hence for taking reasonable steps for
the prevention and detection of fraud and other
irregularities.
The directors are responsible for the maintenance and
integrity of the corporate and financial information
included on the Cello Group plc website.
Legislation in the United Kingdom governing
the preparation and dissemination of financial
statements may differ from legislation in other
jurisdictions.
Employees
It is the Company’s policy not to discriminate
between employees or potential employees on
any grounds. Full and fair consideration is given to
the recruitment, training and promotion of disabled
people and, should staff become disabled
during the course of their employment, efforts
are made to provide appropriate re-training. The
Company places enormous importance on the
contributions of its employees and aims to keep
them informed of developments in the Company
through a combination of meetings and electronic
communication.
Political and Charitable Contributions
During the year the Company made no political or
charitable donations.
Directors Third Party Indemnity Provisions
A qualifying Third Party Indemnity Provision was in
place for directors throughout the year.
Policy on Payment to Creditors
The Company agrees the terms and conditions
under which business transactions with suppliers are
conducted. It complies with these payment terms,
provided that it is satisfied that the supplier has
provided the goods or services in accordance with
agreed terms and conditions.
The effect of the Company’s payment policy is that
its trade creditors at the year end represent 48 days
(2008: 43 days).
Research and Development Activities
During the year the Group spent £141,000 (2008:
£119,000) on the development of new software
products which are expected to generate
economic benefits in the future. These amounts
were capitalised as intangible assets.
Statement as to Disclosure of Information to the
Auditors
The directors who were in office on the date of
approval of these financial statements have
confirmed that, as far as they are aware, there is
no relevant audit information of which the auditors
are unaware. Each of the directors has confirmed
that he, as far as he is aware, has taken all the
steps that he ought to have taken as a director
in order to make himself aware of any relevant
audit information and to establish that it has been
communicated to the auditor.
Auditors
A resolution to re-appoint Baker Tilly UK Audit LLP,
Chartered Accountants, as auditors will be proposed
at the forthcoming Annual General Meeting.
By order of the Board
Mark Bentley
Company Secretary
15 March 2010

18
Corporate Governance
The Board of Cello Group plc appreciates the value
of good corporate governance not only in the areas
of accountability and risk management but also as
a positive contribution to the business. The Board
considers that the Company, whilst trading on the
AIM Market, has adopted those requirements of the
Combined Code on Corporate Governance (the
“Code”) published in June 2006 as best applicable
to the Company given its current size.
Board Structure
The Board comprises two executive directors and
four non-executive directors. The roles of Chairman
and Chief Executive are separate. The Non-Executive
Directors are independent of management and
free from any business or other relationship with the
Company other than owning shares. The directors’
biographies appear on pages 84 to 85.
The Board is scheduled to meet at least six times
a year and additionally when necessary. At each
scheduled meeting of the Board, the Chief
Executive and Finance Director report on the
Group’s operations. The Board is satisfied that it is
provided with information in an appropriate form
and quality to enable it to discharge its duties. All
directors are subject to re-election by shareholders
at the first opportunity after their appointment. All
directors are required to retire by rotation and one
third of the Board is required to seek re-election
each year. The Chairman ensures that the directors
are permitted to take independent professional
advice as required.
All directors have access to the advice and services
of the Company Secretary, who is responsible to
the Board for ensuring that Board procedures are
followed and that applicable rules and regulations
are complied with.
The following committees of the Board have been
established to deal with specific aspects of the
Company’s affairs.
Audit Committee
The Audit Committee consists of three Non-Executive
Directors; Will David as Chairman, Paul Hamilton
and Allan Rich. The Committee considers matters
relating to the financial accounting controls, the
reporting of results, and the effectiveness and cost
of the audit. It aims to meet at least twice a year
with the Company’s auditors in attendance. Other
directors attend as required. The Company Secretary
provides secretarial support to the Committee. The
terms of reference of the Committee are available
on request.
In considering the effectiveness of the audit the
Audit Committee will also, where appropriate,
consider whether any flexibility over rotation of the
audit partner is appropriate in order to safeguard
the quality of the audit.
The Audit Committee is satisfied that the Group’s
auditors, Baker Tilly UK Audit LLP, have been objective
and independent of the Group. Associate firms of
Baker Tilly UK Audit LLP perform non-audit services for
the Group, but the Audit Committee is satisfied that
their objectivity is not impaired by such work.
Nomination Committee
The Nomination Committee consists of two
independent Non-Executive Directors; Paul
Hamilton and Will David. The Committee is chaired
by Paul Hamilton and meets as necessary. The
Committee is formally constituted with written terms
of reference and is responsible for reviewing and
making proposals to the Board on the appointment
of directors. The Company Secretary provides
secretarial support to the Committee. The terms
of reference of the Nominations Committee are
available on request.
Remuneration Committee
The Remuneration Committee is formally
constituted with written terms of reference and
makes recommendations to the Board with regard
to remuneration policy and related matters. The
Remuneration Committee consists solely of three
of the Independent Non-Executive Directors, Paul
Hamilton, who chairs the committee, Will David and
Chris Outram. However, the Chairman and the Chief
Executive attend as required and have the right to
address the Committee. The Committee aims to

19
meet at least twice a year. The terms of reference
of the Committee are available on request.
Further details of the Company’s policies on
remuneration, including details of directors’ share
options are given in the Report of the Remuneration
Committee on pages 20 to 22.
Shareholder Communications
The Company believes in maintaining good
communications with shareholders. The Chief
Executive and Finance Director meet analysts
and institutional shareholders regularly with a view
to ensuring that the strategies and objectives of
the Company are well understood. The Senior
Independent Director will not ordinarily attend
such meetings other than at the request of the
relevant shareholder. However, he is available to
shareholders if they have concerns which contact
through the Chairman, Chief Executive or the
Finance Director has failed to resolve or for which
such contact is inappropriate.
Going Concern
The directors have satisfied themselves that the
Company and Group have adequate resources to
continue in operational existence for the foreseeable
future, and for this reason the financial statements
continue to be prepared on a going concern basis.
Internal Control
The Board is responsible for ensuring that the
Group maintains a system of internal controls and
risk management, including suitable monitoring
procedures. The objective of the system is to
safeguard Group assets, ensure proper accounting
records are maintained and that the financial
information used within the business and for
publication is reliable. Any such system can only
provide reasonable, but not absolute, assurance
against material misstatement or loss.
Given the Group’s size and the nature of its business,
the Board does not consider it would be appropriate
to have its own internal audit function. An internal
audit function will be established as and when the
Group is of an appropriate size but meanwhile the
audit of internal financial controls forms part of the
responsibilities of the Group’s finance function.
All the day-to-day operational decisions are taken
initially by the executive directors or subsidiary
directors, in accordance with the Group’s strategy.
Where appropriate, the Board or subsidiary
directors approve such decisions. The executive or
subsidiary directors are also responsible for initiating
all transactions and authorising all payments, save
for those relating to their employment. As such, the
internal controls primarily comprise:
• the segregation of duties, such that the executive
directors have no involvement in the recording
of any financial data;
• the review of pertinent financial and other
information by the Board on a regular basis;
• the prior approval of all significant strategic
decisions;
• having a formal strategy for business activities.
The Environment
The activities of the Group do not have a high impact
on the environment. However, we aim to ensure that
where waste can be reduced, this is done efficiently,
by employing recycling where viable.
Employees
The Group employs nearly 800 employees, and we
place a great deal of emphasis on their training
and retention. Our central programme for rising
talent, “Cello Academy”, is now a well established
feature of our staff development initiatives.
On behalf of the Board
Mark Bentley
Company Secretary
15 March 2010

20
The directors have applied the principles of good
governance relating to directors’ remuneration as
described below:
Remuneration Committee
The Remuneration Committee is authorised on
behalf of the Board to determine the Company’s
remuneration policy on executive directors’
remuneration, including pension rights and share
option awards, and the terms of their service
contracts. The Committee aims to meet at least
twice a year and supervises the operation of share
schemes and other employee incentive schemes.
The remuneration and terms and conditions of
appointment of the Non-Executive Directors will
be set by the Board. No director shall participate
in discussions relating to his own remuneration.
The Remuneration Committee consists of three
of the independent Non-Executive Directors, Paul
Hamilton who chairs the committee, Will David and
Chris Outram.
Remuneration Policy
The policy of the Board is to provide executive
remuneration packages designed to attract,
motivate and retain directors of the calibre
necessary to maintain the Group’s position as a
market leader and to reward them for enhancing
shareholder value and return on investment. The
remuneration should also reflect the directors’
responsibilities and contain incentives to deliver the
Group’s objectives.
The main elements of the executive directors’
remuneration packages are as follows:
• basic salary;
• performance-related bonus – 50% of an
executive director’s bonus is based on earnings
per share growth targets set by the Remuneration
Committee at the beginning of the financial
year. The remaining 50% is paid at the discretion
of the Remuneration Committee;
• benefit package – car allowance and health
care insurance;
• share option incentives – details of share options
granted to the executive directors are shown on
page 15;
• contributions to directors’ individual defined
contribution pension schemes.
The Remuneration Committee reviews the
components of each executive director’s
remuneration package annually.
Report of the Remuneration Committee
Directors’ Remuneration
Salary/ Fees
£’000
Bonus £’000
Benefits
£’000
Total Emoluments
£’000
Pension
£’000
Total 2009 £’000
Total 2008 £’000
Kevin Steeds* – – – – – – 233
Mark Scott 195 45 9 249 29 278 296
Mark Bentley 145 28 6 179 22 201 204
Allan Rich 47 – – 47 – 47 25
Paul Hamilton 28 – – 28 – 28 30
Will David 25 – – 25 – 25 25
Chris Outram 23 – – 23 – 23 25
Total 463 73 15 551 51 602 838
*Deceased on 17 December 2008

21
Long Term Incentive Arrangements
In 2004, the Company established an EMI Share
Option plan to allow selected employees to share
in the success of the Group and promote motivation
and retention through the award of tax efficient
share options.
A summary of all the share option awards to directors
can be found in the directors’ report on page 15.
In 2004, the Company also established an
Unapproved Share Option plan for those individuals
not eligible to participate under the EMI Share Option
plan and for the award of additional options to the
recipients of awards under the EMI Share Option plan.
Vesting of the share options awarded to Mark Scott
in November 2004 under the EMI and Unapproved
Share Option Plans is not subject to performance
conditions but vesting of the share options granted
to Mark Bentley in June 2005 under these plans was
subject to performance conditions which have
been met.
On 13 March 2006 the Board adopted the Cello
Group plc Performance Share Plan 2006 (“PSP”).
However, no awards since made under the PSP
are now capable of vesting and the Remuneration
Committee has decided to make no further awards
under the PSP. To replace the PSP the Board has
adopted two new share option plans and a Joint
Ownership Share plan.
On 17 November 2009 the Board adopted the
Cello Group plc HM Revenue & Customs Approved
Share Option Plan 2009 (the “Approved Plan”) and
on 15 March 2010 adopted the Cello Group plc
Unapproved Option Plan 2010 (the “Unapproved
Plan”).
Under the Approved Plan and the Unapproved Plan
(the “Option Plans”) awards of options over shares
with a market value of no more than 150% of basic
salary may be made to any one individual in any
financial year. A higher percentage may be granted
in exceptional circumstances, as determined by the
Remuneration Committee. It is not currently intended
that main board directors will participate in the
Option Plans.
Options will generally be exercisable three years, but
not later than ten years, after the date of grant subject
to the extent to which performance conditions have
been achieved over the initial three year period after
the award is made and subject to the participant’s
continued employment with the Group.
Performance conditions will be tailored to each
participant according to his or her seniority and
responsibilities and will be based on performance
as measured against an appropriate combination
of Company, Division and Group targets and the
extent to which these are achieved or exceeded
over the performance period will determine the
proportion of each participant’s options which vest.
The Committee will review the Option Plans on a
regular basis and may amend the performance
conditions from time to time.
The Board are in the process of finalising a Joint
Ownership Share Plan 2010 (“JOSP”) under which it
is intended that awards will be made to the Group’s
most senior employees, including main board
executive directors.
Name Title Date of Appointment Notice period
Allan Rich Non-Executive Chairman 5 April 2005 3 months
Mark Scott Chief Executive 5 May 2004 12 months
Mark Bentley Finance Director 1 May 2005 12 months
Paul Hamilton Senior Non-Executive Director 8 October 2004 6 months
Will David Non-Executive Director 8 October 2004 6 months
Chris Outram Non-Executive Director 1 July 2007 3 months
22
Report of the Remuneration Committee (continued)
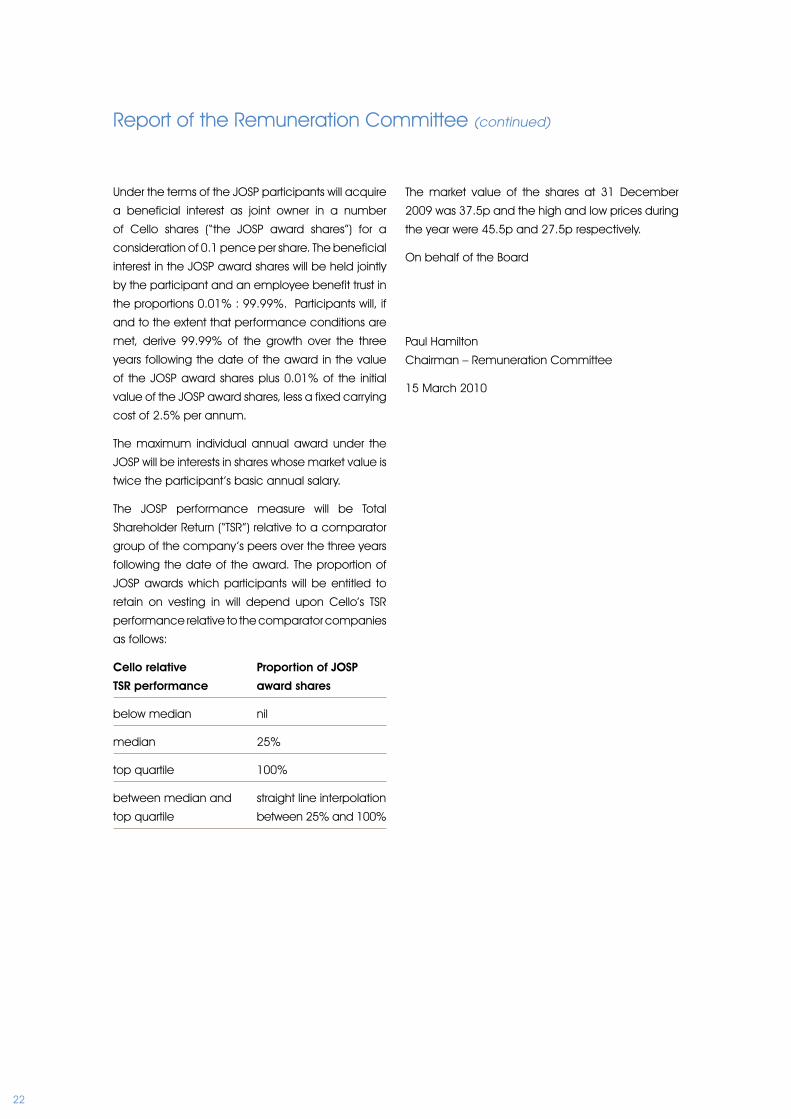
Under the terms of the JOSP participants will acquire
a beneficial interest as joint owner in a number
of Cello shares (“the JOSP award shares”) for a
consideration of 0.1 pence per share. The beneficial
interest in the JOSP award shares will be held jointly
by the participant and an employee benefit trust in
the proportions 0.01% : 99.99%. Participants will, if
and to the extent that performance conditions are
met, derive 99.99% of the growth over the three
years following the date of the award in the value
of the JOSP award shares plus 0.01% of the initial
value of the JOSP award shares, less a fixed carrying
cost of 2.5% per annum.
The maximum individual annual award under the
JOSP will be interests in shares whose market value is
twice the participant’s basic annual salary.
The JOSP performance measure will be Total
Shareholder Return (“TSR”) relative to a comparator
group of the company’s peers over the three years
following the date of the award. The proportion of
JOSP awards which participants will be entitled to
retain on vesting in will depend upon Cello’s TSR
performance relative to the comparator companies
as follows:
Cello relative Proportion of JOSP
TSR performance award shares
below median nil
median 25%
top quartile 100%
between median and straight line interpolation
top quartile between 25% and 100%
The market value of the shares at 31 December
2009 was 37.5p and the high and low prices during
the year were 45.5p and 27.5p respectively.
On behalf of the Board
Paul Hamilton
Chairman – Remuneration Committee
15 March 2010

23
We have audited the Group and parent company
financial statements (“the financial statements”) on
pages 24 to 77. The financial reporting framework
that has been applied in the preparation of the
Group financial statements is applicable law and
International Financial Reporting Standards (IFRSs)
as adopted by the European Union. The financial
reporting framework that has been applied in
the preparation of the parent company financial
statements is applicable law and United Kingdom
Accounting Standards (United Kingdom Generally
Accepted Accounting Practice).
This report is made solely to the company’s
members, as a body, in accordance with Chapter
3 of Part 16 of the Companies Act 2006. Our audit
work has been undertaken so that we might state
to the company’s members those matters we are
required to state to them in an auditor’s report and
for no other purpose. To the fullest extent permitted
by law, we do not accept or assume responsibility
to anyone other than the company and the
company’s members as a body, for our audit work,
for this report, or for the opinions we have formed.
Respective responsibilities of directors and
auditor
As more fully explained in the Statement of Directors’
Responsibilities, the directors are responsible for
the preparation of the financial statements and
for being satisfied that they give a true and fair
view. Our responsibility is to audit the financial
statements in accordance with applicable law and
International Standards on Auditing (UK and Ireland).
Those standards require us to comply with the
Auditing Practices Board’s (APB’s) Ethical Standards
for Auditors.
Scope of the audit of the financial statements
A description of the scope of an audit of financial
statements is provided on the APB’s website at
www.frc.org.uk/apb.scope/UKNP.
Opinion on the financial statements
In our opinion:
• the financial statements give a true and fair view
of the state of the Group’s and of the parent
company’s affairs as at 31 December 2009 and
of the Group’s loss for the year then ended;
• the Group financial statements have been
properly prepared in accordance with IFRSs as
adopted by the European Union;
• the parent company financial statements have
been properly prepared in accordance with
United Kingdom Generally Accepted Accounting
Practice; and
• the financial statements have been prepared
in accordance with the requirements of the
Companies Act 2006.
Opinion on other matters prescribed by the
Companies Act 2006
In our opinion the information given in the Directors’
Report for the financial year for which the financial
statements are prepared is consistent with the
financial statements.
Matters on which we are required to report
by exception
We have nothing to report in respect of the following
matters where the Companies Act 2006 requires us
to report to you if, in our opinion:
• adequate accounting records have not
been kept by the parent company, or returns
adequate for our audit have not been received
from branches not visited by us; or
• the parent company financial statements are
not in agreement with the accounting records
and returns; or
• certain disclosures of directors’ remuneration
specified by law are not made; or
• we have not received all the information and
explanations we require for our audit.
DAVID FENTON (Senior Statutory Auditor)
For and on behalf of
BAKER TILLY UK AUDIT LLP
Statutory Auditor
Chartered Accountants
2 Bloomsbury Street
London WC1B 3ST
15 March 2010
Independent Auditors’ Reportto the members of Cello Group plc

24
Consolidated Income Statement for the year ended 31 December 2009
Notes
Year ended 31 December 2009
£’000
Year ended 31 December 2008
£’000
Continuing operations
Revenue
Cost of sales
1 126,660
(66,201)
137,630
(72,269)
Operating income
Administration expenses
1
3a
60,459
(54,516)
65,361
(57,193)
Headline operating profit
Exceptional items
Amortisation of intangible assets
Acquisition related employee expenses
Share option credit
1
3a
10
18
23
5,943
(1,949)
(455)
(163)
–
8,168
(1,285)
(858)
(647)
450
Operating profit before impairment charges
Impairment of intangible assets
Impairment of goodwill
Impairment of available-for-sale investments
1
10
9
12
3,376
(778)
(7,383)
(207)
5,828
–
–
–
Operating (loss)/profit
Finance income
Finance cost of deferred consideration
Fair value gain/(loss) on derivative financial instruments
Other finance costs
3a
2
2
2
2
(4,992)
69
(104)
155
(956)
5,828
243
(291)
(444)
(1,134)
(Loss)/profit on continuing operations before taxation
Tax 5
(5,828)
(239)
4,202
(1,015)
(Loss)/profit on continuing operations after taxation
Loss from discontinued operations 6
(6,067)
(253)
3,187
(386)
(Loss)/profit for the year (6,320) 2,801
Attributable to:
Owners of the parent
Minority interest
(6,359)
39
2,761
40
(6,320) 2,801

25
Consolidated Income Statement (continued) for the year ended 31 December 2009
Notes
Year ended 31 December 2009
£’000
Year ended 31 December 2008
£’000
Basic (loss)/earnings per share
From continuing operations
From discontinued operations
8
8
(11.26)p
(0.47)p
7.35p
(0.90)p
(11.73)p 6.45p
Diluted (loss)/earnings per shareFrom continuing operationsFrom discontinued operations
88
(11.26)p(0.47)p
5.55p(0.68)p
(11.73)p 4.87p
Consolidated Statement of Comprehensive Income for the year ended 31 December 2009
Year ended 31 December 2009
£’000
Year ended 31 December 2008
£’000
(Loss)/profit for the year (6,320) 2,801
Other comprehensive income:
Exchange differences on translation of foreign operations
Deferred tax recognised direct in equity
12
–
(47)
222
Total other comprehensive income for the year 12 175
Total comprehensive income for the year (6,308) 2,976

26
Consolidated Balance Sheet 31 December 2009
Notes
31 December 2009 £’000
31 December 2008 £’000
Goodwill
Intangible assets
Property, plant and equipment
Available-for-sale investments
Deferred tax assets
9
10
11
12
21
67,926
1,174
2,515
20
962
76,291
2,266
3,103
227
1,080
Non-current assets
Trade and other receivables
Cash and cash equivalents
14
14
72,597
25,711
3,135
82,967
26,658
5,065
Current assets 28,846 31,723
Trade and other payables
Current tax liabilities
Borrowings
Consideration payable in respect of acquisitions
Obligations under finance leases
Derivative financial instruments
15
16
18
19
20
(25,419)
(568)
(14,529)
(2,472)
(68)
(289)
(26,633)
(708)
(1,053)
(7,980)
(68)
–
Current liabilities (43,345) (36,442)
Net current liabilities (14,499) (4,719)
Total assets less current liabilities
Borrowings
Provisions
Obligations under finance leases
Derivative financial instruments
Deferred tax liabilities
16
17
19
20
21
58,098
–
(3,315)
(65)
–
(292)
78,248
(13,750)
(6,453)
(86)
(444)
(616)
Non-current liabilities (3,672) (21,349)
Net assets 54,426 56,899
Equity
Share capital
Share premium
Retained earnings
Capital redemption reserve
Merger reserve
Share-based payment reserve
Foreign currency reserve
22 5,876
34,945
2,904
50
10,496
73
(35)
4,456
31,745
10,048
50
10,496
73
(47)
Equity attributable to equity holders of parent
Minority interest
54,309
117
56,821
78
Total equity 54,426 56,899
Approved and authorised for issue by the Board on 15 March 2010 and signed on its behalf by
Mark Scott Director
Mark Bentley Director

27
Consolidated Cash Flow Statement for the year ended 31 December 2009
Notes
Year ended 31 December
2009 £’000
Year ended 31 December
2008 £’000
Net cash inflow from operating activities before
taxation
Tax paid
24a 5,198
(591)
9,682
(1,911)
Net cash inflow from operating activities after taxation 4,607 7,771
Investing activities
Interest received
Purchase of property, plant and equipment
Sale of property, plant and equipment
Expenditure on intangible assets
Deferred consideration paid for subsidiary undertakings
69
(699)
39
(141)
(1,478)
243
(1,119)
66
(119)
(3,636)
Net cash outflow from investing activities (2,210) (4,565)
Financing activities
Dividends paid to equity holders of the parent
Repayment of borrowings
Repayment of loan notes
Drawdown of borrowings
Capital element of finance lease payments
Payment of finance lease interest
Interest paid
Purchase of own shares
(733)
(3,000)
(2,187)
2,600
(21)
(21)
(935)
(52)
(556)
(8,050)
(5,211)
10,050
(90)
(21)
(1,105)
(71)
Net cash outflow from financing (4,349) (5,054)
Movements in cash and cash equivalents
Net decrease in cash and cash equivalents
Exchange gains/(losses) on cash and bank overdrafts
Cash and cash equivalents at the beginning of the year
(1,952)
22
5,065
(1,848)
(73)
6,986
Cash and cash equivalents at end of the year 24b 3,135 5,065

28
Consolidated Statement of Changes in Equity for the year ended 31 December 2009
Share Capital
£’000
Share Premium
£’000
Capital Redemption
Reserve £’000
Merger Reserve
£’000
Share-based
Payment Reserve
£’000
Foreign Currency
Exchange Reserve
£’000
Retained Earnings
£’000
Total Attributable
to Owners of the Parent
£’000
Minority Interest
£’000
Total Equity £’000
At 1 January 2008 3,884 25,776 50 10,496 523 – 7,692 48,421 38 48,459
Profit for the year – – – – – – 2,761 2,761 40 2,801
Other comprehensive
income:
Currency translation
Deferred tax recognised
direct in equity
–
–
–
–
–
–
–
–
–
–
(47)
–
–
222
(47)
222
–
–
(47)
222
Total other comprehensive
income for the year
–
–
–
– – (47) 222 175 – 175
Total comprehensive income
for the year – – – – – (47) 2,983 2,936 40 2,976
Transactions with owners:
Shares issued
Own shares purchased
Debit for share-based
incentive schemes
Dividends
572
–
–
–
5,969
–
–
–
–
–
–
–
–
–
–
–
–
–
(450)
–
–
–
–
–
–
(71)
–
(556)
6,541
(71)
(450)
(556)
–
–
–
–
6,541
(71)
(450)
(556)
Total transactions with owners 572 5,969 – – (450) – (627) 5,464 – 5,464
At 1 January 2009 4,456 31,745 50 10,496 73 (47) 10,048 56,821 78 56,899
Loss for the year – – – – – – (6,359) (6,359) 39 (6,320)
Other comprehensive
income:
Currency translation – – – – – 12 – 12 – 12
Total comprehensive income
for the year
–
–
–
– – 12 (6,359) (6,347) 39 (6,308)
Transactions with owners:
Shares issued
Own shares purchased
Dividends
1,420
–
–
3,200
–
–
–
–
–
–
–
–
–
–
–
–
–
–
–
(52)
(733)
4,620
(52)
(733)
–
–
–
4,620
(52)
(733)
Total transactions with
owners 1,420 3,200 – – – – (785) 3,835 – 3,835
As at 31 December 2009 5,876 34,945 50 10,496 73 (35) 2,904 54,309 117 54,426
The merger reserve was created as a result of the placing of shares on 4 November 2004.
The capital redemption reserve arose from the purchase and cancellation of own share capital.

29
GENERAL INFORMATION
Cello Group plc is a company incorporated in the United Kingdom under the Companies Act 1985. The
Group’s operations consist principally of research, consulting and direct marketing.
These financial statements are presented in pounds sterling as this is the currency of the primary economic
environment in which the Group operates.
At the date of authorisation of these financial statements, the following standards and interpretations, which
are issued but not yet effective, have not been applied:
Effective for reporting
periods starting on or after
IFRIC 9 Reassessment of Embedded Derivatives – Amendment;
Embedded Derivatives
30 June 2009
IFRIC 14 Amendments – Prepayments of a Minimum Funding
Requirement
1 January 2011
IFRIC 17 Distributions of Non-cash Assets to Owners 1 July 2009
IFRIC 18 Transfers of Assets from Customers 1 July 2009
IFRIC 19 Extinguishing Financial Liabilities with Equity Instruments 1 July 2010
Amendments to IFRSs arising from Annual Improvements Projects
Effective for reporting
periods starting on or after
IFRS 2 Share-based Payment 1 July 2009
IFRS 5 Non-current Assets Held for Sale and Discontinued
Operations
1 January 2010
IFRS 6 Exploration for and Evaluation of Mineral Resources
(consequential amendments from IAS 7)
1 January 2010
IFRS 8 Operating Segments 1 January 2010
IAS 1 Presentation of Financial Statements 1 January 2010
IAS 7 Statement of Cash Flows 1 January 2010
IAS 17 Leases 1 January 2010
IAS 36 Impairment of Assets 1 January 2010
IAS 38 Intangible Assets 1 July 2009
IAS 39 Financial Instruments: Recognition and Measurement 1 January 2010
IFRIC 9 Reassessment of Embedded Derivatives 1 July 2009
IFRIC 16 Hedges of a Net Investment in a Foreign Operation 1 July 2009
The directors anticipate that the adoption of these Standards and Interpretations as appropriate in future
periods will have no material impact on the financial statements of the Group when the relevant standards
come into effect for periods commencing after 1 January 2010.
Consolidated Financial Statements – Accounting Policies

30
SIGNIFICANT ACCOUNTING POLICIES
(1) Basis of accounting
The consolidated financial statements have been
prepared under the historical cost convention, as
modified by the revaluation of available-for-sale
investments and financial assets and liabilities
(including derivative instruments) at fair value
through profit and loss. The consolidated financial
statements have been prepared in accordance
with applicable International Financial Reporting
Standards as adopted by the European Union
(IFRS).
In preparing the consolidated financial statements
the Group has adopted the exemption in IFRS 1
not to restate business combinations prior to 1
December 2005.
The Group’s business activities, performance and
position are set out in the Chairman’s Statement
on pages 4 to 9 and an assessment of the risks
and uncertainties is set out in the Directors’ Report
on pages 14 to 17.
During the year the Group incurred a loss before
tax of £5.8m, although excluding non-recurring
exceptional costs and non-cash charges the
Group made a profit of £5.1m.
The Group had net current liabilities of £14.5m at
31 December 2009. This is due to the inclusion
in current liabilities of the borrowings under the
Group’s debt facilities, which were due to expire
on 31 December 2010, together with certain
earn out liabilities. Since the year end the Group
has entered into new debt facilities which total
£19.0m. £2.0m of these facilities are repayable
on 31 December 2010.
After reviewing the Group’s performance and
forecast future cashflows, the directors consider
the Group has adequate resources to continue in
operational existence for the foreseeable future.
The Group therefore continues to adopt the going
concern basis in preparing the Group’s Financial
Statements.
(2) Basis of consolidation
The Group’s financial statements consolidate the
financial statements of the Company and all of
its subsidiary undertakings. The results of subsidiary
undertakings acquired in the year are included in the
consolidated income statement from the effective
date of acquisition. On acquisition of a business all
of the assets and liabilities of that business that exist
at the date of acquisition are recorded at fair value.
Minority interests represent the portion of profit and or
loss and net assets in subsidiaries that is not held by
the Group and is presented separately from Group
shareholder’s equity in the consolidated balance
sheet. All intra-group transactions and balances are
eliminated on consolidation.
(3) Revenue, cost of sales and revenue
recognition
Revenue is recognised as contract activity
progresses, in accordance with the terms of the
contractual agreement and the stage of completion
of the work. It is in respect of the provision of
services including fees, commissions, rechargeable
expenses and sales of materials performed subject
to specific contract. Where recorded revenue
exceeds amounts invoiced to clients, the excess is
classified as accrued income and where recorded
revenue is less than amounts invoiced to clients, the
difference is classified as deferred income.
Cost of sales include amounts payable to external
suppliers where they are retained at the Group’s
discretion to perform part of a specific client project
or service where the Group has full exposure to the
benefits and risks of the contract with the client.
(4) Goodwill and other intangible assets
In accordance with IFRS 3 Business Combinations,
goodwill arising on acquisitions is capitalised as an
intangible asset. Other intangible assets are also
identified and amortised over their useful economic
lives on a straight line basis. Examples of these are
licences to trade, and client contracts. The useful
economic lives vary from 3 months to 8 years.
Goodwill is not amortised.
Consolidated Financial Statements – Accounting Policies (continued)

31
Under IAS 36 Impairment of Assets, goodwill is
allocated to cash generating units for the purpose of
impairment testing. The allocation is made to each
cash generating unit that is expected to benefit from
the business combination in which goodwill arose
and identified according to operating segment.
The carrying values of goodwill for each cash
generating unit is reviewed annually for impairment
on the basis stipulated in IAS 36 and adjusted to
the recoverable amount. Typically, such a review
will entail an assessment of the present value of
projected returns from the asset over a 3 to 5 year
projection period, and growth assumptions based
on expected overall sector growth for subsequent
years, to a maximum period of 20 years.
(5) Property, plant and equipment
Property, plant and equipment are stated at historical
cost. Depreciation is provided at rates calculated
to write off the cost, less estimated residual value, of
each asset, over their estimated useful economic
lives as follows:-
Leasehold improvements – over the remaining
term of the lease
Motor vehicles – 25% pa. straight line
Computer equipment – 33% pa. straight line
Fixtures, fittings and office equipment – 25% pa.
straight line
(6) Available-for-sale investments
Investments classified as available-for-sale are
initially recorded at fair value including transaction
costs. Such instruments are subsequently measured
at fair value with gains and losses being recognised
in other comprehensive income until the instrument
is disposed of or is determined to be impaired, at
which time the cumulative gain or loss previously
recognised in other comprehensive income is
recycled to the income statement and recognised
in profit or loss for the period. Impairment losses are
recognised in the income statement when there is
objective evidence of impairment.
(7) Internally generated intangible assets –
research and development expenditure
Expenditure on research activities is recognised as
an expense in the period in which it is incurred.
An internally generated intangible asset arising from
the Group’s development expenditure is recognised
only when the following conditions are met:
i. an asset is created that can be identified (such
as software or a new process);
ii. it is probable that the asset created will generate
future economic benefit;
iii. the development cost of the asset can be
measured reliably;
iv. there is the availability of adequate technical,
financial or other resources and an intention to
complete the development and to use or sell
the development
Internally generated assets are amortised on a
straight line basis over their useful lives. Where
no internally generated intangible asset can be
recognised, the development expenditure is
recognised as an expense in the period in which
it is incurred.
Assets subject to amortisation are reviewed for
impairment whenever events or changes in
circumstances indicate that the carrying value
may not be fully recoverable.
(8) Deferred taxation
Deferred tax is the tax expected to be payable or
recoverable on differences between the carrying
value of assets and liabilities in the financial
statements and the corresponding tax bases used in
the computation of taxable profit, and is accounted
for using the balance sheet liability method.
Deferred tax liabilities are generally recognised for
all taxable temporary differences and deferred tax
assets are recognised to the extent that it is probable
that taxable profits will be available against which
deductible temporary differences can be utilised.
Such assets and liabilities are not recognised if
the temporary difference arises from the initial

32
recognition of goodwill or from the initial recognition
of other assets and liabilities in a transaction that
affects neither the tax profit or the accounting profit
other than those on business combinations.
The carrying amount of deferred tax assets is
reviewed at each balance sheet date and reduced
to the extent that it is no longer probable that
sufficient taxable profits will be available to allow all
or part of the asset to be recovered.
Deferred tax is calculated at the tax rates that are
enacted or substantially enacted and expected to
apply in the period when the liability is settled or the
asset is realised. Deferred tax is charged or credited
in the income statement, except where it relates to
items charged or credited directly to equity, in which
case the deferred tax is also dealt with in equity.
(9) Leasing and hire purchase commitments
When the Group enters into a lease which entails
taking substantially all the risks and rewards of
ownership of an asset, the lease is treated as a
finance lease or similar hire purchase contract.
The asset is recorded at fair value (or present
value of minimum lease payments if lower) in the
balance sheet as property, plant and equipment
and is depreciated over the estimated useful life
or the term of the lease, whichever is shorter. Future
instalments under such leases, net of finance
charges, are included as a liability. Rentals payable
are apportioned between the finance element,
which is charged to the income statement, and
the capital element which reduces the outstanding
obligation for future instalments.
All other leases are treated as operating leases
and rentals payable are charged to the income
statement on a straight line basis over the lease
terms.
(10) Foreign currencies
Sterling is the functional currency of the company
and the presentational currency of the Group.
The functional currency of subsidiaries is the local
currency of the primary economic environment in
which the entity operates.
Foreign currency transactions are translated
into the functional currency using the exchange
rate prevailing at the date of the transaction.
Foreign exchange gains or losses resulting from
the settlement of such transactions and from the
translation to the rate prevailing at the year end
of monetary assets and liabilities denominated in
foreign currencies are recognised in the income
statement.
The financial statements of subsidiaries whose
functional currency is different to the presentational
currency of the Group are translated into
the presentational currency of the Group on
consolidation. Assets and liabilities are translated at
the exchange rate prevailing at the balance sheet
date. Income and expenses are translated at the
average exchange rate for the year. Exchange
differences arising on consolidation are recognised
in other comprehensive income and the cumulative
effect of these as a separate component in equity.
(11) Pension contributions
Subsidiaries operate defined contribution pension
schemes and contribute to the personal pension
schemes of certain employees or to a Group
personal pension plan. The assets of the schemes
are held separately from those of the subsidiary
companies in independently administered funds.
The amount charged against profits represents the
contributions payable to the scheme in respect of
the accounting period.
(12) Share-based payments
The Group has applied the requirements of IFRS 2
Share-based Payment which requires the fair value
of share-based payments to be recognised as
an expense. In accordance with the transitional
provisions, IFRS 2 has been applied to such equity
instruments that were granted after 7 November
2002 and which had not vested by 1 January 2006.
Consolidated Financial Statements – Accounting Policies (continued)

33
This standard has been applied to various types of
share-based payments as follows:
i. Share options
Certain employees receive remuneration in
the form of share options. The fair value of the
equity instruments granted is measured on the
date at which they are granted by using the
Black-Scholes model, and is expensed to the
income statement over the appropriate vesting
period.
ii. Acquisition related employee remuneration
expenses
In accordance with IFRS 3 Business Combinations
and IFRS 2 Share-based Payment, certain
payments to employees in respect of earn out
arrangements are treated as remuneration
within the income statement.
(13) Financial instruments
Financial assets and financial liabilities are
recognised on the Group’s balance sheet when
the Group has become a party to the contractual
provisions of the instrument.
i. Trade receivables
Trade receivables are classified as loans
and receivables and are initially recognised
at fair value and subsequently measured
at amortised cost in accordance with IAS
39 Financial Instruments: recognition and
measurement. A provision for impairment
is made where there is objective evidence,
(including customers with financial difficulties or
in default on payments) that amounts will not
be recovered in accordance with original terms
of the agreement. A provision for impairment
is established when the carrying value of the
receivable exceeds the present value of the
future cash flow discounted using the original
effective interest rate. The carrying value of the
receivable is reduced through the use of an
allowance account and any impairment loss is
recognised in the income statement.
ii. Cash and cash equivalents
Cash and cash equivalents comprise cash in
hand and at bank and other short-term deposits
held by the Group with maturities of less than
three months.
iii. Financial liabilities and equity
Financial liabilities and equity instruments are
classified according to the substance of the
contractual arrangements entered into. An
equity instrument is any contract that evidences
a residual interest in the assets of the Group
after deducting all of its liabilities.
iv. Bank borrowings
Interest-bearing bank loans and overdrafts
are recorded initially at their fair value, net of
direct transaction costs. Such instruments are
subsequently carried at their amortised cost and
finance charges, including premiums payable
on settlement or redemption, are recognised
in the income statement over the term of the
instrument using an effective rate of interest.
v. Trade payables
Trade payables are initially recognised at fair
value and subsequently measured at amortised
cost.
vi. Derivative financial instruments and hedge
accounting
The Group’s activities expose the entity primarily
to foreign currency and interest rate risk. The
Group uses interest rate swap contracts to
hedge interest rate exposures.
Interest rate swap contracts are initially
recognised at fair value on the date the contract
is entered into and subsequently remeasured
at their fair value. Changes in the fair value are
recorded in the income statement.

34
(14) Accounting estimates and judgements
The directors consider the critical accounting
estimates and judgements used in the financial
statements and concluded that the main areas of
judgements are:
i. Revenue recognition policies in respect of
contracts which straddle the year end.
ii. Contingent deferred consideration payments in
respect of acquisitions.
iii. Recognition of share-based payments.
iv. Valuation of intangible assets.
These estimates are based on historical experience
and various other assumptions that management
and the board of directors believe are reasonable
under the circumstances and are discussed in
more detail in their respective notes. The Group also
makes estimates and judgements concerning the
future and the resulting estimate may, by definition,
vary from the related actual results.
(15) Provisions
Provisions are recognised when the Group has a
present obligation (legal or constructive) as a result
of a past event, it is probable that an outflow of
resources will be required to settle this obligation and
a reliable estimate can be made of the amount of
the obligation. Expected future cash flows to settle
provisions are discounted to present value.
(16) Segment reporting
Operating segments are reported in a manner
consistent with the internal reporting provided to
the chief operating decision maker. The chief
operating decision maker, which is responsible for
allocating resources and assessing performance
of the operating segments has been indentified as
the board of directors.
Consolidated Financial Statements – Accounting Policies (continued)

35
1 SEGMENTAL INFORMATION
Adoption of IFRS 8 Operating Segments
The Group has adopted IFRS 8 Operating Segments during the year. The standard supersedes IAS 14 Segment
Reporting and is effective for the year ended 31 December 2009. IFRS 8 requires disclosure of segment
information on the basis of information reported internally to the chief operating decision maker for decision
making purposes. The Group considers that the role of chief operating decision maker is performed by the
plc’s board of directors. IAS 14 required segmental information to be reported for business segments and
geographical segments based on assets and operations that provided products and services subject to
different risks and returns. The adoption of IFRS 8 has not had any impact on the performance or position of
the Group.
For management purposes, the Group is organised into two operating groups; Cello Research and Consulting,
and Tangible Group. These groups are the basis on which the Group reports internally to the plc’s board of
directors, who have been identified as the chief operating decision makers.
The principal activities are as follows:
Cello Research and Consulting
The Research and Consulting Group provide both qualitative and quantitative research to a global range
of clients across a range of sectors. This research combined with a consulting capability puts the Group in a
unique position to add real value to client relationships.
Tangible Group
The Tangible Group offers results orientated and customer focused marketing, with particular strength in direct
marketing. Focus is on three key delivery areas; Insight, marketing delivery, and production.
Revenues of £3.85m (2008: £4.30m) are derived from the Group’s largest client and these revenues are
included in Cello Research and Consulting.
Notes to the Consolidated Financial Statementsfor the year ended 31 December 2009

36
1 SEGMENTAL INFORMATION continued
for the year ended 31 December 2009
Research and Consulting
£’000
Tangible Group £’000
Unallocated Corporate Expenses
£’000Group £’000
Profit and loss
Revenue 59,807 66,853 – 126,660
Operating income 36,301 24,158 – 60,459
Headline operating profit (headline segment
result)
Exceptional items
Amortisation of intangible assets
Acquisition related employee expenses
5,575
(918)
(315)
(217)
1,814
(1,031)
(140)
54
(1,446)
–
–
–
5,943
(1,949)
(455)
(163)
Operating profit before impairments
Impairment of intangible assets
Impairment of goodwill
Impairment of available-for-sale investments
4,125
(778)
(4,637)
(177)
697
–
(2,746)
–
(1,446)
–
–
(30)
3,376
(778)
(7,383)
(207)
Operating loss (segment result) (1,467) (2,049) (1,476) (4,992)
Financing income
Finance costs
Fair value gain on derivative financial
instruments
Finance cost of deferred consideration
69
(104)
155
(956)
Loss before tax (5,828)
Other information
Additions to property, plant and equipment 321 371 7 699
Capitalisation of intangible assets – 141 – 141
Depreciation of property, plant and equipment 680 555 12 1,247
Notes to the Consolidated Financial Statements (continued)for the year ended 31 December 2009

37
1 SEGMENTAL INFORMATION continued
31 December 2009
Research and Consulting
£’000
Tangible Group £’000
Unallocated Corporate
Assets/ (Liabilities)
£’000Eliminations
£’000Total
£’000
Assets and liabilities
Non current assets
Current assets
43,634
20,143
27,957
16,252
44
999
–
(8,548)
71,635
28,846
Total segment assets 63,777 44,209 1,043 (8,548) 100,481
Deferred tax assets 962
Consolidated total assets 101,443
Segment liabilities (17,163) (13,977) (8,903) 8,548 (31,495)
Borrowings
Corporation tax liabilities
Deferred tax liabilities
Finance leases
(14,529)
(568)
(292)
(133)
Consolidated total liabilities (47,017)

38
1 SEGMENTAL INFORMATION continued
Notes to the Consolidated Financial Statements (continued)for the year ended 31 December 2009
for the year ended 31 December 2008
Tangible Group £’000
Unallocated Corporate Expenses
£’000Group £’000
Profit and lossRevenue 64,918 72,712 – 137,630
Operating income 37,861 27,500 – 65,361
Headline operating profit (headline segment result) 6,508 3,708 (2,048) 8,168
Exceptional items Amortisation of intangible assets Acquisition related employee expenses Share option credit
(521)(611)(419)
98
(724)(247)(228)
78
(40)––
274
(1,285)(858)(647)450
Operating profit (segment result) 5,055 2,587 (1,814) 5,828
Financing income Finance cost of deferred consideration Fair value loss on derivative financial instruments Finance costs
243(291)(444)
(1,134)
Profit before tax 4,202
Other information
Additions to property, plant and equipment 742 501 – 1,243
Capitalisation of intangible assets – 119 – 119
Depreciation of property, plant and equipment 843 560 – 1,403
Research and Consulting
£’000
31 December 2008
Research and
Consulting £’000
Tangible Group
£’000
Unallocated Corporate
Assets/ (Liabilities)
£’000Eliminations
£’000Total
£’000
Assets and liabilities
Non current assets
Current assets
50,464
18,591
30,086
18,589
1,337
1,075
–
(6,532)
81,887
31,723
Total segment assets 69,055 48,675 2,412 (6,532) 113,610
Deferred tax assets 1,080
Consolidated total assets 114,690
Segment liabilities (23,452) (17,282) (7,308) 6,532 (41,510)
BorrowingsCorporation tax liabilitiesDeferred tax liabilitiesFinance leases
(14,803)(708)(616)(154)
Consolidated total liabilities (57,791)

39
1 SEGMENTAL INFORMATION continued
The Group’s operations are located in the United Kingdom and the USA.
The following table provides an analysis of the Group’s revenue by geographical market, based on the
billing location of the client:
Geographical
Year ended 31 December
2009 £’000
Year ended 31 December
2008 £’000
UK
Rest of Europe
USA
Rest of the World
98,345
18,790
8,511
1,014
110,091
15,954
10,265
1,320
126,660 137,630
2 FINANCE INCOME AND COSTS
Year ended 31 December
2009 £’000
Year ended 31 December
2008 £’000
Financial income:
Interest receivable on bank deposits
Fair value gains on derivative financial instruments
69
155
243
–
224 243
Finance costs:
Interest payable on bank loans and overdrafts
Interest payable on loan notes
Interest payable in respect of finance leases
Finance costs on cap and collar interest rate hedge
547
3
21
385
974
139
21
–
956 1,134
Notional finance costs on future deferred consideration
Fair value loss on derivative financial instruments
104
–
291
444
1,060 1,869

40
Notes to the Consolidated Financial Statements (continued)for the year ended 31 December 2009
3 OPERATING (LOSS)/PROFIT
Notes
Year ended 31 December
2009 £’000
Year ended 31 December
2008 £’000
(a) Operating (loss)/profit is stated after charging/(crediting):
Administration costs:
Staff costs
Operating lease rentals : land and buildings
: other leases
Depreciation of property, plant and equipment : owned assets
: leased assets
Loss/(profit) on disposal of property, plant and equipment
Auditors’ remuneration
Net foreign exchange losses/(profits)
Other occupancy costs
Other administration costs
4
3b
39,682
2,223
307
1,171
76
3
397
263
1,579
8,815
42,047
2,560
310
1,314
89
(48)
402
(522)
1,486
9,555
54,516 57,193
Exceptional items:
Staff redundancies
Property costs
Other
1,372
516
61
978
136
171
1,949 1,285
Other non-headline charges:
Amortisation of intangible assets
Acquisition related employee expenses
Share option credit
Impairment of intangible assets
Impairment of goodwill
Impairment of available-for-sale investments
4
4
455
163
–
778
7,383
207
858
647
(450)
–
–
–
8,986 1,055
(b) Auditors’ remuneration:
Fees payable to Baker Tilly UK Audit LLP for:
– audit services to the parent company
– audit services to subsidiary companies pursuant to legislation
43
238
45
243
Total audit fees 281 288
Non-audit fees:
– taxation services
– interim review
– other services not included above
93
10
13
96
10
8
Total non-audit fees 116 114
Total auditors’ remuneration 397 402
All non-audit fees were payable to associates of Baker Tilly UK Audit LLP.

41
4 STAFF COSTS
The average monthly number of persons (including directors) employed by the Group during the year was
as follows:
Year ended 31 December
2009 £’000
Year ended 31 December
2008 £’000
Cello Research and Consulting
Tangible Group
Head Office
438
344
5
472
361
6
787 839
The aggregate employee costs of these persons were as follows:
Year ended 31 December
2009 £’000
Year ended 31 December
2008 £’000
Wages and salaries
Social security costs
Other pension costs
34,838
3,851
993
36,873
4,150
1,024
Employee costs before non-headline charges/(credits)
Acquisition related employee remuneration expense
Share-based payments – share options
39,682
163
–
42,047
647
(450)
39,845 42,244
Key management remuneration – Directors:
Directors’ emoluments
Social security costs
Money purchase pension contributions
Share-based payments – share options
551
65
51
–
758
90
80
(272)
667 656
Included in the above is £249,000 (2008: £267,000) of emoluments and £29,000 (2008: £29,000) of
pension contributions paid or payable to the highest paid director.
The number of directors to whom retirement benefits accrued under money purchase pension schemes
in the year was 2 (2008: 3).

42
Notes to the Consolidated Financial Statements (continued)for the year ended 31 December 2009
5 TAXATION
Year ended 31 December
2009 £’000
Year ended 31 December
2008 £’000
Current tax:
UK corporation tax at 28% (2008: 28.5%)
Adjustment in respect of prior year
864
(413)
1,047
(466)
451 581
Deferred tax:
Origination and reversal of temporary differences
Effect of decrease in tax rate on deferred tax assets
Adjustment in respect of prior year
(108)
–
(104)
225
6
203
(212) 434
Tax charge 239 1,015
Corporation tax is calculated at 28% (2008: 28.5%) of the estimated assessable profit for the year.
Taxation for other jurisdictions is calculated at the rates prevailing in the respective jurisdiction.
The charge for the year can be reconciled to the loss per the income statement.
Year ended 31 December
2009 £’000
Year ended 31 December
2008 £’000
(Loss)/profit before taxation (5,828) 4,202
Tax at the UK corporation tax rate of 28% (2008: 28.5%)
Tax effect of expenses not deductible for tax purposes
Effect of decrease in tax rate on deferred tax assets
Prior year corporation tax adjustment
Prior year deferred tax adjustment
(1,632)
2,388
–
(413)
(104)
1,198
74
6
(466)
203
239 1,015

43
6 DISCONTINUED OPERATIONS
The loss for the year from discontinued operations relates to two of the Group’s businesses which have
been closed in the year ended 31 December 2009. These were Digital People Online Limited, the Group’s
digital market research business and Richmark Group Inc, the Group’s quantitative market research agency
based in Chicago.
In accordance with IFRS 5 Non-current Assets Held for Sale and Discontinued Operations the income
statement for the year ended 31 December 2008 has been re-presented to include income and expenses
for operations discontinued in the year ended 31 December 2009 in loss from discontinued operations.
An analysis of the result of discontinued operations is as follows:
Year ended 31 December
2009 £’000
Year ended 31 December
2008 £’000
Revenue
Cost of sales
784
(40)
1,497
(274)
Operating income
Administration expenses
744
(997)
1,223
(1,609)
Loss from discontinued operations (253) (386)
7 EQUITY DIVIDENDS
A final dividend of 0.75p (2008: 0.75p) per ordinary share was paid on 17 June 2009 to all shareholders on
the register at 22 May 2009. The total amount of the dividend paid was £439,000 (2008: £334,000).
An interim dividend of 0.50p (2008: 0.50p) per ordinary share was paid on 4 November 2009 to all
shareholders on the register on 9 October 2009. The total amount of the dividend paid was £294,000
(2008: £222,000).
A final dividend of 0.80p (2008: 0.75p) is proposed to be paid on 16 June 2010 to all shareholders on the
register at 21 May 2010. In accordance with IAS 10 Events After the Balance Sheet Date, this dividend has
not been recognised in the consolidated financial statements at 31 December 2009, but if approved will
be recognised in the year ending 31 December 2010.

44
Notes to the Consolidated Financial Statements (continued)for the year ended 31 December 2009
8 (LOSS)/EARNINGS PER SHARE
Year ended 31 December
2009 £’000
Year ended 31 December
2008 £’000
(Loss)/earnings attributable to ordinary shareholders
Loss from discontinued operations
(6,359)
253
2,761
386
(Loss)/earnings attributable to ordinary shareholders from continuing
operations
Adjustments to (loss)/earnings:
Exceptional items
Amortisation of intangible assets
Acquisition related employee remuneration expenses
Share-based payments credit
Impairment of intangible assets
Impairment of goodwill
Impairment of available-for-sale investments
Notional finance costs on future deferred consideration payments
Fair value (gain)/loss on derivative financial instruments
Tax thereon
(6,106)
1,949
455
163
–
778
7,383
207
104
(155)
(829)
3,147
1,285
858
647
(450)
–
–
–
291
444
(618)
Headline earnings attributable to ordinary shareholders 3,949 5,604
Number
of shares
Number
of shares
Weighted average number of ordinary shares
Dilutive effect of securities:
Deferred consideration shares to be issued
54,212,092
7,324,037
42,831,617
13,823,781
Diluted weighted average number of ordinary shares 61,536,129 56,655,398
Further dilutive effect of securities:
Contingent consideration shares to be issued 5,506,051 9,964,568
Fully diluted weighted average number of ordinary shares 67,042,180 66,619,966

45
8 (LOSS)/EARNINGS PER SHARE continued
Year ended 31 December
2009
Year ended 31 December
2008
Basic (loss)/earnings per share
From continuing operations
From discontinued operations
(11.26)p
(0.47)p
7.35p
(0.90)p
(11.73)p 6.45p
Diluted (loss)/earnings per share
From continuing operations
From discontinued operations
(11.26)p
(0.47)p
5.55p
(0.68)p
(11.73)p 4.87p
Fully diluted (loss)/earnings per share
From continuing operations
From discontinued operations
(11.26)p
(0.47)p
4.72p
(0.58)p
(11.73)p 4.14p
Headline earnings per share
Headline basic earnings per share
Headline diluted earnings per share
Headline fully diluted earnings per share
7.28p
6.42p
5.89p
13.08p
9.89p
8.41p
Headline earnings per share and fully diluted (loss)/earnings per share have been presented to provide
additional information which may be useful to the readers of these financial statements.
Basic (loss)/earnings per share is calculated by dividing the (loss)/earnings attributable to ordinary shareholders
by the weighted average number of ordinary shares in issue during the year, excluding treasury shares,
determined in accordance with the provisions of IAS 33 Earnings Per Share.
Diluted (loss)/earnings per share is calculated by dividing (loss)/earnings attributable to ordinary shareholders
by the weighted average number of ordinary shares in issue during the year adjusted for the potentially
dilutive ordinary shares for which the conditions of issue have substantially been met but not issued at the
end of the year. Given the loss in the year ended 31 December 2009, the effect of these, potentially dilutive
ordinary shares, are anti-dilutive so dilutive loss per share is deemed to equal basic loss per share.
Fully diluted (loss)/earnings per share is calculated by adjusting the weighted average number of ordinary
shares in issue on the assumption of conversion of all the potentially dilutive ordinary shares. Given the loss in
the year ended 31 December 2009, the effect of these, potentially dilutive ordinary shares, are anti-dilutive
so fully dilutive loss per share is deemed to equal basic loss per share.
The Group’s potentially dilutive shares are to be issued as deferred consideration on completed acquisitions.

46
Notes to the Consolidated Financial Statements (continued)for the year ended 31 December 2009
9 GOODwILL 2009
£’000 2008 £’000
Cost
At 1 January 2009
Goodwill arising on acquisitions in the year
Adjustment to fair value of deferred consideration
Impairment of goodwill
76,291
48
(1,030)
(7,383)
77,912
–
(1,621)
–
At 31 December 2009 67,926 76,291
Goodwill represents the excess of cost of acquisition over the fair value of the Group’s share of the net
identifiable assets of the acquired subsidiary at the date of acquisition.
Goodwill arising on acquisition in the year relates to goodwill arising on the acquisition of a 20% stake in
Opticomm Media Limited (“Opticomm”) in the year. Opticomm is accounted for as a subsidiary as Cello
Group plc has options over the remaining 80% of the shares in Opticomm and under the option agreement
has the power to govern the financial and operating policies of Opticomm.
The adjustment to fair value of deferred consideration relates to the changes in estimate to deferred consideration
payable under earn out arrangements in accordance with the terms of the relevant acquisition agreements.
The carrying amount of goodwill has been reduced to its recoverable amount through recognition of an
impairment loss against goodwill. This loss is shown separately in the income statement.
Goodwill is allocated to the Group’s cash-generating units identified according to operating segment.
Goodwill allocated by operating segment is given below: 2009
£’000 2008 £’000
Research and Consulting
Tangible Group
41,405
26,521
46,566
29,725
At 31 December 2009 67,926 76,291
The recoverable amount of each cash-generating unit is determined based on value-in-use calculations.
These calculations use pre-tax cash flow projections using projected returns over the next 4 years, with
growth assumptions based on expected overall sector growth for up to 20 years. Future cash flows are then
discounted to present value using a discount rate based on the Group’s estimated weighted average cost of
capital, risk adjusted for the cash-generating unit as appropriate. The average pre-tax discount rate applied
to the cash flow projections is 7.6%. Management have determined projected returns over the next 4 years
based on past performance, cost rationalisation and expectations of market development.
Following this review, impairment charges within Research and Consulting have been made in respect of
SMT Consulting Limited, the Group’s business intelligence unit and Chairos Holdings Limited, the Group’s HR
consultancy business, due to reduced trading performance in the current economic environment.

47
9 GOODwILL continued
Within Tangible Group, impairment charges have been made in respect of Tangible Financial Limited, the
Group’s specialist financial services agency, and OMP Services Limited, the Group’s digital agency based in
Cirencester, due to reduced trading performance in the current economic environment.
The key assumption in the value-in-use calculation is projected revenue used to calculate projected returns.
Reduction in revenues can be mitigated by cost rationalisations in the Group; as a result there is no material
effect to the carrying value of goodwill as a result of reasonable changes to the revenue assumptions in the
short term.
Impairment charges by segment are given in note 1 to the consolidated financial statements.
10 INTANGIBLE ASSETSDevelopment
costs £’000
Client contracts
£’000Licences
£’000Total
£’000
Cost
At 1 January 2008
Expenditure on development
111
119
1,280
–
3,209
–
4,600
119
At 31 December 2008
Expenditure on development
230
141
1,280
–
3,209
–
4,719
141
At 31 December 2009 371 1,280 3,209 4,860
Amortisation
At 1 January 2008
Charge for the year
–
35
793
422
802
401
1,595
858
At 31 December 2008
Charge for the year
Impairment
35
75
–
1,215
65
–
1,203
315
778
2,453
455
778
At 31 December 2009 110 1,280 2,296 3,686
Net book value
At 31 December 2009
261
–
913
1,174
At 31 December 2008 195 65 2,006 2,266
At 1 January 2008 111 487 2,407 3,005
Client contracts and licences are amortised over their useful economic lives which range from 3 months to
8 years. Development costs are internally generated. Remaining amortisation periods are as follows:
Development costs 4 years
Licences 4 years

48
Notes to the Consolidated Financial Statements (continued) for the year ended 31 December 2009
11 PROPERTY, PLANT AND EQUIPMENT
Leasehold improvements
£’000
Computer equipment
£’000
Fixtures, fittings and office
equipment £’000
Motor vehicles
£’000Total
£’000
Cost
At 1 January 2008
Additions
Disposals
Exchange differences
1,850
117
(49)
–
2,457
820
(244)
15
986
124
(84)
7
313
182
(179)
–
5,606
1,243
(556)
22
At 31 December 2008
Additions
On acquisition
Disposals
Exchange differences
1,918
113
–
(28)
–
3,048
423
6
(66)
(8)
1,033
76
–
(3)
(3)
316
87
–
(63)
(1)
6,315
699
6
(160)
(12)
At 31 December 2009 2,003 3,403 1,103 339 6,848
Depreciation
At 1 January 2008
Charge for the year
Disposals
Exchange differences
526
231
(48)
–
1,330
838
(238)
13
274
245
(80)
5
199
89
(172)
–
2,329
1,403
(538)
18
At 31 December 2008
Charge for the year
Disposals
Exchange differences
709
244
(20)
–
1,943
759
(58)
(6)
444
164
(2)
(2)
116
80
(38)
–
3,212
1,247
(118)
(8)
At 31 December 2009 933 2,638 604 158 4,333
Net book value
At 31 December 2009
1,070
765
499
181
2,515
At 31 December 2008 1,209 1,105 589 200 3,103
At 1 January 2008 1,324 1,127 712 114 3,277
The net book value of property, plant and equipment of the Group includes £160,000 (2008: £175,000) of motor
vehicles and £23,000 (2008: £28,000) of other equipment in respect of assets held under finance leases.

49
12 AVAILABLE-FOR-SALE INVESTMENTS
2009 £’000
2008 £’000
At 1 January 2009
Impairment
227
(207)
227
–
At 31 December 2009 20 227
The Group holds 163,936 shares (0.5%) in Pixel Interactive Media Limited, a company listed on the
AIM Market. This company is an Asia-Pacific based interactive media business. The market value of this
investment at 31 December 2009 was £20,000 at 12p per share.
The Group holds 20% of the share capital in TMI Training Consultants Limited, an unquoted company
incorporated in the Republic of Ireland. This company provides brand consulting and training services. This
investment is not being treated as an associate on the grounds of materiality. This investment has been
impaired in full in the year.
The Group held 21% of the share capital in nQual Limited, an unquoted company at 1 January 2009.
nQual was a supplier of online market research solutions which ceased trading in the year. This investment
has been impaired in full in the year.

50
Notes to the Consolidated Financial Statements (continued)for the year ended 31 December 2009
13 SUBSIDIARIES
Details of the Company’s principal subsidiary undertakings as at 31 December 2009 are as follows:
Company name
Country of incorporation/
principal operation
Class of share
Proportion of nominal value
of issued shares held
Principal activity
Held directly:2CV LimitedChiaros Holdings LimitedFenix Media LimitedHill Murray Group LimitedInsight Medical Research LimitedLeapfrog Research and Planning LimitedMagnetic Advertising Company LimitedMarket Research International LimitedOpticomm Media Limited*Rosenblatt LimitedRS Group LimitedTangible Group LimitedThe MSI Consultancy LimitedThe Value Engineers Limited
Held indirectly:2CV incBlonde Digital LimitedBrightsource LimitedCello MRUK Research LimitedInsight Research Group USA IncLabinah Management LimitedRS Consulting LimitedStripe PR and Communications LimitedTangible Data LimitedTangible Financial LimitedTangible UK LimitedTangible Response Limited
EnglandEnglandEnglandEnglandEngland
EnglandScotlandEnglandEnglandEnglandEnglandEnglandEnglandEngland
USAScotlandEnglandEngland
USAEnglandEnglandScotlandEnglandEnglandScotlandEngland
OrdinaryOrdinaryOrdinaryOrdinaryOrdinaryOrdinaryOrdinaryOrdinaryOrdinaryOrdinaryOrdinaryOrdinaryOrdinaryOrdinary
OrdinaryOrdinaryOrdinaryOrdinaryOrdinaryOrdinaryOrdinaryOrdinaryOrdinaryOrdinaryOrdinaryOrdinary
100%100%
51%100%100%100%100%100%
20%100%100%100%100%100%
100%84%
100%100%100%100%100%
84%100%100%100%100%
RCRC
TT
RCRC
TRC
TRCRC
TRCRC
RCTT
RCRCRCRC
TTTTT
*Opticomm Media Limited is included as a subsidiary as Cello Group plc has options over the remaining 80% of the shares in Opticomm Media Limited and under the option agreement Cello has the power to govern the financial and operating policies of Opticomm Media Limited.
RC = Cello Research and Consulting T = Tangible Group

51
14 CURRENT ASSETS
2009 £’000
2008 £’000
Trade and other receivables
Trade receivables
Other receivables
Prepayments and accrued income
19,021
907
5,783
19,759
1,287
5,612
25,711 26,658
The average credit period taken on the provision of services was 56 days (2008: 53 days).
The directors consider that the carrying value of trade and other receivables approximates to fair value.
2009 £’000
2008 £’000
Cash and cash equivalents
Cash at bank and in hand
3,135
5,065
Cash of £1,179,000 (2008: £1,053,000) is maintained in a designated account with The Royal Bank of Scotland
plc as security for the loan notes issued on acquisitions and is therefore not freely available to the Group.
Credit risk
The Group’s principal financial assets are bank balances and cash and trade and other receivables.
The Group’s credit risk is primarily attributable to its trade receivables. Amounts presented in the balance
sheet are net of allowances for doubtful debts. Allowance for doubtful debts was £nil at 31 December 2009
(2008: £nil).
The credit risk on bank balances is considered to be limited.
The Group has no significant concentration of credit risk, with exposure spread over a large number of clients.
15 TRADE AND OTHER PAYABLES
2009 £’000
2008 £’000
Trade payables
Other taxation and social security costs
Accruals and deferred income
Other payables
10,124
2,517
12,425
353
11,818
3,658
10,382
775
25,419 26,633

52
Notes to the Consolidated Financial Statements (continued)for the year ended 31 December 2009
16 BORROwINGS
2009 £’000
2008 £’000
Bank loans
Loan notes
13,350
1,179
13,750
1,053
14,529 14,803
The borrowings are repayable as follows:
– on demand or within one year
– within two to five years
14,529
–
1,053
13,750
14,529 14,803
Bank loans
At 31 December 2009 the Group had a revolving credit facility of £20.0m of which £6.65m was undrawn
at that date. The revolving credit facility reduced to £17.0m on 1 January 2010.
This revolving credit facility bore interest at 2.25% over LIBOR and is secured by a floating charge over all assets
of the Group. The average interest rate on the revolving credit facility in the year was 3.4% (2008: 6.4%).
Since the end of the year the Group has entered into a new debt facility with The Royal Bank of Scotland plc. This
new facility consists of a £10.0m term loan and a £7.0m revolving credit facility. The term loan is repayable in full
over the term to 31 March 2013. The revolving credit facility is available in full to 31 March 2013. Both the term
loan and the revolving credit facility bear interest at a variable rate of 2.50% to 3.25% over LIBOR.
The amounts drawn down on the revolving credit facility of £13.35m have been included as borrowing
repayable within one year as the revolving credit facility in place on 31 December 2009 was due to expire
on 31 December 2010. Under the terms of the new debt facility entered into since the year end £2.0m will
become payable in 2010.
Loan notes
Loan notes have been issued as part of the consideration for certain acquisitions. Secured loan notes are
secured on cash deposits and by way of guarantee. Cash deposits provided as security are included within
cash and cash equivalents and amount to £1,179,000. Loan notes bear interest at the following rates:
2009 £’000
2008 £’000
Secured
LIBOR less 2%
LIBOR
808
371
956
97
1,179 1,053
17 PROVISIONS
Notes2009 £’000
2008 £’000
Contingent consideration for acquisitions 18 3,315 6,453

53
18 DEFERRED CONSIDERATION FOR ACQUISITIONS2009 £’000
2008 £’000
At 1 January 2009
Settled in the year
Adjustment to provision for additions in prior years
Acquisition related employee remuneration expense
Notional finance costs on future deferred consideration payments
14,433
(7,761)
(1,152)
163
104
30,581
(15,240)
(1,846)
647
291
At 31 December 2009 5,787 14,433
In one year or less:
Consideration for which all conditions have been met
In more than one year but not more than five years:
Contingent consideration for acquisitions
2,472
3,315
7,980
6,453
At 31 December 2009 5,787 14,433
Analysis of consideration for which all conditions have been met:
Cash liabilities
Shares to be issued
1,357
1,115
3,315
4,665
2,472 7,980
Analysis of the contingent consideration:
Cash liabilities
Shares to be issued
1,193
2,122
2,475
3,978
3,315 6,453
Acquisitions made by the Group typically involve an earn out agreement whereby the consideration payable
includes a deferred element that is contingent on the future financial performance of the acquired entity.
Earn out payments are to be in cash (or loan notes) and shares; in the analysis above the minimum
percentage of cash (or loan notes) has been assumed. However, at the Group’s sole discretion, this
percentage can be increased.
Conditions have substantially been met on £2.5m (2008: £8.0m) of earn out and other consideration which is
payable in 2010.
The provision for contingent consideration for acquisitions represents the directors’ best estimate of the amount
expected to be payable in cash (or loan notes) and shares to be issued. The provision is discounted to present
value at the company’s borrowing rate.
As a result of a review of contingent consideration at the year end, the directors’ best estimate of contingent
consideration payable in respect of acquisitions prior to 1 January 2009 has decreased the provision for
consideration payable by £1.2m (2008: £1.8m).
If the remaining earn out conditions are met, based on current expectations, £2.5m will become payable in
2011 and the remaining £0.8m is payable in 2012 or later.

54
Notes to the Consolidated Financial Statements (continued)for the year ended 31 December 2009
19 OBLIGATIONS UNDER FINANCE LEASES
A maturity analysis of obligations under finance leases is shown below:
2009 £’000
2008 £’000
Finance leases which expire:
– within one year
– in more than one year but not more than five years
68
65
68
86
133 154
The Group’s policy is to lease certain of its plant, property and equipment under finance leases. The average
lease term is 3 years. The average effective borrowing rate is 16% (2008: 15%). Interest rates are fixed at the
contract date and all leases are on a fixed repayment basis.
All lease obligations are denominated in sterling.
The fair value of the Group’s obligations approximates to their carrying value.
The Group’s obligations under finance leases are secured by the lessors’ rights over the leased assets.
20 DERIVATIVE FINANCIAL INSTRUMENTS
2009 £’000
2008 £’000
Cap and collar interest rate hedge at fair value 289 444
On 22 October 2007, the Group entered into a nil cost cap and collar interest rate hedge over £10.0m of
borrowings, which reduced to £9.0m on 1 January 2009 and reduced to £7.0m on 1 January 2010. The
cap and collar interest rate hedge expires on 31 December 2010. The cap and collar are limited to LIBOR
at 6.5% with a floor of 5.01%. At 31 December 2009 the fair value of this hedge is a liability of £289,000
(2008: £444,000). The cap and collar interest rate hedge is included within Level 2 as defined in IFRS 7
(Revised) Financial Instruments: Disclosures.

55
21 DEFERRED TAXATION
The deferred tax asset of £962,000 (2008: £1,080,000) and deferred tax liability of £292,000 (2008:
£616,000) recognised in the financial statements is set out below:
2009 £’000
2008 £’000
Deferred tax assets
Unrelieved tax losses carried forward
Decelerated capital allowances
Unrelieved acquisition related employee remuneration expense
Unrelieved loss on derivative financial instruments
–
262
619
81
45
312
599
124
962 1,080
Deferred tax liabilities
Accelerated capital allowances
Temporary difference between the net book value and the
tax value of intangible assets
Other timing differences
(8)
(256)
(28)
(36)
(580)
–
(292) (616)
670 464
The movement for the year is analysed as follows:
2009 £’000
2008 £’000
At 1 January 2009
Income statement
Recognised in other comprehensive income
Revaluation due to change in tax rate
Foreign exchange differences
464
212
–
–
(6)
599
(434)
222
54
23
At 31 December 2009 670 464
Deferred tax has been calculated using rates that are expected to apply when the asset or liability is
expected to be realised or settled.

56
Notes to the Consolidated Financial Statements (continued)for the year ended 31 December 2009
22 SHARE CAPITAL
Authorised number of 10p shares
Allotted, issued and fully paid number
of 10p sharesShare capital
£’000
At 1 January 2008
Movements in the year
50,000,000
15,000,000
38,843,852
5,717,751
3,884
572
At 31 December 2008
Movements in the year
65,000,000
19,600,000
44,561,603
14,200,594
4,456
1,420
At 31 December 2009 84,600,000 58,762,197 5,876
The company has one class of ordinary shares which carry no right to fixed income.
On 28 March 2008, 67,725 ordinary shares of 10p each were issued to employees of the Group at a
value of 113.0p pursuant to the terms of the deferred consideration contained within the share purchase
agreement with SMT Consulting Limited, a wholly owned subsidiary.
On 17 April 2008, 5,650,026 ordinary shares of 10p each were issued at a value of 114.0p to employees
of the Group and vendors of Insight Medical Research Limited, Silvermills Holdings Limited, Tangible
Communications Limited, Hill Murray Group and Target Direct (Holdings) Limited, all wholly owned subsidiaries,
pursuant to the terms of the share purchase agreements of these companies.
On 16 April 2009, 13,471,067 ordinary shares of 10p each were issued at a value of 32.5p to vendors of The
Value Engineers Limited, The MSI Consultancy Limited, Magnetic Advertising Limited and Market Research
International Limited, all wholly owned subsidiaries, pursuant to the terms of the share purchase agreements
of these companies.
On 23 April 2009, 285,735 ordinary shares of 10p each were issued at a value of 32.8p to the vendor of
Rosenblatt Limited to purchase all of the remaining shares in Rosenblatt pursuant to the terms of the share
purchase agreement of that company.
On 8 May 2009, 443,792 ordinary shares of 10p each were issued at a value of 33.4p to the vendors of
Fenix Media Limited pursuant to the terms of the share purchase agreement of that company. Following
the issue of shares the Group owns 50.7% of Fenix Media Limited.

57
23 SHARE-BASED PAYMENTS
Options
The Group has three share option schemes.
EMI Share Option Scheme and Unapproved Share Option Scheme
In 2004, the company established an EMI Share Option Scheme plan and an Unapproved Share Option
Scheme. 600,000 share options awarded under these schemes have no performance related vesting
criteria and expire on 1 November 2014. 163,266 share options awarded under these schemes can be
exercised from 1 June 2008 until 1 June 2015 on a sliding scale subject to earnings per share growth in the
three years from the date of grant. On 13 March 2006, the Remuneration Committee agreed that no further
awards would be made under these plans. The range of exercise prices of options granted under these
schemes is 100p to 122.5p being the market value of the shares at the date of grant of the options.
PSP Option Scheme
On 13 March 2006 the company established a new Performance Share Plan. Under this plan participants
are awarded options over fully paid shares with an exercise price equal to the nominal value of shares,
currently 10p per share. Options are exercisable three or four years after grant subject to the condition
that earnings per share cannot drop in any year in the vesting period and subject to the extent to which
an earnings per share growth criteria of up to 15% compound has been met.
The following share options were outstanding under these share option schemes at 31 December 2009
and 31 December 2008.
31 December 2009 31 December 2008
Number of
share options
weighted average
exercise price (pence)
Number of share options
Weighted average
exercise price (pence)
Outstanding at the beginning of the year
Granted during the year
Lapsed during the year
763,266
–
–
105
–
–
3,338,617
987,000
(3,562,351)
32
10
10
Outstanding at the end of the year 763,266 105 763,266 105
Exercisable at the end of the year 763,266 105 763,266 105
The Group uses a Black Scholes model to calculate the fair value of options. The key inputs are as follows:
EMI Options
Unapproved Options
PSP Options 2007
PSP Options 2008
Weighted average share price
Weighted average exercise price
Expected volatility
Expected life
Risk free rate
Dividend yield
Weighted average remaining contractual life
115p
123p
17.6%
3 years
6.75%
1%
6 years
115p
123p
17.6%
3 years
6.75%
1%
6 years
148p
10p
17.6%
3.8 years
6.75%
1%
8.5 years
126p
10p
17.6%
3 years
6.00%
1%
9.5 years

58
Notes to the Consolidated Financial Statements (continued) for the year ended 31 December 2009
23 SHARE-BASED PAYMENTS continued
Expected volatility has been determined by calculating the historical volatility of the Group’s share price over
the previous 2 years. The expected life used in the model has been adjusted, based on management’s best
estimates, for the effects of the non-transferability, exercise restrictions and behavioural considerations.
At 31 December 2009, 281,633 EMI options (2008: 281,633) and 481,633 unapproved options, (2008: 481,633)
had vested. No share options under the PSP scheme have vested at 31 December 2009 (2008: nil).
The fair value of options granted in the year was £nil (2008: £967,000).
The Group recognised a credit of £nil (2008: £450,000) in the year in relation to equity settled share-based
payment transactions, as the performance criteria were not met.
24 NOTES TO THE CONSOLIDATED CASH FLOw STATEMENT
(a) Reconciliation of profit for the year to net cash inflow from operating activities
Year ended 31 December
2009 £’000
Year ended 31 December
2008 £’000
(Loss)/profit for the year
Financing income
Finance costs of deferred consideration
Fair value (gain)/loss on derivative financial instruments
Other finance costs
Tax
Depreciation
Amortisation of intangible assets
Impairment of intangible assets
Impairment of goodwill
Impairment of available-for-sale assets
Share-based payment expense
Acquisition related employee remuneration expense
Loss/(profit) on disposal of property, plant and equipment
Decrease in receivables
Decrease in payables
(6,320)
(69)
104
(155)
956
239
1,247
455
778
7,383
207
–
163
3
977
(770)
2,801
(243)
291
444
1,134
1,015
1,403
858
–
–
–
(450)
647
(48)
2,062
(232)
Net cash inflow from operating activities 5,198 9,682
(b) Analysis of net debtAt 1 January
2009 £’000
Cash flow £’000
Issue of loan notes
£’000
Foreign exchange
£’000
At 31 December 2009 £’000
Cash and cash equivalents
Loan notes
Bank loans
Finance leases
5,065
(1,053)
(13,750)
(154)
(1,952)
2,187
400
21
–
(2,313)
–
–
22
–
–
–
3,135
(1,179)
(13,350)
(133)
(9,892) 656 (2,313) 22 (11,527)

59
25 COMMITMENTS UNDER OPERATING LEASES
At 31 December 2009 the Group had total commitments under non-cancellable operating leases as follows:
Land and buildings
2009 £’000
Land and buildings
2008 £’000
Other 2009 £’000
Other 2008 £’000
within one year
in more than one year but not more than five years
after five years
1,865
4,595
782
2,621
6,248
1,935
187
173
–
280
309
–
7,242 10,804 360 589
26 RELATED PARTY TRANSACTIONS
Transactions between the Company and its subsidiaries, which are related parties, have been eliminated
on consolidation and are not disclosed in this note.
Remuneration of key management personnel
The key management personnel of the Group are considered to be the directors. Further information about
the remuneration of the directors is provided in the Report of the Remuneration Committee on pages 20
to 22, and in note 4 to the consolidated financial statements.
27 CONTINGENT LIABILITIES
Under the terms of certain acquisition agreements, additional consideration is payable by the Company
contingent on the future financial performance of the acquired entities. The estimated amount of such
contingent consideration is included in Provisions (note 17 to the consolidated financial statements).

60
Notes to the Consolidated Financial Statements (continued) for the year ended 31 December 2009
28 FINANCIAL INSTRUMENTS
Financial risk management
The Group’s activities expose the Group to a number of risks including market risk (foreign currency risk
and interest rate risk), credit risk and liquidity risk. The Group manages these risks through an effective risk
management programme.
Maturity analysis
Non-derivative financial assets
The tables below analyse the Group’s financial assets held for managing liquidity risk which are considered to
be readily saleable or are expected to generate cash inflows to meet cash outflows on financial liabilities.
2009Less than 6 months
£’000Total
£’000
Available-for-sale investments
Cash and cash equivalents
Trade receivables
Other receivables
Accrued income
20
3,135
19,021
907
2,735
20
3,135
19,021
907
2,735
25,818 25,818
2008
Available-for-sale investments
Cash and cash equivalents
Trade receivables
Other receivables
Accrued income
227
5,065
19,759
1,287
2,015
227
5,065
19,759
1,287
2,015
28,353 28,353
Non-derivative financial liabilities
The tables below analyse the Group’s financial liabilities on a contractual gross undiscounted cash flow
basis into maturity groupings based on period outstanding at the balance sheet date up to the contractual
maturity date.
2009
Less than 6 months
£’000
Between 6 months and
1 year £’000
Between 1 and 5 years
£’000Total
£’000
Bank loans
Loan notes
Finance leases
Consideration payable in respect of acquistions
Trade payables
Accruals
Other payables
–
1,179
34
2,472
10,124
6,516
353
13,350
–
34
–
–
–
–
–
–
65
–
–
–
–
13,350
1,179
133
2,472
10,124
6,516
353
Total 20,678 13,384 65 34,127

61
28 FINANCIAL INSTRUMENTS continued
2008
Less than 6 months
£’000
Between 6 months and
1 year £’000
Between 1 and 5 years
£’000Total
£’000
Bank loans
Loan notes
Finance leases
Consideration payable in respect of acquistions
Trade payables
Accruals
Other payables
–
1,053
34
7,980
11,818
6,236
775
–
–
34
–
–
–
–
13,750
–
86
–
–
–
–
13,750
1,053
154
7,980
11,818
6,236
775
Total 27,896 34 13,836 41,766
The Group monitors rolling forecasts of the Group’s liquidity position on the basis of expected operating
cash flow.
In addition, at 31 December 2009, the Group had a committed undrawn bank facility of £6.65m (2008:
£6.25m) which can be accessed as considered necessary. This facility expires on 31 December 2010.
Since the year end the Group has entered into a new debt facility which is disclosed in note 16 to the
consolidated financial statements.
Foreign currency risk
The Group operates in a number of markets across the world and is exposed to foreign exchange risk
arising from various currency exposures in respect of trade receivables and trade payables, in particular
with respect to the US dollar and the euro. This risk is considered to be low.
Sensitivity analysis
The Group has derived the following sensitivities based on variations of 30% in the US dollar and the euro.
2009 £’000
2008 £’000
Impact on equity and profit after tax
30% increase in US dollar fx rate against pound sterling
30% decrease in US dollar fx rate against pound sterling
30% increase in euro fx rate against pound sterling
30% decrease in euro fx rate against pound sterling
(63)
62
(57)
70
(48)
89
(48)
88
Interest rate risk
The Group’s interest rate exposure arises mainly from its floating rate interest bearing borrowings.
The table below shows the Group’s financial assets and liabilities split by those bearing fixed rates, floating
rates and those that are non-interest bearing.

62
Notes to the Consolidated Financial Statements (continued) for the year ended 31 December 2009
28 FINANCIAL INSTRUMENTS continued
Financial assets2009
Floating rate £’000
Non-interest bearing
£’000Total
£’000
Available-for-sale investments
Cash and cash equivalents
Trade receivables
Other receivables
Accrued income
–
3,135
–
–
–
20
–
19,021
907
2,735
20
3,135
19,021
907
2,735
3,135 22,683 25,818
2008
Available-for-sale investments
Cash and cash equivalents
Trade receivables
Other receivables
Accrued income
–
5,065
–
–
–
227
–
19,759
1,287
2,015
227
5,065
19,759
1,287
2,015
5,065 23,288 28,353
Financial liabilities2009
Fixed rate
£’000Floating rate
£’000
Non-interest bearing
£’000Total
£’000
Trade payables
Accruals
Other payables
Consideration payable in respect of acquisitions
Bank loans
Loan notes
Obligations under finance leases
–
–
–
–
–
–
133
–
–
–
–
13,350
1,179
–
10,124
6,516
353
2,472
–
–
–
10,124
6,516
353
2,472
13,350
1,179
133
133 14,529 19,465 34,127
2008
Trade payables
Accruals
Other payables
Consideration payable in respect of acquisitions
Bank loans
Loan notes
Obligations under finance leases
–
–
–
–
–
–
154
–
–
–
–
13,750
1,053
–
11,818
6,236
775
7,980
–
–
–
11,818
6,236
775
7,980
13,750
1,053
154
154 14,803 26,809 41,766

63
28 FINANCIAL INSTRUMENTS continued
Sensitivity analysis
The Group has derived a sensitivity analysis based on 50% variances in floating interest rates.
2009 £’000
2008 £’000
Impact on equity and profit after tax 50% increase in base rate of interest50% decrease in base rate of interest
(24)24
(36)15
Credit risk exposure
Credit risk predominantly arises from financial asset investments and trade receivables and cash and cash
equivalents. The risk is mitigated by rigorous credit control procedures and trade debtor insurance where
appropriate.
The Group’s maximum exposure to credit risk, relating to its financial assets is equivalent to their carrying
value as disclosed below. All financial assets have a fair value which is equal to their carrying value.
2009 £’000
2008 £’000
Maximum exposure to credit riskAvailable-for-sale investmentsTrade and other receivablesCash and cash equivalents
2022,6633,135
22723,061
5,065
25,818 28,353
Capital management
The Group’s main objective when managing capital is to protect returns to shareholders by ensuring the
Group will continue to trade in the foreseeable future.
The Group considers its capital to include share capital, share premium, retained earnings, interest in own
shares and debt as noted below.
Debt includes short and long-term borrowings (including overdrafts and lease obligations) net of cash and
cash equivalents, where under the same facility agreement.
The Group does not have any externally imposed capital requirements. The debt and cash are substantially
with one financial institution under one facility agreement.
2009 £’000
2008 £’000
Total debtLess: cash and cash equivalents
14,662(3,135)
14,957(5,065)
Net debt 11,527 9,892
Total equity 54,754 56,899
Debt to capital ratio 0.21 0.17

64
28 FINANCIAL INSTRUMENTS continued
Finance income
An analysis of finance income is set out in note 2 to the consolidated financial statements.
Finance costs
An analysis of interest payable and similar charges is set out in note 2 to the consolidated financial
statements.
Non-derivative financial instruments recognised in the balance sheet
2009
Loans and receivables
£’000Available-for-sale
£’000Total
£’000
Non-current financial assets
Available-for-sale investments – 20 20
– 20 20
Current financial assets
Trade receivables
Other receivables
Accrued income
Cash and cash equivalents
19,021
907
2,735
3,135
–
–
–
–
19,021
907
2,735
3,135
25,798 – 25,798
Other financial
liabilities £’000
Liabilities at fair value through profit or loss
£’000
Total £’000
Current financial liabilities
Trade payables
Accruals
Other payables
Consideration payable in respect of acquisitions
Obligations under other finance leases
Bank loans
Loan notes
10,124
6,516
353
2,472
68
13,350
1,179
–
–
–
–
–
–
–
10,124
6,516
353
2,472
68
13,350
1,179
34,062 – 34,062
Non-current financial liabilities
Obligations under finance leases 65 – 65
65 – 65
Notes to the Consolidated Financial Statements (continued) for the year ended 31 December 2009

65
28 FINANCIAL INSTRUMENTS continued
2008
Loans and receivables
£’000Available-for-sale
£’000Total
£’000
Non-current financial assetsAvailable-for-sale investments – 227 227
– 227 227
Current financial assetsTrade receivablesOther receivablesAccrued incomeCash and cash equivalents
19,7591,2872,0155,065
––––
19,7591,2872,0155,065
28,126 – 28,126
Other financial liabilities
£’000
Liabilities at fair value through profit or loss
£’000
Total £’000
Current financial liabilities
Trade payables
Accruals
Other payables
Consideration payable in respect of acquisitions
Obligations under other finance leases
Loan notes
11,818
6,236
775
7,980
68
1,053
–
–
–
–
–
–
11,818
6,236
775
7,980
68
1,053
27,930 – 27,930
Non-current financial liabilities
Bank loans
Obligations under finance leases
13,750
86
– 13,750
86
13,836 – 13,836

66
28 FINANCIAL INSTRUMENTS continued
Available-for-sale investments
Details of available-for-sale investments are given in note 12 to the consolidated financial statements.
Financial assets
Financial assets comprise trade and other receivables and cash and cash equivalents.
Trade and other receivables are as follows:
2009 £’000
2008 £’000
Trade receivables
Other receivables
Accrued income
19,021
907
2,735
19,759
1,287
2,015
22,663 23,061
The average credit period taken is 56 days (2008: 53 days).
The Group holds no collateral against these receivables at the balance sheet date.
The following table provides analysis of trade and other receivables that were past due at 31 December,
but not impaired. The Group believes that the balances are ultimately recoverable based on a review
of past payment history and the current financial status of customers. There are no material bad debt
provisions at either 31 December 2009 or 31 December 2008.
2009 £’000
2008 £’000
Up to three months
Up to six months
5,072
266
5,204
740
5,338 5,944
There are no significant credit risks arising from financial assets that are neither past due nor impaired.
At 31 December 2009, £20.1m (2008: £21.6m) of receivables were denominated in sterling, £1.7m (2008:
£0.6m) in US dollars and £0.9m (2008: £0.9m) in euros.
The directors consider that the carrying amount of trade and other receivables to be equal to their fair
value.
Cash and cash equivalents of £3.1m (2008: £5.1m) comprise cash and short-term deposits held by the
Group. The carrying amount of these assets equals their fair value.
Notes to the Consolidated Financial Statements (continued) for the year ended 31 December 2009

67
28 FINANCIAL INSTRUMENTS continued
Bank loans and overdrafts
20092009 £’000
2008 £’000
Bank loans 13,350 13,750
All loans in both years are denominated in sterling.
The weighted average interest rates paid were:2009 2008
Bank overdrafts 2.8% 6.0%
Bank loans 3.1% 6.9%
The directors estimate that the fair value of the Group’s borrowings is not significantly different to the
carrying value.
In October 2007 the Group entered into a new £20.0m revolving credit facility with Royal Bank of Scotland
plc. This facility was revised in December 2008. Under the revised terms the facility is available until December
2010 and reduces to £17.0m on 1 January 2010. The interest rate payable is 2.25% above LIBOR.
Since the end of the year the Group has entered into a new debt facility with The Royal Bank of Scotland
plc. This new facility consists of a £10m term loan and a £7m revolving credit facility. The term loan is
repayable in full over the term to 31 March 2013. The revolving credit facility is available in full to 31 March
2013. Both the term loan and the revolving credit facility bear interest at a variable rate of 2.50% to 3.25%
over LIBOR.
In addition to the loan facilities the Group has a £2.0m working capital facility which is agreed until January
2010 and which bears interest at 2.25% above the Bank of England base rate. Since the year end the
Group has renewed this working capital facility which is agreed until 31 March 2011 and bears interest of
3.25% above the Bank of England base rate.
Obligations under finance leases
It is the Group’s policy to lease certain of its fixtures and equipment under finance leases. The average
lease term is 3–4 years. For the year ended 31 December 2009, the average effective borrowing rate was
16% (2008: 15%). Interest rates are fixed at the contract date. All leases are on a fixed repayment basis
and no arrangements have been entered into for contingent rental payments. All lease obligations are
denominated in pounds sterling.
The fair value of the Group’s lease obligations equals their carrying amount.
The Group’s obligations under finance leases are secured by the lessor’s charge over the leased assets. The
net book value of the secured assets is disclosed in note 11 to the consolidated financial statements.

68
28 FINANCIAL INSTRUMENTS continued
Consideration payable in respect of acquisitions
Acquisitions made by the Group typically involve an earn out agreement whereby the consideration
payable includes a deferred element that is contingent on future financial performance of the required
entity.
Conditions have substantially been met on £2.5m (2008: £8.0m) of earn out and other consideration which
is payable in 2010. Of this amount, £1.4m (2008: £3.3m) is payable in cash or loan notes with the remaining
£1.1m (2008: £4.7m) payable in shares. However, at the Group’s sole discretion, the proportion payable in
cash or loan notes can be increased.
Other financial liabilities
Trade and other payables are as follows:
2009 £’000
2008 £’000
Trade payables
Accruals
Other payables
10,124
6,516
353
11,818
6,236
775
16,993 18,829
At 31 December 2009, £15.8m (2008: £17.9m) of payables were denominated in sterling, £0.8m (2008:
£0.3m) in US dollars and £0.4m (2008: £0.6m) in euros.
Trade and other payables principally comprise amounts outstanding for trade purchases and ongoing
costs. The average credit period taken for trade purchases is 48 days (2008: 43 days).
The directors consider that the carrying amount of trade payables to be equal to their fair value.
Derivative financial instruments
In 2007 the Group entered into a nil cost cap and collar interest rate hedge which expires on 31 December
2010. Under this arrangement £10.0m, which reduced to £9.0m in 2009 and reduces to £7.0m in 2010, of
the Group’s borrowings is subject to a maximum LIBOR interest rate of 6.50% and a minimum of 5.01% pa.
The fair value attributed to this instrument at 31 December 2009 is a liability of £289,000 (2008: £444,000).
Fair value disclosures
The loss recognised in the income statement on available-for-sale financial assets is presented separately
on the income statement as impairment of available-for-sale investments.
The gain recognised in profit and loss on derivative financial liabilities is presented separately on the income
statement as fair value gain on derivative financial instruments.
The movement in fair value can be reconciled as follows:
Available-for-sale assets 2009 £’000
Derivative financial statements
2008 £’000
Total £’000
At 1 January 2009 227 (444) (217)
Total gains and losses recognised
in the income statement (207) 155 (52)
At 31 December 2009 20 (289) (269)
Notes to the Consolidated Financial Statements (continued) for the year ended 31 December 2009

69
Company Balance Sheet 31 December 2009
Notes
31 December 2009 £’000
31 December 2008 £’000
FIXED ASSETS
Tangible assets
Investments
1
2
24
79,407
30
89,262
79,431 89,292
CURRENT ASSETS
Debtors
Cash at bank and in hand
3 6,535
960
5,453
1,056
7,495 6,509
CREDITORS: Amounts falling due within one year 4 (27,552) (21,308)
NET CURRENT LIABILITIES (20,057) (14,799)
TOTAL ASSETS LESS CURRENT LIABILITIES
CREDITORS: Amounts falling due after more than
one year
PROVISIONS FOR LIABILITIES
5
6
59,374
–
(2,854)
74,493
(13,750)
(5,890)
NET ASSETS 56,520 54,853
CAPITAL AND RESERVES
Called up share capital
Share premium account
Capital redemption reserve
Merger reserve
Share-based payment reserve
Profit and loss account
10
12
12
12
12
12
5,876
34,945
50
10,496
73
5,080
4,456
31,745
50
10,496
73
8,033
EQUITY SHAREHOLDERS’ FUNDS 13 56,520 54,853
Approved and authorised for issue by the Board on 15 March 2010 and signed on its behalf by
Mark Scott Director
Mark Bentley Director

70
Accounting Policiesfor the year ended 31 December 2009
1 BASIS OF ACCOUNTING
The Company financial statements have been prepared under the historical cost convention and in
accordance with United Kingdom Generally Accepted Accounting Practice (UK GAAP). As permitted by
The Companies Act 2006, the company’s profit and loss account has not been presented.
2 TANGIBLE FIXED ASSETS
Tangible fixed assets are stated at historical cost. Depreciation is provided at rates calculated to write off the
cost, less estimated residual value, of each asset, over their estimated useful economic lives as follows:
Computer equipment 33% pa. straight line
Fixtures, fittings and office equipment 25% pa. straight line
3 INVESTMENTS
Fixed asset investments are stated at cost less provision for any impairment in value.
4 DEFERRED TAXATION
Deferred tax is recognised in respect of all timing differences that have originated but not reversed at the
balance sheet date where transactions or events that result in an obligation to pay more tax in the future
or a right to pay less tax in the future have occurred at the balance sheet date. Timing differences are
differences between the Company’s taxable profits and its results as stated in the financial statements that
arise from the inclusion of gains and losses in tax assessments in periods different from those in which they
are recognised in the financial statements.
Deferred tax assets are recognised to the extent that it is regarded as more likely than not that they will be
recoverable against suitable taxable profits in the future.
Deferred tax is measured at the average tax rates that are expected to apply in the periods in which timing
differences are expected to reverse, based on tax rates and laws that have been enacted or substantially
enacted by the balance sheet date. Deferred tax is measured on a non-discounted basis.
5 SHARE-BASED PAYMENTS
The Company has applied the requirements of FRS 20 Share-based Payment which requires the fair value
of share-based payments to be recognised as an expense. In accordance with the transitional provisions,
FRS 20 has been applied to such equity instruments that were granted after 7 November 2002 and which
had not vested by 1 January 2006.
This standard has been applied to various types of share-based payments as follows:
i. Share options
Certain employees receive remuneration in the form of share options. The fair value of the equity
instruments granted is measured on the date at which they are granted by using the Black-Scholes
model, and is expensed to the profit and loss account over the appropriate vesting period.
ii. Acquisition related employee remuneration expenses
Having regard to the basis for conclusions behind FRS 20 and in accordance with FRS 18
Accounting Policies, these payments are treated as remuneration within the profit and loss account
of subsidiary companies.
6 PROVISIONS
Provisions are recognised when the Company has a present obligation (legal or constructive) as a result of
a past event, it is probable that an outflow of resources will be required to settle this obligation and a reliable
estimate can be made of the amount of the obligation. Expected future cashflows to settle provisions are
discounted to present value.
7 RELATED PARTY TRANSACTIONS
In accordance with FRS 8 Related Party Disclosures, the company is exempt from disclosing transactions
with its subsidiaries as they are included in the consolidated financial statements.

71
1 TANGIBLE FIXED ASSETS
Computer equipment
£’000
Fixtures, fittings and office
equipment £’000
Total £’000
Cost
At 1 January 2009
Additions
35
–
36
7
71
7
At 31 December 2009 35 43 78
Depreciation
At 1 January 2009
Charged for the year
28
4
13
9
41
13
At 31 December 2009 32 22 54
Net book value
At 31 December 2009 3 21 24
At 31 December 2008 7 23 30
2 FIXED ASSET INVESTMENTS
Subsidiaries £’000
Other investments
£’000 Total
£’000
At 1 January 2009
Adjustment to fair value of deferred consideration
Impairment
Acquired in the year
89,050
(1,031)
(8,682)
50
212
–
(192)
–
89,262
(1,031)
(8,874)
50
At 31 December 2008 79,387 20 79,407
Subsidiaries:
The Company’s principal trading subsidiaries are listed in note 13 to the consolidated financial
statements.
Other investments:
The Company holds 163,936 shares (0.5%) in Pixel Interactive Media Limited, a company listed on the
AIM Market. This company is an Asia-Pacific based interactive media business. The market value of this
investment at 31 December 2009 was £20,000, at 12p per share.
Notes to the Company Financial Statements for the year ended 31 December 2009

72
3 DEBTORS
Notes 2009 £’000
2008 £’000
Amounts falling due within one year:
Amounts owed by subsidiary companies
Deferred tax asset
Prepayments and accrued income
Corporation tax
8
5,947
2
38
548
4,755
9
19
670
6,535 5,453
4 CREDITORS: Amounts falling due within one year
Notes 2009 £’000
2008 £’000
Bank overdraft (see below)
Trade creditors
Other taxation and social security costs
Accruals and deferred income
Amounts owed to Group companies
Loan notes (see below)
Bank loan (see below)
Consideration payable in respect of acquisitions
Other creditors
7
7,954
118
102
393
2,543
1,179
13,350
1,906
7
6,277
110
85
379
6,381
1,053
–
7,012
11
27,552 21,308
Bank overdraft
The bank overdraft is part of the Group wide working capital facility with Royal Bank of Scotland plc, which
holds a debenture over the assets of the Company and its subsidiaries. There is a cross-guarantee between
the Company and its subsidiaries. Since the year end the Group wide working capital facility has been
renewed until 31 March 2011.
Bank loan
At 31 December 2009 the Company had a revolving credit facility of £20.0m of which £6.65m was undrawn
at that date. The revolving credit facility reduced to £17.0m on 1 January 2010.
This revolving credit facility bore interest at 2.25% over LIBOR and is secured by a floating charge over all assets
of the Company. The average interest rate on the revolving credit facility in the year was 3.4% (2008: 6.4%).
Since the end of the year the Company has entered into a new debt facility with The Royal Bank of Scotland
plc. This new facility consists of a £10.0m term loan and a £7.0m revolving credit facility. The term loan is
repayable in full over the term to 31 March 2013. The revolving credit facility is available in full to 31 March
2013. Both the term loan and the revolving credit facility bear interest at a variable rate of 2.50% to 3.25%
over LIBOR.
The amounts drawn down on the revolving credit facility of £13.35m have been included as repayable
within one year as the revolving credit facility in place on 31 December 2009 was due to expire on 31
December 2010. Under the terms of the new debt facility entered into since the year end £2.0m will
become payable in 2010.
Notes to the Company Financial Statements (continued) for the year ended 31 December 2009

73
4 CREDITORS: Amounts falling due within one year continued
Loan notes
Loan notes have been issued as part of the consideration for certain acquisitions. Secured loan notes are
secured on cash deposits and by way of guarantee. Cash deposits provided as security are included within
cash at bank and in hand and amount to £1,179,000. Loan notes bear interest at the following rates:
2009 £’000
2008 £’000
Secured
LIBOR less 2%
LIBOR
808
371
956
97
1,179 1,053
5 CREDITORS: Amounts falling due after more than one year 2009 £’000
2008 £’000
Bank loans – 13,750
6 PROVISIONS FOR LIABILITIES
Notes2009 £’000
2008 £’000
Contingent consideration for acquisitions 7 2,854 5,890
7 DEFERRED CONSIDERATION FOR ACQUISITIONS£’000
At 1 January 2009
Settled in the year
Adjustment to provision for additions in prior years
Notional finance costs on future deferred consideration payments
12,902
(7,095)
(1,151)
104
At 31 December 2009 4,760
Due in one year or less:
Consideration for acquisitions
Due after more than one year but not more than five years:
Contingent consideration for acquisitions
1,906
2,854
At 31 December 2009 4,760
Analysis of consideration payable for acquisitions is as follows:2009 £’000
2008 £’000
Cash liabilities
Shares to be issued
1,054
852
2,796
4,216
1,906 7,012

74
7 DEFERRED CONSIDERATION FOR ACQUISITIONS continued
Analysis of the contingent consideration in the Company financial
statements is as follows:
2009 £’000
2008 £’000
Earn out related cash liabilities
Shares to be issued
985
1,869
2,194
3,696
2,854 5,890
Earn out payments are to be in cash and shares, in the analysis above the minimum percentage of cash
has been assumed. However, at the Company’s sole discretion, this percentage can be increased.
Acquisitions made by the Company typically involve an earn out agreement whereby the consideration
payable includes a deferred element that is contingent on the future financial performance of the
acquired entity.
Earn out payments are to be in cash (or loan notes) and shares; in the analysis above the minimum
percentage of cash (or loan notes) has been assumed. However, at the Company’s sole discretion, this
percentage can be increased.
Conditions have substantially been met on £1.9m of earn out and other consideration which is payable
in 2010.
The provision for contingent consideration for acquisitions represents the directors’ best estimate of the
amount expected to be payable in cash or loan notes and shares to be issued. The provision is discounted
to present value at the company’s borrowing rate.
As a result of a review of contingent consideration at the year end, the directors’ best estimate of contingent
consideration payable in respect of acquisitions prior to 1 January 2008 has decreased the provision for
consideration payable by £1.2m.
If the remaining earn out conditions are met, £2.0m will be payable in 2011 and the remaining £0.8m is
payable in 2012 or later.
8 DEFERRED TAXATION2009 £’000
2008 £’000
Deferred tax assets:
Other timing differences 2 9
The movement in the year of £7,000 is included in the tax charge in the profit and loss account.
Notes to the Company Financial Statements (continued) for the year ended 31 December 2009

75
9 FINANCIAL INSTRUMENTS
The Company’s financial instruments principally comprise borrowings and various items such as trade
debtors and creditors that arise directly from operations. The main purpose of these financial instruments is
to raise money for the Group’s operations.
All of the material activities of the Company take place in the United Kingdom and consequently there is
minimal exchange risk. As at 31 December 2009 the Company had no material foreign currency exposures.
It is the company’s policy not to enter into any foreign currency contracts.
The main risk arising from the Company’s financial instruments is interest rate risk and liquidity risk.
The directors monitor cash flow of the Company to ensure that there is sufficient liquidity to meet foreseeable
needs. The operations of the Company generate cash and the planned growth of activities are cash
generative. In addition the Company operates a working capital facility of £2.0m and, a loan facility of
up to £20.0m of which £13.35m (2008: £13.75m) has been drawn down at 31 December 2009. These
facilities are reviewed on a rolling basis and both facilities are secured by an unlimited inter company
composite guarantee.
Since the year end the Company has entered in to a new debt facility which is disclosed in note 16 to the
consolidated financial statements, and renewed its working capital facility until 31 March 2011.
The Company has taken advantage of the exemption in respect of the disclosure of short-term debtors
and creditors.
The fair value of the Company’s financial assets and liabilities is not considered to be materially different
from their book values.
The Company has no financial liabilities other than its bank overdraft, bank loans and loan notes that do
not fall under the exemption for short-term creditors.
Financial liabilitiesFloating rate
financial liabilities
£’000
Fixed rate financial liabilities
£’000Total
£’000
At 31 December 2009 22,483 – 22,483
At 31 December 2008 21,080 – 21,080
Floating rate liabilities at 31 December 2009 comprised the bank overdraft, bank loan and loan notes. All
interest is based on the RBS base rate or LIBOR.

76
9 FINANCIAL INSTRUMENTS continued
Maturity analysis
The maturity profile of the Company’s financial liabilities is as follows:
Bank loans and overdrafts
2009 £’000
Bank loans and overdrafts
2008 £’000
Loan notes 2009 £’000
Loan notes 2008 £’000
Total 2009 £’000
Total 2008 £’000
Repayable Within one year or on demand In more than one year but not more than five years
21,304
–
6,277
13,750
1,179
–
1,053
–
22,483
–
7,330
13,750
21,304 20,027 1,179 1,053 22,483 21,080
10 SHARE CAPITAL2009 £’000
2008 £’000
Authorised:
84,600,000 ordinary shares of 10p each 8,460 6,500
Allotted, issued and fully paid:
58,761,897 ordinary shares of 10p each
5,876
4,456
The company has one class of ordinary shares which carry no right to fixed income.
Details of shares issued in the year are given in note 22 to the consolidated financial statements.
11 SHARE-BASED PAYMENTS
Details of share option awards and key inputs into the Black Scholes model to calculate the fair value of
options are given in note 23 to the consolidated financial statements.
For the year ended 31 December 2009, the Company recognised a credit of £nil in the profit and loss
account (2008: £272,000) in relation to equity settled share-based payment transactions.
Notes to the Company Financial Statements (continued) for the year ended 31 December 2009

77
12 RESERVES
Share premium account
£’000
Capital redemption
reserve £’000
Merger reserve
£’000
Share-based
payment reserve
£’000
Profit and loss
account £’000
Total £’000
Company1 January 2009Profit for the yearDividends paid Purchase of own sharesPremium on allotment of shares during the year
31,745–––
3,200
50––– –
10,496 ––– –
73––– –
8,033(2,169)
(732)(52)
–
50,397(2,169)
(732)(52)
3,200
31 December 2009 34,945 50 10,496 73 5,080 50,644
13 EQUITY SHAREHOLDERS’ FUNDS2009 £’000
2008£’000
(Loss)/profit for the year
New share capital subscribed
Premium on shares issued in the year (net of expenses)
Dividends paid
Credit for share-based incentive schemes
Share-based payments in subsidiaries
Purchase of own shares
(2,169)
1,420
3,200
(732)
–
–
(52)
7,153
572
5,969
(556)
(272)
(178)
(71)
Net addition to equity shareholders’ funds
Opening equity shareholders’ funds
1,667
54,853
12,617
42,236
Closing equity shareholders’ funds 56,520 54,853

78
Notice of Annual General Meeting
Notice is hereby given that the Sixth Annual General
Meeting of the Company will be held at 11-13
Charterhouse Buildings, London EC1M 7AP on
Monday 17 May 2010 at 12.30pm, for the transaction
of the following business:
ORDINARY BUSINESS
1. To receive and adopt the Directors’ Report and
Financial Statements for the year ended 31
December 2009, together with the auditors’
report thereon.
2. To declare a final dividend of 0.80p per ordinary
share for the year ended 31 December 2009.
3. To receive and approve the Directors’
Remuneration Report for the year ended 31
December 2009.
4. To re-elect Mark Scott as a Director, who resigns
in accordance with the Company’s Articles of
Association.
5. To re-elect Chris Outram as a Director, who
resigns in accordance with the Company’s
Articles of Association.
6. To re-appoint Baker Tilly UK Audit LLP as auditor
of the Company to hold office until the next
General Meeting at which accounts are
laid and to authorise the Directors to fix their
remuneration.
SPECIAL BUSINESS
To consider and, if thought fit, pass the following
resolutions of which resolutions 7 and 8 are
ordinary resolutions and resolutions 8, 9 and 10
are special resolutions.
7. That, in substitution for existing authorities to
the extent unutilised, the directors be and are
hereby generally and unconditionally authorised
pursuant to section 551 of the Companies Act
2006 (“the Act”) to exercise all powers of the
Company to allot, grant options over, offer or
otherwise deal with or dispose of any relevant
securities (as defined in the Act) up to an
aggregate nominal amount of £2,583,780.30
to such persons, at such times and on such
terms and conditions as the directors determine
during the period expiring (unless previously
renewed, varied or revoked by the Company in
General Meeting) on whichever is the earlier of
the conclusion of the Annual General Meeting
of the Company held in 2011 and the date
falling 15 months after the date of passing of this
resolution, but the Company may make an offer
or agreement before the expiry of this authority
which would or might require relevant securities
to be allotted after expiry of this authority and
the directors may allot relevant securities in
pursuance of that offer or agreement.
8. That, subject to the passing of resolution 7 set
out in the notice convening this meeting, the
directors be empowered pursuant to section
570 of the Act, to allot equity securities (within
the meaning of the Act) of the Company for
cash pursuant to the general authority conferred
on them by resolution 7 as if section 561(1) of
the Act did not apply to any such allotment
provided that this power shall be limited to:
(a) the allotment of equity securities in
connection with an offer of equity securities
(whether by way of a rights issue, open offer
or otherwise), open for acceptance for a
period fixed by the directors, to holders
of ordinary shares on the register on any
fixed record date in proportion (as nearly
as practicable) to their holdings of ordinary
shares, subject to such exclusions or other
such arrangements as the directors may
deem necessary or expedient in relation to
fractional entitlements or legal or practical
problems arising under the laws of, or the
requirements of, any regulatory body or
any stock exchange in, any territory; and
(b) the allotment (otherwise than pursuant to
paragraph (a) above) of equity securities
up to an aggregate nominal amount of
£587,621.97,
and the power hereby conferred shall operate
in substitution for and to the exclusion of any
previous power given to the directors pursuant

79
to section 570 of the Act and shall expire on
whichever is the earlier of the conclusion of
the Annual General Meeting of the Company
held in 2011 and the date falling 15 months
after the date of the passing of this resolution,
unless such power is renewed or extended prior
to such expiry, except that the Company may
before the expiry of any power conferred by this
resolution make an offer or agreement which
would or might require equity securities to be
allotted after such expiry and the directors may
allot equity securities in pursuance of such offer
or agreement as if the power conferred hereby
had not expired.
This power applies in relation to a sale of shares
which is an allotment of equity securities by
virtue of Section 560(2) of the Act as if in the first
paragraph of this resolution the words “pursuant
to the general authority conferred on them by
resolution 8” were omitted.
9. That the Company be and is hereby granted
general and unconditional authority pursuant
to section 701 of the Act to make market
purchases (as defined in section 693 of the Act)
of any of its own ordinary shares of 10p each on
such terms and in such manner as the board
of directors of the Company may from time to
time determine provided that:
(a) the maximum number of shares authorised
to be purchased is 2,938,110 ordinary
shares of 10p each, being 5% of the shares
in issue as at 3 March 2010;
(b) the maximum price which may be paid for
a share is an amount equal to not more
than 105% of the average of the middle
market quotations for the shares taken from
the London Stock Exchange Daily Official
List for the five business days before the day
on which the purchase is made;
(c) the minimum price which may be paid for
a share is 10p exclusive of any attributable
expenses payable by the Company; and
(d) the authority conferred by this resolution
shall expire on the conclusion of the Annual
General Meeting of the Company held in
2011 and the date falling 15 months after
the date of the passing of this resolution,
unless such authority is renewed or
extended prior to such expiry, whichever is
the earlier, except that the Company may,
before such expiry, enter into a contract for
the purchase of its own shares which may
be completed by or executed wholly or
partly after the expiration of this authority.
10. That:
(a) all the provisions of the Company’s
Memorandum of Association (which, by
virtue of Section 28 of the Act, are treated
as provisions of the Company’s Articles
of Association with effect from 1 October
2009) be deleted; and
(b) the Articles of Association produced to the
meeting and signed by the Chairman for
the purpose of identification be approved
and adopted as the new Articles of
Association of the Company in substitution
for, and to the exclusion of the existing
Articles of Association, with effect from the
conclusion of the Annual General Meeting.
The principal changes introduced to the Articles of
Association are set out in Appendix 1.
By order of the Board
Mark Bentley
Company Secretary
16 April 2010
Registered Office
11-13 Charterhouse Buildings
London
EC1M 7AP

80
NOTES TO THE NOTICE OF ANNUAL
GENERAL MEETING
1. As a member of the Company, you are entitled
to appoint a proxy to exercise all or any of your
rights to attend, speak and vote at the Annual
General Meeting and you should have received
a proxy form with this notice of meeting. You can
only appoint a proxy using the procedures set out
in these notes and the notes to the proxy form.
2. A proxy does not need to be a member of the
Company but must attend the Annual General
Meeting to represent you. Details of how to
appoint the Chairman of the Annual General
Meeting or another person as your proxy using
the proxy form are set out in the notes to the
proxy form. If you wish your proxy to speak on
your behalf at the Annual General Meeting you
will need to appoint your own choice of proxy
(not the Chairman) and give your instructions
directly to him/her.
3. You may appoint more than one proxy
provided each proxy is appointed to exercise
rights attached to different shares. You may not
appoint more than one proxy to exercise rights
attached to any one share.
4. As permitted by Regulation 41 of the
Uncertificated Securities Regulations 2001,
Shareholders who hold their shares in
uncertificated form must be entered on the
Company’s share register by 12.30 p.m. on
15 May 2010 in order to be entitled to attend
and vote at the Annual General Meeting. Such
Shareholders may only cast votes in respect of
shares held at such time. Changes to entries on
the register of members after such time on such
date will be disregarded in determining the
rights of any person to attend and vote at the
Annual General Meeting.
5. To be effective, a proxy form must be duly
completed, executed and returned, together
with the power of attorney or other authority,
if any, under which it is signed, or a notarially
certified copy or a copy certified in accordance
with the Powers of Attorney Act 1971 of such
power of attorney or authority, so as to reach the
Company’s registrars, Computershare Investor
Services PLC, PO Box 82, The Pavilions, Bridgwater
Road, Bristol BS99 6ZY by 12.30 p.m. on 15 May
2010, being 48 hours prior to the time fixed for
the meeting or, in the case of an adjournment,
as at 48 hours prior to the time of the adjourned
meeting.
6. In the case of joint holders, where more than
one of the joint holders purports to appoint a
proxy, only the appointment submitted by the
most senior holder will be accepted. Seniority is
determined by the order in which the names of
the joint holders appear in the Company’s register
of members in respect of the joint holding (the
first-named being the most senior).
7. If multiple corporate representatives are
appointed, in order to facilitate voting by
corporate representatives at the Annual General
Meeting, arrangements will be put in place at the
Annual General Meeting so that:
(i) if a corporate member has appointed the
Chairman of the Annual General Meeting as
its corporate representative with instructions to
vote on a poll in accordance with the directions
of all the other corporate representatives
for that member at the Annual General
Meeting, then, on a poll, those corporate
representatives will give voting directions to
the Chairman and the Chairman will vote (or
withhold a vote) as corporate representative
in accordance with those directions; and
(ii) if more than one corporate representative
for the same corporate member attends the
Annual General Meeting but the corporate
member has not appointed the Chairman of
the Annual General Meeting as its corporate
representative, a designated corporate
representative will be nominated, from those
corporate representatives who attend, who
will vote on a poll and the other corporate
representatives will give voting directions to
that designated corporate representative.
Notice of Annual General Meeting (continued)

81
8. The following documents will be available at
the registered office of the Company on any
weekday (except Saturday) during normal
business hours from the date of this notice until
the date of the Annual General Meeting:
– a copy of the service agreements for the
Executive Directors;
– a copy of the letters of appointment for the
Non-Executive Directors;
– the Memorandum and Articles of Association
of the Company;
– a draft of the proposed new Articles of
Association of the Company (showing
changes from the existing Articles of
Association of the Company); and
– the register of interests of the directors (and
their families) in the share capital of the
Company.
These documents will also be available for
inspection during the Annual General Meeting and
for at least 15 minutes before it begins.
EXPLANATION OF SPECIAL BUSINESS AT THE ANNUAL
GENERAL MEETING
Explanation of Resolution 7
(Authority to allot securities)
Resolution 7, which will be proposed as an ordinary
resolution, would give the directors authority to
allot shares up to a maximum nominal amount
of £2,583,780.30 being 44% of the Company’s
issued share capital as at 3 March 2010. The existing
authority would be revoked and this new authority
would expire on the date of the 2011 Annual
General Meeting or 17 August 2011, whichever is
the earlier.
Explanation of Resolution 8
(Disapplication of pre-emption rights)
Resolution 8, which will be proposed as a special
resolution, would renew the power of the directors
to allot shares for cash as though the rights of pre-
emption conferred by section 561(1) of the Act
did not apply:
(a) in respect of the whole of the authorised
but unissued share capital in connection
with an offer to existing shareholders in
proportion to their existing holdings save
that the directors are allowed to offer
shares to existing shareholders otherwise
than strictly in proportion to their holdings
where, for example, overseas regulations
make it difficult to offer shares pro rata
to existing overseas shareholders or when
dealing with fractions of shares, and
(b) up to a nominal amount of £587,621.97,
being 10%, of the issued share capital of
the Company as at 3 March 2010 (to give
the directors some flexibility in financing
business opportunities as they arise).
This power would expire on the date of the 2011
Annual General Meeting or 17 August 2011,
whichever is the earlier.
Explanation of Resolution 9
(Authority to purchase own shares)
In certain circumstances it may be advantageous
for the Company to purchase its own shares.
Resolution 9, which will be proposed as a special
resolution, seeks authority from shareholders to
do so, such authority to expire on the date of
the 2011 Annual General Meeting or 17 August
2011, whichever is the earlier. The directors intend
to exercise this power only if and when, in the
light of market conditions prevailing at the time,
they believe that the effect of such purchases
will be to increase earnings per share and is in
the best interests of shareholders generally. Other
investment opportunities, appropriate gearing
levels and the overall position of the Company
will be taken into account before deciding upon
this course of action. Any shares purchased in this
way will be cancelled and the number of shares
in issue will be accordingly reduced.
This resolution specifies the maximum number of
shares which may be acquired (being 2,938,110
ordinary shares, which is 5% of the Company’s
issued share capital as at 3 March 2010 of
58,762,197 ordinary shares) and the maximum and
minimum prices at which they may be bought.

82
Explanation of Resolution 10
(Changes to Memorandum of Association and
Adoption of new Articles of Association)
Resolution 10, which will be proposed as a special
resolution, would (a) remove those provisions of
the memorandum of association of the Company
which, by virtue of the Companies Act 2006, are
to be treated as forming part of the Company’s
Articles of Association with effect from 1 October
2009 and (b) adopt new articles of association
of the Company (the “New Articles”) primarily
to bring them into line with the provisions of the
Companies Act 2006 that were introduced on 1
October 2009.
An explanatory note of the principal changes
to the Company’s current articles of association
(the “Current Articles”) is set out in Appendix 1.
Other changes, which are of a minor, technical
or clarifying nature and also some more minor
changes which merely reflect changes made by
the Companies Act 2006 have not been noted
in Appendix 1. The new Articles showing all the
changes to the current Articles are available for
inspection.
APPENDIX I
EXPLANATORY NOTE OF PRINCIPAL CHANGES TO
THE COMPANY’S ARTICLES OF ASSOCIATION
1. The Company’s objects
The provisions regulating the operations of the
Company are currently set out in the Company’s
memorandum and Articles of Association. The
Company’s memorandum contains, among
other things, the objects clause which sets out
the scope of the activities which the Company
is authorised to undertake. This is drafted to give
a wide scope.
The Companies Act 2006 significantly reduces
the constitutional significance of a company’s
memorandum. The Companies Act 2006
provides that a memorandum will record only
the names of subscribers and the number of
shares each subscriber has agreed to take in
the company. Under the Companies Act 2006
the objects clause and all other provisions
which are currently contained in a company’s
memorandum, for existing companies at 1
October 2009, will be deemed to be contained
in a company’s Articles of Association but the
company can remove these provisions by
special resolution.
Further the Companies Act 2006 states that
unless a company’s articles provide otherwise,
a company’s objects are unrestricted. This
abolishes the need for companies to have
objects clauses. For this reason the Company is
proposing to remove its objects clause together
with all other provisions of its memorandum
which, by virtue of the Companies Act 2006,
are to be treated as forming part of the
Company’s Articles of Association from 1
October 2009. Resolution 10(a) confirms the
removal of these provisions for the Company.
As the effect of this resolution will be to remove
the statement currently in the Company’s
memorandum of association regarding limited
liability, the New Articles also contain an express
statement regarding the limited liability of the
shareholders.
2. Articles which duplicate statutory provisions
Provisions in the Current Articles which replicate
provisions contained in the Companies Act 2006
are in the main to be removed in the New Articles.
This is in line with the approach advocated by the
UK Government that statutory provisions should
not be duplicated in a company’s constitution.
3. Change of name
Currently, a company can only change its name
by special resolution. Under the Companies
Act 2006 a company will be able to change its
name by other means provided for by its articles.
To take advantage of this provision, the New
Articles enable the directors to pass a resolution
to change the Company’s name.
4. Authorised share capital and unissued shares
The Companies Act 2006 abolishes the
requirement for a company to have an
authorised share capital and the New Articles
Notice of Annual General Meeting (continued)

83
reflect this. Directors will still be limited as to the
number of shares they can at any time allot
because allotment authority continues to be
required under the Companies Act 2006, save in
respect of employee share schemes.
5. Redeemable shares
At present if a company wishes to issue
redeemable shares, it must include in its
articles the terms and manner of redemption.
The Companies Act 2006 enables directors to
determine such matters instead provided they
are so authorised by the articles. The New Articles
contain such an authorisation. The Company
has no plans to issue redeemable shares but if
it did so the directors would need shareholders’
authority to issue new shares in the usual way.
6. Suspension of registration of share transfers
The Current Articles permit the directors to
suspend the registration of transfers. Under the
Companies Act 2006 share transfers must be
registered as soon as practicable. The power in
the Current Articles to suspend the registration
of transfers is inconsistent with this requirement.
Accordingly, this power has been removed in the
New Articles.
7. Authority to purchase own shares,
consolidate and sub-divide shares, and
reduce share capital
Under the law previously in force a company
required specific enabling provisions in its articles
to purchase its own shares, to consolidate or
sub-divide its shares and to reduce its share
capital or other undistributable reserves as
well as shareholder authority to undertake the
relevant action. The Current Articles include these
enabling provisions. Under the Companies Act
2006 a company will only require shareholder
authority to do any of these things and it will
no longer be necessary for articles to contain
enabling provisions. Accordingly the relevant
enabling provisions have been removed in the
New Articles.
8. Vacation of office by directors
The Current Articles specify the circumstances
in which a director must vacate office. The
New Articles update these provisions to reflect
the approach taken on mental and physical
incapacity in the model articles for public
companies produced by the Department for
Business, Enterprise and Regulatory Reform
9. Distribution of assets otherwise than cash
The Current Articles contain provisions dealing
with the distribution of assets in kind in the
event of the Company going into liquidation.
These provisions have been removed in the
New Articles on the grounds that a provision
about the powers of liquidators is a matter for
insolvency law rather than the articles and that
the Insolvency Act 1986 confers powers on the
liquidator which would enable it to do what is
envisaged by the Current Articles.
10. Use of seals
A company used to have authority in its articles
to have an official seal for use abroad. After 1
October 2009 such authority will no longer be
required. Accordingly the relevant authorisation
has been removed in the New Articles.
The New Articles provide an alternative option
for execution of documents (other than share
certificates). Under the New Articles, when the
seal is affixed to a document it may be signed
by one authorised person in the presence of
a witness, whereas previously the requirement
was for signature by either a director and the
secretary or two directors or such other person
or persons as the directors may approve.
11. General
Generally the opportunity has been taken to
bring clearer language into the New Articles
and in some areas to conform the language
of the New Articles with that used in the model
articles for public companies produced by
the Department for Business, Enterprise and
Regulatory Reform.

84
Directors
Allan Rich –
Non-Executive Chairman
Allan Rich has spent all his
working life in the advertising
business. He co-founded
Davidson Pearce Berry and
Spottiswood which became
one of the most successful agencies in the UK during
the late 60’s and early 70’s. In 1975 he founded
the first independent media planning and buying
company in the UK which he called The Media
Business. In 1995 he took the company to the
London Stock Market and in 1998 sold his group to
Grey Advertising New York in order to create a truly
global media organisation, MediaCom. Over the
following 4 years MediaCom became the largest
media company in the UK and number 5 in the
world. Allan is a member of the Audit Committee.
Mark Scott –
Chief Executive
From 1994 to 1998 Mark
Scott was a senior executive
at WPP Group plc, latterly
being appointed Operations
Director for the Group with
responsibility for the Group’s European and Asian
acquisition programme. Post WPP he became
Executive Vice President of Lighthouse Global
Network LLC where he helped acquire and
consolidate more than 15 marketing services
companies. From 2000 to 2002 he was appointed
a senior executive of Lake Capital Management,
a private equity firm, where he was responsible for
a range of investments in marketing service firms.
He has been a member of the Boards of a number
of public companies in the sector including
Watermark Group plc, Chime Communications
Group plc, Chemistry Communications Group plc
and Fitch plc. He obtained his MBA from Harvard
Business School and a first class honours degree in
English Literature from Oxford University.
Mark Bentley –
Group Finance Director
Mark Bentley joined Cello
Group as Group Finance
Director in May 2005. He is
also Company Secretary.
Mark previously worked
for Citigate Dewe Rogerson which he joined in
2000 as Financial Controller and spent the next
five years in various senior finance roles within
Incepta Group plc, including Finance Director of
Citigate Dewe Rogerson from February 2001. Whilst
maintaining the Finance Director role, he took on
wider operational responsibilities when he was
appointed Chief Operating Officer in November
2003. From June 2002 he also had the parallel role
of Finance Director of the Citigate SMARTS regional
network of offices. Prior to Citigate he was Financial
Projects Manager at Hodder Headline plc. Mark
qualified as a chartered accountant with Coopers
& Lybrand in 1996.
Paul Hamilton –
Non-Executive Director and
Senior Independent Director
Paul Hamilton was Senior
Independent Director of
Wellington Underwriting plc
until 31 December 2006. Prior
to this Paul worked in both corporate finance at
UBS Warburg where he was a Managing Director,
and in corporate broking at Rowe & Pitman where
he was a Partner. In recent years Paul has also
been Chairman of the FSA Listing Rules Committee
and a member of the FSA Listing Authority
Advisory Committee and London Stock Exchange
Primary Markets Committee. Paul chairs both the
Nomination and Remuneration Committee and is
a member of the Audit Committee.

85
will David – Independent
Non-Executive Director
Will David was Non-Executive
Chairman of Polaron plc until
March 2007 and Chairman
of its Audit and Remuneration
Committees, and of Orca
Interactive Limited until it was taken over in May
2008. He is currently Non-Executive Chairman of
Advanced Power Components plc. He has more
than 20 years’ experience working in corporate
advisory and broking roles for small and mid
cap companies. Will has also worked at Investec
Henderson Crosthwaite, PricewaterhouseCoopers,
Hoare Govett & Co and The London Stock
Exchange. During his professional career Will has
worked on over twenty flotations for clients across
a range of sectors. His experience also includes
acquisitions and disposals, public takeovers and
secondary fundraisings and provision of advice
on corporate governance matters. Will chairs the
Audit Committee and is a member of both the
Nomination and Remuneration Committees.
Chris Outram – Independent
Non-Executive Director
Chris Outram has
accumulated more than 30
years experience helping
companies develop and
refine their growth strategies,
the last 20 years of which he gained with OC&C
Strategy Consultants, a firm which he founded in
1987 and which now operates out of 13 offices
worldwide. Chris has also served on the boards
of AIM and main listed companies as well as a US
listed company. As such he brings a broad range
of experience to Cello encompassing Corporate/
Business Unit Strategy, Operational performance
improvement and M&A as well as organisational
advice. He has worked across multiple sectors many
of which were international in nature, particularly
transatlantic. Chris read two undergraduate
degrees and has an MBA from INSEAD. Chris is a
member of the Remuneration Committee.

8686
COMPANY SECRETARY Mark Bentley
REGISTERED OFFICE 11-13 Charterhouse Buildings London EC1M 7AP
INDEPENDENT AUDITORS Baker Tilly UK Audit LLP Chartered Accountants 2 Bloomsbury Street London WC1B 3ST
NOMINATED ADVISER & BROKER Altium Capital Limited30 St. James’s SquareLondonSW1Y 4AL
SOLICITORS Marriott Harrison Staple Court 11 Staple Inn Buildings London WC1V 7QH
PRINCIPAL BANKERS Royal Bank of Scotland plc 280 Bishopsgate London EC2M 4RB
REGISTRARS Computershare Investor Services plc PO Box 82 The Pavilions Bridgwater Road Bristol BS99 7NH
Advisers

8787
HEAD OFFICE11-13 Charterhouse Buildings London EC1M 7AP tel: +44 (0)20 7812 8460 www.cellogroup.co.uk Contact: Mark Scott
CELLO RESEARCH AND CONSULTING
Insight Research Group 11-13 Charterhouse Buildings London EC1M 7AP tel: +44 (0)20 7608 9300 www.insightrg.com Contact: Jane Shirley, Nicola Cowland
Insight Research Group USA 1465 Irving Street Rahway NJ 07065 tel: +1 732 587 2900 www.insightrg.com Contact: Avanti Ananthram
RS Consulting Group (London)Priory House 8 Battersea Park Road London SW8 4BH tel: +44 (0)20 7627 7700 www.rsconsulting.com Contact: Phil Stubington
Leapfrog13 High Street Windsor Berkshire SL4 1LD tel: +44 (0)175 327 1400 www.leapfrogresearch.co.uk Contact: Judy Taylor
Leapfrog in America19 West 24th Street 10th Floor New York NY 10011 tel: +1 212 488 6300 www.leapfroginamerica.com Contact: Mark Rodgers
Rosenblatt155 Regents Park Road London NW1 8BB tel: +44 (0)20 7483 0583 www.rosenblatt.co.uk Contact: Alex Maule
SMT Consulting Wendover House 24 London End Beaconsfield, Buckinghamshire HP9 2JH tel: +44 (0)1494 731750 www.smtconsulting.co.uk Contact: John Spear
The Value EngineersWendover House 24 London End Beaconsfield, Buckinghamshire HP9 2JH tel: +44 (0)1494 680999 www.thevalueengineers.com Contact: Owen Williams
TMIThe Holos, Gorcott Hill, Beoley, Redditch B98 9ET tel: +44 (0)845 330 8312 www.tmi.co.uk Contact: Gillian James
The MSI Consultancy Weaver’s Yard, West Street Farnham, Surrey GU9 7DN tel: +44 (0)1252 717099 www.msi.co.uk Contact: Stephen Highley
CELLO mruk research City Wall House 32 Eastwood Ave Glasgow G41 3NS tel: +44 (0)141 533 3350 www.mruk.co.uk Contact: Jim Law
2CV Research34 Rose Street London WC2E 9EB tel: +44 (0)20 7655 9900 www.2CV.co.uk Contact: Vincent Nolan
Group Directory

88
TANGIBLE GROUP116 Dundas Street Edinburgh EH3 5EE tel: +44 (0)131 556 8002 www.tangiblegroup.co.uk Contact: Andy Carolan, John Rowley
tangible37 The Shore Edinburgh EH6 6QU tel: +44 (0)131 526 3069 www.tangible.uk.com Contact: Melanie Morris
tangible:responseSt James’s House St James Square Cheltenham GL50 3PR tel: +44 (0)1242 258700 www.tangible.uk.com Contact: Paul Handley
tangible:financial7 Midford Place London W1T 5PG tel: +44 (0)20 7881 3200 www.tangible.uk.com Contact: Avril Ellis
tangible:dataSt James’s House St James Square Cheltenham GL50 3PR tel: +44 (0)1242 258700 www.tangibledata.co.uk Contact: Nigel Magson
Farm 7 Midford Place London W1T 5PG tel: +44 (0)20 7874 6550 www.farmcom.co.uk Contact: Owen Lee
Leith 37 The Shore Edinburgh EH6 6QU tel: +44 (0)131 561 8600 www.leith.co.uk Contact: Richard Marsham
Blonde 116 Dundas Street Edinburgh EH3 5EE tel: +44 (0)131 474 9525 www.blondedigital.com Contact: Pete Burns
OomphThe Old Museum Tetbury Road Cirencester GL7 1UP tel: +44 (0)1285 883790 www.oomphagency.com Contact: Stephen Priestnall
BrightsourceSt James’s House St James Square Cheltenham GL50 3PR tel: +44 (0)1242 534200 www.brightsource.co.uk Contact: Peter Frings
Magnetic116 Dundas Street Edinburgh EH3 5EE tel: +44 (0)131 555 7510 www.magnetic-advertising.com Contact: Guy Hundleby
Group Directory (continued)

Page
Financial Highlights 1
Positioning and Strategy 2-3
Chairman’s Statement 4-9
Cello Research and Consulting 10-11
Tangible Group 12-13
Directors’ Report 14-17
Corporate Governance 18-19
Report of the Remuneration Committee 20-22
Independent Auditors’ Report 23
Consolidated Income Statement 24-25
Consolidated Statement of Comprehensive Income 25
Consolidated Balance Sheet 26
Consolidated Cash Flow Statement 27
Consolidated Statement of Changes in Equity 28
Consolidated Financial Statements – Accounting Policies 29-34
Notes to the Consolidated Financial Statements 35-68
Company Balance Sheet 69
Company Financial Statements – Accounting Policies 70
Notes to the Company Financial Statements 71-77
Notice of Annual General Meeting 78-83
Directors 84-85
Advisers 86
Group Directory 87-88
Contents
The Cello Annual Report 2009 is made from Naturalis Recycled Smooth paper, sourced from 50% FSC-certified recycled, 20% FSC virgin pulp and 30% mill broke. It is manufactured in Scotland.

Cello
Gro
up p
lc Annual Rep
ort 2009
Annual ReportYear Ended 31 December 2009
Cello Group plc11-13 Charterhouse BuildingsLondon EC1M 7APtel: +44 (0)20 7812 8460www.cellogroup.co.uk
Company Registration No. 05120150