Embed Size (px)
Citation preview

Cell Stem Cell, Volume 7
Supplemental Information
A Distinctive DNA Damage Response in Human
Hematopoietic Stem Cells Reveals an
Apoptosis-Independent Role for p53 in Self-Renewal Michael Milyavsky, Olga I. Gan, Magan Trottier, Martin Komosa, Ofer Tabach, Faiyaz Notta, Eric Lechman, Karin G. Hermans, Kolja Eppert, Zhanna Konovalova, Olga Ornatsky, Eytan Domany, M. Stephen Meyn, and John E. Dick Inventory of supplemental information Supplemental Data: Supplemental experimental procedures Supplemental References Figure S1, related to Figure1; Figure S2, Related to Figure3; Figure S3, Related to Figure4; Figure S4, Related to Figure5; Table S1, related to Figure5; Table S2, related to Figures 3 and 5; Table S3

Supplemental Experimental Procedures Sample collection and purification
Samples of cord blood (CB) were obtained according to procedures approved by the
institutional review board of Trillium Hospital (Mississauga, Ontario) and University
Health Network (Toronto, Canada). CB samples were collected and purified as described
(Guenechea et al., 2001). For sorting experiments, enriched CB samples were pooled and
then incubated with fluorescein isothicyanate (FITC)-conjugated monoclonal anti-
CD45RA (Beckton Dickinson, San Jose, CA), phycoerythrin(PE)-conjugated monoclonal
anti-CD90 (BD Pharmingen), phycoerythrin-cyanin7(Pc7)-conjugated monoclonal anti-
CD38 and allophycocyanin(APC)-conjugated monoclonal anti-CD34 antibodies (Beckton
Dickinson). Cells were washed, resuspended in phosphate buffered saline (PBS)
containing 5% fetal calf serum (FCS, Sigma, Oakville, ON, Canada) and were sorted on a
MoFlo (Dako Cytomation). Isotype controls of FITC, PE, Pc7 and APC, as well as the
forward-scatter and side-scatter properties of normal viable cord blood cells, were used to
establish sorting gates.
Immunofluorescence
Following irradiation (IR) with 3Gy on Gammacell 1000 Research Irradiator (Best
Theratronics Ltd, Ottawa, ON, Canada), Lin- CB cells were allowed to adhere to poly-L-
lysine coated slides (Electron Microscopy Sciences, PA) for 30 min at 37 °C prior to
indicated time points. Cells were treated as described previously(Stavropoulos et al.,
2002). The cells were labeled with antibodies against γH2AX (1:3000, Upstate, MA)
overnight at 4 °C, and labeled with FITC-conjugated donkey anti-mouse and TRITC-

conjugated donkey anti-rabbit secondary antibodies (Jackson ImmunoResearch, PA) for 1
hr at room temperature. DNA was stained with 0.1 µg/ml DAPI for 5 min and slides were
mounted with SlowFade Antifade medium (Invitrogen, ON, Canada).
To quantitate the number of γH2AX foci per cell, nuclei were selected with DAPI,
excluding cells undergoing apoptosis based on nuclear morphology. Images were
obtained as described previously(Bradshaw et al., 2005). Resultant stacks were subjected
to iterative deconvolution analysis using the 3D rendering program Volocity 3.7
(Improvision, Coventry, UK).
Neutral comet assay
At indicated time points after 15Gy IR, cells were harvested and processed on ice. Five to
ten thousand cells were mixed with 0.1% low-melting point agarose, pipetted onto pre-
coated microscope slides and placed at 4 °C. Once solidified, the slides were immersed in
prechilled lysis solution (Trevigen, MD) for 1 hr at 4 °C. Following lysis, slides were
electrophoresed in prechilled 0.5X TBE buffer (pH 8.5) at 32 V for 25 min. Slides were
fixed in cold methanol for 5 min, and stained with ethidium bromide immediately prior to
analysis. Comets were analyzed using a Zeiss Axioskop microscope fitted with a 20X
objective and Retiga 1300 camera. Komet 5.5 software (Kinetic Imaging Ltd.,
Nottingham, UK) was used to determine “Olive Tail Moments” of individual nuclei.
Viral Constructs
Bidirectional lentiviral construct MA1 (Amendola et al., 2005) was used to clone GSE56
and Bcl-2 by replacing truncated NGFR reporter gene.

p53 and ASPP1 shRNAs were designed using the Dharmacon algorithm
(www.dharmacon.com). 19 nucleotides sense siRNA were used as followed: p53, 5’-
GACTCCAGTGGTAATCTAC- 3’; red fluorescent protein (RFP), 5’-
GTGGGAGCGCGTGATGAAC-3’; ASPP1#41, 5’- GAGCAACAATGAACAGATT -
3’; ASPP1#71: 5’ – GCCTCAACCATAAGCGACATT -3’; ASPP1#91: 5’ –
CCTGTCGAGATGTTGTAGAAT -3’. Complimentary oligos were annealed to create
PacI and XbaI overhangs for cloning into the lentivector containing the H1 promoter and
enhanced green fluorescent protein (EGFP) gene, an internal riboromal entry site and
puromycin selection cassette (H1-GIP).
Ex-vivo experiments
To determine EPO-independence of transduced cells, 10% bovine serum albumin,
insulin and transferrin (BIT – StemCell Technologies, Canada) were used in medium
instead of FCS and EPO was omitted from cytokines cocktail used to assay clonogenic
cell content in methylcellulose cultures.
TEX cell line was cultured in IMDM supplemented with 15% FCS, SCF
(20ng/ml) and IL-3 (2ng/ml).
NOD/SCID mouse repopulation.
Monoclonal anti-CD122 antibodies were generated from the hybridoma cell line TM-β (a
gift from T.Tanaka, Osaka University Medical Center, Osaka, Japan). Doses of injected
cells were chosen to provide substantial engraftment for non-irradiated cells. Thus, we
injected the cell equivalent of 20 000 and 40 000 of freshly thawed Lin-CB for non-

irradiated and irradiated cells, respectively. Mice were sacrificed following 7-10 weeks
post-transplantation and spleen, bone marrow from the right injected femur and combined
bone marrow (BM) from left femur, tibia and pelvis were analyzed by flow cytometry.
Engraftment of human CD45+ cells as well as of myeloid (CD45+CD33+), B-lymphoid
(CD45+CD19+), and erythroid (CD45-CD36+glycophorin A-positive) human cells was
assessed.
FACScalibur™ or LSR II cytometers (Becton Dickinson) were used for flow
cytometry. Human cells from transplanted NOD-SCID mice were assessed awith APC-
conjugated anti-human CD45, PE-conjugated anti-CD36, anti-CD33 (Becton Dickinson)
and anti-GlyA (Coulter), Pc5-conjugated anti-human CD19 (Coulter). EGFP fluorescence
was detected with channel FL1 to the FITC emission profile. During quadrant analysis,
only fluorescence excluding more than 99% of isotypic control events was considered
specific. Cell Quest Pro software (Becton Dickinson) and FlowJo (Tree Star) were used
for data acquisition and analysis.
For secondary transplantation cells from the injected right femur (RF) and BM
were centrifuged, resuspended in PBS and 5% FCS and separately injected IF into NOD-
SCID mice pre-conditioned as described for primary transplantations. The secondary
recipients were killed in 7-10 weeks after transplantation and human engraftment was
assessed by flow cytometry as described for primary recipients.
To quantify gH2AX foci in primitive cell sub-fraction, lineage depletion of
human cells from engrafted mice was done as described (McKenzie et al., 2007).

Real Time PCR primers: GPDH, Fwd. ACCCACTCCTCCACCTTTGA, Rev. CTGTTGCTGTAGCCAAATTCGT p53, Fwd. CCCAAGCAATGGATGATT TGA, Rev. GGCATTCTGGGAGCTTCATCT p21, Fwd. CGCGACTGTGATGCGCTAATG, Rev. GGAACCTCTCATTCAACCGCC Puma, Fwd. CCTGGAGGGTCCTGTACAATCT, Rev. GCACCTAATTGGGCTCCATCT Killer/DR5, Fwd. TGACTCATCTCAGAAATGTCAATTCTTA, Rev. GGACACAAGAAGAAAACCTTAATGC ASPP1 (PPP1R13B), Applied Biosystems Gene Expression Assay, Taqman(R), Assay ID: Hs00367408_m1 Supplemental References:
Amendola, M., Venneri, M.A., Biffi, A., Vigna, E., and Naldini, L. (2005). Coordinate dual-gene transgenesis by lentiviral vectors carrying synthetic bidirectional promoters. Nat Biotechnol 23, 108-116. Bradshaw, P.S., Stavropoulos, D.J., and Meyn, M.S. (2005). Human telomeric protein TRF2 associates with genomic double-strand breaks as an early response to DNA damage. Nat Genet 37, 193-197. Guenechea, G., Gan, O.I., Dorrell, C., and Dick, J.E. (2001). Distinct classes of human stem cells that differ in proliferative and self-renewal potential. Nat Immunol 2, 75-82. McKenzie, J.L., Gan, O.I., Doedens, M., and Dick, J.E. (2007). Reversible cell surface expression of CD38 on CD34-positive human hematopoietic repopulating cells. Exp Hematol 35, 1429-1436. Stavropoulos, D.J., Bradshaw, P.S., Li, X., Pasic, I., Truong, K., Ikura, M., Ungrin, M., and Meyn, M.S. (2002). The Bloom syndrome helicase BLM interacts with TRF2 in ALT cells and promotes telomeric DNA synthesis. Hum Mol Genet 11, 3135-3144.

Figure S1. Neutral comet assay analysis comparing Progenitor population and quiescent
primary fibroblasts after 15Gy of IR.
Progenitors referred to Lin-CD34+38+ CB cells after sorting and incubation in X-VIVO
medium supplemented with 1% BSA for 1h at370C. Quiescent primary fibroblasts were
prepared by culturing for in 0.1% FBS. Cells were harvested 0.5, 1, 3 or 6 hours after
exposure to IR, and plotted relative to OTM values obtained immediately after damage.
Figure S1, related to Figure1
30
40
50
60
70
80
90
100
0.5 1 3 6
Time after 15 Gy IR (hrs)
Oliv
e Ta
il M
omen
t (%
initi
al)
Progenitors
quiescent fibroblasts
1 hr 3 hr
20

Figure S2. Roles of p53, Bcl-2 and ASPP1 in the survival of Lin-CB cells.
A) Inactivation of p53 and overexpression of Bcl-2 partially rescues CFC after
irradiation. Relative survival of CFC with inactivated p53 or overexpressed Bcl-2
(calculated by dividing number of colonies scored in the irradiated plate by the number of
colonies from the same fraction counted in the non-irradiated plate). Bars represent
means ± standard deviation, * p<0.05 versus Ctrl.
B) Analysis of ASPP1 mRNA in sorted cord blood derived Lin-CD34+38- and Lin-
CD34+38+ subfractions (n=3 of independent cord blood sorts).
C) Validation of shASPP1 lentiviral constructs knokdown efficiency. 293HEK cells were
infected with the indicated shRNA constructs and then selected with puromycin (3μg/ml)
for 3 days. Relative expression level of ASPP1 was determined by Q-PCR. Gene specific
expression levels were normalized to the levels of the β-actin housekeeping control for
the same cDNA sample.
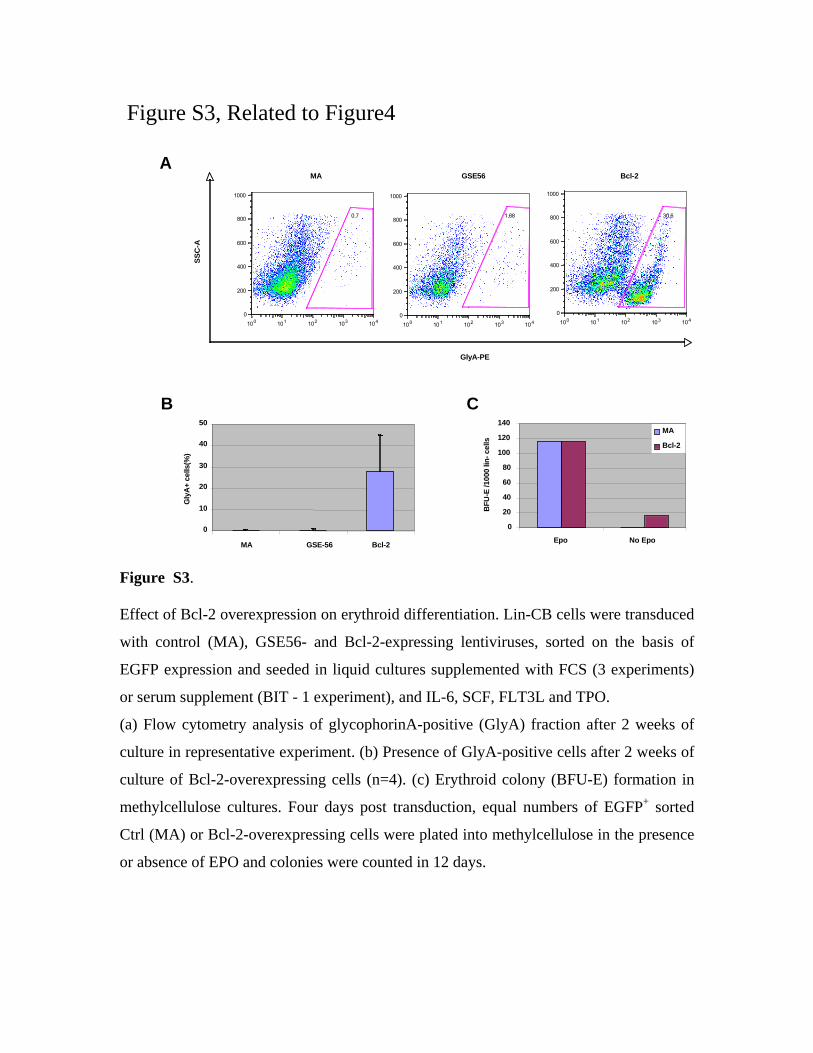
Figure S3.
Effect of Bcl-2 overexpression on erythroid differentiation. Lin-CB cells were transduced
with control (MA), GSE56- and Bcl-2-expressing lentiviruses, sorted on the basis of
EGFP expression and seeded in liquid cultures supplemented with FCS (3 experiments)
or serum supplement (BIT - 1 experiment), and IL-6, SCF, FLT3L and TPO.
(a) Flow cytometry analysis of glycophorinA-positive (GlyA) fraction after 2 weeks of
culture in representative experiment. (b) Presence of GlyA-positive cells after 2 weeks of
culture of Bcl-2-overexpressing cells (n=4). (c) Erythroid colony (BFU-E) formation in
methylcellulose cultures. Four days post transduction, equal numbers of EGFP+ sorted
Ctrl (MA) or Bcl-2-overexpressing cells were plated into methylcellulose in the presence
or absence of EPO and colonies were counted in 12 days.
Figure S3, Related to Figure4
MA GSE56 Bcl-2
100 101 102 103 1040
200
400
600
800
1000SS
C-A
30.6
100 101 102 103 104
GlyA-PE
0
200
400
600
800
1000
1.68
100 101 102 103 1040
200
400
600
800
1000
0.7
0
10
20
30
40
50
MA GSE-56 Bcl-2
Gly
A+
cells
(%)
A
B
0
20
40
60
80
100
120
140
Epo No Epo
BFU
-E /1
000
lin- c
ells
MA
Bcl-2
C

Figure S4. Differentiation profile of human grafts from Lin-CB cells expressing Ctrl,
p53KD, or Bcl-2 genes. (a) Representative flow cytometry analysis of human
engraftment. Erythroid (CD45-CD36+GlyA+), myeloid (CD45+CD33+) and B- lymphoid
(CD45+CD19+) human cells were assessed. (b) Median value for erythroid (GlyA - red),
myeloid (CD33- green) and B-lymphoid (CD19 - blue) engraftment in each group (Ctrl
NT, n=24; p53KD NT, n= 23; Bcl-2 NT, n=8; p53KD IR, n=15; Bcl-2 IR, n=6).
Figure S4, Related to Figure5
CD45(%)
100 101 102 103 104100
101
102
103
10499.8
0
100 101 102 103 104100
101
102
103
104 2.98 5.05
88.7100 101 102 103 104
0
50
100
150
200
25094.1
CD19(%)
100 101 102 103 104100
101
102
103
104 6.74
8.23
SSC
Gly
A(%
)
EGFP
(%)
CD
33(%
)
A
B
0
10
20
30
40
50
60
70
80
90
100
Ctrl, nt p53,KD, nt Bcl-2, nt p53KD, IR Bcl-2, IR
Med
ian
(%) GlyA
CD33
CD19

Table S2. Effect of p53 Inactivation on the Survival of CFC and HSC after 3 Gy of
Irradiation (Related to Figures 3 and 5)
Table S3. Effect of p53 inactivation and Bcl-2 overexpression on g-H2AX foci accumulation in un-irradiated human Lin- primitive cells following transplantation
Human hematopoietic Lin- cells were obtained from the engrafted primary or secondary mice and used for g-H2AX immunofluorescent analysis. N indicates the number of cells scored. Results represent means of 2-3 independent experiments.
Mean number of foci per nucleus MA p53KD Bcl-2
Primary recipient 2.3 N=132
2.1 N=126
2.5 N=73
Secondary recipient
2.6 N=78
6.8 N=71
1.2 N=27
Dose of GFP+ CB cells injected permouse
(equivalent of Day 0)
shRFPmice engrafted*/ total mice
transplanted
shp53mice engrafted* / total mice
transplanted
500 Not done 3 / 7
1000 7 / 12 4 / 6
2000 5 / 12 2 / 6
4000 4 / 6 7 / 7
Estimated frequency of HSC (95%confidence interval)
1 in 2538(1502 Š 4288)
1 in 1537(1155-2044)
Table S1, related to Figure5
Limiting dilution analysis of HSC frequency in control ( shRFP) andp53-knockdown (shp53) groups.
*Mice engrafted: refers to animals with human cells in both injected femur and collateral bones. HSC frequency was calculated using L-CalcŖ Software for Limiting Dilution Analysis from StemCell Technologies, Vancouver, Canada.
Surviving fraction (% of NT) Relative benefit of p53inactivation
Cntr p53KDCFC, 3 Gy 11.9 20.3 x1.7HSC, 3Gy 0.7 4.0 x5.7