Embed Size (px)
Citation preview

1
Cell fate-decision as high-dimensional critical state transition 1
2
Mitra Mojtahedi# 1,2, Alexander Skupin# 2,3, Joseph Zhou2 , Ivan G. Castaño1,5, 3
Rebecca Y. Y. Leong-Quong1, Hannah Chang4, Alessandro Giuliani6 and Sui 4
Huang* 1,2 5
6
Affiliation: 7 1 Department of Biological Sciences, University of Calgary, 2500 University Dr. NW, Calgary, AB T2N 8
1N4, Canada 9 2 Institute for Systems Biology, 401 Terry Ave N, Seattle, WA 98109, USA 10 3 Luxembourg Centre for Systems Biomedicine, 7, Avenue des Hauts-Fourneaux L-4362 Esch-sur Alzette, 11
Luxembourg 12 4 5AM Ventures, 2200 Sand Hill Road, Suit 110, Menlo Park, CA 94025 13 5 Corporación Parque Explora, departament of innovation and design, Colombia 14 6 Istituto Superiore di Sanità, Roma, Italy 15
*email address: [email protected] 16
# equal contribution 17
18
19
Abstract 20
Cell fate choice and commitment of multipotent progenitor cells to a differentiated 21
lineage requires broad changes of their gene expression profile. However, how 22
progenitor cells overcome the stability of their robust gene expression configuration 23
(attractor) and exit their state remains elusive. Here we show that commitment of 24
blood progenitor cells to the erythroid or the myeloid lineage is preceded by the 25
destabilization of their high-dimensional attractor state and that cells undergo a 26
critical state transition. Single-cell resolution analysis of gene expression in 27
populations of differentiating cells affords a new quantitative index for predicting 28
critical transitions in a high-dimensional state space: decrease of correlation 29
between cells with concomitant increase of correlation between genes as cells 30
approach a tipping point. The detection of “rebellious cells” which enter the fate 31
opposite to the one intended corroborates the model of preceding destabilization of 32
the progenitor state. Thus, “early-warning signals” associated with critical 33
transitions can be detected in statistical ensembles of high-dimensional systems, 34
offering a formal tool for analyzing single-cell’s molecular profiles that goes beyond 35
computational pattern recognition but is based on dynamical systems theory and 36
can predict impending major shifts in cell populations in development and disease. 37
38
Introduction 39
.CC-BY-NC-ND 4.0 International licensepeer-reviewed) is the author/funder. It is made available under aThe copyright holder for this preprint (which was not. http://dx.doi.org/10.1101/041541doi: bioRxiv preprint first posted online Feb. 26, 2016;
2
A multipotent stem cell or progenitor cell is in a state that poises it to commit to one of 40
two or more predestined lineages and to differentiate. Yet, its state-characteristic gene 41
expression profile in the high-dimensional gene expression state space is robustly 42
maintained because the cell is in a stable attractor state [1,2] (“ground state” [3]) of the 43
gene regulatory network (GRN). Thus, commitment to a lineage involves overcoming 44
this stabilization as genes alter their expression in a coordinated manner to establish the 45
new gene expression pattern that implements the new phenotype of the differentiated 46
state (Fig 1). Individual cells can, due to noisy gene expression fluctuations, transiently 47
approach the border of the attractor in one or several dimensions and thereby be 48
transiently “primed” to exit the basin of attraction, and by chance or biased by external 49
conditions, differentiate into one of the predestined lineage accessible to the respective 50
multipotent progenitor [4,5,6,7]. However the fundamental question remains whether 51
differentiating cells exit the progenitor attractor simply by harnessing rare chance 52
configurations of expression of the appropriate regulatory proteins to “jump” into a new 53
nearby stable attractor state [8,9,10,11] or instead, by undergoing a larger-scale 54
destabilization of their (high-dimensional) gene expression state [12,13,14]. 55
56
A cell fate choice and fate commitment driven by a destabilization of the progenitor 57
attractor state until cells “spill out of it” would represent a critical state transition [15,16]. 58
Herein, a stable attractor state of a system is gradually destabilized due to a steady and 59
monotonical change in one characteristic of its underlying control structure (a systems 60
parameter) until the system suddenly transits a “tipping point” (bifurcation) at which the 61
stable attractor state disappears and other attractors become accessible. The progenitor 62
cells in that destabilized attractor would then move to the(se) new stable state(s) that 63
represent the gene expression pattern of new cell phenotypes. This formal description 64
would explain multi-potentiality and the quasi-irreversible lineage restriction beyond a 65
“point of no-return” [14]. 66
67
Critical transitions of a system (like a cell) can occur because of the presence of non-68
linear interactions between its underlying component parts (genes, proteins) that 69
collectively produce multiple distinct potential behaviors (cell phenotypic states) and if 70
the realizable range of the value of critical parameters that characterize these interactions 71
encompass qualitatively distinct behavioral regimes. Even if specific details of the 72
interactions and the identity of the critical parameter are not known, stochastic 73
fluctuations or certain perturbations can expose a system’s approach towards a critical 74
state transition. This is manifest as “early warning signals” and is essentially a 75
consequence of the destabilization of an attractor state that precedes the bifurcation event. 76
Early warning signals can be exploited to predict a qualitative system-wide shift in a 77
.CC-BY-NC-ND 4.0 International licensepeer-reviewed) is the author/funder. It is made available under aThe copyright holder for this preprint (which was not. http://dx.doi.org/10.1101/041541doi: bioRxiv preprint first posted online Feb. 26, 2016;
3
complex nonlinear system, as has been applied to material properties, ecosystems, social 78
systems and disease states [15,16,17,18]. 79
80
The principle of a bifurcation governing cell fate choice naturally unites the two 81
classical models of binary cell fate decision of multipotent progenitor cells at 82
developmental branch-point: the stochastic (intrinsic) and the deterministic (instructive) 83
models [19,20,21,22,23]. In the stochastic model [24,25] the cells randomly assume a 84
(pre)committed, or primed state that renders them responsive to the fate-specifying 85
growth factor which then acts to selectively expand (“select”) these primed cells which in 86
turn would proliferate and terminally differentiate. In the deterministic model [26,27], 87
the same factors act to specifically instruct the cell which gene to turn on and off to 88
establish the gene expression pattern of the prospective fate. These two models are not 89
mutually exclusive and experimental evidence support either scheme depending on 90
experimental design [19,20,21,22,23]. 91
92
Here we use single-cell gene expression analysis to examine in a model system the 93
fate commitment of blood progenitor cells either into the erythroid cells (precursors of 94
erythrocytes), promoted by the growth factor (cytokine) erythropoietin (EPO), or into the 95
myeloid lineage (precursors of monocytes and granulocytes), promoted by the cytokines 96
GM-CSF and IL-3. We show that the formalism of critical state transitions, so far only 97
demonstrated for examples in which the system state is characterized by one variable 98
[17], can (i) be applied to a high-dimensional system, namely the gene expression pattern 99
defining a mammalian cell state, while (ii) at the same time, taking advantage of the fact 100
that the system is present in an ensemble of replicates: a population of cells. To this end, 101
we introduce a new index IC computed from high-dimensional single-cell gene 102
expression profiles of cell populations and show that it can serve as an early warning 103
signal for an impending cell state transition. Critical transitions also explain the long-104
observed phenomenon of “rebellious cells” that differentiate into the direction opposite to 105
that instructed by the growth factors. Single-cell resolution analysis of cells exposed to 106
conflicting stimuli also confirm that developmental trajectories are robust and 107
predestined, as predicted by early models [14,28], and that the stochastic and 108
deterministic scheme of cell fate control coexist. 109
110
111
Results and Discussion 112
1. Single-cell gene expression patterns during binary cell fate decision 113
To determine if differentiation goes through a tipping point in high-dimensional gene 114
expression state space we studied the commitment of the murine multipotent 115
.CC-BY-NC-ND 4.0 International licensepeer-reviewed) is the author/funder. It is made available under aThe copyright holder for this preprint (which was not. http://dx.doi.org/10.1101/041541doi: bioRxiv preprint first posted online Feb. 26, 2016;
4
hematopoietic precursor cell line EML into an erythroid and myeloid fate when 116
stimulated by EPO and GM-CSF/IL-3, respectively [4]. We also treated cells with a 117
combination of EPO and GM-CSF/IL-3 to separate a generic destabilization from the 118
specific fate choice because we reasoned that the latter should be neutralized by the 119
combination treatment. To ensure that heterogeneity of the starting cell population is due 120
to dynamic fluctuations and not to pre-existing pre-committed cells (which would merely 121
be selectively enriched by the respective growth factors) we used a cell line, as opposed 122
to primary cells, that allows for the study of populations recently derived from a single 123
common ancestor. We monitored transcript expression patterns at single-cell resolution 124
using qPCR to harness the information provided by a statistical ensemble of (randomly 125
distinct) cells which manifests the stability of a given nominal cell state. 126
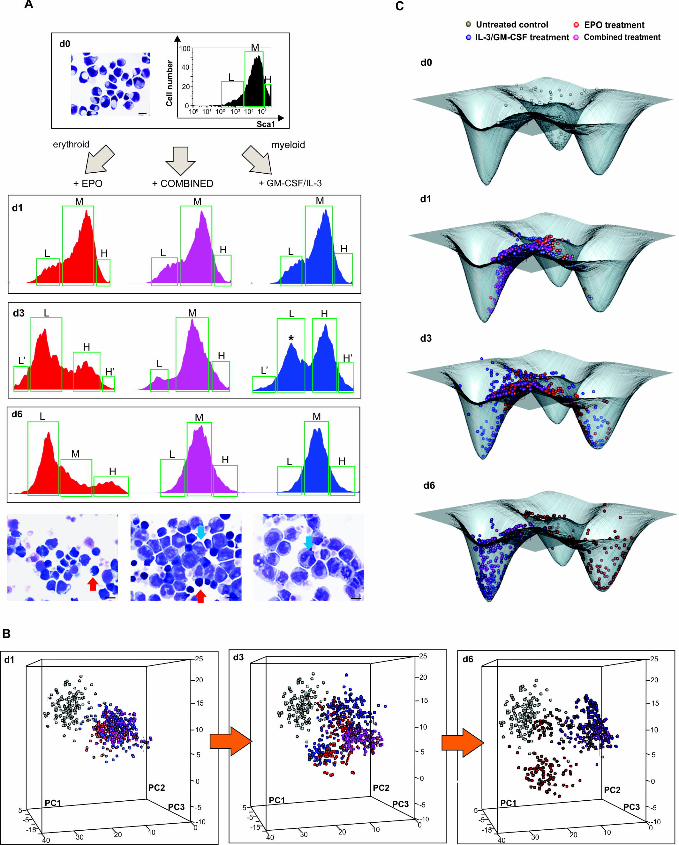
Exit from the progenitor state was first monitored by flow cytometry measurement of 127
the down-regulation of the stem-cell markers Sca1 and c-kit. The induction of a bimodal 128
distribution with a new discrete subpopulation with lower Sca1 (as well as c-kit) surface 129
protein expression confirmed the switch-like state transition (Fig 1A). Fig 1B shows the 130
time course of single-cell transcript patterns of 19 selected genes (listed and explained in 131
S1 Fig and S1 Table) known to be functionally involved in or to mark fate commitment 132
of the EML cells, visualized by plotting each cell into the Cartesian space spanned by the 133
three principal components (PC) following principal component analysis (PCA) to reduce 134
the 19-dimenional state space (Appendix A Supplementary Methods). The “cloud” of 135
untreated cells (black, depicted for reference for each time point) spreads upon treatment 136
(colored balls), reaching highest diversity at day 3 (d3). The cells then coalesced into two 137
distinct dense clusters at d6 (blue and red) representing the erythroid (red) and myeloid 138
(blue) lineages which were identified by the characteristic expression of erythroid or 139
myeloid transcript levels (S2 Fig and S1 Table). As shown in S3 Fig, in this single-cell 140
qPCR, measurement noise was only a small fraction of the biological cell-to-cell 141
variability, thus the dispersion of points in state space largely reflects the biological 142
diversity of cells. Loading of gene scores show that PC1 captures the erythroid-myeloid 143
dichotomy, whereas PC2 reflects the stemness-differentiation axis (S4 Fig). Single-cell 144
measurement also provides the local cell density for each position in state space which 145
can be visualized as the elevation of an approximate quasi-potential landscape [12] (Fig 146
1C, legend) which shows the three attractor states as minima. 147
Intriguingly, at d3 some cells consistently went in the “wrong” direction, opposite to 148
the instruction by the cytokines (e.g. some EPO-treated cells were associated with the 149
myeloid cell cluster and vice versa). These “rebellious cells” disappeared at d6 – either 150
by “transdifferentiating” to the “correct” lineage or by dying out (see below). Progenitor 151
cells receiving a combined treatment also diverged at d3 but stayed in an intermediate 152
“undecided” region of the state space before joining the myeloid cluster (Fig 1B). Thus, 153
.CC-BY-NC-ND 4.0 International licensepeer-reviewed) is the author/funder. It is made available under aThe copyright holder for this preprint (which was not. http://dx.doi.org/10.1101/041541doi: bioRxiv preprint first posted online Feb. 26, 2016;
5
the conflicting signals delayed the fate decision but ultimately a uniform decision is 154
made. This behavior corroborates the notion that gene expression change during lineage 155
determination is not simply instructed by external growth factors, but also governed by 156
intrinsic constraints that channel cells towards predestined attractors of the GRN and do 157
not allow for stable intermediates, as Waddington first predicted [28]. In this case it 158
appears that the attractor for the myeloid fate is more readily accessible. 159
160
2. High-dimensional critical state transition in ensemble of systems 161
Independent of the (unknown) detailed dynamics of the underlying GRN, a 162
destabilization and disappearance of even a high-dimensional attractor state is a 163
bifurcation event and should display the signatures of an approach to a critical phase 164
transition [16] at which cells would undergo a discontinuous switch towards the 165
destination state. While the bimodal distributions of Sca1 (Fig 1A) after d3 already 166
suggest a quasi-discrete transition, they cannot reveal a destabilization in a high-167
dimensional state prior to the switch. Recently reported cases of critical transitions in 168
stressed ecosystems and disease processes [refs. in [17]] pertain to low-dimensional 169
systems in which typically one systems variable was observed longitudinally. By 170
contrast, here we examine time snapshots of states of a high-dimensional system (19-171
dimenional cell state vector) embodied by the GRN. 172
From theoretical consideration, a critical destabilization and transition to a new 173
attractor will be manifest in two changes in the correlation statistics (as explained and 174
derived in S2 Appendix): First, a decrease of cell-cell correlation R(cell k, cell l) between 175
all pairs of the n cell state vectors in the m=17-dimensional gene space; this reflects the 176
expected increase of amplitudes of random fluctuation of gene expression due to the 177
weakening “attracting force” in the “flattening” basin of attraction prior to the bifurcation 178
[29,30]. Second, a concomitant increase of gene-gene correlation R(gene i, gene j) 179
between all pairs of “gene vectors” that describe the gene expression values of each gene 180
across all the cells; this corresponds to the increase of long-range correlations of state 181
variables in time and/or space described in many phenomenological analyses of critical 182
state transitions [17]( 9)( 9). The overall increase in the correlation between the gene 183
vectors arises because of the symmetry-breaking destabilization and is plausible from two 184
different perspectives: (i) as a consequence of the “range restriction effect” of correlation 185
in statistics when the dominance of the symmetric stochastic fluctuations in the attractor 186
yields to non-symmetric, regulated change of gene expression [31,32] or (ii) as a 187
consequence of the appearance of a saddle-node in the dynamical system description 188
through which the individual cells pass. A detailed mathematical derivation of is 189
provided in the S2 Appendix. This reasoning motivates an index for critical transitions, 190
IC: 191
.CC-BY-NC-ND 4.0 International licensepeer-reviewed) is the author/funder. It is made available under aThe copyright holder for this preprint (which was not. http://dx.doi.org/10.1101/041541doi: bioRxiv preprint first posted online Feb. 26, 2016;
6
����� � �|����,���|
����, �� , 192
193
where g are gene vectors and S are the cell state vectors at sample time t and ���… , … �� 194
denotes the average of all Pearson’s coefficients of correlation. We postulate that IC 195
increases towards a maximum when cells go through the critical state transition (see S2 196
Appendix). Recently, Chen et al. proposed a similar index for full transcriptome time 197
courses which for lack of single-cell resolution state vectors estimates state 198
diversification differently and involves the prior computational selection of a subset of 199
genes in the same data [30]. 200
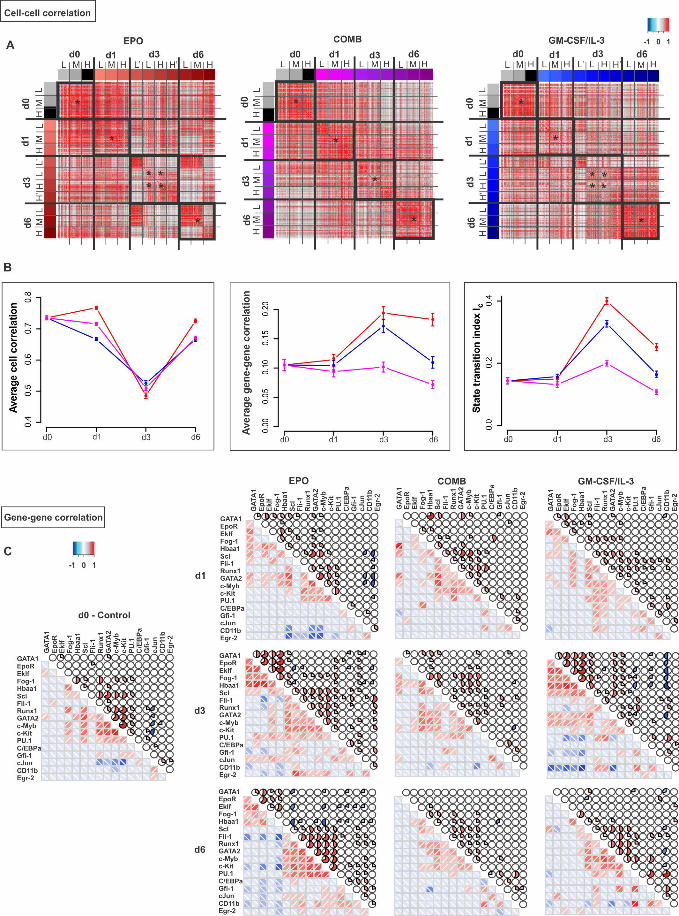
Fig 2A shows the n×n heat map for cell-cell correlation coefficients ���� , ��� for 201
all pairs of the n=1600 cells for the three treatments (EPO, GM-CSF/IL-3 and combined) 202
at each time point t. The diagonal shows that correlation of cells within the populations 203
decreases at d1 and notably at d3, compared to d0, and increases again at d6, indicative of 204
a transient diversification of cell states and a return to a more homogenous population 205
consistent with an attractor state. Since we also recorded the cells’ position with respect 206
to the Sca1 surface marker expression (roughly partitioning the population into three 207
fractions, Sca1-high (H), Sca1-medium (M) and Sca1-low (L) – see Fig 1A) one can see 208
that the decrease of correlation was not due to comparing cells across subpopulations in 209
bimodal populations (Fig 1A). The higher correlation among the cells within the extreme-210
low Sca1 fraction (L’) in both EPO and GM-CSF/IL-3 treatment is consistent with 211
advanced commitment of cells which are enriched in the Sca1-low fraction towards the 212
erythroid fate as previously reported [4]. By contrast, the high correlation among the H 213
cells at the end of EPO treatment reflects the “rebellious” cells that became myeloid 214
under EPO treatment. 215
The second criterion for a critical state transition, the increase in gene-gene 216
correlation ���� , ���, between the genes is shown in Fig 2B. Both EPO and GM-217
CSF/IL-3 treatment resulted in almost a doubling of ���� , ��� at d3 which returned 218
towards baseline at d6. The heat-maps of the raw data (Fig 2C) show that the increase of 219
���� , ��� resulted from correlated (red) as well as negatively correlated gene pairs 220
(blue) at d1, but more pronounced at d3. By contrast, genes were mostly uncorrelated in 221
the progenitor state, consistent with the dominance of random fluctuations around the 222
attractor state. 223
Together, the cell-cell and gene-gene correlation gave rise to a temporal course of 224
the index IC that sharply peaked at d3 after induction of either fate commitment, which 225
thus marks the critical transition and coincides with lineage separation in state space (Fig 226
1B). 227
228
.CC-BY-NC-ND 4.0 International licensepeer-reviewed) is the author/funder. It is made available under aThe copyright holder for this preprint (which was not. http://dx.doi.org/10.1101/041541doi: bioRxiv preprint first posted online Feb. 26, 2016;
7
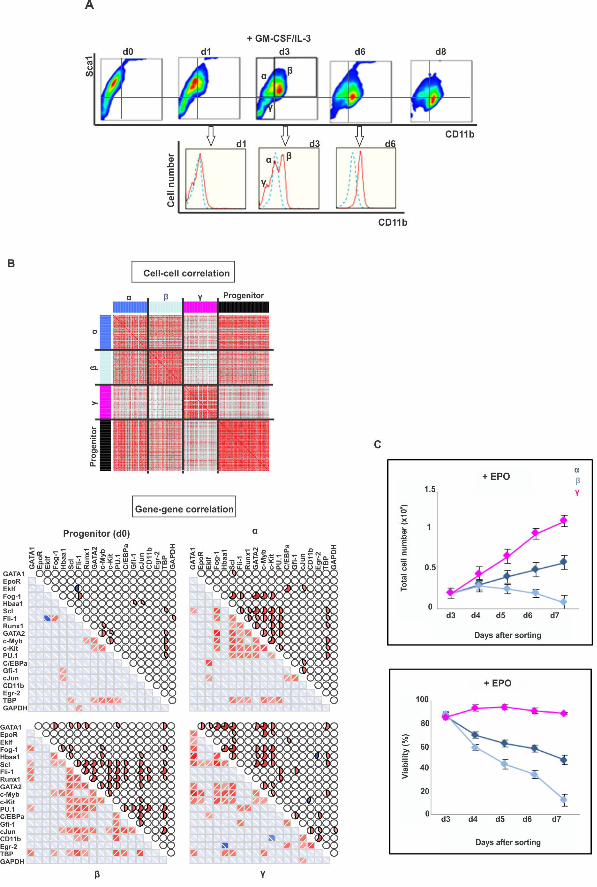
3. Alternative monitoring of myeloid commitment reveals rebellious cells 229
To exclude that the gene-gene and cell-cell correlation behavior is an idiosyncrasy 230
linked to monitoring the exit from the progenitor attractor along the direction of Sca1 231
reduction, we also monitored and dissected differentiation along the axis of increase of 232
the differentiation marker CD11b, a reliable indicator of myeloid differentiation (Fig 3A). 233
Following GM-CSF/IL-3 treatment, CD11b surface expression first increased and then 234
Sca1 decreased, from CD11bLOW/Sca1HIGH to CD11bHIGH/Sca1LOW. At d3, the time 235
around which maximal destabilization was expected, the entire cell population split into 236
three populations with respect to CD11b: Sca1HIGH/CD11bLOW (termed α), 237
Sca1HIGH/CD11bHIGH (β) and unexpectedly, Sca1LOW/CD11bVERY-LOW (γ) (Fig 3A). 238
Single-cell transcript analysis suggests that the α-subpopulation corresponds to the 239
destabilized but not yet fully committed cells because it displays highest cell-cell 240
diversity and high correlation of the gene vectors (Fig 3B). The cells of subpopulation β 241
were most advanced toward the myeloid lineage (high expression of Gfi1, CEBPα and 242
cJun transcripts) consistent with the high CD11b expression, whereas cells of 243
subpopulation γ correspond to “rebellious” cells that moved in the opposite direction and 244
displayed erythroid gene expression patterns, including a large number of EpoR positive 245
cells, despite treatment with GM-CSF/IL-3 (S5A-D Fig). At d6 the γ population 246
disappeared (Fig 3A), consistent with the rebellious cells in the PCA analysis of Fig 1B. 247
However, addition of EPO to the culture medium rescued the γ cells (Fig 3C), and to a 248
lesser extent, the α but not the myeloid committed β cells. 249
This finding not only confirms that the rebellious γ cells have aberrantly moved 250
towards the erythroid lineage despite myeloid instruction but also corroborates the notion 251
of “cell selection” in fate control in which growth factors determine lineage also by 252
acting as survival and mitogenic factors for early committed cells that express the 253
cognate receptor – in this case the EpoR [19,23,24]. 254
255
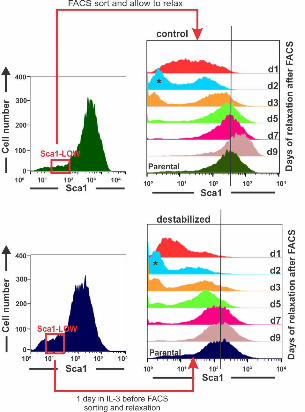
4. Critical slowing down 256
A dynamical signature of an approach to a critical transition that is often used in low 257
dimensional systems is the “slowing down” of the relaxation of a state variable back to 258
the original attractor state due to a reduced attracting force [15,17,18] after a small 259
perturbation or noise-driven excursion. Although critical slowing down is linked to the 260
flattening of the attractor and inherently associated with the increase in autocorrelation of 261
the fluctuation of the state variables, and thus, not actually an independent criterion, its 262
experimental assessment is distinct and often practical. Here critical slowing down was 263
exposed by measuring the relaxation of sorted “outlier” cells which were (transiently) in 264
an extreme state with respect to the projection into just one dimension, that of Sca1. We 265
isolated the Sca1LOW tail of populations that were either treated for 1 day with GM-266
.CC-BY-NC-ND 4.0 International licensepeer-reviewed) is the author/funder. It is made available under aThe copyright holder for this preprint (which was not. http://dx.doi.org/10.1101/041541doi: bioRxiv preprint first posted online Feb. 26, 2016;
8
CSF/IL-3 to destabilize the progenitor state, or in untreated populations. As previously 267
shown, the Sca1LOW fraction re-establishes the parental distribution within 5-6 days [4]. 268
By contrast, cells exposed to GM-CSF/IL-3 for just one day which does not yet cause 269
significant broadening of the distribution, required at least 9 days to reconstitute the 270
parental Sca1 expression distribution from the same tail fraction (Fig 4). 271
272
5. Transcriptomes confirm the scheme of rebellious cells 273
Finally, the repeated observation of “rebellious cells” is consistent with a 274
bifurcation at which two (or more) new attractors become accessible when the progenitor 275
attractor vanishes, representing the dichotomy between the two “sister” lineages [13,33]. 276
The destabilization of the progenitor state, unlike in canonical saddle-node bifurcations of 277
most studied critical transitions [15,16,17,18], opens up a choice of two attractors, and 278
despite an instructive bias towards either one imposed by the growth factors, this allows 279
cells to “spill” into the “wrong” attractor if molecular noise overcomes the instructive 280
bias toward the intended lineage. Thus, the existence of “rebellious cells” is also a 281
signature of a critical transition. 282
To show that such binary behavior is not an artifact of projection in one state space 283
dimension (in this case, with respect to Sca1 or CD11b) but holds in the high-284
dimensional state space, we measured the transcriptomes of the subpopulations that have 285
either responded to the growth factor or appeared to have not responded – at least with 286
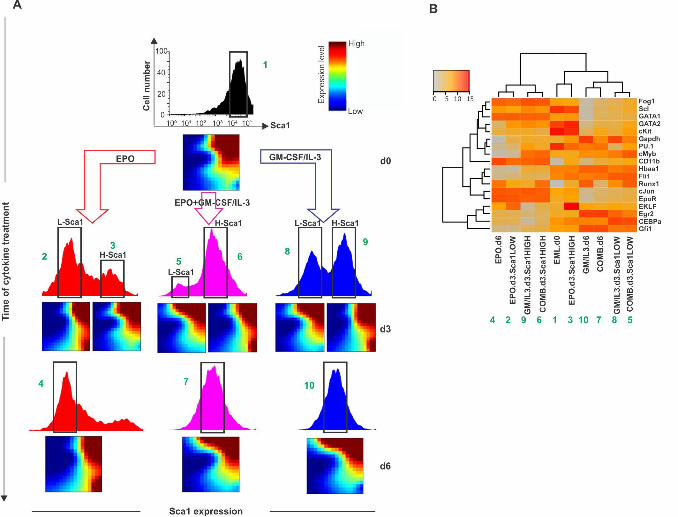
respect to change in Sca1 expression (Fig 5). As shown earlier (Fig 1) all three treatments 287
with the either cytokines as well as combined, triggered a split of the population into two 288
distinct subpopulations with response to the progenitor marker Sca1 (bimodal distribution 289
at d3, Fig 5). 290
Intriguingly, cells from the Sca1HIGH subpopulation which appeared to have not 291
responded after 3d in EPO because Sca1 stayed high (fraction #3 or H-Sca1 in Fig 5A) 292
had a transcriptome that resembled that of the cells which had responded to GM-CSF/IL-293
3 treatment and had down-regulated Sca1 (fraction #8 or L-Sca1 in Fig 5A). Conversely, 294
Sca1HIGH cells that had apparently not responded yet at d3 to GM-CSF/IL-3 (fraction #9 295
in Fig 5A) displayed a more pronounced change of the transcriptome that was remarkably 296
similar to that of Sca1LOW cells (fraction #2 that had responded to EPO). (For quantitative 297
analysis of transcriptome similarities see S2 Table). In the combined treatment cells 298
exhibited a transcriptome behavior that was similar to that of the nominally myeloid fated 299
(GM-CSF/IL-3 treated) cells – in agreement with the single-cell transcript analysis (Fig 300
1). 301
The transcriptome measurement of subpopulations which appear to have not 302
responded to the differentiation signal with respect to down-regulating the progenitor 303
state marker actually have responded but by changes in the non-observed state space 304
.CC-BY-NC-ND 4.0 International licensepeer-reviewed) is the author/funder. It is made available under aThe copyright holder for this preprint (which was not. http://dx.doi.org/10.1101/041541doi: bioRxiv preprint first posted online Feb. 26, 2016;
9
dimensions, underscoring the importance of high-dimensional dynamics. The crosswise 305
overall similarity of the transcriptome changes in the non-responders in one treatment to 306
that of the responders in the other treatment strongly supports the model of a constrained 307
dynamics with a finite number (here: two) of fate options that represent the predestined 308
developmental potentials embodied by attractors that become accessible once the 309
progenitor state is destabilized. This behavior of aberrant but defined behavior also 310
reveals a stochastic, non-instructive component in fate determination. 311
Specifically, we suspect that the rebellious cells are cells that following the 312
flattening of the progenitor attractor initiated by the external differentiation signal 313
erroneously enter the “non-intended” attractor that is also accessible because the 314
stochastic gene expression fluctuations may, in some cells, overcome the instructive 315
signal that bias the change toward a specific lineage attractor. Nevertheless the rebellious 316
cells, being in the “wrong” fate, should eventually die because the lack of survival signals 317
provided by the continuing presence of the same growth factor, as their disappearance in 318
the measurement in Fig. 1 implies. Thus instruction and selection synergize, in a two-319
step scheme, in that cells must be instructed and be selected for in order to adopt a 320
particular phenotype. This two-step process increases fidelity of fate determination in the 321
tissue. 322
323
6. Conclusion 324
Here we show that exit from the multipotent progenitor state and commitment to a 325
particular cell lineage exhibit signatures of a critical state transition because of the 326
underlying destabilization of a high-dimensional attractor state. Fig 6 summarizes 327
schematically the model. In doing so we confirm that the two classical models of cell fate 328
control, instruction by extrinsic signals and selection of intrinsically predestined states 329
[19,20,21,22,23], not only coexist but also complement each other within a formal 330
concept. 331
The framework of a critical transition has been used to describe sudden qualitative 332
changes in a variety of complex systems in nature [15,16,17,18] and entails the “early 333
warning signals” that herald the transition. We show here that early warning signs which 334
essentially manifest the distortion of the attractor landscape that is intrinsically linked to 335
most types of bifurcations (“tipping point”) can also be defined and detected for high-336
dimensional dynamics. 337
To do so we introduce an index IC, which is formally derived from dynamical 338
systems theory [30] and whose increase serves as an early warning signal, indicating an 339
approach to a bifurcation. IC is particularly useful for single-cell resolution snapshots of 340
molecular profiles, as provided by RNA-seq [34] and CyTOF [35], of statistical 341
ensembles of cells (=cell populations) taken at multiple time intervals during a biological 342
.CC-BY-NC-ND 4.0 International licensepeer-reviewed) is the author/funder. It is made available under aThe copyright holder for this preprint (which was not. http://dx.doi.org/10.1101/041541doi: bioRxiv preprint first posted online Feb. 26, 2016;
10
time course. This quantity is derived from a dynamical systems theory treatment of the 343
actual underlying process and not from descriptive statistical pattern recognition as 344
currently used to analyze single-cell molecular profiles. IC captures the information 345
immanent in both the m gene vectors (the expression level of a gene across a large 346
number n of individual cells) and the n cell vectors (the state of a given cell with respect 347
to a large number of m genes), resulting in the data structure of a n x m matrix for each 348
time point in the process being studied. Thus, IC does not require continuous monitoring 349
as in many studies of critical state transitions because much of the information is in the 350
high dimensionality (m) and in the statistical ensemble (n) and thus could be of practical 351
utility for predicting major shifts in cell populations and tissues relevant in development 352
and disease. 353
354
355
Material and Methods 356
Culture and differentiation of EML cells 357
Blood progenitor EML cells (ATCC CRL-11691) were cultured and maintained as 358
described previously [24]. Multipotent EML cell population was stimulated with either 359
EPO (to differentiate into erythroid cells), or GM-CSF/IL-3 and ATRA (to obtain 360
myeloid cells) or a mixture of all cytokines for the “combined” treatment as previously 361
reported [4,36]. Wright-Giemsa staining was performed with some modification 362
following a reported protocol [37]. In brief, 60,000 cells in 250 µl of PBS + 1% FBS 363
buffer were cytospun at 350 rpm for 5 minutes per slide and allowed to air dry for 10 364
minutes. Slides were subjected to five 1-second dips in methanol, followed by Wright-365
Giemsa staining solution (0.4% (w/v), Sigma). After a final rinse with water, slides were 366
allowed to air dry for 30 minutes. Colored phase contrast images were obtained using a 367
Zeiss Axiovert 200M microscope. 368
369
Flow cytometry and fluorescent-activated cell sorting (FACS) 370
Cell surface protein immunostaining and flow cytometry measurements were performed 371
using established methods [4]. Briefly the antibodies Sca1-PE (BD Pharmingen 372
#553335), ckit-FITC (BD Pharmingen #553355) and CD11b-FITC (BD Pharmingen 373
#557396) were used at 1:1,000 dilutions in ice-cold PBS containing 1% fetal calf serum 374
with (flow cytometry) or without (FACS) 0.01% NaN3. Appropriate unstained and 375
single-color controls were used for gate definition and compensation set-up. Isotype 376
control antibodies (BD Pharmingen #553988 for FITC and #553930 for PE isotype) were 377
used to establish the background signal caused by non-specific antibody binding. 378
Propidium iodide (Roche #11348639001) staining was used to identify dead cells that 379
were removed from analyses. Flow cytometry analysis was performed on a BD 380
.CC-BY-NC-ND 4.0 International licensepeer-reviewed) is the author/funder. It is made available under aThe copyright holder for this preprint (which was not. http://dx.doi.org/10.1101/041541doi: bioRxiv preprint first posted online Feb. 26, 2016;
11
FACSCalibur cell cytometer with 10,000 viable events for each sample. Data were 381
acquired using CellQuest Pro (BD) software and analyzed in FlowJo. 382
For FACS sorting, the Sca1 protein distribution was measured and the expression 383
distribution was gated into three regions according to the Sca1 expression level as Sca1-384
Low, Mid and High on day 0, 1 and 6 or 4 regions on day 3 after differentiation initiation 385
(Fig 1A). Single cell sorting was conducted on a BD Biosciences FACSAria III in lysis 386
buffer (see below). For myeloid differentiation, cells were stained with antibodies for 387
both Sca1 and CD11b protein markers and cell subpopulation were gated as illustrated in 388
Fig 3A. For studies involving the dynamics of sorted subpopulations, antibodies were 389
removed after sorting using brief incubation in a low-pH buffer [4]. 390
391
Single-cell gene-expression analysis using OpenArray qPCR 392
Single cells were directly sorted into 5.0 µl of lysis buffer (CellsDirect kit, Invitrogen) 393
containing 4.25 µl Resuspension Buffer and 0.25 µl Lysis Enhancer using a FACSAria 394
III (BD Biosciences). 0.5 µl RNaseOut (Invitrogen) was added to the lysis solution to 395
protect the RNA from degradation. To ensure that liquid droplets containing single cells 396
were deposited at the center of the well and not at the wall, the position was checked on 397
the plastic film covering the PCR plate. To reduce the possibility of cell sticking to the 398
wall of the PCR well plate, we used low-binding PCR plates (Axygen, #6509). As control 399
sample, a small population of 100 cells were sorted into a single well for qPCR analysis. 400
To test for contamination of sorted cells with mRNA from lysed dead cells, 5.5 μl liquid 401
from the FACS instrument was collected and analyzed. After sorting, the samples were 402
heated 75 ˚C for 10 min to accelerate the lysis process and samples were stored at -80 ˚C. 403
From these single-cell lysate samples, cDNA was directly synthesized as described 404
previously [36]. The obtained cDNA was pre-amplified by 18 cycles [36] and 405
subsequently diluted with Tris-EDTA buffer at a ratio 1:10 resulting in templates for the 406
real-time PCR analysis. This protocol led to less than 30 quantification cycles (Cq) during 407
the single-cell qPCR analysis on an OpenArray system (Life Technologies). On this 408
system, each qPCR plate consists of 12×4 subarrays and each subarray contains 8×8 409
reaction chambers of 33 nl volume [38] (S 6A Fig). Each sample was divided into a 410
subarray with 64 reaction chambers prior qPCR quantification. No-template (water) 411
control was also run on each plate to check for non-specific products and/or presence of 412
contaminants in the master mix. Following the amplification, the corresponding curves 413
and C� values were processed using the OpenArray Real-Time qPCR Analysis software 414
(version 1.0.4) with a quantification threshold of 100(+/-5). Specific PCR primers were 415
pre-immobilized in the chambers (S 6B Fig) and released in the first cycle by heat. For 416
each subarray, 2 µl of target sample was loaded into each well of a 384-well plate 417
(Applied Biosystems); subsequently, 3 µl of the master mix reaction consisting of 418
.CC-BY-NC-ND 4.0 International licensepeer-reviewed) is the author/funder. It is made available under aThe copyright holder for this preprint (which was not. http://dx.doi.org/10.1101/041541doi: bioRxiv preprint first posted online Feb. 26, 2016;
12
TaqMan OpenArray Real-time PCR Master Mix (Applied Biosystems) was added to each 419
well. Target and master mix were combined, centrifuged, and the 384-well plate was 420
processed in the OpenArray AccuFill system (Applied Biosystems). During processing, 421
2.1 µl of the reaction solution was transferred automatically from each well into the 422
corresponding subarrays of a qPCR plate, where the reaction solution retains into the 423
reaction wells due to the differential hydrophilic–hydrophobic coating between wells and 424
surface of the qPCR array [38]. The qPCR step was performed using thermocycling 425
conditions of 50 °C for 2 min, 95 °C for 10 min, 40 cycles of 95 °C for 15 sec and 60 °C 426
for 1 min. 427
428
Testing Taman qPCR assays 429
We used off-the-shelf primers designed by Applied BioSystems (Life Technologies) for 430
the analysis. The primers are usually designed to span exon-exon junction to target 431
multiple splice variants of one transcript and to target only and specifically the gene of 432
interest, avoiding amplification of genomic DNA. S3 Table lists all genes of interest, the 433
inventoried TaqMan assay IDs (Applied Biosystems) and further relevant information 434
where the manufacturer does not provide primer and probe sequences. To evaluate qPCR 435
assay performance, calibration (standard) curves were generated by performing qPCR on 436
a serial dilution of a prepared template. Each of these dilutions was dispensed into two 437
subarrays of OpenArray plate leading to 6 technical qPCR replicates for each single cell 438
sample. To minimize the effect of sampling errors on quantification precision, only 439
sample/assay combinations with at least 3 quantifiable replicates were considered for 440
preparing the standard curves. The GAPDH assay was not pre-immobilized on 441
OpenArray plate but was independently tested on BioRad qPCR platform. 442
443
Analysis of single-cell gene expression data 444
Data analysis is described in more details in Supplementary Discussion. Single-cell 445
expression data were initially analysed with OpenArray qPCR analysis software. For 446
quality control, amplification curves were quality filtered and Ct thresholds were set for 447
each assay with the same thresholds used across all experiments and cell populations. 448
Data were subsequently exported to Excel as csv files. All of Cq values are available in 449
S1 Table. Samples not expressing any gene were excluded from the analysis. 450
Experimentally determined LODs were used as cutoff Cqs (S3 Table). Each assay was 451
performed in triplicates, and the median of the triplicates was used for subsequent 452
analysis. After this pre-processing, ΔCq was calculated as previously described [39]. 453
Higher level of analysis such as correlation, clustering, and PCA was performed on log2-454
transfromed expression data. 455
.CC-BY-NC-ND 4.0 International licensepeer-reviewed) is the author/funder. It is made available under aThe copyright holder for this preprint (which was not. http://dx.doi.org/10.1101/041541doi: bioRxiv preprint first posted online Feb. 26, 2016;
13
456
Gene expression profiling with microarrays and data analysis 457
Microarray analyses were performed by the Vancouver Prostate Cancer centre. EML 458
progenitor cell population was stimulated with EPO alone, IL-3/GM-CSF alone or a 459
combination of all cytokines. On d3 and d6 after stimulation with different cytokines, the 460
main “peaks” in the Sca1 distribution were gated and cell subpopulations were sorted 461
using FACSAria III. Fig 1A and B illustrate the experimental design for the microarray 462
experiments. Total RNA was extracted from 1×10⁶ of sorted subpopulations using 463
mirVana miRNA Isolation Kit (Ambion) following the manufacturer’s instructions. 464
Genomic DNA was removed from the isolated and purified RNA using DNase I. Total 465
RNA quality was assessed with the Agilent 2100 Bioanalyzer prior to microarray 466
analysis. Samples with a RIN value equal to or greater than 8.0 were deemed acceptable 467
for microarray analysis. Samples were prepared following Agilent's One-Color 468
Microarray-Based Gene Expression Analysis Low Input Quick Amp Labeling v6.0. An 469
input of 100 ng of total RNA was used to generate Cyanine-3 labeled cRNA. Samples 470
were hybridized on Agilent SurePrint G3 Mouse GE 8x60K Microarray (Design ID 471
028005). Arrays were scanned with the Agilent DNA Microarray Scanner at a 3 µm scan 472
resolution, and data was processed with Agilent Feature Extraction 11.0.1.1. To filter out 473
genes that were not expressed above the background noise, a raw intensity cutoff value of 474
25 was applied because the correlation between the technical replicates decreases for 475
higher levels. Green processed signal was quantile-normalized using the 476
“normalize.quantiles” function in R that takes care of inter-chip variability. To filter out 477
genes which did not change between the samples, the distribution of each gene across all 478
samples was analyzed. Therefore the standard deviation (STD) distribution was 479
calculated and only genes with STD > 10% were selected. As a result, 6297 genes passed 480
the criteria and were selected as the 10% top genes among the samples. Self-organising 481
maps (SOM) of the 10% top most varied genes (6297 genes) were generated using the 482
Gene Expression Dynamics Inspector program (GEDI) [40]. Cluster analysis was 483
performed using the “clustergram” function in Matlab R2012a Bioinformatics toolbox 484
using hierarchical clustering with Euclidean distance metric and average linkage to 485
generate the dendrogram. Input data was log2-tranformed values of normalized 486
fluorescent intensity signals for genes of interest extracted from the samples and plotted 487
as a heatmap. Data represented the average of n = 2 independent biological replicates. 488
The normalized fluorescent intensity values of 17 genes of interest in the curated network 489
were extracted from each sample. 490
491
492
Acknowledgments 493
.CC-BY-NC-ND 4.0 International licensepeer-reviewed) is the author/funder. It is made available under aThe copyright holder for this preprint (which was not. http://dx.doi.org/10.1101/041541doi: bioRxiv preprint first posted online Feb. 26, 2016;
14
The authors would like to thank Drs. Luonan Chen and Hong Qian for helpful 494
discussions. 495
496
497
Author contributions 498
M.M. designed experiments, performed experiments and data analysis. A.S. designed and 499
performed statistical data analysis and theoretical analysis. J.Z. and A.G. performed 500
theoretical analysis, R.L-Q and I.G.C. and H.C. performed experiments. S.H. conceived 501
of experiments and theory and designed experiments and conceived and performed 502
theoretical analysis. S.H. drafted the manuscript, M.M., A.S. and S.H. edited and wrote 503
the paper. 504
505
506
Additional information 507
Accession codes: Microarray data have been deposited in GEO under accession number 508
GSE70405. 509
510
511
Figure legends 512
Fig 1. Single-cell analysis of transcript expression during binary fate decision in 513
EML cells. (A) A progenitor EML cell population was stimulated with EPO (left), IL-514
3/GM-CSF (right) or with a combination of EPO, GM-CSF/IL-3 (center). Flow 515
cytometry histograms of Sca1 surface expression were gated into Sca1LOW
(L), 516
Sca1MEDIUM
(M) and Sca1HIGH
(H) fractions or subpopulations (green boxes) during 517
FACS sorting of single cells at the indicated days for use in later analysis (Fig 2). At d3, 518
further division to account for the extreme outliers (L’, H’)* indicates “rebellious cells” 519
(see text). (B) For visualization of individual cells’ transcript expression patterns (of the 520
m=17 genes) cells were projected onto a dimension-reduced state space spanned by the 521
three first principal components (PC) following principal component analysis (PCA, see 522
S1 Appendix). Each sphere represents a cell, colored according to treatment: untreated 523
progenitors (grey); cells treated with EPO (red), cells treated with GM-CSF/IL-3 (blue); 524
and combined-treated cells (purple). (C) To calculate a quasi-potential landscape for the 525
three cell types, a Gaussian filter with s =2 was applied to PC1 and PC2 coordinates of 526
cells at d0 and d6 treated with EPO and GM-CSF/IL-3 leading to a smooth 2-527
dimensional distribution p. With the (quasi-)steady state assumption [15], the attractor 528
landscape was visualized relative to a base level of 0 by –log(p +1). 529
530
.CC-BY-NC-ND 4.0 International licensepeer-reviewed) is the author/funder. It is made available under aThe copyright holder for this preprint (which was not. http://dx.doi.org/10.1101/041541doi: bioRxiv preprint first posted online Feb. 26, 2016;
15
Fig 2. Critical transition during lineage commitment. (A) Cell-cell correlation 531
matrices displaying the Pearson correlation coefficient R(Sk, Sl) for all pairs of cells in 532
states Sk and Sj (see S2 Appendix). R calculated for a set of 150 progenitor cells, 500 533
EPO-treated, 500 GM-CSF/IL-3-treated and 450 combination-treated (COMB) cells from 534
data used in Fig 1. Black squares (diagonal) emphasize the higher correlation between 535
cells within the nominally same population. Two control genes (GAPDH and TBP) were 536
excluded from this analysis. L’, L, M, H, H’ indicate the Sca1 fractions shown in Fig 1: 537
extremely low, low, medium, high and extremely high level of Sca1 expression, 538
respectively. (B) Average Pearson correlation coefficients for all cell-cell pairs (left) and 539
all gene-gene pairs (center) as well as the state transition index Ic = �|� � , ��|�/540
����� , ���� at various time points. Cell-cell correlation coefficients were calculated for 541
the central fractions/subpopulations in panel A(*). Error bars indicate SEM. (C) Gene-542
gene correlation matrices for the 17 genes of interest and the two endogenous control 543
genes for the three treatments at various time points where correlation is indicated either 544
by color (lower matrix triangle) or solid color segment in pie chart. Color values for 545
magnitude of correlation coefficient for both matrices (A, C) are shown in color bar. 546
547
Fig 3. Intermediate stage of myeloid commitment exhibits destabilization of 548
progenitor state, alternative states and “slowing down” of relaxation. (A) flow 549
cytometry dot plot of expression of Sca1 and CD11b upon treatment of the progenitor 550
EML cells with GM-CSF/IL-3. Three distinct subpopulations on d3, designated, α, β and 551
γ, in the (tri-modal distribution of CD11b flow cytometry histogram underneath (red line, 552
treated; blue line, untreated). (B) Cell-cell correlation for 72 progenitor cells and 48 cells 553
from each of the α, β and γ subpopulations, and gene-gene correlation for all 17 genes of 554
interest and two endogenous control genes. Pearson correlation coefficient displayed as 555
heatmap, same color scheme as in Fig 2. (C) Rescue by EPO of the “rebellious” 556
=unintended γ subpopulation (pink curve) during myeloid differentiation. Three 557
subpopulations (α, dark blue; β, light blue and γ, pink) were FACS sorted, antibodies 558
removed and stimulated with EPO. Total cell number and viability were quantified on 559
day of sorting (d3) and 4 subsequent days. Viability was determined based on % of cells 560
excluding trypan blue. Each point represents average +/- STD for 2 biological replicates. 561
562
Fig 4. Critical Slowing down of state relaxation during fate commitment. “Critical 563
slowing down” of relaxation and restoring of parental distribution of the sorted Sca1-low 564
outlier fraction in the treated population. Clonal EML progenitor cells were stimulated 565
(top) with GM-CSF/IL-3 or not (bottom) and cells with lowest 15% Sca1 expression 566
were FACS-sorted one day after stimulation. 567
568
.CC-BY-NC-ND 4.0 International licensepeer-reviewed) is the author/funder. It is made available under aThe copyright holder for this preprint (which was not. http://dx.doi.org/10.1101/041541doi: bioRxiv preprint first posted online Feb. 26, 2016;
16
Fig 5. Whole-population transcriptome analysis reveals transient alternative 569
program (“rebellious cells”). (A) Sca1 expression population distribution in progenitor 570
and cytokine-treated cells and transcriptomes of sorted subpopulations at indicated 571
treatments/time points displayed as GEDI Self-organizing maps [40]. Progenitor EML 572
cells were stimulated with EPO alone, with GM-CSF/IL-3 alone or with the combination 573
of the two, and the Sca1-medium (M) fractions (d0 and d6) and/or the Sca1-Low and -574
High subpopulations (d3) were FACS sorted and used for microarray analysis. (B) 575
Hierarchical cluster analysis of the microarray-based transcriptomes of the samples in A 576
(columns, correspondence indicated by the green numbers) for a subset of the 17 genes 577
analyzed in single-cell qPCR (rows). 578
579
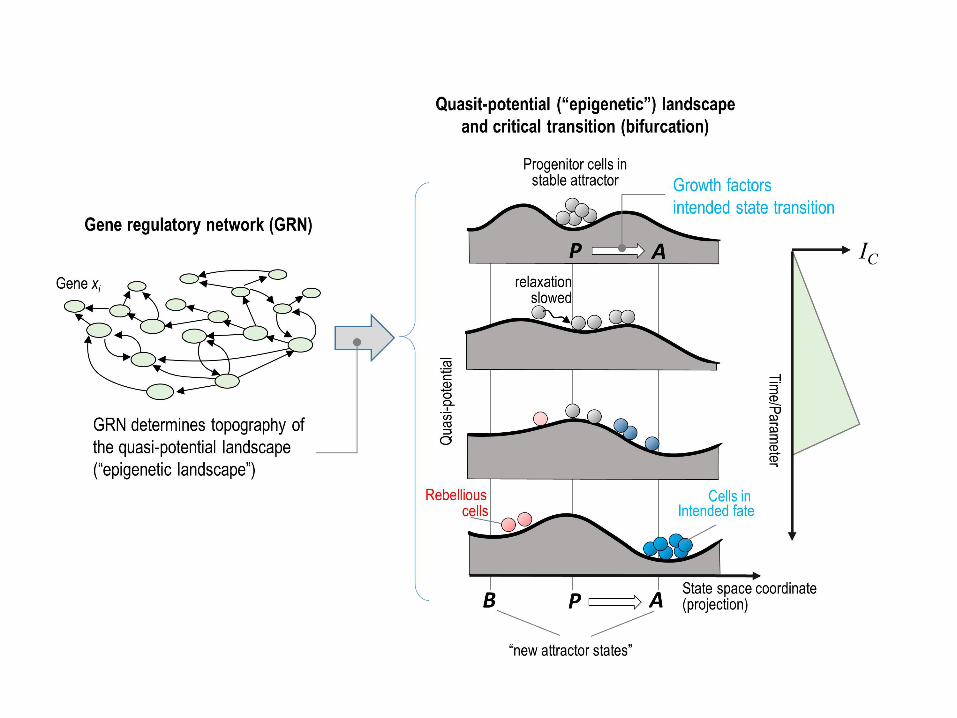
Fig 6. Epigenetic landscape model of symmetry-breaking bifurcation event. 580
Progenitor cells (grey-ish) stimulated with growth factors (e.g. ATRA/IL-3). This scheme 581
illustrates the two stages of the model: starting with the treatment of progenitor attractor 582
state, first, the destabilization of the (meta)stable attractor of the progenitor cells and 583
generation of a poised unstable state and second, the opening of the access to the 584
destination attractors (both intended and non-intended), allowing the cells to descend – 585
further instructed by the cytokines to favor one of the two valleys. As explained in 586
section 2 of results, the cell-cell and gene-gene correlation give rise to a gradual increase 587
of the index IC that peaked at critical transition and coincides with lineage separation in 588
state space. 589
590
591
Supporting Information Captions 592
593
S1 Appendix. Supplementary methods (data analysis) 594
595
S2 Appendix. Supplementary discussion (with mathematical proof) 596
597
S1 Fig. Manually curated model of gene regulatory network governing fate decision 598
of CMP. Network of experimentally verified regulatory interactions of transcription 599
factors involved in multipotency of the CMP state, fate decision and differentiation to the 600
erythroid and myeloid lineages (S1 Table). The canonical GATA1-PU.1 circuit is 601
highlighted in green. A few surface markers including c-kit (progenitor, grey box), EpoR 602
(erythroid, red box) and CD11b (myeloid, blue box) were included in the network to 603
control the cell differentiation behavior and used as markers for lineage commitment in 604
experiments. The numbers point to the references listed in S1 Table. 605
606
.CC-BY-NC-ND 4.0 International licensepeer-reviewed) is the author/funder. It is made available under aThe copyright holder for this preprint (which was not. http://dx.doi.org/10.1101/041541doi: bioRxiv preprint first posted online Feb. 26, 2016;
17
S2 Fig. Gene expression profile of single-cell samples during differentiation. 607
Expression profiles of 17 transcription factors and control genes (rows) in individual cells 608
(columns) are visualized as a heatmap. Cell columns are arranged for days d1, d3 and d6 609
with respect to different treatments where grey shades correspond to untreated 610
progenitors (d0), red shades to EPO treatment, blue shades indicate cells treated with 611
GM-CSF/IL-3 and purple shades to combined treatment EPO+GM-CSF/IL-3 cytokines. 612
The different shades of each color indicate the different Sca1 marker expression levels 613
Sca1Low (L), Sca1Mid (M) and Sca1High (H) determined during FACS sorting where darker 614
shades denote higher Sca1 expression. Gene rows were ordered according to their 615
biological role as indicated on the left. 616
617
S3 Fig. Technical noise associated with single-cell RT-qPCR is significantly smaller 618
than biological cell-cell variability. (A) Quantification cycles (Cq) of 80 individual 619
EML cells for GATA1 expression is reported. Values are means ± STD for up to 128 620
technical replicates. (B) Quantification cycles (Cq) of up to 110 technical replicates are 621
presented for 3 selected single-cells. Single-cell Cqs of biological samples clearly show a 622
broader distribution relative to that of technical replicates. (C) Box plots represent the 623
variability in terms of CV for technical replicates averaged over 110 realizations of the 624
real-time PCR-steps on the ds-cDNA and the distribution of CV across all 80 individual 625
EML progenitor cells for the GATA1 expression. The biological variation was 626
significantly larger than the technical noise (p-value 2.2e-28, Mann-Whitney U test). 627
Similar results were obtained for PU.1 (not shown). 628
629
S4 Fig. Distinct trajectories of cell differentiation are observed upon stimulation of 630
progenitor cells with cytokines in the PCA state space. (A) Principal component 631
projections in a total of ~1600 haematopoietic cells including progenitor (black), single-632
EPO treated (red-shades), single-IL3/GM-CSF treated (blue-shades) and combined-633
treated (purple-shades) in the first three components determined from expression of all 17 634
transcription factors and endogenous control genes. (B) Principal component loadings for 635
PC 2 and 3 indicate the extent to which each gene contributes to the separation of cells 636
along each component. (C) PCA weights of genes for the first three PCs reveals the 637
importance of the individual genes to explain the difference between the different 638
treatments and corresponding cell fate. (D) Cells in their attractor states still exhibit 639
heterogeneous transcription profiles that can be traced back to individual genes. Cells 640
treated with GM-CSF/IL-3 for 6 days are clearly located within the state space defined by 641
the myeloid genes and cells treated by EPO exhibit 2 clusters where the lower one is 642
governed by erythroid genes and the higher one by stemness genes. (E) Variance 643
.CC-BY-NC-ND 4.0 International licensepeer-reviewed) is the author/funder. It is made available under aThe copyright holder for this preprint (which was not. http://dx.doi.org/10.1101/041541doi: bioRxiv preprint first posted online Feb. 26, 2016;
18
explained by principal components show that the first three components jointly explain 644
more than 70% of variation in the data. 645
646
S5 Fig. Gene expression in individual cells from the progenitor population and the 647
α, β, and γ subpopulations. (A-D) Heatmap representation of gene expression profiles 648
for the set of 17 genes of the curated network and 2 endogenous genes as control in total 649
216 single cells including 72 progenitor cells (panel A) and 48 single cells from each of 650
the three subpopulations in the tri-modal Sca-1 population distribution on day 3 after 651
GM-CSF/IL-3 treatment (Fig 3), α (B) β (C), and γ (D). Genes are ordered according to 652
their reported biological role, as erythroid-associated (red box), stemness (green box), 653
myloid-associated (blue box) and endogenous genes in all subplots. Based on the 654
expressed genes, the β subpopulation seems to be committed to the myeloid lineage while 655
the γ subpopulation is committed to the erythroid lineage. The α subpopulation exhints an 656
indeterminacy with a bias towards the myeloid lineage. (E) PCA of all attractor cells (d0 657
and d6) as shown in the S4 Fig combined with the cells from the α (yellow), β (green), 658
and γ (pink) subpopulations support the above described similarity to the untreated EML, 659
the GM-CSF/IL-3 stimulated and the EPO-stimulated cells, respectively. (F) Coefficient 660
of variation CV (used as a cell-specific quantity to expose population dispersion) was 661
calculated for each cell from the expression levels across all genes for each 662
subpopulation. Histograms represent the number of cells at different level of the CV 663
measure and show that cells in α subpopulation have higher spread of cellular CV values. 664
665
S6 Fig. Representation of an OpenArray plate used for single-cell qPCR. (A) Each 666
OpenArray (Applied Biosystems) is the size of a microscope slide. It holds 48 groups 667
(subarrays, red rectangular) of 64 holes of 33 nl volume in which one PCR reaction 668
occurs. A hydrophilic layer is at the interior surface of each hole and a hydrophobic layer 669
is at the exterior surface of the plate allowing for filling the hole by surface tension. In 670
total, each array carries 3072 qPCR reactions. (B) Specific PCR primers are pre-671
immobilized in individual holes (by manufacturer, for customized assay patterns) and 672
released by heat in the first cycle. (C) An example of the distribution of single-cell 673
samples (SC) along with NTC (no template water control), IRC (inter-run calibrator) and 674
100-cell control (PC) samples on an OpenArray chip. 675
676
S7 Fig. Quality control of single-cell qCPR. (A) Inter-chip variability is evaluated using 677
inter-run calibrator (IRC) sample. Each curve represents the distribution of Cq values of 678
each gene across all OpenArray chips. The flat black curve represents the distribution of 679
all genes across all chips. The inter-gene differences are up to 2 orders of magnitude 680
larger than the inter-chip variability of the same gene. The inter-run calibrator was a 10-681
.CC-BY-NC-ND 4.0 International licensepeer-reviewed) is the author/funder. It is made available under aThe copyright holder for this preprint (which was not. http://dx.doi.org/10.1101/041541doi: bioRxiv preprint first posted online Feb. 26, 2016;
19
fold diluted sample of 18 cycles pre-amplified cDNA of 10 ng isolated RNA from EML 682
progenitor cell population. (B-D) Correlation between gene expression in an ensemble of 683
48 individual cells and 6 replicates of 100-cell pools is plotted. Cells used were from 684
subpopulations, α, β and γ (subplots b-d) as presented in Fig 3 and 19 genes as listed in 685
Table S3 were measured in triplicate in all single cells and bulk (100-cell) samples from 686
each subpopulation. Mean expression for each gene was calculated across all single cell 687
or pool samples. Note that the scaled mean expression for 100-cells pool was plotted 688
against mean expression for single-cells. In all cases a high correlation between single -689
cell data and bulk data with correlation coefficient of > 0.86 was observed. 690
691
S1 Table. Regulatory interactions in the curated GRN model of binary fate decision 692
in CMP. Table of the regulatory interactions (either activating (A) or inhibiting (I)) 693
between the genes. For each interaction, the literature is referenced. All interactions have 694
been reported in for murine hematopoiesis. 695
696
S2 Table. Quantified dissimilarity between transcriptomes from micro-arrays 697
between samples. Pair-wise dissimilarity between expression profiles (samples) was 698
calculated based on the normalized gene expression levels for 6297 filtered genes (see 699
METHODS) with 1 – R where R is the Pearson’s correlation coefficient which ranges 700
from 0 to 1, meaning that 0 correspond to highest similarity and 1 to most different 701
expression. Bootstrapping was performed by randomly selecting 30% of the genes in any 702
sample to calculate the pair-wise dissimilarity metric and repeating the procedure 10,000 703
times to generate the reported standard deviations. 704
705
S3 Table. Evaluation of qPCR assays. Table lists all primer pairs and relevant 706
information including IDs and amplicon length. All assays were inventoried. Identical 707
PCR primers were used in the pre-amplification step and the subsequent singleplex qPCR 708
step. In addition, the amplification efficiency and limit of detection (LOD) of the qPCR 709
assays are given. To evaluate efficiency and LOD, a 1:2 serial dilution was prepared from 710
18 cycles pre-amplified product from 10 ng RNA purified from EML progenitor cell 711
population. Amplification efficiency was calculated according to: [10(1/-S)-1] × 100%. 712
The slope was obtained by linear regression of the standards curve. Efficiency was 713
determined as average of two biological replicates with 6 qPCR technical replicates each. 714
The Cq value for the LOD is defined as the most diluted sample that results in positive 715
amplification for 5 out of 6 replicates. 716
717
S4 Table: Single-cell and 100-cell samples quantification cycles (raw) data. The 718
quantification cycles (Cqs) for all analyzed single-cells as well as 100-cell-pool control 719
.CC-BY-NC-ND 4.0 International licensepeer-reviewed) is the author/funder. It is made available under aThe copyright holder for this preprint (which was not. http://dx.doi.org/10.1101/041541doi: bioRxiv preprint first posted online Feb. 26, 2016;
20
samples are reported. Single cells from untreated EML control cells as well as EML cells 720
treated with EPO, GM-CSF/IL-3 or a combination of all cytokines on d1, d3 and d6 of 721
stimulation. Gene expression data for single-cell samples sorted from α, β and γ 722
subpopulations generated upon GM-CSF/IL-3 treatment of EML are also included. 6 723
replicates of the 100-cell samples were also sorted from each fraction and/or 724
subpopulation and analyzed as control. 725
726
727
References 728
1. Macarthur BD, Ma’ayan A, Lemischka IR. Systems biology of stem cell fate and 729
cellular reprogramming. Nat. Rev. Mol. Cell Biol. 2009;10:672–81. 730
2. Huang S. Cell lineage determination in state space: a systems view brings 731
flexibility to dogmatic canonical rules. PLoS Biol. 2010;8:e1000380. 732
3. Wray J, Kalkan T, Smith AG. The ground state of pluripotency. Biochem. Soc. 733
Trans. 2010;38:1027–1032. 734
4. Chang HH, Hemberg M, Barahona M, Ingber DE, Huang S. Transcriptome-wide 735
noise controls lineage choice in mammalian progenitor cells. Nature. 736
2008;453:544–7. 737
5. Hough SR, Laslett AL, Grimmond SB, Kolle G, Pera MF, A continuum of cell 738
states spans pluripotency and lineage commitment in human embryonic stem cells. 739
PLoS One. 2009;4(11):e7708. 740
6. Pina C, Fugazza C, Tipping AJ, Brown J, Soneji S, Teles J, et al., Inferring rules 741
of lineage commitment in haematopoiesis. Nat. Cell Biol. 2010;14:287–94. 742
7. Canham MA, Sharov AA, Ko MSH, Brickman JM. Functional heterogeneity of 743
embryonic stem cells revealed through translational amplification of an early 744
endodermal transcript. PLoS Biol. 2010;8:e1000379. 745
8. Kauffman S. Homeostasis and differentiation in random genetic control networks. 746
Nature. 1969;224:177-8. 747
9. Wu M, Su RQ, Li X, Ellis T, Lai YC, Wang X. Engineering of regulated stochastic 748
cell fate determination. Proc Natl Acad Sci U S A. 2013;110:10610-5. 749
10. Mendoza L, Alvarez-Buylla ER. Dynamics of the genetic regulatory network for 750
Arabidopsis thaliana flower morphogenesis. J Theor Biol. 1998;193:307-19. 751
.CC-BY-NC-ND 4.0 International licensepeer-reviewed) is the author/funder. It is made available under aThe copyright holder for this preprint (which was not. http://dx.doi.org/10.1101/041541doi: bioRxiv preprint first posted online Feb. 26, 2016;
21
11. Huang S, Eichler G, Bar-Yam Y, Ingber DE. Cell fates as high-dimensional 752
attractor states of a complex gene regulatory network. Phys Rev Lett. 753
2005;94:128701. 754
12. Zhou JX, Aliyu MDS, Aurell E, Huang S. Quasi-potential landscape in complex 755
multi-stable systems. J. R. Soc. Interface. 2015;12:1-15. 756
13. Zhou JX, Huang S. Understanding gene circuits at cell-fate branch points for 757
rational cell reprogramming.Trends Genet. 2011;27:55-62. 758
14. Huang S. Systems biology of stem cells: three useful perspectives to help 759
overcome the paradigm of linear pathways. Philos Trans R Soc Lond B Biol Sci. 760
2011;366:2247-59. 761
15. Sole RV. Phase Transitions. Princeton, N.J.;Princeton University Press; 2011. 762
16. Scheffer M, Carpenter SR, Lenton TM, Bascompte J, Brock W, Dakos V, et al., 763
Anticipating critical transitions. Science. 2012;338:344–8. 764
17. Trefois C, Antony PM, Goncalves J, Skupin A, Balling R. Critical transitions in 765
chronic disease�: transferring concepts from ecology to systems medicine. Curr. 766
Opin. Biotechnol. 2015;34:48–55. 767
18. Scheffer M, Bascompte J, Brock WA, Brovkin V, Carpenter SR, Dakos V, et al. 768
Early-warning signals for critical transitions. Nature. 2009;461:53–9. 769
19. Coffman RL, Reiner SL. Instruction, selection, or tampering with the odds? 770
Science. 1999 284:1283-1285. 771
20. Germain RN. T-cell development and the CD4-CD8 lineage decision. Nat Rev 772
Immunol. 2002;2:309-22. 773
21. Robb L. Cytokine receptors and hematopoietic differentiation. Oncogene. 774
2007;26:6715-23. 775
22. Graf T. Differentiation plasticity of hematopoietic cells. Blood. 2002;99:3089-101. 776
23. Enver T, Jacobsen SEW. Instructions writ in blood. Nature. 2009;461:183-184. 777
24. Enver T, Heyworth CM, Dexter TM. Do stem cells play dice? Blood. 778
1998;92:358-41; discussion 352. 779
.CC-BY-NC-ND 4.0 International licensepeer-reviewed) is the author/funder. It is made available under aThe copyright holder for this preprint (which was not. http://dx.doi.org/10.1101/041541doi: bioRxiv preprint first posted online Feb. 26, 2016;
22
25. Davis CB, Killeen N, Crooks ME, Raulet D, Littman DR. Evidence for a 780
stochastic mechanism in the differentiation of mature subsets of T lymphocytes. 781
Cell. 1993;73:237-47. 782
26. Metcalf D. Lineage commitment and maturation in hematopoietic cells: the case 783
for extrinsic regulation. Blood. 1998;92:345-7; discussion 352. 784
27. Rieger MA, Hoppe PS, Smejkal BM, Eitelhuber AC, Schroeder T. Hematopoietic 785
cytokines can instruct lineage choice. Science. 2009;325:217-8. 786
28. Waddington CH. Principles of Embryology. Allen Unwin Ltd; New 787
York:Macmillan; 1956. 788
29. Wang J, Xu L, Wang E, Huang S. The potential landscape of genetic circuits 789
imposes the arrow of time in stem cell differentiation. Biophys. J. 2010;99:29–39. 790
30. Chen L, Liu R, Liu ZP, Li M, Aihara K. Detecting early-warning signals for 791
sudden deterioration of complex diseases by dynamical network biomarkers. Sci. 792
Rep. 2012;2:18–20. 793
31. Giuliani A. Statistical Mechanics of Gene Expression Networks�: Increasing 794
Connectivity as a Response to Stressful Condition. Adv. Syst. Biol. 2014;3:1–4. 795
32. Gorban AN, Smirnova EV, Tyukina T. Correlations, risk and crisis: From 796
physiology to finance. Phys. A Stat. Mech. its Appl. 2010;389:3193–3217. 797
33. Huang S, Guo YP, May G, Enver T. Bifurcation dynamics in lineage-commitment 798
in bipotent progenitor cells. Dev. Biol. 2007;305: 695–713. 799
34. Bandura DR, Baranov VL, Ornatsky OI, Antonov A, Kinach R, Lou X, Pavlov S, 800
Vorobiev S, Dick JE, Tanner SD. Mass Cytometry: technique for real time single 801
cell multitarget immunoassay based on inductively coupled plasma time-of-flight 802
mass spectrometry. Anal. Chem. 2009;81:6813–6822. 803
35. Ozsolak F, Milos PM. RNA sequencing: advances, challenges and opportunities. 804
Nature Reviews:Genetics. 2011;12:87-98. 805
36. Mojtahedi M, Fouquier d’Hérouël A, Huang S. Direct elicitation of template 806
concentration from quantification cycle (Cq) distributions in digital PCR. Nucleic 807
Acids Res. 2014;42:e126. 808
37. Woronzoff-Dashkoff KK. The wright-giemsa stain. Secrets revealed. Clin. Lab. 809
Med. 2002;22:15–23. 810
.CC-BY-NC-ND 4.0 International licensepeer-reviewed) is the author/funder. It is made available under aThe copyright holder for this preprint (which was not. http://dx.doi.org/10.1101/041541doi: bioRxiv preprint first posted online Feb. 26, 2016;

23
38. Branon C, Morrison T. Nanoliter high throughput quantitative PCR. Nucleic Acids 811
Res. 2006;34:e123. 812
39. Fluidigm. Application Guidance�: Single-Cell Data Analysis-RevA1. 2012;1-40. 813
40. Guo Y, Eichler GS, Feng Y, Ingber DE, Huang S. Towards a holistic, yet gene-814
centered analysis of gene expression profiles: A case study of human lung cancers. 815
J. Biomed. Biotechnol. 2006;29:1–11. 816
.CC-BY-NC-ND 4.0 International licensepeer-reviewed) is the author/funder. It is made available under aThe copyright holder for this preprint (which was not. http://dx.doi.org/10.1101/041541doi: bioRxiv preprint first posted online Feb. 26, 2016;
.CC-BY-NC-ND 4.0 International licensepeer-reviewed) is the author/funder. It is made available under aThe copyright holder for this preprint (which was not. http://dx.doi.org/10.1101/041541doi: bioRxiv preprint first posted online Feb. 26, 2016;
.CC-BY-NC-ND 4.0 International licensepeer-reviewed) is the author/funder. It is made available under aThe copyright holder for this preprint (which was not. http://dx.doi.org/10.1101/041541doi: bioRxiv preprint first posted online Feb. 26, 2016;
.CC-BY-NC-ND 4.0 International licensepeer-reviewed) is the author/funder. It is made available under aThe copyright holder for this preprint (which was not. http://dx.doi.org/10.1101/041541doi: bioRxiv preprint first posted online Feb. 26, 2016;
.CC-BY-NC-ND 4.0 International licensepeer-reviewed) is the author/funder. It is made available under aThe copyright holder for this preprint (which was not. http://dx.doi.org/10.1101/041541doi: bioRxiv preprint first posted online Feb. 26, 2016;
.CC-BY-NC-ND 4.0 International licensepeer-reviewed) is the author/funder. It is made available under aThe copyright holder for this preprint (which was not. http://dx.doi.org/10.1101/041541doi: bioRxiv preprint first posted online Feb. 26, 2016;
.CC-BY-NC-ND 4.0 International licensepeer-reviewed) is the author/funder. It is made available under aThe copyright holder for this preprint (which was not. http://dx.doi.org/10.1101/041541doi: bioRxiv preprint first posted online Feb. 26, 2016;