Embed Size (px)
Citation preview
Integrated Systems and Technologies: Mathematical Oncology
Cell Division Patterns in Acute Myeloid LeukemiaStem-likeCellsDetermineClinicalCourse:AModelto Predict Patient SurvivalThomas Stiehl1,2,3, Natalia Baran4, Anthony D. Ho4, and Anna Marciniak-Czochra1,2,3
Abstract
Acute myeloid leukemia (AML) is a heterogeneous disease inwhich a variety of distinct genetic alterations might occur.Recent attempts to identify the leukemia stem-like cells (LSC)have also indicated heterogeneity of these cells. On the basis ofmathematical modeling and computer simulations, we haveprovided evidence that proliferation and self-renewal rates ofthe LSC population have greater impact on the course of diseasethan proliferation and self-renewal rates of leukemia blastpopulations, that is, leukemia progenitor cells. The modelingapproach has enabled us to estimate the LSC properties of 31individuals with relapsed AML and to link them to patient
survival. On the basis of the estimated LSC properties, thepatients can be divided into two prognostic groups that differsignificantly with respect to overall survival after first relapse.The results suggest that high LSC self-renewal and prolifera-tion rates are indicators of poor prognosis. Nevertheless,high LSC self-renewal rate may partially compensate for slowLSC proliferation and vice versa. Thus, model-based interpre-tation of clinical data allows estimation of prognostic factorsthat cannot be measured directly. This may have clinicalimplications for designing treatment strategies. Cancer Res;75(6); 940–9. �2015 AACR.
IntroductionAcute myeloid leukemias (AML) comprise a heterogeneous
group of diseases (11–12). Evidence accumulated that AMLs aremaintained by a population of leukemic stem cells (LSC, leuke-mia initiating cells, leukemia stem-like cells) that are resistant to
conventional chemotherapy, and likely are responsible forrelapses (7–8, 13). Division kinetics and self-renewal rates of LSCand less primitive leukemia blast cells are poorly understood,because they cannot be monitored in vivo (8, 14).
This issue is, however, of biologic and clinical significance asnot only the total count of leukemic cells may determine theclinical course, but also the LSC count and LSC dynamicalproperties such as proliferation and self-renewal rates. This isdemonstrated by the following two hypothetical scenarios. (i) Asmall number of LSC surviving induction chemotherapy drasti-cally reduce overall survival if they rapidly expand after cessationof the treatment. (ii) A small number of LSC surviving inductiontherapybut remaining dormant or slowly cycling after cessationoftherapy leads to relapse after many years and a longer period ofsurvival than in scenario (i). According to this reasoning, even if itwere possible to measure LSC numbers, for example, based onsurface markers, it would be important to know their divisionkinetics and self-renewal rates. Thus far, these parameters haveremained undefined (8, 14).
A growing number of genetic (11–12, 15), epigenetic (16), andregulatory aberrations (17–18) relevant for leukemogenesis andrisk stratification has been described. Despite this knowledge, theimpact of these factors on clinical course and on cell properties isnot well-defined (12, 19, 20). In general, the impact of a givenparameter may depend on the absence or presence of other, stillunknown, parameters (12, 21–23). Genetic studies suggest thatleukemogenetic hits vary considerably among patients (24–26).Variability in survival of patients with the same risk factors under-scores the complexity of the interplay of different detectedaberrations.
We propose that estimation of LSC properties in the terms ofself-renewal andproliferation ratesmay serve as a complementaryand more direct approach to gain insights into the mechanismsgoverning leukemia dynamics (19). In this work, we have applied
1Institute of Applied Mathematics, University of Heidelberg, Heidel-berg, Germany. 2Bioquant Center, University of Heidelberg, Heidel-berg, Germany. 3Interdisciplinary Center for Scientific Computing(IWR), University of Heidelberg, Heidelberg, Germany. 4Departmentof Medicine V, Medical Center, University of Heidelberg, Heidelberg,Germany.
Note: Supplementary data for this article are available at Cancer ResearchOnline (http://cancerres.aacrjournals.org/).
Corresponding Author: Thomas Stiehl, University of Heidelberg, Im Neuenhei-mer Feld 294, 69120 Heidelberg, Germany. Phone: 49-6221-548761; Fax: 49-6221-545331; E-mail: [email protected]
doi: 10.1158/0008-5472.CAN-14-2508
�2015 American Association for Cancer Research.
Major FindingsMathematical modeling and model-driven patient data
analysis suggest that proliferation and self-renewal rates ofleukemia stem-like cells (LSC) have greater impact on clinicaldynamics of acute myeloid leukemia than self-renewal andproliferation rates of non-stem leukemic cells. The proposedmathematical model allows deriving estimates of LSC prop-erties of individual patients that predict overall survival.
CancerResearch
Cancer Res; 75(6) March 15, 2015940
on September 20, 2018. © 2015 American Association for Cancer Research. cancerres.aacrjournals.org Downloaded from
Published OnlineFirst January 22, 2015; DOI: 10.1158/0008-5472.CAN-14-2508
a combination of mathematical models established by our group(5, 27). In conjunction with clinical parameters, we have studiedthe impact of LSC proliferation and self-renewal rates, comparedwith proliferation and self-renewal of less primitive leukemiablast cells or leukemia progenitor cells (LPC), on clinicaloutcome.
Mathematical approaches have been used many times toimprove understanding of the hematopoietic system and itsdiseases; for review see refs. 28–33. They offer the possibility tocomprehend processes not yet accessible by experimental mea-surements (5).
Quick Guide to Equations and AssumptionsWe consider a mathematical model describing dynamics of leukemic and hematopoietic cells in acute myeloid leukemia.
The model includes one hematopoietic and one leukemic cell line. The hematopoietic line consists of hematopoietic stem cells(HSC), hematopoietic progenitor cells (HPC), and postmitotic mature cells, the leukemic line of leukemia stem cells (LSC),leukemia progenitor cells, and postmitotic leukemic blasts. Both cell lines interact via feedback due to hematopoietic cytokines.
The main assumptions are:* Mitotic cells are characterized by their proliferation rate, apoptosis rate, and self-renewal rate. The latter determineswhat fraction
of progeny cells originating from division adopts the same fate as the parent cell.* Leukemic and hematopoietic cells respond to the same cytokines and compete for them (1–3). Cytokine densities depend
mainly on postmitotic cell densities (4).* Shortage of postmitotic cells leads to high cytokine concentrations (4).High cytokine levels lead to enhanced self-renewal (5–6).* All mitotic cell types have the ability to self-renew; the self-renewal potential of stem cells is higher than that of non-stem cells
(7–10).* Stem cells divide less frequently than progenitor cells (8–10).
We denote by c1 the density of HSCs, by p1c their proliferation rate, by d1
c their apoptosis rate, and by a1c their maximumpossible
self-renewal rates. The flux to mitosis is then p1c c1. Of the originating 2p1
c c1, the fraction a1c remains in the stem cell compartment
and the remainder belongs to theHPC compartment. The density of HPCs is denoted by c2, and that ofmature blood cells by c3. Therespective properties are denoted by p2
c, d2c and a2
c, d3c. The densities of leukemic stem cells, progenitor cells, and postmitotic blasts
are denoted by l1, l2, and l3. Their respective properties as p1l, d1
l, and a1l and so forth.
The density of cytokine molecules is denoted by s, and normalized between zero and one. It is given by
s tð Þ ¼ 11þ kll3ðtÞ þ kcc3ðtÞ ;
where kc and kl are positive constants.Time evolution of hematopoietic cells is then given by
ddtc1 ¼ 2ac1s� 1
� �pc1c1 � dc1c1
ddt
c2 ¼ 2 1� ac1s� �
pc1c1 þ 2ac2s� 1� �
pc2c2 � dc2c2
ddtc3 ¼ 2 1� ac2s
� �pc2c2 � dc3c3
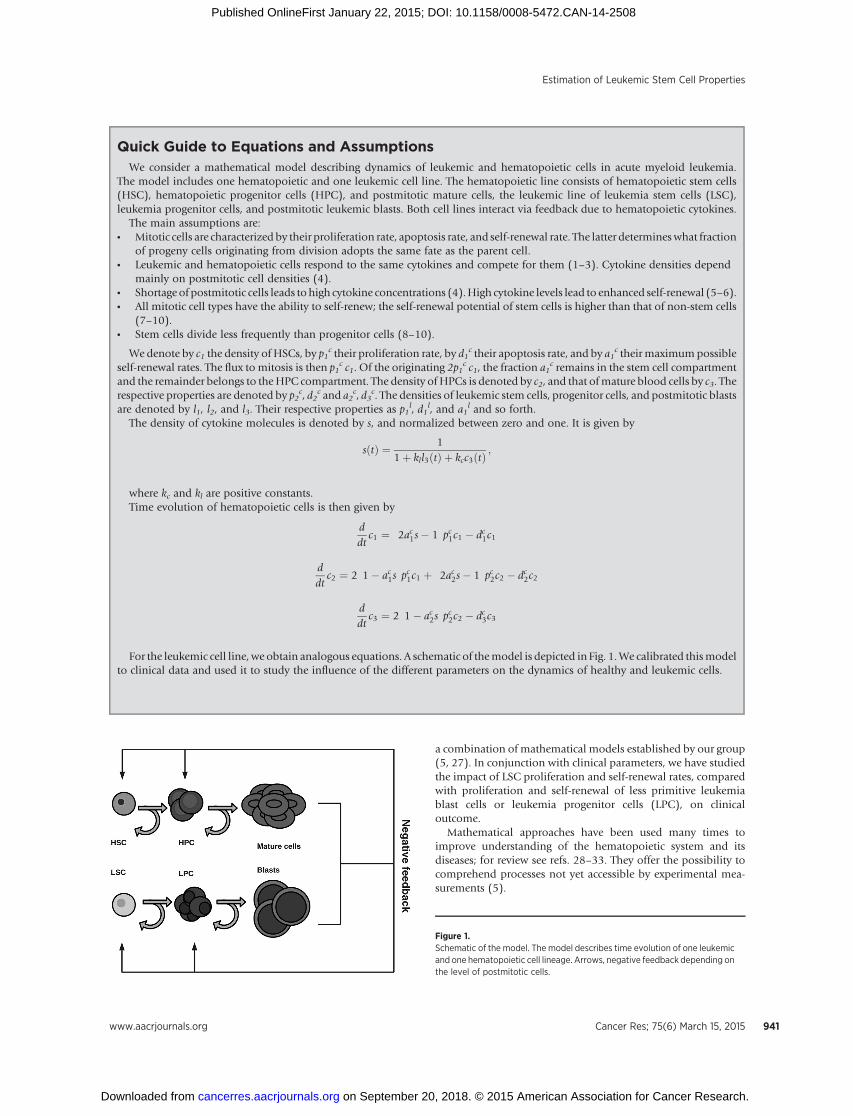
For the leukemic cell line, we obtain analogous equations. A schematic of themodel is depicted in Fig. 1.We calibrated thismodelto clinical data and used it to study the influence of the different parameters on the dynamics of healthy and leukemic cells.
Figure 1.Schematic of the model. The model describes time evolution of one leukemicand one hematopoietic cell lineage. Arrows, negative feedback depending onthe level of postmitotic cells.
Estimation of Leukemic Stem Cell Properties
www.aacrjournals.org Cancer Res; 75(6) March 15, 2015 941
on September 20, 2018. © 2015 American Association for Cancer Research. cancerres.aacrjournals.org Downloaded from
Published OnlineFirst January 22, 2015; DOI: 10.1158/0008-5472.CAN-14-2508
Achievements of the current work are 3-fold: (i) quantitativeestimation of the impact of the proliferation and self-renewalrates of LSC as well as of the less primitive LPCs on the clinicalcourse of disease, (ii) model-based estimation of LSC prolif-eration and self-renewal rates in relapsing patients, (iii) usingestimated LSC proliferation and self-renewal rates to predictpatients' prognosis.
In this study, we have outlined the principles of our mathe-matical model and we have defined the parameters of divisionkinetics and self-renewal rate. Using computer simulations, wehave related LSCproliferation and self-renewal rates to the clinicalcourse of relapse. We then have applied the proposed frameworkto estimate surrogate LSC proliferation and self-renewal rates of41 patients with relapsed AML and to relate them to long-termclinical outcomes.
Materials and MethodsMathematical model
In the following, we introduce the mathematical model. Themodel is an extension of amodel of hematopoiesis (6, 34), whichhas been validated on the basis of patient data and applied toclinical questions (5, 35).
On the basis of the classical understanding of hematopoiesis(36), we assume that the hematopoietic system consists of anordered sequence of discrete maturation states (compartments),which are sequentially traversed (36).We treat each compartmentas a "well-mixed tank" and describe its time evolution usingordinary differential equations. The large count of cells formingthe hematopoietic system (36, 37) justifies this approach. Themodel includes one leukemic cell lineage and one healthy celllineage.
For simplicity, we assume that each lineage consists of threedifferent cell types. In healthy hematopoiesis, we distinguishamong hematopoietic stem cells (HSC), hematopoietic progen-itor cells (HPC), and nondividing mature cells, whereas theleukemic lineage includes leukemic stem cells (LSC), an interme-diate population, corresponding to the progenitor cell populationof healthy hematopoiesis ("leukemic progenitor cells," LPC, thatis, dividing leukemic non-stem cells) and nondividing leukemicblasts.
Each cell type is characterized by the following cell properties:* Proliferation rate, describing the frequency of cell divisions
per unit of time.* Fraction of self-renewal (self-renewal rate), describing the
fraction of progeny cells returning to the compartmentoccupied by the parent cells that gave rise to them. On thebasis of our earlier work and on compatibility with clinicaldata (5–6, 38), we assume that the fraction of self-renewal isregulated by feedback signaling. The fraction of self-renewalassigned to non-stem cells is ameasure of the average numberof cell divisions performed before a cell becomes postmitoticunder homeostatic conditions (5).
* Death rate, describing the fraction of cells dying per unit oftime. For simplicity, we assume that dividing cells do not dieand nondividing cells die at constant rates.
Formation of blood cells is regulated by a negative feedback(4, 39), mediated by a system of lineage- and stage-specificcytokines (4, 36, 39). If there is a need for more blood cells of acertain type, the concentration of cytokine molecules increasesand stimulates formation of mature cells. Numerical solutions
of the model of hematopoiesis, validated on the basis ofclinical observations (5–6, 35, 38), indicate that the regulationof self-renewal is a more efficient mechanism than the regula-tion of proliferation rates. Similar conclusions were drawnusing the models of multistage cell lineages applied to regen-eration and maintenance of the mouse olfactory epithelium(40). Therefore, in this article, we assume that the regulatorymechanism is based on feedback inhibition of self-renewal bymature cells. For each dividing population, a maximal self-renewal rate is prescribed. Depending on the concentration ofthe feedback signal, self-renewal is downregulated. We postu-late that healthy and leukemic cells respond to the samefeedback signals. This assumption is supported by the findingthat leukemic cells express receptors for hematopoietic cyto-kines (1) and interact with the bone marrowmicroenvironment(2–3). We further presume that the level of the feedback signaldecreases if mature cell counts or leukemic blast countsincrease. This form of feedback can be interpreted as compe-tition between healthy and leukemic cells for environmentalfactors or bone marrow niche space (38, 41). The competitionof healthy and leukemic cells for environmental factors makesit necessary to model both lineages. Especially during the earlyphase of the disease, when leukemic cell numbers are stillsmall, consumption of resources by healthy cells is not negli-gible, because it is higher than consumption of resources byleukemic cells. A model including a different mechanism ofcompetition between leukemic and hematopoietic cells hasbeen proposed in (41) and shows similar dynamicproperties. Figure 1 gives a schematic representation of themodel. Derivation of the equations can be found in the Sup-plementary Data (Section 1).
SimulationsImpact of LSC properties on clinically observable progress of
the disease is investigated using model simulations. As asymptom of the progress, we consider impairment of hemato-poiesis, which is a common feature of acute leukemias. Wepresume that under physiologic conditions, the hematopoieticcells are in a dynamic equilibrium, that is, production of eachcell type equals its clearance. We start computer simulationswith equilibrium cell counts in the hematopoietic lineage and asmall number of LSC (1 per kg of body weight), mimicking theappearance of LSC due to a mutation or survival of LSC aftertherapy. Initial conditions for the other leukemic cell types(LPCs and blasts) are equal to zero. In the next step, we evaluatethe period of time until mature blood cell counts are reducedby 20%. Choosing different cutoff values between 10% and90% does not change the results; alternatively, marrow blastfractions can be used to define the time point of diagnosis. Weperform these simulations for a wide range of leukemic stemand progenitor cell properties. Parameters of the hematopoieticlineage have been calibrated on the basis of the data from theliterature (see Section 2 in Supplementary Data). Simulationshave been performed using standard ODE-solvers fromMATLAB (Version 7.8; The MathWorks, Inc.).
For all simulations, we assume the following, in accordancewith biologic hypotheses:* Leukemic stem cells proliferate slowly compared with
leukemic progenitor cells (8–10).* Leukemic stem cells have higher self-renewal rates than other
leukemic cells (7–10).
Stiehl et al.
Cancer Res; 75(6) March 15, 2015 Cancer Research942
on September 20, 2018. © 2015 American Association for Cancer Research. cancerres.aacrjournals.org Downloaded from
Published OnlineFirst January 22, 2015; DOI: 10.1158/0008-5472.CAN-14-2508
From mathematical analysis (34) and numerical studies (38),the capacity for self-renewal of LSCs must be larger than that ofHSC to observe the expansion of a LSC-derived leukemic cellpopulation. We hypothesize that a leukemic progenitor cellcannot establish a leukemic cell line in the absence of LSC(8–10). As a consequence, maximal self-renewal of leukemicprogenitor cells has to be smaller than that of HSCs (34). Fur-thermore, we postulate that clearance rates of blasts are constantover time. This might be accurate, provided that there exists stillunoccupied bone marrow space (41).
Application to patient dataWe apply the proposedmodel to obtain novel insights into cell
properties at relapse of AML.We use bonemarrow aspiration datafrom patients participating in clinical trials at the UniversityHospital of Heidelberg (Department of Medicine V; Heidelberg,Germany). Written consent for usage of clinical data for scientificpurposes was obtained from each patient.We consider the data of41 randomly chosen patients. Of the considered 41 patients, 22showed a FLT3-ITD at diagnosis. Patients had to meet the fol-lowing criteria: (i) at least one documented relapse of the diseasein the bonemarrow, (ii) achievement of complete remission (lessthan 5% blasts in marrow) after treatment of primary diagnosis,(iii) successful bone marrow examination at relapse, and (iv)
documented date of death or patients were still alive at the day ofdata collection. Criterion (iv) limited the number of consideredpatients.
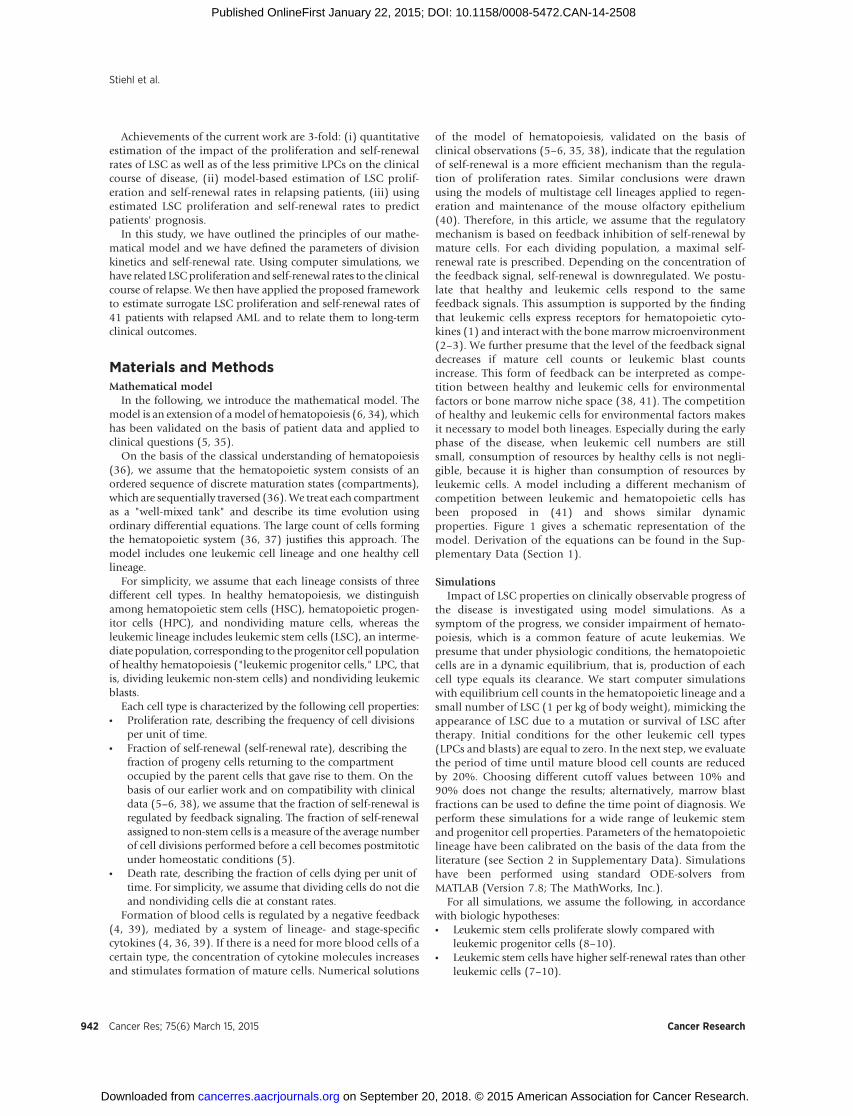
From the data we obtained the time elapsed between completeremission of primary disease and first relapse as well as themarrow blast fractions over time. Computer simulations indicatethat dynamics of the disease are approximately independent ofLPCproperties (Fig. 2A–E, see below). Therefore, we can apply themodel to estimate LSC properties based on clinical data. On thebasis of the assumptions that LSC number at complete remissionis small (less than 100 per kg of body weight) and that hemato-poietic recovery occurs fast in comparison with relapse, we seekLSC proliferation and self-renewal rates that can explain theobserved expansion of marrow blasts.
For this purpose, we vary LSC generation time between half aday and several months and self-renewal fraction between 0.501and 0.999 (a fraction of self-renewal equal to 1 means that allprogeny cells are of the same type as the parent cell). Within thisparameter range, we find all possible combinations compatiblewith clinical data. Blast half-life is chosenbetween 25%and100%of leukocyte half-life, motivated by literature (42). As simulationsshow, this choice has little impact on leukemia dynamics. In themodel, blast fractions are calculated by dividing the number of allleukemic cell types by the number of all hematopoietic cell types
Figure 2.Impact of LSC and LPC dynamics on the clinicalcourse. A, impact of LSC properties on impairmentof hematopoiesis. The vertical axis depicts the timeelapsed between appearance of one LSC per kg ofbody weight with the properties indicated on thex-axis (self-renewal) and y-axis (proliferation) andreduction of mature healthy cell counts by 20%.Time T is defined as the time coordinate of theminimum of the depicted graph. We introducedthis time unit to compare the impact of stem andprogenitor cell properties on leukemia dynamics.The time scale of the vertical axis is the same inA–E. In A, LPC parameters are fixed (proliferation,10� HPC proliferation; self-renewal, 0.6). B–E,impact of LPC properties on impairment ofhematopoiesis is relatively small compared withimpact of LSC properties. The vertical axis depictsthe time elapsed between appearance of one LSCper kg of body weight and reduction of maturehealthy cell counts by 20%; the x- and y-axesindicate properties of the LPC population. For eachof B–E, LSC properties were set to different fixedvalues: LSC proliferation: 0.5� HSC proliferation,LSC self-renewal: 0.87 (B); LSC proliferation: 5�HSC proliferation, LSC self-renewal: 0.9 (C); LSCproliferation: 10� HSC proliferation, LSC self-renewal: 0.99 (D); LSC proliferation: 1� HSCproliferation, LSC self-renewal: 0.86 (E). Forparameters for the hematopoietic lineage seeSection 2 in Supplementary Data.
Estimation of Leukemic Stem Cell Properties
www.aacrjournals.org Cancer Res; 75(6) March 15, 2015 943
on September 20, 2018. © 2015 American Association for Cancer Research. cancerres.aacrjournals.org Downloaded from
Published OnlineFirst January 22, 2015; DOI: 10.1158/0008-5472.CAN-14-2508
residing in bone marrow. The system is initialized with steadystate hematopoietic cell counts and a small number of LSCs (1LSC per kg of body weight). Other choices of initial LSC countslead to similar dynamics (see Fig. 3A and B).
Statistical analysisSurvival distributions of different patient groups are compared
using the log-rank test (43).Weperform an exact log-rank test thatis based on explicit calculation of the test statistic (44). In allconsidered cases, the test yields significant results (P < 0.05).
ResultsLSC properties are crucial for clinical dynamics
We used computer simulations to study the impact of LSCproliferation and self-renewal rates on the dynamics of disease. Asa marker of the clinical course, we chose the impairment ofhealthy hematopoiesis. Using the proportion of marrow blastsas a diagnostic marker led to equivalent results.
In our simulations, we measured the time from the origin ofa leukemic stem cell population until reduction of mature cellsby 20%. To detect its dependence on LSC properties, we fixedLPC parameters and varied LSC proliferation rate between 50%of HSC proliferation and 1,000% of HSC proliferation. LSCself-renewal rate was varied between 105% of HSC self-renewaland a value close to the maximal possible fraction of self-renewal, which is 1 (corresponding to the scenario that allprogeny cells are identical to their parent cells). Of note, 105%has been chosen because there is evidence that LSCs possesshigher self-renewal potential than HSC (20, 34, 41). Simula-tion results are depicted in Fig. 2A. Simulations suggest thatLSC properties have a strong impact on clinical dynamics. Thetime needed for 20% reduction of mature cell counts varies by
more than 250% for the chosen set of LSC properties. Figure 2Asuggests that the same dynamics can be obtained for LSC withdifferent self-renewal and proliferation rates. Fast impairmentof healthy hematopoiesis requires large LSC self-renewal rate orfast LSC division kinetics or a combination of both.
LPC properties have little impact on the course of the diseaseFor a range of LSC properties, we simulated the impact of
LPC properties on dynamics of disease. For this purpose, wevaried LPC proliferation between 50% of HPC and 2,000% ofHPC proliferation and LPC self-renewal between 1% and 99%of HSC self-renewal. The latter condition assured that LPC self-renewal was smaller than HSC self-renewal rate. The biologicinterpretation of this condition is that relapse of the disease canonly occur if LSCs survive chemotherapy (9–10). LSC proper-ties were kept fixed. The results are depicted in Fig. 2B–E.Simulations indicate that these variations had little impact ondynamics of the disease. Only if the self-renewal capacity ofleukemic progenitor cells approaches the self-renewal capacityof HSC or LSC, the influence of LPC properties on leukemiadynamics becomes visible. For the chosen parameter ranges, thetime needed for reduction of mature cells by 20% changes byless than 15% if LPC properties are varied. This value is small incomparison with the impact of LSC described above (see Figs. 2and 3A).
Properties of the LSC may differ between individualsThe results demonstrated in the previous section suggest that
dynamics of disease, that is, the time interval between gener-ation of LSC and outbreak of leukemia or time betweentreatment and relapse, depends predominantly on proliferationand self-renewal rates of LSC while the respective parameters ofall other leukemic cell types exert a negligible influence. If we
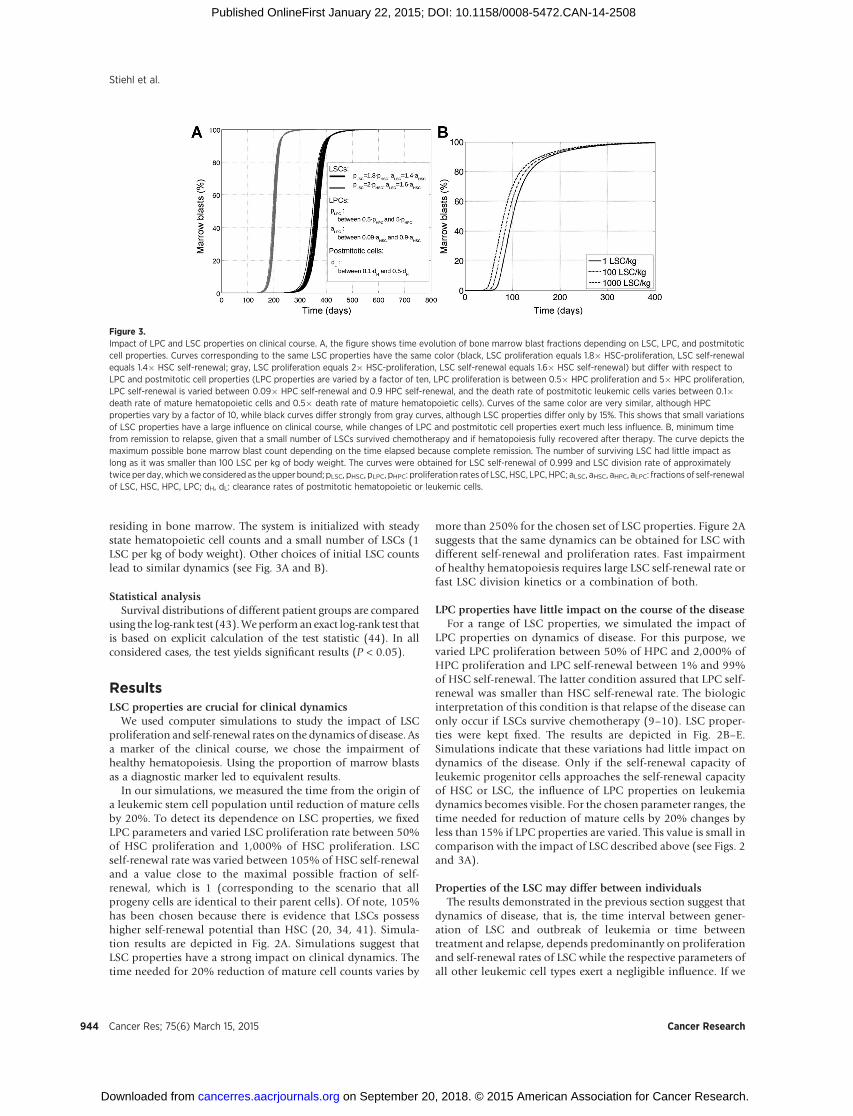
Figure 3.Impact of LPC and LSC properties on clinical course. A, the figure shows time evolution of bone marrow blast fractions depending on LSC, LPC, and postmitoticcell properties. Curves corresponding to the same LSC properties have the same color (black, LSC proliferation equals 1.8� HSC-proliferation, LSC self-renewalequals 1.4� HSC self-renewal; gray, LSC proliferation equals 2� HSC-proliferation, LSC self-renewal equals 1.6� HSC self-renewal) but differ with respect toLPC and postmitotic cell properties (LPC properties are varied by a factor of ten, LPC proliferation is between 0.5� HPC proliferation and 5� HPC proliferation,LPC self-renewal is varied between 0.09� HPC self-renewal and 0.9 HPC self-renewal, and the death rate of postmitotic leukemic cells varies between 0.1�death rate of mature hematopoietic cells and 0.5� death rate of mature hematopoietic cells). Curves of the same color are very similar, although HPCproperties vary by a factor of 10, while black curves differ strongly from gray curves, although LSC properties differ only by 15%. This shows that small variationsof LSC properties have a large influence on clinical course, while changes of LPC and postmitotic cell properties exert much less influence. B, minimum timefrom remission to relapse, given that a small number of LSCs survived chemotherapy and if hematopoiesis fully recovered after therapy. The curve depicts themaximum possible bone marrow blast count depending on the time elapsed because complete remission. The number of surviving LSC had little impact aslong as it was smaller than 100 LSC per kg of body weight. The curves were obtained for LSC self-renewal of 0.999 and LSC division rate of approximatelytwice per day,whichweconsidered as the upper bound; pLSC, pHSC, pLPC, pHPC: proliferation rates of LSC, HSC, LPC, HPC; aLSC, aHSC, aHPC, aLPC: fractions of self-renewalof LSC, HSC, HPC, LPC; dH, dL: clearance rates of postmitotic hematopoietic or leukemic cells.
Stiehl et al.
Cancer Res; 75(6) March 15, 2015 Cancer Research944
on September 20, 2018. © 2015 American Association for Cancer Research. cancerres.aacrjournals.org Downloaded from
Published OnlineFirst January 22, 2015; DOI: 10.1158/0008-5472.CAN-14-2508
assume that this is true, it will be possible to infer LSCproperties from clinical data. We have applied the model toclinical data from 41 patients with relapsed AML to estimatetheir respective LSC properties. We considered the followingidealized scenario: a small number of LSC (less than 100 per kgof body weight) survived chemotherapy, hematopoiesis wasfully restored after treatment and expansion of leukemic cellseventually led to relapse. This approach is justified by recentsequencing data showing that in many cases leukemia cells atrelapse are genetically related to the leukemic cells detected atprimary diagnosis (8, 15, 45).
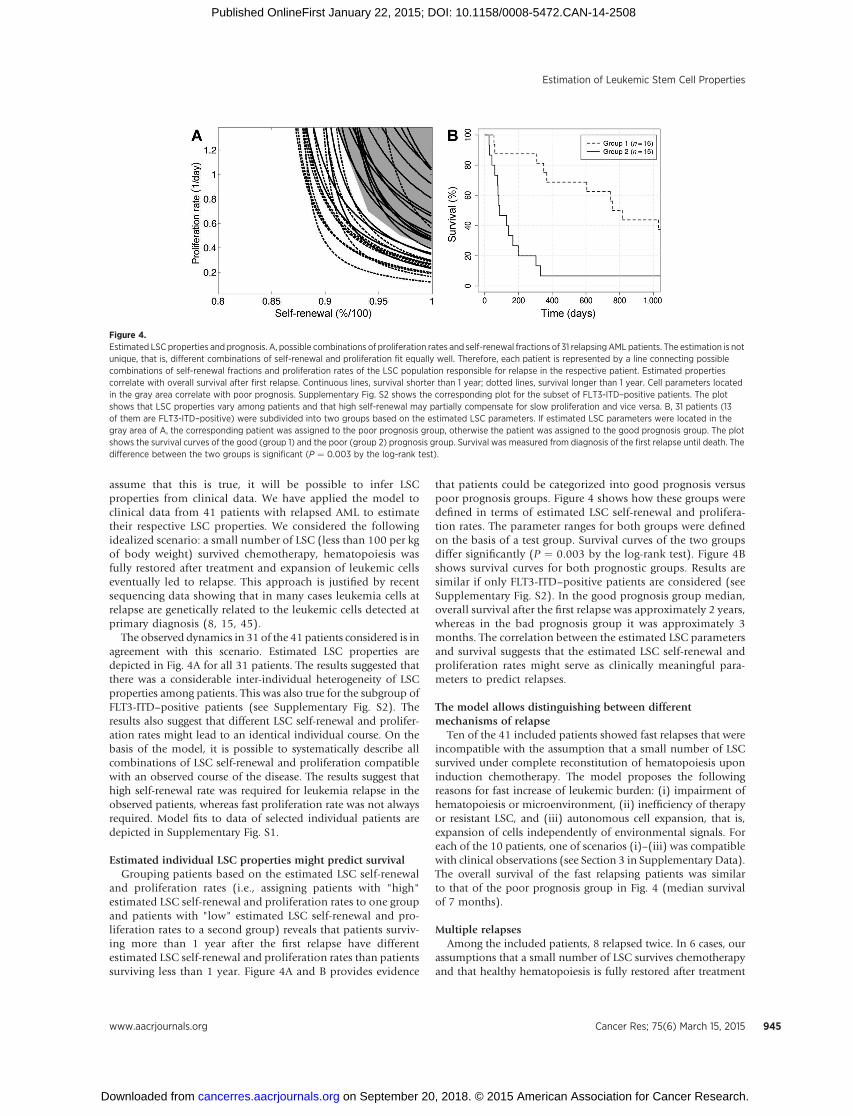
The observed dynamics in 31 of the 41 patients considered is inagreement with this scenario. Estimated LSC properties aredepicted in Fig. 4A for all 31 patients. The results suggested thatthere was a considerable inter-individual heterogeneity of LSCproperties among patients. This was also true for the subgroup ofFLT3-ITD–positive patients (see Supplementary Fig. S2). Theresults also suggest that different LSC self-renewal and prolifer-ation rates might lead to an identical individual course. On thebasis of the model, it is possible to systematically describe allcombinations of LSC self-renewal and proliferation compatiblewith an observed course of the disease. The results suggest thathigh self-renewal rate was required for leukemia relapse in theobserved patients, whereas fast proliferation rate was not alwaysrequired. Model fits to data of selected individual patients aredepicted in Supplementary Fig. S1.
Estimated individual LSC properties might predict survivalGrouping patients based on the estimated LSC self-renewal
and proliferation rates (i.e., assigning patients with "high"estimated LSC self-renewal and proliferation rates to one groupand patients with "low" estimated LSC self-renewal and pro-liferation rates to a second group) reveals that patients surviv-ing more than 1 year after the first relapse have differentestimated LSC self-renewal and proliferation rates than patientssurviving less than 1 year. Figure 4A and B provides evidence
that patients could be categorized into good prognosis versuspoor prognosis groups. Figure 4 shows how these groups weredefined in terms of estimated LSC self-renewal and prolifera-tion rates. The parameter ranges for both groups were definedon the basis of a test group. Survival curves of the two groupsdiffer significantly (P ¼ 0.003 by the log-rank test). Figure 4Bshows survival curves for both prognostic groups. Results aresimilar if only FLT3-ITD–positive patients are considered (seeSupplementary Fig. S2). In the good prognosis group median,overall survival after the first relapse was approximately 2 years,whereas in the bad prognosis group it was approximately 3months. The correlation between the estimated LSC parametersand survival suggests that the estimated LSC self-renewal andproliferation rates might serve as clinically meaningful para-meters to predict relapses.
The model allows distinguishing between differentmechanisms of relapse
Ten of the 41 included patients showed fast relapses that wereincompatible with the assumption that a small number of LSCsurvived under complete reconstitution of hematopoiesis uponinduction chemotherapy. The model proposes the followingreasons for fast increase of leukemic burden: (i) impairment ofhematopoiesis or microenvironment, (ii) inefficiency of therapyor resistant LSC, and (iii) autonomous cell expansion, that is,expansion of cells independently of environmental signals. Foreach of the 10 patients, one of scenarios (i)–(iii) was compatiblewith clinical observations (see Section 3 in Supplementary Data).The overall survival of the fast relapsing patients was similarto that of the poor prognosis group in Fig. 4 (median survivalof 7 months).
Multiple relapsesAmong the included patients, 8 relapsed twice. In 6 cases, our
assumptions that a small number of LSC survives chemotherapyand that healthy hematopoiesis is fully restored after treatment
Figure 4.Estimated LSC properties and prognosis. A, possible combinations of proliferation rates and self-renewal fractions of 31 relapsingAML patients. The estimation is notunique, that is, different combinations of self-renewal and proliferation fit equally well. Therefore, each patient is represented by a line connecting possiblecombinations of self-renewal fractions and proliferation rates of the LSC population responsible for relapse in the respective patient. Estimated propertiescorrelate with overall survival after first relapse. Continuous lines, survival shorter than 1 year; dotted lines, survival longer than 1 year. Cell parameters locatedin the gray area correlate with poor prognosis. Supplementary Fig. S2 shows the corresponding plot for the subset of FLT3-ITD–positive patients. The plotshows that LSC properties vary among patients and that high self-renewal may partially compensate for slow proliferation and vice versa. B, 31 patients (13of them are FLT3-ITD–positive) were subdivided into two groups based on the estimated LSC parameters. If estimated LSC parameters were located in thegray area of A, the corresponding patient was assigned to the poor prognosis group, otherwise the patient was assigned to the good prognosis group. The plotshows the survival curves of the good (group 1) and the poor (group 2) prognosis group. Survival was measured from diagnosis of the first relapse until death. Thedifference between the two groups is significant (P ¼ 0.003 by the log-rank test).
Estimation of Leukemic Stem Cell Properties
www.aacrjournals.org Cancer Res; 75(6) March 15, 2015 945
on September 20, 2018. © 2015 American Association for Cancer Research. cancerres.aacrjournals.org Downloaded from
Published OnlineFirst January 22, 2015; DOI: 10.1158/0008-5472.CAN-14-2508
can recapitulate the observed data. Our results indicated that LSCproperties might vary between relapses.
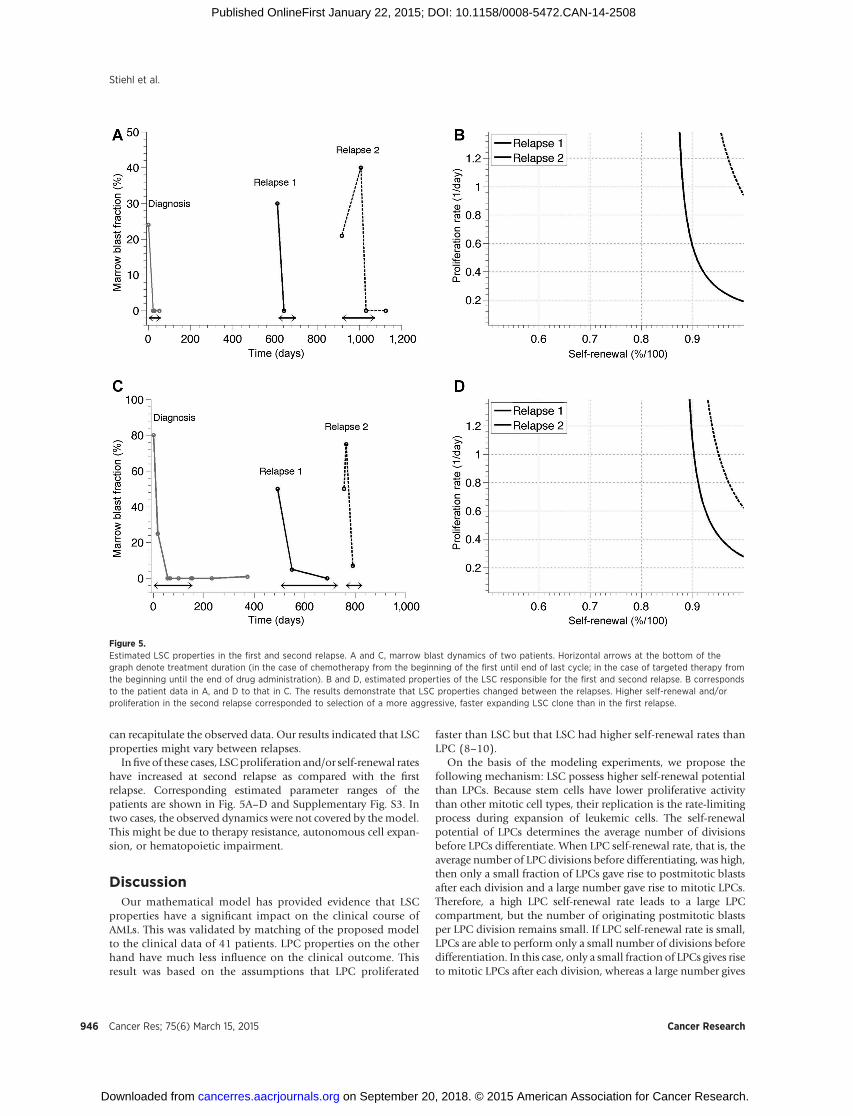
Infive of these cases, LSCproliferation and/or self-renewal rateshave increased at second relapse as compared with the firstrelapse. Corresponding estimated parameter ranges of thepatients are shown in Fig. 5A–D and Supplementary Fig. S3. Intwo cases, the observed dynamics were not covered by themodel.This might be due to therapy resistance, autonomous cell expan-sion, or hematopoietic impairment.
DiscussionOur mathematical model has provided evidence that LSC
properties have a significant impact on the clinical course ofAMLs. This was validated by matching of the proposed modelto the clinical data of 41 patients. LPC properties on the otherhand have much less influence on the clinical outcome. Thisresult was based on the assumptions that LPC proliferated
faster than LSC but that LSC had higher self-renewal rates thanLPC (8–10).
On the basis of the modeling experiments, we propose thefollowing mechanism: LSC possess higher self-renewal potentialthan LPCs. Because stem cells have lower proliferative activitythan other mitotic cell types, their replication is the rate-limitingprocess during expansion of leukemic cells. The self-renewalpotential of LPCs determines the average number of divisionsbefore LPCs differentiate. When LPC self-renewal rate, that is, theaverage number of LPC divisions before differentiating, was high,then only a small fraction of LPCs gave rise to postmitotic blastsafter each division and a large number gave rise to mitotic LPCs.Therefore, a high LPC self-renewal rate leads to a large LPCcompartment, but the number of originating postmitotic blastsper LPC division remains small. If LPC self-renewal rate is small,LPCs are able to perform only a small number of divisions beforedifferentiation. In this case, only a small fraction of LPCs gives riseto mitotic LPCs after each division, whereas a large number gives
Figure 5.Estimated LSC properties in the first and second relapse. A and C, marrow blast dynamics of two patients. Horizontal arrows at the bottom of thegraph denote treatment duration (in the case of chemotherapy from the beginning of the first until end of last cycle; in the case of targeted therapy fromthe beginning until the end of drug administration). B and D, estimated properties of the LSC responsible for the first and second relapse. B correspondsto the patient data in A, and D to that in C. The results demonstrate that LSC properties changed between the relapses. Higher self-renewal and/orproliferation in the second relapse corresponded to selection of a more aggressive, faster expanding LSC clone than in the first relapse.
Stiehl et al.
Cancer Res; 75(6) March 15, 2015 Cancer Research946
on September 20, 2018. © 2015 American Association for Cancer Research. cancerres.aacrjournals.org Downloaded from
Published OnlineFirst January 22, 2015; DOI: 10.1158/0008-5472.CAN-14-2508
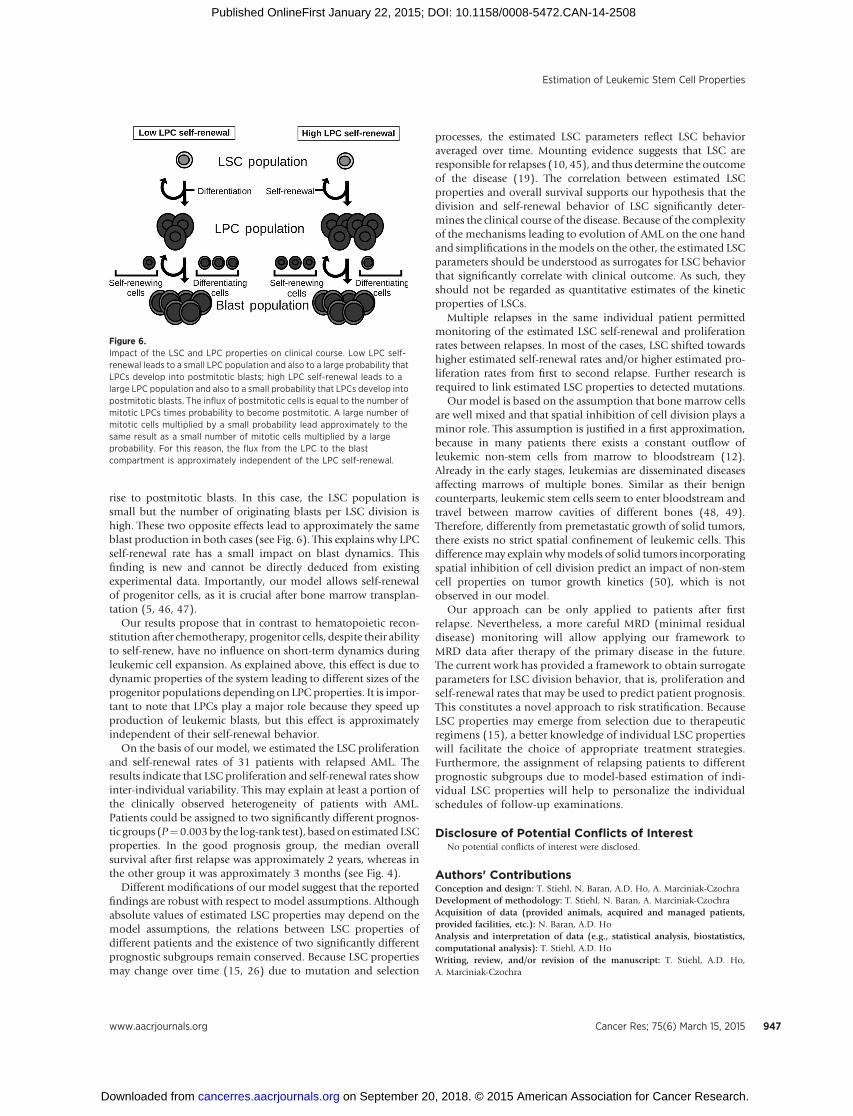
rise to postmitotic blasts. In this case, the LSC population issmall but the number of originating blasts per LSC division ishigh. These two opposite effects lead to approximately the sameblast production in both cases (see Fig. 6). This explains why LPCself-renewal rate has a small impact on blast dynamics. Thisfinding is new and cannot be directly deduced from existingexperimental data. Importantly, our model allows self-renewalof progenitor cells, as it is crucial after bone marrow transplan-tation (5, 46, 47).
Our results propose that in contrast to hematopoietic recon-stitution after chemotherapy, progenitor cells, despite their abilityto self-renew, have no influence on short-term dynamics duringleukemic cell expansion. As explained above, this effect is due todynamic properties of the system leading to different sizes of theprogenitor populations depending on LPC properties. It is impor-tant to note that LPCs play a major role because they speed upproduction of leukemic blasts, but this effect is approximatelyindependent of their self-renewal behavior.
On the basis of our model, we estimated the LSC proliferationand self-renewal rates of 31 patients with relapsed AML. Theresults indicate that LSC proliferation and self-renewal rates showinter-individual variability. This may explain at least a portion ofthe clinically observed heterogeneity of patients with AML.Patients could be assigned to two significantly different prognos-tic groups (P¼0.003by the log-rank test), basedonestimated LSCproperties. In the good prognosis group, the median overallsurvival after first relapse was approximately 2 years, whereas inthe other group it was approximately 3 months (see Fig. 4).
Different modifications of our model suggest that the reportedfindings are robust with respect to model assumptions. Althoughabsolute values of estimated LSC properties may depend on themodel assumptions, the relations between LSC properties ofdifferent patients and the existence of two significantly differentprognostic subgroups remain conserved. Because LSC propertiesmay change over time (15, 26) due to mutation and selection
processes, the estimated LSC parameters reflect LSC behavioraveraged over time. Mounting evidence suggests that LSC areresponsible for relapses (10, 45), and thus determine the outcomeof the disease (19). The correlation between estimated LSCproperties and overall survival supports our hypothesis that thedivision and self-renewal behavior of LSC significantly deter-mines the clinical course of the disease. Because of the complexityof the mechanisms leading to evolution of AML on the one handand simplifications in themodels on the other, the estimated LSCparameters should be understood as surrogates for LSC behaviorthat significantly correlate with clinical outcome. As such, theyshould not be regarded as quantitative estimates of the kineticproperties of LSCs.
Multiple relapses in the same individual patient permittedmonitoring of the estimated LSC self-renewal and proliferationrates between relapses. In most of the cases, LSC shifted towardshigher estimated self-renewal rates and/or higher estimated pro-liferation rates from first to second relapse. Further research isrequired to link estimated LSC properties to detected mutations.
Our model is based on the assumption that bone marrow cellsare well mixed and that spatial inhibition of cell division plays aminor role. This assumption is justified in a first approximation,because in many patients there exists a constant outflow ofleukemic non-stem cells from marrow to bloodstream (12).Already in the early stages, leukemias are disseminated diseasesaffecting marrows of multiple bones. Similar as their benigncounterparts, leukemic stem cells seem to enter bloodstream andtravel between marrow cavities of different bones (48, 49).Therefore, differently from premetastatic growth of solid tumors,there exists no strict spatial confinement of leukemic cells. Thisdifferencemay explain whymodels of solid tumors incorporatingspatial inhibition of cell division predict an impact of non-stemcell properties on tumor growth kinetics (50), which is notobserved in our model.
Our approach can be only applied to patients after firstrelapse. Nevertheless, a more careful MRD (minimal residualdisease) monitoring will allow applying our framework toMRD data after therapy of the primary disease in the future.The current work has provided a framework to obtain surrogateparameters for LSC division behavior, that is, proliferation andself-renewal rates that may be used to predict patient prognosis.This constitutes a novel approach to risk stratification. BecauseLSC properties may emerge from selection due to therapeuticregimens (15), a better knowledge of individual LSC propertieswill facilitate the choice of appropriate treatment strategies.Furthermore, the assignment of relapsing patients to differentprognostic subgroups due to model-based estimation of indi-vidual LSC properties will help to personalize the individualschedules of follow-up examinations.
Disclosure of Potential Conflicts of InterestNo potential conflicts of interest were disclosed.
Authors' ContributionsConception and design: T. Stiehl, N. Baran, A.D. Ho, A. Marciniak-CzochraDevelopment of methodology: T. Stiehl, N. Baran, A. Marciniak-CzochraAcquisition of data (provided animals, acquired and managed patients,provided facilities, etc.): N. Baran, A.D. HoAnalysis and interpretation of data (e.g., statistical analysis, biostatistics,computational analysis): T. Stiehl, A.D. HoWriting, review, and/or revision of the manuscript: T. Stiehl, A.D. Ho,A. Marciniak-Czochra
Figure 6.Impact of the LSC and LPC properties on clinical course. Low LPC self-renewal leads to a small LPC population and also to a large probability thatLPCs develop into postmitotic blasts; high LPC self-renewal leads to alarge LPC population and also to a small probability that LPCs develop intopostmitotic blasts. The influx of postmitotic cells is equal to the number ofmitotic LPCs times probability to become postmitotic. A large number ofmitotic cells multiplied by a small probability lead approximately to thesame result as a small number of mitotic cells multiplied by a largeprobability. For this reason, the flux from the LPC to the blastcompartment is approximately independent of the LPC self-renewal.
Estimation of Leukemic Stem Cell Properties
www.aacrjournals.org Cancer Res; 75(6) March 15, 2015 947
on September 20, 2018. © 2015 American Association for Cancer Research. cancerres.aacrjournals.org Downloaded from
Published OnlineFirst January 22, 2015; DOI: 10.1158/0008-5472.CAN-14-2508
Administrative, technical, or material support (i.e., reporting or organizingdata, constructing databases): T. StiehlStudy supervision: A.D. Ho, A. Marciniak-Czochra
Grant SupportThis work was supported by the Collaborative Research Center, SFB 873
"Maintenance and Differentiation of Stem Cells in Development and Disease"from the German Research Council (DFG).
The costs of publication of this article were defrayed in part by thepayment of page charges. This article must therefore be hereby markedadvertisement in accordance with 18 U.S.C. Section 1734 solely to indicatethis fact.
Received August 28, 2014; revised December 5, 2014; accepted December 10,2014; published OnlineFirst January 22, 2015.
References1. Shinjo K, Takeshita A,Ohnishi K, Ohno R. Granulocyte colony-stimulating
factor receptor at various differentiation stages of normal and leukemichematopoietic cells. Leuk Lymphoma 1997;25:37–46.
2. Cogle CR, Goldman DC,Madlambayan GJ, Leon RP, Al Masri A, Clark HA,et al. Functional integration of acute myeloid leukemia into the vascularniche. Leukemia 2014;28:1978–87.
3. Krause DS, Fulzele K, Catic A, Sun CC, Dombkowski D, Hurley MP, et al.Differential regulation of myeloid leukemias by the bone marrow micro-environment. Nat Med 2013;19:1513–7.
4. Layton JE, Hockman H, Sheridan WP, Morstyn G. Evidence for a novel invivo control mechanism of granulopoiesis: mature cell-related control of aregulatory growth factor. Blood 1989;74:1303–7.
5. Stiehl T, Ho AD, Marciniak-Czochra A. The impact of CD34þ cell dose onengraftment after stem cell transplantations: personalized estimates basedon mathematical modeling. Bone Marrow Transplant 2014;49:30–37.
6. Marciniak-Czochra A, Stiehl T, Jager W, Ho AD, Wagner W. Modeling ofasymmetric cell division in hematopoietic stem cells—regulation of self-renewal is essential for efficient repopulation. Stem Cells Dev 2009;18:377–85.
7. Bonnet D, Dick JE. Human acute myeloid leukemia is organized as ahierarchy that originates from a primitive hematopoietic cell. Nat Med1997;3:730–7.
8. Lutz C, Hoang VT, Ho AD. Identifying leukemia stem cells—is it feasibleand does it matter? Cancer Lett 2013;338:10–14.
9. Chen SY, Huang YC, Liu SP, Tsai FJ, Shyu WC, Lin SZ. An overview ofconcepts. Cell Transplant 2011;20:113–120.
10. Buss EC, Ho AD. Leukemia stem cells. Int. J. Cancer 2011;129:2328–36.11. Kihara R, Nagata Y, Kiyoi H, Kato T, Yamamoto E, Suzuki K, et al.
Comprehensive analysis of genetic alterations and their prognostic impactsin adult acute myeloid leukemia patients. Leukemia 2014.
12. EH Estey. Acute myeloid leukemia: 2013 update on risk-stratification andmanagement. Am J Hematol 2013;88:318–27.
13. HopeKJ, Jin L,Dick JE. Acutemyeloid leukemia originates fromahierarchyof leukemic stem cell classes that differ in self-renewal capacity. NatImmunol 2004;5:738–743.
14. Wright NA. Stem cell identification—in vivo lineage analysis versus in vitroisolation and clonal expansion. J Pathol 2012;227:255–266.
15. Ding L, Ley TJ, Larson DE, Miller CA, Koboldt DC, Welch JS, et al. Clonalevolution in relapsed acutemyeloid leukaemia revealed by whole-genomesequencing. Nature 2012;481:506–510.
16. Gutierrez SE, Romero-Oliva FA. Epigenetic changes: a common theme inacute myelogenous leukemogenesis. J Hematol Oncol 2013;6:57.
17. Gentles AJ, Plevritis SK, Majeti R, Alizadeh AA. Association of a leukemicstem cell gene expression signaturewith clinical outcomes in acutemyeloidleukemia. JAMA 2010;304:2706–15.
18. Marcucci G, Maharry KS, Metzeler KH, Volinia S, Wu YZ, Mrozek K, et al.Clinical role of microRNAs in cytogenetically normal acute myeloidleukemia: miR-155 upregulation independently identifies high-riskpatients. J Clin Oncol 2013;31:2068–93.
19. Gudgin EJ, Huntly BJP. Acute myeloid leukemia: leukemia stem cells writea prognostic signature. Stem Cell Res Ther 2011;2:1–3.
20. Shlush LI, Zandi S, Mitchell A, Chen WC, Brandwein JM, Gupta V, et al.Identification of pre-leukaemic haematopoietic stem cells in acute leukae-mia. Nature 2014;506:328–33.
21. Gale RE, Green C, Allen C, Mead AJ, Burnett AK, Hills RK, et al. The impactof FLT3 internal tandem duplication mutant level, number, size, andinteraction with NPM1mutations in a large cohort of young adult patientswith acute myeloid leukemia. Blood 2008;111:2776–84.
22. Bacher U, Haferlach C, Kern W, Haferlach T, Schnittger S. Prognosticrelevance of FLT3-TKD mutations in AML: the combination matter—ananalysis of 3082 patients. Blood 2008;111:2527–37.
23. Renneville A, Roumier C, Biggio V, Nibourel O, Boissel N, Fenaux P, et al.Cooperating gene mutations in acute myeloid leukemia: a review of theliterature. Leukemia 2008;22:915–31.
24. Schaub FX, Looser R, Li S, Hao-ShenH, Lehmann T, Tichelli A, et al. Clonalanalysis of TET2 and JAK2mutations suggests that TET2 can be a late eventin the progression of myeloproliferative neoplasms. Blood 2010;115:2003–7.
25. Jan M, Majeti R. Clonal evolution of acute leukemia genomes. Oncogene2013;32:135–140.
26. Jan M, Snyder TM, Corces-Zimmerman MR, Vyas P, Weissman IL, QuakeSR, et al. Clonal evolution of preleukemic hematopoietic stem cellsprecedes human acute myeloid leukemia. Sci Transl Med 2012;4:149ra118.
27. Stiehl T,Marciniak-CzochraA.Mathematicalmodelling of leukemogenesisand cancer stem cell dynamics. Math Mod Nat Phenom 2012;7:166–202.
28. Roeder I. Quantitative stem-cell biology: computational studies in thehematopoietic system. Curr Opinion Hematol 2006;13:222–8.
29. Foley C,MackeyMC.Dynamic hematological disease: a review. JMath Biol2009;58:285–322.
30. Whichard ZL, Sarkar CA, Kimmel M, Corey SJ. Hematopoiesis and itsdisorders: a systems biology approach. Blood 2010;115:2339–47.
31. Liso A, Castiglione F, Cappuccio A, Stracci F, Schlenk RF, Amadori S, et al. Aone-mutation mathematical model can explain the age incidence of acutemyeloid leukemia withmutated nucleophosmin (NPM1). Haematologica2008;93:1219–26.
32. Scholz M, Engel C, Loeffler M. Modelling human granulopoiesis underpoly-chemotherapy with G-CSF support. J Math Biol 2005;50:397–439.
33. Wodarz D, Garg N, Komarova NL, Ohad B, Keating MJ, Wierda WG, et al.Kinetics of chronic lymphocytic leukemia (CLL) cells in tissues and bloodduring therapy with the BTK inhibitor ibrutinib. Blood 2014.
34. Stiehl T, Marciniak-Czochra A. Characterization of stem cells using math-ematical models of multistage cell lineages. Math Comp Model 2011;53:1505–17.
35. Marciniak-Czochra A, Stiehl T Mathematical models of hematopoieticreconstitution after stem cell transplantation. In:BockHG,Carraro T, JaegerW, Koerkel S eds. Model based parameter estimation: theory and applica-tions. Heidelberg, Germany: Springer; 2011.
36. Jandl JH Blood cell formation. In:Jandl JH ed. Textbook of hematology.Boston, MA: Little, Brown and Company; 1996. p. 1–69.
37. Lansdorp PM. Stem cell biology for the transfusionist. Vox Sang 1998;74(Suppl 2):91–94.
38. Walenda T, Stiehl T, Braun H, Fr€obel J, Ho AD, Schroeder T, et al. Feedbacksignals in myelodysplastic syndromes: increased self-renewal of the malig-nant clone suppresses normal hematopoiesis. PLoS Comp Biol 2014;10:e1003599.
39. Metcalf D. Hematopoietic cytokines. Blood 2008;111:485–491.40. Lander A, Gokoffski K,Wan F, NieQ, Calof A. Cell lineages and the logic of
proliferative control. PLoS Biol 2009;7:84–100.41. Stiehl T, Baran N, Ho AD, Marciniak-Czochra A. Clonal selection and
therapy resistance in acute leukaemias: mathematical modelling explainsdifferent proliferation patterns at diagnosis and relapse. J R Soc Interface2014;11:20140079.
42. Savitskiy VP, Shman TV, Potapnev MP. Comparative measurement ofspontaneous apoptosis in pediatric acute leukemia bydifferent techniques.Cytom B Clin Cytom 2003;56:16–22.
Cancer Res; 75(6) March 15, 2015 Cancer Research948
Stiehl et al.
on September 20, 2018. © 2015 American Association for Cancer Research. cancerres.aacrjournals.org Downloaded from
Published OnlineFirst January 22, 2015; DOI: 10.1158/0008-5472.CAN-14-2508
43. Armitage P, Berry G, Matthews JNS eds. Statistical methods in medicalresearch, 4th ed. Oxford, United Kingdom: Blackwell Science Ltd.;2002.
44. Everitt B,Hothorn T eds. A handbook of statistical analyses using R, 2nd ed.London, United Kingdom: Chapman and Hall CRC; 2010.
45. Lutz C, Woll PS, Hall G, Castor A, Dreau H, Cazzaniga G, et al. Quiescentleukaemic cells account for minimal residual disease in childhood lym-phoblastic leukaemia. Leukemia 2013;27:1204–7.
46. Astori G, Malangone W, Adami V, Risso A, Dorotea L, Falasca E. A novelprotocol that allows short-term stemcell expansionofboth committed andpluripotent hematopoietic progenitor cells suitable for clinical use. BloodCells Mol Dis 2001;27:715–24.
47. RoodmanGD, LeMaistre CF,ClarkGM,PageCP,NewcombTF,KnightWA.CFU-GEMM correlate with neutrophil and platelet recovery in patientsreceiving autologous marrow transplantation after high-dose melphalanchemotherapy. Bone Marrow Transplant 1987;2:165–73.
48. Wright DE, Wagers AJ, Gulati AP, Johnson FL, Weissman IL. Physiologicalmigration of hematopoietic stem and progenitor cells. Nature 2011;294:1933–6.
49. Schroeder MA, DiPersio JF. Mobilization of hematopoietic stem andleukemia cells. J Leukoc Biol 2012;91:47–57.
50. Morton CI, Hlatky L, Hahnfeldt P, Enderling H. Non-stem cancer cellkinetics modulate solid tumor progression. Theor Biol Med Model2011;8:48.
www.aacrjournals.org Cancer Res; 75(6) March 15, 2015 949
Estimation of Leukemic Stem Cell Properties
on September 20, 2018. © 2015 American Association for Cancer Research. cancerres.aacrjournals.org Downloaded from
Published OnlineFirst January 22, 2015; DOI: 10.1158/0008-5472.CAN-14-2508
2015;75:940-949. Published OnlineFirst January 22, 2015.Cancer Res Thomas Stiehl, Natalia Baran, Anthony D. Ho, et al. Determine Clinical Course: A Model to Predict Patient SurvivalCell Division Patterns in Acute Myeloid Leukemia Stem-like Cells
Updated version
10.1158/0008-5472.CAN-14-2508doi:
Access the most recent version of this article at:
Material
Supplementary
http://cancerres.aacrjournals.org/content/suppl/2015/01/22/0008-5472.CAN-14-2508.DC1
Access the most recent supplemental material at:
Cited articles
http://cancerres.aacrjournals.org/content/75/6/940.full#ref-list-1
This article cites 44 articles, 9 of which you can access for free at:
Citing articles
http://cancerres.aacrjournals.org/content/75/6/940.full#related-urls
This article has been cited by 4 HighWire-hosted articles. Access the articles at:
E-mail alerts related to this article or journal.Sign up to receive free email-alerts
Subscriptions
Reprints and
To order reprints of this article or to subscribe to the journal, contact the AACR Publications Department at
Permissions
Rightslink site. Click on "Request Permissions" which will take you to the Copyright Clearance Center's (CCC)
.http://cancerres.aacrjournals.org/content/75/6/940To request permission to re-use all or part of this article, use this link
on September 20, 2018. © 2015 American Association for Cancer Research. cancerres.aacrjournals.org Downloaded from
Published OnlineFirst January 22, 2015; DOI: 10.1158/0008-5472.CAN-14-2508


![Isolationand Immunochemicaland Chemical Characterization ...cancerres.aacrjournals.org/content/canres/37/8_Part_1/2638.full.pdf · [CANCER RESEARCH 37, 2638-2643, August 1977] SUMMARY](https://img.pdfslide.us/doc/110x75/5e8c9e4abec5b96bc2503bdc/isolationand-immunochemicaland-chemical-characterization-cancer-research-37.jpg)