Embed Size (px)
Citation preview
Council of European Energy Regulators asbl Cours Saint-Michel 30a Box F ndash 1040 Brussels Belgium Arrondissement judiciaire de Bruxelles ndash RPM 0861035445
Report on Regulatory Frameworks for European Energy Networks 2020
Incentive Regulation and Benchmarking Work Stream
Ref C20-IRB-54-03 11 March 2021
Ref C20-IRB-54-03
CEER Report on Regulatory Frameworks for European Energy Networks 2020
2156
INFORMATION PAGE
Abstract
This document (Ref C20-IRB-54-03) presents the 2020 edition of the CEER report on regulatory frameworks for European energy networks
This report provides a general overview of the regulatory regimes applied in 2020 the required efficiency developments and analyses the overall determination of capital costs in EU Member States Great Britain Northern Ireland Iceland and Norway A major focus is placed on the calculation of an adequate rate of return the determination of the regulatory asset base (RAB) and the depreciation of assets in the different regulatory regimes Other important individual parameters and new incentive mechanisms presented in this study should be interpreted in the context of a whole country-specific regulatory regime Some contents only reflect an ex-ante approach for 2020 while ex-post calculations are yet to be performed
This report also serves as a background paper to CEER work on incentives both in a quantitative as well as in a qualitative way
Target Audience European Commission energy suppliers traders gaselectricity customers gaselectricity industry consumer representative groups network operators Member States academics and other interested parties
Keywords Regulatory framework investment conditions networks rate-of-return regulation regulatory asset base cost of capital incentive mechanisms depreciations
Disclaimer This report has been drafted with care and CEER has no intention to express opinions with this report However CEER cannot guarantee that the report is free of errors or statements that unintentionally could be taken as an opinion rather than a neutral conclusion or a reported fact If you have any queries relating to this paper please contact CEER Secretariat Tel +32 (0)2 788 73 30 Email brusselsceereu
Ref C20-IRB-54-03
CEER Report on Regulatory Frameworks for European Energy Networks 2020
3156
Related Documents CEER Documents
bull CEER Report on Regulatory Frameworks for European Energy Networks 2019 Ref C19-IRB-48-03 28 January 2020
bull CEER Report on Regulatory Frameworks for European Energy Networks 2018 Ref C18-IRB-38-03 18 January 2019
bull CEER Report on Investment Conditions in European Countries in 2017 Ref C17-IRB-30-03 11 January 2018
bull CEER Report on Investment Conditions in European Countries in 2016 Ref C16-IRB-29-03 24 January 2017
bull CEER Report on Investment Conditions in European Countries in 2015 Ref C15-IRB-28-03 14 March 2016
bull CEER Memo on regulatory aspects of energy investment conditions in European countries Ref C14-IRB-23-03a 27 April 2015
bull CEER Memo on regulatory aspects of energy investment conditions in European countries Ref C13-IRB-17-03 7 March 2014
bull CEER Memo on regulatory aspects of energy investment conditions in European countries Ref C13-EFB-09-03 4 July 2013
External Documents
bull IRG ndash Regulatory Accounting Principles of Implementation and Best Practice for WACC calculation February 2007
bull S Ross R Westerfield B Jordan Essentials of Corporate Finance IrwinMcGraw-Hill 2016
Ref C20-IRB-54-03
CEER Report on Regulatory Frameworks for European Energy Networks 2020
4156
Table of Contents
1 INTRODUCTION 7
2 COMPACT DESCRIPTION OF THE REGULATORY FRAMEWORK 8
21 Austria 9
22 Belgium 14
23 Croatia 15
24 Czech Republic 20
25 Denmark 24
26 Estonia 28
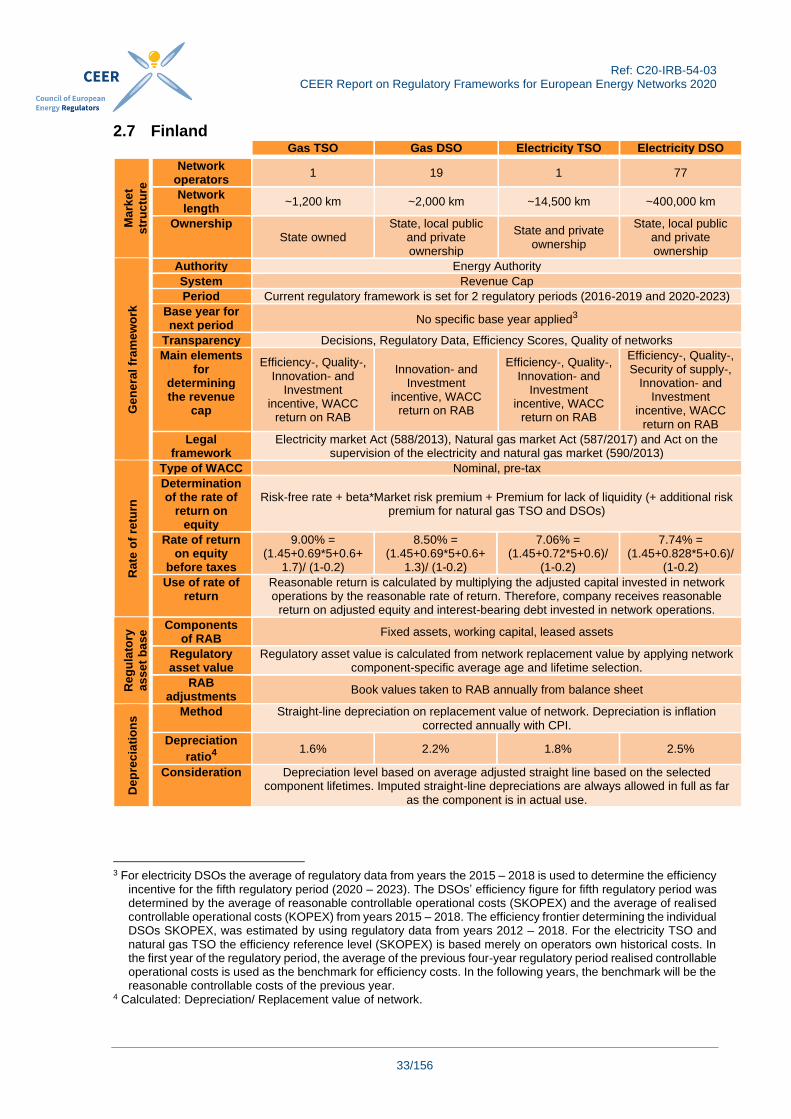
27 Finland 33
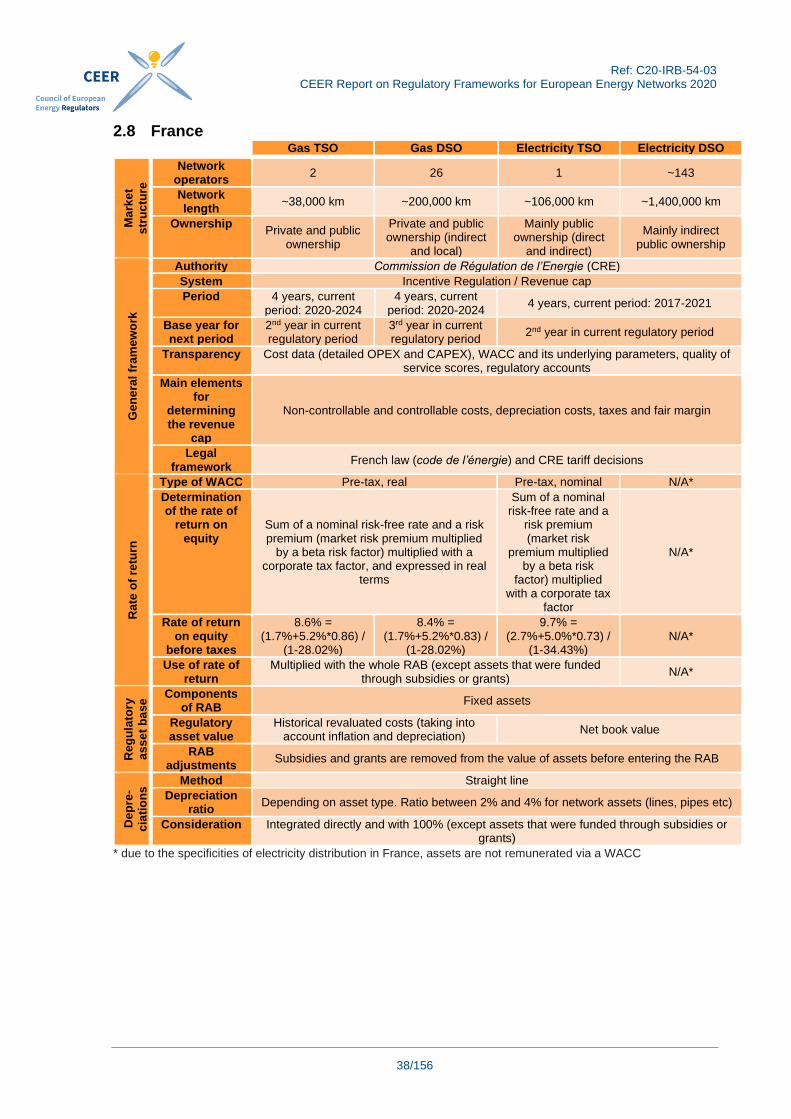
28 France 38
29 Germany 41
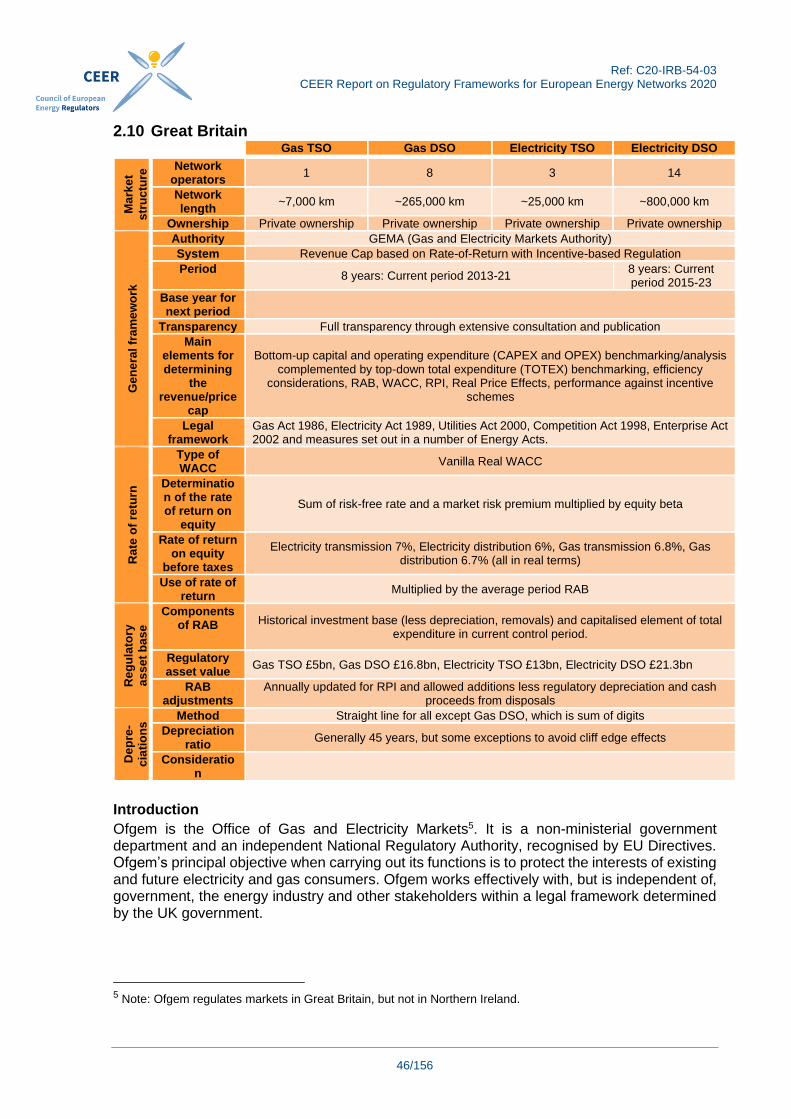
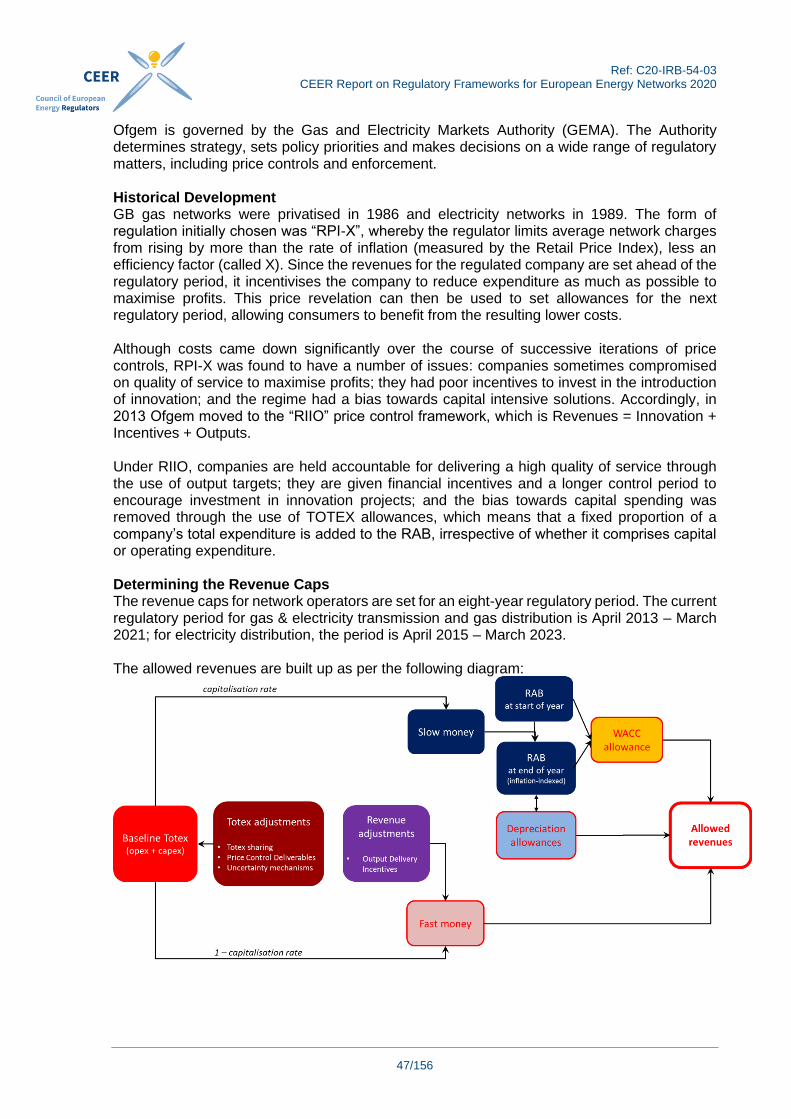
210 Great Britain 46
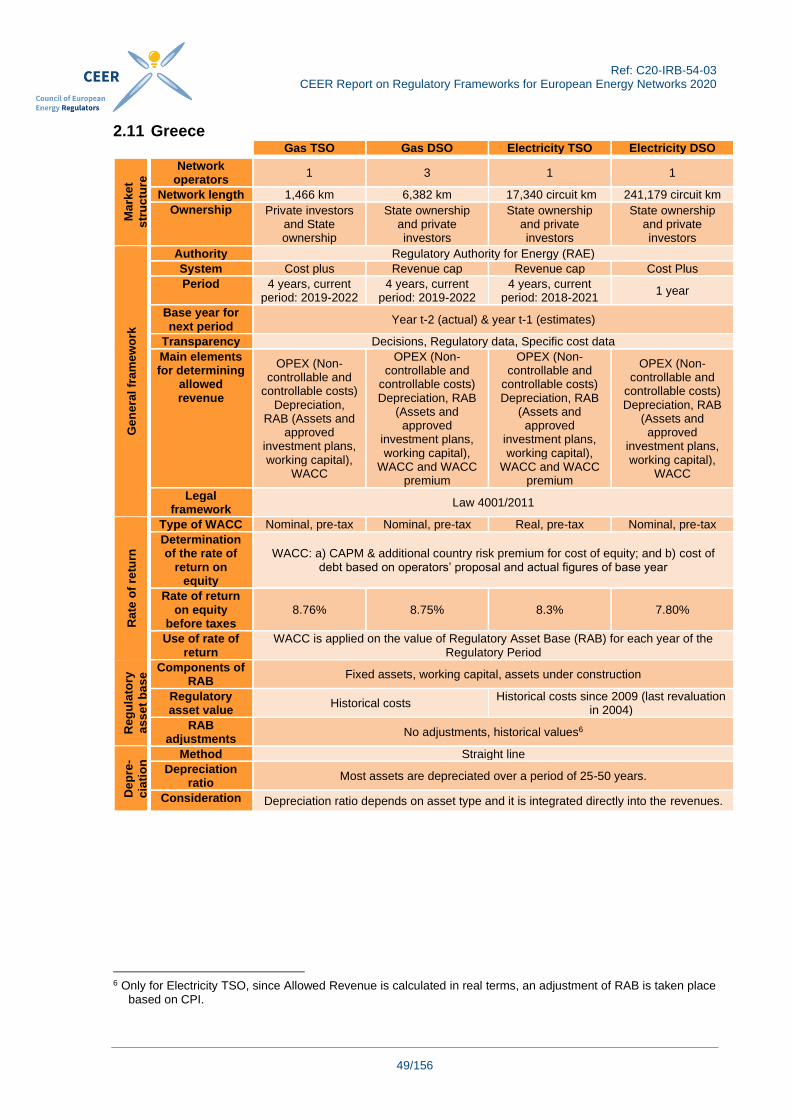
211 Greece 49
212 Hungary 54
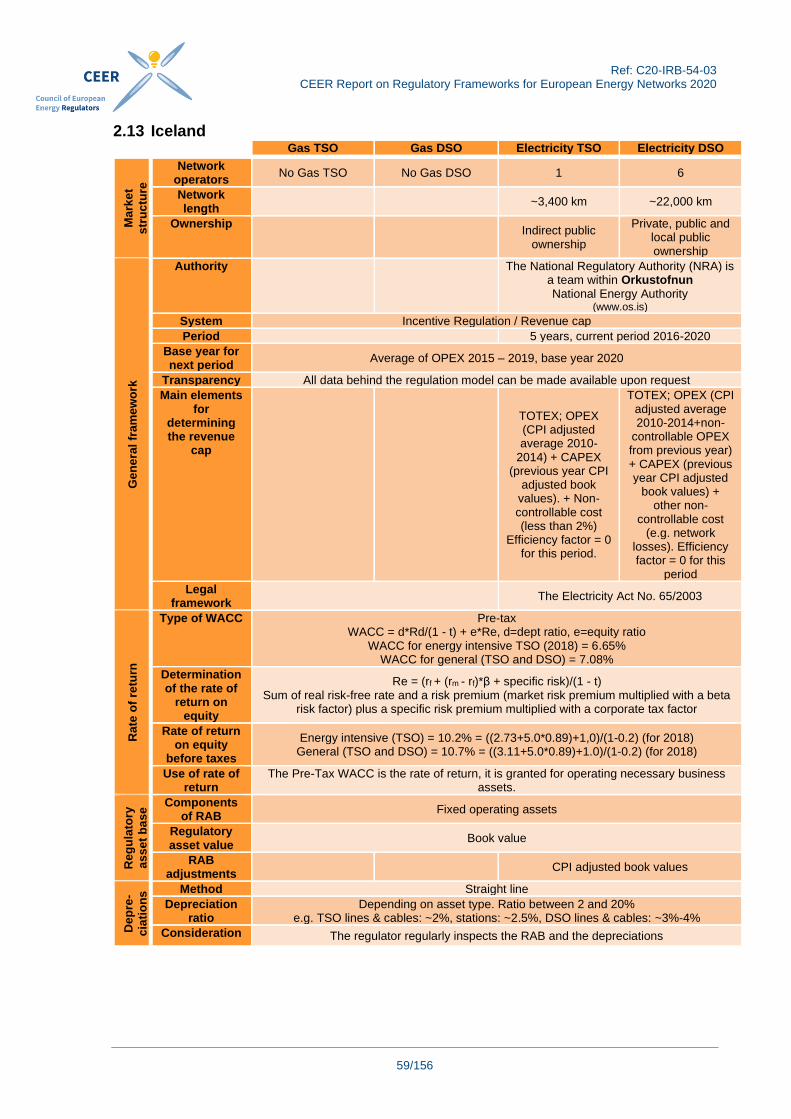
213 Iceland 59
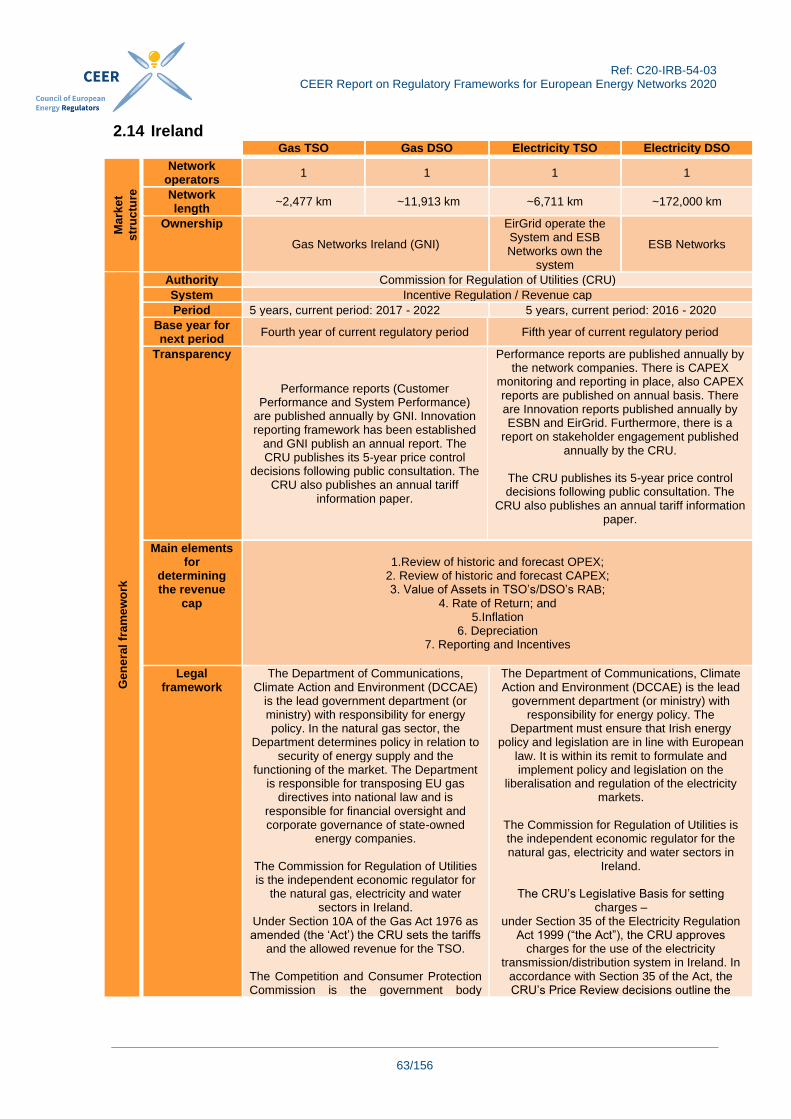
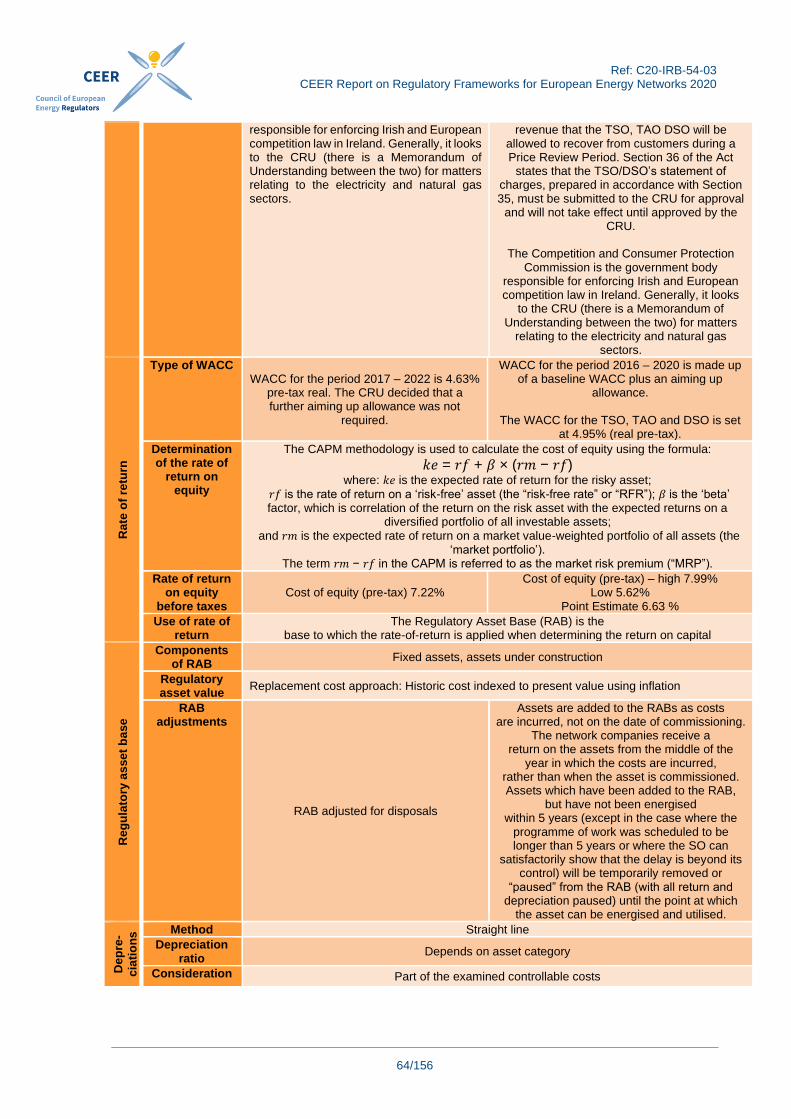
214 Ireland 63
215 Italy 68
216 Latvia 70
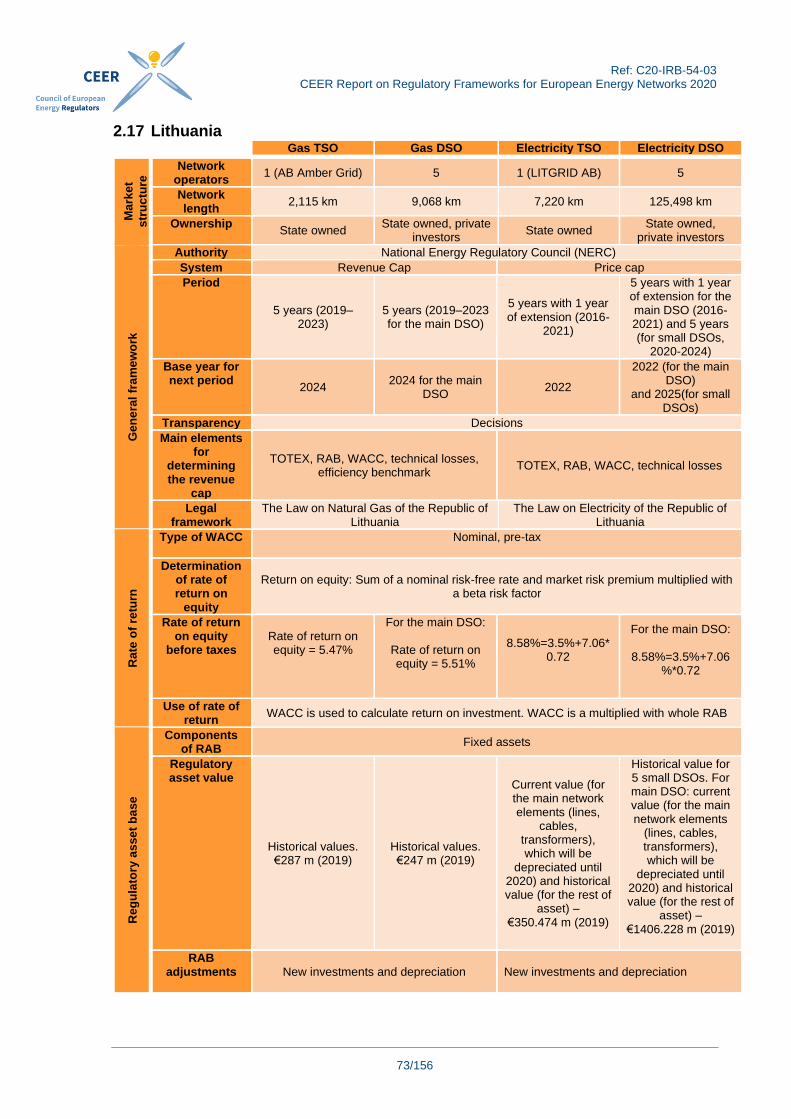
217 Lithuania 73
218 Luxembourg 77
219 Netherlands 81
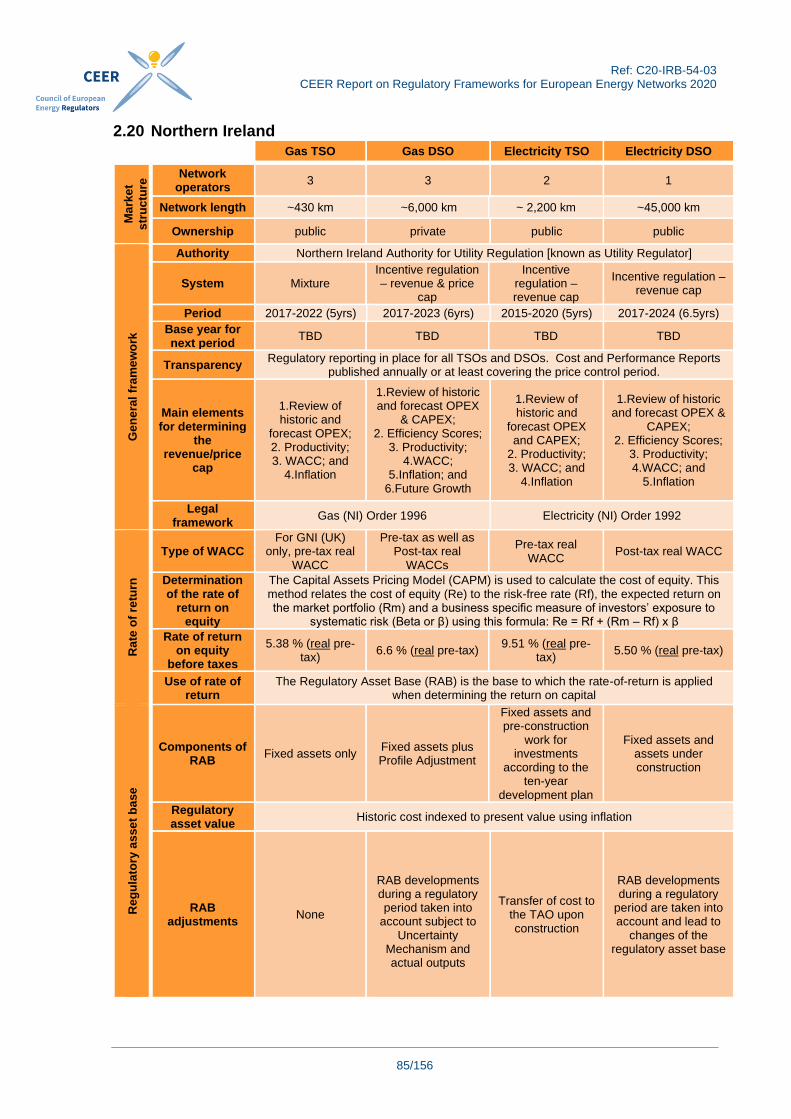
220 Northern Ireland 85
221 Norway 90
222 Poland 95
223 Portugal 100
224 Romania 105
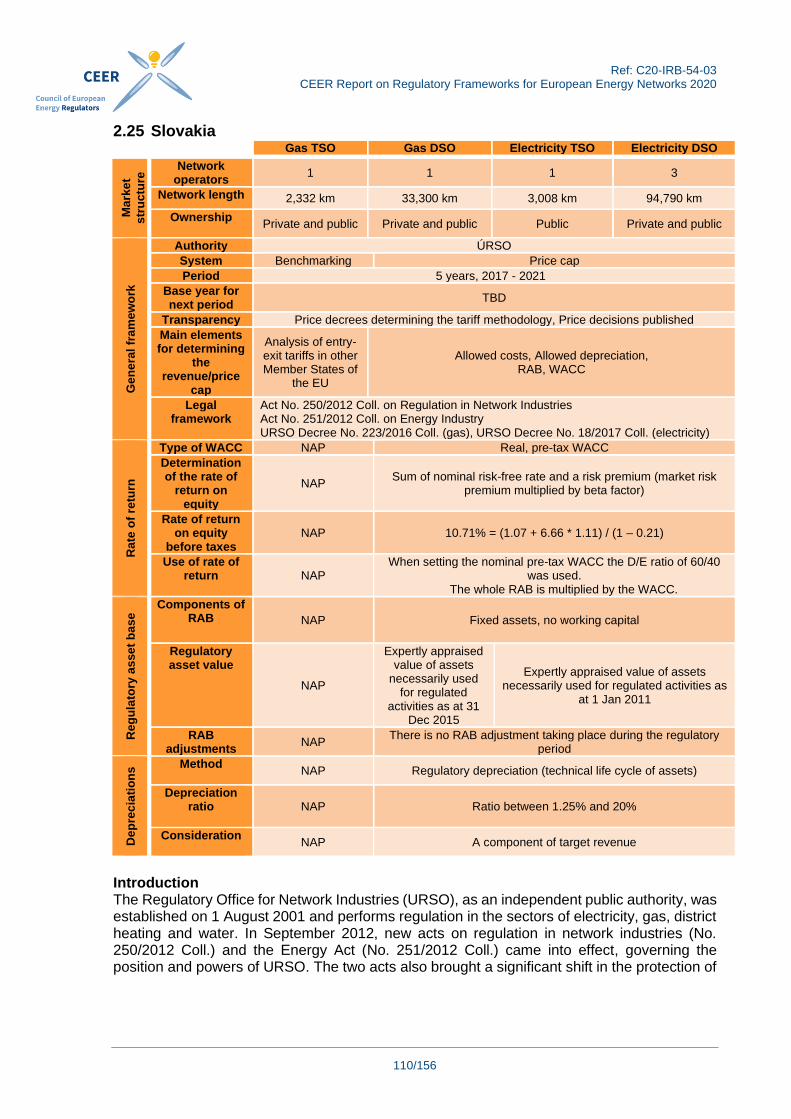
225 Slovakia 110
226 Slovenia 114
227 Spain 118
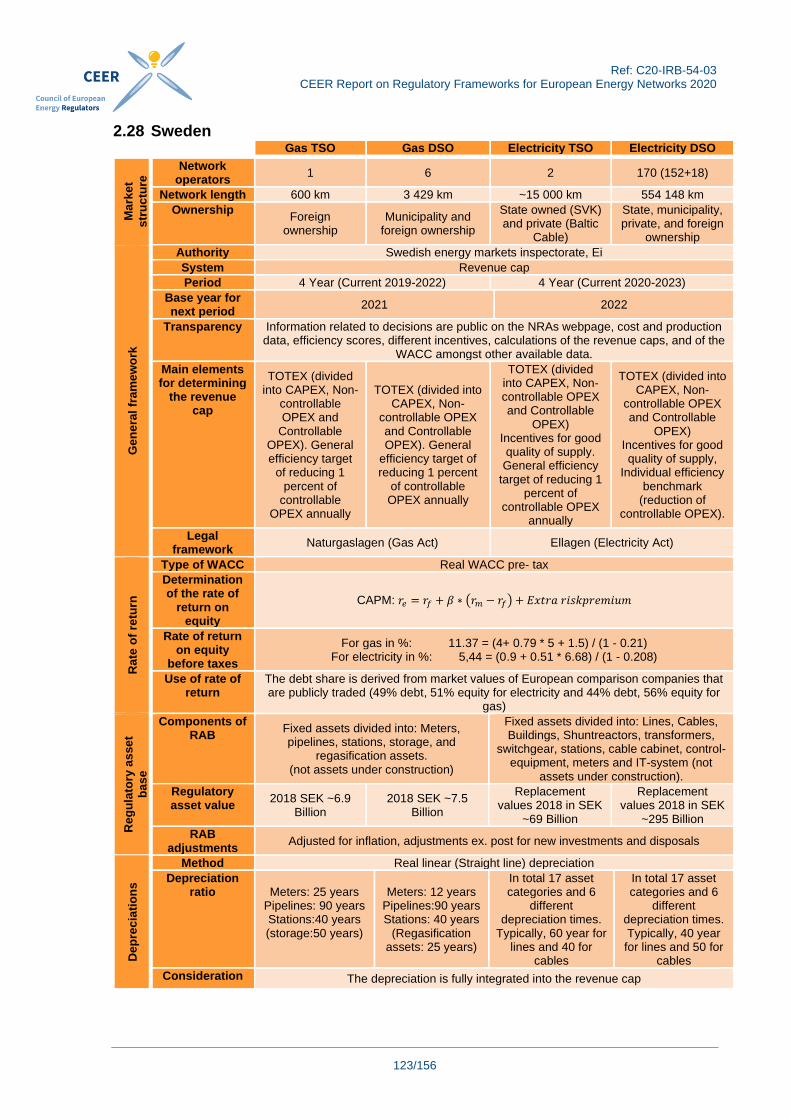
228 Sweden 123
3 ECONOMIC THEORY AND THE REGULATORY SYSTEM 128
31 Regulatory System in Place 128
Ref C20-IRB-54-03
CEER Report on Regulatory Frameworks for European Energy Networks 2020
5156
32 Efficiency Requirements 129
33 General Overview of System Operators 129
331 Regulatory System in Place and Efficiency Requirements 129
332 Operational Expenses (OPEX) 129
333 Capital Expenses (CAPEX) 129
334 Incentives and Penalties 130
335 Tariffs 130
336 Allowed Revenue 130
4 CALCULATION OF THE RATE OF RETURN 131
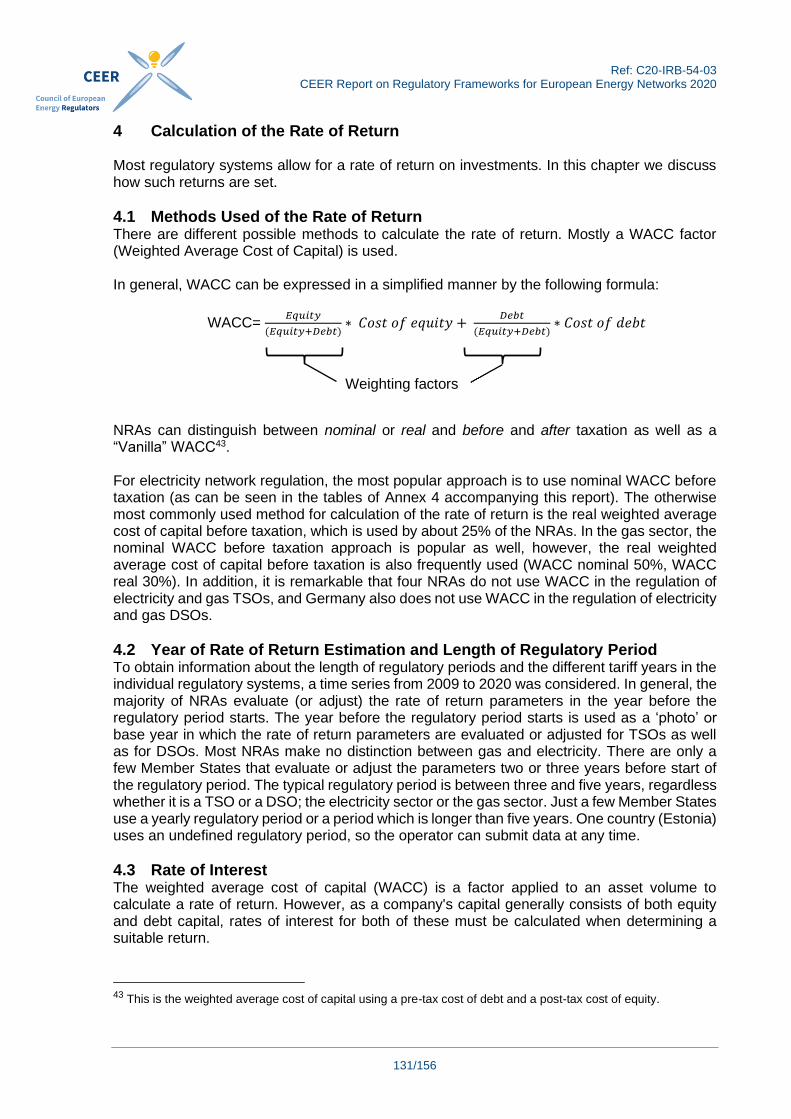
41 Methods Used of the Rate of Return 131
42 Year of Rate of Return Estimation and Length of Regulatory Period 131
43 Rate of Interest 131
431 Risk-free Rate 132
432 Debt Premiums 133
433 Market Risk Premiums 133
434 Capital Gearing 134
435 Taxes 134
436 Beta 134
5 REGULATORY ASSET BASE 136
51 Components of the RAB 136
511 Tariff Calculation 136
512 Fixed Assets 136
513 Working Capital 136
514 Assets Under Construction 137
515 Contribution from Third Parties 137
516 Leased Assets 138
52 Determination of Initial Regulatory Asset Value 138
521 Historical Costs 138
522 Re-evaluation of Assets 138
523 Mix of Historical and Re-evaluated Assets 139
53 Difference Between the RAB Defined on the Net Book Values and the RAB Based on Re-evaluated Asset Base 139
54 Monetary Value of Regulated Assets on Historical Cost Basis and Monetary Value of Re-evaluated Regulated Assets 140
55 RAB Adjustments 140
56 RAB Conclusions 140
6 DEPRECIATIONS 141
61 Overview 141
Ref C20-IRB-54-03
CEER Report on Regulatory Frameworks for European Energy Networks 2020
6156
7 INCENTIVES AND IMPROVEMENTS 142
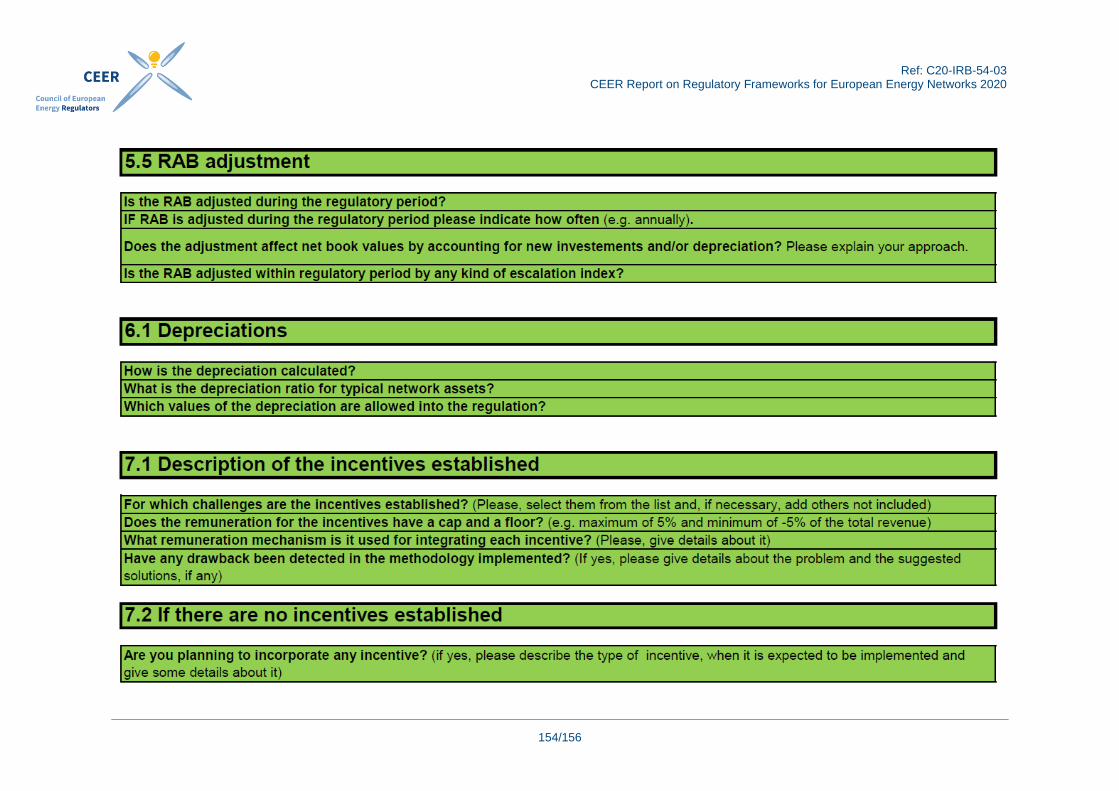
71 Description of the Incentives Established 142
72 If There are no Incentives Established 143
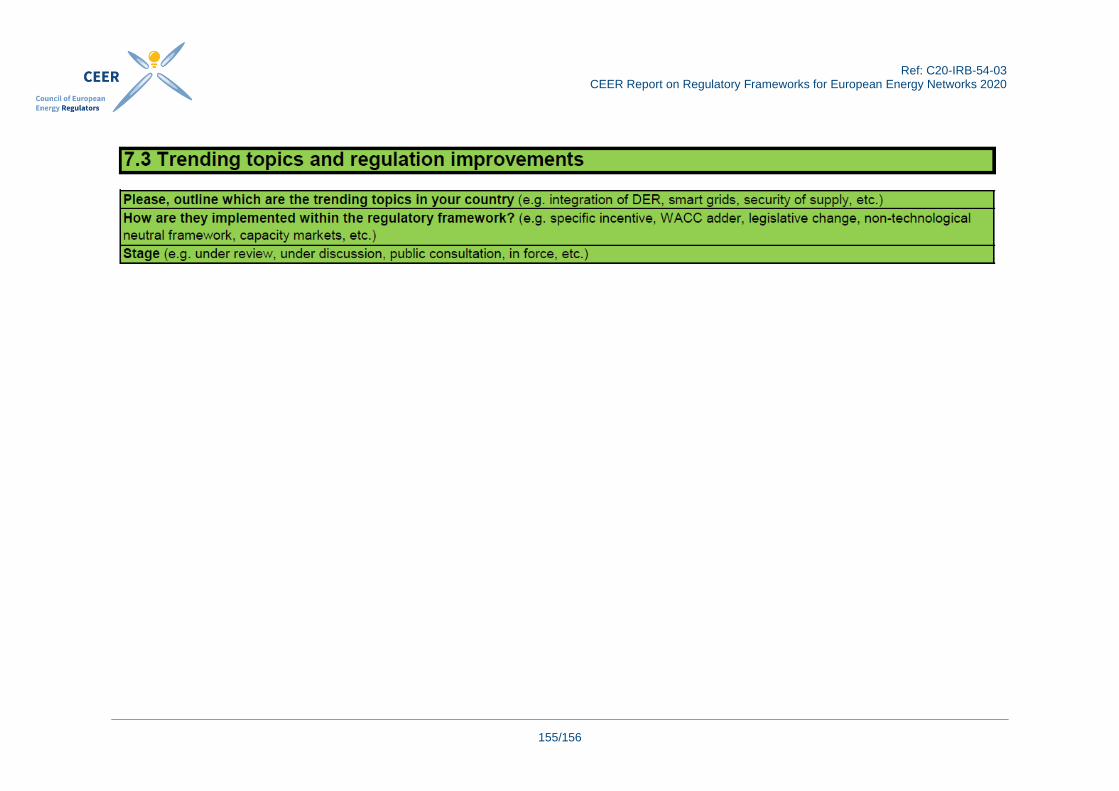
73 Trending Topics and Regulatory Improvements 143
8 CONCLUSIONS 144
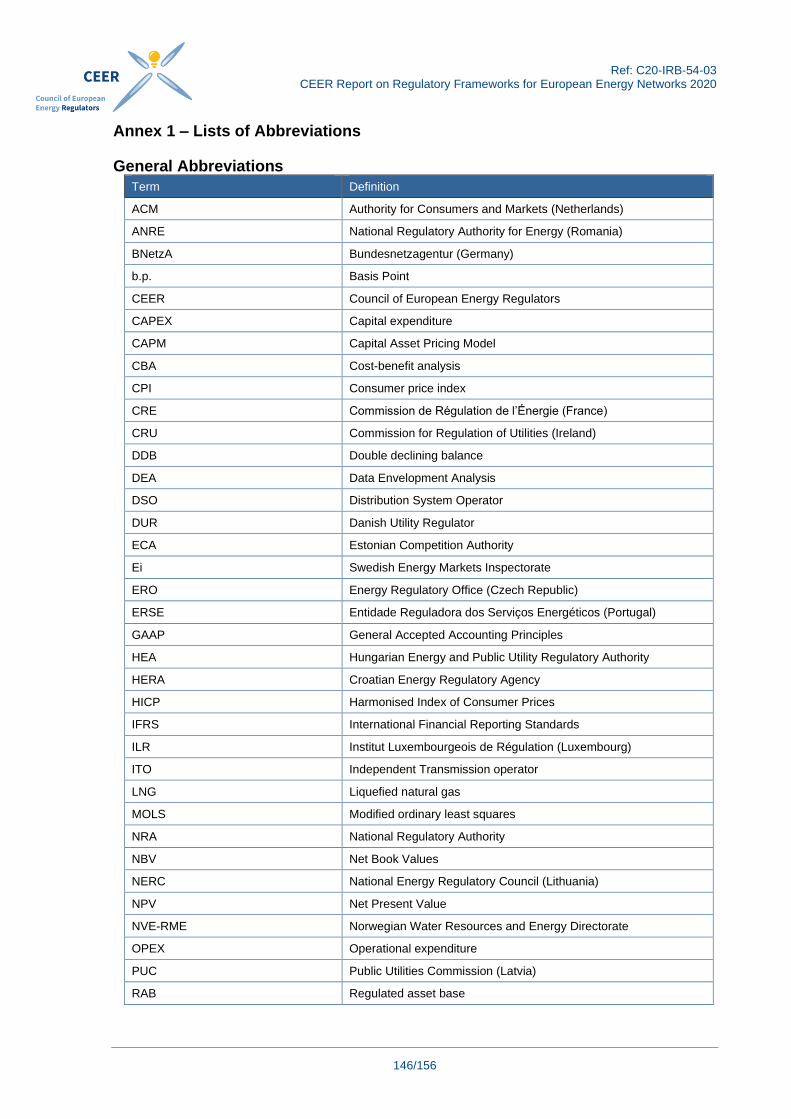
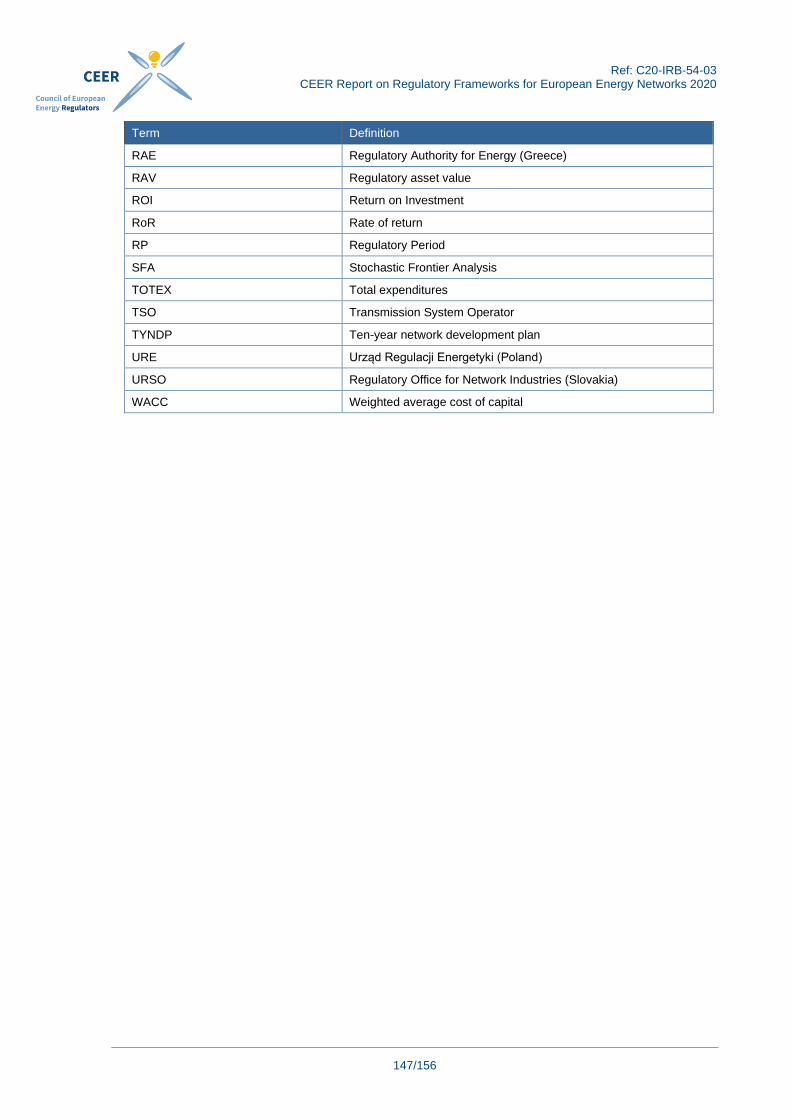
ANNEX 1 ndash LISTS OF ABBREVIATIONS 146
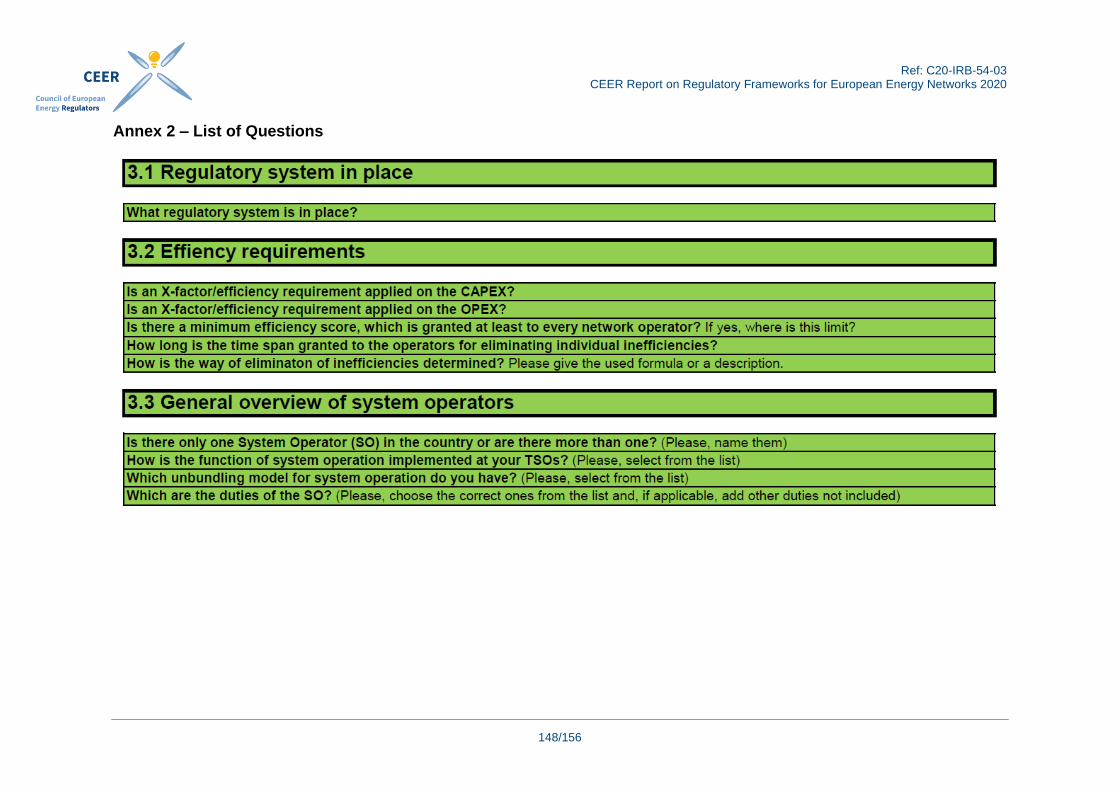
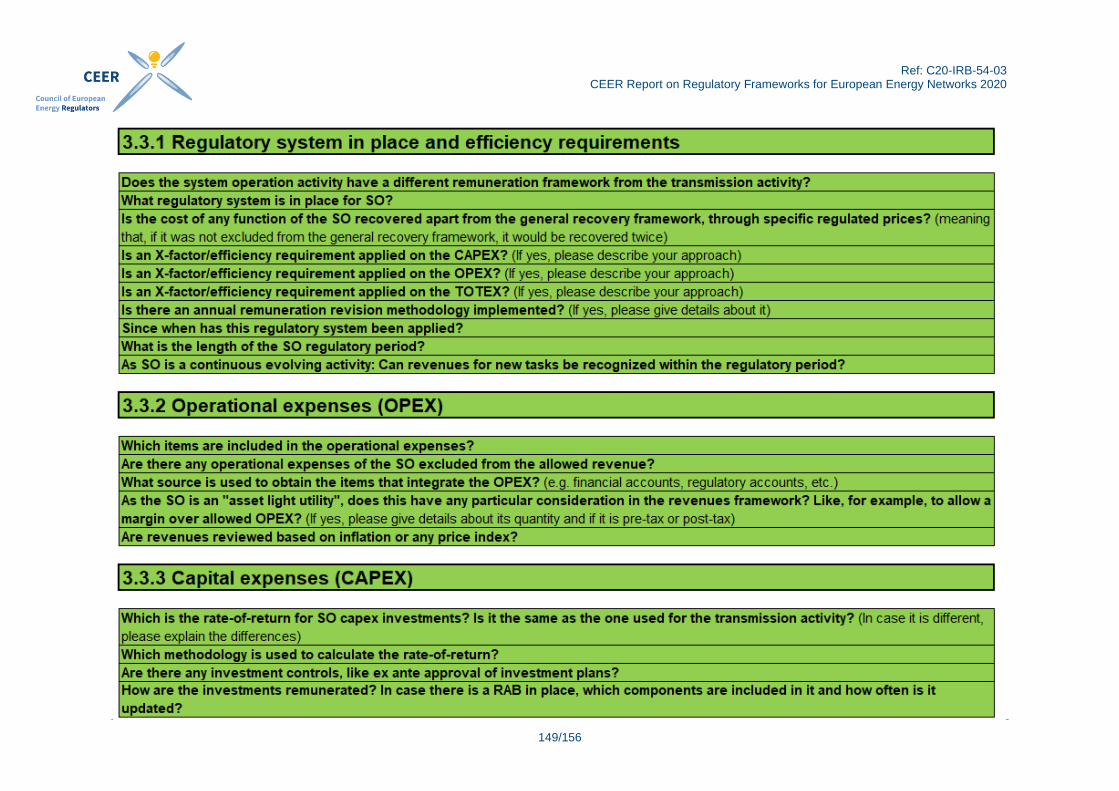
ANNEX 2 ndash LIST OF QUESTIONS 148
ANNEX 3 ndash ABOUT CEER 156 ANNEX 4 ndash COLLECTED amp FILLED OUT TABLEShelliphelliphelliphelliphelliphelliphelliphelliphelliphelliphelliphelliphelliphellipSeparate files ANNEX 5 ndash CASE STUDIEShelliphelliphelliphelliphelliphelliphelliphelliphelliphelliphelliphelliphelliphelliphelliphelliphelliphelliphelliphelliphelliphelliphelliphelliphellipSeparate file
Ref C20-IRB-54-03
CEER Report on Regulatory Frameworks for European Energy Networks 2020
7156
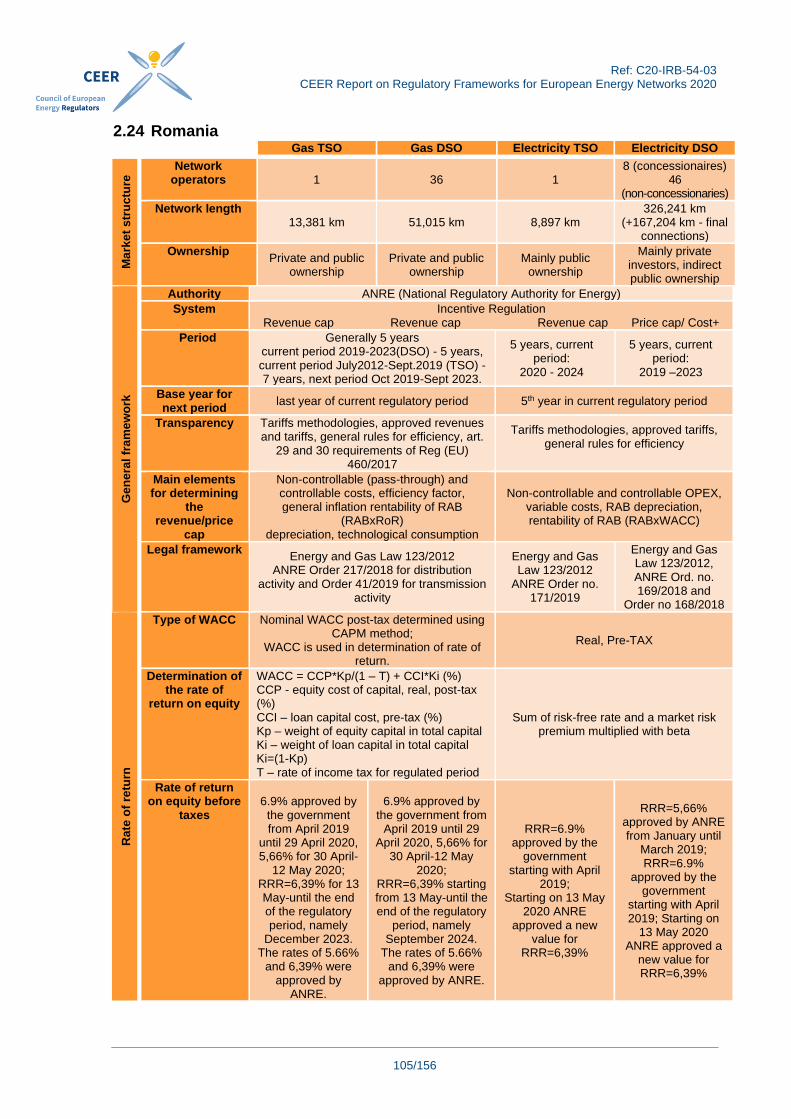
1 Introduction This report is the 2020 version of a series of annual reports drafted and issued by the Council of European Energy Regulators (CEER) It provides a general overview of the regulatory systems for electricity and gas networks in most EU Member States Great Britain Northern Ireland Iceland and Norway in 2020 A major focus is placed on the calculation of a classic and adequate rate of return the determination of the regulatory asset base (RAB) and the depreciation of assets in the different regulatory regimes Other factors may also influence the work of the regulated network operators or the decisions of investors including for example the time required for permitting processes or the overall stability of the implemented regime However these equally important aspects go beyond the scope of this report and are therefore not covered in this analysis In respect to this the reader should be aware that the parameters presented in this study must be interpreted in the context of a whole country-specific regulatory regime CEER considers that in a system with a mature regulatory framework the regulatory review will generally be a package of different decisions which need to form a coherent whole As tariff regulation schemes are highly complex a direct comparison of certain parameters such as capital costs is difficult and should only be done in the context of the whole regulatory system CEER addressed this challenge by undertaking a survey among CEER Members which focused on the main elements for determining allowed revenues This data was then subject to a basic comparison and a number of conclusions were drawn This report includes data submitted by the National Regulatory Authorities (NRAs) of Austria Belgium Croatia Czech Republic Denmark Estonia Finland France Germany Great Britain Greece Hungary Iceland Ireland Italy Latvia Lithuania Luxembourg Netherlands Northern Ireland Norway Poland Portugal Romania Slovakia Slovenia Spain and Sweden (27 countries) The data collection covering the current regulatory regimes in 2020 took place in the first half of 2020 In comparison to the previous report no major changes were found in respect of the most important parameters The tables of chapter 3 and 7 used for the queries have been modified slightly for better clarity and understanding In addition to the second chapter two more countries took the opportunity of authoring a national case study which describes their regulatory regime in a more detailed manner with tables and calculation examples (Annex 4)1 For further details regarding differences or developments one can consult last yearrsquos report
1 Annex 4 is uploaded as a separate document on the same webpage of CEER as this report
Ref C20-IRB-54-03
CEER Report on Regulatory Frameworks for European Energy Networks 2020
8156
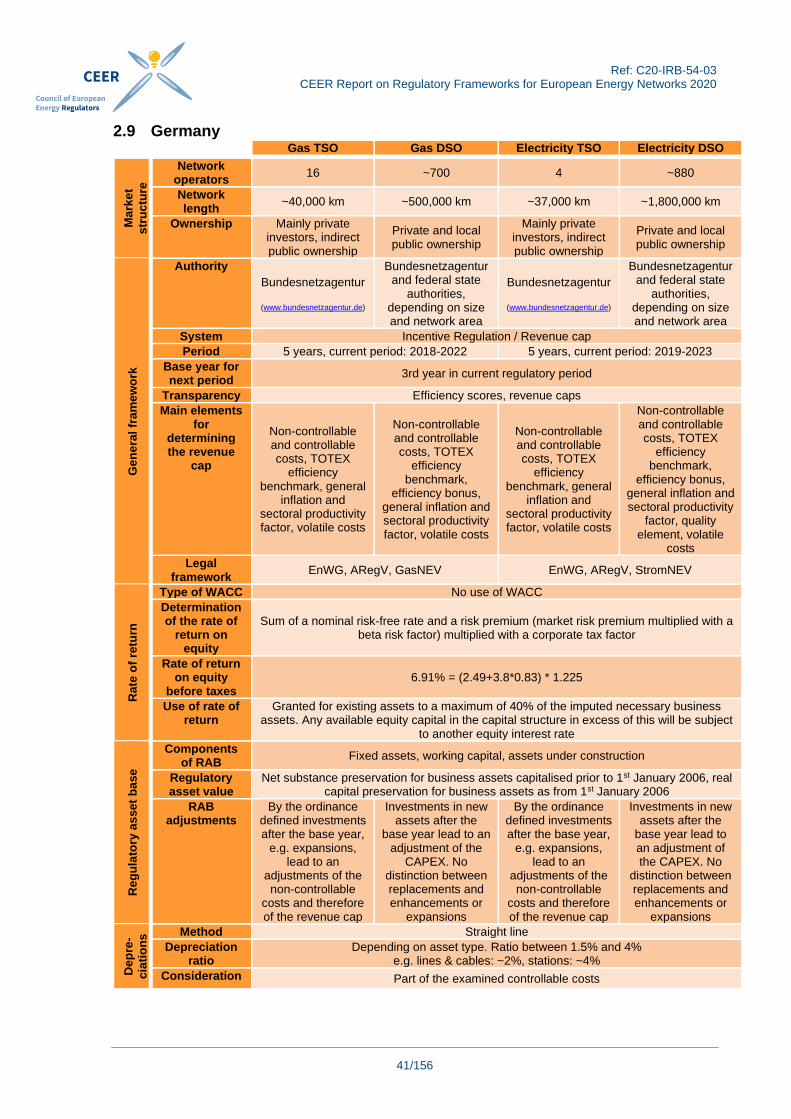
2 Compact Description of the Regulatory Framework There is some variation in the number size and structure of electricity and gas network operators across European countries partly because of how individual European countries have developed in the past However network operators are universally regarded as natural monopolies requiring regulation by NRAs As each country decides on the type and structure of its regulatory system it is not appropriate to compare individual systems directly Examining the different systems does however make it possible to identify similarities between them No one system is unique Rather each system makes use of a toolbox of regulatory instruments reflecting the current state of thinking about regulation in a country It is often the case that several regulatory systems employ the same tools or combinations of them However such tools are used in accordance with their suitability in the national context This chapter describes most European regulatory systems The subsections describe the regulatory framework per country without going into great detail Any questions regarding specific features should be directed to the individual NRA that provided the description This chapter is intended to provide assistance to both NRAs and potential investors It may provide supporting materialuseful background information in the event of a possible change in the national regulatory system or if key data from other regulated countries are compared In addition it gives investors an overview of the prevailing returns and terms for planned investments Each national description includes a fact sheet listing the key regulations and figures that provides an overview
Ref C20-IRB-54-03
CEER Report on Regulatory Frameworks for European Energy Networks 2020
9156
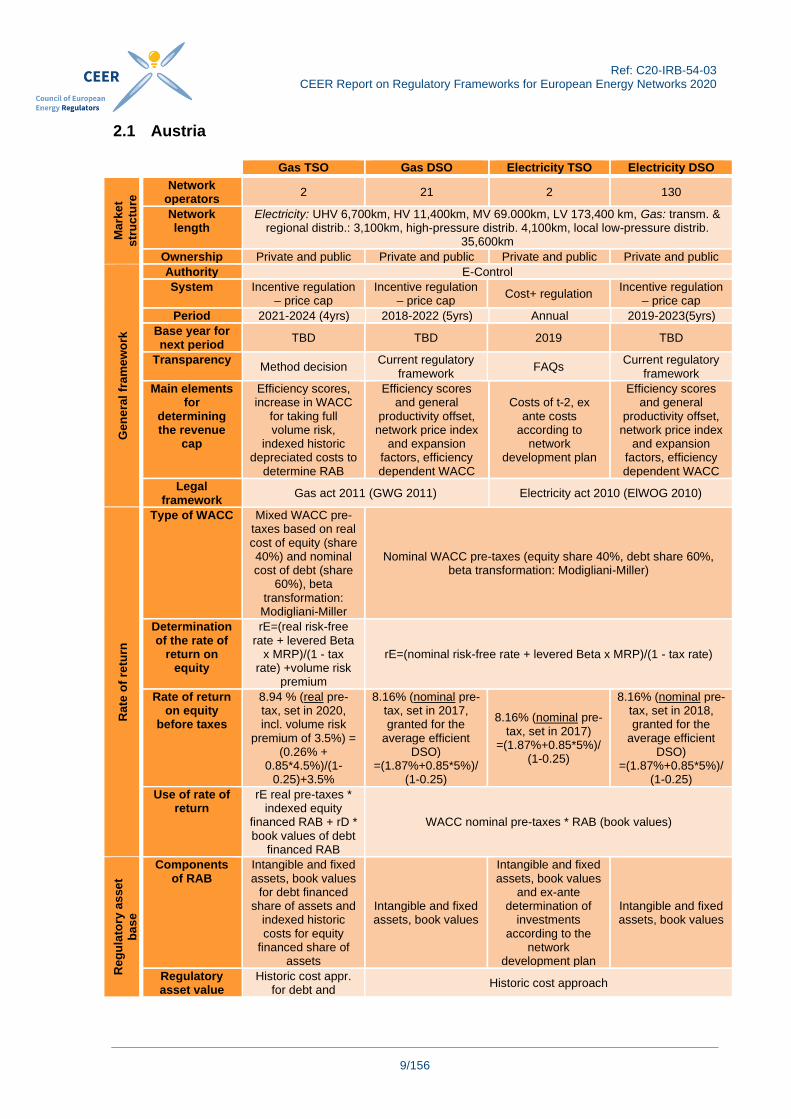
21 Austria
Gas TSO Gas DSO Electricity TSO Electricity DSO
Ma
rke
t
str
uc
ture
Network operators
2 21 2 130
Network length
Electricity UHV 6700km HV 11400km MV 69000km LV 173400 km Gas transm amp regional distrib 3100km high-pressure distrib 4100km local low-pressure distrib
35600km
Ownership Private and public Private and public Private and public Private and public
Ge
ne
ral
fra
me
wo
rk
Authority E-Control
System Incentive regulation ndash price cap
Incentive regulation ndash price cap
Cost+ regulation Incentive regulation
ndash price cap
Period 2021-2024 (4yrs) 2018-2022 (5yrs) Annual 2019-2023(5yrs)
Base year for next period
TBD TBD 2019 TBD
Transparency Method decision
Current regulatory framework
FAQs Current regulatory
framework
Main elements for
determining the revenue
cap
Efficiency scores increase in WACC
for taking full volume risk
indexed historic depreciated costs to
determine RAB
Efficiency scores and general
productivity offset network price index
and expansion factors efficiency dependent WACC
Costs of t-2 ex ante costs
according to network
development plan
Efficiency scores and general
productivity offset network price index
and expansion factors efficiency dependent WACC
Legal framework
Gas act 2011 (GWG 2011) Electricity act 2010 (ElWOG 2010)
Rate
of
retu
rn
Type of WACC Mixed WACC pre-taxes based on real cost of equity (share 40) and nominal cost of debt (share
60) beta transformation Modigliani-Miller
Nominal WACC pre-taxes (equity share 40 debt share 60 beta transformation Modigliani-Miller)
Determination of the rate of
return on equity
rE=(real risk-free rate + levered Beta
x MRP)(1 - tax rate) +volume risk
premium
rE=(nominal risk-free rate + levered Beta x MRP)(1 - tax rate)
Rate of return on equity
before taxes
894 (real pre-tax set in 2020 incl volume risk
premium of 35) = (026 +
08545)(1-025)+35
816 (nominal pre-tax set in 2017 granted for the
average efficient DSO)
=(187+0855)(1-025)
816 (nominal pre-tax set in 2017)
=(187+0855)(1-025)
816 (nominal pre-tax set in 2018 granted for the
average efficient DSO)
=(187+0855)(1-025)
Use of rate of return
rE real pre-taxes indexed equity
financed RAB + rD book values of debt
financed RAB
WACC nominal pre-taxes RAB (book values)
Reg
ula
tory
as
se
t
ba
se
Components of RAB
Intangible and fixed assets book values
for debt financed share of assets and
indexed historic costs for equity
financed share of assets
Intangible and fixed assets book values
Intangible and fixed assets book values
and ex-ante determination of
investments according to the
network development plan
Intangible and fixed assets book values
Regulatory asset value
Historic cost appr for debt and
Historic cost approach
Ref C20-IRB-54-03
CEER Report on Regulatory Frameworks for European Energy Networks 2020
10156
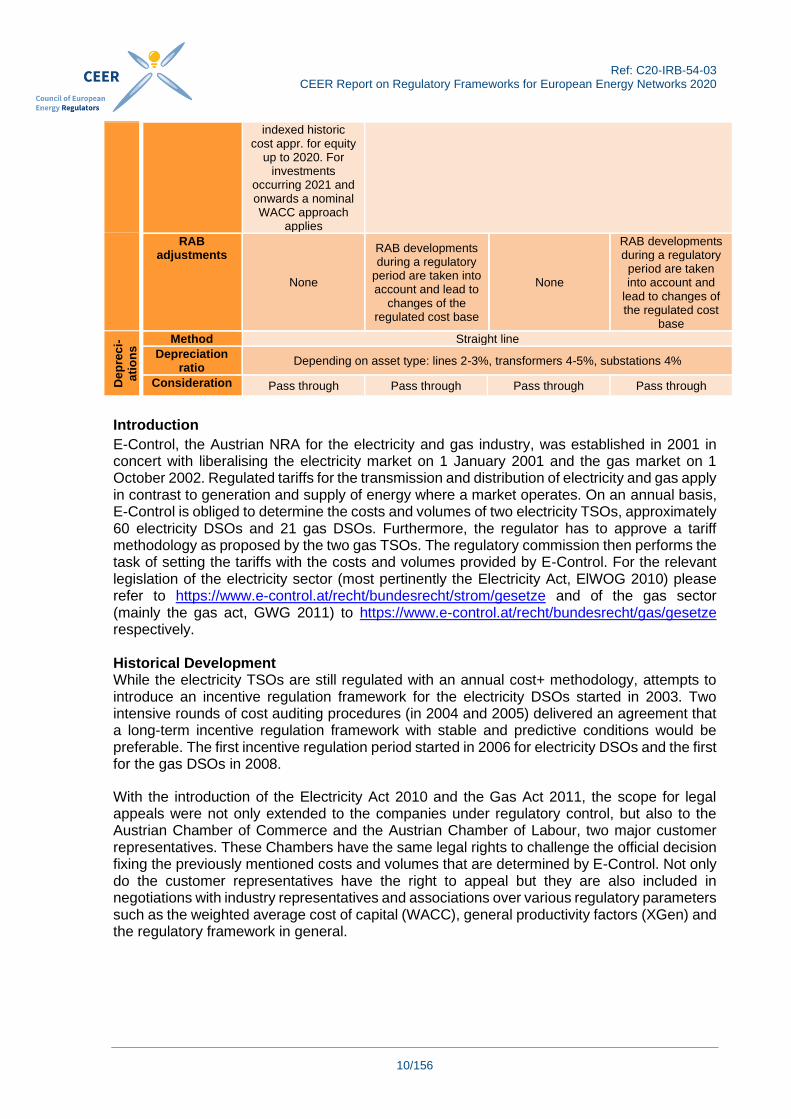
Introduction
E-Control the Austrian NRA for the electricity and gas industry was established in 2001 in concert with liberalising the electricity market on 1 January 2001 and the gas market on 1 October 2002 Regulated tariffs for the transmission and distribution of electricity and gas apply in contrast to generation and supply of energy where a market operates On an annual basis E-Control is obliged to determine the costs and volumes of two electricity TSOs approximately 60 electricity DSOs and 21 gas DSOs Furthermore the regulator has to approve a tariff methodology as proposed by the two gas TSOs The regulatory commission then performs the task of setting the tariffs with the costs and volumes provided by E-Control For the relevant legislation of the electricity sector (most pertinently the Electricity Act ElWOG 2010) please refer to httpswwwe-controlatrechtbundesrechtstromgesetze and of the gas sector (mainly the gas act GWG 2011) to httpswwwe-controlatrechtbundesrechtgasgesetze respectively Historical Development While the electricity TSOs are still regulated with an annual cost+ methodology attempts to introduce an incentive regulation framework for the electricity DSOs started in 2003 Two intensive rounds of cost auditing procedures (in 2004 and 2005) delivered an agreement that a long-term incentive regulation framework with stable and predictive conditions would be preferable The first incentive regulation period started in 2006 for electricity DSOs and the first for the gas DSOs in 2008
With the introduction of the Electricity Act 2010 and the Gas Act 2011 the scope for legal appeals were not only extended to the companies under regulatory control but also to the Austrian Chamber of Commerce and the Austrian Chamber of Labour two major customer representatives These Chambers have the same legal rights to challenge the official decision fixing the previously mentioned costs and volumes that are determined by E-Control Not only do the customer representatives have the right to appeal but they are also included in negotiations with industry representatives and associations over various regulatory parameters such as the weighted average cost of capital (WACC) general productivity factors (XGen) and the regulatory framework in general
indexed historic cost appr for equity
up to 2020 For investments
occurring 2021 and onwards a nominal WACC approach
applies
RAB adjustments
None
RAB developments during a regulatory
period are taken into account and lead to
changes of the regulated cost base
None
RAB developments during a regulatory period are taken into account and
lead to changes of the regulated cost
base
De
pre
ci-
ati
on
s Method Straight line
Depreciation ratio
Depending on asset type lines 2-3 transformers 4-5 substations 4
Consideration Pass through Pass through Pass through Pass through
Ref C20-IRB-54-03
CEER Report on Regulatory Frameworks for European Energy Networks 2020
11156
Current Regulatory Frameworks Electricity Transmission The two Austrian electricity TSOs are regulated with an annual cost+ methodology Those costs and volumes are audited on an annual basis on the least available costs in t-2 (historical values) to the year (t) where the tariffs are in force This general framework to rely on historical values is abrogated for investments according to the ten-year network plan which is subject to approval by E-Control Capital costs are recognised ex-ante in line with paragraph 38(4) of ElWOG 2010 In order to overcome the t-2 delay the approved historic controllable costs are adjusted with a network price index and an individual efficiency offset besides a general efficiency requirement to current costs Non-controllable costs consist of ancillary services secondary control network losses and costs due to network expansion within the ten-year network plan among others where no efficiency requirements are applied in line with paragraph 59(6) of ElWOG 2010 The individual efficiency factor stems either from CEERrsquos international E3Grid Benchmarking procedure (if the TSO participated) or from other sources that are appropriate (eg the efficiency outcome of the distribution grid) Additional elements included into the cost+ framework permit the companies to earn a bonus if ex-ante set targets on various market relevant duties (eg facilitation of competition in reserve markets) are met The regulatory account ensures that the company bears no volume risk at all Differences resulting from deviations between planned (t-2) volumes and actual volumes are considered when setting new tariffs in the following years An adder is granted to the nominal weighted average cost of capital (WACC) to promote and facilitate investments Although both electricity TSOs are cost+ regulated annually the WACC and its adder are granted for a time-span in line with the 3rd regulatory period for gas DSOs (ie 2018-2022) Gas Transmission In contrast to both the electricity and the gas distribution sectors E-Control is not obliged to approve the costs and volumes on an annual basis E-Control approves a tariff methodology which is submitted by the TSOs as a proposal After approval the NRA sets costs and volumes according to these principles for the whole duration of a regulatory period of four years The tariffs are set for this period and do not change within the period
The regulatory framework for gas transmission is quite different from the other sectors as it consists of a forward-looking tariff methodology It applies to the regulatory period of 2021-2024 The regulatory asset value (RAV) is split into debt and equity financed shares and consists of book values for the former and current indexed values for the latter This differentiation is applied to all assets commissioned prior to 2021 Due to this procedure the debt finance share of the RAV is remunerated with a nominal rate of debt (161) and the equity financed RAV with a real rate of equity (544 before taxes excl volume risk premium) For investments occurring in 2021 and onwards a nominal WACC pre-tax of 358 is granted As there is by law no regulatory account (to account for differences in estimated or historical volumes and actual ones) foreseen for the gas TSOs these entities bear the full volume risk in contrast to the three other sectors To compensate these companies for the volume of risk they bear the real rate of equity is lifted by 350 basis points (bp) Forward-looking costs are adjusted with an efficiency factor consisting of an individual and a general component In total the requirement amounts to 15 pa and is the result of negotiations between customer representatives and the TSOs This value is based on a self-assessment by the TSOs Costs for planned investments are considered ex-ante and aligned with actual investments in the next regulatory period
Ref C20-IRB-54-03
CEER Report on Regulatory Frameworks for European Energy Networks 2020
12156
The current methodology for gas TSOs foresees an uplift of the equity return by 150 bp in case of RampD investments (pilot projects) Eligible pilot projects must enhance the efficiency of operation and should bear a positive economic surplus (cost benefit analysis) If external research funds grant a subsidy these grants are not deducted from allowed OPEX A major change from previous methodologies is a now symmetric bonus-malus scheme for operating targets (ie environment and safety for workers minimum quality requirements critical infrastructure protection) A description of the tariff methodology for the period 2021-2024 is published in English at the following link httpswwwe-controlatenmarktteilnehmergasnetzentgeltemethodenbeschreibung Electricity Distribution The current 4th regulatory period for electricity DSOs has been effective since 1 January 2019 and lasts until 31 December 2023 (a five-year period) The regulatory framework was adopted for the 4th regulatory period to be in line with the methodology that was established for the gas distribution sector one year in advance
The TOTEX inflation-adjusted budget constraint with general and individual productivity offsets was replaced by a similar procedure to OPEX and an introduction of an efficiency-adjusted WACC for the cost of capital While depreciation is a pass-through based on a t-2 principle the income of occurred investments is granted The return on these investments is adjusted with the company specific efficiency values taken from a national benchmarking analysis that relies on the two methods MOLS (modified ordinary least squares) and DEA (data envelopment analysis) and varies between a bandwidth of +- 05 around the WACC of 488 for the average efficient DSO A calibration mechanism ensures that the system is cost neutral ie the rewards for above average performance equal the penalties for below average performance The OPEX which is determined for the base year of a regulatory period is adjusted via a network price index (consisting of a consumer price index and a wage index) a general productivity offset (095) and an individual efficiency factor annually The individual efficiency factor is derived from a national relative efficiency estimate (with the benchmarking models based on TOTEX MOLS and DEA across a time span of 75 years (one and a half regulatory periods) in which the inefficiencies have to be removed In the previous period this time span amounted to ten years Investments occurring during the regulatory period are treated as average-efficient until a new benchmarking analysis is performed at the beginning of the next period The capital costs of these investments are considered with a t-2 delay A mark-up on the WACC is also applied to encourage investments Besides the annual treatment of the capital costs an operating cost factor is adjusting the budget during the regulatory period for a change in service provision This change is measured as an annual deviation in line length of high medium and low voltage level as well as metering points to the corresponding values in the base year The deviations (increase or decrease of line lengths and metering points) are multiplied with specific operating cost estimates and increase or decrease the approved budged during the regulatory period The OPEX cost+ mechanism for the smart metering roll-out was replaced for the 4th period with a lump sum remuneration that not only provides an incentive to undercut this granted flat-value but also to decrease the administrative burden for the NRA
Ref C20-IRB-54-03
CEER Report on Regulatory Frameworks for European Energy Networks 2020
13156
A regulatory account further ensures that effects due to the t-2 principle do not translate into windfall profits or losses to the network operators Gas Distribution The current 3rd regulatory period for gas DSOs started on 1 January 2018 and ends on 31 December 2022 (five-year period) and includes major changes when compared to the 2nd regulatory period The TOTEX inflation adjusted budget constraint with general and individual productivity offsets was replaced by a similar procedure to OPEX and an introduction of an efficiency-adjusted WACC for the cost of capital While depreciation is a pass-through based on a t-2 principle the income of occurred investments is granted The return on these investments is adjusted with the company specific efficiency values taken from a national benchmarking analysis that relies on the two methods MOLS and DEA and varies between a bandwidth of +- 05 around the WACC of 488 for the average efficient DSO The initially introduced parameters k1 and k2 ensure a setting where the outcome is not cost-neutral and rewards above-average efficient DSOs This means that a total of five million euros per year for above average performance and -2 million euros per year for below average efficiency Investments occurring during the regulatory period are treated as average-efficient until a new benchmarking analysis is performed at the beginning of the next period The capital costs of these investments are considered with a t-2 delay A mark-up on the WACC is also applied to encourage investments Besides the annual treatment of the capital costs an operating cost factor is adjusting the budget during the regulatory period for a change in service provision This OPEX-factor is similar to the factor for electricity DSOs as mentioned above with two further incentives for DSOs to acquire new customers and to encourage development of the gridrsquos density (providing services to more customers with the existing grid lengths) A regulatory account further ensures that effects due to the t-2 principle do not translate into windfall profits or losses to the network operators Both customer representatives ndash the Austrian Chamber of Commerce and the Austrian Chamber of Labour ndash have appealed against the official decisions (the cost determinations according to the controversial regulatory model) of all gas DSOs In autumn 2019 and spring 2020 around a third of all cases have been settled by the respective DSOs and the customer representatives The settlement consists of an adjustment of k1 and k2 in a cost-neutral manner as well as an increase in the general productivity requirement (slight increase from 067 to 083 pa) Due to the settlement the bandwidth of the efficiency dependent WACC is further narrowed and spans now between 455 for the minimum efficient DSO to 505 for the efficient DSO (with 488 to the average efficient DSO) The remaining cases are still pending at the federal administrative court but are expected to be settled with the same outcome A quality regulation is considered inappropriate as suitable indicators have not been identified yet Despite this minimal quality standards on commercial quality besides norms for product quality are already in effect The description of the 3rd regulatory period for gas DSOs is only available in German and published at the following link httpswwwe-controlatmarktteilnehmergasnetzentgelteentgeltermittlungsverfahren
Ref C20-IRB-54-03
CEER Report on Regulatory Frameworks for European Energy Networks 2020
14156
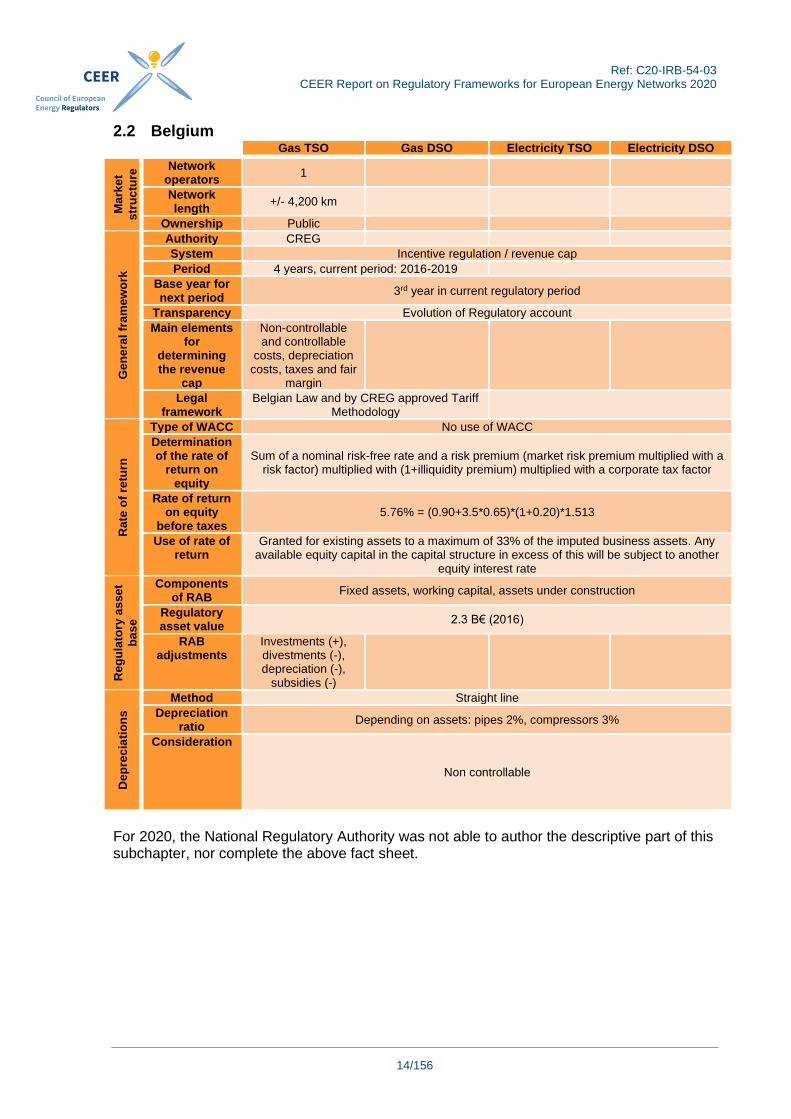
22 Belgium Gas TSO Gas DSO Electricity TSO Electricity DSO
Ma
rke
t
str
uc
ture
Network operators
1
Network length
+- 4200 km
Ownership Public
Ge
ne
ral
fra
me
wo
rk
Authority CREG
System Incentive regulation revenue cap
Period 4 years current period 2016-2019
Base year for next period
3rd year in current regulatory period
Transparency Evolution of Regulatory account
Main elements for
determining the revenue
cap
Non-controllable and controllable
costs depreciation costs taxes and fair
margin
Legal framework
Belgian Law and by CREG approved Tariff Methodology
Rate
of
retu
rn
Type of WACC No use of WACC
Determination of the rate of
return on equity
Sum of a nominal risk-free rate and a risk premium (market risk premium multiplied with a risk factor) multiplied with (1+illiquidity premium) multiplied with a corporate tax factor
Rate of return on equity
before taxes 576 = (090+35065)(1+020)1513
Use of rate of return
Granted for existing assets to a maximum of 33 of the imputed business assets Any available equity capital in the capital structure in excess of this will be subject to another
equity interest rate
Reg
ula
tory
as
se
t
ba
se
Components of RAB
Fixed assets working capital assets under construction
Regulatory asset value
23 Beuro (2016)
RAB adjustments
Investments (+) divestments (-) depreciation (-)
subsidies (-)
Dep
rec
iati
on
s
Method Straight line
Depreciation ratio
Depending on assets pipes 2 compressors 3
Consideration
Non controllable
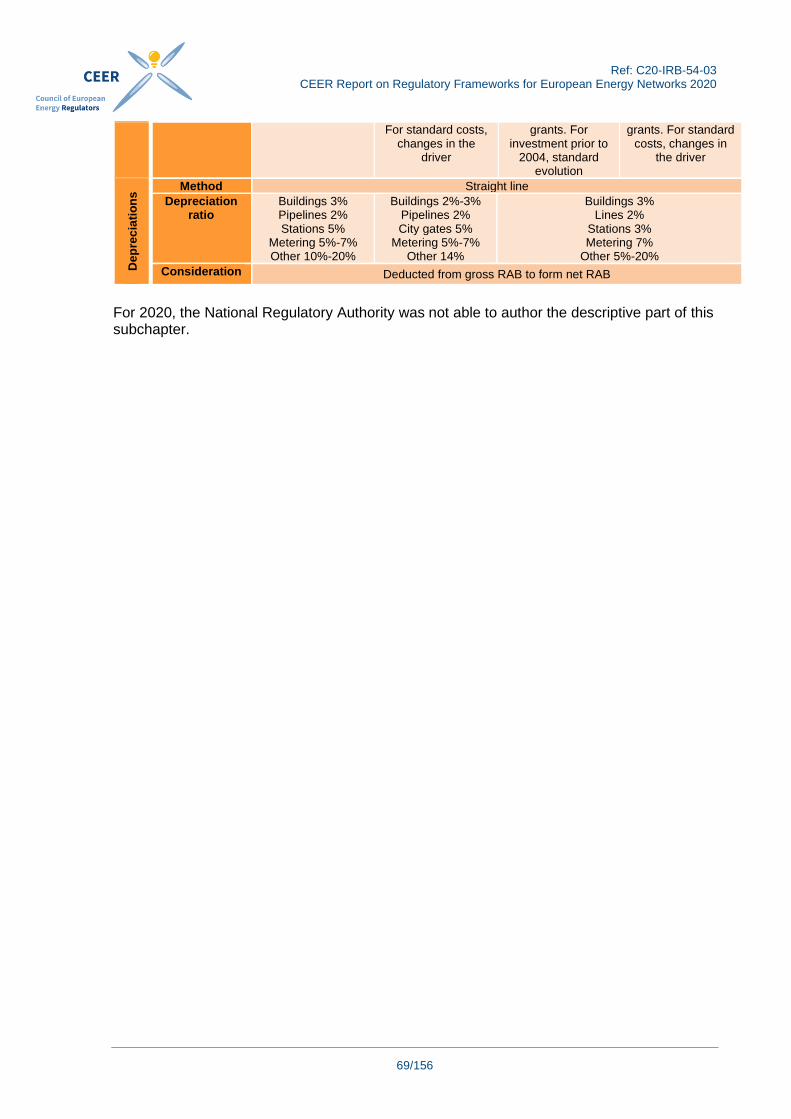
For 2020 the National Regulatory Authority was not able to author the descriptive part of this subchapter nor complete the above fact sheet
Ref C20-IRB-54-03
CEER Report on Regulatory Frameworks for European Energy Networks 2020
15156
23 Croatia Gas TSO Gas DSO Electricity TSO Electricity DSO
Ma
rke
t
str
uc
ture
Network operators
1 35 1 1
Network length
2531 km 19673 km 7758 km 140067 km
Ownership Public ownership
Private and local public ownership
Ge
ne
ral
fram
ew
ork
Authority Croatian Energy Regulatory Agency (HERA)
System Incentive Regulation Revenue cap
Cost plus method (cost of service rate of return)
Period
5 years current regulatory period 2017-2021
Business costs and costs of development are based on business
and development plans prepared adjusted and adopted for every year based on a three-year development
plan with the Agencyrsquos consent
Base year for next period
Base year is 2015 for 2nd regulatory period 2017-2021
Base year is 2019 for regulatory period 2018-2020
Transparency
For gas TSO httpwwwplinacrohrdefaultaspxid=5
92
For gas DSO information about
regulation and prices are published
on HERAs web-site wwwherahr
For Electricity TSO httpswwwhopshr
For Electricity DSO information about regulation and prices are published on HERAs web-
site wwwherahr
Main elements for
determining the revenue
cap OPEX and CAPEX OPEX is projected for regulatory period based on 1+CPI-X formula without ex-post adjustment if realised above but with profit-sharing mechanism if realised OPEX is below projected level Budgeted-planned CAPEX with an ex-post adjustment based on real values (only up to the economically efficient level)
OPEX and CAPEX Operating costs TPpos include the following
bull Costs of network maintenance
bull Costs of loss coverage in the network
bull Costs of gross salaries
bull Other staff costs
bull Other business-related costs
bull Other costs determined by the law
Costs of capital TPkap equal the following
TPkap = PRim + A whereby individual items are the following PRim ndash revenues from regulated
assets (regulated asset base) [kn] and A - Depreciation of the regulated
assets in the considered year [kn]
Legal framework
Methodology for the Determination of the Amount of Tariff Items for Gas Transmission (Official Gazette No 481858187920) Methodology for the Determination of the Amount of Tariff Items for Gas Distribution (Official Gazette No 4818)
Meanings of the expressions used in this Tariff System are determined by the Energy Act (ldquoOfficial Gazetterdquo No 6801 and 17704) the Act on the Electricity Market (ldquoOfficial Gazetterdquo No 17704) the General Conditions of Electricity Supply (ldquoOfficial Gazetterdquo No 1406) and the Grid Code for the Electric Power System (ldquoOfficial gazetterdquo No 3606)
Rate
of
retu
rn Type of WACC Nominal pre-tax WACC WACC before taxation
Determination of the rate of
The rate of return on equity (re) is determined by applying the capital asset pricing model
The rate of return on equity (re) is determined
Re= r
f + (r
m - r
f) middot
Ref C20-IRB-54-03
CEER Report on Regulatory Frameworks for European Energy Networks 2020
16156
return on equity
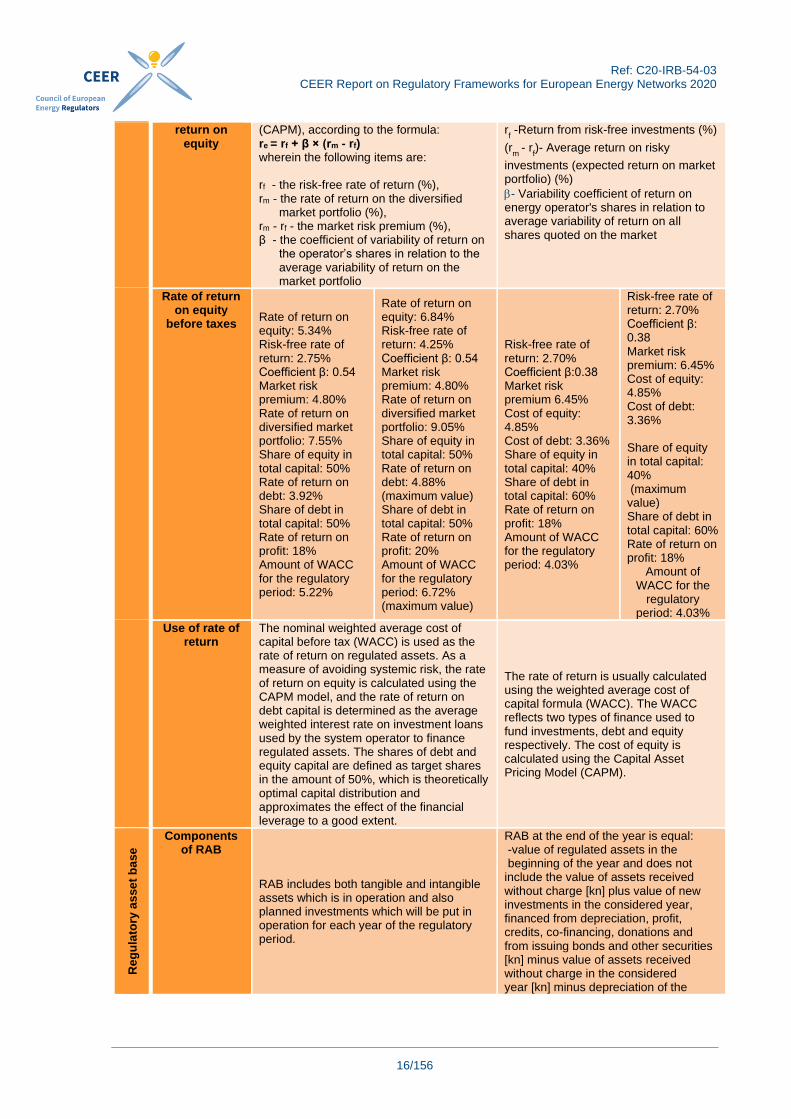
(CAPM) according to the formula re = rf + β times (rm - rf) wherein the following items are rf - the risk-free rate of return () rm - the rate of return on the diversified market portfolio () rm - rf - the market risk premium () β - the coefficient of variability of return on the operatorrsquos shares in relation to the average variability of return on the market portfolio
rf -Return from risk-free investments ()
(rm
- rf)- Average return on risky
investments (expected return on market portfolio) ()
- Variability coefficient of return on energy operators shares in relation to average variability of return on all shares quoted on the market
Rate of return on equity
before taxes Rate of return on equity 534 Risk-free rate of return 275 Coefficient β 054 Market risk premium 480 Rate of return on diversified market portfolio 755 Share of equity in total capital 50 Rate of return on debt 392 Share of debt in total capital 50 Rate of return on profit 18 Amount of WACC for the regulatory period 522
Rate of return on equity 684 Risk-free rate of return 425 Coefficient β 054 Market risk premium 480 Rate of return on diversified market portfolio 905 Share of equity in total capital 50 Rate of return on debt 488 (maximum value) Share of debt in total capital 50 Rate of return on profit 20 Amount of WACC for the regulatory period 672 (maximum value)
Risk-free rate of return 270 Coefficient β038 Market risk premium 645 Cost of equity 485 Cost of debt 336 Share of equity in total capital 40 Share of debt in total capital 60 Rate of return on profit 18 Amount of WACC for the regulatory period 403
Risk-free rate of return 270 Coefficient β 038 Market risk premium 645 Cost of equity 485 Cost of debt 336 Share of equity in total capital 40 (maximum value) Share of debt in total capital 60 Rate of return on profit 18
Amount of WACC for the
regulatory period 403
Use of rate of return
The nominal weighted average cost of capital before tax (WACC) is used as the rate of return on regulated assets As a measure of avoiding systemic risk the rate of return on equity is calculated using the CAPM model and the rate of return on debt capital is determined as the average weighted interest rate on investment loans used by the system operator to finance regulated assets The shares of debt and equity capital are defined as target shares in the amount of 50 which is theoretically optimal capital distribution and approximates the effect of the financial leverage to a good extent
The rate of return is usually calculated using the weighted average cost of capital formula (WACC) The WACC reflects two types of finance used to fund investments debt and equity respectively The cost of equity is calculated using the Capital Asset Pricing Model (CAPM)
Reg
ula
tory
as
se
t b
ase
Components of RAB
RAB includes both tangible and intangible assets which is in operation and also planned investments which will be put in operation for each year of the regulatory period
RAB at the end of the year is equal -value of regulated assets in the beginning of the year and does not include the value of assets received without charge [kn] plus value of new investments in the considered year financed from depreciation profit credits co-financing donations and from issuing bonds and other securities [kn] minus value of assets received without charge in the considered year [kn] minus depreciation of the
Ref C20-IRB-54-03
CEER Report on Regulatory Frameworks for European Energy Networks 2020
17156
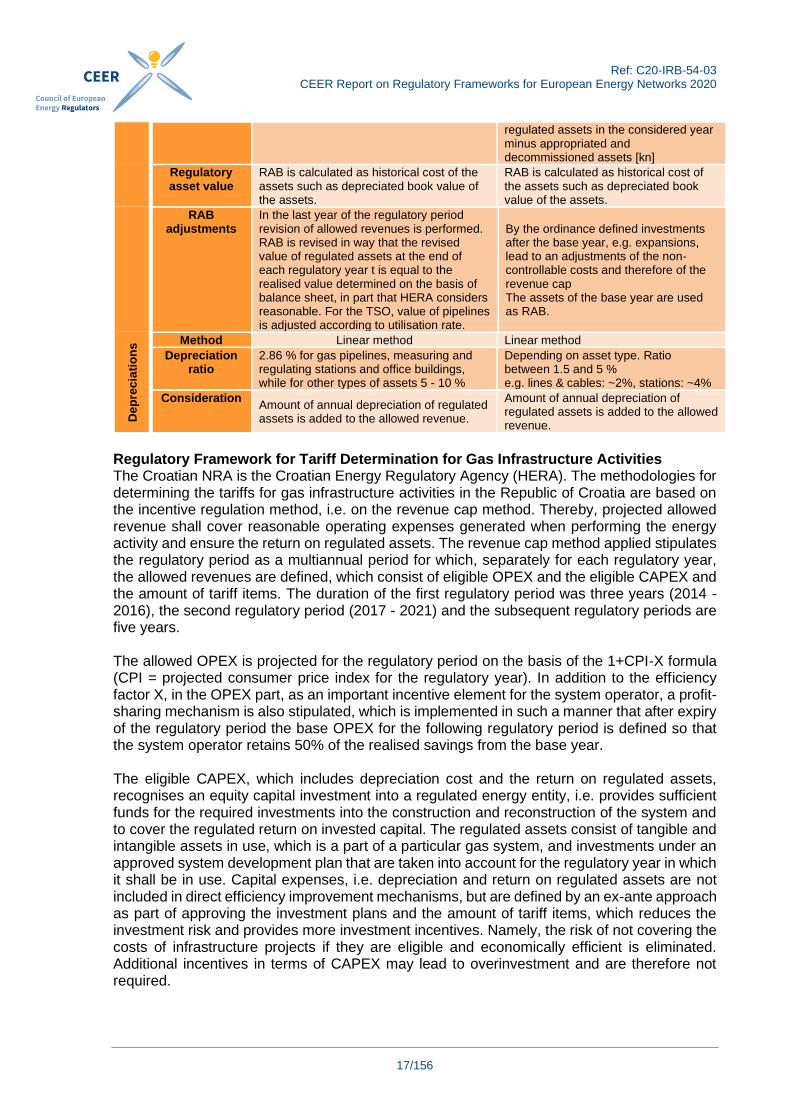
regulated assets in the considered year minus appropriated and decommissioned assets [kn]
Regulatory asset value
RAB is calculated as historical cost of the assets such as depreciated book value of the assets
RAB is calculated as historical cost of the assets such as depreciated book value of the assets
RAB adjustments
In the last year of the regulatory period revision of allowed revenues is performed RAB is revised in way that the revised value of regulated assets at the end of each regulatory year t is equal to the realised value determined on the basis of balance sheet in part that HERA considers reasonable For the TSO value of pipelines is adjusted according to utilisation rate
By the ordinance defined investments after the base year eg expansions lead to an adjustments of the non-controllable costs and therefore of the revenue cap The assets of the base year are used as RAB
De
pre
cia
tio
ns Method Linear method Linear method
Depreciation ratio
286 for gas pipelines measuring and regulating stations and office buildings while for other types of assets 5 - 10
Depending on asset type Ratio between 15 and 5 eg lines amp cables ~2 stations ~4
Consideration Amount of annual depreciation of regulated assets is added to the allowed revenue
Amount of annual depreciation of regulated assets is added to the allowed revenue
Regulatory Framework for Tariff Determination for Gas Infrastructure Activities The Croatian NRA is the Croatian Energy Regulatory Agency (HERA) The methodologies for determining the tariffs for gas infrastructure activities in the Republic of Croatia are based on the incentive regulation method ie on the revenue cap method Thereby projected allowed revenue shall cover reasonable operating expenses generated when performing the energy activity and ensure the return on regulated assets The revenue cap method applied stipulates the regulatory period as a multiannual period for which separately for each regulatory year the allowed revenues are defined which consist of eligible OPEX and the eligible CAPEX and the amount of tariff items The duration of the first regulatory period was three years (2014 - 2016) the second regulatory period (2017 - 2021) and the subsequent regulatory periods are five years The allowed OPEX is projected for the regulatory period on the basis of the 1+CPI-X formula (CPI = projected consumer price index for the regulatory year) In addition to the efficiency factor X in the OPEX part as an important incentive element for the system operator a profit-sharing mechanism is also stipulated which is implemented in such a manner that after expiry of the regulatory period the base OPEX for the following regulatory period is defined so that the system operator retains 50 of the realised savings from the base year The eligible CAPEX which includes depreciation cost and the return on regulated assets recognises an equity capital investment into a regulated energy entity ie provides sufficient funds for the required investments into the construction and reconstruction of the system and to cover the regulated return on invested capital The regulated assets consist of tangible and intangible assets in use which is a part of a particular gas system and investments under an approved system development plan that are taken into account for the regulatory year in which it shall be in use Capital expenses ie depreciation and return on regulated assets are not included in direct efficiency improvement mechanisms but are defined by an ex-ante approach as part of approving the investment plans and the amount of tariff items which reduces the investment risk and provides more investment incentives Namely the risk of not covering the costs of infrastructure projects if they are eligible and economically efficient is eliminated Additional incentives in terms of CAPEX may lead to overinvestment and are therefore not required
Ref C20-IRB-54-03
CEER Report on Regulatory Frameworks for European Energy Networks 2020
18156
An important incentive element within the applied regulatory method is the regular audit of the allowed revenues which is performed in the last year of the regulatory period and as part of which the difference is determined between the realised revenue (R) and the audited allowed revenue (AI) to be distributed to the following regulatory period Since the applied revenue cap method guarantees to the system operator the level of revenue in the medium term a significant part of the market risk is shifted to the system users The reduction of market risk also affects the reduction of the liquidity risk and hence the reduction of the cost of financing the investment activities An additional measure aimed at mitigating the risk of the system operator business is the option of performing an extraordinary audit of the allowed revenue also during the current regulatory period at the request of the operator or according to the estimates by HERA The extraordinary audit of allowed revenue is performed due to unexpected changes in the market that have a significant impact on the conditions of providing the energy activity which the system operator could not have foreseen nor prevented eliminated or avoided As part of the extraordinary audit an audit may be performed of all the elements used in the calculation of the allowed revenue and in the calculation of the amount of tariff items for the current regulatory period An additional measure in gas distribution is the possibility of introducing a regulatory account This is an optional model of economic regulation which provides the possibility for the system operator in the later years of the regulatory account the reimbursement of the revenue realised in the early years in the amount less than the allowed revenue that would have resulted from the application of the standard regulation model That is in the case of significant investments in the existing infrastructure or with entirely new infrastructure the standard regulation model is not appropriate since significant investments which by being put into use are included in the regulatory asset base affect the strong growth in the amount of allowed capital expenses in the first years of the project At the same time large investments in the initial period are often accompanied by low system usage level The aforementioned situation would result in uncompetitive high tariffs for using the system in the same period which would represent a negative factor for the decision to invest in the project Therefore the regulatory account is approved in such a manner that the gas system operator achieves cumulatively the same allowed revenue as without the use of the regulatory account but with different time dynamics The period for which a regulatory account is established may not be shorter than two regulatory periods nor longer than the period for which the operator has concluded a concession contract Such a mechanism also prevents discrimination against new users that use the system in the early years since the tariff items are unified and without fluctuations throughout the entire period for which the regulatory account is kept The nominal WACC before tax is used as the rate of return on regulated assets As a measure of avoiding systemic risk the rate of return on equity is calculated using the CAPM model and the rate of return on debt capital is determined as the average weighted interest rate on investment loans used by the system operator to finance regulated assets The shares of debt and equity capital are defined as target shares in the amount of 50 which is theoretically optimal capital distribution and approximates the effect of the financial leverage to a good extent In this respect a pre-defined ratio of debt and equity capital in the WACC calculation significantly reduces the regulatory risk while at the same time encourages the system operator to consider the actual capital structure used In addition applying a targeted ratio provides for equal treatment and approach to WACC calculation for all energy entities in gas infrastructure activities The decision on the actual capital structure in regular business and project financing remains with the system operator while the target ratio defined by the methodologies for determining the amount of tariff items for gas infrastructure activities in the Republic of Croatia refers solely to the WACC calculation
Ref C20-IRB-54-03
CEER Report on Regulatory Frameworks for European Energy Networks 2020
19156
Regulatory framework for tariff determination for electricity infrastructure activities Introduction The electricity networks are examples of what are known as natural monopolies where effective competition is restricted To ensure that network operators (DSOs = Distribution System Operators TSOs = Transmission System Operators) do not make any monopoly profits but still operate their networks as cost effectively as possible the electricity network operators are subject to regulation This task is performed by the HERA as the regulatory authority responsible in Croatia for the networks in various sectors including electricity and gas Historical development Regulation by the HERA began in 2006 as cost-plus regulation Under this regime the revenue that network operators are allowed to earn within a certain period (regulatory period) is determined using a mathematical formula and fixed for the period It therefore incentivises network operators to lower their costs within the regulatory period (work efficiently) so as to increase their profits within the limits of the framework (revenue (fixed) minimum income realised by implementation of tariff items should cover the acknowledged total costs of electricity distribution) Allowed revenue shall cover reasonable operating expenses generated when performing the energy activity and ensure the return on regulated assets The revenue cap method applied stipulates the regulatory period as a multiannual period for which separately for each regulatory year the allowed revenues are defined consisting of eligible OPEX and eligible CAPEX In the course of the current regulatory year based on business data from the Annex 1 of this Tariff System the Agency shall determine the total acknowledged operating costs for the previous regulatory year - the realised income according to tariff items and the value of their difference ΔUTPpret The difference between the realised income by implementation of tariff items the acknowledged total operating costs from the previous regulatory year ΔUTPpret and the estimated difference for the current regulatory year ΔUTPsad shall be taken into consideration when determining the amounts of tariff items for electricity distribution of tariff customers for the considered future regulatory year
Determining the revenue caps
A regulatory period equals one regulatory year Determining the amounts of tariff items for the future regulatory year is based on the acknowledged operating costs from the previous regulatory year realised and estimated operating costs for the present regulatory year and accepted planned costs for the considered future regulatory year The revenue caps for network operators are set for a regulatory period The costs data is supplemented by a calculated return on equity The premium covering network-specific risks is determined using the capital asset pricing model (CAPM) and is derived from the product of an imputed market risk premium and a risk factor (beta factor) A pre-defined ratio of debt and equity capital in the WACC calculation significantly reduces the regulatory risk while at the same time encourages the system operator to consider the actual capital structure used
Transparency
The data is published on the regulatory authority website
Ref C20-IRB-54-03
CEER Report on Regulatory Frameworks for European Energy Networks 2020
20156
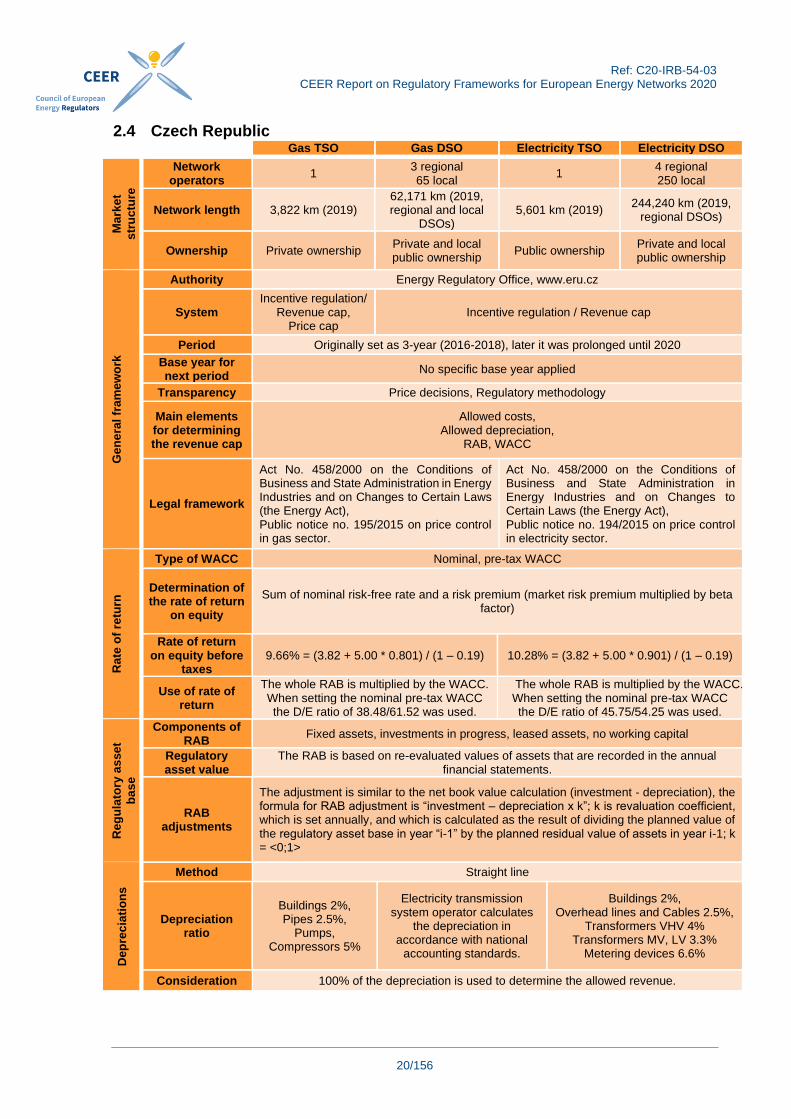
24 Czech Republic Gas TSO Gas DSO Electricity TSO Electricity DSO
Ma
rke
t
str
uc
ture
Network operators
1 3 regional 65 local
1 4 regional 250 local
Network length 3822 km (2019) 62171 km (2019 regional and local
DSOs) 5601 km (2019)
244240 km (2019 regional DSOs)
Ownership Private ownership Private and local public ownership
Public ownership Private and local public ownership
Ge
ne
ral
fra
me
wo
rk
Authority Energy Regulatory Office wwwerucz
System Incentive regulation
Revenue cap Price cap
Incentive regulation Revenue cap
Period Originally set as 3-year (2016-2018) later it was prolonged until 2020
Base year for next period
No specific base year applied
Transparency Price decisions Regulatory methodology
Main elements for determining the revenue cap
Allowed costs Allowed depreciation
RAB WACC
Legal framework
Act No 4582000 on the Conditions of Business and State Administration in Energy Industries and on Changes to Certain Laws (the Energy Act) Public notice no 1952015 on price control in gas sector
Act No 4582000 on the Conditions of Business and State Administration in Energy Industries and on Changes to Certain Laws (the Energy Act) Public notice no 1942015 on price control in electricity sector
Rate
of
retu
rn
Type of WACC Nominal pre-tax WACC
Determination of the rate of return
on equity
Sum of nominal risk-free rate and a risk premium (market risk premium multiplied by beta factor)
Rate of return on equity before
taxes 966 = (382 + 500 0801) (1 ndash 019) 1028 = (382 + 500 0901) (1 ndash 019)
Use of rate of return
The whole RAB is multiplied by the WACC When setting the nominal pre-tax WACC the DE ratio of 38486152 was used
The whole RAB is multiplied by the WACC When setting the nominal pre-tax WACC the DE ratio of 45755425 was used
Reg
ula
tory
as
se
t
ba
se
Components of RAB
Fixed assets investments in progress leased assets no working capital
Regulatory asset value
The RAB is based on re-evaluated values of assets that are recorded in the annual financial statements
RAB adjustments
The adjustment is similar to the net book value calculation (investment - depreciation) the formula for RAB adjustment is ldquoinvestment ndash depreciation x krdquo k is revaluation coefficient which is set annually and which is calculated as the result of dividing the planned value of the regulatory asset base in year ldquoi-1rdquo by the planned residual value of assets in year i-1 k = lt01gt
Dep
rec
iati
on
s
Method Straight line
Depreciation ratio
Buildings 2 Pipes 25
Pumps Compressors 5
Electricity transmission system operator calculates
the depreciation in accordance with national
accounting standards
Buildings 2 Overhead lines and Cables 25
Transformers VHV 4 Transformers MV LV 33
Metering devices 66
Consideration 100 of the depreciation is used to determine the allowed revenue
Ref C20-IRB-54-03
CEER Report on Regulatory Frameworks for European Energy Networks 2020
21156
Introduction Electricity and gas distribution and electricity and gas transmission are so-called natural monopolies the operation of which relies on only one network because the rollout of a parallel infrastructure is not effective in economic terms To prevent monopolies from dictating prices uncontrollably they have to be regulated by the state A regulatory authority is usually authorised to do this in the case of regulation In the Czech Republic Act No 4582000 (the Energy Act) sets up the Energy Regulatory Office (ERO) for the purpose of regulation in the energy sector Under the Energy Act the ERO is obliged to set out in implementing legal regulations the method of regulation in energy industries and price control procedures To this end public notices no 1942015 on price control in electricity sector and no 1952015 on price control in gas sector were published in August 2015 they came into effect with the beginning of the fourth regulatory period (RP) in 2016 Furthermore ERO published a document called ldquoPrinciples of price regulation for the period from 2016 to 2018 in electricity and gas sector and for the market operatorrsquos activitiesrdquo in which the price methodology for the fourth RP is described in more detail The fourth RP was originally set as a three-year period (2016-2018) but in January 2018 it was prolonged until the end of 2020 without any changes in the price methodology The purpose of the methodology for the fourth RP was to determine a reasonable level of profit for companies during the whole RP to ensure adequate quality of the services provided to customers with effective spending of costs to support future investments to provide for the resources required for network renovation and to continue to improve efficiencies from which customers also benefit Price Control in the Electricity Industry The resulting price of electricity supply for all categories of final customers is comprised of five basic components The first component is the uncontrolled price of commodity ie the electrical energy itself [in Czech called ldquosilovaacute elektřinardquo still ldquoenergyrdquo or ldquoelectricityrdquo in English] which is priced on market principles and in line with the various electricity suppliersrsquo business strategies The other components of the price are as follows regulated activities of a monopoly nature which include electricity transport and distribution from the generating plant over the transmission and distribution systems to the final customer and also activities related to ensuring the stability of the electricity system from the technical point of view (the so-called provision of system services) and from the commercial point of view (primarily the electricity market operatorrsquos activity in the area of imbalance clearing) The last component of the resulting price of electricity supply is the contribution to support of electricity from promoted sources The above is the approach to electricity supply pricing for all customer categories with effect from 1 January 2006 when the Czech electricity market was completely liberalised Price Control in the Gas Industry The price of natural gas supply for final customers is comprised of four basic components The first component is the charge for commodity ie natural gas itself which is priced on market principles and in line with the various gas suppliersrsquo business strategies The other three components are the price for gas transmission gas distribution and market operatorrsquos activities The prices for these three components are regulated and determined by ERO Regulatory Methodology Framework A revenue cap methodology is used for setting the allowed revenue in the Czech Republic The length of the RP is mainly five years The basic formula for determining allowed revenue is
Ref C20-IRB-54-03
CEER Report on Regulatory Frameworks for European Energy Networks 2020
22156
AR = AC + AD + P
where
AR is the value of the allowed revenue AC is the value of the allowed costs AD is the value of the allowed depreciation P is the value of the allowed profit Allowed Costs The generally adopted theory of regulation assumes that the costs that enter into the subsequent RP are determined based on the analysis of values achieved in the preceding period This theory is based on the assumption that during the RP the companies reduce their costs under the pressure for efficiency thereby achieving higher profits than those set for them by regulator ERO decided to determine the initial level of allowed costs as the arithmetic average of actual accounting costs for two particular years specifically years 2012 and 2013 for which the audited actual values were available ERO considered such procedure for the fourth RP to be objective transparent fair and acceptable for all market participants For setting the cost base ndash to obtain the input value of costs ndash rigorous classification of reported costs for the defined reference years had to be carried out for regulated entities and the anomalies that were not accepted for this input data were separated from the reported and eligible justified costs Costs base was netted for extraordinary costs and at the same time it was submitted to a thorough check Extraordinary costs are the costs that are not related to the standard activity performed by the regulated entity and which are not of regular nature (they are not repeated every year) or the costs that were incurred just once The values ascertained in such a manner for years 2012 and 2013 were adjusted with an escalation factor to the time value 2015 The arithmetic average of these values thus became the initial value of allowed costs for the fourth RP The regulation principle of the revenue cap is then consistently applied to these costs throughout the RP This costs base is annually adjusted with escalation factor and efficiency factor Escalation Factor The initial cost base is indexed to the following years by the escalation factor The escalation factor for the fourth RP is composed by the annual business service price index with the weight of 70 and the annual consumer price index with 1 bonus and the weight of 30 published by the Czech Statistical Office for April of the relevant year Efficiency Factor (X Factor) The efficiency factor makes companies on the energy market behave more efficiently and reduce costs over the RP At the beginning of the RP the regulator sets the value of the required efficiency which the companies are obliged to observe The ERO set this value to 3 for the fourth RP (2016-2018) and it represents the year on year decrease of the costs by 101 (according to the formula 119883=1minus sup3radic097=101 ) For the additional years of the fourth regulatory period (2019 and 2020) the same value of efficiency factor (101) has been applied
Ref C20-IRB-54-03
CEER Report on Regulatory Frameworks for European Energy Networks 2020
23156
Allowed Depreciation The allowed depreciation is determined on the basis of the planned values in individual years of the RP The planned values of the depreciation are adjusted in the year ldquoi+2rdquo based on the actual values using the time value of money Profit
The profit of the regulated entity is simplified calculated as follows
P = RAB x WACC
where RAB is the value of the regulatory asset base WACC is the rate of return Regulatory Asset Base The calculation of the regulatory asset base in the fourth RP uses for its input the planned values which are corrected (in two-year lag) based on the actual values In order to maintain continuity between the third and the fourth RP the initial level of the regulatory asset base (RAB0) was set at the planned value of the regulatory asset base for the year 2015 In the subsequent years of the RP the initial level of the regulatory asset base is increased (or decreased) by the differences between the capitalised investments and the depreciation which is adjusted with the revaluation coefficient utilised in the third RP The assets under construction are also included into RAB These assets are part of RAB under certain conditions namely the planned acquisition period of the investments is more than two years (the time of preparation is not included) and the total planned price of individual investment exceeds 500 million CZK Rate of Return (WACC) The WACC parameter (nominal pre-tax) is used for calculating profit in the Czech Republic When determining the rate of return as the key parameter for investment conditions (and decisions) in the regulated environment the ERO analysed the market environment risk rate of individual environments as well as overall economic position of similar ndash peer ndash companies in the Czech Republic and also in the other EU countries ERO set the values of the WACC parameter as fixed for the entire RP except for cases when the income tax rate of legal entities is changed ndash considering the relevant specific conditions and indicators for electricity and gas industries The rate of return is set as the uniform value for the electricity industry and the uniform value for the gas industry (ie the same rate for the DSO as well as the TSO in the given industry) Inflation Rate ndash Time Value of Money To adjust the planned values that are included into the parameters of regulation the standard cases are covered by inflation rate parameter which is derived from the index of industrial producersrsquo prices The inflation rate parameter is defined annually based on the ratio of rolling averages reported by the Czech Statistical Office in the table ldquoIndustrial Producer Price Index by Section and Subsection of CZ-CPA in the Czech Republic (ratio of rolling averages)rdquoIn the specific cases the WACC value is used as the time value of money
Ref C20-IRB-54-03
CEER Report on Regulatory Frameworks for European Energy Networks 2020
24156
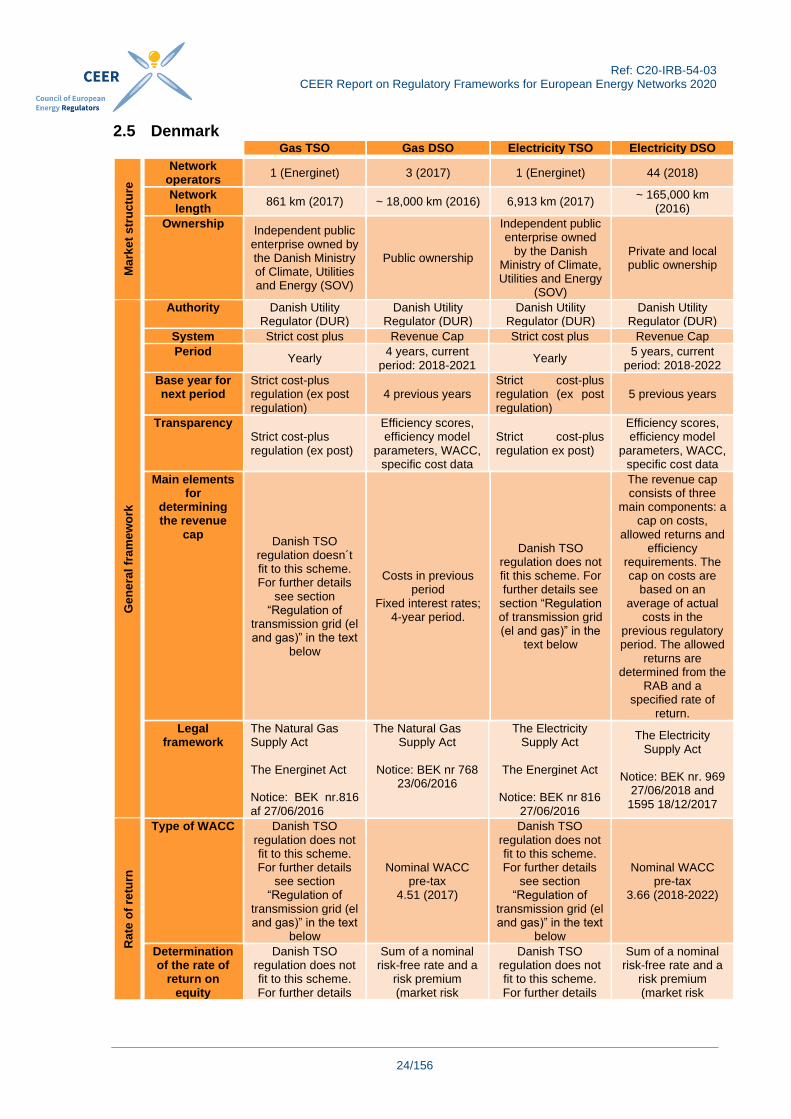
25 Denmark Gas TSO Gas DSO Electricity TSO Electricity DSO
Ma
rke
t s
tru
ctu
re
Network operators
1 (Energinet) 3 (2017) 1 (Energinet) 44 (2018)
Network length
861 km (2017) ~ 18000 km (2016) 6913 km (2017) ~ 165000 km
(2016)
Ownership Independent public enterprise owned by the Danish Ministry of Climate Utilities and Energy (SOV)
Public ownership
Independent public enterprise owned
by the Danish Ministry of Climate Utilities and Energy
(SOV)
Private and local public ownership
Ge
ne
ral
fra
me
wo
rk
Authority Danish Utility Regulator (DUR)
Danish Utility Regulator (DUR)
Danish Utility Regulator (DUR)
Danish Utility Regulator (DUR)
System Strict cost plus Revenue Cap Strict cost plus Revenue Cap
Period Yearly
4 years current period 2018-2021
Yearly 5 years current
period 2018-2022
Base year for next period
Strict cost-plus regulation (ex post regulation)
4 previous years Strict cost-plus regulation (ex post regulation)
5 previous years
Transparency Strict cost-plus regulation (ex post)
Efficiency scores efficiency model
parameters WACC specific cost data
Strict cost-plus regulation ex post)
Efficiency scores efficiency model
parameters WACC specific cost data
Main elements for
determining the revenue
cap Danish TSO
regulation doesnacutet fit to this scheme For further details
see section ldquoRegulation of
transmission grid (el and gas)rdquo in the text
below
Costs in previous period
Fixed interest rates 4-year period
Danish TSO regulation does not fit this scheme For further details see
section ldquoRegulation of transmission grid (el and gas)rdquo in the
text below
The revenue cap consists of three
main components a cap on costs
allowed returns and efficiency
requirements The cap on costs are
based on an average of actual
costs in the previous regulatory period The allowed
returns are determined from the
RAB and a specified rate of
return
Legal framework
The Natural Gas Supply Act The Energinet Act Notice BEK nr816 af 27062016
The Natural Gas Supply Act
Notice BEK nr 768
23062016
The Electricity Supply Act
The Energinet Act
Notice BEK nr 816
27062016
The Electricity Supply Act
Notice BEK nr 969
27062018 and 1595 18122017
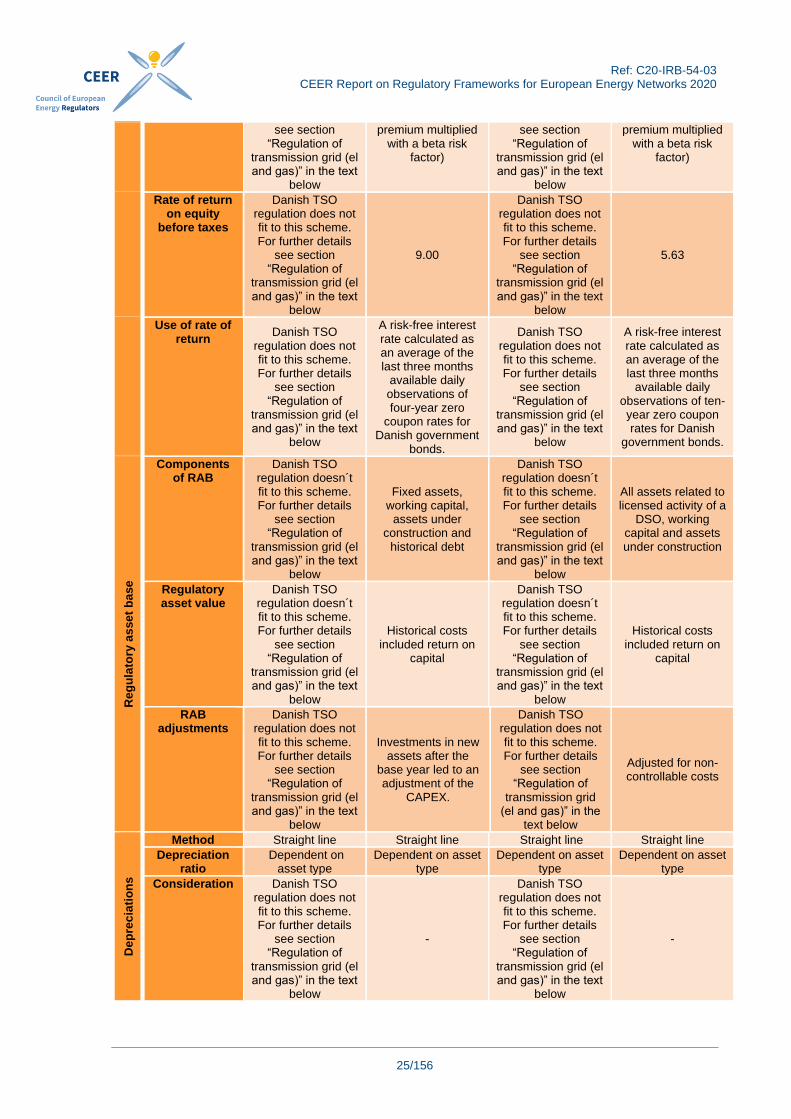
Rate
of
retu
rn
Type of WACC Danish TSO regulation does not fit to this scheme For further details
see section ldquoRegulation of
transmission grid (el and gas)rdquo in the text
below
Nominal WACC pre-tax
451 (2017)
Danish TSO regulation does not fit to this scheme For further details
see section ldquoRegulation of
transmission grid (el and gas)rdquo in the text
below
Nominal WACC pre-tax
366 (2018-2022)
Determination of the rate of
return on equity
Danish TSO regulation does not fit to this scheme For further details
Sum of a nominal risk-free rate and a
risk premium (market risk
Danish TSO regulation does not fit to this scheme For further details
Sum of a nominal risk-free rate and a
risk premium (market risk
Ref C20-IRB-54-03
CEER Report on Regulatory Frameworks for European Energy Networks 2020
25156
see section ldquoRegulation of
transmission grid (el and gas)rdquo in the text
below
premium multiplied with a beta risk
factor)
see section ldquoRegulation of
transmission grid (el and gas)rdquo in the text
below
premium multiplied with a beta risk
factor)
Rate of return on equity
before taxes
Danish TSO regulation does not fit to this scheme For further details
see section ldquoRegulation of
transmission grid (el and gas)rdquo in the text
below
900
Danish TSO regulation does not fit to this scheme For further details
see section ldquoRegulation of
transmission grid (el and gas)rdquo in the text
below
563
Use of rate of return
Danish TSO regulation does not fit to this scheme For further details
see section ldquoRegulation of
transmission grid (el and gas)rdquo in the text
below
A risk-free interest rate calculated as an average of the last three months
available daily observations of four-year zero
coupon rates for Danish government
bonds
Danish TSO regulation does not fit to this scheme For further details
see section ldquoRegulation of
transmission grid (el and gas)rdquo in the text
below
A risk-free interest rate calculated as an average of the last three months
available daily observations of ten-year zero coupon rates for Danish
government bonds
Reg
ula
tory
as
se
t b
ase
Components of RAB
Danish TSO regulation doesnacutet fit to this scheme For further details
see section ldquoRegulation of
transmission grid (el and gas)rdquo in the text
below
Fixed assets working capital
assets under construction and
historical debt
Danish TSO regulation doesnacutet fit to this scheme For further details
see section ldquoRegulation of
transmission grid (el and gas)rdquo in the text
below
All assets related to licensed activity of a
DSO working capital and assets under construction
Regulatory asset value
Danish TSO regulation doesnacutet fit to this scheme For further details
see section ldquoRegulation of
transmission grid (el and gas)rdquo in the text
below
Historical costs included return on
capital
Danish TSO regulation doesnacutet fit to this scheme For further details
see section ldquoRegulation of
transmission grid (el and gas)rdquo in the text
below
Historical costs included return on
capital
RAB adjustments
Danish TSO regulation does not fit to this scheme For further details
see section ldquoRegulation of
transmission grid (el and gas)rdquo in the text
below
Investments in new assets after the
base year led to an adjustment of the
CAPEX
Danish TSO regulation does not fit to this scheme For further details
see section ldquoRegulation of
transmission grid (el and gas)rdquo in the
text below
Adjusted for non-controllable costs
Dep
rec
iati
on
s
Method Straight line Straight line Straight line Straight line
Depreciation ratio
Dependent on asset type
Dependent on asset type
Dependent on asset type
Dependent on asset type
Consideration Danish TSO regulation does not fit to this scheme For further details
see section ldquoRegulation of
transmission grid (el and gas)rdquo in the text
below
-
Danish TSO regulation does not fit to this scheme For further details
see section ldquoRegulation of
transmission grid (el and gas)rdquo in the text
below
-
Ref C20-IRB-54-03
CEER Report on Regulatory Frameworks for European Energy Networks 2020
26156
Introduction The Danish Utility Regulator (DUR) is independent of the government The tasks of DUR are stipulated in the supply acts for electricity natural gas and district heating Regulation of Electricity Grid Companies Danish electricity grid companies are natural monopolies As the distribution of electricity is a monopolistic activity the grid companies generally do not have the same incentives for financial efficiency as enterprises on a free competitive market The grid companies are therefore subject to financial regulation managed by DUR The regulation aims at reflecting the pressure on efficiency faced by enterprises subject to competition on the free market The financial regulation primarily consists of two mechanisms revenue caps and benchmarks Revenue caps set a ceiling on the operating revenues of grid companies The revenue caps for DSOs are set for a five-year regulatory period The first regulatory period runs from 2018 until 2022 The revenue caps consist of three main components a cap on costs allowed returns and efficiency requirements The cap on costs are based on an average of actual costs in the previous regulatory period The allowed returns are determined from the RAB and a specified rate of return Throughout a regulatory period the revenue caps are adjusted for changes in the price levels (inflation) and the specific activity level of a given DSO The efficiency requirements are related to the overall productivity changes in the Danish economy and individual performance calculated from benchmarking Benchmarking aims at ensuring that consumers do not pay more for the services of the grid companies than they would have done if the companies were subject to competition If the actual costs of a grid company are too high efficiency improvement requirements will be imposed on the company by DUR The RAB which is used to calculate the allowed returns and is divided into two parts a forward-looking asset base and a historical asset base Each asset base is coupled with its own rate of return and the WACC is only used as the rate of return on the forward-looking asset base The forward-looking asset base consists of regulatory assets invested from 1 January 2018 and forward The rate of return on the historical asset base is a continuation of the previous definition of allowed rate of return which is not comparable to the WACC definitions and methods Regulation of Gas Distribution Companies Grid companies are not subject to competition and therefore DUR regulations aim at encouraging these companies to be more efficient by lowering the cap on their revenues The revenue cap is made up by i) operating costs (decided activity level) ii) operating costs (imposed by external factors) iii) historic debt locked (remaining from 2004 balance) iv) asset base and v) costs to promote and realise reductions in energy consumption DUR sets efficiency demands on i) operating costs based on a benchmark between the DSOs to ensure external pressure to lower costs continuously Furthermore DUR sets a cap on i) operating costs based on historic cost levels and DSOs can achieve efficiency gains by realising operating costs that are lower this level of historic costs adjusted for efficiency demands The revenue cap is adjusted to actual level of ii) operating costs
Ref C20-IRB-54-03
CEER Report on Regulatory Frameworks for European Energy Networks 2020
27156
Before entering a regulation period DUR sets a level of interest rate for the iv) asset base using a WACC framework and a CAPM methodology The level of interest is fixed during the regulation period but the asset base can vary The revenue cap is adjusted by iv) actual costs to realise reductions in energy consumption Regulation of Transmission Grid (Electricity and Gas) Energinet is the TSO for both electricity and gas in Denmark The special provisions for Energinet were established by law on Energinet and executive order on economic regulation of Energinet Energinet is ex-post regulated in accordance with a ldquonon-profitrdquo principle whereby the companys tariffs may only cover the necessary costs incurred in efficient operation and an interest rate to ensure the real value of the companys capital base on 1 January 2005 (strict cost-plus regulation) Energinetrsquos capital base on 1 January 2005 was 3157 million DKK In 2016 the return of capital was 21 million DKK (07) The economic regulation of Energinet does not allow explicit efficiency requirements for Energinet However DUR may determine that a specific cost ndash or the amount thereof ndash does not constitute a necessary cost at efficient operation and therefore may not be included (or only partially included) in Energinetrsquos tariffs DUR and Energinet have participated in two European benchmarks of electricity TSOs the latest being in 2013 and also in the first European benchmark of gas TSOs which was concluded in 2016 The benchmarks play a role as background for DURrsquos economic regulation and assessment of Energinet DUR distributed the results of the benchmark analyses to the Minister of Energy Utilities and Climate in the ministryrsquos capacity as owner of the Energinet In its utility strategy (Regeringens forsyningsstrategi) in September 2016 the government presented its comprehensive utility strategy for Danish households and companies One of the proposals was a new incentive-based financial regulation of Energinet
Ref C20-IRB-54-03
CEER Report on Regulatory Frameworks for European Energy Networks 2020
28156
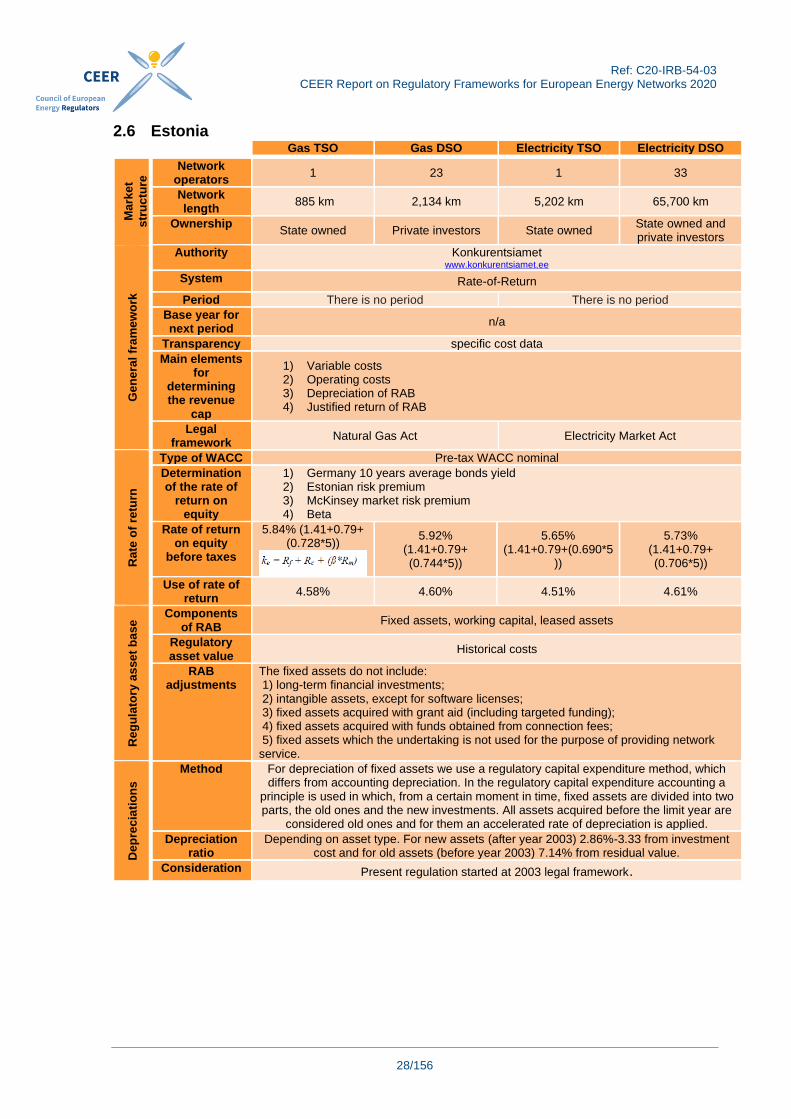
26 Estonia Gas TSO Gas DSO Electricity TSO Electricity DSO
Ma
rke
t
str
uc
ture
Network operators
1 23 1 33
Network length
885 km 2134 km 5202 km 65700 km
Ownership State owned Private investors State owned
State owned and private investors
Ge
ne
ral
fra
me
wo
rk
Authority Konkurentsiamet wwwkonkurentsiametee
System Rate-of-Return
Period There is no period There is no period
Base year for next period
na
Transparency specific cost data
Main elements for
determining the revenue
cap
1) Variable costs 2) Operating costs 3) Depreciation of RAB 4) Justified return of RAB
Legal framework
Natural Gas Act Electricity Market Act
Rate
of
retu
rn
Type of WACC Pre-tax WACC nominal
Determination of the rate of
return on equity
1) Germany 10 years average bonds yield 2) Estonian risk premium 3) McKinsey market risk premium 4) Beta
Rate of return on equity
before taxes
584 (141+079+ (07285))
592 (141+079+ (07445))
565 (141+079+(06905
))
573 (141+079+ (07065))
Use of rate of return
458 460 451 461
Reg
ula
tory
as
se
t b
ase Components
of RAB Fixed assets working capital leased assets
Regulatory asset value
Historical costs
RAB adjustments
The fixed assets do not include 1) long-term financial investments 2) intangible assets except for software licenses 3) fixed assets acquired with grant aid (including targeted funding) 4) fixed assets acquired with funds obtained from connection fees 5) fixed assets which the undertaking is not used for the purpose of providing network service
Dep
rec
iati
on
s
Method For depreciation of fixed assets we use a regulatory capital expenditure method which differs from accounting depreciation In the regulatory capital expenditure accounting a
principle is used in which from a certain moment in time fixed assets are divided into two parts the old ones and the new investments All assets acquired before the limit year are
considered old ones and for them an accelerated rate of depreciation is applied
Depreciation ratio
Depending on asset type For new assets (after year 2003) 286-333 from investment cost and for old assets (before year 2003) 714 from residual value
Consideration Present regulation started at 2003 legal framework
Ref C20-IRB-54-03
CEER Report on Regulatory Frameworks for European Energy Networks 2020
29156
Introduction The Estonian Competition Authority (ECA) establishes network charges for network operators The laws provide uniform price regulation for all network operators regardless of their size The ECA has prepared uniform methods for the calculation of network charges based on the WACC The methods are applied similarly and uniformly in analysing the activities and monitoring the prices of all the undertakings under the ECArsquos supervision in compliance with the principle of equal treatment and proportionality Variable Cost Variable costs are costs that vary in line with changes in the sales volume ie are directly dependent on the sales volume The following variable costs shall be included in network charges the costs of outsourced transmission andor distribution network services and the costs of electricity purchased for covering network losses ECA shall use the following methods to analyse network losses monitoring of the dynamics of network losses in time comparison of statistical indicators with other network operators analysis of technical indicators (eg length of lines number of substations etc) and analysis of the impact of investments on network losses The cost of the network electricity losses is the product of the forecast amount of network loss and the price The forecast price of the electricity purchased for covering network losses shall be justified and cost-effective An analysis of the justification of the price shall be based on the weighted average price determined on the basis of the price applicable in the Nord Pool Spot Estonian price region and the size of network losses in the 12 calendar months preceding the submission of the request plus justified costs necessary for purchasing electricity The weighted average price is calculated on the basis of the one-day forward hourly price in the electricity market during the aforementioned period and the network operatorrsquos amount of energy lost in the respective hour If the amount of electricity purchased for compensating network losses is below 5000 MWh a year the electricity price may be forecast on the basis of the electricity supply agreement In such a case the justification of the price as well as the conformity of the price with the market price shall be analysed and the organisation of a tender shall be expected In the case of a transmission network operator specific income and expenses are taken into account including the income and expenses of the transit flow compensation mechanism between transmission network operators (ITC) countertrade costs transmission capacity auction income etc Operating Cost Operating costs are all the justified costs necessary for the provision of network services which are not variable costs or capital expenditure Operating costs are divided into controlled operating costs and non-controlled operating costs The following justified costs are generally considered as operating costs the costs of maintenance and repairs performed by the network operator the costs of outsourced works and services transport costs information technology and communication costs labour expenses (including taxes) the state fee payable for the activity licence for providing network services fees for tolerating technical networks or structures other costs which must be listed and justified in the request ECA shall use the following methods to analyse operating costs monitoring of the dynamics of operating costs in time by quantity and as a special cost in regard to the sales volume comparison of statistical indicators with similar network operators performance of an in-depth analysis of the components of operating costs (using expert evaluations if necessary) and analysis of the impact of investments on operating costs Monitoring the dynamics of costs in time means a change in the operating costs of a network operator across the years in general
Ref C20-IRB-54-03
CEER Report on Regulatory Frameworks for European Energy Networks 2020
30156
it must not grow more than the CPI An in-depth analysis shall include a detailed distribution of operating costs between different activities The detailed distribution of operating costs shall include data across the three calendar years preceding the submission of the request The network operator shall justify the incurrence variation and cost-efficiency of the costs presented in the in-depth analysis The dynamics of the special costs of various cost types may be compared in conducting an in-depth analysis Upon comparing the costs of a network operator and the statistical indicators determined on the basis thereof with the costs of other similar network operators the special costs under the operating costs of similar network operators shall be compared (total operating costs per sales amount) If necessary ECA may also analyse the cost types and the special costs of similar network operators (eg the labour expenses of network operators per sales amount) Upon approval and verification of network charges ECA shall not accept the following cost items the cost of doubtful receivables costs related to ancillary activities costs arising from changes in the value of assets (change in the balance of inventories write-downs of current assets etc) penalties and fines for delays imposed on the network operator pursuant to law (fines for administrative violations penalty payments compensation for damages etc) costs not related to business activities (sponsorship gifts donations etc) other unjustified costs identified in the process of an economic analysis Regulated Assets and Capital Expenditure Determining the value of regulated assets (the fixed assets necessary for the provision of network services) is necessary for calculating capital expenditure and justified profitability The ECA shall analyse the justification of both made and forecast investments for the basis for accounting for regulated assets For the purpose of verifying the justification of investments
bull The Transmission System Operator shall submit a detailed five-year investment plan and a prospective ten-year investment plan The investment plan shall include the cost and justification of the investments the economy and cost-efficiency to be achieved and the criteria for improving the security of supply and quality
bull A Distribution System Operator (DSO) with more than 100000 consumers shall submit the same data as the Transmission System Operator and
bull A DSO with fewer than 100000 consumers shall submit a detailed five-year investment plan and a prospective ten-year investment plan upon the ECArsquos request
The ECA shall not accept the following costs incurred on fixed assets as regulated assets and capital expenditure long-term financial investments fixed assets acquired using connection charges paid by consumers fixed assets acquired using non-refundable aid (eg EU external aid programmes) intangible assets (excluding computer software licences and rights of use pertaining to land related to technical structures) fixed assets related to ancillary activities costs arising from changes in the value of assets (impairment of the value of fixed assets losses from sales and liquidations of property plant and equipment and intangible assets etc) assets which the network operator is not actually using for the provision of network services Capital expenditure is calculated on the basis of the value of the fixed assets (regulated assets) necessary for the provision of network services and the capital expenditure rate The capital expenditure rate is the reciprocal value of the useful technical life of the asset Individual assets may have different useful lives and therefore different capital expenditure rates Upon justifying the useful life of an asset the ECA shall verify the following - The expected period of use of the asset - The expected physical wear and tear of the asset and - The technical or moral obsolescence of the asset
Ref C20-IRB-54-03
CEER Report on Regulatory Frameworks for European Energy Networks 2020
31156
The accounting of regulated assets and capital expenditure shall be consistent and shall also continue in the event of changes in the ownership of the undertaking or the asset The calculation of the net assets underlying the network fees is as follows 1) Depreciation on fixed assets is calculated using the straight-line depreciation method 2) Depreciation rates for fixed assets are not justified if they differ substantially from the
depreciation rates set for similar life same uses and similar fixed assets or if the entity does not calculate the depreciation based on the useful (technical) life of the fixed assets
3) Depreciation is calculated based on the acquisition cost In this case deprecation of fixed assets to be included in the net fees is based on deprecation rate(s) set for assets acquired and
4) If necessary differentiation of fixed assets can be used using different depreciation rates of fixed assets
The working capital shall be calculated on the basis of 5 of the allowed revenue of the tariff year If necessary a more detailed working capital analysis may be performed The internal turnover of undertakings belonging to a vertically integrated group shall not be included in working capital accounts If necessary an additional working capital analysis shall be performed Justified Profitability The justified profitability to be included in the price shall be calculated on the basis of the fixed assets (both tangible and intangible assets) necessary for the provision of network services
Justified profitability (JP) is determined as the product of the regulated assets (RA) and the
WACC
The WACC is calculated using a capital structure of which 50 is debt capital and 50 equity and the same proportion shall also be taken as the basis in the case of all other regulated undertakings providing a similar service (ie a vital service provided by a dominating undertaking in the market eg electricity gas district heating water supply)
The risk-free rate of return is the average interest rate of German ten-year bonds in the preceding ten years plus Estoniarsquos state risk premium If Estonian government bonds exist the interest rate of the government bonds may be used as the risk-free rate of return As Estonia does not have long-term government bonds that are traded on the secondary market it is not possible to give a direct quantitative assessment on Estoniarsquos state risk This can only be done indirectly by comparing Estonia with countries that have issued state bonds The Ministry of Finance has recommended that the ECA take into account the average return on ten-year bonds of European countries with a credit rating similar to the one given to Estonia by rating agencies (SampPMoodyrsquosFitch) and use this to assess the return on Estoniarsquos long-term government bonds
The cost of debt is the sum of the risk-free rate of return (plus Estonia`s state risk premium) and the debt risk premium of the undertaking The cost of equity is calculated using the CAPM (capital assets pricing model) model (Ce = Rf + Rc + szlig x Rm) The value of the beta coefficient is determined on the basis of the relevant indicators of other European andor US regulated undertakings The market risk premium is determined on the basis of the long-term market risk premium of other European andor US undertakings
Ref C20-IRB-54-03
CEER Report on Regulatory Frameworks for European Energy Networks 2020
32156
Usually2 the ECA calculates WACC annually and publishes it on its website at wwwkonkurentsiametee
2 The period 2016-2019 was an exception because the German ten-year bonds in the preceding five years
decreased Therefore from 2020 the ECA introduced the German ten-year bonds in the preceding ten years
Ref C20-IRB-54-03
CEER Report on Regulatory Frameworks for European Energy Networks 2020
33156
27 Finland Gas TSO Gas DSO Electricity TSO Electricity DSO
Ma
rke
t
str
uc
ture
Network operators
1 19 1 77
Network length
~1200 km ~2000 km ~14500 km ~400000 km
Ownership State owned
State local public and private ownership
State and private ownership
State local public and private ownership
Ge
ne
ral
fra
me
wo
rk
Authority Energy Authority
System Revenue Cap
Period Current regulatory framework is set for 2 regulatory periods (2016-2019 and 2020-2023)
Base year for next period
No specific base year applied3
Transparency Decisions Regulatory Data Efficiency Scores Quality of networks
Main elements for
determining the revenue
cap
Efficiency- Quality- Innovation- and
Investment incentive WACC
return on RAB
Innovation- and Investment
incentive WACC return on RAB
Efficiency- Quality- Innovation- and
Investment incentive WACC
return on RAB
Efficiency- Quality- Security of supply-
Innovation- and Investment
incentive WACC return on RAB
Legal framework
Electricity market Act (5882013) Natural gas market Act (5872017) and Act on the supervision of the electricity and natural gas market (5902013)
Rate
of
retu
rn
Type of WACC Nominal pre-tax
Determination of the rate of
return on equity
Risk-free rate + betaMarket risk premium + Premium for lack of liquidity (+ additional risk premium for natural gas TSO and DSOs)
Rate of return on equity
before taxes
900 = (145+0695+06+
17) (1-02)
850 = (145+0695+06+
13) (1-02)
706 = (145+0725+06)
(1-02)
774 = (145+08285+06)
(1-02)
Use of rate of return
Reasonable return is calculated by multiplying the adjusted capital invested in network operations by the reasonable rate of return Therefore company receives reasonable
return on adjusted equity and interest-bearing debt invested in network operations
Reg
ula
tory
as
se
t b
as
e Components
of RAB Fixed assets working capital leased assets
Regulatory asset value
Regulatory asset value is calculated from network replacement value by applying network component-specific average age and lifetime selection
RAB adjustments
Book values taken to RAB annually from balance sheet
Dep
rec
iati
on
s Method Straight-line depreciation on replacement value of network Depreciation is inflation
corrected annually with CPI
Depreciation
ratio4 16 22 18 25
Consideration Depreciation level based on average adjusted straight line based on the selected component lifetimes Imputed straight-line depreciations are always allowed in full as far
as the component is in actual use
3 For electricity DSOs the average of regulatory data from years the 2015 ndash 2018 is used to determine the efficiency
incentive for the fifth regulatory period (2020 ndash 2023) The DSOsrsquo efficiency figure for fifth regulatory period was determined by the average of reasonable controllable operational costs (SKOPEX) and the average of realised controllable operational costs (KOPEX) from years 2015 ndash 2018 The efficiency frontier determining the individual DSOs SKOPEX was estimated by using regulatory data from years 2012 ndash 2018 For the electricity TSO and natural gas TSO the efficiency reference level (SKOPEX) is based merely on operators own historical costs In the first year of the regulatory period the average of the previous four-year regulatory period realised controllable operational costs is used as the benchmark for efficiency costs In the following years the benchmark will be the reasonable controllable costs of the previous year
4 Calculated Depreciation Replacement value of network
Ref C20-IRB-54-03
CEER Report on Regulatory Frameworks for European Energy Networks 2020
34156
Introduction In the Finnish energy sector the regulatory task is performed by the Energy Authority as an independent regulatory authority The responsibilities of the TSOs and DSOs are set by the Finnish Electricity Market Act and Natural Gas Market Act Guidelines for the regulatory procedures applied by the Energy Authority are provided by the Act on the supervision of the electricity and natural gas market The main objectives of regulation are the reasonableness of pricing and high quality of network services Therefore the Energy Authority seeks these with the entity formed by regulation methods specific incentives and with practical steering impacts of the methods on the network operatorrsquos business operations In addition to the main targets of regulation other key targets include equality and network development as well as the sustainability continuity development and efficiency of business operations Historical Development Until 2005 the Energy Authorityrsquos regulation methodology was ex-post regulation based on case-specific assessment Since 2005 determining reasonableness of the network operation prices has been based on ex-ante set regulation method with pre-defined regulatory periods Under this regime the allowed revenues are set for network operators before the start of the regulatory period The current regulatory period is four years but the methods are valid for two consecutive regulatory periods since the Electricity Market Act changed in 2013 Determining the Revenue Caps The Energy Authority does not regulate the actual charges and tariffs as TSOs and DSOs set them independently The regulation of the electricity grid and natural gas network services are based on the assessment of the reasonableness of the pricing in network services as a whole The method decisions are published before the start of the upcoming regulatory period and these method decisions determine how the allowed or target revenues are set for the period The supervision of the reasonableness of the pricing is direct to the accumulating entity comprised by different network service fees Regulatory methods consider capital invested in network operations and reasonable rate of return (WACC-) to it which constitute the reasonable return for a network operator In turn as a comparison to reasonable return is considered the realised adjusted profit from network operations which includes the effect of incentives The impact of incentives is deducted when calculating realised adjusted profits The incentive elements that are applied in regulatory methods varies between TSOs and DSOs and the set of incentives used are a quality incentive an efficiency incentive an innovation incentive a security of supply incentive and an investment incentive The Energy Authority monitors operatorsacute profits for the regulatory period and whether they exceed determined reasonable level If pricing exceeds the determined reasonable level the surplus will have to be returned to customers in the next regulatory periodrsquos pricing Efficiency Benchmarking Efficiency means that the service required by the customer is provided at the lowest cost possible The operation of a network operator is cost-effective when the input or costs used in its operations are as small as possible in relation to the output of operations The pricing of network operations is not subject to market pressure therefore the operator has no incentive to improve the efficiency of its operations In such a case without regulation any cost ineffectiveness could be compensated with higher prices The purpose of the efficiency incentive is therefore to encourage network operators to operate in a cost-effective way and to achieve a cost level that is achievable The Energy Authority applies efficiency incentives to the electricity TSO the natural gas TSO and the electricity DSOs Natural gas DSOs are not subject to efficiency incentives
Ref C20-IRB-54-03
CEER Report on Regulatory Frameworks for European Energy Networks 2020
35156
In the calculation of efficiency improvement potential the network operatorsrsquo realised controllable operational costs (KOPEX) is benchmarked with operatorsrsquo reasonable controllable operative costs (SKOPEX) For the electricity TSO and the natural gas TSO the efficiency reference level (SKOPEX) is based merely on operatorsrsquo own historical costs In the first year of the regulatory period the average of the previous four-year regulatory period realised controllable operational costs is used as the benchmark for efficiency costs In the following years the benchmark will be the reasonable controllable costs of the previous year With electricity DSOs the company-specific efficiency target is also observed by comparing individual DSOsrsquo KOPEX to DSOsrsquo SKOPEX DSOsrsquo reasonable controllable operational costs at an output level according to efficient operations are determined by using the efficiency frontier The efficiency frontier is estimated from combined cost and output data from all DSOs The variables included in the measurement of company-specific efficiency target consists of the input variables (KOPEX and replacement value of network) output variables (volume of transmitted energy number of metering points total length of the electricity network and regulatory outage costs) and operating environment variables (connectionsmetering points -ratio) In calculation of KOPEX and SKOPEX for the fourth regulatory period (2016 ndash 2019) the average of regulatory data for 2011 ndash 2014 was used and for the fifth regulatory period (2020 ndash 2023) the average of regulatory data for 2015 ndash 2018 The efficiency frontier was estimated for the fourth regulatory period by using regulatory data from 2008 ndash 2014 as the initial data for company specific efficiency measurement variables and these were adjusted with regard to the consumer price index to the 2014 level The efficiency frontier was re-estimated for the fifth regulatory period (2020 ndash 2023) in 2019 using regulatory data from 2012 ndash 2018 For electricity DSOs efficiency benchmarking has used the StoNED-method (Stochastic Non-Smooth Envelopment of Data) since 2012 In 2015 a method was developed further to its current form for regulatory periods 2016 ndash 2019 and 2020 ndash 2023 Quality Incentive The Energy Authority uses regulatory outage costs as a quality incentive Regulatory outage costs ie the disadvantage caused by outages are calculated based on the number and duration of outages as well as the unit prices of outages which are determined The DSOrsquos average realised regulatory outage costs for the two previous regulatory periods ie eight years are used as the reference level of regulatory outage costs The reference level is adjusted with the annual energy transmitted to the customers to make the reference level of regulatory outage costs comparable with the realised regulatory costs with respect to the transmitted energy The impact of the quality incentive is deducted when calculating realised adjusted profit The impact of the quality incentive is calculated so that the realised regulatory outage costs are deducted from the reference level of regulatory outage costs The maximum impact of the quality incentive in the calculation of realised adjusted profit is made reasonable The impact of the quality incentive may not be higher than 15 of the reasonable return in the year in question for electricity DSOs 3 for the electricity TSO and 2 for the gas TSO Natural gas DSOs are not subject to the quality incentive Innovation Incentive The purpose of the innovation incentive is to encourage the network operators to develop and use innovative technical and operational solutions in their network operations The key objectives of research and development activities are the development and introduction of smart grids and other new technologies and methods of operation As a result the network operator may incur research and development costs before the new technologies are in full
Ref C20-IRB-54-03
CEER Report on Regulatory Frameworks for European Energy Networks 2020
36156
use and utilisable The Energy Authority encourages the network operators to make active efforts in research and development by deducting reasonable research and development costs in the calculation of realised adjusted profit Acceptable research and development costs must be recorded in the unbundled profit and loss account as expenses as capitalised RampD costs are not accepted for inclusion in the calculation of the innovation incentive Acceptable research and development costs must be directly related to the creation of new knowledge technology products or methods of operation in network operations for the sector The impact of the innovation incentive is deducted when calculating realised adjusted profit The impact of the innovation incentive is calculated so that a share corresponding to a maximum of 1 of the DSOrsquos total turnover from network operations in the unbundled profit and loss accounts in the regulatory period are treated as reasonable research and development costs This incentive is applied to all network operators Investment Incentive The purpose of the investment incentive is to encourage DSOs and TSOs to make investments in a cost-effective manner and to enable replacement investments The investment incentive consists of the incentive impact of unit prices and the straight-line depreciation calculated from the adjusted replacement value The incentive impact of unit prices directs the network operators to invest more effectively than on average and to find more cost-effective methods of implementation than before The incentive impact arises from the difference between investments calculated with unit prices and the cost of realised investments Together with the net present value the incentive impact of the straight-line depreciation calculated from the network operatorrsquos adjusted replacement value directs the operator to maintain its network in accordance with the lifetimes it has selected in actual use as part of the network assets and enables the making of sufficient replacement investments The incentive impact arises from the fact that the methods allow for the operator an annual depreciation level based on average adjusted straight-line depreciation based on the lifetimes selected by the operator Imputed straight-line depreciations are always allowed in full as far as the component is in actual use Therefore imputed straight-line depreciation is calculated for the component even after the end of the lifetime if the component is still in actual use The impact of the investment incentive is deducted when calculating realised adjusted profit and this incentive is applied to all DSOs and TSOs Security of Supply Incentive With the new Electricity Market Act which entered into force in 2013 criteria for security of supply were set through a maximum duration of outage for electricity DSOs In order to implement the new security of supply obligations most of the electricity DSOs need to make extensive replacement investments and carry out maintenance For this reason the security of supply incentive was introduced into the methods for the fourth and fifth regulatory periods for the years 2016 ndash 2023 The write-downs of the security of supply incentive compensate for the demolition made regarding replacement investments which has been compulsory due to the security of supply criteria The write-downs of the security of supply incentive consider justifiable early replacement investments made in order to meet the security of supply criteria in so far as the investment incentive does not take them into account In other words the write-down of the security of supply incentive only compensates the potentially lost part of imputed straight-line depreciation which the DSO has not been able to predict when selecting the average lifetime for the fourth regulatory period
Ref C20-IRB-54-03
CEER Report on Regulatory Frameworks for European Energy Networks 2020
37156
The impact of the security of supply incentive is calculated by adding together the write-downs of the NPV residual value resulting from early replacement investments carried out to improve the security of supply and the reasonable costs of maintenance and contingency measures The security of supply incentive is only applied to electricity distribution system operators The minimum requirements of the security of supply set in the Electricity Market Act in 2013 and the transition to updated regulation methods in 2016 led to large tariff increases by a few large DSOs in Finland in 2016 In the aftermath of an extensive public debate the Energy Authority suggested amendments to the legislation and in 2017 the Electricity Market Act was changed in a way such that the DSOs are allowed to increase electricity transmission and distribution charges up to 15 compared to the charges collected during the 12 months prior to the increase Transparency The Energy Authority publishes regulatory methods decisions expert reports efficiency targets and the data used in the efficiency estimation on the Authorityrsquos website The Energy Authority also publishes the annually updated parameters regarding to the calculation of the reasonable pricing The Energy Authority has also prepared an Excel workbook for electricity DSOs to assess the reasonable return for the regulatory period and to evaluate the realised adjusted profit Outlook Although the current methodology is set out for two regulatory periods years 2016 to 2023 the Energy Authority strives to develop methodology in accordance with changing market conditions For example Energy Authority has ordered a survey about international regulatory methods supporting demand response
Ref C20-IRB-54-03
CEER Report on Regulatory Frameworks for European Energy Networks 2020
38156
28 France Gas TSO Gas DSO Electricity TSO Electricity DSO
Ma
rke
t
str
uc
ture
Network operators
2 26 1 ~143
Network length
~38000 km ~200000 km ~106000 km ~1400000 km
Ownership Private and public
ownership
Private and public ownership (indirect
and local)
Mainly public ownership (direct
and indirect)
Mainly indirect public ownership
Ge
ne
ral
fra
me
wo
rk
Authority Commission de Reacutegulation de lrsquoEnergie (CRE)
System Incentive Regulation Revenue cap
Period 4 years current period 2020-2024
4 years current period 2020-2024
4 years current period 2017-2021
Base year for next period
2nd year in current regulatory period
3rd year in current regulatory period
2nd year in current regulatory period
Transparency Cost data (detailed OPEX and CAPEX) WACC and its underlying parameters quality of service scores regulatory accounts
Main elements for
determining the revenue
cap
Non-controllable and controllable costs depreciation costs taxes and fair margin
Legal framework
French law (code de lrsquoeacutenergie) and CRE tariff decisions
Rate
of
retu
rn
Type of WACC Pre-tax real Pre-tax nominal NA
Determination of the rate of
return on equity
Sum of a nominal risk-free rate and a risk premium (market risk premium multiplied
by a beta risk factor) multiplied with a corporate tax factor and expressed in real
terms
Sum of a nominal risk-free rate and a
risk premium (market risk
premium multiplied by a beta risk
factor) multiplied with a corporate tax
factor
NA
Rate of return on equity
before taxes
86 = (17+52086)
(1-2802)
84 = (17+52083)
(1-2802)
97 = (27+50073)
(1-3443) NA
Use of rate of return
Multiplied with the whole RAB (except assets that were funded through subsidies or grants)
NA
Reg
ula
tory
as
se
t b
as
e Components
of RAB Fixed assets
Regulatory asset value
Historical revaluated costs (taking into account inflation and depreciation)
Net book value
RAB adjustments
Subsidies and grants are removed from the value of assets before entering the RAB
Dep
re-
cia
tio
ns Method Straight line
Depreciation ratio
Depending on asset type Ratio between 2 and 4 for network assets (lines pipes etc)
Consideration Integrated directly and with 100 (except assets that were funded through subsidies or grants)
due to the specificities of electricity distribution in France assets are not remunerated via a WACC
Ref C20-IRB-54-03
CEER Report on Regulatory Frameworks for European Energy Networks 2020
39156
Introduction In France the Commission de Reacutegulation de lrsquoEacutenergie (CRE) is the independent authority responsible for the regulation of electricity and gas markets CRE is in charge of setting up access rules and tariffs for the utilisation of electricity and gas grids It is also responsible for approving investments in upstream electricity and gas infrastructure (electricity and gas transmission gas storage and LNG terminals) In electricity there is a single Transmission System Operator (TSO) RTE which operates maintains and develops the high and very high voltage network With more than 100000 km of lines between 63000 and 400000 volts the network managed by RTE is the largest in Europe There are 143 electricity Distribution System Operators (DSOs) in France of various sizes Distribution is dominated by Enedis which operates 95 of the electricity distribution network representing 14 million km of lines and 35 million customers Six other DSOs serve more than 100000 customers (Geacutereacutedis SRD SER GEG URM and EDF SEI) and the remaining DSOs are local companies that serve less than 100000 customers In the gas sector there are two TSOs GRTgaz and Tereacutega (formerly TIGF) GRTgaz operates a pipeline network of approximately 32000 km Tereacutega operates a network of about 5000 km in South-West France Since 1 November 2018 with the implementation of Francersquos single market area there is only one market area but still two balancing zones one for each TSO who are each responsible for the balancing of its own area of operation On the distribution side there are 26 natural gas DSOs supplying about 115 million consumers GRDF is the main one with more than 96 of the market volume Reacutegaz-Bordeaux and Reacuteseau GDS each distribute to about 15 of the market while the 23 other DSOs represent less 1 of distribution in total TSO Certification and DSO Independence On 26 January 2012 CRE certified all the French TSOs under the Independent Transmission Operator (ITO) model Revisions were carried out for RTE and Tereacutega after changes in their shareholding RTErsquos certification was renewed by a decision on the 11 January 2018 Initially certified as an ITO Tereacutegarsquos status was changed in ownership unbundling (OU) on 3 July 2014 after a modification of the shareholding structure of the TSO Regarding DSOs CRE ensures they are effectively independent of their parent company For instance there must be clearly differentiation between companies engaged in the supply or production of gas or electricity within the vertically integrated company (Enterprise Verticallement Inteacutegreacutee or EVI) to which they belong This verification is based on internal organisation and governance rules operating autonomy and implementation of a compliance officer in charge of independence obligations and compliance with the code of good conduct Electricity Transmission and Distribution Tariffs In electricity the current transmission and distribution tariffs for RTE (TURPE-5 HTB) and Enedis (TURPE-5 HTA-BT) entered into force on 1 August 2017 for a period of approximately four years (in accordance with the CREs deliberations of 17 November 2016) During the elaboration process CRE conducted in-depth analyses of the projected expenses of French operators of practices in other European countries and on the evaluation of the WACC of electricity and natural gas infrastructure in France Operating expenditures and their comparison with those of other European network managers were also examined At the end of the process CRE largely kept the previous tariff structure while introducing some improvements regarding incentives relating to capital expenditures quality of service and losses
Ref C20-IRB-54-03
CEER Report on Regulatory Frameworks for European Energy Networks 2020
40156
Regarding distribution the tariff is equalised therefore the same applies for all DSOs Charges are calculated based on an average distribution cost plus a management fee and determined according to the level of voltage on which consumers are connected A specific device to ensure that the network operators have the necessary resources to meet the costs of research and development as well as deployment of smart grids has been introduced while encouraging operators to be efficient Gas Transmission Tariffs The tariff for the use of the GRTgaz and Tereacutega natural gas transmission networks is known as the ldquoATRTrdquo The current regulatory period (ATRT-7) entered into force on 1 April 2020 for a period of approximately four years It took into consideration the (EU) regulation 2017460 establishing a network code on harmonised transmission tariff structures for gas (ldquoTariff network coderdquo) and was adopted after extensive stakeholder consultation conducted in 2019 and relies on several studies which were published The ATRT7 tariff aims at giving gas TSOs the capacity to meet the challenges of the energy transition particularly with the development of bio-methane injection into the networks It also provides the capacity to take into account the changes in the gas market in the coming years especially to control the evolution of tariffs in a context marked by the expiration of certain long-term contracts and the end of major investment projects Gas Distribution Tariffs The sixth tariff period for the use of GRDFs natural gas distribution networks known as the ATRD-6 tariff entered into force on 1 July 2020 for a period of about four years As the previous tariff it encourages GRDF to improve its efficiency especially in a context of a drop in gas consumption while maintaining the gas distribution network at a maximum-security level It also aims at providing GRDF with the capacity to adapt to the energy transition in particular regarding the development of smart metering the injection of bio-methane and research and development activities The ATRD-6 tariff also includes the estimated expenses related to the ldquogas conversionrdquo project (converting the L gas zone to an H gas zone)
Ref C20-IRB-54-03
CEER Report on Regulatory Frameworks for European Energy Networks 2020
41156
29 Germany Gas TSO Gas DSO Electricity TSO Electricity DSO
Ma
rke
t
str
uc
ture
Network operators
16 ~700 4 ~880
Network length
~40000 km ~500000 km ~37000 km ~1800000 km
Ownership Mainly private investors indirect public ownership
Private and local public ownership
Mainly private investors indirect public ownership
Private and local public ownership
Ge
ne
ral
fra
me
wo
rk
Authority
Bundesnetzagentur
(wwwbundesnetzagenturde)
Bundesnetzagentur and federal state
authorities depending on size and network area
Bundesnetzagentur
(wwwbundesnetzagenturde)
Bundesnetzagentur and federal state
authorities depending on size and network area
System Incentive Regulation Revenue cap
Period 5 years current period 2018-2022 5 years current period 2019-2023
Base year for next period
3rd year in current regulatory period
Transparency Efficiency scores revenue caps
Main elements for
determining the revenue
cap
Non-controllable and controllable costs TOTEX
efficiency benchmark general
inflation and sectoral productivity factor volatile costs
Non-controllable and controllable costs TOTEX
efficiency benchmark
efficiency bonus general inflation and sectoral productivity factor volatile costs
Non-controllable and controllable costs TOTEX
efficiency benchmark general
inflation and sectoral productivity factor volatile costs
Non-controllable and controllable costs TOTEX
efficiency benchmark
efficiency bonus general inflation and sectoral productivity
factor quality element volatile
costs
Legal framework
EnWG ARegV GasNEV EnWG ARegV StromNEV
Rate
of
retu
rn
Type of WACC No use of WACC Determination of the rate of
return on equity
Sum of a nominal risk-free rate and a risk premium (market risk premium multiplied with a beta risk factor) multiplied with a corporate tax factor
Rate of return on equity
before taxes 691 = (249+38083) 1225
Use of rate of return
Granted for existing assets to a maximum of 40 of the imputed necessary business assets Any available equity capital in the capital structure in excess of this will be subject
to another equity interest rate
Reg
ula
tory
as
se
t b
ase
Components of RAB
Fixed assets working capital assets under construction
Regulatory asset value
Net substance preservation for business assets capitalised prior to 1st January 2006 real capital preservation for business assets as from 1st January 2006
RAB adjustments
By the ordinance defined investments after the base year
eg expansions lead to an
adjustments of the non-controllable
costs and therefore of the revenue cap
Investments in new assets after the
base year lead to an adjustment of the
CAPEX No distinction between replacements and enhancements or
expansions
By the ordinance defined investments after the base year
eg expansions lead to an
adjustments of the non-controllable
costs and therefore of the revenue cap
Investments in new assets after the
base year lead to an adjustment of the CAPEX No
distinction between replacements and enhancements or
expansions
Dep
re-
cia
tio
ns Method Straight line
Depreciation ratio
Depending on asset type Ratio between 15 and 4 eg lines amp cables ~2 stations ~4
Consideration Part of the examined controllable costs
Ref C20-IRB-54-03
CEER Report on Regulatory Frameworks for European Energy Networks 2020
42156
Introduction The electricity and gas networks are examples of what are known as natural monopolies where effective competition is restricted or does not exist at all To ensure that network operators (DSOs = Distribution System Operators TSOs = Transmission System Operators) do not make any monopoly profits but still operate their networks as cost effectively as possible the electricity and gas network operators are subject to regulation This task is performed by the Bundesnetzagentur (BNetzA) as the regulatory authority responsible in Germany for the networks in various sectors including electricity and gas BNetzA is responsible for regulating all operators with more than 100000 customers or whose network area covers more than one federal state All other network operators are regulated by the regulatory authorities in the federal states These federal state authorities can however also delegate regulation to BNetzA Historical Development Regulation by BNetzA began in 2005 as cost-plus regulation An incentive-based regulatory regime was introduced in 2009 to replace cost-plus regulation Under this regime the revenue that network operators are allowed to earn within a certain period (regulatory period) is determined using a mathematical formula and is fixed for the period It therefore makes sense (incentive) for network operators to lower their costs within the regulatory period (work efficiently) so as to increase their profits within the limits of the framework (revenue (fixed) minus costs (controllable) equals profit) Determining the Revenue Caps The revenue caps for network operators are set for a five-year regulatory period Each cap is composed of the permanently non-controllable costs temporarily non-controllable costs controllable costs (applying a distribution factor for reducing inefficiencies) a possible efficiency bonus (DSOs only) general inflation relative to the base year and a general sectoral productivity factor a CAPEX in period top-up to take account of the cost of capital for investments after the base year (DSOs only) quality element (electricity DSOs only) and volatile costs The difference between the allowed revenue and the development of actual volumes over the year is entered into a regulatory account Efficiency Benchmarking BNetzA carries out its efficiency benchmarking on the basis of the cost examination (TOTEX) and structural data validation before the start of each new regulatory period for gas and electricity network operators separately The efficiency benchmarking involves assessing the operators individual costs against the services they provide and determining each operators cost efficiency compared to the other operators In addition to the (input) cost parameters structural (or output) parameters are taken into account to replicate the services provided in each case as well as the regional characteristics Possible structural parameters could e g include the number of connection points peak load the amount of energy delivered or injected and transformer and compressor station data The costs and structural data collected always relate to the base year which is always the third year of a regulatory period The costs data mainly comprise staff and materials costs interest on borrowings depreciations and other operating costs Depreciations are prescribed in the regulations and are based on technical asset lives The costs data is supplemented by a calculated return on equity Anyone investing in a business enterprise expects a return on the capital employed that is competitive and reflects
Ref C20-IRB-54-03
CEER Report on Regulatory Frameworks for European Energy Networks 2020
43156
the industry-specific risks This return is usually a result of market forces and depends on the individual sector and the general level of interest rates If there is an imbalance between the risk of investment and potential earnings as a rule there will be no investment However since network operators ndash by virtue of their natural monopoly ndash are not fully subject to these market mechanisms yet still need to make vital investments in infrastructure the rate of return on equity is determined by the regulator The return on equity comprises a risk-free rate (determined on the basis of the ten-year average current yield of fixed-interest securities) and a risk premium The premium covering network-specific risks is determined using the capital asset pricing model (CAPM) and is derived from the product of an imputed market risk premium and a risk factor (beta factor) Corporate tax is accounted for through a factor applied to the sum of the risk-free rate and the risk premium Trade tax is by contrast determined on the basis of the return on equity The rate of return on equity is different for new and old assets The return on equity comprising the risk-free rate the risk premium and the corporate tax factor is applicable to new assets that first existed in or after 2006 A rate adjusted to take account of inflation is applicable to old assets that existed before 2006 The rate of return on equity is granted for existing assets to a maximum of 40 of the imputed necessary business assets Any available equity capital in the capital structure in excess of this will be subject to another equity interest rate This equity II interest rate is aligned with the standard rates of interest for procured capital and is set as a ten-year average based on the yields published by the German Bundesbank (federal bank) Existing borrowed capital is recognised at equal value insofar as any interest on borrowings does not exceed the customary market interest rate for comparable loans The costs known as the permanently non-controllable costs are deducted from this cost pool (materials costs staff costs costs of borrowing taxes other costs write-downs and return on equity minus revenue and income with cost-reducing effect) Permanently non-controllable costs are for example upstream network costs non-wage labour costs and concession fees Network operators can fully recoup the permanently non-controllable costs as revenue From the third regulatory period (2018 for gas and 2019 for electricity) there is an annual subtraction of the capital cost for the DSOs This subtraction takes account of the fall in capital expenditure for the asset base (total costs of depreciation the return on equity and the corporate tax each of which is imputed plus the costs of borrowing) over the duration of the regulatory period The CAPEX subtraction is also deducted from the cost pool The remaining controllable costs data and the structural data are then taken for the efficiency benchmarking model The structural cost parameters for all network operators are used to define groups or combinations of parameters that reflect the services provided by the network operators The optimum size of the parameter groups is also examined and defined The efficiency scores for the network operators are determined by applying the data envelopment analysis (DEA) and stochastic frontier analysis (SFA) methods to the defined parameter groups Since efficiency benchmarking is a comparative method the results for the individual network operators have a mutual influence on each other A network operator that provides the same scope of services as but has higher costs than another operator (100 efficiency) will have an efficiency score lower than 100 The efficiency scores are then applied to the controllable costs (total costs
Ref C20-IRB-54-03
CEER Report on Regulatory Frameworks for European Energy Networks 2020
44156
minus permanently non-controllable costs minus CAPEX subtraction) A network operator with an efficiency score of 80 for example will need to remedy the 20 of inefficiencies over the course of the upcoming regulatory period Each of the two methods used (DEA and SFA) offers only a restricted approach to determining efficiency scores This is why both methods are applied to determine more than one efficiency score for each network operator The network operators costs are also adjusted to take account of the networks different lifetime structures The DEA and SFA methods are then applied to determine further efficiency scores using these standardised costs Each network operator is then given the highest of the four efficiency scores calculated If the efficiency score calculated for a network operator using the two methods is lower than 60 the score is raised to 60 as the set minimum efficiency level A maximum efficiency level of 100 is also set The results are also examined to identify any network operators that appear as outliers and whose efficiency scores clearly dominate the efficiency scores of other network operators These network operators are no longer taken into account in the benchmarking and are given a fixed score of 100 without having any further influence on the efficiency scores of the other network operators The most efficient DSOs are eligible for a bonus added to the revenue cap on the basis of a super-efficiency analysis this bonus is limited to a maximum value of 5 This gives operators an incentive beyond the end of a regulatory period to improve efficiency in the long term even if they have already achieved an efficiency score of 100 General Sectoral Productivity Factor and Price Development Another component of the revenue cap is the general sectoral productivity factor which is always applicable for one regulatory period This factor is determined using scientific methods from the divergence between productivity gain in the network industry and productivity gain in the economy as a whole The idea behind this factor is to imitate market forces and thus simulate competitive pressure It is assumed that where competition exists productivity gains will lead to lower costs for companies and companies will pass on this competitive advantage to customers in the form of lower prices so as to attract customers away from competitors The productivity factor has the effect of reducing revenues The revenue caps also take account of the development of consumer prices in relation to the base year (CPI-X regime) General price increases lead to an increase in the revenue cap Quality Regulation Under a regulatory regime that provides incentives to cut costs there is a risk that operators will refrain from undertaking the necessary investments or measures in order to achieve the required or potential savings To counter this the regime includes quality regulation for electricity distribution networks This takes the form of a quality element in the formula for setting the revenue caps Operators achieving above-average quality in past years will have an amount added to their cap while operators with comparatively poor quality levels will have amounts deducted (bonuspenalty system) Adjusting the Revenue Caps After the Reference Year A CAPEX in period top-up for DSOs ensures that the revenue cap can be adjusted in line with the cost of capital for investments in new assets after the reference year No distinction is made here between replacement and enhancement or expansion expenditure Operators must apply for the top-up six months in advance
Ref C20-IRB-54-03
CEER Report on Regulatory Frameworks for European Energy Networks 2020
45156
TSOs (and in some cases DSOs) are able to refinance their necessary expansion and restructuring investments through investment measures Proposed expansion and restructuring investments can be approved provided they are required for the stability of the system as a whole incorporation into the national or international interconnected grid or expansion of the network to meet energy supply requirements Investments approved under the investment measures are factored into the revenue cap as permanently non-controllable costs In the event of changes in other permanently non-controllable costs of a network operator in the course of a regulatory period the revenue cap and thus the network charge can be adjusted accordingly National Specificities Electricity (Gas) DSOs with fewer than 30000 (15000) customers can choose to participate in what is known as the simplified procedure and are then not subject to efficiency benchmarking The efficiency score applicable to these operators is the weighted average of all adjusted efficiency levels from the national benchmarking exercise in the previous regulatory period For companies subject to the simplified procedure the portion allocated to permanently non-controllable costs is fixed at a flat rate of 5 Transparency The data published on the regulatory authorityrsquos websites include revenue caps and annual adjustments efficiency scores and efficiency bonuses Outlook There are currently no further plans to fundamentally change the incentive-based regulatory regime in Germany Various changes were made to the regime in 2016 Currently there are plans to introduce more incentives for supporting the grid extension related to the energy transition and for supporting the decrease of grid bottlenecks and the related costs of operating with these grid bottlenecks
Ref C20-IRB-54-03
CEER Report on Regulatory Frameworks for European Energy Networks 2020
46156
210 Great Britain Gas TSO Gas DSO Electricity TSO Electricity DSO
Ma
rke
t
str
uc
ture
Network operators
1 8 3 14
Network length
~7000 km ~265000 km ~25000 km ~800000 km
Ownership Private ownership Private ownership Private ownership Private ownership
Ge
ne
ral
fra
me
wo
rk
Authority GEMA (Gas and Electricity Markets Authority)
System Revenue Cap based on Rate-of-Return with Incentive-based Regulation
Period 8 years Current period 2013-21
8 years Current period 2015-23
Base year for next period
Transparency Full transparency through extensive consultation and publication
Main elements for determining
the revenueprice
cap
Bottom-up capital and operating expenditure (CAPEX and OPEX) benchmarkinganalysis complemented by top-down total expenditure (TOTEX) benchmarking efficiency
considerations RAB WACC RPI Real Price Effects performance against incentive schemes
Legal framework
Gas Act 1986 Electricity Act 1989 Utilities Act 2000 Competition Act 1998 Enterprise Act 2002 and measures set out in a number of Energy Acts
Rate
of
retu
rn
Type of WACC
Vanilla Real WACC
Determination of the rate of return on
equity
Sum of risk-free rate and a market risk premium multiplied by equity beta
Rate of return on equity
before taxes
Electricity transmission 7 Electricity distribution 6 Gas transmission 68 Gas distribution 67 (all in real terms)
Use of rate of return
Multiplied by the average period RAB
Reg
ula
tory
as
se
t b
as
e
Components of RAB Historical investment base (less depreciation removals) and capitalised element of total
expenditure in current control period
Regulatory asset value
Gas TSO pound5bn Gas DSO pound168bn Electricity TSO pound13bn Electricity DSO pound213bn
RAB adjustments
Annually updated for RPI and allowed additions less regulatory depreciation and cash proceeds from disposals
Dep
re-
cia
tio
ns Method Straight line for all except Gas DSO which is sum of digits
Depreciation ratio
Generally 45 years but some exceptions to avoid cliff edge effects
Consideration
Introduction
Ofgem is the Office of Gas and Electricity Markets5 It is a non-ministerial government department and an independent National Regulatory Authority recognised by EU Directives Ofgemrsquos principal objective when carrying out its functions is to protect the interests of existing and future electricity and gas consumers Ofgem works effectively with but is independent of government the energy industry and other stakeholders within a legal framework determined by the UK government
5 Note Ofgem regulates markets in Great Britain but not in Northern Ireland
Ref C20-IRB-54-03
CEER Report on Regulatory Frameworks for European Energy Networks 2020
47156
Ofgem is governed by the Gas and Electricity Markets Authority (GEMA) The Authority determines strategy sets policy priorities and makes decisions on a wide range of regulatory matters including price controls and enforcement Historical Development GB gas networks were privatised in 1986 and electricity networks in 1989 The form of regulation initially chosen was ldquoRPI-Xrdquo whereby the regulator limits average network charges from rising by more than the rate of inflation (measured by the Retail Price Index) less an efficiency factor (called X) Since the revenues for the regulated company are set ahead of the regulatory period it incentivises the company to reduce expenditure as much as possible to maximise profits This price revelation can then be used to set allowances for the next regulatory period allowing consumers to benefit from the resulting lower costs Although costs came down significantly over the course of successive iterations of price controls RPI-X was found to have a number of issues companies sometimes compromised on quality of service to maximise profits they had poor incentives to invest in the introduction of innovation and the regime had a bias towards capital intensive solutions Accordingly in 2013 Ofgem moved to the ldquoRIIOrdquo price control framework which is Revenues = Innovation + Incentives + Outputs Under RIIO companies are held accountable for delivering a high quality of service through the use of output targets they are given financial incentives and a longer control period to encourage investment in innovation projects and the bias towards capital spending was removed through the use of TOTEX allowances which means that a fixed proportion of a companyrsquos total expenditure is added to the RAB irrespective of whether it comprises capital or operating expenditure Determining the Revenue Caps The revenue caps for network operators are set for an eight-year regulatory period The current regulatory period for gas amp electricity transmission and gas distribution is April 2013 ndash March 2021 for electricity distribution the period is April 2015 ndash March 2023 The allowed revenues are built up as per the following diagram
Ref C20-IRB-54-03
CEER Report on Regulatory Frameworks for European Energy Networks 2020
48156
Baseline TOTEX is set taking a view on justification of investment and then if justified making an allowance for efficient costs Network operators are incentivised to beat these allowed costs through a sharing mechanism which allows them to keep a share of any underspend or bear a proportion of any overspend These revealed costs then help to set benchmarks for the cost levels in the following price control period Efficiency Requirements Investment plans for the entire regulatory period are approved ex-ante on the basis of established needs case and the having a positive cost benefit analysis Operators are allowed efficient costs and incentivised to beat these through a profitloss sharing mechanism Where costs or timing of investment need are not clear there are uncertainty mechanisms that allow for a revisiting of the justification at a later stage of the control period The efficient allowances will sometimes take consideration of factors such as efficiency gains (to mimic the expected gains in productivity that occur in competitive markets) and real price effects (those unavoidable business costs that develop at a different rate to the RPI annual revenue indexation) Price Development The allowed revenues are indexed to the retail prices index in relation to the base year and also take into account real price effects Quality Regulation Network operators have to meet performance outputs specified in their licences the categories of output are common within sectors but vary between sectors The performance targetsrequirements vary from licensee to licensee Failure to deliver outputs can be met by a variety of measures financial penalties claw back of revenues and in extreme cases enforcement action Adjustments after the Reference Year Each year Ofgem recalculates revenue allowances due to inflation investment non-controllable (pass-through) operating and maintenance costs licensee specific mechanisms and incentives This adjustment is done on an annual basis and feeds into tariffs that come into effect two years afterwards Transparency Price controls are set following extensive stakeholder consultation typically over a two-to-three-year timeframe in advance of the regulatory period Submissions responses and decisions are all published on the Ofgem website (subject to commercial confidentiality restrictions) Licensees are obliged to send in annual returns and Ofgem publishes reports that monitor how the licensees are performing against the price control settlement
Ref C20-IRB-54-03
CEER Report on Regulatory Frameworks for European Energy Networks 2020
49156
211 Greece Gas TSO Gas DSO Electricity TSO Electricity DSO
Ma
rke
t
str
uc
ture
Network operators
1 3 1 1
Network length 1466 km 6382 km 17340 circuit km 241179 circuit km
Ownership Private investors and State ownership
State ownership and private investors
State ownership and private investors
State ownership and private investors
Ge
ne
ral
fra
me
wo
rk
Authority Regulatory Authority for Energy (RAE)
System Cost plus Revenue cap Revenue cap Cost Plus
Period 4 years current period 2019-2022
4 years current period 2019-2022
4 years current period 2018-2021
1 year
Base year for next period
Year t-2 (actual) amp year t-1 (estimates)
Transparency Decisions Regulatory data Specific cost data
Main elements for determining
allowed revenue
OPEX (Non-controllable and
controllable costs) Depreciation
RAB (Assets and approved
investment plans working capital)
WACC
OPEX (Non-controllable and
controllable costs) Depreciation RAB
(Assets and approved
investment plans working capital)
WACC and WACC premium
OPEX (Non-controllable and
controllable costs) Depreciation RAB
(Assets and approved
investment plans working capital)
WACC and WACC premium
OPEX (Non-controllable and
controllable costs) Depreciation RAB
(Assets and approved
investment plans working capital)
WACC
Legal framework
Law 40012011
Rate
of
retu
rn
Type of WACC Nominal pre-tax Nominal pre-tax Real pre-tax Nominal pre-tax
Determination of the rate of
return on equity
WACC a) CAPM amp additional country risk premium for cost of equity and b) cost of debt based on operatorsrsquo proposal and actual figures of base year
Rate of return on equity
before taxes 876 875 83 780
Use of rate of return
WACC is applied on the value of Regulatory Asset Base (RAB) for each year of the Regulatory Period
Reg
ula
tory
as
se
t b
as
e Components of
RAB Fixed assets working capital assets under construction
Regulatory asset value
Historical costs Historical costs since 2009 (last revaluation
in 2004)
RAB adjustments
No adjustments historical values6
Dep
re-
cia
tio
n Method Straight line
Depreciation ratio
Most assets are depreciated over a period of 25-50 years
Consideration Depreciation ratio depends on asset type and it is integrated directly into the revenues
6 Only for Electricity TSO since Allowed Revenue is calculated in real terms an adjustment of RAB is taken place
based on CPI
Ref C20-IRB-54-03
CEER Report on Regulatory Frameworks for European Energy Networks 2020
50156
Introduction Electricity and natural gas networks are characterised as ldquonatural monopoliesrdquo in which effective competition is limited or does not exist at all In this context to ensure that network operators do not abuse their dominant position ie provide non-discriminatory access to the network at tariffs that reflect conditions of healthy competition and to stimulate cost effective operation of the network Transmission System Operators (TSOs) and Distribution System Operators (DSOs) are subject to regulation This task is performed by the Regulatory Authority for Energy (RAE) RAE among other tasks oversees and regulates the electricity and natural gas network operators in Greece Electricity transmission and distribution in Greece are conducted by one TSO (ADMIE-IPTO) and one DSO (HEDNO) Regarding natural gas there is one TSO (DESFA) and three DSOs (EDA Attikis EDA Thess7 DEDA) There is also a separate electricity DSO (privately owned) operating the network of Athens International Airport The Athens International Airportrsquos Electricity Grid Manager is regulated However only accounting obligations are applied since it has less than 100000 customers (Directive 722009) Historical Development Unbundling Following the Energy Law 40012011 the Public Power Corporation (PPC SA) established a 100 subsidiary ADMIE SA according to the Independent Transmission Operator (ITO) model In 2012 RAE certified ADMIE SA as the independent power transmission system operator and since 2017 ADMIE SA has followed the model of Ownership Unbundling and the shareholding structure is 51 Greek State (through ADMIE HOLDINGS Inc and DES ADMIE SA) 24 State Grid Europe Limited and 25 other institutional and private investors HEDNO SA (Hellenic Electricity Distribution Network Operator SA) was formed by the separation of the Distribution Department from PPC SA according to Law 40012011 and in compliance with 200972EC EU Directive HEDNO SA is a 100 subsidiary of PPC SA (51 owned by Greek State and 49 by institutional investors amp general public) however it is fully independent in operation and management retaining all the independence requirements that are incorporated within the aforementioned legislative framework HEDNO is organised as a distribution operator based on the ISO model PPC SA retains the ownership of distribution assets HEDNO is also the designated system amp market operator of the non-interconnected island electricity systems The Hellenic Natural Gas TSO (DESFA SA) was privatised during 2018 and the companyrsquos shareholding structure is now 34 the Greek State and 66 SENFLUGA SA (a consortium of the companies SNAM ENAGAS and FLUXYS) The three Natural Gas DSOs (EDA Attikis EDA Thess and DEDA8) were unbundled from supply activities in 2017 Tariff Regulation According to law9 RAE approves tariff setting methodologies for all non-competitive activities and sets relevant overarching principles and criteria Explicit allowed revenue methodologies are currently in place for electricity transmission (since 2015) gas transmission (since 2012) and for gas distribution (since 2016) The regulatory model is essentially a multi-year revenue-
7 Operator of the Natural Gas Distribution Network within the geographical areas of Thessaloniki Prefecture and
Thessaly Region 8 Operator of the Natural Gas Distribution Network for the Rest of Greece apart from Attiki and Thessaloniki ndash
Thessalia 9 Law 27731999 and Law 40012011
Ref C20-IRB-54-03
CEER Report on Regulatory Frameworks for European Energy Networks 2020
51156
cap on OPEX and cost-plus on CAPEX Allowed revenue for electricity distribution is currently calculated by relying on the principles underpinning the electricity transmission revenue methodology adapted to single-year regulatory periods and applied broadly as cost-plus on both OPEX and CAPEX Regulatory Decision Process Given the allowed revenue methodologies in place for the next period the process starts with regulatory submissions by operators due not later than seven months before the start of the next regulatory period The decision setting allowed revenue for the next period is issued two months before its start Decisions are taken separately for each TSO and DSO in the natural gas and electricity sectors Main Principles of the Tariff Regulation The Regulatory Period Duration of the regulatory period is set as part of the allowed revenue methodology decision For electricity and gas TSOs as well as for gas DSOs a four-year Regulatory Period applies10 For the electricity DSO the regulatory period can be set from three to five years defined also as part of the allowed revenue methodology decision (to be issued in 2020) The base (reference) year for all operators is year 119905 minus 2 Determining Allowed Expenditures The main building blocks of allowed revenue (OPEX and CAPEX) are determined in separate processes CAPEX streams are derived by approved network development plans (ten-year plan for electricity and gas TSO five-year plan for electricity and gas DSOs) that apply for the regulatory period under review These can be modified on an annual basis and are approved separate from allowed revenue decisions Modifications to approved development plans during a regulatory period are considered in ex-post treatment of CAPEX OPEX streams are determined in the context of the allowed revenue decision RAE set a reasonable OPEX allowance for the next period scrutinising operatorsrsquo expenditure proposals based on past performance and forecasts considering changes in relevant drivers conditions statutory and regulatory requirements etc Regulatory Asset Base ndash Depreciation The Regulatory Asset Base (RAB) includes the estimated capital employed for the regulated network activity for every year of the regulatory period which includes the following
i Undepreciated value of fixed assets (+) ii Assets under construction (+) iii Working capital (+) iv Grants and Contributions from Third Parties (-)
Depreciation is calculated for every year of the regulatory period for all assets that are expected to be in service during that year excluding assets funded by third parties Assets under construction are remunerated only for return on employed capital
10 In the recent past regulatory periods of three years were implemented while the current regulatory period for
gas TSO is 2 years (2017-2018)
Ref C20-IRB-54-03
CEER Report on Regulatory Frameworks for European Energy Networks 2020
52156
For the electricity TSO (ADMIE) and DSO (HEDNO) the historical values of 2009 have been considered (two revaluations took place before 2009 in 2000 and 2004 and the relevant surplus has been included in historical values) Since then no revaluation has been considered For the natural gas TSO and DSOs historical values are considered WACC and WACC Premium A weighted average cost of capital (WACC) is calculated as a rate of return for capital employed (RAB) WACC is estimated in real terms (pre-tax) only for the electricity TSO (since 2015) while for all the other operators a nominal pre-tax WACC is used Due to specific country conditions an extra premium (Country Risk Premium) is added to CAPM model For the electricity TSO and for specific projects that are characterised as Projects of Major Importance in the TYNDP a premium rate of return can be provided in addition to WACC The percentage of this premium varies between 1 and 25 and is decided by RAE For gas DSOs RAE can increase the allowed return (WACC) by 15 according to specific objectives (defined by RAE) mainly aiming to increase natural gas consumption WACC Calculation
119882119860119862119862119901119903119890minus119905119886119909119899119900119898119894119899119886119897 = 119892 lowast 119903119889 + (1 minus 119892) lowast 119903119890(119905 minus 1)
119903119890119901119900119904119905minus119905119886119909119899119900119898119894119899119886119897 = 119903119891 + 120573119890119902119906119894119905119910 lowast 119872119877119875 + 119862119877119875
Parameters electricity natural gas
Transmission (2020)
Distribution11 (2019)
transmission (2020)
distribution (2020)
Nominal risk-free rate 070 047 035 035
Country Risk Premium (CRP) 180 200 180 180
Cost of Debt 504 460 393 308
Market premium 500 530 530 530
Equity beta 067 060 080 080
Cost of Equity (pre-tax) 83 780 876 875
Gearing - D(D+E) 3627 2715 1890 1800
Tax rate12 2800 2800 2700 2700
Nominal pre-tax WACC 710 697 784 773
Treatment of OPEX amp CAPEX ndash Efficiency Incentives Except for extraordinary allowed revenue revisions the electricity TSOrsquos and gas DSOsrsquo OPEX allowances are not subject to ex-post adjustment or settlement either during or after the regulatory period As there is no efficiency sharing mechanism currently in place the scheme provides some incentives to these operators to operate more efficiently The electricity DSO is provided with similar incentives although these are further limited to plusmn3 of OPEX allowance deviations beyond this threshold are potentially subject to settlement ex-post
11 The relevant decision for 2020 is to be issued The above figures are according decision 5722019 for the Allowed
Revenue of 2019 12 At the end of 2019 according to Law 46462019 tax rate has been reduced to 24
Ref C20-IRB-54-03
CEER Report on Regulatory Frameworks for European Energy Networks 2020
53156
OPEX allowance of the gas TSO is fully adjusted based on actual figures (cost-plus approach) CAPEX is treated on a cost-plus basis for both electricity and gas TSOs and DSOs with settlements for differences between approved and realised expenditure carried out both on annual basis and at the end of the regulatory period Extraordinary Revisions of Allowed Revenue Extraordinary revisions of the allowed revenue can be performed in case of a substantial change on the legal economic or actual data that were considered when calculating the allowed revenue has occurred Adjusting During a Regulatory Period Inflation adjustments are made for all network operators during the regulatory period apart from the electricity DSO which has a one-year regulatory period Outlook Key plans to further develop the regulatory regime for electricity networks in Greece include introducing for the electricity DSO
bull a multi-year regulatory period (three-five years)
bull a revenue-cap methodology (probably for OPEX during the first period)
bull incentives to reduce network losses (penaltyreward scheme) and
bull a quality regulation (minimum guaranteed standards complemented with a penaltyreward scheme in the following period)
Ref C20-IRB-54-03
CEER Report on Regulatory Frameworks for European Energy Networks 2020
54156
212 Hungary Gas TSO Gas DSO Electricity TSO Electricity DSO
Ma
rke
t
str
uc
ture
Network operators
1 10 1 6
Network length
5874 km 83872 km 4856 km 161800 km
Ownership Private Ownership
2 state-owned 8 private
Public 1 public 5 private
Ge
ne
ral
fra
me
wo
rk
Authority Hungarian Energy and Public Utility Regulatory Authority (httpwwwmekhhuhome)
System Incentive Regulation
Period 4 years current period 2017 Jan-2021 Sep (longer than 4 years due to the change from Jan-Dec regulatory periods to Oct-Sep
periods)
4 years current period 2017-2020
Base year for next period
2018 2019 2019
Transparency The methodological guidelines for determining the justified costs and maintaining the prices during the regulation period are available on HEA website
Main elements for
determining the allowed
revenue
Allowed revenue is composed of
OPEX CAPEX Depreciation (all
adjusted to account for inflation)
efficiency improvement factor for OPEX (CPI-X)
Allowed revenue is composed of OPEX
CAPEX Depreciation (all
adjusted to account for inflation)
efficiency improvement factor for OPEX (CPI-X)
Hybrid model Hybrid model
Legal framework
Act 40 of 2008 on natural gas
Commission Regulation
2017460 (TAR NC)
Act 40 of 2008 on natural gas
Act 86 of 2007 on electricity
Rate
of
retu
rn
Type of WACC Real pre-tax
Determination of the rate of
return on equity
Sum of the real risk-free rate and risk premium (equity beta multiplied by market risk premium)
Rate of return on equity
before taxes 614 = (0188+1689+430072((1-019) 620 = (188+430073)(1-019)
Use of rate of return
WACC is multiplied with the whole value of RAB to calculate the return on capital
Reg
ula
tory
as
se
t
ba
se
Components of RAB
Tangible assets Fixed assets
Regulatory asset value
Network assets depreciated replacement value Non-network assets historical costs
RAB adjustments
The assets of the base year are modified yearly with modified CPI and T-1 yearrsquos
investments which were approved by the Authority
The assets of the base year are modified yearly with CPI and T-1 yearrsquos investments
minus depreciation minus connection charges
Dep
re-
cia
tio
ns Method Straight line
Depreciation ratio
Depending on asset type the useful lifetime (years) pipeline 50 compressor station 20
gas delivery station 30
Depending on asset type Ratio between 25 and 7 eg lines amp cables ~25
stations ~333
Consideration Based on expected useful lifetime Based on expected useful lifetime
Ref C20-IRB-54-03
CEER Report on Regulatory Frameworks for European Energy Networks 2020
55156
Introduction The electricity and gas networks are examples of what are known as natural monopolies where effective competition is limited or does not exist at all To ensure that network operators (DSOs and TSOs) do not make any monopoly profits but still operate their networks as cost effectively as possible the electricity and gas network operators are subject to regulation Electricity Historical Development Regulation began in Hungary after privatisation in 1997 with the first four-year regulatory period The regulation was incentive-based from the beginning but there were gradual changes in each period The developments in the electricity and gas sectors ran in parallel but there were some differences In electricity separate network tariffs have existed since 2003 The Capital Asset Pricing Model was first applied in the 2005-2008 pricing period while benchmarking was introduced in the 2009-2012 pricing period The present regulatory period has seen a transition from price caps to revenue caps as the quantity changes of the distributed energy are taken into account Determining the Price Caps The Hungarian incentive regulation is a price-cap-like system The price caps for network operators are set at the beginning of the four-year regulatory period The cap is calculated from the justified costs (operation amp maintenance (OampM) depreciation capital costs (RAB multiplied with WACC) network loss) and the transmitted or distributed energy The justified costs are determined through a detailed cost review Concerning the OampM cost there is an efficiency benchmarking the Regulatory Asset Base and the depreciation are calculated from the depreciated replacement value and the expected lifetime of the assets Efficiency Benchmarking The Hungarian Energy and Public Utility Regulatory Authority (hereinafter HEA) carries out its OampM cost-efficiency benchmarking prior to the start of each new regulatory period for gas and electricity network operators separately The efficiency benchmarking involves assessing the operators individual costs against the services they provide and determining each operators cost efficiency compared to the other operators The benchmarking is related to the DSOrsquos part- or sub-operations such as operation and maintenance metering and reading customer service The partial productivity index is used General Sectoral Productivity Factor and Price Development The idea behind this factor is to imitate market forces and thus simulate competitive pressure It is assumed that where competition exists productivity gains will lead to lower costs for companies and companies will pass on this competitive advantage to customers in the form of lower prices so as to attract customers away from competitors Quality Regulation Under a regulatory regime that provides incentives to cut costs there is a risk that operators will refrain from undertaking the necessary investments or measures in order to achieve the required or potential savings To counter this the regime includes quality regulation for electricity distribution networks This takes the form of a quality element in the formula for maintaining the price caps Operators achieving above the required quality (SAIDI SAIFI Outage Rate) in past years will have an amount added to their price cap while operators with comparatively poor quality levels will have amounts deducted (bonuspenalty system) The TSO is subject to a far softer quality regulation which is only a simple penalty system and which has not been activated so far
Ref C20-IRB-54-03
CEER Report on Regulatory Frameworks for European Energy Networks 2020
56156
Adjusting the Price Caps After the Reference Year The formula for maintaining the network tariffs during the regulation period consists of the following cost and revenue elements
- Forecasted CPI ndash X (OampM) forecasted CPI (depreciation and capital expenditure) - Investments - Forward electricity price changes (network losses) - The difference between the factual revenue and the forecasted revenue - Quality of service and - Other specific costs (only in case of the TSO)
National Specialities For electricity there are nation-wide uniform distribution tariffs with an inter-DSO compensation tool Transparency HEArsquos methodological guidelines for determining the justified costs and maintaining the prices during the regulation period are available on the HEA website Natural Gas Historical Development With regards to natural gas a separate system for tariffs has existed since 2004 Before their introduction between 1999 and 2004 regulated tariffs (containing both the costs related to system usage and commodity costs) consisted of two components (fixed and variable) Before 1999 a single component tariff (purely volume based) was in effect Since 2004 system tariffs have been regulated with regulatory periods ranging between two and six years The current regulatory period began on the 1st of January 2017 Due to the switch to regulatory periods with their beginnings coinciding with the beginning of the gas year the current regulatory period will be longer than four years and will last until the 30th of September 2021 Determining the Tariffs Tariffs are set for four-year (as a default) regulatory periods with annual tariff reviews during the regulatory period HEA carries out a cost and asset review before the beginning of each regulatory period during which it determines the regulatory asset base the justified operating costs and the level of the WACC to be applied during the next regulatory period Before the cost and asset review HEA issues methodological guidelines detailing the applied methodologies both for the setting of the initial tariffs and the annual tariff review during the regulatory period During the cost review mainly with regards to DSOs HEA benchmarks the efficiency of relevant activities among the system operators In 2015 HEA issued a guideline to DSOs in order to harmonise their cost accounting practices and thus help the benchmarking process HEA also determines the level of metering losses considered to be justified and the cost of the lost gas After determining the justified operating costs and the regulatory asset base HEA calculates the level of the costs to be recovered through the tariffs (cost base) Based on the cost base the relevant capacities and heating-degree day normalised volumetric data HEA determines the applicable tariffs In 2019 in line with the provisions of Commission Regulation (EU) 2017460 of 16 March 2017 establishing a network code on harmonised transmission tariff structures for gas HEA issued
Ref C20-IRB-54-03
CEER Report on Regulatory Frameworks for European Energy Networks 2020
57156
a reference price methodology following a public consultation which replaced the former methodological guidelines with regards to the transmission system operator A Short Overview of the Benchmarking Process Utilised During the Cost and Asset Review of DSOs The aim of benchmarking the relevant costs is to assess the efficiency of the different operators and to determine the justified level of operating costs For the benchmarking HEA used partial productivity indices HEA divided the activity of DSOs into comparable sub-activities allocated the relevant costs to the sub-activities and based on the relevant cost driversoutputs created per unit indices These per unit partial productivity indices form the basis of the benchmarking process The following sub-activities are used in the benchmarking process Activities related to the operation of infrastructure
bull Maintenance and operation of pressure regulators (with the exceptions of small-sized pressure regulators placed at end-users) and city gates
bull Maintenance and operation of gas lines
bull Maintenance and operation of gas meters and
bull Maintenance and operation of pressure regulators placed at end-users + costs related to malfunctions
Activities related to system users
bull Meter reading
bull Customer relations
bull Billing and
bull Technical review of end-user system plans and testing of end-user systems
Only operating costs are benchmarked The following categories of costs are not benchmarked pass-through costs costs of an insignificant level costs reviewed with other methodologies (eg network losses) Cost drivers used during the process were determined based on the following criteria
bull The data was available at all DSOs and it was determined with a sufficiently similar methodology
bull A strong correlation was found both on the level of individual DSOs and for their totality between the cost driver and the relevant cost base and
bull For activities with no sufficient cost drivers identified composite cost drivers with a better fit were created from the combination of the relevant drivers
In order to account for justified differences between the costs and operating circumstances of the DSOs the regulator had the right to modify cost drivers By dividing the relevant costs with the relevant cost drivers the regulator created the partial productivity indices regarding unit costs By dividing the sum of the relevant costs of all DSOs with the sum of the relevant cost drivers of all DSOs the regulator determined the average unit costs In the case of DSOs with higher-than-average unit costs only the average unit cost level is considered to be justified the part of the per unit costs above the average level are not accepted as a part of the justified cost base
Ref C20-IRB-54-03
CEER Report on Regulatory Frameworks for European Energy Networks 2020
58156
In order to avoid unjustified under recovery of costs due to different accounting and cost allocation practices between DSOs an ldquoefficiency reserverdquo is utilised The role of this ldquoefficiency reserverdquo is to allow the efficiency increase in those cost categories in which a DSOrsquos efficiency is more than average to compensate for lack of efficiency in those cost categories in which a DSOrsquos efficiency is less than average Adjusting the Tariffs During the Regulatory Period During the regulatory period annual tariff reviews are carried out in order to keep the tariffs updated During the annual tariff review the initial cost base is adjusted and tariffs are recalculated based on the adjusted cost base and the updated capacities and heating-degree day normalised volumetric data The adjustment takes into consideration the following factors
bull Inflation
bull Changes to the operating costs caused by legislative changes
bull Changes in the regulatory asset base depreciation and cost of capital
bull Investments arising from legislative changes or regulatory obligations
bull Changes in the recognised cost of the settlement difference
bull Adjustments to be made based on the ex-post examination of the system operatorrsquos profit with regards to its profit limit
bull Correction of errors if any and
bull Changes in data expressed in volumes and quantified non-financial parameters
National Specialities
bull Nation-wide uniform transmission tariffs
bull Separate distribution tariffs for each DSO (Before 2011 uniform distribution tariffs with an inter-DSO compensation mechanism were utilised however the system led to legal disputes Since 2011 separate distribution tariffs are used) and
bull Off-peak seasonal consumers
Transparency The methodological guidelines for both the cost and asset review and the within-period annual cost review are published on the regulatorrsquos website before the cost and asset review
Ref C20-IRB-54-03
CEER Report on Regulatory Frameworks for European Energy Networks 2020
59156
213 Iceland Gas TSO Gas DSO Electricity TSO Electricity DSO
Ma
rke
t
str
uc
ture
Network operators
No Gas TSO No Gas DSO 1 6
Network length
~3400 km ~22000 km
Ownership
Indirect public ownership
Private public and local public ownership
Ge
ne
ral
fra
me
wo
rk
Authority
The National Regulatory Authority (NRA) is a team within Orkustofnun National Energy Authority
(wwwosis)
System Incentive Regulation Revenue cap
Period 5 years current period 2016-2020
Base year for next period
Average of OPEX 2015 ndash 2019 base year 2020
Transparency All data behind the regulation model can be made available upon request
Main elements for
determining the revenue
cap
TOTEX OPEX (CPI adjusted average 2010-
2014) + CAPEX (previous year CPI
adjusted book values) + Non-controllable cost (less than 2)
Efficiency factor = 0 for this period
TOTEX OPEX (CPI adjusted average 2010-2014+non-
controllable OPEX from previous year) + CAPEX (previous year CPI adjusted
book values) + other non-
controllable cost (eg network
losses) Efficiency factor = 0 for this
period
Legal framework
The Electricity Act No 652003
Rate
of
retu
rn
Type of WACC Pre-tax WACC = dRd(1 - t) + eRe d=dept ratio e=equity ratio
WACC for energy intensive TSO (2018) = 665 WACC for general (TSO and DSO) = 708
Determination of the rate of
return on equity
Re = (rf + (rm - rf)β + specific risk)(1 - t) Sum of real risk-free rate and a risk premium (market risk premium multiplied with a beta
risk factor) plus a specific risk premium multiplied with a corporate tax factor
Rate of return on equity
before taxes
Energy intensive (TSO) = 102 = ((273+50089)+10)(1-02) (for 2018) General (TSO and DSO) = 107 = ((311+50089)+10)(1-02) (for 2018)
Use of rate of return
The Pre-Tax WACC is the rate of return it is granted for operating necessary business assets
Reg
ula
tory
as
se
t b
as
e Components
of RAB Fixed operating assets
Regulatory asset value
Book value
RAB adjustments
CPI adjusted book values
Dep
re-
cia
tio
ns Method Straight line
Depreciation ratio
Depending on asset type Ratio between 2 and 20 eg TSO lines amp cables ~2 stations ~25 DSO lines amp cables ~3-4
Consideration The regulator regularly inspects the RAB and the depreciations
Ref C20-IRB-54-03
CEER Report on Regulatory Frameworks for European Energy Networks 2020
60156
Introduction The National Regulatory Authority (NRA) in Iceland Orkustofnun is responsible for regulating natural monopolies in electricity and consists of a team of four people Iceland has no gas networks and the majority of space heating is conducted through direct use of geothermal energy Iceland has one TSO (Transmission System Operator) and ~75 of the energy produced is transmitted directly to Energy-Intensive Industries The other ~25 of the energy is transmitted to six DSOs (Distribution System Operators) with the number of customers ranging from ~900 to ~80 000 Two of the DSOs distribute both in rural and urban areas Historical Development The Electricity Act no 652003 came into force in 2003 and implements Directives 9692 and 200354 The 3rd Energy Package has not yet been implemented into national law Regulation by the NRA officially began in 2005 as revenue cap regulation with a team of two people The Electricity Act was changed in 2011 The changes in terms of regulation included eg a longer regulatory period from three to five years and rate of return changed from being based on government bonds directly to a WACC After the change of the regulation the team was enlarged and consists presently of four people Determining the Revenue Caps The revenue caps for network operators are set for a five-year regulatory period The last cap was set in 2015 for the period 2016ndash2020 based on data from 2010ndash2014 where the base year is 2015 The next cap will be set in 2020 for the 2021-2025 period The cap is composed of the five-year average of the controllable OPEX non-controllable OPEX and CAPEX Determining the Allowed Revenue The revenue cap is updated every year ex-post and is referred to as allowed revenue The allowed revenue is updated by CPI adjusting the controllable OPEX (relative to the base year) set by the revenue cap Non-controllable OPEX is based on real values and includes network losses and TSO tariffs (for DSOs) which the DSOs can fully recoup as revenue TSO network losses are not a part of their revenue capallowed revenue but the tariff for network losses is monitored by the NRA CAPEX includes the RAB times the WACC plus depreciations for the relevant year The RAB is based on inflation adjusted book values on 1 January for the relevant year Depreciations are linear and based on asset type The difference between the allowed revenue and the actual revenue from distributiontransmission is entered into a regulatory account containing accumulated surplus or deficit balances All change in tariffs are based on that account A network operator cannot have accumulated surplus that is higher than 10 of their last allowed revenue All accumulated deficits that are higher than 10 of the last allowed revenue are written off Split up Revenue Caps Both the TSO and two of the six DSOs in Iceland have split up revenue caps and allowed revenue and thus have two regulatory accounts The TSO has a revenue cap for transmission to the DSOs and a revenue cap for transmission to Energy-Intensive Industries Two of the DSOs have a revenue cap for their urban areas and a revenue cap for their rural areas Efficiency Benchmarking Orkustofnun is legally obliged to carry out an efficiency study of the network operators before the revenue cap is set every five years Such a study can only be carried out through independent specialists and not by the regulator Other than that the efficiency legislation is open in terms of methodology and data After a recommendation from the specialists the regulator can make a decision on an efficiency factor for the next period Before the last cap was set in 2015 independent specialists conducted such an efficiency study on the TSO and
Ref C20-IRB-54-03
CEER Report on Regulatory Frameworks for European Energy Networks 2020
61156
the six DSOs The TSO was evaluated independently and not benchmarked against other TSOs The six DSOs were evaluated as eight companies since two of them have split up revenue caps The evaluation for the DSOs was based on a DEA analysis and the controllable OPEX (input) and structural data Structural parameters can include peak load energy delivered length of lines and cables number of customer etc The result was used as a recommendation for an efficiency factor for the NRA and the NRA made an efficiency score decision based on that recommendation That decision was however appealed to an independent appeal committee that revoked the NRArsquos decision Rate of Return According to the Electricity Act the WACC is the rate of return on book values of all assets in the RAB Both the TSO and two of the DSOs have two RABs on account of their split of the revenue cap The WACC is the weighted average of the cost of debt and cost of equity calculated by the capital asset pricing model Corporate tax is accounted for through a factor applied to the WACC formula Inflation is however not accounted for in the WACC formula since the RAB is adjusted in terms of inflation every year All parameters in the WACC model are fixed in a regulation no 1922016 except the risk-free rate The risk-free rate is a moving average of the ten-year inflation-indexed US TIPS (Treasury Inflation-Protected Securities) plus a ten-year CDS (Credit Default Swap) spread for Energy-Intensive Industries and ten-year inflation-indexed Icelandic government bonds for the general user and DSOs The NRA calculates a new WACC every year based on the change in the risk-free rate Eg in April 2017 the NRA at Orkustofnun published new WACC for 2018 based on the average of the risk-free rate from 1 January 2007 to 31 December 2016 The WACC 2018 is the rate of return for the RAB when the allowed revenue for 2018 will be calculated in 2019 The WACC regulation mentioned above has a revision clause and is revised upon request The revision and recommendation for the parameters of the WACC formula is performed by independent group of specialists with the WACC committee appointed by the NRA Quality Regulation The Icelandic regulatory regime provides incentives to cut costs and to invest There is still a risk that operators will refrain from undertaking the necessary investments or measures in order to achieve the required or potential savings To counter this data on quality of the network is collected and monitored by the NRA The quality element is not a part of the revenue capallowed revenue formula although it has been considered and was included in the draft of the Electricity Act Investments The DSOs are not legally obligated to report their investment plans to the NRA The NRA can however request all such information especially when it comes to potential change in tariffs where the DSOs are obligated to provide a forecast for the allowed revenue to account for the effect on the regulatory account The TSO is obligated by law to deliver a three-year exact investment plan and ten-year network development plan to the NRA The NRA approves or rejects the investment plan The three-year plan is equivalent to an investment authorisation This plan includes all investments of the TSO Transparency The NRA plans to publish data on the regulatory website which will include revenue caps and annual adjustments WACC etc All data related to the regulation can be made available upon request
Ref C20-IRB-54-03
CEER Report on Regulatory Frameworks for European Energy Networks 2020
62156
Outlook There are currently no formal plans to develop the incentive-based regulatory regime in Iceland Various changes were last made to the regime in 2011
Ref C20-IRB-54-03
CEER Report on Regulatory Frameworks for European Energy Networks 2020
63156
214 Ireland Gas TSO Gas DSO Electricity TSO Electricity DSO
Ma
rke
t
str
uc
ture
Network operators
1 1 1 1
Network length
~2477 km ~11913 km ~6711 km ~172000 km
Ownership
Gas Networks Ireland (GNI)
EirGrid operate the System and ESB Networks own the
system
ESB Networks
Ge
ne
ral
fra
me
wo
rk
Authority Commission for Regulation of Utilities (CRU)
System Incentive Regulation Revenue cap
Period 5 years current period 2017 - 2022 5 years current period 2016 - 2020
Base year for next period
Fourth year of current regulatory period Fifth year of current regulatory period
Transparency
Performance reports (Customer Performance and System Performance)
are published annually by GNI Innovation reporting framework has been established
and GNI publish an annual report The CRU publishes its 5-year price control
decisions following public consultation The CRU also publishes an annual tariff
information paper
Performance reports are published annually by the network companies There is CAPEX
monitoring and reporting in place also CAPEX reports are published on annual basis There are Innovation reports published annually by ESBN and EirGrid Furthermore there is a
report on stakeholder engagement published annually by the CRU
The CRU publishes its 5-year price control decisions following public consultation The
CRU also publishes an annual tariff information paper
Main elements for
determining the revenue
cap
1Review of historic and forecast OPEX
2 Review of historic and forecast CAPEX 3 Value of Assets in TSOrsquosDSOrsquos RAB
4 Rate of Return and 5Inflation
6 Depreciation 7 Reporting and Incentives
Legal framework
The Department of Communications Climate Action and Environment (DCCAE)
is the lead government department (or ministry) with responsibility for energy policy In the natural gas sector the
Department determines policy in relation to security of energy supply and the
functioning of the market The Department is responsible for transposing EU gas
directives into national law and is responsible for financial oversight and corporate governance of state-owned
energy companies
The Commission for Regulation of Utilities is the independent economic regulator for
the natural gas electricity and water sectors in Ireland
Under Section 10A of the Gas Act 1976 as amended (the lsquoActrsquo) the CRU sets the tariffs
and the allowed revenue for the TSO
The Competition and Consumer Protection Commission is the government body
The Department of Communications Climate Action and Environment (DCCAE) is the lead
government department (or ministry) with responsibility for energy policy The
Department must ensure that Irish energy policy and legislation are in line with European
law It is within its remit to formulate and implement policy and legislation on the
liberalisation and regulation of the electricity markets
The Commission for Regulation of Utilities is the independent economic regulator for the natural gas electricity and water sectors in
Ireland
The CRUrsquos Legislative Basis for setting charges ndash
under Section 35 of the Electricity Regulation Act 1999 (ldquothe Actrdquo) the CRU approves
charges for the use of the electricity transmissiondistribution system in Ireland In
accordance with Section 35 of the Act the CRUrsquos Price Review decisions outline the
Ref C20-IRB-54-03
CEER Report on Regulatory Frameworks for European Energy Networks 2020
64156
responsible for enforcing Irish and European competition law in Ireland Generally it looks to the CRU (there is a Memorandum of Understanding between the two) for matters relating to the electricity and natural gas sectors
revenue that the TSO TAO DSO will be allowed to recover from customers during a Price Review Period Section 36 of the Act
states that the TSODSOrsquos statement of charges prepared in accordance with Section 35 must be submitted to the CRU for approval
and will not take effect until approved by the CRU
The Competition and Consumer Protection
Commission is the government body responsible for enforcing Irish and European competition law in Ireland Generally it looks
to the CRU (there is a Memorandum of Understanding between the two) for matters
relating to the electricity and natural gas sectors
Rate
of
retu
rn
Type of WACC WACC for the period 2017 ndash 2022 is 463
pre-tax real The CRU decided that a further aiming up allowance was not
required
WACC for the period 2016 ndash 2020 is made up of a baseline WACC plus an aiming up
allowance
The WACC for the TSO TAO and DSO is set at 495 (real pre-tax)
Determination of the rate of
return on equity
The CAPM methodology is used to calculate the cost of equity using the formula
119896119890 = 119903119891 + 120573 times (119903119898 minus 119903119891) where 119896119890 is the expected rate of return for the risky asset
119903119891 is the rate of return on a lsquorisk-freersquo asset (the ldquorisk-free raterdquo or ldquoRFRrdquo) 120573 is the lsquobetarsquo factor which is correlation of the return on the risk asset with the expected returns on a
diversified portfolio of all investable assets
and 119903119898 is the expected rate of return on a market value-weighted portfolio of all assets (the lsquomarket portfoliorsquo)
The term 119903119898 minus 119903119891 in the CAPM is referred to as the market risk premium (ldquoMRPrdquo)
Rate of return on equity
before taxes Cost of equity (pre-tax) 722
Cost of equity (pre-tax) ndash high 799 Low 562
Point Estimate 663
Use of rate of return
The Regulatory Asset Base (RAB) is the base to which the rate-of-return is applied when determining the return on capital
Reg
ula
tory
as
se
t b
ase
Components of RAB
Fixed assets assets under construction
Regulatory asset value
Replacement cost approach Historic cost indexed to present value using inflation
RAB adjustments
RAB adjusted for disposals
Assets are added to the RABs as costs are incurred not on the date of commissioning
The network companies receive a return on the assets from the middle of the
year in which the costs are incurred rather than when the asset is commissioned Assets which have been added to the RAB
but have not been energised within 5 years (except in the case where the
programme of work was scheduled to be longer than 5 years or where the SO can
satisfactorily show that the delay is beyond its control) will be temporarily removed or
ldquopausedrdquo from the RAB (with all return and depreciation paused) until the point at which
the asset can be energised and utilised
Dep
re-
cia
tio
ns Method Straight line
Depreciation ratio
Depends on asset category
Consideration Part of the examined controllable costs
Ref C20-IRB-54-03
CEER Report on Regulatory Frameworks for European Energy Networks 2020
65156
Introduction The Commission for Regulation of Utilities (CRU) is the independent body responsible for regulating the natural gas and electricity sectors in Ireland Part of its responsibilities involves regulating the level of revenue which the monopoly system operators can recover from its customers to cover its costs The electricity and gas networks in Ireland are described as ldquonatural monopoliesrdquo as the nature of it is that it would be inefficient to develop duplicate sets of wires and pipes to service customers Given the relatively small size of Ireland it would also be inefficient to break the current geographical area of the networks into smaller sections managed by individual DSOsTSOs although this is possible in larger jurisdictionsnetworks Gas Gas Networks Ireland (GNI) is the gas system owner and operator in Ireland GNI owns and operates both the Transmission Network and Distribution Network Companies must hold a licence issued by the CRU to distribute electricity or gas through the energy network The CRU is responsible for ensuring that customers and network users receive value for money while the network companies earn a fair return on their activities to make the necessary network investments Those investments go towards the efficient operation development and maintenance of the networks There are almost 700000 natural gas customers in Ireland Electricity The transmission business consists of EirGrid licensed by the CRU as the Transmission System Operator (TSO) and ESB acting through its ESB Networks business unit as the licensed Transmission Asset Owner (TAO) EirGrid is responsible for the operation and setting the maintenance and development policies of the transmission system while ESB Networks is responsible for maintaining the system and carrying out construction work for its development ESB Networks Ltd a wholly owned subsidiary of ESB is licensed by the CRU as Distribution System Operator (DSO) and is responsible for building maintaining and operating the distribution system ESB acting through its ESB Networks business unit is the licensed Distribution Asset Owner (DAO) and owns the distribution and transmission networks Determining the Revenue Cap The CRU uses a revenue-cap regulatory regime to determine the appropriate level of revenue required to allow the System Operators (SOs) to operate the networks in Ireland The CRU sets revenues ex-ante for a regulatory period of five years There are a number of key components required to estimate the level of revenue that will be sufficient to finance the SOs The building blocks of the regime are as follows Operational Expenditure The overall revenue figure for OPEX that is put in place by the CRU is the result of both rigorous scrutiny of the SOrsquos proposals and benchmarking The CRU applies both a top-down and bottom-up benchmarking approach to OPEX The objective of the bottom-up assessment is to develop a base year or stable run rate of normalised OPEX that represents the core historic lsquobusiness as usualrsquo OPEX (which can then be revised as to reflect additional items of core OPEX) forecast to be incurred in future years of the regulatory period There are two components to the top-down benchmarking assessment Firstly the SOs are benchmarked to comparable utility businesses to determine how expenditure compares to an efficiency benchmark for the relevant sector Secondly the CRU considers the degree of ongoing efficiency improvement or frontier shift that might be possible for the SO over the regulatory period
Ref C20-IRB-54-03
CEER Report on Regulatory Frameworks for European Energy Networks 2020
66156
Capital Expenditure In reviewing the SOrsquos CAPEX proposals the CRU analyses the proposals to determine whether they are appropriate fully justified whether they would deliver benefits to the customer and whether the estimated costs are realistic Determining the Appropriate Rate of Return The CRU sets the rate of return that the SO can earn on the efficiently incurred capital investments in its RAB This is known as the WACC This is essentially a weighted average of the cost of debt and the cost of equity The CRU sets a WACC that is used to derive a fair return on the capital investments made by the utility while also endeavouring to ensure that the SOs sits comfortably within an investment grade credit rating The CAPM is used to assess the cost of equity which is used to aid the determination of an appropriate WACC Uncertain Costs Uncertain costs are defined as those that could not reasonably be foreseen by the SOs The CRU decided that such costs should be dealt with on a case-by case basis In each case the SO would be expected to ensure that changes in OPEX or new CAPEX would take place in an efficient manner and this would be reflected in the allowance provided ndash that is there would not be an automatic pass-through of such costs Pass-through Items The price control model contains a provision for the pass-through of certain types of costs such as business rates that are deemed to lie outside the businessrsquos control In some cases pass-through items are subject to incentive mechanisms which shares savings between the SOs and the network customers for example in areas such as rates and safety K-factor Adjustments The CRU regulates the SOs through a form of revenue cap regulation which allows adjustments relating to one revenue control period to feed through into subsequent periods This adjustment mechanism is generally referred to as a k-factor mechanism The k-factor methodology is an adjustment used to allow for the fact that while the CRU approves a level of revenue to allow the SO to cover its costs over a regulatory period this level depends on assumptions about what happens over the course of that period but it may not necessarily reflect events as they occur The adjustment essentially corrects for these events by applying a correction to the annual revenue to be collected in subsequent periods Indexation The model used by the CRU uses a base allowable revenue which is indexed to take account of price inflation The index used should be the best reflection of the increases in prices faced by the utility such as wage inflation or materials inflation Also the index needs to be practical to implement robust and transparent In the recent review of allowable revenues for the SOs the CRU used Harmonised Index of Consumer Prices (HICP) The CRU accepts that no one index can precisely mirror the utilityrsquos input costs It is also accepted that the majority of the annual revenue which the utility receives covers depreciation and return on its asset base rather than operating costs
Ref C20-IRB-54-03
CEER Report on Regulatory Frameworks for European Energy Networks 2020
67156
Valuation of the RAB The SOsrsquo RAB is valued using a replacement cost approach The use of this approach has continued during the prevailing price control periods While it is recognised that there are advantages and disadvantages associated with each methodology the replacement cost approach was taken as it is more likely to result in the correct level of network investment The CRU notes that there are a number of variations of replacement cost that could be used The version used by the CRU uses the acquisition cost indexed with inflation as a proxy for the replacement cost Depreciation Method The CRU used the straight-line depreciation methodology in its recent price control decisions and for the prevailing price control decisions Determining the Allowed Revenue Combining all the component parts the CRU generates an overall revenue allowance for the SOs This revenue feeds through into setting the transmission and distribution tariffs for each tariff period ie 1 October to 30 September Outlook With regard to the gas Price Control (PC) the CRU is beginning work for the PC5 period keeping in mind issues such as movement towards a decarbonised economy and incentive mechanisms With regard to the electricity Price Review (PR) the CRU published in May 2018 its decision on reporting and incentives under PR4 The CRU introduced what the CRU considers improvements to the existing incentives and reporting regime through the decisions in that paper The aim is to provide the customer with better value for money and improve quality of services provided to the customer
Ref C20-IRB-54-03
CEER Report on Regulatory Frameworks for European Energy Networks 2020
68156
215 Italy Gas TSO Gas DSO Electricity TSO Electricity DSO
Ma
rke
t
str
uc
ture
Network operators
9 ~214 11 (1 SO) ~127
Network length
~35000 km ~264000 km ~73600 km ~1273000 km
Ownership Mainly private investors indirect public ownership
Mainly private and local public ownership
Mainly private investors indirect public ownership
Mainly private and local public ownership
Ge
ne
ral
fra
me
wo
rk
Authority ARERA
System
Cost-plus for CAPEX Price-cap for OPEX
Cost-plus for CAPEX Price-cap for OPEX
Standard cost approach for
centralised costs
Cost-plus for CAPEX Price-cap for OPEX
Cost-plus for CAPEX Price-cap for OPEX
Standard cost approach for smaller
DSOs
Period 4 years 2020-2023 6 years 2020-2025 4 years 2020-2023 4 years 2020-2023
Base year for next period
Transparency All data pursuant
Commission Regulation (EU)
2017460
Aggregated data at sectoral level published at beginning of
regulatory period
Aggregated data at sectoral level published at beginning of
regulatory period
Aggregated data at sectoral level published at beginning of
regulatory period
Main elements for
determining the revenue
cap
OPEX (updated with price-cap)
return on net RAB additional return for
incentives depreciation fuel
gas losses unaccounted-for
gas
OPEX (updated with price-cap) return on
net RAB and depreciation
OPEX (updated with price-cap)
return on net RAB additional return for
incentives depreciation
regulatory account ITC costsrevenues
OPEX (updated with price-cap)
return on net RAB additional return for
incentives depreciation
Legal framework
ARERA Res 1142019Rgas
ARERA Res 5702019Rgas
ARERA Res 5682019Reel
ARERA Res 5682019Reel
For WACC ARERA Res 5832015Rcom
Rate
of
retu
rn
Type of WACC Pre-tax real Determination of the rate of
return on equity
Sum of real risk-free rate (with a floor to 05) a country risk premium and a beta risk factor multiplied with an equity risk premium (determined as difference between Total
Market Return and risk-free rate)
119870119890119901119904119903119890119886119897 = 119898119886119909(
119877119865119901119899119900 119898119894119899 119886119897 minus 119894119904119903119901
1 + 119894119904119903119901
0005) + 120573119904119886119904119904119890119905 sdot [1 + (1 minus 119905119888119901) sdot
119892119901119904
1 minus 119892119901119904
] sdot (119879119872119877 minus 119898119886119909(119877119865119901
119899119900 119898119894119899 119886119897 minus 119894119904119903119901
1 + 119894119904119903119901
0005)) + 119862119877119875119901
Rate of return on equity
before taxes 54 58 53 57
Use of rate of return
Applied to the net value of RAB
Reg
ula
tory
as
se
t b
ase
Components of RAB
Fixed assets working capital assets under construction
Regulatory asset value
Historical cost re-valued for inflation net of depreciation
and grants
Both historical cost and standard unit
cost (sectoral average) depending on type (central vs local assets) Both are re-valued for
inflation and net of depreciation and
grants
Historical cost re-valued for inflation net of depreciation
and grants Investments prior to
2004 are considered as lump-sum with standard net value evolution and depreciation
Historical cost for bigger companies Standard unit cost (sectoral average)
for smaller companies Both are re-valued for
inflation and net of depreciation and
grants
RAB adjustments
New investments depreciation grants
New investments depreciation grants
New investments depreciation
New investments depreciation
Ref C20-IRB-54-03
CEER Report on Regulatory Frameworks for European Energy Networks 2020
69156
For standard costs changes in the
driver
grants For investment prior to
2004 standard evolution
grants For standard costs changes in
the driver
De
pre
cia
tio
ns Method Straight line
Depreciation ratio
Buildings 3 Pipelines 2 Stations 5
Metering 5-7 Other 10-20
Buildings 2-3 Pipelines 2 City gates 5
Metering 5-7 Other 14
Buildings 3 Lines 2
Stations 3 Metering 7
Other 5-20
Consideration Deducted from gross RAB to form net RAB
For 2020 the National Regulatory Authority was not able to author the descriptive part of this subchapter
Ref C20-IRB-54-03
CEER Report on Regulatory Frameworks for European Energy Networks 2020
70156
216 Latvia Gas TSO Gas DSO Electricity TSO Electricity DSO
Ma
rke
t
str
uc
ture
Network operators
1 1 1 11
Network length
1188 km 5206 km 5240 km 96500 km
Ownership Mainly private Mainly private Public ownership Public ownership
Ge
ne
ral
fra
me
wo
rk
Authority The Public Utilities Commission
System Revenue cap13
Period 2-5 years 14 2 years15
Not exceeding 5 years
2-5 years
Base year for next period
Tariffs are based on justified historical costs (some of the costs are justified based on historical 3-year average costs) and forecast of any other future costs
Transparency When submitting new tariff proposal overview with key indicators and figures is published on Regulatorrsquos website As a part of evaluation process public hearing takes place All
stakeholders are welcome to submit comments questions and proposals
Main elements for
determining the revenue
cap
OPEX + CAPEX (Depreciation + return on capital)
Legal framework
Energy Law Law on Regulators of Public Utilities Methodology for the Calculation of the Tariffs on the Natural Gas Transmission System Services Methodology for the Calculation of the Tariffs on the Natural Gas Distribution System Service
Electricity Market Law Law on Regulators of Public Utilities Methodology for the Calculation of the Tariffs on the Electricity Transmission System Services Methodology for the Calculation of the Tariffs on the Electricity Distribution System Services
Rate
of
retu
rn
Type of WACC
Pre-tax real
Determination of the rate of
return on equity
Return on equity Sum of a nominal risk-free rate16 country risk premium market risk
premium multiplied with a beta risk factor and a size premium which is applied only to small and micro-sized entities
Rate of return on equity
before taxes 681 676
Use of rate of return
WACC is applied to the value of RAB to calculate the return on capital which is a part of capital costs in tariff
Reg
ula
tory
as
se
t
ba
se
Components of RAB
Fixed assets intangible investment Does not include inventories and assets under construction
Regulatory asset value
Book value as per financial reports (taking into account asset revaluations carried out by the operator at replacement cost value)
RAB adjustments
The RAB is adjusted and set when the operator submits the tariff proposal during the period the tariff is in force there is no RAB adjustment taking place
Dep
re-
cia
tio
ns Method According to IAS and operators accounting policy (straight line is mostly applicable)
Depreciation ratio
According to the asset type Ratio between 1 and 20 eg gas pipelines 17-25 electricity lines 2-5 electricity transformation substations 25-125
Consideration Depreciation is a part of capital costs in the tariff
13 Methodology was set in July 2020 First tariff is in force from 1 January 14 According to methodology NRA can decide on a different length of regulatory and tariff period 15 According to methodology in tariff evaluating process NRA can extend the tariff period 16 To calculate real WACC the inflation rate is applied to the calculated nominal pre-tax WACC as a whole
Ref C20-IRB-54-03
CEER Report on Regulatory Frameworks for European Energy Networks 2020
71156
Introduction The unified multi-sector regulator in Latvia was established on 1 September 2001 The Public Utilities Commission (PUC) in accordance with the law ldquoOn Regulators of Public Utilitiesrdquo is an institutionally and functionally independent fully-fledged autonomous body governed by public law and independent in the implementation of its budget approved by law The regulator independently performs functions determined in law and within its competence independently adopts decisions and issues administrative acts which are binding for specific public utilities providers and users In accordance with the law ldquoOn Regulators of Public Utilitiesrdquo one of the regulatorrsquos main functions is to determine tariffs and the methodology for calculation of tariffs Tariff calculation methodologies of the different sectors are developed in accordance with the law ldquoOn Regulators of Public Utilitiesrdquo sectoral laws and other normative acts which are in force in the EU and Latvia All methodologies are regularly updated and renewed according to changes in the normative environment Corresponding with market opening (electricity 2015 gas 2017) former vertically integrated energy supply monopolies have been unbundled The task of the regulator is to ensure the availability of public services the availability of infrastructure to public service providers in all regulated sectors the correspondence of public service tariffsprices to their economic value as well as to promote competition transparency and availability of information Therefore tariffs are set by PUC Even though there are some differences in methodologies applied in tariff calculation between TSOs and DSOs and between the electricity and gas sectors the common goal remains the same In Latvia tariffs are currently set using revenue cap and cost-plus approach The tariff period may vary For gas the TSO methodology defines it as one-year period For electricity the TSO tariff periods do not exceed five years and the DSO TSO methodology for 2019 defines it as one-year period For other energy utilities a fixed period is not applied Furthermore PUC annually evaluates actual performance of TSOs and DSOs PUC has legal rights to request new tariff proposals from system operators in case of significant deviations from the set tariffs The system operator has similar rights to submit new tariff proposals if there is legal technical or economical reason for change Determining the Allowed Target Revenues The allowed revenues are calculated using the building-block approach The main parts of the allowed revenues are OPEX and CAPEX Capital costs consist of depreciation and return on capital which is calculated by applying a rate of return WACC determined by the regulator to the value of RAB The WACC is set yearly and the system operator must apply it when calculating the new tariff proposal that are planned to come into effect in the respective year From 1 January 2020 the applied WACC is pre-tax real Changes to the WACC calculation were made in 2019 and the main reason for introduction of real WACC was that the WACC calculation methodology is applied to different regulated sectors that have differing approaches to revaluation of regulated assets thus there was a need to create equal conditions for sectors where companies mainly use historic cost for regulated assets and sectors where companies regularly perform asset revaluation
Ref C20-IRB-54-03
CEER Report on Regulatory Frameworks for European Energy Networks 2020
72156
The general RAB definition used in all energy sector tariff calculation methodologies states that RAB consists of assets or part thereof used for providing the regulated service by the system operator The electricity transmission and distribution sectors as well as gas distribution sector exclude inventories from the RAB and assets under construction from RAB Instead they include the financing costs of maintaining the necessary inventory levels in the operating expenses For projects of common interest the costs of assets under construction can be included in RAB only if such incentive is granted to this project according to the Article 13 of the Regulation (EU) No 3472013 Transparency When approving new tariffs an overview with key indicators and figures is published on PUCrsquos website Public hearings are organised Outlook There are further plans to develop the regulatory regime in Latvia A methodology for setting
electricity TSO and gas DSO tariffs is planned to be developed based on an incentive-based
revenue cap principle
Ref C20-IRB-54-03
CEER Report on Regulatory Frameworks for European Energy Networks 2020
73156
217 Lithuania Gas TSO Gas DSO Electricity TSO Electricity DSO
Ma
rke
t
str
uc
ture
Network operators
1 (AB Amber Grid) 5 1 (LITGRID AB) 5
Network length
2115 km 9068 km 7220 km 125498 km
Ownership State owned
State owned private investors
State owned State owned
private investors
Ge
ne
ral
fra
me
wo
rk
Authority National Energy Regulatory Council (NERC)
System Revenue Cap Price cap
Period
5 years (2019ndash2023)
5 years (2019ndash2023 for the main DSO)
5 years with 1 year of extension (2016-
2021)
5 years with 1 year of extension for the main DSO (2016-2021) and 5 years (for small DSOs
2020-2024)
Base year for next period
2024 2024 for the main
DSO 2022
2022 (for the main DSO)
and 2025(for small DSOs)
Transparency Decisions
Main elements for
determining the revenue
cap
TOTEX RAB WACC technical losses efficiency benchmark
TOTEX RAB WACC technical losses
Legal framework
The Law on Natural Gas of the Republic of Lithuania
The Law on Electricity of the Republic of Lithuania
Rate
of
retu
rn
Type of WACC Nominal pre-tax
Determination of rate of return on
equity
Return on equity Sum of a nominal risk-free rate and market risk premium multiplied with a beta risk factor
Rate of return on equity
before taxes Rate of return on equity = 547
For the main DSO
Rate of return on equity = 551
858=35+706072
For the main DSO
858=35+706072
Use of rate of return
WACC is used to calculate return on investment WACC is a multiplied with whole RAB
Reg
ula
tory
as
se
t b
ase
Components of RAB
Fixed assets
Regulatory asset value
Historical values euro287 m (2019)
Historical values euro247 m (2019)
Current value (for the main network elements (lines
cables transformers) which will be
depreciated until 2020) and historical value (for the rest of
asset) ndash euro350474 m (2019)
Historical value for 5 small DSOs For main DSO current value (for the main network elements
(lines cables transformers) which will be
depreciated until 2020) and historical value (for the rest of
asset) ndash euro1406228 m (2019)
RAB adjustments New investments and depreciation
New investments and depreciation
Ref C20-IRB-54-03
CEER Report on Regulatory Frameworks for European Energy Networks 2020
74156
De
pre
-
cia
tio
ns Method Straight-line depreciation
Depreciation ratio
133-25 143-25 143 - 25
Consideration Depreciation ratio depends on asset type All depreciation of regulated assets is integrated into revenues
Introduction Natural gas electricity transmission and distribution are regulated activities under the Law on Energy of the Republic of Lithuania Law on Electricity of the Republic of Lithuania and Law on Natural Gas of the Republic of Lithuania The performance of TSOs and DSOs are licensed and regulated by National Energy Regulatory Council (NERC) NERC approves the requirements for keeping records of regulated activities approves methodologies for the setting of state-regulated prices sets state-regulated prices and price caps and controls the application of state-regulated prices and rates Moreover NERC sets requirements for reliable transport of energy and quality of services and control compliance therewith and performs other functions laid down by legal acts TSOs and DSOs are responsible for the stability and reliability of the transmissiondistribution system They are also responsible for the provision of system services in the territory of the Republic of Lithuania operation maintenance management and development of interconnectors to other systems TSOs and DSOs shall ensure objective and non-discriminatory conditions for access to the system by network users DSOs provide electricitynatural gas distribution connectiondisconnection of the customers and guaranteed17 natural gas supply (only gas DSO) services TSOs provide electricitynatural gas distribution transit and balancing services Moreover the natural gas TSO also performs the LNG terminal funds administrator function
Main Principles of the Tariff Regulation The main methodologies on which tariffs for natural gas and electricity transmission and distribution are calculated have been approved by NERC That is the Methodology of Electricity Transmission Distribution and Public Supply Services and Public Price Cap Calculation Methodology of setting state-regulated prices for natural gas sector Methodology for Determining Income and Prices of State Regulated Natural Gas Activities and Methodology on Rate of Return on Investments (ROI) A five-year regulatory period applies for the natural gas and electricity transmission and distribution prices regulated by NERC The allowable income levels are calculated as the sum of economically based costs consisting of CAPEX (cost of depreciation (using straight line method) and ROI) OPEX (repair and maintenance administrative cost wages etc) taxes and technical losses The WACC of the natural gas and electricity TSOs and DSOs is calculated in accordance with the Methodology on Rate of Return on Investments where cost of debt (the entitys actual long-term borrowing costs limited by the market average) and equity risk premium (the sum of the equity risk premium of the country with the developed capital market (the US) and the additional market risk premium of Lithuania) are evaluated The equity risk premium calculated for the entire regulatory period and the cost of debt must be adjusted annually NERC uses WACC to calculate ROI as well as the discount rate in approving capital investments of TSOs and DSOs
17 Guaranteed natural gas supply means the supply of natural gas are guaranteed to customers through the
provision of services of public interest
Ref C20-IRB-54-03
CEER Report on Regulatory Frameworks for European Energy Networks 2020
75156
Making Adjustments During a Regulation Period In the natural gas sector a NERC decision allows regulated price caps to be adjusted once a year These are subject to the change in the inflation rate prices of imported natural gas taxes amount of natural gas or the requirements of legal acts regulating activities of natural gas network operators investments by natural gas undertakings as agreed with NERC or deviation by natural gas network operators from the indicators determined in methodologies for the calculation of price caps approved by the NERC In the electricity sector the regulated price caps are adjusted each year following the change of the inflation rate (OPEX) new investments depreciation and change of WACC (CAPEX) the electricity price (technical losses) and the ROI adjustment from previous periods The actual ROI in natural gas and electricity sectors is estimated after the first two years of the regulatory period and after the entire regulatory period Taking into account the income earned cost incurred and effectiveness of regulated activities The ROI may be increased due to the decisions of regulated companies related to the reorganisation or other factors decreasing OPEX accordingly 50 or 100 of the proved savings Regulatory Decision Process The process of setting transmission and distribution prices starts with the provision of data for establishing price caps NERC evaluates the data provided by TSOs and DSOs sets or corrects the price caps and approves them by NERC resolutions The TSOs and DSOs provide NERC with an application to approve specific transmission and distribution prices Having verified and determined that prices are not calculated breaching the requirements for setting prices laid down in methodologies and that are discriminating against customers andor are false NERC gives instructions to natural gas network operators in relation to the calculation of specific prices and tariffs Specific prices approved by NERC resolution are published by the TSODSO and NERC no later than one month before the prices enter into force Investments Each year each TSO provides NERC with the ten-year network development plan (TYNDP) ndash the strategic document which covers main investment projects for the following ten years Where a TSO does not execute an investment NERC shall require the TSO to execute the investments or oblige the TSO to accept a capital increase to finance the necessary investments and allow independent investors to participate in the capital NERC determines whether the national TYNDP is consistent with the non-binding TYNDP of ENTSOG and ENTSO-E From 2018 DSOs also have an obligation to prepare a ten-year network development renovation upgrading and investment plan Concerning the RAB TSOs and DSOs can only include those investments which are already implemented18 and approved by NERC NERCrsquos approval of the TYNDP does not mean the approval of the concrete projects thus projects have to be also approved individually An investment project is considered as an investment if it exceeds a certain value (35 million EUR for the TSO or 15 million EUR for a DSO in the electricity sector and 2 million EUR or 5 of the companyrsquos yearly investments (but not lower than 015 million EUR) in the natural gas sector) Otherwise investments are provided in the simplified manner ndash as part of a yearly investment plan Investment projects are based on technical justification financial justification and economic justification eg CBA and impact on regulated prices However there are some exemptions
18 An exception is applied to PCI projects as assets under construction of PCIs is also included into RAB
Ref C20-IRB-54-03
CEER Report on Regulatory Frameworks for European Energy Networks 2020
76156
in the evaluation process For example financial justification is not necessary for most projects which do not increase the transport of the energy and CBA is not required for the upgrade of depreciated assets The yearly investment plan is composed of the list of investments with a value lower than that of an investment project NERC can oblige a company to exclude particular investments from the yearly plan and present it as an investment project All investments included into yearly investment plan must be reasoned and have technical justification Moreover the report of the previous yearly investment plan has to be provided and all the changes of the values of each investment have to be justified compared to the approved plan Quality Regulation NERC sets the minimum levels of the reliability indicators for electricity and natural gas (DSO SAIDI SAIFI and TSO MAIFI AIT) for the regulatory period These levels are estimated as the average of actual numbers of previous regulatory period (not worse than set for the last regulatory period) in electricity sector and as the average of actual numbers of the last three years in natural gas sector Actual ROI of electricity transmission and distribution services must be reduced by 1 (for each reliability indicator worse from 5 to 10 than set by NERC) or 2 (for each reliability indicator worse more than 10 than set by NERC) WACC of natural gas transmission and distribution services must be increasedreduced by 0005 (for each reliability indicator betterworse from 10 to 15 than set by NERC) and 0010 (for each reliability indicator betterworse than 15 than set by NERC)
Ref C20-IRB-54-03
CEER Report on Regulatory Frameworks for European Energy Networks 2020
77156
218 Luxembourg Gas TSO Gas DSO Electricity TSO Electricity DSO
Ma
rke
t
str
uc
ture
Network operators
1 3 1 5
Network length
283 km 3058 km 154 km 10768 km
Ownership Mainly direct and indirect public ownership
Ge
ne
ral
fra
me
wo
rk
Authority Institut Luxembourgeois de Reacutegulation (ILR)
System Revenue cap incentive regulation
Period 4-year period current period 2017-2020 4-year period current period 2017-2020
Base year for next period
2019
Transparency Public consultation before the tariff methodology can be adopted Methodology published in official journal and on NRA website
Possibility to contest NRA decisions
Main elements for
determining the revenue
cap
Remuneration on RAB depreciation Controllable OPEX
Non-controllable OPEX
Remuneration on RAB depreciation Controllable OPEX
Non-controllable OPEX
Remuneration on RAB depreciation Controllable OPEX
Non-controllable OPEX Ancillary
services
Remuneration on RAB depreciation Controllable OPEX
Non-controllable OPEX
Legal framework
Law modified 1 August 2007 relative to the organisation of the natural gas market
E1613ILR E1614ILR
Law modified 1 August 2007 relative to the organisation of the electricity market
E1612ILR E1614ILR
Rate
of
retu
rn
Type of WACC Nominal pre-tax WACC
Determination of the rate of
return on equity
Sum of cost of debt and cost of equity For more details see explanations
Rate of return on equity
before taxes
For natural gas and electricity 612 = 05 (215+145) + (1 ndash 05) (215 + 07946 480)(1 ndash 3093)
Use of rate of return
Granted for self-financed assets in the RAB and for work in progress according with respect to the dispositions of E1612ILR and E1613ILR
Reg
ula
tory
as
se
t
ba
se
Components of RAB
Fixed assets containing production costs work in progress
Regulatory asset value
For assets since 2010 historical costs Before asset financed by own funds (max 50) historical costs re-evaluated with
published indexes Remaining part historical costs
RAB adjustments
Adjustments not foreseen in the method After activation new assets also enter the RAB
Dep
re-
cia
tio
ns Method Linear
Depreciation ratio
Depending on the asset type Useful lifetime 25-50 years for technical assets and constructions and 3-20 years for IT related fixed assets
Consideration Depreciation is fully included in the allowed revenues
Introduction The Luxembourgish electricity market has about 315000 consumers and had a total consumption of 66 TWh in 2018 The natural gas sector accounts for some 90000 consumers with a total consumption of 89 TWh in 2018 The National Regulatory Authority (NRA) is the Institut Luxembourgeois de Reacutegulation (ILR) It is ILRrsquos role to supervise the market functioning in both electricity and gas sectors as well as to ensure universal service in the interest of all consumers As part of these tasks ILR has the power to determine a tariff calculation methodology and to take decisions in matters for which
Ref C20-IRB-54-03
CEER Report on Regulatory Frameworks for European Energy Networks 2020
78156
the national law explicitly entitles ILR for The tariff calculation methodology as well as changes to the methodology can only be decided after a public consultation process 2017 was the first year in which all network tariffs in electricity were equalised among all network operators on a national level This development helps the consumer to better understand the tariffs and makes it easier for suppliers to form their supply prices Network operators on the other hand will redistribute among themselves the part of the revenues which are over- or underachieved due to the fact that their respective tariffs would be different without national tariffs For natural gas the network tariffs remain different for each DSO Determining Revenue Caps The tariff calculation methodology is set for periods of four years with the current period being from 2017 to 2020 In principle the methodologies for natural gas and for electricity are alike Deviations will be explicitly mentioned in this description The current approach is a revenue cap method On an annual basis the network operators submit their tariff proposal for the following year along with the final regulatory accounts of the previous year ILR evaluates the submitted documents and approves the tariffs when no objections remain The yearly review of the closed accounts from the previous year allows adjusting the maximum allowed revenue according to the real costs observed Differences are transferred to a regulatory account which can be included in the next tariff proposal The main categories of costs forming the maximum allowed revenue are RAB remuneration depreciation controllable OPEX specific pass-through quality factor and the regulatory account term Investments and Depreciation The current tariff methodology distinguishes between two categories of investments
bull Small investments of less than 1 million EUR in the electricity sector and less than 500000 EUR in the natural gas sector are counted among the ldquolotsrdquo (batch investments) and
bull Individual investment projects contains projects which do not fall under the ldquolotsrdquo anymore as well as all projects with a cross-border impact regardless of the investment cost
For assets in the ldquolotsrdquo category the administrative burdens are considerably lower than for individual investment projects They have to be classified according to the voltage level (for natural gas according to the level of pressure) and pre-defined asset categories The operator also has to note whether the costs are considered as replacement of infrastructure or new investments In addition the network operator has to submit to the Institute its procedures for standard investments This allows the Institute to verify the efficiency of the procedure Costs under this category enter RAB in the year they occurred For individual investment projects the system operator informs the Institute annually about the progress of each project and informs the Institute about projects for which it foresees the start of the works before the end of the following year Documentation to be submitted for new projects include a justification an analysis of alternatives and other options for the project a cost-benefit analysis the detailed costs an analysis of events that could delay the project or have an influence on the total costs of the project and an operational plan
Ref C20-IRB-54-03
CEER Report on Regulatory Frameworks for European Energy Networks 2020
79156
The tariff methodology provides the possibility to make adjustments to individual investment projects during the realisation phase in case of unforeseen events which cannot be influenced by the network operator The date of activation as well as the total costs of the project can be adjusted upon approval by the Institute provided that the system operator immediately notifies the Institute of such deviations The work in progress from the start of the project until the planned activation date communicated in the operational plan is remunerated by the WACC In case of delays of the project remuneration the tariff methodology allows a reduction or the annulation of the remuneration for the years in question A project enters the RAB based on historical costs and is depreciated on a straight-line basis over the useful lifetime defined in the tariff method Parts of an asset subsidised by public funds or financed by third parties are not included in the RAB Remuneration ndash WACC The WACC used for the current regulatory period is a nominal pre-tax remuneration The final rate of 612 is a combination of the cost of equity and the cost of debt with an equal weighting This gearing represents an efficient capital structure protecting the interests of the consumer as well as allowing the system operator to access capital markets at reasonable costs The cost of debt is the sum of a risk-free rate (RFR) and a debt premium (DP) The RFR is based on a mid-term view of long-term interest rates published by the European Central Bank for Luxembourg The DP is based on current spreads on debt issued by firms having similar activities The issues had at least an A- rating and 7 to 13 years remaining to maturity The cost of equity adds the product of the equity risk premium (ERP) and an equity beta to the RFR This sum is discounted with the company tax rate for Luxembourg The ERP value is based on a study by Dimson Staunton and Marsh in 2015 The equity beta was determined by asset betas for comparable companies with the Modigliani-Miller method Hence remuneration is the product of the year end value of RAB and WACC Controllable Costs Controllable costs are set at the beginning of the regulatory period based on the profit and loss account of the reference year These costs are adjusted for price index network expansion (length of the network and consumers connected to it) and efficiency For the subsequent years the set costs are carried forward taking into account the previously mentioned adjustment factors Controllable costs are mainly salaries administrative costs and other operating costs for which no specific pass-through is foreseen Specific Pass-through Costs and revenues eligible under this category are subject to the annual review of the maximum allowed revenues in the year X+1 During this review the costs estimated during the calculation of tariffs are adjusted for real costs The non-controllable costs can be subdivided into operating costs and additional remunerations (financial incentives)
Ref C20-IRB-54-03
CEER Report on Regulatory Frameworks for European Energy Networks 2020
80156
The first part of these costs contains human resource costs such as training costs old commitments concerning supplementary pensions and costs related to the evolution of salaries in addition to the evolution of the automatic indexation The next part of non-controllable costs is for taxes and contributions Costs eligible under technical operation include network losses the use of third-party infrastructure ancillary services preparatory studies revenues from other transmission or distribution services not accounted separately and revenues from participations of third parties in investment costs Costs linked to cooperation between network operators can be accepted for realising transnational cooperation projects with the aim to increase market integration as well as costs linked to common projects of network operators aiming at enhancing market functioning or increasing the efficiency of the management of distribution networks Finally research and development costs can be accepted under the conditions defined in the tariff methodology Additional remunerations (financial incentives) can be claimed by the network operator for specific tasks which were identified by the regulator as being of particular interest for the consumer for market functioning or to maintain security of supply Projects targeted by this measure include establishing equalised electricity and natural gas network tariffs on a national level setting up a remote monitoring system of the electricity network dissociating activities of supply and network operation for integrated companies with fewer than 100000 connected consumers and establishing a central data hub for specific energy information or for the implementation of network tariffs that improve the consumersrsquo participation in order to increase the efficiency of the usage of the electricity network among others Quality The current methodology has a specific component allowing the integration of a quality factor into the maximum allowed revenue Since this factor has been introduced for the first time at the start of the current regulatory period the aim is to gather reliable data on the quality of service of the network operators As a consequence during this monitoring period no financial implications are caused by this factor For electricity the evolution of the system average interruption duration index (SAIDI) is observed In case of a deterioration of this index the network operator in question needs to analyse the situation and deliver a specific report which explains the reasons for this development Such a report will be published For natural gas the quality factor does not apply for the current regulatory period Regulatory Account The annual review of the maximum allowed revenue allows to adjust some of the elements forming the estimated maximum allowed revenue (MAR) for real costs Indeed RAB remuneration work in progress remuneration depreciation quantity factor for controllable costs and specific pass-through items will be adjusted The reviewed MAR will then be compared to the revenues from approved tariffs of the concerned year Differences will be allocated to the regulatory account and can be used in the following tariff exercises Due to the evolutions and developments in the sector for example the roll-out of smart meters the development of e-mobility more active consumers and a bigger share of decentralised production the Institute has launched a study to work out possible directions for the future tariff structure Elements of this study will have an impact on the tariff methodology for the next regulatory period
Ref C20-IRB-54-03
CEER Report on Regulatory Frameworks for European Energy Networks 2020
81156
219 Netherlands Gas TSO Gas DSO Electricity TSO Electricity DSO
Ma
rke
t
str
uc
ture
Network operators
1 (GTS) 7 1 (TenneT) 7
Network length
12000 km 124000 km 21000 km 318000 km
Ownership State owned (public
by law)
Local public ownership (public by
law)
State owned (public by law)
Local public ownership (public
by law)
Ge
ne
ral
fra
me
wo
rk
Authority Authority for Consumers and Markets (ACM) (wwwacmnl)
System Incentive regulation Revenue cap
Period 3-5 years (currently 2017-2021)
Base year for next period
TBD
Transparency Method and tariff decisions Regulatory data Efficiency scores Quality of networks
Main elements for
determining the revenue
cap
TOTEX CPI cost efficiency
benchmark productivity change
WACC RAB
TOTEX CPI yardstick
productivity change WACC RAB
TOTEX CPI cost efficiency
benchmark productivity change
WACC RAB
TOTEX CPI yardstick
productivity change WACC RAB
quality incentive
Legal framework
Gaswet (Gas Act) Electriciteitswet 1998 (Electricity Act)
Rate
of
retu
rn
Type of WACC Real pre-tax
Determination of the rate of
return on equity
Sum of (1) risk-free rate and (2) equity risk premium beta Equity risk premium is based
on data in individual Eurozone countries over the period 1900-2015 (Dimson Marsh and Staunton database) An average of both the geometric and arithmetic average is taken
Multiplied by beta based on comparator group
Rate of return on equity
before taxes
67 in 2021 (calculated based on 502 after taxes and 25 tax rate 67 = (128+505074)075)
Use of rate of return
Real WACC is currently based on a 50 debt and 50 equity capital structure Real WACC is multiplied with the indexed RAB
Reg
ula
tory
as
se
t
ba
se
Components of RAB
Fixed assets and certain intangible assets (such as software) are included no working capital
Regulatory asset value
Indexed historical costs
RAB adjustments
Annual indexation (with CPI) Also adjustment for certain specific (expansionary)
investments
Annual indexation (with CPI) Also adjustment for certain specific (replacement) investments
Annual indexation (with CPI) Also adjustment for certain specific (expansionary)
investments
Annual indexation (with CPI)
Dep
re-
cia
tio
ns Method Straight line depreciation corrected for inflation (CPI) each year
Depreciation ratio
Most assets are depreciated over a period of 35 ndash 55 years
Consideration Depreciation is part of the total costs which are subject to an x-factor over the course of the regulatory period
Introduction The Transmission and Distribution System Operators (TSOs and DSOs) in electricity and gas are neutral market facilitators The Dutch Electricity Act and Gas Act specify what responsibilities the TSOs and DSOs have These responsibilities are linked to two domains First TSOs and DSOs are tasked with the transport and distribution of electricity and natural gas in an efficient safe and secure manner Second they are responsible for creating and maintaining connection points with other networks and consumers TSOs are also responsible for system operations Furthermore TSOs and DSOs have a responsibility to share all relevant
Ref C20-IRB-54-03
CEER Report on Regulatory Frameworks for European Energy Networks 2020
82156
information in order for consumers and producers to make efficient decisions Finally they have the task to ensure the safety of the networks The electricity grids and gas networks are natural monopolies where effective competition is restricted or does not exist at all They are also legal monopolies To ensure that network tariffs reflect what is normal in competitive circumstances and to stimulate operators to operate their networks as cost effectively as possible electricity and gas network operators are subject to regulation This regulatory task is performed by the Authority for Consumers and Markets (ACM) Historical Development Regulation by (the predecessor of) ACM began in 2002 with an incentive-based regulatory regime which is still in place to date Under this regime the revenues that network operators are allowed to earn within a certain period (regulatory period) is determined using a mathematical formula and fixed for the period This incentivises network operators to lower their costs in order to maintain or increase profits Regulatory Decision Process The process of setting allowed revenues starts with the publication of a method decision (valid for a period between three to five years) before the start of that regulatory period Method decisions are taken separately for GTS (the gas TSO) TenneT (the electricity TSO) combined for gas DSOs and also combined for electricity DSOs In these decisions ACM determines how the allowed or target revenue is calculated Soon after this ACM publishes the so-called x-factor decisions In these decisions the base level of revenue for the regulatory period and the annual tariff cut (this is the x-factor) are set For the electricity DSO a quality incentive is also set (the q-factor see below) X-factor decisions are made for each TSO and each DSO individually Finally during the regulatory period ACM publishes tariff decisions annually also individually for each TSO and DSO Tariff decisions take the relevant x-factor decision as a starting point and also account for further tariff corrections due to changes during a regulatory period court decisions etc Main Principles of the Tariff Regulation The most important principle is a revenueprice cap based on exogenous efficient cost level ACM incentivises TSOs and DSOs to operate efficiently by setting the revenue of the operators before the start of the regulatory period (ie an ex-ante revenue cap or price cap) The allowed or target revenue is set equal to the expected efficient costs If a system operator operates more efficiently than the cap it may keep the resulting profits On the other hand if it operates less efficiently it also has to take the resulting losses Because the efficient cost level is not only based on the network operatorrsquos own costs the regulation also gives incentives for efficiency That is because the efficient cost level is based on mostly exogenous data the network operator knows that in future periods it is able to profit from efficient choices today This gives the system operator an incentive to be efficient in both the short term and the long term For each regulatory period ACM renews the revenue or price cap to the actual efficient cost level If cost reductions lead to a lower efficient cost level consumers will benefit from these cost reductions in the period following these cost reductions In this way network operators earn a bonus for efficient operation and consumers profit from lower cost levels in the long run Hence the Dutch incentive regulation also ensures affordability of energy network services In order to ensure the safety and security of the network TSOs and DSOs have to invest in their networks and they need capital for that The incentive scheme parameters (like the WACC) are set such that network operators receive an appropriate return on their investment
Ref C20-IRB-54-03
CEER Report on Regulatory Frameworks for European Energy Networks 2020
83156
so that they are able to compensate their investors This return should match the return a company would get in a competitive market However whether or not a network operator actually receives this return will depend on the decisions the network operator makes The regulation is technology-neutral ie it facilitates efficient investments regardless of their nature Quality of Transport By way of a so-called q-factor ACM gives an incentive to the electricity DSOs to maintain an optimal quality standard If a DSO has fewer or shorter outages than the norm it will gain extra revenue through a positive q-factor If it has more or longer outages than the norm it will lose a share of its revenues through a negative q-factor For the gas DSOs there is no q-factor as no informative indicator for quality has been identified so far By law q-factors are not implemented for TSOs Quality maintenance for the TSOs and the gas DSOs is therefore safeguarded by the minimum requirements embedded in the Electricity Act the Gas Act and the technical conditions which are also set by ACM through separate procedures Q-factors are added to x-factors when setting allowed revenues so they have a cumulative effect The Regulatory Period The law allows for a regulatory period of three to five years The current period started on 1 January 2017 and runs until 31 December 2021 In the past periods of three years were often implemented The advantages of a shorter period are the flexibility to actualise the method more frequently and that the gap between ex-ante estimates and ex-post realisations is lower The main advantage of a longer period is more stability and certainty for network operators and customers In addition a longer period creates stronger efficiency incentives because the network operators will have a longer period in which they are able to profit from efficient operations X-factor Mechanism The mechanism of the x-factor works as follows ACM determines the base revenue on the basis of the realised costs and the static efficiency measures Then using parameters that estimate future cost trends ACM determines the level of the revenue at the end of the period The annual revenue then gradually evolves from the base level to the level at the end of the period ie the x-factor is equal to the annual change in revenue This means that the x-factor is a price differential rather than an efficiency target Determining the Regulatory Cost Base The cost of a network operator includes operational costs and capital costs The operational costs are determined on the basis of data from the network operators The capital costs include the return on investment and depreciation These are calculated by ACM based on investment data from network operators For all types of investments regulated depreciation periods are set in the regulation Periods vary between classes of assets ranging from 5 to 55 years The tariffs include an appropriate return which is based on a WACC-method This WACC gives an allowance for both the cost of debt and the cost of equity When setting the WACC ACM looks at the market return instead of the actual costs the network operators face By looking at the market return it is ensured that the return is no higher than what would be appropriate in a competitive environment The WACC (real pre-tax) is the same for all network operators because the reference group used to set the WACC is representative for all network operators For 2016 it was set at 45 for 2021 at 30 The method takes into account embedded debt This is not necessary for expansion investments so for these investments
Ref C20-IRB-54-03
CEER Report on Regulatory Frameworks for European Energy Networks 2020
84156
the WACC is set at 38 in 2016 and 30 in 2021 Since a real WACC is used the regulatory asset base is indexed For TSOs the expected costs of regular expansion investments during the regulatory period are added as additional capital costs The expected costs are set equal to the average costs for regular expansion investments of the three most recent years Operational cost for expansion investments are estimated at 1 of the investment expense
European directives stipulate that tariffs should reflect the actual costs incurred insofar they correspond to those of an efficient and structurally comparable network operator Since there is only one gas TSO and one electricity TSO in the Netherlands ACM determines the efficient costs for the TSOs by comparing them with other European TSOs in a cost efficiency benchmark When setting the efficient cost level for TSOs ACM also takes into account the dynamic efficiency This is the expected scope for improving cost efficiency resulting from technological and economic trends Lower costs because of such dynamic efficiency are passed on to consumers during the regulatory period in the form of lower tariffs Effectively the result of cost efficiency studies is used when historic actual cost are translated to allowed revenues for a future period
For DSOs so-called yardstick competition is used to determine the static efficiency Two yardsticks are set one for electricity DSOs and one for gas DSOs ACM sets yardsticks equal to the cost per unit of output based on the actual cost of the DSOs Each service that is billed separately by a DSO adds to the output where the national tariff code prescribes what can be billed and what not For incomparable types of costs (so-called regional differences) a correction is made on individual basis For DSOs the dynamic efficiency is equal to the geometric mean of the annual difference in the costsoutput ratio This figure is used to adjust the yardstick The so-determined efficient cost levels constitute the basis for the cost estimates used to set the allowed revenues for the upcoming period Making Adjustments During a Regulation Period For some cost estimates ACM is obliged to correct estimates annually and correct the allowed revenue accordingly There can also be other circumstances that may call for intermediate corrections (a) by court ruling (b) if it turns out that the decision was based on incomplete or incorrect data (c) if deviations between estimates and realisations are disproportional or (d) if the revenue is based on services that a network operator no longer provides For circumstances b-d it is up to ACM to decide if and how corrections will be made
Ref C20-IRB-54-03
CEER Report on Regulatory Frameworks for European Energy Networks 2020
85156
220 Northern Ireland Gas TSO Gas DSO Electricity TSO Electricity DSO
Ma
rke
t
str
uc
ture
Network operators
3 3 2 1
Network length ~430 km ~6000 km ~ 2200 km ~45000 km
Ownership public private public public
Ge
ne
ral
fra
me
wo
rk
Authority Northern Ireland Authority for Utility Regulation [known as Utility Regulator]
System Mixture Incentive regulation ndash revenue amp price
cap
Incentive regulation ndash revenue cap
Incentive regulation ndash revenue cap
Period 2017-2022 (5yrs) 2017-2023 (6yrs) 2015-2020 (5yrs) 2017-2024 (65yrs)
Base year for next period
TBD TBD TBD TBD
Transparency Regulatory reporting in place for all TSOs and DSOs Cost and Performance Reports
published annually or at least covering the price control period
Main elements for determining
the revenueprice
cap
1Review of historic and
forecast OPEX 2 Productivity 3 WACC and
4Inflation
1Review of historic and forecast OPEX
amp CAPEX 2 Efficiency Scores
3 Productivity 4WACC
5Inflation and 6Future Growth
1Review of historic and
forecast OPEX and CAPEX
2 Productivity 3 WACC and
4Inflation
1Review of historic and forecast OPEX amp
CAPEX 2 Efficiency Scores
3 Productivity 4WACC and
5Inflation
Legal framework
Gas (NI) Order 1996 Electricity (NI) Order 1992
Rate
of
retu
rn
Type of WACC For GNI (UK)
only pre-tax real WACC
Pre-tax as well as Post-tax real
WACCs
Pre-tax real WACC
Post-tax real WACC
Determination of the rate of
return on equity
The Capital Assets Pricing Model (CAPM) is used to calculate the cost of equity This method relates the cost of equity (Re) to the risk-free rate (Rf) the expected return on the market portfolio (Rm) and a business specific measure of investorsrsquo exposure to
systematic risk (Beta or β) using this formula Re = Rf + (Rm ndash Rf) x β
Rate of return on equity
before taxes
538 (real pre-tax)
66 (real pre-tax) 951 (real pre-
tax) 550 (real pre-tax)
Use of rate of return
The Regulatory Asset Base (RAB) is the base to which the rate-of-return is applied when determining the return on capital
Reg
ula
tory
as
se
t b
ase
Components of RAB
Fixed assets only Fixed assets plus Profile Adjustment
Fixed assets and pre-construction
work for investments
according to the ten-year
development plan
Fixed assets and assets under construction
Regulatory asset value
Historic cost indexed to present value using inflation
RAB adjustments
None
RAB developments during a regulatory period taken into
account subject to Uncertainty
Mechanism and actual outputs
Transfer of cost to the TAO upon construction
RAB developments during a regulatory
period are taken into account and lead to
changes of the regulatory asset base
Ref C20-IRB-54-03
CEER Report on Regulatory Frameworks for European Energy Networks 2020
86156
De
pre
cia
t-
ion
s
Method Straight line (with Electricity DSO kinked line)
Depreciation ratio
Depends on asset type
Consideration Part of the examined costs
Introduction The Northern Ireland Authority for Utility Regulation (otherwise known as the Utility Regulator [UR) is the independent non-ministerial government department responsible for regulating Northern Irelandrsquos electricity gas water and sewerage industries to promote the short and long-term interests of consumers The Utility Regulatorrsquos statutory objectives are to
bull Protect the short and long-term interests of electricity and gas consumers with regard to price and quality of service
bull Promote competition where appropriate in the generation transmission and supply of electricity and
bull Promote the development and maintenance of an economic and co-ordinated natural gas industry
The Utility Regulatorrsquos work involves
bull Issuing and maintaining licences for gas and electricity companies to operate in Northern Ireland
bull Making sure that these companies meet relevant legislation and licence obligations
bull Challenging these companies to keep the prices they charge as low as they can be
bull Encouraging regulated companies to be more efficient and responsive to customers
bull Working to encourage competition in the gas and electricity markets
bull Setting the standards of service which regulated companies provide to customers and
bull Acting as an adjudicator on certain customer complaints disputes and appeals In carrying out its work the Utility Regulator also takes account of the needs of vulnerable consumers The UR also aim to contribute to the promotion of sustainable development in exercising its duties Historical Development The electricity industry in Northern Ireland was privatised in 1992-1993 The industry is split by wholesale network (transmission and distribution) and supply The regulator ensures that each licensed activity is ring-fenced from other activities in the same group of companies All consumers have metered supply but more sophisticated meters and tariffs are used for industrial consumers than for households There are three transmission licences a distribution licence and also a market operator licence System Operator for Northern Ireland Limited (SONI) holds the TSO licence for Northern Ireland SONI also holds the market operator licence for Northern Ireland in conjunction with EirGrid A transmission licence is held by NIE Networks Limited in respect of ownership of the main transmission system A second is held by Moyle Interconnector Limited a subsidiary of Mutual Energy Limited (MEL) which owns the Moyle Interconnector assets linking the network to the GB system in Scotland
Ref C20-IRB-54-03
CEER Report on Regulatory Frameworks for European Energy Networks 2020
87156
NIE Networks also hold a distribution licence for their distribution system The Utility Regulator sets price limits for the monopolistic components of the electricity industry and ensures that end prices for consumers reflect efficient costs and reasonable levels of profitability The gas sector is split into three main areas transmission distribution and supply Gas transmission deals with the large high-pressure pipelines that convey gas to the distribution systems There are four transmission pipelines in Northern Ireland
bull SNIP (Scotland to Northern Ireland Pipeline) is 135 kilometres long and runs from Twynholm in Scotland to Ballylumford The SNIP is owned by Premier Transmission Limited which is part of the Mutual Energy Ltd group of companies
bull BGTP (Belfast Gas Transmission pipeline) is 26 kilometres long and is connected to the SNIP and to the North West Pipeline It also supplies gas to the Belfast distribution network The BGTP is owned by Belfast Gas Transmission Limited (BGTL) which is part of the Mutual Energy Ltd group of companies
bull NWP (North West Pipeline) is 112 kilometres long and runs from Carrickfergus to Coolkeeragh Power-station It is owned by GNI (UK) and
bull SNP (South North Pipeline) is 156 kilometres long and runs from Gormanstown in Co Meath to Carrickfergus where it links into the NWP It is also owned by GNI (UK)
Gas distribution deals with the medium and low-pressure gas mains that convey gas licenced areas within Northern Ireland There are three distribution licensed areas within Northern Ireland
bull Greater Belfast and Larne area - operated by Phoenix Natural Gas Limited (PNGL)
bull Ten Towns distribution area - operated by Firmus Energy (Distribution) Limited (FEDL) and
bull West distribution licensed area - operated by SGN Natural Gas Limited (SGN) The legislative framework that governs the energy industry in Northern Ireland includes
bull Energy (NI) Order 2003 httpwwwlegislationgovuknisi2003419contents
bull Electricity (NI) Order 1992 httpwwwlegislationgovuknisi1992231contents and
bull Gas (NI) Order 1996 httpwwwlegislationgovuknisi1996275contents Current Regulatory Frameworks Electricity Transmission In Northern Ireland the transmission system is owned by NIE Networks (the TAO) and operated by SONI (the TSO) who are certified under Article 9(9) arrangements of Directive 200972EC Both NIE Networks and SONI are part of wider corporate structures under the ownership of the Irish state government Moyle Interconnector Limited is also a certified TSO but this asset is operated and administered by SONI SONI is regulated on a revenue cap framework Controllable costs are set on an ex-ante basis with a WACC return for capital projects A 5050 mechanism exists for overunderspend on controllable costs SONI also earn a margin for performing a revenue collection function Certain non-controllable costs such as ancillary services are provided on a pass-through basis Mechanisms are also in place to provide additional revenue within period for unforeseen projects or pre-construction work associated with investments prescribed by the ten-year network development plan
Ref C20-IRB-54-03
CEER Report on Regulatory Frameworks for European Energy Networks 2020
88156
Typically speaking no catch-up efficiency target is applied to the TSO Rather a general productivity challenge is applied alongside an assessment of real price effects As the company bears no volume risk tariffs are adjusted via a correction (K-factor) adjustment on a t-2 basis to account for any overunder recovery of revenue It is our intention to move the TSO to a more incentive based regulatory framework going forward (See httpswwwuregnigovukpublicationssoni-price-control-final-approach) For the transmission asset owner (NIE Networks) the Utility Regulatorrsquos methodology for setting an efficient transmission allowance follows a traditional RPI +- X regulatory approach NIE Networks transmission allowance is set alongside their distribution price control This is discussed further in the distribution section below The regulated electricity revenue entitlements for network and market costs for 2019 - 20 can be found at the following link httpswwwuregnigovuksitesuregnifilesmediafilesRegulated20Entitlement20Values20201920202020-20Information20Notepdf Gas Transmission The regulatory framework for gas transmission is different depending on the TSO All the TSOs are certified under the full ownership unbundled arrangements Premier Transmission Limited (PTL) and Belfast Gas Transmission Limited (BGTL) are part of the Mutual Energy Limited (MEL) group These companies are all subject to a lsquomutualisedrsquo model In this model NI gas consumers absorb deviations between forecast and actual operating costs in return for an absence of equity fundingreturns from the business These TSOs have a lsquoshadowrsquo price control which sets out expectations While they carry no cost risk the licence holders have a reputational incentive to manage costs effectively in line with the lsquoshadowrsquo allowance GNI (UK) is a subsidiary of Gas Networks Ireland which is part of Ervia a utility infrastructure company owned by the government of the Republic of Ireland GNI (UK) is subject to a traditional lsquorevenue caprsquo framework In the case of GNI (UK) the allowance for controllable OPEX represents a fixed amount the licence holder will recover from consumers Any variation between this allowance and actual controllable OPEX is absorbed (or retained) by the licence holder In this instance the consumer is exposed to no operating cost risk Instead this risk is borne entirely by the shareholders of the licence holder and is reflected in the rate of return This provides the licence holder with a very clear incentive to effectively manage costs For all three TSOs the only spend they incur is OPEX Any maintenance or replacement costs are treated as operational spend GNI (UK) earn a WACC return on their initial pipeline construction costs PTL and BGTL networks are entirely debt financed by way of bond repayments A description of the gas TSO price control methodology for the period 2017-2022 is published under the following link httpswwwuregnigovukpublicationsgt17-final-determination-main-document Electricity Distribution The current 6th regulatory period for the electricity DSO has been effective since 1 October 2017 and lasts until 2024 (a six-and-a-half year period) The regulatory framework that was adopted for this period follows a traditional RPI +- X revenue cap approach
Ref C20-IRB-54-03
CEER Report on Regulatory Frameworks for European Energy Networks 2020
89156
OPEX costs are subject to efficiency challenge via yardstick benchmark modelling against GB comparators This modelling takes account of local circumstances in the form of special factors and regional price adjustments for labour costs Revenues are inflated by RPI inflation but subject to real price effect considerations and a general productivity challenge Capital costs are treated in three ways
bull Investment for which an ex-ante allowance is included in the determination
bull Investment carried out under the re-opener mechanism where costs will be determined at a later date when the need for the project has been confirmed and
bull Investment which is subject to a volume driver Capital costs earn a WACC return of 318 (real) though this is subject to adjustment following refinancing There are various uncertainty mechanisms in place and a variety of incentives based on delivery of key outputs aligned with cost control A new Reliability Incentive was introduced with annual financial incentives and penalties around performance on customer minutes lost The final determination can be found at httpswwwuregnigovukrp6-final-determination Gas Distribution The current price control for the three gas DSOs in Northern Ireland began on 1 January 2017 for a period of six years Phoenix and Firmus both have a revenue cap while SGN has a price cap in order to provide it with an incentive to outperform on volumes as it develops its distribution network The focus of the price control is to grow and develop the network to maximise the number of connections possible of which incentives are in place to achieve this The price control is based on a standard RPI-X framework Efficient operational costs are set by virtue of top-down benchmarking a bottom-up build-up of costs and application of real price effects and productivity challenge Capital costs are challenged on a similar basis An innovation fund is available if DSOs can make an economic case and justify why the cost should be funded by customers Various uncertainty mechanisms are also available to reflect the actual outcomes of performance and provide flexibility on workload priorities The description of this regulatory period for gas DSOs is published under the following link httpswwwuregnigovukpublicationsgd17-final-determination-final
Ref C20-IRB-54-03
CEER Report on Regulatory Frameworks for European Energy Networks 2020
90156
221 Norway Gas TSO Gas DSO Electricity TSO Electricity DSO
Ma
rke
t
str
uc
ture
Network operators NA 2 1 128
Network length NA 740 km ~12500 km
~102500 km ndash HV ~204700 km ndash LV (le 1kV)
Ownership NA
Public and private ownership
State ownership Mainly municipality
local public ownership
Ge
ne
ral
fra
me
wo
rk
Authority NA NVE-RME
System Under development Incentive regulation Revenue cap
Period Under development
Data is updated every year important factors (ie WACC-model) fixed for five years
Base year for next period
Under development Annual regulation based on cost data two
years back
Transparency Under development
Full transparency - Revenue caps efficiency scores all data script for calculation in R
Main elements for determining the
revenue cap NA Under development
Controllable and pass-through cost TOTEX efficiency benchmark Averagely efficient
company receives RoR
Legal framework Act on common rules for the internal market for gas with underlying
regulations
Energy Act with underlying regulations accounting legislation
Rate
of
retu
rn Type of WACC Under development Nominal pre-tax
Determination of the rate of return on
equity Under development CAPM
Rate of return on equity before taxes
Under development (Rf + Infl + βe x MP)(1 - t) = (25 + 233 +
0875 500)(1-024) = 12 19
Use of rate of return WACC is multiplied with RAB
Reg
ula
tory
as
se
t b
as
e
Components of RAB
Book values from financial statement adjusted with 1 working capital premium assets under
construction and grants funded assets are excluded
Regulatory asset value
Book values from financial statements
RAB adjustments BV + 1 working capital premium
Dep
re-
cia
tio
n
s
Method Linear depreciations from financial statements
Depreciation ratio Depending on asset type must be approved by accountant
Consideration Part of examined controllable costs
Introduction The present Norwegian Energy Act came into force on 1 January 1991 The Act unbundled the activities of generation and supply which can operate in competitive markets from transmission and distribution of electricity In order to achieve a competitive and efficient electricity market The Norwegian Water Resources and Energy Directorate (NVE-RME) regulates transmission and distribution system operators with a combination of direct regulation and incentive based economic revenue cap regulation The goal of the regulation is to promote efficient transmission and distribution of energy Norway has 128 electricity Distribution System Operators (DSOs) Statnett is the only Transmission System Operator (TSO) Norway does not have gas TSOs
19 Rf = Risk free rate Infl = Inflation βe = Equity Beta MP = Market premium t = tax rate
Ref C20-IRB-54-03
CEER Report on Regulatory Frameworks for European Energy Networks 2020
91156
The electricity system operators set their tariffs based on the allowed revenue (AR) 119860119877119905 = 119877119862119905 + 119875119879119905 + 119879119862119905 + 119877amp119863119905 minus 119862119864119873119878119905 + 119879119871119905 The allowed revenue is the sum of the revenue cap (RC) pass-through costs related to property tax (PT) and tariff costs to other regulated networks (TC) Approved RampD costs are also included To remove the time lag (TL) in the cost of capital recovery the difference between actual cost of capital (depreciations and return on assets) in the revenue cap year and the cost base from two years previously is included Furthermore any Costs of Energy Not Supplied (CENS) during the year are deducted from the allowed revenue CENS is a measure of the calculated value of lost load for the customers The CENS arrangement is a quality regulation providing an incentive for network operators to maintain their assets properly and to ensure necessary investments at a socioeconomically efficient level in order to avoid power outages The revenue compliance is subject to regulatory control Excess or deficit revenue for a given year is calculated as the difference between actual collected revenues and allowed revenues in a year Actual collected revenues include tariff revenues from customers congestion revenue and revenue from system operations NVE-RME decides an excessdeficit revenue balance every year The decision is made approximately one year after the RC is set when the companies have reported their actual costs in the RC-year The balance is to be adjusted towards zero over time through tariff changes Excess revenues must be reimbursed to the customers while deficit revenues may be recovered According to the economic regulation of network companies transactions within a vertically integrated company and transactions between the network company and other companies in the same group needs to be based on competitive market conditions Furthermore the national regulator may impose a specific method for cost allocation between areas of operation in vertically integrated companies NVE-RME audits annually a selection of the companies to reveal any cross-subsidies
Historical Development In the first regulatory period from 1993-1996 NVE-RME used rate-of-return regulation for the industry During this period NVE-RME prepared the implementation of a framework for revenue cap regulation that would give better incentives for cost efficiency than possible in rate-of-return regulation NVE-RME developed systems to collect data from the DSOs and a revenue cap model that included the use of DEA to set general as well as company specific efficiency targets In the second regulatory period 1997-2001 NVE-RME introduced a revenue cap model with a cost base that was based on the DSOrsquos own historical cost The regulatory rate of return was fixed at 83 The cost base was adjusted yearly to calculate revenue caps the cost base was increased by CPI and reduced by an efficiency target X The general efficiency target was 15 and individual efficiency targets were between 0 and 3 The revenue caps were also adjusted for new investments with a factor deducted from growth in distributed electricity In this period the incentives for cost efficiency increased from the first regulatory period To avoid incentives to reduce costs resulting in low quality of service NVE-RME introduced an incentive mechanism for quality of service in 2001 see Langset (2002)20
20 Langset T (2002) Quality Dependent Revenues ndash Incentive Regulation of Quality of Supply Energy amp
Environment 13(4) 749-61
Ref C20-IRB-54-03
CEER Report on Regulatory Frameworks for European Energy Networks 2020
92156
CENS was calculated based on price per MWh for energy that was not delivered due to outages An expected value of CENS was added to the revenue caps and actual value of CENS was deducted from allowed revenue when this was settled The regulatory model in the third regulatory period from 2002-2006 was similar to the second period The cost base was updated and based on data from 1996 to 1999 and minor changes were introduced to the benchmarking models The CENS model was expanded to differ between more customer groups (from two to six) and adapted to implicitly take into account heterogeneity among DSOs Similar to the second regulatory period the decoupling of the DSOsrsquo costs and revenues due to the use of up to ten-year-old data gave strong incentives for efficiency At the same time the time delay between costs and revenues created weak incentives for investments It also took time before efficiency improvements resulted in lower tariffs for end users In the fourth regulatory period from 2007-2012 NVE-RME introduced major changes to the model To address the weaknesses described above the CPI-X model was abandoned It was replaced with a hybrid model where each DSOrsquos share of the revenue cap was decided by a combination of the DSOrsquos own costs (cost plus) whereas the rest was decided by a cost norm This cost norm was estimated through benchmarking methods based on the costs of other comparable DSOs (yardstick competition) The cost base in the model was no longer fixed for the period but updated yearly This contributed to increase incentives for investments After two regulatory periods with strong incentives for cost efficiency the change was partly motivated to strengthen the incentives for investments Around 2005 increasing investments were expected in the industry A large part of the asset base had become rather old and there was need for reinvestments Reducing the lag of the cost base increased the incentives to invest During this period the incentives for quality were strengthened through expansion of the CENS arrangement The incentives for cost efficiency were still strong but these incentives were applied differently than in traditional CPI-X regulation The cost norms were calibrated so that on the industry level the sum of cost norms was equal to the sum of cost bases With this mechanism the industry as a whole got the regulatory rate of return and also DSOs with average efficiency DSOs that were more efficient than the average earned a higher return and the opposite outcome for the less efficient Since this model was applied yearly the implication was that the DSOs ldquocompetedrdquo for their share of the total revenue cap In the model DSOs that lagged behind the average performance of DSOs would experience a lower rate of return This mechanism incentivised efficiency and at the same time reduced time lag between costs and revenues Another feature of this period was the incorporation of environmental variables (Z-factors) in the cost norm This was important in order to increase the credibility of the model These Z-factors were included as outputs in the model In 2007 the DEA-model had one input (total costs) and nine output variables Five of these were related to network structure and four were Z-factors
The fifth regulatory period started in 2013 The main model framework from 2007 was maintained but several elements in the model were improved Disincentives for mergers and acquisitions were removed and incentives for participation in research development and pilot projects were strengthened The number of outputs in DEA were reduced and the method for adjusting for Z-factors was revised see Amundsveen et al (2014)21 Already in 2010 the Z-
21 Amundsveen Kvile Kordahl and Langset (2014) Second Stage Adjustment for Firm Heterogeneity In DEA A
Novel Approach Used in Regulation of Norwegian Electricity DSOs in Recent Developments in Data Envelopment Analyses and its Applications Proceedings of the 12th International Conference of DEA
Ref C20-IRB-54-03
CEER Report on Regulatory Frameworks for European Energy Networks 2020
93156
factors were moved to a second stage regression but in 2013 the changes were applied in order to meet some of the criticism towards this approach Also the model for calculating the regulatory rate of return (based on a weighted average cost of capital model) was updated to ensure the DSOsrsquo ability to be able to earn a reasonable rate of return on their assets (Langset and Syvertsen 2015)22 Determining the Revenue Caps NVE-RME regulates the network companies using an incentive-based revenue cap (RC) model The RC is set annually based on a formula of 40 cost recovery and 60 cost norm resulting from benchmarking models There is a two-year lag in the cost data The model is applied to operators of all electricity networks Statnett is benchmarked together with other European TSOs while the other network operators are benchmarked in models based on DEA There are separate models for local and regional distribution NVE-RME announces the RC for the coming year in November and the network companies set the tariffs accordingly In principle the only difference between the announced and the final RC for a year are the actual prices inflation and WACC that has to be estimated in the notification In addition to this any errors in the companiesrsquo cost or technical data discovered after the notification are corrected in the final RC Any changes in the rules and regulations will be subject to a public consultation implemented before the RC-year begins Changes in the methodologies not stated in the regulation are mainly subject to a consultation with affected parties but are also publicly available on NVE-RMErsquos website The RCs are calculated based on expected total costs using inflation-adjusted cost data from two years back The deviation between the expected total costs and the actual total costs of all companies in a year is included in the RC calculation two years later (eg the deviation between expected and actual costs for 2017 will be corrected in the RC for 2019) The total cost deviation is distributed among the companies using their share of the sectorrsquos total regulatory asset base This mechanism does not apply to the regulation of Statnett Efficiency Benchmarking NVE-RME implements two different efficiency assessment models for determining the revenue caps for DSOs in the local and regional distribution grids Both models follow the same three stage procedure 1 DEA ndash Compares efficiency solving specific tasks 2 Z-factor correction - Adjusts DEA scores from the 1st stage for differences in environmental factors Efficiency may increase or decrease dependent on target units Z-factors 3 Calibration - Addition to cost norm such that total industry cost base equals cost norm Ensures that averagely efficient companies receive a return equal to the NVE-RME-interest The inputs in the first and second stage of the calculation are essentially what differ in the two models The differences are depicted in the table below
22 Langset amp Syvertsen (2015) The WACC Model in the Regulation of the Norwegian Electricity Network
Operators ICER Chronicle ed
Ref C20-IRB-54-03
CEER Report on Regulatory Frameworks for European Energy Networks 2020
94156
TOTEX is used in a single input cost-minimising DEA assuming constant returns to scale Also the weighted values used as outputs in the regional distribution grid capture a lot of the differences between companies This is one of the important reasons the second stage analysis includes more variables of the local distribution compared to the regional distribution For readers interested in calculation specifics see our script (in R) for calculation on httpsgithubcomNVEIRiR General Sectoral Productivity Factor and Price Development NVE-RME does not implement any productivity factor As described above the total revenue cap for the industry is given Since the model is updated annually there are strong incentives for each DSO to reduce costs In order to maintain a given level of rate of return a DSO has to keep up with the development of the ldquoaverage DSOrdquo The large number of DSOs limits the effects of cartelisation National Specificities Some smaller DSOs are exempted from the regular RC-model described above These companies are compared to their own historical average cost Outlook NVE-RME currently has no plans on major model revisions The method for determining the WACC was subject to a public hearing in 2018 The WACC-model is fixed for a minimum of five years and was last revised in 2013
23 Including depreciations on grants funded assets Estimated using Principal Component Analysis
Local distribution Regional Distribution
Stage 1 - DEA
Input Outputs Input Outputs
1) TOTEX = OPEX
+ Depreciations23 + Return on BV
+ Cost of Network Losses
+ CENS
1) Number of customers
2) Length of HV network KM
3) Number of substations
1) TOTEX = OPEX
+ Depreciations + Return on BV
+ CENS
1) Overhead lines weighted
value 2) Ground
cables weighted value
3) Sea cables weighted value 4) Substations weighted value
Stage 2 Z-factor correction
Z-factors Z-factors
Mountain environments Forest environments
Coastal environments
Cold environments
City (share of grid laid as underground cables)
Forest environments (share of overhead lines in coniferous forest)
Ref C20-IRB-54-03
CEER Report on Regulatory Frameworks for European Energy Networks 2020
95156
222 Poland Gas TSO Gas DSO Electricity TSO Electricity DSO
Ma
rke
t
str
uc
ture
Network operators
1 entity 1 main entity and 52
local DSOs 1 entity 184 local DSOs
Network length ~11611 km24 ~138975 km25 ~15000 km ~815000 km
Ownership State-owned
Indirect state-owned public and
private State-owned
Public partly public and private
Ge
ne
ral
fra
me
wo
rk
Authority The President of Energy Regulatory Office (URE) (wwwuregovpl)
System
Cost of service with elements of revenue cap
Cost of service with elements of revenue cap
Mixed (Revenue cap with elements of incentive-based
regulation and elements of quality
regulation)
Period Calendar year 12 months Calendar year 2016-2020
Base year for next period
Mainly a year preceding the year of tariff submission for approval for which audited
financial statement is available
Mainly a year preceding the year of tariff submission
for approval for which audited
financial statement is available
The basis will be set when
developing the assumptions for the
next regulatory period
Transparency The approved tariffs and guidelines on WACC issued by the President of URE For TSO also publication of information
according to article 29 and 30 of NC TAR26
The approved tariffs and guidelines on WACC issued by the President of
URE
Tariffs assumptions on benchmarking
models and WACC guidelines
Main elements for determining
the revenue cap
Justified operating expenditures
depreciation local taxes and other fees cost of gas
losses and return on capital employed
Justified operating expenditures
depreciation local taxes and other fees cost of gas
losses pass-through costs and return on capital
employed
RoC + OPEX depreciation
property taxes losses costs of maintaining the system-related
standards of quality and
reliability of current electricity supplies
RoC (determined also by quality
regulation factors) + OPEX
depreciation property taxes
losses and pass-through costs
Legal framework
Energy Law Act and regulations of the Minister of Energy
EU law
Rate
of
retu
rn
Type of WACC Pre-tax nominal Pre-tax nominal
Determination of the rate of
return on equity
Cequity pre-tax=(Risk-free rate + βequity equity risk premium)(1-corporate tax rate)
(Risk-free rate + βequity equity risk premium)(1-corporate tax rate)
Rate of return on equity
before taxes
726027 =(3187+05986450)(1-
19) 6754=(2430+0724420)(1-19)28
Use of rate of return
In allowed revenue we include RoC = WACC RAB
24 High-methane and low-methane natural gas transmission network (including SGT transit pipeline) 25 For main entity high-methane and low-methane natural gas network 26 Commission Regulation (EU) 2017460 of 16 March 2017 establishing a network code on harmonised
transmission tariff structures for gas (OJ L 72 of 17 March 2017 p 29) 27 Value included in the calculation of gas TSO tariff for 2020 28 The risk-free rate is updated every three months both for gas and electricity companies
Ref C20-IRB-54-03
CEER Report on Regulatory Frameworks for European Energy Networks 2020
96156
Re
gu
lato
ry a
sse
t
ba
se
Components of RAB Tangible fixed assets in use and intangible
assets deducted by assets financed by subsidy
Fixed assets assets under construction intangible assets
Regulatory asset value
Set for every tariff Re-evaluated assets
RAB adjustments
Adjustments of return of capital included in allowed revenue are possible during tariff
calculation Annually Annually
De
pre
cia
tio
ns
Method Straight-line Straight-line
Depreciation ratio
Economic useful life is set according to requirements of accountancy law for adequate groups of fixed assets Approximate EUL for compressors equals 5 years measuring stations 15 years pipelines and buildings 40 years
For transformers and substations economic useful life is 30-40 years For new investments an average depreciation value of all investments (eg transformers substations IT systems meters) equal to 4 is allowed
Consideration A component of allowed revenue
Regulatory Framework The President of URE29 is the head of a central body of government administration accountable for regulation of fuels and the energy economy Their competence referred to in article 23 of the Energy Law Act of 10 April 1997 embraces inter alia granting and revoking licences approving tariffs and controlling their application and the promotion of competition as well The President of URE regulates activities of energy enterprises with the aim of balancing interests of these companies and customers The legal framework for regulation of transmission and distribution of gaseous fuels and electricity is constituted by Energy Law Act and regulations of the Minister of the EconomyEnergy on detailed terms for structuring and calculation of tariffs and on detailed terms of the transmission systems operation Network Tariffs ndash Allowed Revenue Components Energy enterprises dealing with transmission and distribution (both of gas and electricity) are obliged to hold a licence and perform billing basing on tariffs approved by the President of URE According to article 47 of the Energy Law Act tariffs are set by energy enterprises and submitted for approval by the President of URE who approves the tariff or refuses it if they assess that the tariff has not been set in line with provisions of articles 44-46 thereof Generally gas transmission and distribution tariffs must cover justified costs of conducting the licensed activity (set ex-ante) and a justified return on capital employed Moreover the protection of the customerrsquos interest against unjustified level of prices and charges must be taken into account Allowed or target revenue in case of gas network tariffs consists of planned reasonable operating expenditures depreciation local taxes and other fees cost of gas losses and return on capital employed In the WACC calculation for 2017 and 2018 the notional gearing of 2575 and 3070 was applied respectively whereas before the year 2017 the actual one derived from the latest audited financial statement of the regulated entity According to the WACC setting methodology for gas system operators for years 2019-202330 the share of debt will increase annually by four percentage points starting from 34 in 2019
29 URE ndash Urząd Regulacji Energetyki (English Energy Regulatory Office) 30httpswwwuregovplplbiznestaryfy-zalozeniazalozenia-dla-kalkulacj-27834Pismo-Prezesa-Urzedu-
Regulacji-Energetyki-do-przedsiebiorstw-energetycznychhtml
Ref C20-IRB-54-03
CEER Report on Regulatory Frameworks for European Energy Networks 2020
97156
For electricity network companies allowed revenue consists of planned reasonable operating expenditures depreciation local taxes and other fees cost of losses return on capital employed and costs of maintaining the system-related standards of quality and reliability of current electricity supplies In WACC for electricity an equal ratio of debt to equity is applied The risk-free rate applied in the calculation of WACC for a specific quarter of the year is published by the President of URE at the beginning of each quarter It corresponded to the average profitability of the fixed rate ten-year Treasury bonds with the longest maturity listed on Treasury BondSpot Poland over 18 months preceding the current quarter for electricity infrastructure companies and over 36 months for gas system operators All data necessary for the WACC calculation is published Guidelines on WACC calculation for gas network companies are included in the document The methodology for a calculation of cost of capital employed by gas network companies for years 2019-2023 published on URErsquos website31 The main component of RAB for gas assets is made up by tangible fixed assets in use and intangible assets32 revealed in the latest audited financial statement of the gas network company deducted by assets financed by subsidy Remunerated assets include the average value (from tariff period and previous period) of planned capital expenditures from network development plans accepted by the President of URE deducted by planned connection fees and corrected in some cases by a coefficient indicating the average underperformance of planned capital expenditures in previous years Moreover an average planned depreciation for the tariff year and previous year is subtracted Guidelines on WACC calculation for electricity network companies are included in the document The methodology for a calculation of cost of capital employed by electricity network companies for years 2016-2020 published on URErsquos website33 RAB is based on re-evaluated assets The re-valuation of the RAB was done for 31 December 2008 In the subsequent years the RAB was adjusted primarily due to investments deprecation and connection fees The compliance of a proposed tariff with the specific provisions of law is verified under the administrative procedure which finishes with the decision of the President of URE (approving a tariff or refusing to approve it) In proceedings for tariff approval the President of URE carries out a detailed analysis of costs which constitute the basis for calculation of transmission and distribution charges making sure that there are no cross-subsidies between licensed and unlicensed activities and between different types of licensed activities Justified costs used for calculation are set according to articles 44 and 45 of the Energy Law Act and rules of cost recording stipulated in the accountancy act The basis of verification of these costs is the audited financial statement from previous year referred to in article 44 paragraph 2 of the Energy Law Act Additionally energy enterprises are obliged to deliver quarterly reports on their activity (including inter alia amounts of gas sold revenue costs and investment expenditures) according to URErsquos template The tariff decision of the President of URE together with the tariff itself (the document containing transmission charges and conditions of its application) are published in the Bulletin of URE available on URErsquos website within 14 days of the approval date Energy enterprises
31 httpbipuregovplbiptaryfy-i-inne-decyzjezalozenia-dla-kalkulacj2189Zalozenia-dla-kalkulacji-i-redakcji-taryf-przedsiebiorstw-sektora-gazowegohtml 32 net value ie deducted by depreciation 33 httpbipuregovplbiptaryfy-i-inne-decyzjezalozenia-dla-kalkulac2299Zalozenia-do-kalkulacji-taryf-OSD-na-
rok-2016html
Ref C20-IRB-54-03
CEER Report on Regulatory Frameworks for European Energy Networks 2020
98156
apply tariffs not earlier than after 14 days and not later than the 45th day from the publication date with the exception of tariffs for gas transmission which are applied in the period specified in the decision approving the tariff but not earlier than after 14 days from the publication thereof If a concerned energy enterprise is not satisfied with the President of URErsquos decision approving or denying approval of the tariff it can appeal against it within a 14-day period to the Court of Competition and Consumer Protection The appealed tariff is not applied Gas TSO Tariff There is one gas TSO in Poland ndash OGP GAZ-SYSTEM SA It operates its own transmission network and the network owned by SGT EuRoPol GAZ SA (Yamal pipeline) under the ISO formula The tariff methodology is compliant with European and domestic law supplemented by guidelines issued by the President of URE The postage stamp cost allocation methodology is applied There is no distinction between domestic and cross-border transmission tariffs ie the same tariff applies both for domestic and cross-border network users In the case of gas storage facilities and LNG facilities connected to the transmission system an 80 and 100 discount is applied respectively The transmission tariff is calculated and approved for a calendar year The regulatory period equals one year
The details of tariff calculation are included in the decision of the President of URE on reference price methodology for years 2020-2022 issued pursuant to article 27(4) of the NC TAR34 Gas DSOsrsquo Tariffs As of 31 December 2017 in Poland only one DSO was operating that was undergoing legal and functional unbundling requirements ndash Polska Spoacutełka Gazownictwa sp z oo35 whose main shareholder was PGNiG SA This company carries out its business activity involving the distribution of gaseous fuels using low- medium- and high-pressure distribution networks for customers located throughout Poland In addition in Poland 52 local DSOs were operating which were not obliged to unbundle their distribution and trading activities Very often the share of gas supplying revenues for these companies made up a marginal amount of total revenues The methodology of justified costs setting and return on capital employed calculation are much the same as for TSO tariffs but instead of entryexit tariffs a group tariffs approach is applied In case of companies conducting an integrated activity (distribution and supply of gas) the tariff incudes prices of gas for households because the obligation to apply regulated prices of gas will remain in force until 31 December 2023 (according to Energy Law Act art 62b) Electricity Grid Operators Regulation There is one Transmission System Operator (TSO) in Poland ndash a state-owned company PSE SA It runs its business activity under a licence for electricity transmission granted by the President of URE and valid until 31 December 2030 Distribution System Operators (DSOs) operating within vertically integrated companies and serving more than 100000 customers connected to their grids are obliged to be independent in terms of legal form organisational structure and decision-making (Article 9d of the Energy Law Act) There are 184 DSOs authorised by the President of URE including five entities
34httpbipuregovplbiptaryfy-i-inne-decyzje-binne-decyzje-informacj3777Inne-decyzje-informacje-
sprawozdania-opublikowane-w-2019-rhtml 35 Polish Gas Company Ltd
Ref C20-IRB-54-03
CEER Report on Regulatory Frameworks for European Energy Networks 2020
99156
legally separated from former integrated distribution companies and 179 DSOs not obliged to be legally unbundled Almost all DSOs not obliged to be legally unbundled perform their functions in systems not connected directly to the transmission grid but to the distribution networks of the five legally unbundled operators Tariffs for Electricity Grid Operators The TSO tariff is set as a one-year tariff and approved by the President of URE although tariffs are derived from a long-term (multi-year) regulation of the TSO Cost of service and revenue cap methods are used in tariff setting The WACC determining method was adopted for years 2016-2020 (both for TSO and DSOs) The regulatory period for five biggest DSOs is five years (the current one at time of writing being 2016-2020) Nevertheless the tariffs are approved annually by the President of URE Mixed type of regulation ie revenue cap with elements of incentive-based regulation and quality regulation is used Models for OPEX and grid losses were established for above mentioned regulatory period The X-coefficients were included in charges for the first year of regulatory period and were set for the next years A quality charge (for maintaining power system standards) is also included in tariffs of the TSO and DSOs For DSOs elements of quality regulation were introduced for regulatory period 2016-2020 The regulation assumes the use of a quality factor Qt which influences return on capital Qt factor depends on DSOrsquos performance in the field of supply quality measured inter alia by SAIDI and SAIFI indicators TSOsrsquo and DSOsrsquo Network Development Plans (Electricity and Gas) The network development plan should ensure a long-term maximising of capital expenditures efficiency and costs incurred by energy enterprises so that in particular years the capital expenditures and costs would not cause excessive increase in prices and charges for the supply of electricity and gas while ensuring continuity reliability and quality of supply CAPEX which influences the return on capital employed and depreciation included in tariff calculation is agreed by energy enterprises with the President of URE in the network development plans The energy enterprises involved in the transmission or distribution of electricity prepare network development plans for their area of operation in terms of satisfying current and future demand for electricity for a period not shorter than three years excluding the TSO preparing the plan for a ten-year period and DSOs for at least five years The plans are updated every three years The energy enterprises involved in the transmission or distribution of gaseous fuels are obliged to draft network development plans for their area of operation in terms of satisfying current and future demand for gas In the case of the TSO the plan is drafted for a ten-year period while in the case of DSOs for five-year period The plans of the TSO and DSOs are updated every two years excluding plans of the TSO pertaining to entrusted transmission networks which are updated on yearly intervals Currently such case applies only to Yamal Transmission Network which is entrusted by SGT EuRoPol GAZ SA (the owner) to OGP Gas-System SA (TSO) under the ldquoISOrdquo unbundling model It might be added that development plans are elaborated in case of distribution and transmission systems pertaining to natural gas but also to other gaseous fuels
Ref C20-IRB-54-03
CEER Report on Regulatory Frameworks for European Energy Networks 2020
100156
223 Portugal Gas TSO Gas DSO Electricity TSO Electricity DSO
Ma
rke
t
str
uc
ture
Network operators
1 (REN) 11 1 (REN) 1 (EDP)36
Network length
1375 km 18987 km 9002 km 226530 km
Ownership Private ownership
Ge
ne
ral
fra
me
wo
rk
Authority Entidade Reguladora dos Serviccedilos Energeacuteticos (ERSE)
System Price-cap (OPEX) and rate of return
(CAPEX)
Price-cap (OPEX) and rate of return
(CAPEX)
Price-cap (OPEX) and standard
costsrate of return (CAPEX)
Price-cap and rate of return (HVMV) and TOTEX (LV)
Period 4 years (current period 2020-2023) 3 years (current period 2018-2020)
Base year for next period
Last real year
Transparency Tariff code Tariff board and Tariff documents
Main elements for
determining the revenue
cap
Non-controllable and controllable
costs RAB WACC efficiency
benchmark inflation mechanism for
attenuation of tariff adjustments
Non-controllable and controllable
costs RAB WACC efficiency
benchmark inflation
Non-controllable and controllable costs RAB WACC efficiency benchmark
inflation incentives general economic interest costs
Legal framework
Decree-Law No 2312012 of 26 October Decree-Law No 215-B2012 of 8 October
Rate
of
retu
rn
Type of WACC Nominal pre-tax
The WACC (Pre-tax) is indexed to the Portuguese 10-year bond benchmark and depends in each year on its evolution with a cap and a floor
Tax rate = 315 Tax rate = 315
Determination of the rate of
return on equity
Capital Asset Pricing Model (CAPM)
The Market Risk Premium=Risk Premium for Mature Market+Country Risk spread
Risk Premium for Mature Market = Spread between SampP500 and USA 10 years treasury bond yields since 1961
Country Risk spread = Spread between Portuguese 10 year bond yields and 10 year bond yields of Germany Finland Austria Netherlands and France
Rate of return on equity
before taxes
67 71 79 85
Initial values for the regulatory period (July 2019)
Initial values for the regulatory period (January 2018)
Use of rate of return
WACC is currently based on 50 debt and 50 equity applied to RAB
WACC is currently based on 55 debt and 45 equity applied to RAB
Reg
ula
tory
as
se
t
ba
se
Components of RAB
Fixed assets deducted from third partiesrsquo contributions
Regulatory asset value
RAB is based on historical and re-evaluated costs
RAB is based on historical costs and
standard costs
RAB is based on historical costs
RAB adjustments
Each year the RAB is adjusted in order to consider new investments write-offs and depreciation
36 Due to the volume of information the table only include data about the regulated distribution network operator of
Mainland Portugal
Ref C20-IRB-54-03
CEER Report on Regulatory Frameworks for European Energy Networks 2020
101156
De
pre
-
cia
tio
ns Method Straight line depreciation
Depreciation ratio
5-45 years 5-40 years 15-30 years 5-40 years
Consideration Part of CAPEX
Introduction In Portugal the regulation of the electricity sector is focused on transmission system management distribution last resort supplier and energy purchase and sale activities In the Autonomous Regions of the Azores and Madeira in addition to those activities the regulation also focuses on the energy acquisition and global system management activity37
In addition to those activities in the natural gas sector (Mainland Portugal only) the regulation also focuses on the global system management activity underground storage activity and reception storage and regasification of LNG activity More recently a new regulated activity has been created the supplier switching activity ERSE is responsible for regulation which encompasses monitoring of markets and infrastructures and annual tariff fixing Historical development The regulation of the electricity sector began in 1999 having undergone a major change in 2007 with the liberalisation of the markets At that time the figure of the last resort supplier was autonomised which until then was under the purview of the distribution network operator In the natural gas sector regulation began in gas year 2007-2008 for the high-pressure activities and in gas year 2008-2009 for the remaining activities In both sectors regulation of regulated activities has been based mostly on incentive regulation (price-cap and revenue-cap) for OPEX and on the application of the rate of return to investments in CAPEX TOTEX approach has also been applied in some activities and standard investment cost in others However throughout the regulatory periods there has been a need to change to other methodologies Therefore there are also other incentives such as incentives for quality of service losses reduction and smart grids as outlined below The main aspects of the type of regulation followed by ERSE are (i) the application of reference costs in the electricity transmission activity from the 2009-2011 regulation period (ii) the modification in 2012 of the price cap methodology applied to TOTEX in the distribution activity to a price cap methodology applied to OPEX and rate of return to CAPEX and (iii) the application of the price-cap methodology to TOTEX in the low voltage distribution activity in the regulatory period 2018-202038 In the Autonomous Regions the definition of reference costs for fossil fuels consumed in electricity generation in the energy acquisition and the global system management activity should also be highlighted as well as the application of an incentive regulation to the three activities of the Autonomous Regions from the 2009-2011 regulatory period 39
37 The electricity generation activity in the Autonomous Regions of the Azores and Madeira is regulated and is not
liberalised because these regions benefit from a derogation from the application of Directive 200354 EC 38 TOTEX approach was applied into distribution activity between 1999 and 2011 39 In the activity of Energy Acquisition and Global System Management incentive regulation only started in 2012
Ref C20-IRB-54-03
CEER Report on Regulatory Frameworks for European Energy Networks 2020
102156
In natural gas at the beginning of the regulatory period 2016-2017 to 2018-2019 a mechanism was introduced to transmission and distribution activity that seeks to mitigate the effects associated with the volatility of demand in the amount of allowed revenues to be recovered by tariffs In the same period for the reception storage and regasification of LNG activity and subterranean storage activity a mechanism was applied to mitigate tariff adjustments recognising the positive externalities that this activity brings to all of the Natural Gas National System In the global system management activity regulation changed from an accepted cost model to an incentive regulation model (revenue cap) In natural gas a new regulatory period started in 2020 and goes to 2023 It was the first time that a regulatory period of four years was defined In addition the regulatory period coincides with the calendar year instead of the gas year (from June of one year to July of the following year) The main changes for this new regulatory period were differentiation in the investments with cost recovered though tariffs according to their nature and taking into account the fulfilment of their initial objectives sharing between companies and consumers of the results of efficiency targets application improvements in the reporting of audited information for regulatory purposes and the extinction of the mechanism applied to distribution activity to mitigate the effects associated with the volatility of demand Regulatory Process ERSE is responsible for preparing and approving the Tariff Code which establishes the methodology to be used for calculating tariffs as well as the ways to regulate the allowed revenues The approval of the Tariff Code is preceded by a public consultation and an opinion from ERSEs Tariff Board ERSErsquos tariff-setting process including its time frame is also defined in the code The allowed revenues of each regulated activities are recovered through specific tariffs each with its own tariff structure and characterised by a given set of billing variables The methodologies and parameters for the tariff calculation are evaluated and fixed at the beginning of each regulation period to be applied during that period Determining allowed revenues The allowed revenues are calculated based on the information sent annually by the regulated companies real audited data and estimated data At the beginning of each regulatory period the companies send their cost forecasts for the entire new regulation period The ldquocost basesrdquo considered in the price-cap and revenue-cap methodologies result from critical analysis of the companiesrsquo operating costs (net of additional income) controllable and non-controllable costs and investment costs It should be noted that there are other costs that are allowed outside the ldquocost basesrdquo therefore not subject to efficiency this is the case for concession rents and actuarial gains and losses The definition of efficiency targets with the objective of reducing controllable costs is based on international and national benchmarking studies through the application of parametric and non-parametric methods Specifically the Corrected Ordinary Least Squares (COLS) and Stochastic Frontier Analysis (SFA) methodologies are used in the parametric models and the Data Envelopment Analysis (DEA) methodology is used in the non-parametric models Regarding investments in addition to the analysis of the values sent by the companies each year ERSE also takes into account the Development and Investment Plan prepared every two years by each sectorrsquos transmission and distribution network operators in HVMV
Ref C20-IRB-54-03
CEER Report on Regulatory Frameworks for European Energy Networks 2020
103156
In addition to the definition of the accepted costs incentives are also defined For the electricity distribution activity these consist of incentives for quality of service losses reduction and for investments in smart grids Recently ERSE has defined a new output-based incentive which aims to lead the DSO to deliver to consumers value-added services enabled by smart grids The amount of this incentive is based on the sharing between the DSO and consumers of the benefits generated by such services To access it the DSO must demonstrate that it provides a package of ldquokey smart-grid servicesrdquo For the electricity transmission activity there is an incentive for efficient investment in the transmission network through the use of reference prices in the valuation of the new equipment to be integrated in the network and an incentive to increase the availability of the elements of the transmission network In the current regulatory period the incentive for the maintenance of end-of-life equipment was replaced by incentives to economic rationalisation of costs Asset base remuneration The remuneration of the asset base is calculated using a pre-tax nominal WACC The methodology used for setting the cost of equity is the Capital Asset Pricing Model and the cost of debt is set using a default spread model where a spread (debt premium) is added to the risk-free rate Due to some uncertainty remaining and volatility of the financial environment the rate of return is updated ex-post each year in order to reflect the evolution of financial market conditions The WACC (pre-tax) to be applied in the regulatory period is indexed to the Portuguese 10-year bond benchmark and depends each year on its evolution with a cap and a floor The floor is 450 for the electricity TSO and 475 for an electricity DSO The cap is 950 for the electricity TSO and 975 for an electricity DSO The floor is 450 for the gas TSO and 470 for a gas DSO The cap is 880 for the gas TSO and 900 for gas DSO For the electricity regulatory period 2018-2020 a 075pp (percentage points) premium is added to the electricity TSO WACC for investments after 2009 when their cost is considered efficient using a methodology where real and standard costs for those investments are compared
ROE parameters Portugal
GasElectricity Gas Electricity
TSO DSO TSO DSO
Risk free rate (nominal) 057 057 100 100
Tax rate 3150 3150 3150 3150
Equity risk premium 650 650 766 766
Equity beta 062 066 058 063
Cost of equity (before taxes) 668 708 794 850
Ref C20-IRB-54-03
CEER Report on Regulatory Frameworks for European Energy Networks 2020
104156
Allowed revenue adjustments The allowed revenues from each activity are adjusted after two years based on real audited values For price-cap and revenue-cap methodologies the adjustments made result from changes in the level of cost drivers In energy purchase and sale activities given their more volatile nature the adjustments are made after one year based on estimated values Costs accepted outside the cost base are also recalculated on the basis of actual values For the natural gas sector all activities undergo adjustments at the end of one year (estimated adjustment) and at the end of two years (actual adjustment) The values of the actual adjustments are deducted from the estimated adjustments in the activities where this calculation is made The values of the adjustments are incorporated into the allowed revenues of the year with the appropriate financial update National Specificities In the electricity sector there are regulated activities in Mainland Portugal and the Autonomous Regions while in the natural gas sector they operate only in Mainland Portugal In addition to the electricity distribution network operator in HVMV and LV there are ten LV distribution network operators that operate locally In the electricity sector 13 of allowed revenues recovered through tariffs are costs arising essentially from political decisions the so-called General Economic Interest Costs (CIEGs) In the natural gas sector the distribution activity is licensed by different geographic areas but is subject to the same regulatory methodologies As mentioned in the natural gas sector at the high-pressure level mechanisms have been created to mitigate extreme volatility of demand when it occurs
Ref C20-IRB-54-03
CEER Report on Regulatory Frameworks for European Energy Networks 2020
105156
224 Romania Gas TSO Gas DSO Electricity TSO Electricity DSO
Ma
rke
t s
tru
ctu
re Network
operators 1 36 1 8 (concessionaires)
46 (non-concessionaries)
Network length 13381 km 51015 km 8897 km
326241 km (+167204 km - final
connections)
Ownership Private and public
ownership Private and public
ownership Mainly public
ownership
Mainly private investors indirect public ownership
Ge
ne
ral
fra
me
wo
rk
Authority ANRE (National Regulatory Authority for Energy)
System Incentive Regulation Revenue cap Revenue cap Revenue cap Price cap Cost+
Period Generally 5 years current period 2019-2023(DSO) - 5 years current period July2012-Sept2019 (TSO) -7 years next period Oct 2019-Sept 2023
5 years current period
2020 - 2024
5 years current period
2019 ndash2023
Base year for next period
last year of current regulatory period 5th year in current regulatory period
Transparency Tariffs methodologies approved revenues and tariffs general rules for efficiency art
29 and 30 requirements of Reg (EU) 4602017
Tariffs methodologies approved tariffs general rules for efficiency
Main elements for determining
the revenueprice
cap
Non-controllable (pass-through) and controllable costs efficiency factor general inflation rentability of RAB
(RABxRoR) depreciation technological consumption
Non-controllable and controllable OPEX variable costs RAB depreciation rentability of RAB (RABxWACC)
Legal framework Energy and Gas Law 1232012
ANRE Order 2172018 for distribution activity and Order 412019 for transmission
activity
Energy and Gas Law 1232012
ANRE Order no 1712019
Energy and Gas Law 1232012 ANRE Ord no 1692018 and
Order no 1682018
Rate
of
retu
rn
Type of WACC Nominal WACC post-tax determined using CAPM method
WACC is used in determination of rate of return
Real Pre-TAX
Determination of the rate of
return on equity
WACC = CCPKp(1 ndash T) + CCIKi () CCP - equity cost of capital real post-tax () CCI ndash loan capital cost pre-tax () Kp ndash weight of equity capital in total capital Ki ndash weight of loan capital in total capital Ki=(1-Kp) T ndash rate of income tax for regulated period
Sum of risk-free rate and a market risk premium multiplied with beta
Rate of return on equity before
taxes
69 approved by
the government from April 2019
until 29 April 2020 566 for 30 April-
12 May 2020 RRR=639 for 13 May-until the end of the regulatory period namely
December 2023 The rates of 566
and 639 were approved by
ANRE
69 approved by the government from
April 2019 until 29 April 2020 566 for
30 April-12 May 2020
RRR=639 starting from 13 May-until the end of the regulatory
period namely September 2024
The rates of 566 and 639 were
approved by ANRE
RRR=69 approved by the
government starting with April
2019 Starting on 13 May
2020 ANRE approved a new
value for RRR=639
RRR=566 approved by ANRE from January until
March 2019 RRR=69
approved by the government
starting with April 2019 Starting on
13 May 2020 ANRE approved a
new value for RRR=639
Ref C20-IRB-54-03
CEER Report on Regulatory Frameworks for European Energy Networks 2020
106156
Use of rate of return
Granted for initial RAB (privatisation value) existing assets and new assets
- RAB value at the beginning of each regulatory period (Remaining value of initial privatisation RAB and the other existing assets) is multiplied with RoR an included in the regulated revenue
- Beginning with the 2nd year of the regulatory period each year new entries are multiplied with RoR and included in the regulated revenue
Granted for initial RAB (privatisation value) for existing assets and for new
assets RRR is multiplied with whole RAB Debt and equity percentages are 4060
Reg
ula
tory
as
se
t b
ase
Components of RAB
Fixed assets working capital
Historical costs multiplied with index costs
Investments in new assets after the base year led to an adjustment of the CAPEX
Regulatory asset value
The RAB value consists in historical assets value and value of the new investments
The value of the new investments included in RAB is considered to be the accounting
value For each year of the regulatory period the RAB value increases with the investment in new assets and decreases
with depreciation and the value of the asset that exits before complete depreciation
The assets of the base year used as initial RAB For each year of the regulatory
period the RAB value increases with the investment in new assets and decreases
with depreciation and the value of the asset that exits before complete
depreciation For RAB existing on 1 January 2005 or the privatisation date it was a fair value of the assets updated with inflation For the rest of the assets based on historical costs updated with
inflation
RAB adjustments
Investments in new assets after the base year and assets that exit before complete
depreciation led to an adjustment of
the CAPEX
Investments in new assets after the base year and assets that exit before complete depreciation led to
an adjustment of the CAPEX
The plus value that resulted from the
revaluation of assets but limited
to RAB adjusted with
CPI
RAB adjusted with CPI but limited by the current value of
the assets
Dep
rec
iati
on
s
Method Straight line
Depreciation ratio
Depending on asset type Buildings 50 years
Pipes and technical inst 40 years Other between 7 and 20 years
Land not included
Depending on asset type Ratio between 2 and 166 eg
lines amp cables 25-10 stations 2
Consideration Part of regulated revenue The depreciation calculated for the
previous year asset entries is directly and 100 integrated into the regulated
revenues Afterwards when the tariff adjustments are made the depreciation
already included in the regulated revenues is adjusted with inflation rate
Part of regulated revenue Depreciation is included directly and 100 in revenue
before the linearisation
Introduction The Romanian Energy Regulatory Authority (ANRE) is the regulatory authority responsible in Romania for approving methodologies and tariffs for electricity and gas networks For electricity ANRE is responsible for regulating the Romanian TSO (there is only one) eight operators holding the concession of distribution service (ODCs) and other distribution operators (ODs)
Ref C20-IRB-54-03
CEER Report on Regulatory Frameworks for European Energy Networks 2020
107156
For gas ANRE is responsible for regulating the Romanian TSO (there is only one) and 31 operators holding the concession of the distribution service (DSOs) Historical Development An incentive-based regulatory regime was introduced in 2005 for the two TSOs (for setting transmission tariffs) and ODCs The methodology for setting electricity transmission tariffs uses a revenue cap regulatory system ANRE uses a price cap methodology (tariffs basket cap) for setting electricity distribution tariffs applied by ODC For ODs (other electricity distribution operators then concessionaires) a cost-plus methodology is in force For setting regulated gas tariffs starting in 2019 ANRE uses for both distribution and transmission activities a revenue cap methodology Determining the RevenuePrice Caps For electricity the revenueprice caps for electricity network operators (the TSO and ODCs) are set for a five-year regulatory period The current regulatory period is from 2020 to 2024 for transmission and from 2019 to 2023 for distribution Each revenue cap is composed of the non-controllable operating and maintenance costs controllable operating and maintenance costs (applying an efficiency factor for reducing inefficiencies) costs of electricity losses costs of RAB depreciation and rentability of the RAB (RAB x WACC) There are efficiency requirements for controllable OPEX and for costs of electricity losses WACC is set in the reference year for the next regulatory period and can be updated during the regulatory period in order to reflect the evolution of the financial market conditions The following assets are eliminated from evaluating the RAB
bull Grants fees received from new customer connections
bull Assets which are conserved and assets that are still under construction and
bull Inefficient investments and other that do not follow the prudence criteria provided by regulations
For gas the revenue cap for the TSO and DSOs are set for a five-year regulatory period Each revenue cap is composed of the controllable (applying an efficiency factor for reducing inefficiencies) and non-controllable (pass-through) costs technological consumption costs costs of the RAB depreciation rentability of RAB (RAB x RoR40) and general inflation Efficiency Requirements Electricity The level of controllable operating and maintenance costs (controllable OPEX) for the first year of the regulatory period is set by ANRE based on an efficiency benchmarking An efficiency requirement (X-factor) is applied on controllable OPEX during the regulatory period An X-
40 Rate of Return
Ref C20-IRB-54-03
CEER Report on Regulatory Frameworks for European Energy Networks 2020
108156
factor equal to 2 is applied annually to the controllable OPEX for transmission in the current regulatory period For distribution (ODC) the X-factor is 2 for the regulatory period 2019-2023 For the level of electricity losses recognised in tariffs ANRE imposed targets at the beginning of the regulatory period that have a declining trend during the regulatory period For the electricity price recognised for acquiring the energy required to cover electricity losses ANRE considers a limit equal to the average of the prices recorded by ODC The investment plan for the entire regulatory period is verified in terms of necessity opportunity efficiency cost of investments The structure of the plan is also verified and the plan is approved ex-ante by ANRE The estimated benefits that justify the efficiency of every investment in electricity network is evaluated ex-ante and also ex-post by the network operator and reported to ANRE ANRE removes from the RAB the investments that prove ex-post to be inefficient because the expected benefits are not confirmed Gas The level of controllable and pass-through costs for the first year of the regulatory period is set by ANRE based on the analysis performed on the cost submitted by the TSO and DSOs An efficiency factor (X-factor) is applied on controllable OPEX during the regulatory period For distribution (DSO) the X-factor is set to 1 for each year of the regulatory period 2020-2023 For transmission (TSO) the efficiency was set to 15 for each year of the fourth regulatory period (1 October 2019 to 30 September 2024) Price Development The revenuetariffs basket caps take account of the development of consumer prices in relation to the base year (CPI-X regime) General price increases lead to an increase in the revenue cap Regulated tariffs for gas are yearly adjusted within each regulatory period and consideredreflected in the regulated prices Quality Regulation ANRE sets quality indicators for service quality and reliability for electricity and gas For electricity distribution there are also set minimum levels for individual indicators like number and duration of interruptions in power supply The distribution operator must pay compensation to the users of the grid when the minimum levels imposed are exceeded Compensation paid by the operator are not justified costs to be recognised in regulated tariffs Adjustments After the Reference Year Each year ANRE calculates revenue corrections due to inflation investment non-controllable (pass-through) operating and maintenance costs changes in energy volumes and losses (quantity and price of losses) The value of the revenue correction is included in the revenue used to determinate tariffs for the next year for both electricity and gas For electricity if the accomplished value of annual investments is less than 80 of the predicted value taken into consideration an annual revenue adjustment is made In this way ANRE ensures that unused revenues are recovered as quickly as possible These annual adjustments are considered at the end of the regulatory period for the final corrections
Ref C20-IRB-54-03
CEER Report on Regulatory Frameworks for European Energy Networks 2020
109156
For gas ANRE calculates revenue and tariff corrections due to differences in total revenue generated by volumes variations inflation investment pass-through costs and technological consumption Transparency The data published on the ANRE website include the tariffs and an informative note with details on the analysis used for calculating the revenue caps and annual adjustments For gas ANRE publishes on its website the tariffs for each operator (TSO and DSOs) Outlook For all regulated activities electricity distribution and transmission and gas distribution and transmission ANRE approved new methodologies starting with the fourth regulatory period The aim is to harmonise the provisions of the four methodologies For gas distribution activity the methodology has been changed from price cap to revenue cap and for gas transmission activity the methodology was modified in order to comply with article 26 requirements of Reg (EU) 2017460
Ref C20-IRB-54-03
CEER Report on Regulatory Frameworks for European Energy Networks 2020
110156
225 Slovakia Gas TSO Gas DSO Electricity TSO Electricity DSO
Ma
rke
t
str
uc
ture
Network operators
1 1 1 3
Network length 2332 km 33300 km 3008 km 94790 km
Ownership Private and public Private and public Public Private and public
Ge
ne
ral
fra
me
wo
rk
Authority UacuteRSO
System Benchmarking Price cap
Period 5 years 2017 - 2021
Base year for next period
TBD
Transparency Price decrees determining the tariff methodology Price decisions published
Main elements for determining
the revenueprice
cap
Analysis of entry-exit tariffs in other Member States of
the EU
Allowed costs Allowed depreciation RAB WACC
Legal framework
Act No 2502012 Coll on Regulation in Network Industries Act No 2512012 Coll on Energy Industry URSO Decree No 2232016 Coll (gas) URSO Decree No 182017 Coll (electricity)
Rate
of
retu
rn
Type of WACC NAP Real pre-tax WACC
Determination of the rate of
return on equity
NAP Sum of nominal risk-free rate and a risk premium (market risk
premium multiplied by beta factor)
Rate of return on equity
before taxes NAP 1071 = (107 + 666 111) (1 ndash 021)
Use of rate of return NAP
When setting the nominal pre-tax WACC the DE ratio of 6040 was used
The whole RAB is multiplied by the WACC
Reg
ula
tory
as
se
t b
ase Components of
RAB NAP Fixed assets no working capital
Regulatory asset value
NAP
Expertly appraised value of assets
necessarily used for regulated
activities as at 31 Dec 2015
Expertly appraised value of assets necessarily used for regulated activities as
at 1 Jan 2011
RAB adjustments
NAP There is no RAB adjustment taking place during the regulatory
period
Dep
rec
iati
on
s Method
NAP Regulatory depreciation (technical life cycle of assets)
Depreciation ratio
NAP Ratio between 125 and 20
Consideration
NAP A component of target revenue
Introduction The Regulatory Office for Network Industries (URSO) as an independent public authority was established on 1 August 2001 and performs regulation in the sectors of electricity gas district heating and water In September 2012 new acts on regulation in network industries (No 2502012 Coll) and the Energy Act (No 2512012 Coll) came into effect governing the position and powers of URSO The two acts also brought a significant shift in the protection of
Ref C20-IRB-54-03
CEER Report on Regulatory Frameworks for European Energy Networks 2020
111156
market participants as well as in the reinforcing of the Officersquos independence and competences Currently URSO is in the fifth regulatory period (2017 - 2021) which was set at five years In order to harmonise amendments to the primary legislation by the transposition of the Clean Energy Package with the new regulatory policy for the next regulatory period (2023 - 2027) the current regulatory period will be after the adoption of the amendment to the regulatory policy extended by one year The dominant activity of URSO is tariff (price) regulation The scope and manner of its implementation is set out in the implementing regulations in the form of price decrees and the terms and conditions of tariff application are set out in individual price decisions Historical development In 2001 SEPS Slovakiarsquos electricity TSO was unbundled and as a result three vertically integrated undertakings providing electricity distribution electricity supply and services were established In 2013 SEPS was certified based on the ownership unbundling model Eustream the sole gas transmission system operator was certified as an independent transmission system operator (ITO) in 2013 Gas transmission assets were not transferred to the transmission system operator but remained the property of the parent company SPP as SPP-distribuacutecia the only gas distribution system operator which was unbundled from SPP in 2006 The electricity and gas markets were fully liberalised as of July 2007 With entry into the 3rd regulatory period (2009 - 2011) URSO ceased to apply the original revenue cap method and established the incentive regulation principle based on the price cap methodology Since 2012 the three-year regulatory period has been replaced by a more stable regulatory framework with a five-year period Main principles of price regulation The basic principle of regulation of prices (tariffs) approved or set by URSO for the five-year regulatory period applies price cap as a method which guarantees profit only under real efficient business operation and incentivises network operators to reduce their own losses Since 2009 URSO has also regulated the quality of services which focuses primarily on consumer protection Network operators and suppliers must comply with the quality standards set by URSO decree in order for the consumers to receive adequate quality for the price they pay for electricity gas and heat In the event of non-compliance with the quality of supply and services the regulated entity is obliged to pay a compensatory payment to the consumer Additional adjustments during the regulatory period The price decision is valid for the entire regulatory period In the event of a significant change in the economic parameters on the basis of which URSO approved or set the price the regulated entity may request a change in the price decision URSO may also initiate a change in the price decision on its own initiative Basic formula for setting the price cap (electricity) Price cap = [OPEX allowance x (1 + core inflation - efficiency factor) + (RAB x WACC) + depreciation (from RAB + from planned CAPEX for next year) - revenues from connections] forecasted volume
Ref C20-IRB-54-03
CEER Report on Regulatory Frameworks for European Energy Networks 2020
112156
In electricity distribution the price cap is set for each voltage level separately (EHV ndash 110 kV HV - 22 kV LV - 04 kV) Basic formula for setting the price cap (gas) Price cap = [OPEX allowance x (1 + core inflation - efficiency factor) + (RAB x WACC) + depreciation (from RAB) + costs to cover losses and own consumption - revenues from connections] forecasted volume] Gas distribution tariffs are categorised based on a contractually agreed annual volume of distributed gas for each offtake (supply) point and the postage stamp principle is applied Eligible costs Operating costs are optimised through the JPI - X factor where JPI is the core inflation set by the Statistical Office and X is the efficiency factor of 35 If JPI ltX then JPI - X = 0 and overheads up to the amount of overheads in year t-1 are included in the eligible costs in year t Allowed depreciation The price proceeding for each year of the regulatory period will also assess the use of the declared costs for new investments in the form of depreciation Profit A reasonable profit within the price proceeding is multiplication of the RAB and WACC values It shall take into account the scope of the investments required to ensure a long-term reliable safe and efficient system operation an adequate return on operating assets and the stimulation of stable long-term business Regulatory Asset Base The value of the property is referred to as RAB - regulatory asset base RAB (for electricity) was determined on 1 January 2011 and its value is equal to the general value of assets determined on the basis of an expert opinion RAB (for gas) was determined as of 31 December 2015 WACC The WACC value (before tax nominal) is set at a maximum of 647 and is applied constantly throughout the whole regulatory period However if the difference of input parameters entering the WACC calculation exceeds 10 a new WACC value is determined for the relevant year and published on the URSO website by 30 June of the calendar year
WACC pre-tax nominal =119864
119864+119863+
119877119890
1minus119879+
119863
119864+119863 119909 119877119889
T ndash income tax rate for year t E ndash equity D ndash liabilities Rd ndash real price of liabilities for the regulatory period set at 373 (average rate of loans provided to non-financial corporations for a period of five years or more with a loan amount over 1 mil euros) Re ndash real price of equity and liabilities
Re = Rf + βlev x (Rm - Rf) Rf ndash return on risk-free assets for the regulatory period set at 303
Ref C20-IRB-54-03
CEER Report on Regulatory Frameworks for European Energy Networks 2020
113156
βlev ndash is a weighted coefficient β which defines the sensitivity of the companys share to market risk taking into account the income tax rate and the share of liabilities
βlev = βunlev x [1 + (1 minus 119879) 119909119863
119864]
βunlev ndash is an unweighted coefficient without the influence of the income tax rate and the share of liabilities set at 053 DE ndash ratio of liabilities to equity set at 60 in favour of liabilities (Rm - Rf) ndash total risk premium set at 454 Methodology for setting gas transmission tariffs The regulatory framework for gas transmission differs from gas distribution in that it consists of a method of comparing tariffs in EU Member States (international benchmarking) According to the Act on Regulation if there is effective pipeline-to-pipeline competition URSO shall by direct comparison approve or determine comparable prices for access to the transmission network and gas transmission which take the form of tariffs Tariffs are set for individual entry and exit points of the transmission network (entry-exit system) and apply for domestic and foreign users of the transmission network The submitted analysis compares the total average prices for gas transmission including conversion to length units taking into account the relevant distance of entry and exit points of the transmission network costs depreciation and revenues for the provision of services in the transmission networks The method allows TSOs to cover all costs while generating a reasonable profit which enables the company to make new investments required by the gas market develop sufficient flexibility in offering new products and services and adopt measures under EU legislation Tariffs are set for the entire regulatory period their final amount is subject to an annual increase equivalent to the inflation rate
Ref C20-IRB-54-03
CEER Report on Regulatory Frameworks for European Energy Networks 2020
114156
226 Slovenia
Gas TSO Gas DSO Electricity TSO Electricity DSO
Ma
rke
t
str
uc
ture
Network operators
1 13 1 1
Network length ~1174 km ~4740 km ~2890 km ~65400 km
Ownership Public Private and public Public Private and public
Ge
ne
ral
fra
me
wo
rk
Authority Energy Agency
System Incentive regulation Revenue cap
Period 3 years current period 2019-2021
Base year for next period
2nd or 3rd year in current regulatory period (2016 2017)
Transparency bull the methodology determining the regulatory framework and the methodology determining the network charge bull WACC study bull httpswwwagen-rssizemeljski-plin1 bull httpswwwagen-rssielektricna-energija3
Main elements for determining
the revenueprice
cap
Controllable OPEX (general
productivity) uncontrollable OPEX CAPEX (depreciation
regulated return on assets)
consumption incentives
Controllable OPEX (efficiency score
general productivity)
uncontrollable OPEX CAPEX (depreciation
regulated return on assets) incentives
Controllable OPEX (general
productivity) uncontrollable OPEX CAPEX (depreciation
regulated return on assets) losses
ancillary services consumption
incentives
Controllable OPEX (efficiency score
general productivity)
uncontrollable OPEX CAPEX (depreciation
regulated return on assets) losses consumption
incentives
Legal framework Act on the methodology for determining the
regulatory framework of the
natural gas transmission system
operator
Act on the methodology for determining the
regulatory framework of the gas distribution system operator
Act on the methodology determining the regulatory framework and the
methodology determining the network charge for the electricity system operators
Rate
of
retu
rn
Type of WACC Pre-tax WACC nominal (equity share 60 debt share 40) WACC 2019-2021 = 526
Determination of the rate of return
on equity
Cost of equity is determined on the ldquorisk premium modelrdquo (Cost of equity = cost of debt + 2) Cost of debt is 5-years average (2012-2016) for interest rate to non-financial
companies in Slovenia Premium of 2 is the difference between return on equity and cost of debt for Slovenian market
Rate of return on equity before
taxes Cost of equity = cost of debt + premium (368 + 2 = 568)
Use of rate of return
For each year of the regulatory period WACC is applied on the value of the Regulatory Asset Base (RAB)
Reg
ula
tory
as
se
t b
ase Components of
RAB bull Book values of tangible and intangible assets after RAB adjustment bull Ex-ante investments according to development plan bull No working capital no assets under construction
Regulatory asset value
bull Book value for existing assets bull Investment value according to development plan for new assets
RAB adjustments
RAB adjustments are bull value of assets acquired with subsidies and grants bull assets under construction bull value of assets acquired with disproportionate costs for connection to network bull value of assets acquired with congestion income
Ref C20-IRB-54-03
CEER Report on Regulatory Frameworks for European Energy Networks 2020
115156
De
pre
cia
tio
ns Method Straight line
Depreciation ratio For existing assets and new investments
the actual rate of depreciation is taken into account
bull existing assets (actual rate of depreciation depending on asset type) bull planned new investments in energy infrastructure (286) bull planned other assets (5)
Consideration 100 of depreciation is integrated into revenues
Regulation of Electricity Transmission and Distribution Operators The regulation in the regulatory period from 1 January 2019 to 31 December 2021 is carried out on the basis of the Act on the methodology determining the regulatory framework and the methodology determining the network charge for the electricity network operators The methodology for setting the network charge determines the principles of economic regulation of electricity services of general economic interest and sets the eligible costs of the electricity network operators The methodology is based on the regulated network charge with the aim that by setting the network charge and other revenues and taking into account identified deviations from previous years the system operator is to cover all eligible costs of the regulatory period
In establishing the regulatory framework for the period 20192021 the Slovenian NRA the Energy Agency addressed electricity consumption planned development of the infrastructure level of quality of supply eligible costs of the system operators and network charge tariffs for each consumer group The eligible costs of the electricity system operators consist of controlled operation and maintenance costs uncontrolled operation and maintenance costs costs of electricity losses depreciation costs and regulated return on assets The basic controlled operational and maintenance costs are calculated in accordance with requested yearly productivity improvement The yearly productivity improvement consists of planned general productivity and individual productivity For the Transmission System Operator (TSO) only the planned general productivity is used The individual productivity of each Distribution System Operator (DSO) is determined in the benchmark analysis The eligible costs are covered by the network charge and other revenues When determining the resources to cover the eligible costs due consideration is given to the deviations from the regulatory framework in previous years and the planned settlement for a current regulatory period The methodology for assessing the network charge determines the procedures and elements to assess the network charge and to divide consumers into various consumers groups For calculating the network charge the non-transaction postage-stamp method is used which means a system of uniform tariffs for calculating the network charge on the territory of Slovenia within the individual consumer group For the allocation of costs for different voltage levels the gross approach to calculating the network charge for transmission and distribution network is used
The methodology of the regulated network charge is also based on incentives which depend on incurred eligible costs achieved quality of supply level the provision of free ancillary services the acquisition of non-refundable European funds savings in the purchase of smart electricity meters with communications module realised investments in smart grids projects realised pilot projects and a special incentive for innovation
Ref C20-IRB-54-03
CEER Report on Regulatory Frameworks for European Energy Networks 2020
116156
If a system operator achieves higher or lower eligible costs of actually eligible costs this difference is reflected in its income statement Incentives concerning the achieved quality of supply level are determined according to the achieved level of supply continuity from the reference level and are reflected in increased or decreased eligible costs If the system operator provides one or more ancillary services free of charge which is not the result of legislation incentives equivalent to 10 of the saving that equals the amount paid for the ancillary service will be awarded to the system operator If the system operator obtains non-refundable European funds incentives of 05 of the current value of the assets is granted to the system operator in the year when the assets were put into service If the system operator achieves a lower annual average acquisition price than price-cap of smart meters in accordance with the methodology a single incentive of 10 of the realised annual saving is awarded to the system operator If the system operator realises the investments in smart grids that meet the requirements set out in the methodology a single incentive is acknowledged amounting to 3 of the current value of the asset in the year in which the asset was put into service If the system operator fulfils the conditions and criteria for the projects promoting investments in smart grids in accordance with the methodology for these projects pilot tariffs can be used
The electricity system operator must identify deviations from the regulatory framework after each year of the regulatory framework Deviations are established as a difference between planned and actual eligible costs of the system operator and a difference between planned and actual revenue sources which include the identified surplus or deficit of the network charge from previous years The Energy Agency issues a separate decision if it concludes that deviations were not calculated in accordance with the methodology The Energy Agency keeps under review the implementation of the regulatory framework during the regulatory period by monitoring the monthly realisation of the network charge by analysing the criteria of the costs and by calculating deviations from the regulatory framework Regulation of Gas Transmission and Distribution Operators The Energy Agency carries out the regulation in the regulatory period from 1 January 2019 to 31 December 2021 on the basis of the Act on the methodology for determining regulatory framework for the natural gas transmission system the Act on the methodology for determining the network charge for the natural gas transmission operator the Act on the methodology for determining regulatory framework for the natural gas distribution system and the Act on the methodology for determining the network charge for the natural gas distribution operator The methodology for setting the network charge determines the principles of economic regulation and sets the eligible costs of the gas operators The methodology is based on the regulated network charge with the aim that by setting the network charge and other revenues and taking into account identified deviations from previous years the system operator is able to cover all eligible costs of the regulatory period The regulation methodology is based on the method of the regulated annual income and regulated network charges of the TSODSO arising from a determination of eligible costs taking into account (in addition to the network charge) several other factors These other factors include all other revenues as sources for the system operator to cover eligible costs from the previous period the obligation of the TSODSO to transfer the surplus of the network charge and its dedicated use for covering eligible costs in the next regulatory period and the right of the TSODSO when determining the regulatory framework for the following years to take into account the coverage of the network charge deficit
Ref C20-IRB-54-03
CEER Report on Regulatory Frameworks for European Energy Networks 2020
117156
The eligible costs of the gas system operators consist of controlled operating and maintenance costs uncontrolled operating and maintenance costs depreciation costs and regulated return on assets Resources for covering eligible costs are the network charge and other revenues In determining the resources for covering eligible costs the deviations from the regulatory framework of the previous years are duly taken into account
By using the method of regulated annual income and regulated network charges the TSODSO determines the regulatory framework in a way that incorporates the planned annual income the surplus of network charges from the previous years the planned network charge deficit maximum up to the amount of depreciation charge that covers the costs up to the amount of eligible costs for the regulatory period and the corresponding deficit of previous years The TSODSO submits to the Energy Agency the request for granting consent to the regulatory framework network tariff items and tariff items for other services for the relevant regulatory period In the process of issuing approval the Energy Agency assesses the compliance of the proposed eligible costs the network charge and other network charge items with the applicable methodologies
At the end of each regulatory period the TSO must determine the deviations from the regulatory framework The deviations are determined as the difference between actual eligible costs and existing sources for covering eligible costs which include recorded income or the network charge deficit from previous years The Energy Agency issues a special decision when it finds that the deviations are not calculated in accordance with the methodology The Energy Agency monitors the implementation of the regulatory framework during the regulatory period
Three investment incentives are available in the area of electricity and gas If the system operator obtains non-refundable European funds incentives of 05 of the current value of the assets is granted to the system operator in the year when the assets were put into service In gas for a customer who consumes biomethane or synthetic biomethane the network charge for both the TSO and DSOs is reduced up to 20 depending on the portion of biogas in gas consumed The network charge is set to 50 for a filling station for compressed gas for vehicles
Ref C20-IRB-54-03
CEER Report on Regulatory Frameworks for European Energy Networks 2020
118156
227 Spain Gas TSO Gas DSO Electricity TSO Electricity DSO
Ma
rke
t
str
uc
ture
Network operators
1 large TSO (ENAGAS) 1 small
TSO and 12 transport co
19 DSOs that are part of 6 groups
1 TSO (REE)
5 large DSOs (gt90 system
revenues) and 327 small DSO
lt100000 clients
Network length
13749 km (2018) 73950 km (2018) 44173 km (2018) 896562 km (2018)
Ownership Private except for 5 stake of the
State in ENAGAS
Private utilities and investment funds
Private except for 20 stake of the
State in REE
Private 5 large DSO are part of
integrated utilities
Ge
ne
ral
fra
me
wo
rk
Authority CNMC sets revenues from 2020 on methodologies from 20202021 in electricitygas
System Rate of return Incentive Regulation
Period 6 years next 2021-2026 6 years 2020-2025
Base year for next period
For regulatory period (n n+5) review is made with n-1 available data so n-2 data
Transparency CNMC publishes its proposals and final decisions on its website There is a period for a hearing process Final decisions (Circulars) are published in the Official State Gazette
Main elements for
determining the revenue
cap
Investment amp OPEX reference values
RAB rate of return regulatory lifetime of assets revenues for continuity of supply
and extension of assetrsquos lifetime
The allowed revenue of the preceding year changes in the
number of clients changes in the volume of gas
distributed
Investment reference values OPEX reference
values RAB rate of return regulatory lifetime of assets
Incentives
Investment values OPEX values Other
regulated tasks reference values
RAB rate of return regulatory lifetime of assets number of clients Incentives
Legal framework
Law 341998 of the Hydrocarbons sector Law 182014 of 15 October
Law 242013 of the Electricity sector Circulars 22019 52019 62019 72019
Rate
of
retu
rn
Type of WACC Nominal post-tax WACC
Determination of the rate of
return
Electricity transmission and distribution CNMC has calculated the Rate of Return by using WACC It will be 6003 in 2020 and 558 over 2021-2025 Nominal pre-tax Gas transmission The current rate of return is set at 509 (the average yield on 10-year Bonds in the 24 months before the entry into force of the legislation plus a spread of 50 bp) An additional remuneration term (ldquoRemuneration for the continuity of supplyrdquo) increases the implicit return on gas transmission assets For the next regulatory period (2021-2026) CNMC has calculated the Rate of return by using the WACC formula Gas distribution a rate of return of 10-year Bond plus a spread of 150 bp was set in 2002 and from then on a parametric remuneration formula applies
Rate of return on equity
before taxes 640 = 297 + 072 475 (Electricity TSO amp DSOs)
Use of rate of return
Rate of return is applied (nominal pre-tax) on RAB in Gas TSO Electricity TSO and Electricity DSO A rate of return was set for gas distribution in 2002 and from then on a parametric remuneration formula applies
Reg
ula
tory
as
se
t b
ase
Components of RAB
Fixed assets (No working capital no assets under construction)
Regulatory asset value
Electricity depending on commissioning year Replacement cost Average between audited costs and Investment reference values Audited costs with some limitations For
TSO unique facilities and DSOTSO pilot projects Audited costs Gas transmission average between audited costs and investment reference values Audited costs for unique facilities Gas distribution RAB based on the inflated gross
investment value of assets in 2000 since then the parametric formula applies
RAB adjustments
Assets built year n-1 are added year n
RAB defined in 2002 and then
parametric formula
Assets built year n-2 are added year n
Assets built year n-2 are added year n
Dep
re-
cia
tio
ns Method Straight Line
Depreciation ratio
Generally 25 (Lines Cables Substations Transformers transmission pipelines) For gas distribution assets a 5 depreciation ratio was set in 2002 since then the
parametric remuneration formula applies
Consideration 100 of Depreciation is integrated into the revenues
Ref C20-IRB-54-03
CEER Report on Regulatory Frameworks for European Energy Networks 2020
119156
General facts Six-year regulatory periods are established for both electricity and gas activities Regulatory parameters are not updated by price indexes within the regulatory period Royal Decree Law 12019 gives CNMC (Spanish NRA) powers to set revenues and tariffs which was previously done by the Ministry Consequently CNMC has published new regulation to set revenues for gas and electricity TSOs and DSOs for the following regulatory periods (2020-2025 for electricity and 2021-2026 for gas) As changes in electricity apply from 2020 this chapter has been updated for electricity Electricity Transmission and Distribution Electricity DSO and TSO receive remuneration for investment (CAPEX) OampM (OPEX) and other regulatory tasks (only DSO) In addition they have incentivespenalties that can result in increased or decreased revenues depending on their performance A new regulatory period started in 2020 Investment remuneration (CAPEX)
Regulatory Asset Base (RAB) The RAB is updated every year by adding new investments and subtracting depreciation Assets under construction and working capital are not included in the RAB Subsidies and assets built or financed by third parties are also excluded When assets end their regulatory lifetime they are taken out of the RAB and stop receiving revenues for investment Assets commissioned in year n start receiving revenues in year n+2 To take this into account the RAB is increased by (1 + Rate of Return) ^(remuneration delay factor) This factor is calculated for each asset for TSOs while it is equal to 15 for DSOs
TSO
bull The RAB was set by taking into account the value of assets built before 1998 as a whole not asset by asset with an ldquoimplicit valuerdquo method
bull For assets built from 1998 to 2014 the RAB was set at replacement cost asset by asset taking into account the remaining regulatory asset lifetime of each asset
bull For assets built from 2015 onwards the RAB is calculated as the average between audited costs and investment reference values Therefore 1) If the TSO is able to build an asset at a cost below its reference value it retains half of the difference in the RAB as a reward but limited up to the 125 of the cost 2) On the other hand if the asset is built at a cost above the reference value only half of the difference will be taken into account in the RAB but limited to 125 of the reference value For assets built from 2018 onwards if the cost is higher than the reference value divided by 085 the transmission company has to submit a technical audit justifying the high costs
For unique TSO facilities such as international interconnectors or submarine cables connecting islands or to the mainland just audited costs are taken into account due to lack of reference values There are specific investment reference values for the TSO assets in the isolated energy systems of the Canary and Balearic Islands
DSO
bull For assets built until 2014 the RAB was set at replacement cost by multiplying the existing physical assets by the investment reference values for each asset type with an efficiency factor subtracting subsidies and assets built or financed by third parties This value was calculated for all RABs as of 31 December 2014 in aggregated terms
Ref C20-IRB-54-03
CEER Report on Regulatory Frameworks for European Energy Networks 2020
120156
taking into account the proportion of investments pending to recover in the statutory accounts of each DSO
bull For assets built from 2015 to 2017 the RAB is calculated as the average between audited costs and investment reference values If audited costs are lower than reference values only up to +125 of audited costs are considered
bull For assets built in 2018 RAB is calculated as the average between audited costs and investment reference values If audited costs are higher than reference values only up to +125 of reference values is considered if audited costs are lower than reference values only up to +125 of audited costs are considered
bull For assets built from 2019 onwards RAB is calculated considering the audited costs This introduces flexibility for companies in which type of assets to invest and allows them to make decisions based on technical reasons in order to adapt grids to the challenges of this period (digitalisation distributed generation and electrical vehicle) Nonetheless an adjustment is performed every three years in aggregated terms to set some limits average costs for each type of asset from year n-4 to n-2 are compared with investment reference values If they are higher than 105 there is a negative adjustment of 50 of the difference In contrast if costs are lower than 09 there is a positive adjustment of 50 of the difference
bull There are two specific terms in the RAB that account for investments in control centres remote control communications and in land where electrical assets are built after 1 January 2015 For them the RAB is based on audited costs
Depreciation (TSO amp DSO) RAB is recovered by a straight-line depreciation value Regulatory Asset Lifetime is set at 40 years for most assets (lines transformers etc) and 12 years for control centres Rate of Return (TSO amp DSO) Net RAB pending to recover is multiplied by the Rate of Return The Rate of Return has been calculated by using the WACC formula for this regulatory period (2020-2025) resulting 558 As it was set at 6503 previously it was exceptionally 6003 in 2020 so that the decrease per year is lower than 50 bp then dropping to 558 for 2021-2025 The CAPM model is used for the rate of return on equity Risk-free rate is the 10-year Spanish government bond beta coefficient is obtained as the average beta from a peer group of utilities Market Risk Premium is obtained from the DMS reportrsquos data for European countries The cost of debt is calculated as the average of IRS 10-year + CDS 10-year of the utilities in the peer group In the case that there were not CDS for a company its debt bonds (8-12 years) are used instead of IRS + CDS The proportion between debt and equity is set as the optimal regulatory gearing ratio -50 ndash but also taking into account the values of the peer group Operation amp Maintenance remuneration (OPEX) The TSO receives an allowance for OPEX that is calculated by multiplying the number of physical assets of each type by the OPEX reference values plus an efficiency term which allows TSO to retain part of the efficiencies gained in the previous regulatory period During the regulatory period the TSO has an incentive to operate and maintain the grid below reference values For TSO unique assets only unique OPEX values may apply There are also specific OPEX reference values for TSO assets in the isolated energy systems of the Islands
Ref C20-IRB-54-03
CEER Report on Regulatory Frameworks for European Energy Networks 2020
121156
DSOs receive an allowance for OampM (OPEX) included into a term named lsquoCOMGESrsquo which comprises OPEX and also a small part of investments not included in the electricity assets that have reference values It is updated within the regulatory period with a factor that establishes a proportion between this term and the investments in electric assets that have reference values An efficiency factor also adjusts COMGES to reflect the companyrsquos capacity to manage lsquoCOMGESrsquo costs Remuneration for the extended regulatory lifetime of assets (TSO amp DSO) Assets which regulatory lifetime has expired receive increased OPEX reference values to incentivise that they are kept under operation The increasing factor is 30 the first 5 years ranges from 30 to 35 from 5 to 10 years then from 35 to 45 from 10 to 15 years and after 15 years it keeps rising by 3 per year until it reaches 100 Remuneration for other regulated tasks (DSO only) DSOs receive the following revenues to perform other regulated tasks (1) metering (2) helping clients contract electricity revenues to support invoicing and to reduce non-payments by clients (3) Responding to telephone calls from clients (4) grid planning and (5) revenues to cover overhead costs Each type of revenues for other regulated tasks is calculated as a reference value multiplied by the number of clients There are different reference values for the first 1000 clients the first 10000 clients the first 100000 the first 1000000 the first 5000000 clients and above 5000000 clients DSOs are incentivised to perform these tasks at lower costs than those established as reference values per client as they retain the difference There is also a bonus term that takes into account the performance of the company in the previous regulatory period compared with an efficient company Incentivespenalties TSOs have an Incentive to maximise grid availability (-35 +25) DSOs have incentives to reduce grid losses (-2 +1 in 2020 and 2021 and to be determined later) and to improve quality of supply (-2 +2 the first 3 years and -3 +3 the last 3 years of the regulatory period) Penaltiesrsquo limits for quality of supply can be multiplied by 2 if the indicators are under a certain limit for 2 or more consecutive years An incentive to detect fraud (0 +15) will be also applied in 2020 and 2021 it will be later integrated into the incentive to reduce grid losses There is also a financial prudence penalty (after 2023) for both the TSO and DSOs with more than 100000 clients if a companyrsquos economic and financial ratios do not meet the recommended values of Communication 12019 It is limited to 1 of total revenues Gas Transmission and Distribution The current regulatory period ends 31 December 2020
TSO The current remuneration for the primary transmission network takes into account two components remuneration of availability and remuneration of continuity of supply The remuneration of availability includes OampM costs depreciation and financial remuneration calculated by applying the rate of return to the annual net value of the investment Regulatory Asset Base (RAB) For facilities commissioned before 2002 the assets value after the revaluation of 1996 (Royal Decree-Law 71996) minus subsidies received to finance these assets is considered For new facilities brought into service since 2002 the standard value of each investment set by the regulator is used while those investments that entail expansion are measured at actual cost Transport facilities brought into service since 2008 are valued at the average of the reference value and actual cost (audited)
Ref C20-IRB-54-03
CEER Report on Regulatory Frameworks for European Energy Networks 2020
122156
Depreciation The RAB is recovered by a straight-line depreciation value Regulatory lifetime is set at 40 years for all pipelines and 30 years for other transmission assets Rate of return The current rate of return is set at 509 For the next regulatory period the WACC formula will be used for the Rate of Return calculation Remuneration for Operation amp Maintenance (OPEX) Remuneration is based on technical characteristics by using reference OampM values Remuneration for continuity of supply It is a remuneration assigned to the following activities transmission regasification and underground storage which is then distributed to all facilities of each activity while they are in operation according to their standard replacement investment value The global remuneration is calculated on a yearly basis based on the prior-year remuneration multiplied by an efficiency factor and the changes in total national demand for gas Therefore it can be considered that the financial remuneration is made of two terms an explicit financial return (509 on the net value) and an implicit financial return obtained from the remuneration for continuity of supply Once the regulatory lifetime of the facilities has ended if the asset continues in operation the remuneration is calculated as OampM costs increased by a coefficient DSO The current remuneration has its origins in 2002 when it was established according to the real investments and operating costs of the Spanish distribution companies in 2000 The initial annual remuneration base was calculated for 2000 taking into account the following remuneration blocks Financial remuneration a rate of 677 (equivalent to a 10-year Spanish bond + 150 bp at that time) was applied to the inflated gross investment value of regulatory asset base in 2000 The RAB was obtained assuming the gross investment value of assets of 1996 updated to 2000 since this was the last balance sheet revaluation available Amortisation based on the gross asset investment costs in 2000 divided by the useful economic life of assets (20 years) Annual operating costs based on the accounting data from the industry players In a second step 2000 values were brought forward to 2002 This update was made taking into account the inflation rate and the average national demand growth over the period 2000-2002 adjusted with an efficiency factor of 07103 The remuneration of incremental distribution activities from 2002 to 2014 was based on the yearly updating of initial revenues set for 2002 according to a parametric formula that remunerated the increase (or loss) on new points of supply and delivery of higher (or lower) volumes of gas After Law 182014 the overall remuneration was reduced by euro110 million and the revenues are updated on a yearly basis by a parametric remuneration formula This formula calculates annual allowed revenue as the sum of the allowed revenue of the preceding year and additional revenue earned (or lost) during the current year from new points of supply acquired (or lost) and delivery of higher (or lower) volumes of gas In order to incentivise network expansion to non-gasified zones different reference values are used during the first 5 years depending on whether or not customers are in recently-gasified municipalities Additional regulated income (such as regulated inspections activation rights regulated services lines supply renewal revenues meter rents etc) is received by DSOs
Ref C20-IRB-54-03
CEER Report on Regulatory Frameworks for European Energy Networks 2020
123156
228 Sweden Gas TSO Gas DSO Electricity TSO Electricity DSO
Ma
rke
t
str
uc
ture
Network operators
1 6 2 170 (152+18)
Network length 600 km 3 429 km ~15 000 km 554 148 km Ownership
Foreign ownership
Municipality and foreign ownership
State owned (SVK) and private (Baltic
Cable)
State municipality private and foreign
ownership
Ge
ne
ral
fra
me
wo
rk
Authority Swedish energy markets inspectorate Ei
System Revenue cap
Period 4 Year (Current 2019-2022) 4 Year (Current 2020-2023)
Base year for next period
2021 2022
Transparency Information related to decisions are public on the NRAs webpage cost and production data efficiency scores different incentives calculations of the revenue caps and of the
WACC amongst other available data
Main elements for determining
the revenue cap
TOTEX (divided into CAPEX Non-
controllable OPEX and
Controllable OPEX) General efficiency target
of reducing 1 percent of
controllable OPEX annually
TOTEX (divided into CAPEX Non-
controllable OPEX and Controllable OPEX) General
efficiency target of reducing 1 percent
of controllable OPEX annually
TOTEX (divided into CAPEX Non-controllable OPEX and Controllable
OPEX) Incentives for good quality of supply General efficiency
target of reducing 1 percent of
controllable OPEX annually
TOTEX (divided into CAPEX Non-
controllable OPEX and Controllable
OPEX) Incentives for good quality of supply
Individual efficiency benchmark
(reduction of controllable OPEX)
Legal framework
Naturgaslagen (Gas Act) Ellagen (Electricity Act)
Rate
of
retu
rn
Type of WACC Real WACC pre- tax
Determination of the rate of
return on equity
CAPM 119903119890 = 119903119891 + 120573 lowast (119903119898 minus 119903119891) + 119864119909119905119903119886 119903119894119904119896119901119903119890119898119894119906119898
Rate of return on equity
before taxes
For gas in 1137 = (4+ 079 5 + 15) (1 - 021) For electricity in 544 = (09 + 051 668) (1 - 0208)
Use of rate of return
The debt share is derived from market values of European comparison companies that are publicly traded (49 debt 51 equity for electricity and 44 debt 56 equity for
gas)
Reg
ula
tory
as
se
t
ba
se
Components of RAB
Fixed assets divided into Meters pipelines stations storage and
regasification assets (not assets under construction)
Fixed assets divided into Lines Cables Buildings Shuntreactors transformers
switchgear stations cable cabinet control-equipment meters and IT-system (not
assets under construction)
Regulatory asset value
2018 SEK ~69 Billion
2018 SEK ~75 Billion
Replacement values 2018 in SEK
~69 Billion
Replacement values 2018 in SEK
~295 Billion
RAB adjustments
Adjusted for inflation adjustments ex post for new investments and disposals
Dep
rec
iati
on
s
Method Real linear (Straight line) depreciation
Depreciation ratio Meters 25 years
Pipelines 90 years Stations40 years (storage50 years)
Meters 12 years Pipelines90 years Stations 40 years
(Regasification assets 25 years)
In total 17 asset categories and 6
different depreciation times
Typically 60 year for lines and 40 for
cables
In total 17 asset categories and 6
different depreciation times Typically 40 year for lines and 50 for
cables
Consideration The depreciation is fully integrated into the revenue cap
Ref C20-IRB-54-03
CEER Report on Regulatory Frameworks for European Energy Networks 2020
124156
Introduction The electricity and gas networks are examples of natural monopolies as it would be both economically and environmentally unreasonable to have competing infrastructures available for each customer This means that the network operators (DSOs and TSOs) have limited or no competition To be the only seller in a price-inelastic market entails possibility for the operator to increase prices and thereby increase profits To ensure that the network operators do not make unreasonably high profits regulation needs to be in place The Swedish energy markets inspectorate Ei is the NRA responsible for designing the regulation in a way that minimises the welfare losses from monopoly power The main objective with the regulation is to ensure that the network operators do not make monopoly profits while retaining efficient operations of the grid with a good quality of supply In this way high quality and fair prices will be ensured for the customers Ei regulates both the gas and the electricity sector and the size of the regulated operators span from around 10 connections for the smallest operators to over 800000 customers for the largest operators In the electricity market there are currently 170 DSOs and two TSOs in Sweden The Swedish TSOs are Affaumlrsverket Svenska Kraftnaumlt (SVK) and Baltic Cable (BC) With a few exceptions SVK owns and operates all parts of the transmission system Baltic Cable (BC) owns one transmission line connecting the electricity grid between Sweden and Germany All other entities that operate power systems in Sweden are defined as DSOs The 170 DSOs are of varying size and ownership structure (state municipal private and other) and they each have a so-called concession (permission) for the distribution of electricity either for a defined geographical area (in total 152 local DSOs) or for specific lines (in total 18 regional DSOs) The concession means a privilege but also entails several obligations which are governed by laws and a regulation Ei monitors that the network operators follow the existing rules Eirsquos role as the NRA is for example to ensure that customers have access to a power distribution system to provide incentives for cost efficient operation with acceptable reliability and with objective reasonable and non-discriminatory tariffs The gas market is relatively small in Sweden and consists of one TSO Swedegas one storage facility owned by Swedegas (RAB value in SEK ~460 Million at 2015) one regasification facility (RAB value in SEK ~104 million at 2015) and 6 DSOs There is no distribution system for gas in the northern parts of Sweden Historical Development The Swedish electricity market was deregulated in 1996 since then generation and trading of electricity are exposed to competition The network operations in their capacity as natural monopolies are subject to regulation Since the deregulation multiple regulation methods have been implemented One example is that in 2003 a performance-based tariff regulation was introduced where fictive reference networks were used Until 2012 Sweden used ex-post regulation where each year was treated as a regulatory period From 2012 ex-ante revenue cap regulation has been used In the regulation the regulator shall decide on each network operatorsrsquo revenue caps after a proposal from each company The revenue cap shall cover reasonable operational costs and a reasonable return on the assets used in the distribution and transmission A trend in Sweden amongst the DSOs is that the operators merge into fewer and larger companies At the end of the 1950s there were more than 1500 companies and in the early 1980s the number had dropped to 380 companies Today there are under 200 network operators under Eirsquos regulation
Ref C20-IRB-54-03
CEER Report on Regulatory Frameworks for European Energy Networks 2020
125156
Determining the Revenue Caps The regulatory model of Sweden is based on different cost items Firstly there is the division between capital expenditure CAPEX and operating expenditure OPEX The latter cost is in turn divided in controllable and non-controllable OPEX The controllable OPEX is based on data reported from the network operators on historical costs the costs are reduced yearly by an efficiency target (see further on efficiency benchmarking) This requirement to increase productivity is not applied for the non-controllable OPEX The non-controllable OPEX are estimates provided by the network operators prior to the period that are corrected for actual outcome ex post For CAPEX the assessment of the regulatory asset base is the first (and plausibly the most important) part The regulatory asset base is valued by the principle of replacement value for the existing assets and adjusted for age Investments and disposals of assets under the regulatory period is estimated prior to the period and corrected for the actual outcome ex-post Investments and disposals are reported for every 6-month period The norm for rate of return is decided by the method of WACC The different costs are adjusted for inflation to have the same price level Any deviations from the revenue cap will be added to the cap in the next period For the electricity network operators there are incentives for efficient use of the network and to have a good security of supply The security of supply incentive is set as a norm for the period based on historic data on interruption (AIT AIF and CEMI) The data on interruptions after the regulatory period is compared to the historical norm and the return on capital is adjusted in relation to the change of quality The incentive for efficient use of the network has the same outline as the other incentive with a norm set prior to the period that is compared with the actual outcome after the period As indicators for efficient use of the network the average load factor and network losses are used Together the two incentives can affect the yearly return for the network operators with plusmn 33 For the gas network operators no such incentives exist According to Section 51-2sectsect of the Swedish Electricity Act the revenues will be fixed in advance for each regulatory period consisting of four calendar years unless there are special reasons to use another period of time In the decision of the revenue cap the data and methodology used in the determining the revenue cap should be described (3sect) The Electricity Act states that the cap should cover the reasonable costs of conducting grid activities during the supervisory period and provide a reasonable return on capital (equity) needed to carry out the activity Regarding the design of the tariffs the legislation says that ldquoGrid tariffs should be objective non-discriminatory and promote efficient use of the networkrdquo (Section 4 1sect law 2009892) Otherwise the network operators are free to design their tariffs as they please Ei have been given the right to design secondary legislation on how the electricity network operators can structure their tariffs and a project to overlook the tariff structure is ongoing Quality Regulation For electricity there are as mentioned above incentives for efficient use of the network and for good security of supply For the gas market there are currently no quality regulations in place Under a regulatory regime that provides incentives to cut costs there is a risk that operators will refrain from undertaking the necessary investments or measures to achieve the required or potential savings To counter this in the electricity market quality norms are integrated in the cap If norm values for delivery are exceeded (fewer outages than the norm indicates) during the regulatory period the operator will get an increased revenue cap for the coming regulatory period The purpose is to give incentives for future improvement in quality
Ref C20-IRB-54-03
CEER Report on Regulatory Frameworks for European Energy Networks 2020
126156
Operators achieving above-average quality in past years will have an amount added to their cap while operators with comparatively poor-quality levels will have amounts deducted Like the security of supply incentive the regulation includes incentives to reduce network losses and to have a stable average load factor Prior to the period reference values are set for losses and load factor If a company can outperform the reference value they will get an increase in the cap if they preform worse they will get a deduction of the cap The adjustments based on the incentives are calculated annually and are limited to plusmn33 of the operatorsrsquo return on the asset base Beyond this the network operators will need to economically compensate customers for outages longer than 12 hours Outages longer than 24 hours are illegal and when they happen the operators must come up with a plan for it not to happen in the future Every DSO should on a yearly basis submit data to Ei on a customer level For the reliability incentive scheme data about outages between 3 minutes and 12 hours is used (both longer and shorter outages are also reported) Outages above 12 hours are excluded to not punish DSOs twice Efficiency Benchmarking The gas network operators have a general efficiency requirement to annually reduce 1 percent of their controllable OPEX The reason for a general requirement rather than firm-specific efficiency targets is due to the small number of operators In a benchmarking analysis based on only a few operators the results are likely to underestimate the technological level making the operators look more efficient than they are There is also a lot of heterogeneity amongst the Swedish gas network operators making it difficult to compare them to each other The same target is set for the electricity TSOs also due to a lack of comparable operators For the electricity DSOs an efficiency benchmarking model is used to estimate firm-specific potential for efficiency improvements The benchmarking involves assessing the operators individual costs against the services they provide and determining each DSOs cost efficiency compared to the other DSOs In the benchmarking process Ei uses a DEA model to compare the inputs (controllable OPEX and CAPEX) to the outputs (number of customers delivered electricity high and low voltage the highest effect against overhead grid and number of network stations) for the DSOs By the choice of variables some structural differences are accounted for to some extent for example the number of network stations works as a proxy for customer density The calculations are based on the average of four years of historical data The efficiency requirement is based on the controllable OPEX The maximal improvement potential has been set to 30 with a realisation time of eight years (two regulatory periods) and the DSOs get to keep 50 of their realised improvements This results in a maximal requirement (lowering of the revenue cap) of 75 of a DSOs controllable OPEX To also incentivise the relative efficient operators to improve a minimum level have been set to 1 annually of the controllable OPEX Determining the Regulatory Asset Base and Reasonable Return For electricity the regulatory asset bases in Sweden are based on norm-values which is a way to estimate the replacement value for all assets In total there are 17 asset categories in the asset base with six different depreciation times for which the asset base is adjusted before calculating the operators allowed return In Sweden a real linear depreciation method is used to estimate depreciation costs The depreciation times are currently set between 10 to 60 years (with possibilities for the addition of 25 extra lifespan if the assets are functional after their regulatory lifespan) For the gas network operators indexed acquisition values are used
Ref C20-IRB-54-03
CEER Report on Regulatory Frameworks for European Energy Networks 2020
127156
as the primary method to determine the value of the asset base The depreciation times for gas assets are stated in the table above To determinate the rate of return for the network operators a weighted average cost of capital WACC method is used both for electricity and gas The WACC gives allowance for the cost of debt and the cost of equity To calculate an efficient debt ratio European network operators that are publicly traded are observed since they should have incentives to minimise their costs in order to maximise shareholdersrsquo utility The debt part of the WACC is based on the risk-free rate of return and a credit risk-premium based on the ratings for the publicly traded comparison networks To determinate the cost of equity the capital asset pricing model CAPM is used The same European comparison network operators as earlier are used for estimating the beta value while the market risk-premium and the risk-free rate of return are based on Swedish market data Except from this the gas network operators also receive an extra risk-premium due to differences in risk structure than the European comparison network operators no such risk premium exists on the electricity side How to determinate a reasonable rate of return for network operators has been widely discussed in Sweden and the network operators have multiple times appealed Eis decisions and argued for a higher rate of return For the electricity regulation period 2020-2023 the government have decided on new legislation on how to determine a reasonable rate of return and added more differentiated depreciation time for network assets this has lowered the real WACC pre-tax to 216 from previous 585 For the gas network operators where no such regulation exists Ei has decided on a real WACC before tax on 652 for the regulatory period 2019-2022 based on previous rulings in court Transparency Information guides to reporting and how to calculate the revenue cap along with Eirsquos calculations and decisions are published on the webpage of the NRA
Ref C20-IRB-54-03
CEER Report on Regulatory Frameworks for European Energy Networks 2020
128156
3 Economic Theory and the Regulatory System In the past cost-based regulation approaches (rate-of-return regulation or cost-plus regulation) were widely used for tariff regulation purposes The rate-of-return model guarantees the regulated company a certain pre-defined rate of return on its regulatory asset base Another approach is cost-plus regulation in which a pre-defined profit margin is added to the costs of the company Evidently the regulated company has no incentive to minimise its costs under a cost-based regulation framework because it can increase its profits by simply expanding the asset or cost base Under cost-plus regulation a company may have an incentive to signal incorrect costs to the regulator or to even opt for wasting resources in order to increase the cost base (ldquogold-platingrdquo) As a response to the major drawbacks of the cost-based regulation incentive-based approaches to tariff regulation were first developed in Great Britain and are currently applied in many other countries Incentive-based regulation can be characterised by the use of financial rewards and penalties to induce the regulated company to achieve the desired goals (generally in form of an efficient cost base) while the company is allowed some discretion in how to achieve them Rewards and penalties replace a lsquocommand and controlrsquo form of regulation and provide incentives to the company to achieve the goals by allowing it to share the lsquoextra profitrsquo in case it over-fulfils the targets set by the regulator In general incentive-based regulation aims at cost control ndash so that grid users later could benefit from lower costs in a quantitative way through lower tariffs in the future
31 Regulatory System in Place Most European countries use incentive-based regulation in the form of a revenue cap The tables in Annex 4 accompanying this report41 which contains the NRA answers to the questionnaires underline the usage of this regulatory instrument In general most countries use a mixture of a cap regulation (revenue or price) and a guaranteed rate of return A revenue cap regulation can thereby be seen as an indirect price cap regulation where the revenue is the result of price multiplied with the quantity Nowadays a cost-plus regulation is an exception and is only used in a few countries Electricity transmission is regulated by incentive methods in 19 out of 25 countries Revenue caps are set by 15 NRAs From the beginning of the regulatory period 2016 - 2019 for the transmission of electricity Belgium introduced a considerable number and amount of extra incentives to increase efficiencies foster market integration and security of supply and support related research activities The Belgian TSO has strongly taken those into account In electricity distribution 21 NRAs apply incentive regulation Price caps are used by seven NRAs and 14 NRAs use revenue caps Gas transmission is regulated by incentive methods in 21 countries A limitation by caps is used by 19 countries sometimes even with a mixture of price and revenue caps In six countries a rate of return is implemented In gas distribution incentive-based methods are applied by 22 countries In four countries a mixture of incentive and cost-based methods is applied and eight NRAs use a cost-based regulation
41 Annex 4 is uploaded as a separate document on the same webpage as this report
Ref C20-IRB-54-03
CEER Report on Regulatory Frameworks for European Energy Networks 2020
129156
32 Efficiency Requirements Efficiency requirements stimulate the network operators to reduce costs and to work more efficiently One way of implementing these requirements is to reduce the allowed revenues year by year The tables in Annex 4 show whether the NRAs set efficiency requirements (lsquoX-factorsrsquo) on OPEX and CAPEX The survey revealed that a majority of the NRAs in electricity and gas focus on cost saving on the OPEX side On the CAPEX side nearly 20 of respondents have efficiency requirements applied This result is independent of the type of energy (gaselectricity) and the market layer (TSODSO) In some cases an efficiency requirement is applied to TOTEX (CAPEX+OPEX) One country (Belgium) uses different efficiency requirements depending on the region of the country
33 General Overview of System Operators Some regulatory regimes distinguish between the TSO functions of transport and of system operation For electricity the tasks of a system operator cover the complete area of activities for operating electric power systems including security control and quality in terms of fixed technical standards principles and procedures but also the synchronous operation of interconnected power systems42 This activity includes balancing services primary and secondary reserves capacity management ancillary services (disturbance reserves voltage support) and the purchase of energy for congestion management and redispatching This activity excludes day-to-day management of the network functionality For gas system operation includes ancillary services and congestion management It also includes the maintenance of the security of supply in the natural gas system by the coordination of entry and exit agents and the balancing of the natural gas system This activity also excludes day-to-day management of the network functionality In almost all countries all functions are within one company and there is no separation of transport and system operation In some countries there is no separation but separated financial accounts per function Therefore there is no different regulatory treatment at this point In the gas sector only Finland and Spain separate the transport and system operation functions
331 Regulatory System in Place and Efficiency Requirements In most cases a common methodology for setting the revenues for both functions is used In case that there are separated market functions a separate x-factor (efficiency requirement) is applied on the OPEX or even on the TOTEX
332 Operational Expenses (OPEX) The operational expenses of the system operators consist of the components of personnel and operating cost Sometimes additional components are included and there are also operational expenses of the system operator that are excluded from the allowed revenue To obtain the items that integrate the OPEX the financial as well as the regulatory accounts are used
333 Capital Expenses (CAPEX) To calculate the rate of return for System Operator (SO) investments in all countries the same methodological components (WACC and CAPM) are used and the same rate is used as for the transmission investments
42 Definition used by the Agency for the Cooperation of Energy Regulators (ACER)
Ref C20-IRB-54-03
CEER Report on Regulatory Frameworks for European Energy Networks 2020
130156
334 Incentives and Penalties In general there are no incentives or penalties included in the methodology derived from the fulfilment of the system operator functions and therefore in most cases there is no related cap for the incentives or penalties In some countries there are incentives or penalties included in the methodology derived from the fulfilment of the system operator functions like a bonusmalus system for the procurement of balancing and loss energy in Germany or incentives for solving technical restrictions in Spain
335 Tariffs Half of the NRAs which have a separated treatment of system operators do not have a special tariff for the revenues of the system operators For these NRAs the general tariffs are used In other cases there is a special third-party access tariff (eg in Portugal) In Spain the remuneration of the electricity system operator is satisfied 50 by electricity producers according to their available capacity and 50 by retailers and direct consumers For the Spanish gas system operator the revenues are collected as a percentage of the tolls and fees collected
336 Allowed Revenue If there are deviations between the system operatorrsquos collected revenues and the system operatorrsquos allowed revenues most NRAs make an adjustment at the latest two years later after which the difference is settled In the Czech Republic a correction factor is applied
Ref C20-IRB-54-03
CEER Report on Regulatory Frameworks for European Energy Networks 2020
131156
4 Calculation of the Rate of Return Most regulatory systems allow for a rate of return on investments In this chapter we discuss how such returns are set
41 Methods Used of the Rate of Return There are different possible methods to calculate the rate of return Mostly a WACC factor (Weighted Average Cost of Capital) is used In general WACC can be expressed in a simplified manner by the following formula
WACC= 119864119902119906119894119905119910
(119864119902119906119894119905119910+119863119890119887119905)lowast 119862119900119904119905 119900119891 119890119902119906119894119905119910 +
119863119890119887119905
(119864119902119906119894119905119910+119863119890119887119905)lowast 119862119900119904119905 119900119891 119889119890119887119905
NRAs can distinguish between nominal or real and before and after taxation as well as a ldquoVanillardquo WACC43 For electricity network regulation the most popular approach is to use nominal WACC before taxation (as can be seen in the tables of Annex 4 accompanying this report) The otherwise most commonly used method for calculation of the rate of return is the real weighted average cost of capital before taxation which is used by about 25 of the NRAs In the gas sector the nominal WACC before taxation approach is popular as well however the real weighted average cost of capital before taxation is also frequently used (WACC nominal 50 WACC real 30) In addition it is remarkable that four NRAs do not use WACC in the regulation of electricity and gas TSOs and Germany also does not use WACC in the regulation of electricity and gas DSOs
42 Year of Rate of Return Estimation and Length of Regulatory Period To obtain information about the length of regulatory periods and the different tariff years in the individual regulatory systems a time series from 2009 to 2020 was considered In general the majority of NRAs evaluate (or adjust) the rate of return parameters in the year before the regulatory period starts The year before the regulatory period starts is used as a lsquophotorsquo or base year in which the rate of return parameters are evaluated or adjusted for TSOs as well as for DSOs Most NRAs make no distinction between gas and electricity There are only a few Member States that evaluate or adjust the parameters two or three years before start of the regulatory period The typical regulatory period is between three and five years regardless whether it is a TSO or a DSO the electricity sector or the gas sector Just a few Member States use a yearly regulatory period or a period which is longer than five years One country (Estonia) uses an undefined regulatory period so the operator can submit data at any time
43 Rate of Interest The weighted average cost of capital (WACC) is a factor applied to an asset volume to calculate a rate of return However as a companys capital generally consists of both equity and debt capital rates of interest for both of these must be calculated when determining a suitable return
43 This is the weighted average cost of capital using a pre-tax cost of debt and a post-tax cost of equity
Weighting factors
Ref C20-IRB-54-03
CEER Report on Regulatory Frameworks for European Energy Networks 2020
132156
431 Risk-free Rate The risk-free rate is the expected return on an asset which bears in theory no risk at all ie whose expected returns are certain44 In other words the risk-free rate is the minimum return an investor should expect for any investment as any amount of risk would not be tolerated unless the expected rate of return was greater than the risk-free rate The risk-free rate can be described as either ldquonominalrdquo or ldquorealrdquo The nominal interest rate is the amount in money terms of interest payable The real risk-free rate excludes inflation and reflects the pure time value of money to an investor The relationship between nominal and real risk-free rates and inflation can be expressed as follows45
(1 + nominal risk-free rate) = (1 + real risk-free rate) x (1 + inflation) In practice it is not possible to find an investment that is free of all risks However freely traded investment-grade government bonds can generally be regarded as having close to zero default risk and zero liquidity risk
4311 Evaluating Risk-free Rates There are only marginal differences in the individual regulatory systems concerning evaluating the risk-free rate Most NRAs evaluate the risk-free rate on the basis of government bondsrsquo interest rates The risk-free rates are usually evaluated on the basis of their own national government bond interest rates Some regulators however use the interest rates based on the government bonds of selected foreign countries (AA or higher rated) or OECD averages In most cases they use the same methodology for all network operators but in some countries there are differences in approaches between both electricity and gas sector and between transmission and distribution The main reason for such differences is that the risk-free rates have not been evaluated at the same time The most frequently used bonds have maturities of ten years but also lower year bonds appear In addition it is remarkable that Germany uses maturities of 1 2 5 10 20 and 30 years Most CEER Member countries use historical averages but in relation to the years of historical analysis there is no uniform usage The majority of NRAs apply 1 5 or 10 years of historical analysis independent of electricity or gas sector and TSO or DSO regulation
4312 Values of Nominal and Real Risk-free Rates There are different values of nominal and real risk-free rates used by regulators In order to compare the value of risk-free rates the Member States were also asked if the risk-free rate used is nominal or real The conclusions could be drawn that most of the NRAs use nominal risk-free rates (only a few countries use real risk-free rates) and the typical value of nominal risk-free rate is between 10 and 40 Nevertheless the values of the risk-free rates also depend on the year of assessment
44 IRG ndash Regulatory Accounting Principles of Implementation and Best Practice for WACC calculation February
2007 wwwergeuintdocpublicationserg_07_05_pib_s_on_waccpdf 45 S Ross R Westerfield B Jordan Essentials of Corporate Finance IrwinMcGraw-Hill 1996 p 248
Ref C20-IRB-54-03
CEER Report on Regulatory Frameworks for European Energy Networks 2020
133156
432 Debt Premiums In corporate debt finance the debt risk premium is the expected rate of return above a (determined) risk-free interest rate The risk premium is determined as the margin between the risk-free rate and the corporate bond rate It expresses the incentive for an investor to invest in the corporation instead of investing in for example secure government bonds
4321 Evaluating Debt Premiums In the tables of Annex 4 the approach towards debt premiums (where applied) their value the applicable year and a short description of the evaluation are shown The evaluation of the values of debt premiums differs from NRA to NRA They are usually estimated on the basis of market analysis provided by external experts and internal comparative analysis conducted by the NRAs but some of them also use country ratings The values rather reflect the borrowing conditions for network operators which are seen as companies with good ratings The values of debt premiums used by the regulators are in most cases between 040 and 200 Portugal uses a debt premium of 25 for electricity and 275 for gas The values of the debt premium differ marginally from electricity to gas regulation and TSOs to DSOs Only a few CEER Member countries do not use debt premiums in their regulatory system
4322 Real Cost of Debt in Tariff Calculation The tables in Annex 4 show the value of the real cost of debt In order to make the cost of debt applied by the NRAs more comparable the debt premium was (in most cases) added to the real risk-free rates The survey shows that for the majority of the analysed countries the real cost of debt is in a range between 15 and 40 Only a few countries use a real cost of debt at less than 1 or higher than 6 Concerning the year of evaluating real cost of debt most NRAs apply years between 2015 and 2019 Just a few countries use years before 2013
433 Market Risk Premiums Market risk premium could be defined as the excess return that the overall stock market provides over an investment at the risk-free rate This is determined by comparing the returns on equity and the returns on risk-free investments This excess return compensates investors for taking on the relatively higher risk of the equity market The size of the premium will vary as the risk changes (in the stock market as a whole) high-risk investments are compensated with a higher premium
4331 Evaluating Market Risk Premiums The surveyed countries should give information about the value of the market risk premium the year of evaluation and the NRArsquos approach for evaluating it The value of the market risk premium is often in the range of 4 to 5 independent of electricity or gas sector and TSO or DSO regulation Only a few NRAs use market risk premiums with a lower or higher value It is noteworthy that Romania uses the highest value for the gas market (69 for DSOs and TSOs) and Portugal uses the highest value for the electricity market (766 for DSOs ndash including a country risk spread) Concerning the year of evaluation of the market risk premium most Member States apply years between 2015 and 2019 As in the case of debt premiums the values of market risk premiums are also based on a market analysis NRAs also use the reports prepared by the expert group Dimson Marsh Staunton and the analysis provided by Damodaran46
46 httpspapersssrncomsol3paperscfmabstract_id=299335
Ref C20-IRB-54-03
CEER Report on Regulatory Frameworks for European Energy Networks 2020
134156
434 Capital Gearing Gearing could be defined as the proportion of assets that were funded from borrowed funds It is necessary for calculating the WACC when the weighting factors have to be determined
As shown in subchapter 41 the formula 119863119890119887119905
119864119902119906119894119905119910+119863119890119887119905 defines the gearing
4341 Evaluating the Gearing Ratio The questionnaire for this report included the values of the gearing for the year of evaluation and a short description of the evaluation by the NRAs Most of the countries use a gearing between 40 and 60 In general the same value is used for all sectors be they TSOs or DSOs Only a few countries make use of different values and if they do so the value changes only minimally Concerning the year of evaluation of the gearing most CEER Member countries apply years between 2015 and 2019 The majority of NRAs base the gearing ratio on expertsrsquo reports or market analysis
435 Taxes The tax value could be defined as the rate of income tax paid by the network operators
4351 Evaluating the Tax Value The tables in Annex 4 show the value of the tax rates used by the NRAs Additionally the year of evaluation and a short description of the evaluation is included The NRAs filled in the value of the corporate tax or the corporate income tax (depending on the name which is used) which apply to the network companies The value of corporate tax depends on the national tax system Most of the CEER Member countries use a corporate tax rate between 20 and 30 only a few NRAs are situated below or over this value In general the same value is used for all sectors be they TSOs or DSOs Only a few countries make use of different values if this is the case the value only changes slightly Concerning the year of the gearing ratio evaluation most countries apply years between 2015 and 2019 In many regulatory systems the tax value is defined by law
436 Beta An asset beta could be described as a quantitative measure of the volatility of a given stock mutual fund or portfolio relative to the overall market The asset beta therefore reflects the business risk in the specific market where the company operates A beta of one corresponds to the expectations of the market as a whole a beta above one is more volatile than the overall market while a beta below one is less volatile The beta of a company is calculated after subtracting its debt obligations thus measuring the non-diversifiable risk Asset (unlevered) beta removes the effects of leverage on the capital structure of a firm since the use of debt can result in tax rate adjustments that benefit a company Removing the debt component allows an investor to compare the base level of risk between various companies An equity beta could be defined as an indication of the systematic risk attached to the returns on ordinary stocks Equity beta accounts for the combined effects of market and financial risks that the stockholders of a company have to face It equates to the asset beta for an ungeared firm or is adjusted upwards to reflect the extra riskiness of stocks in a geared firm
Ref C20-IRB-54-03
CEER Report on Regulatory Frameworks for European Energy Networks 2020
135156
The dependence between the asset and equity beta is usually presented by the following formula
eszlig = aszlig[1+(1-t)(DE)] where eszlig = equity beta aszlig = asset beta t = tax rate D = Debt E = Equity DE ndash gearing ratio Sometimes in the calculation of the equity beta the influence of taxes is not taken into account In this case the formula for calculation equity beta is as follows
eszlig = aszlig[1+DE]
4361 Evaluating the Asset and Equity Beta The questionnaire included the NRAsrsquo approach for asset and equity beta evaluation The majority of NRAs evaluate beta values by using both external and internal market analyses The most frequently applied approach in the calculation of equity beta is to use the formula which includes tax Some regulators use a formula which does not include tax and Belgium Great Britain and Hungary use direct equity beta without a calculation of asset beta Due to the different gearing ratios a comparison of equity betas could be misleading In order to make the values comparable the asset beta was calculated The calculation was based on the value of equity betas and gearing ratios used by the regulators The formulas presented above were used in this calculation
4362 Betas in the Regulation The tables in Annex 4 show asset beta aszlig = eszlig[1+(1-t)(DE)] andor aszlig = eszlig(1+DE) used in tariff calculation for the electricity and gas TSOs and DSOs The values of asset beta calculated with [aszlig = eszlig[1+(1-t)(DE)] are in the electricity sector as well as in the gas sector typically in the range between 03 and 05 The values of asset betas calculated with [aszlig = eszlig[1+DE]] are generally lower The values for the electricity and gas sectors are between 026 and 04
Ref C20-IRB-54-03
CEER Report on Regulatory Frameworks for European Energy Networks 2020
136156
5 Regulatory Asset Base In general the Regulatory Asset Base (RAB) serves as an important parameter in utility regulation in order to determine the allowed profit The structure of individual components included into the RAB and their valuation differ significantly among CEER Member countries and even among the regulated sectors The RAB value is usually also linked with depreciation depending on an individual NRArsquos approach In general the RAB provides for remuneration of both historic and new investment The RAB should be formed by the assets necessary for the provision of the regulated service in their residual (depreciated) value The RAB can be comprised of several components such as fixed assets working capital or construction in progress Other elements such as capital contributions of customers government (eg subsidies) and third parties on the contrary are usually excluded The RAB may be valued according to different methods (eg historical costs indexed historical costs or actual re-purchasing costs) which will have an influence on the determination of the CAPEX A RAB based on indexed historical costs would therefore require the use of a real instead of a nominal WACC As a result it is important to understand the relation between the RAB definition and the WACC structure
51 Components of the RAB The following subchapter analyses the approach taken by NRAs towards fixed assets working capital assets under construction contribution from third parties and leased assets with respect to their inclusionexclusion to the RAB
511 Tariff Calculation In general the role of the RAB is very important for the tariff calculation Most of the countries use the RAB as one component (multiplied with the WACC) for calculating the allowed revenue With a determined revenue the necessary tariffs can also be calculated Concerning the question of whether 100 of RAB is used in tariff calculation all surveyed NRAs answered with lsquoyesrsquo for electricity TSOs For the other sectors (electricity DSOs gas DSOs gas TSOs) most of the countries use 100 of RAB in tariff calculation Only Poland (for gas DSOs and TSOs) does not use 100 of RAB for the tariff regulation
512 Fixed Assets Fixed assets also known as a lsquonon-current assetrsquo is a term used in accounting for assets and property which cannot easily be converted into cash Fixed assets normally include items such as lines and pipes land and buildings motor vehicles furniture office equipment computers fixtures and fittings and plant and machinery
According to the survey data submitted all NRAs count the fixed assets into the RAB In Poland gas network assets are included in the RAB at net present value
513 Working Capital Working capital represents operating liquidity available to company Working capital is considered as a part of operating capital Net working capital is calculated as current assets minus current liabilities
Working Capital = Current Assets Net Working Capital = Current Assets minus Current Liabilities
Ref C20-IRB-54-03
CEER Report on Regulatory Frameworks for European Energy Networks 2020
137156
The answers to the survey showed that approximately a third of the NRAs include working capital into the RAB therefore the majority of countries do not take working capital into the RAB It should be noted that only in parts of Belgium is working capital is taken into the RAB in the electricity and gas DSO regulation For the Flemish region they calculate working capital into the RAB whereas in the Walloon and Brussels regions they do not take working capital into the RAB In Finland accounts receivables and inventories are allowed into the RAB in book values however excluding cash equivalents or other receivables In Estonia the level of working capital is determined as 5 of the three-year average sales revenue and in Norway as 1 of the book value In Germany only working capital which is necessary for the operations is included and in Luxembourg the working capital is approved if duly justified
514 Assets Under Construction Assets under construction are a special form of tangible assets They are usually displayed as a separate balance sheet item and therefore require a separate account determination in their asset classes Cost includes all expenditures incurred for construction projects capitalised borrowing costs incurred on a specific borrowing for the construction of fixed assets incurred before it has reached the working condition for its intended use and other related expenses A fixed asset under construction is transferred to fixed assets once it has reached the working condition for its intended use Ordinary depreciation is not allowed for assets under construction in most countries Even if from the accounting point of view these assets are not included in the fixed assets the NRAs from a regulatory perspective do sometimes include such cost in the RAB for remuneration as shown in the survey About half of the NRAs responded that electricity transmission and distribution assets under construction are included in the RAB In gas transmission and distribution a few NRAs responded that assets under construction are included into the RAB Some countries have certain conditions for assets under construction to be included in the RAB eg for certain categories of investments as a transition before phase-out or a length of construction of more than two years In Luxembourg also financing costs of assets under construction may be considered under working capital
515 Contribution from Third Parties Contributions from third parties such as connection fees contributions from public institutions EU funding under cohesionstructural funds or EU grants under Decision No 13642006EC which lays down guidelines for trans-European energy networks are often deducted by the NRAs from the RAB (lsquoringfencingrsquo) This approach is based on the reasoning that to the extent the asset (partly or in total) was not financed by the regulated entity it should not be included in the RAB and remunerated The survey shows that the vast majority of the NRAs deduct such contributions from the RAB in the electricity and gas sector for both TSO and DSO regulation Only a few countries take contributions from third parties into the RAB in their regulation
Ref C20-IRB-54-03
CEER Report on Regulatory Frameworks for European Energy Networks 2020
138156
516 Leased Assets According to International Financial Reporting Standards (IFRS)47 finance lease assets must be shown on the balance sheet of the lessee with the amounts due on the lease also shown on the balance sheet as liabilities This is intended to prevent the use of lease finance to keep the lease liabilities off-balance sheet According to a number of national accounting standards however it is possible to consider these assets as the OPEX and keep them off-balance sheet The attached tables (in Annex 4) show that around 40 of the surveyed NRAs include leased assets into the RAB For DSO regulation Belgium includes leased assets only for the Flemish Region and not for the Walloon or Brussels Regions Most countries which do not include leased assets consider them as OPEX Some countries have certain conditions for leased assets to be included in the RAB eg for certain types of leases or do not always base them on IFRS
52 Determination of Initial Regulatory Asset Value The value of the RAB on which the companies earn a return in accordance with the regulatory cost of capital (ie the weighted average cost of capital where applicable) is crucial for the calculation of the regulatory revenue The value of the assets included into the RAB could be expressed either in terms of historical costs or re-evaluated values Whilst the historical cost approach values the RAB with reference to the costs that were actually incurred by the company to build or acquire the network the re-evaluated values represent the costs that would hypothetically be incurred at the time of re-evaluation of the assets
521 Historical Costs The method of valuation of the RAB in historical costs is applied in regulatory regimes where the assets of regulated companies were not re-evaluated or in the regimes where NRAs keep a regulatory database of the historical values of the assets As the historical costs do not reflect a decrease in the real value of the assets caused by the inflation some NRAs make use of the indexed historical cost method In electricity and gas TSO and DSO regulation most of the surveyed NRAs do not base RAB exclusively on historical value of assets
522 Re-evaluation of Assets The re-evaluation of fixed assets is a technique that may be required to accurately describe the true value of the capital goods a business owns The purpose of a re-evaluation is to bring into the books the fair market value of fixed assets This may be helpful in order to decide on selling one of its assets or inserting part of the company into a new company Re-evaluation of assets was conducted in many countries following the unbundling of vertically integrated companies where separate network companies were established
47 International Financial Reporting Standards (wwwifrsorg)
Ref C20-IRB-54-03
CEER Report on Regulatory Frameworks for European Energy Networks 2020
139156
Other reasons for re-evaluation mentioned in the survey were very high inflation rates and the consolidation processes of regulated companies In some regulatory regimes a re-evaluation of distribution assets is conducted annually according to the IFRS accounting standards Even though the most frequently applied method was depreciated replacement costs for the sake of comparison it is crucial to know when the last re-evaluation was performed This is the major difference among countries surveyed The re-evaluation is be done in two ways either once or on a frequent basis One of the main advantages of the annual re-evaluation is that an NRA works with the real asset values and does not need to deal with the significant increase of RAB of market circumstances The surveyed countries answered the question of whether the RAB is exclusively based on re-evaluated assets and if yes how they influence the level of RAB Overall it should be noted that only a few CEER Member countries (25) base the RAB on re-evaluated assets Some of them index RAB annually by using different index eg retail price index or construction industry index or they evaluate assets on the basis of historical costs In electricity transmission the RAB is exclusively based on the re-evaluated assets in six countries the Czech Republic Great Britain Italy Latvia Poland and Sweden For gas transmission and distribution the situation is almost the same The Czech Republic France Great Britain Hungary Ireland Italy Latvia and Sweden base the RAB exclusively on the re-evaluated assets
523 Mix of Historical and Re-evaluated Assets Six NRAs apply a mix of historical values and re-evaluated assets In Germany the equity-financed share of old assets is indexed at replacement values for the cost determination The debt-financed share of old assets is valued at historical values New assets are always valued at historical values In Luxembourg assets are valued at historical costs Old assets (capitalised before 1 January 2010) may as an option be evaluated as follows a fraction of old assets is valued at historical costs (up to the debt ratio 50 of all old assets) and at indexed historical costs (up to the equity ratio 50) In Hungary in the case of natural gas TSOs and DSOs the self-owned fixed assets were re-evaluated except the other technical machines equipment and tools which were accepted at book value Since one of the two natural gas TSOs was established in 2015 its assets were not re-evaluated at all but were accepted at book value
53 Difference Between the RAB Defined on the Net Book Values and the RAB Based on Re-evaluated Asset Base
The CEER Member countries were asked for the difference (in percentage terms) between the RAB defined on net book values according to national GAAP (or IFRS) and the RAB based on re-evaluated asset base The purpose of this question was to find out if there is any difference between net book value and RAB Regulated companies may have re-evaluated the assets but the NRA for regulation purposes could approve only part of those assets
Ref C20-IRB-54-03
CEER Report on Regulatory Frameworks for European Energy Networks 2020
140156
The survey shows that in the electricity as well as in gas sector in nearly 75 of the countries there is no difference between net book value and RAB If there is a difference between net book value and RAB the percentages vary greatly from 30 to over 120 It is noteworthy that Hungary generally has the highest percentage variance (RAB to NBV)
54 Monetary Value of Regulated Assets on Historical Cost Basis and Monetary Value of Re-evaluated Regulated Assets
The survey includes the question of the monetary value of regulated assets on a historical cost basis and the monetary value of re-evaluated regulated assets (in both cases aggregated for all companies) Nearly half of the surveyed NRAs are unable to make a statement concerning this and some of them are not allowed because of confidential information The monetary values of regulated assets and re-evaluated regulated assets are very different and vary from country to country It cannot be said that the amount of the values depends on a specific sector
55 RAB Adjustments The RAB is ordinarily adjusted annually within the regulatory period when the value of the new investments is taken into consideration and the value of the depreciation is deducted According to the survey responses almost three quarters of the NRAs adjust the RAB during the regulatory period and the annual recalculation of the net book value (new investment depreciation) is the most common approach Concerning the question of whether the adjustment affects net book values by accounting for new investments andor depreciation most countries confirm this Usually the book value is calculated by adding investments and subtracting depreciations The survey also enquired whether NRAs adjusted the RAB within the regulatory period to correspond the real values of the RAB by some kind of progression index In Great Britain the RAB is indexed for inflation using RPI (Government retail price index of inflation including interest costs) and in Italy the gross fixed investment deflator measured by the National Institute of Statistics is used
56 RAB Conclusions From a balance sheet perspective fixed assets are the most significant items in the energy industry Also according to the responses of the energy regulators fixed assets were without exception indicated as a component of the RAB A third of the regulators additionally include working capital in the RAB albeit with specific rules for its determination and inclusion Less than half of the regulators in the gas and electricity distribution sectors and in the gas transmission sector include the investment in progress in the RAB For electricity transmission on the other hand the ratio is inversed and investment in progress is more often than not included in the RAB The contribution by third parties is deducted from the RAB by nearly all NRAs with only a few exceptions From the responses one can conclude that the most common way of calculating the RAB components is the historical costs method followed by the re-evaluated assets method with the mixture of these two methods applied only rarely In all countries surveyed other adjustments were not mentioned
Ref C20-IRB-54-03
CEER Report on Regulatory Frameworks for European Energy Networks 2020
141156
6 Depreciations Depreciation decreases the asset value through use and the shortening of theoretical asset life and should also allow a firm to cover replacement investment costs during the economic lifetime of an asset Concerning the duration of depreciation the economic lifetime of the asset should be taken into account in a forward looking long-run approach
The two most common approaches towards depreciation are lsquostraight linersquo and lsquoacceleratedrsquo depreciation The straight-line depreciation method spreads the cost evenly over the life of an asset On the other hand a method of accelerated depreciation such as the double declining balance (DDB) allows the company to deduct a much higher share in the first years after purchase
61 Overview Almost all NRAs use the straight-line approach towards depreciations Once the NRA has decided on a depreciation method (straight line or accelerated depreciation) this method is applied for both gas and electricity system operators in the country For both electricity and gas regulation most NRAs have the same depreciation rate for typical TSO and DSO network assets even when not the case there is usually only a marginal difference One question to the NRAs was ldquoWhich values of depreciation are allowed into the regulationrdquo The regulators predominantly use the same value of depreciation for TSOs and DSOs There may be some minor differences between the two Additionally the NRAs use different depreciation values with the majority using historical values in different variations For the most part the linear method is applied for the depreciation of the regulated assets The lifetime of a typical network asset ranges from 30 to 50 years and the majority of NRAs use the individual depreciation rate for each type of asset However in some regulatory frameworks the average rate for all companies and all assets is applied As with RAB valuation the depreciation of assets could be based on historic values re-evaluated values or on a mixture of these two methods The vast majority of regulators allowed depreciation of tangible and intangible assets valued on the same basis as the RAB in their regulation hence clear correlation between these values can be observed
Ref C20-IRB-54-03
CEER Report on Regulatory Frameworks for European Energy Networks 2020
142156
7 Incentives and Improvements Incentives are one of the central elements of the regulatory regimes in European countries Due to the absence of a competitive environment for network operators regulation has been introduced Instead of defining all the working processes of the regulated network operators most regulatory regimes only constitute a certain framework that aims to give incentives to network operators in a certain direction The next subchapter and the corresponding tables in Annex 4 give an overview of the established incentives At the end of this chapter the trending topics and regulatory improvements which are currently planned or implemented are highlighted
71 Description of the Incentives Established The pace of technological changes has intensified in recent years These changes should be taken into account at the transmission and distribution network level Therefore at both network levels of the electricity sector we find some incentives regarding the installation and operation of smart grids and smart meters At the electricity DSO level there are also some incentives established for the integration of renewable distributed generation In general more incentives are implemented in the electricity sector than in the gas sector Furthermore some countries have individual incentives established in their regulatory regime For example the Spanish regulatory regime includes at the electricity TSO level incentives to not exceed the investment eligible for remuneration incentives to promote an adequate economic and financial capacity a suitable capitalisation and a sustainable debt structure and incentives to extent the useful remuneration lifetime of assets in order to avoid the electricity system to incur in unnecessary investment costs Finland as an example for gas TSO incentives regulation has established incentives for investments quality efficiency and innovation The investment incentive consists of the incentive impact of unit prices and the straight-line depreciation calculated from the adjusted replacement value The quality incentive is based on a quality bonus method in which the reward and sanction are defined on fixed steps and where undelivered energy is used as a quality indicator Annual undelivered energy is benchmarked against the TSOs reference level which is determined by undelivered energy over eight years The target level and upper and lower quarters determining reward andor sanction are derived from the reference level The efficiency reference level is based merely on the operatorrsquos own historical costs In the first year of the regulatory period the average of the previous four-year regulatory period realised controllable operational costs is used as the benchmark for efficiency costs In the following years the benchmark will be the reasonable controllable costs of the previous year Innovation incentive encourages the TSO to develop and use innovative technical and operational solutions in its network operations The key objectives of research and development activities are the development and introduction of smart grids and other new technologies and methods of operation Acceptable costs for research and development (RampD) must be directly related to creation of new knowledge technology products or methods of operations At the electricity DSO level again Spain is one of the countries which has implemented several additional incentives such as investment control incentive a financial prudence incentive an assets lifetime extension incentive and innovation support
Ref C20-IRB-54-03
CEER Report on Regulatory Frameworks for European Energy Networks 2020
143156
Finally Ireland could be mentioned as a country with individual incentives at the gas DSO level They have established incentives for building new connections a better customer performance an incentive to reduce shrinkage against target values and incentives for controllable OPEX and CAPEX
72 If There are no Incentives Established Several NRAs are planning to implement different incentives in their regulatory regime to react to the changes occurring in energy markets For instance Luxembourg will continue to have specific measures for interconnection projects within the new tariff methodology for 2021 Norway is considering changing the tariff structure in order for the demand for MW to influence the tariff for all customers This could give incentives for more demand response For the gas sector Croatia will have a review of the overall tariff setting regulation frame for third regulatory period (2022-2026) Spain is planning some incentives at TSO and DSO level integration of vehicular gas enhancement of cost-efficiency investments and operation incentive for financial prudence incentive to reduce losses in gas transmission pipelines and distribution network etc
73 Trending Topics and Regulatory Improvements The current trending topics which the network operators and the NRAs have to deal with are a mixture of general tasks and new tasks and strategies caused by changes in energy markets Many NRAs are preparing for the next regulatory period As such the existing current situation of the tariffs is analysed and adjustments are made The use or change of the WACC system is also one of the trending topics for the NRAs Due to the energy transition NRAs have to deal with new tasks such as the integration of renewable energies e g wind solar and biogas the installation of smart grids and meters and the necessary investments in new lines pipes and new technology Here the right adjustments and the implementation of incentives are needed to prepare the networks for their new andor changed tasks The integration of flexibility also plays an important role for NRAs here The upgrading of networks to what is often termed a lsquosmart gridrsquo usually comes with a need to be able to transfer huge amounts of data Thus the implementation of data hubs to manage these data is also currently growing in importance
Ref C20-IRB-54-03
CEER Report on Regulatory Frameworks for European Energy Networks 2020
144156
8 Conclusions This CEER report analysed different regulatory systems of electricity and gas networks in most individual EU Member States Great Britain Northern Ireland Iceland and Norway It provides a general overview of the regulatory practices in place the calculation of a rate of return the determination of the regulatory asset base (RAB) and the depreciation of assets in different regulatory systems All these components give an impression of the conditions for possible investments in electricity and gas networks in Europe It is not the intention of this report to paint a complete picture of the existing regulatory framework For example the costs of OPEX and their treatment within the regulatory systems are not considered in this report Furthermore other important factors which are difficult to measure (such as the stability of the regulatory framework or regulatory processes) are not addressed in this report although they play a key role in the decisions of investors When interpreting the figures which are used as the background for the reportrsquos content and which are presented in the tables of Annex 4 accompanying this report the regulatory framework must be considered as a whole as singling out selected parameters would distort the overall picture Nevertheless this report provides detailed information about the regulatory framework and indirect information about the investment conditions in each country offering helpful insights The report shows that different countries have different characteristics in their respective regulatory systems But also that there are many parallels between the regulatory regimes that can be identified (as seen in chapter 2) For the method of asset valuation the WACC is the preferred method by many NRAs Whereas the real WACC was used for the profitability calculation of the re-evaluated assets the nominal WACC is used for the assets in historical values The RAB can be comprised of several components including fixed assets working capital or constructions in progress There is thus some variation amongst NRAs According to the survey data almost all NRAs include the fixed assets in the RAB In contrast with respect to the working capital more than half of NRAs do not include working capital in the RAB or use a derived notion of that working capital depending on whether the electricity or gas system operator is considered The ldquoconstruction in progressrdquo component gives the same result as working capital Less than half of the NRAs surveyed allow assets under construction in the RAB The RAB value is usually linked with depreciation depending on the NRA In gas and electricity regulation straight line depreciation is applied by most NRAs The surveyed NRAs use different depreciation values with the majority using the historical values in different variations The lifetime of the typical network asset ranges from 30 to 50 years and the majority of the NRAs use the individual depreciation ratio for each type of asset
For a deeper analysis of investment conditions it would be useful to take a closer look at other parameters such as costs per unit share of CAPEX TOTEX or the consideration of total costs
Ref C20-IRB-54-03
CEER Report on Regulatory Frameworks for European Energy Networks 2020
145156
Finally the developments of the energy networks in Europe should regularly be analysed closely in the future due to changes caused by the energy transition The switch from conventional to renewable energy sources a growing cooperation between (and inside) European energy networks and the integration of smart elements into the networks can be seen as the next challenges for network operators but also for the national authorities
Ref C20-IRB-54-03
CEER Report on Regulatory Frameworks for European Energy Networks 2020
146156
Annex 1 ndash Lists of Abbreviations
General Abbreviations
Term Definition
ACM Authority for Consumers and Markets (Netherlands)
ANRE National Regulatory Authority for Energy (Romania)
BNetzA Bundesnetzagentur (Germany)
bp Basis Point
CEER Council of European Energy Regulators
CAPEX Capital expenditure
CAPM Capital Asset Pricing Model
CBA Cost-benefit analysis
CPI Consumer price index
CRE Commission de Reacutegulation de lrsquoEacutenergie (France)
CRU Commission for Regulation of Utilities (Ireland)
DDB Double declining balance
DEA Data Envelopment Analysis
DSO Distribution System Operator
DUR Danish Utility Regulator
ECA Estonian Competition Authority
Ei Swedish Energy Markets Inspectorate
ERO Energy Regulatory Office (Czech Republic)
ERSE Entidade Reguladora dos Serviccedilos Energeacuteticos (Portugal)
GAAP General Accepted Accounting Principles
HEA Hungarian Energy and Public Utility Regulatory Authority
HERA Croatian Energy Regulatory Agency
HICP Harmonised Index of Consumer Prices
IFRS International Financial Reporting Standards
ILR Institut Luxembourgeois de Reacutegulation (Luxembourg)
ITO Independent Transmission operator
LNG Liquefied natural gas
MOLS Modified ordinary least squares
NRA National Regulatory Authority
NBV Net Book Values
NERC National Energy Regulatory Council (Lithuania)
NPV Net Present Value
NVE-RME Norwegian Water Resources and Energy Directorate
OPEX Operational expenditure
PUC Public Utilities Commission (Latvia)
RAB Regulated asset base
Ref C20-IRB-54-03
CEER Report on Regulatory Frameworks for European Energy Networks 2020
147156
Term Definition
RAE Regulatory Authority for Energy (Greece)
RAV Regulatory asset value
ROI Return on Investment
RoR Rate of return
RP Regulatory Period
SFA Stochastic Frontier Analysis
TOTEX Total expenditures
TSO Transmission System Operator
TYNDP Ten-year network development plan
URE Urząd Regulacji Energetyki (Poland)
URSO Regulatory Office for Network Industries (Slovakia)
WACC Weighted average cost of capital
Ref C20-IRB-54-03
CEER Report on Regulatory Frameworks for European Energy Networks 2020
148156
Annex 2 ndash List of Questions
Ref C20-IRB-54-03
CEER Report on Regulatory Frameworks for European Energy Networks 2020
149156
Ref C20-IRB-54-03
CEER Report on Regulatory Frameworks for European Energy Networks 2020
150156
Ref C20-IRB-54-03
CEER Report on Regulatory Frameworks for European Energy Networks 2020
151156
Ref C20-IRB-54-03
CEER Report on Regulatory Frameworks for European Energy Networks 2020
152156
Ref C20-IRB-54-03
CEER Report on Regulatory Frameworks for European Energy Networks 2020
153156
Ref C20-IRB-54-03
CEER Report on Regulatory Frameworks for European Energy Networks 2020
154156
Ref C20-IRB-54-03
CEER Report on Regulatory Frameworks for European Energy Networks 2020
155156
Ref C20-IRB-54-03
CEER Report on Regulatory Frameworks for European Energy Networks 2020
156156
Annex 3 ndash About CEER The Council of European Energy Regulators (CEER) is the voice of Europes national energy regulators CEERrsquos Members and Observers comprise 39 national energy regulatory authorities (NRAs) from across Europe CEER is legally established as a not-for-profit association under Belgian law with a small Secretariat based in Brussels to assist the organisation CEER supports its NRA membersobservers in their responsibilities sharing experience and developing regulatory capacity and best practices It does so by facilitating expert working group meetings hosting workshops and events supporting the development and publication of regulatory papers and through an in-house Training Academy Through CEER European NRAs cooperate and develop common position papers advice and forward-thinking recommendations to improve the electricity and gas markets for the benefit of consumers and businesses In terms of policy CEER actively promotes an investment friendly harmonised regulatory environment and the consistent application of existing EU legislation A key objective of CEER is to facilitate the creation of a single competitive efficient and sustainable Internal Energy Market in Europe that works in the consumer interest Specifically CEER deals with a range of energy regulatory issues including wholesale and retail markets consumer issues distribution networks smart grids flexibility sustainability and international cooperation CEER wishes to thank in particular the following regulatory experts for their work in preparing this report Sina Wildenhain (BNetzA) Tim Harlinghausen (BNetzA) and Michiel Odijk (ACM) More information is available at wwwceereu
Ref C20-IRB-54-03
CEER Report on Regulatory Frameworks for European Energy Networks 2020
2156
INFORMATION PAGE
Abstract
This document (Ref C20-IRB-54-03) presents the 2020 edition of the CEER report on regulatory frameworks for European energy networks
This report provides a general overview of the regulatory regimes applied in 2020 the required efficiency developments and analyses the overall determination of capital costs in EU Member States Great Britain Northern Ireland Iceland and Norway A major focus is placed on the calculation of an adequate rate of return the determination of the regulatory asset base (RAB) and the depreciation of assets in the different regulatory regimes Other important individual parameters and new incentive mechanisms presented in this study should be interpreted in the context of a whole country-specific regulatory regime Some contents only reflect an ex-ante approach for 2020 while ex-post calculations are yet to be performed
This report also serves as a background paper to CEER work on incentives both in a quantitative as well as in a qualitative way
Target Audience European Commission energy suppliers traders gaselectricity customers gaselectricity industry consumer representative groups network operators Member States academics and other interested parties
Keywords Regulatory framework investment conditions networks rate-of-return regulation regulatory asset base cost of capital incentive mechanisms depreciations
Disclaimer This report has been drafted with care and CEER has no intention to express opinions with this report However CEER cannot guarantee that the report is free of errors or statements that unintentionally could be taken as an opinion rather than a neutral conclusion or a reported fact If you have any queries relating to this paper please contact CEER Secretariat Tel +32 (0)2 788 73 30 Email brusselsceereu
Ref C20-IRB-54-03
CEER Report on Regulatory Frameworks for European Energy Networks 2020
3156
Related Documents CEER Documents
bull CEER Report on Regulatory Frameworks for European Energy Networks 2019 Ref C19-IRB-48-03 28 January 2020
bull CEER Report on Regulatory Frameworks for European Energy Networks 2018 Ref C18-IRB-38-03 18 January 2019
bull CEER Report on Investment Conditions in European Countries in 2017 Ref C17-IRB-30-03 11 January 2018
bull CEER Report on Investment Conditions in European Countries in 2016 Ref C16-IRB-29-03 24 January 2017
bull CEER Report on Investment Conditions in European Countries in 2015 Ref C15-IRB-28-03 14 March 2016
bull CEER Memo on regulatory aspects of energy investment conditions in European countries Ref C14-IRB-23-03a 27 April 2015
bull CEER Memo on regulatory aspects of energy investment conditions in European countries Ref C13-IRB-17-03 7 March 2014
bull CEER Memo on regulatory aspects of energy investment conditions in European countries Ref C13-EFB-09-03 4 July 2013
External Documents
bull IRG ndash Regulatory Accounting Principles of Implementation and Best Practice for WACC calculation February 2007
bull S Ross R Westerfield B Jordan Essentials of Corporate Finance IrwinMcGraw-Hill 2016
Ref C20-IRB-54-03
CEER Report on Regulatory Frameworks for European Energy Networks 2020
4156
Table of Contents
1 INTRODUCTION 7
2 COMPACT DESCRIPTION OF THE REGULATORY FRAMEWORK 8
21 Austria 9
22 Belgium 14
23 Croatia 15
24 Czech Republic 20
25 Denmark 24
26 Estonia 28
27 Finland 33
28 France 38
29 Germany 41
210 Great Britain 46
211 Greece 49
212 Hungary 54
213 Iceland 59
214 Ireland 63
215 Italy 68
216 Latvia 70
217 Lithuania 73
218 Luxembourg 77
219 Netherlands 81
220 Northern Ireland 85
221 Norway 90
222 Poland 95
223 Portugal 100
224 Romania 105
225 Slovakia 110
226 Slovenia 114
227 Spain 118
228 Sweden 123
3 ECONOMIC THEORY AND THE REGULATORY SYSTEM 128
31 Regulatory System in Place 128
Ref C20-IRB-54-03
CEER Report on Regulatory Frameworks for European Energy Networks 2020
5156
32 Efficiency Requirements 129
33 General Overview of System Operators 129
331 Regulatory System in Place and Efficiency Requirements 129
332 Operational Expenses (OPEX) 129
333 Capital Expenses (CAPEX) 129
334 Incentives and Penalties 130
335 Tariffs 130
336 Allowed Revenue 130
4 CALCULATION OF THE RATE OF RETURN 131
41 Methods Used of the Rate of Return 131
42 Year of Rate of Return Estimation and Length of Regulatory Period 131
43 Rate of Interest 131
431 Risk-free Rate 132
432 Debt Premiums 133
433 Market Risk Premiums 133
434 Capital Gearing 134
435 Taxes 134
436 Beta 134
5 REGULATORY ASSET BASE 136
51 Components of the RAB 136
511 Tariff Calculation 136
512 Fixed Assets 136
513 Working Capital 136
514 Assets Under Construction 137
515 Contribution from Third Parties 137
516 Leased Assets 138
52 Determination of Initial Regulatory Asset Value 138
521 Historical Costs 138
522 Re-evaluation of Assets 138
523 Mix of Historical and Re-evaluated Assets 139
53 Difference Between the RAB Defined on the Net Book Values and the RAB Based on Re-evaluated Asset Base 139
54 Monetary Value of Regulated Assets on Historical Cost Basis and Monetary Value of Re-evaluated Regulated Assets 140
55 RAB Adjustments 140
56 RAB Conclusions 140
6 DEPRECIATIONS 141
61 Overview 141
Ref C20-IRB-54-03
CEER Report on Regulatory Frameworks for European Energy Networks 2020
6156
7 INCENTIVES AND IMPROVEMENTS 142
71 Description of the Incentives Established 142
72 If There are no Incentives Established 143
73 Trending Topics and Regulatory Improvements 143
8 CONCLUSIONS 144
ANNEX 1 ndash LISTS OF ABBREVIATIONS 146
ANNEX 2 ndash LIST OF QUESTIONS 148
ANNEX 3 ndash ABOUT CEER 156 ANNEX 4 ndash COLLECTED amp FILLED OUT TABLEShelliphelliphelliphelliphelliphelliphelliphelliphelliphelliphelliphelliphelliphellipSeparate files ANNEX 5 ndash CASE STUDIEShelliphelliphelliphelliphelliphelliphelliphelliphelliphelliphelliphelliphelliphelliphelliphelliphelliphelliphelliphelliphelliphelliphelliphelliphellipSeparate file
Ref C20-IRB-54-03
CEER Report on Regulatory Frameworks for European Energy Networks 2020
7156
1 Introduction This report is the 2020 version of a series of annual reports drafted and issued by the Council of European Energy Regulators (CEER) It provides a general overview of the regulatory systems for electricity and gas networks in most EU Member States Great Britain Northern Ireland Iceland and Norway in 2020 A major focus is placed on the calculation of a classic and adequate rate of return the determination of the regulatory asset base (RAB) and the depreciation of assets in the different regulatory regimes Other factors may also influence the work of the regulated network operators or the decisions of investors including for example the time required for permitting processes or the overall stability of the implemented regime However these equally important aspects go beyond the scope of this report and are therefore not covered in this analysis In respect to this the reader should be aware that the parameters presented in this study must be interpreted in the context of a whole country-specific regulatory regime CEER considers that in a system with a mature regulatory framework the regulatory review will generally be a package of different decisions which need to form a coherent whole As tariff regulation schemes are highly complex a direct comparison of certain parameters such as capital costs is difficult and should only be done in the context of the whole regulatory system CEER addressed this challenge by undertaking a survey among CEER Members which focused on the main elements for determining allowed revenues This data was then subject to a basic comparison and a number of conclusions were drawn This report includes data submitted by the National Regulatory Authorities (NRAs) of Austria Belgium Croatia Czech Republic Denmark Estonia Finland France Germany Great Britain Greece Hungary Iceland Ireland Italy Latvia Lithuania Luxembourg Netherlands Northern Ireland Norway Poland Portugal Romania Slovakia Slovenia Spain and Sweden (27 countries) The data collection covering the current regulatory regimes in 2020 took place in the first half of 2020 In comparison to the previous report no major changes were found in respect of the most important parameters The tables of chapter 3 and 7 used for the queries have been modified slightly for better clarity and understanding In addition to the second chapter two more countries took the opportunity of authoring a national case study which describes their regulatory regime in a more detailed manner with tables and calculation examples (Annex 4)1 For further details regarding differences or developments one can consult last yearrsquos report
1 Annex 4 is uploaded as a separate document on the same webpage of CEER as this report
Ref C20-IRB-54-03
CEER Report on Regulatory Frameworks for European Energy Networks 2020
8156
2 Compact Description of the Regulatory Framework There is some variation in the number size and structure of electricity and gas network operators across European countries partly because of how individual European countries have developed in the past However network operators are universally regarded as natural monopolies requiring regulation by NRAs As each country decides on the type and structure of its regulatory system it is not appropriate to compare individual systems directly Examining the different systems does however make it possible to identify similarities between them No one system is unique Rather each system makes use of a toolbox of regulatory instruments reflecting the current state of thinking about regulation in a country It is often the case that several regulatory systems employ the same tools or combinations of them However such tools are used in accordance with their suitability in the national context This chapter describes most European regulatory systems The subsections describe the regulatory framework per country without going into great detail Any questions regarding specific features should be directed to the individual NRA that provided the description This chapter is intended to provide assistance to both NRAs and potential investors It may provide supporting materialuseful background information in the event of a possible change in the national regulatory system or if key data from other regulated countries are compared In addition it gives investors an overview of the prevailing returns and terms for planned investments Each national description includes a fact sheet listing the key regulations and figures that provides an overview
Ref C20-IRB-54-03
CEER Report on Regulatory Frameworks for European Energy Networks 2020
9156
21 Austria
Gas TSO Gas DSO Electricity TSO Electricity DSO
Ma
rke
t
str
uc
ture
Network operators
2 21 2 130
Network length
Electricity UHV 6700km HV 11400km MV 69000km LV 173400 km Gas transm amp regional distrib 3100km high-pressure distrib 4100km local low-pressure distrib
35600km
Ownership Private and public Private and public Private and public Private and public
Ge
ne
ral
fra
me
wo
rk
Authority E-Control
System Incentive regulation ndash price cap
Incentive regulation ndash price cap
Cost+ regulation Incentive regulation
ndash price cap
Period 2021-2024 (4yrs) 2018-2022 (5yrs) Annual 2019-2023(5yrs)
Base year for next period
TBD TBD 2019 TBD
Transparency Method decision
Current regulatory framework
FAQs Current regulatory
framework
Main elements for
determining the revenue
cap
Efficiency scores increase in WACC
for taking full volume risk
indexed historic depreciated costs to
determine RAB
Efficiency scores and general
productivity offset network price index
and expansion factors efficiency dependent WACC
Costs of t-2 ex ante costs
according to network
development plan
Efficiency scores and general
productivity offset network price index
and expansion factors efficiency dependent WACC
Legal framework
Gas act 2011 (GWG 2011) Electricity act 2010 (ElWOG 2010)
Rate
of
retu
rn
Type of WACC Mixed WACC pre-taxes based on real cost of equity (share 40) and nominal cost of debt (share
60) beta transformation Modigliani-Miller
Nominal WACC pre-taxes (equity share 40 debt share 60 beta transformation Modigliani-Miller)
Determination of the rate of
return on equity
rE=(real risk-free rate + levered Beta
x MRP)(1 - tax rate) +volume risk
premium
rE=(nominal risk-free rate + levered Beta x MRP)(1 - tax rate)
Rate of return on equity
before taxes
894 (real pre-tax set in 2020 incl volume risk
premium of 35) = (026 +
08545)(1-025)+35
816 (nominal pre-tax set in 2017 granted for the
average efficient DSO)
=(187+0855)(1-025)
816 (nominal pre-tax set in 2017)
=(187+0855)(1-025)
816 (nominal pre-tax set in 2018 granted for the
average efficient DSO)
=(187+0855)(1-025)
Use of rate of return
rE real pre-taxes indexed equity
financed RAB + rD book values of debt
financed RAB
WACC nominal pre-taxes RAB (book values)
Reg
ula
tory
as
se
t
ba
se
Components of RAB
Intangible and fixed assets book values
for debt financed share of assets and
indexed historic costs for equity
financed share of assets
Intangible and fixed assets book values
Intangible and fixed assets book values
and ex-ante determination of
investments according to the
network development plan
Intangible and fixed assets book values
Regulatory asset value
Historic cost appr for debt and
Historic cost approach
Ref C20-IRB-54-03
CEER Report on Regulatory Frameworks for European Energy Networks 2020
10156
Introduction
E-Control the Austrian NRA for the electricity and gas industry was established in 2001 in concert with liberalising the electricity market on 1 January 2001 and the gas market on 1 October 2002 Regulated tariffs for the transmission and distribution of electricity and gas apply in contrast to generation and supply of energy where a market operates On an annual basis E-Control is obliged to determine the costs and volumes of two electricity TSOs approximately 60 electricity DSOs and 21 gas DSOs Furthermore the regulator has to approve a tariff methodology as proposed by the two gas TSOs The regulatory commission then performs the task of setting the tariffs with the costs and volumes provided by E-Control For the relevant legislation of the electricity sector (most pertinently the Electricity Act ElWOG 2010) please refer to httpswwwe-controlatrechtbundesrechtstromgesetze and of the gas sector (mainly the gas act GWG 2011) to httpswwwe-controlatrechtbundesrechtgasgesetze respectively Historical Development While the electricity TSOs are still regulated with an annual cost+ methodology attempts to introduce an incentive regulation framework for the electricity DSOs started in 2003 Two intensive rounds of cost auditing procedures (in 2004 and 2005) delivered an agreement that a long-term incentive regulation framework with stable and predictive conditions would be preferable The first incentive regulation period started in 2006 for electricity DSOs and the first for the gas DSOs in 2008
With the introduction of the Electricity Act 2010 and the Gas Act 2011 the scope for legal appeals were not only extended to the companies under regulatory control but also to the Austrian Chamber of Commerce and the Austrian Chamber of Labour two major customer representatives These Chambers have the same legal rights to challenge the official decision fixing the previously mentioned costs and volumes that are determined by E-Control Not only do the customer representatives have the right to appeal but they are also included in negotiations with industry representatives and associations over various regulatory parameters such as the weighted average cost of capital (WACC) general productivity factors (XGen) and the regulatory framework in general
indexed historic cost appr for equity
up to 2020 For investments
occurring 2021 and onwards a nominal WACC approach
applies
RAB adjustments
None
RAB developments during a regulatory
period are taken into account and lead to
changes of the regulated cost base
None
RAB developments during a regulatory period are taken into account and
lead to changes of the regulated cost
base
De
pre
ci-
ati
on
s Method Straight line
Depreciation ratio
Depending on asset type lines 2-3 transformers 4-5 substations 4
Consideration Pass through Pass through Pass through Pass through
Ref C20-IRB-54-03
CEER Report on Regulatory Frameworks for European Energy Networks 2020
11156
Current Regulatory Frameworks Electricity Transmission The two Austrian electricity TSOs are regulated with an annual cost+ methodology Those costs and volumes are audited on an annual basis on the least available costs in t-2 (historical values) to the year (t) where the tariffs are in force This general framework to rely on historical values is abrogated for investments according to the ten-year network plan which is subject to approval by E-Control Capital costs are recognised ex-ante in line with paragraph 38(4) of ElWOG 2010 In order to overcome the t-2 delay the approved historic controllable costs are adjusted with a network price index and an individual efficiency offset besides a general efficiency requirement to current costs Non-controllable costs consist of ancillary services secondary control network losses and costs due to network expansion within the ten-year network plan among others where no efficiency requirements are applied in line with paragraph 59(6) of ElWOG 2010 The individual efficiency factor stems either from CEERrsquos international E3Grid Benchmarking procedure (if the TSO participated) or from other sources that are appropriate (eg the efficiency outcome of the distribution grid) Additional elements included into the cost+ framework permit the companies to earn a bonus if ex-ante set targets on various market relevant duties (eg facilitation of competition in reserve markets) are met The regulatory account ensures that the company bears no volume risk at all Differences resulting from deviations between planned (t-2) volumes and actual volumes are considered when setting new tariffs in the following years An adder is granted to the nominal weighted average cost of capital (WACC) to promote and facilitate investments Although both electricity TSOs are cost+ regulated annually the WACC and its adder are granted for a time-span in line with the 3rd regulatory period for gas DSOs (ie 2018-2022) Gas Transmission In contrast to both the electricity and the gas distribution sectors E-Control is not obliged to approve the costs and volumes on an annual basis E-Control approves a tariff methodology which is submitted by the TSOs as a proposal After approval the NRA sets costs and volumes according to these principles for the whole duration of a regulatory period of four years The tariffs are set for this period and do not change within the period
The regulatory framework for gas transmission is quite different from the other sectors as it consists of a forward-looking tariff methodology It applies to the regulatory period of 2021-2024 The regulatory asset value (RAV) is split into debt and equity financed shares and consists of book values for the former and current indexed values for the latter This differentiation is applied to all assets commissioned prior to 2021 Due to this procedure the debt finance share of the RAV is remunerated with a nominal rate of debt (161) and the equity financed RAV with a real rate of equity (544 before taxes excl volume risk premium) For investments occurring in 2021 and onwards a nominal WACC pre-tax of 358 is granted As there is by law no regulatory account (to account for differences in estimated or historical volumes and actual ones) foreseen for the gas TSOs these entities bear the full volume risk in contrast to the three other sectors To compensate these companies for the volume of risk they bear the real rate of equity is lifted by 350 basis points (bp) Forward-looking costs are adjusted with an efficiency factor consisting of an individual and a general component In total the requirement amounts to 15 pa and is the result of negotiations between customer representatives and the TSOs This value is based on a self-assessment by the TSOs Costs for planned investments are considered ex-ante and aligned with actual investments in the next regulatory period
Ref C20-IRB-54-03
CEER Report on Regulatory Frameworks for European Energy Networks 2020
12156
The current methodology for gas TSOs foresees an uplift of the equity return by 150 bp in case of RampD investments (pilot projects) Eligible pilot projects must enhance the efficiency of operation and should bear a positive economic surplus (cost benefit analysis) If external research funds grant a subsidy these grants are not deducted from allowed OPEX A major change from previous methodologies is a now symmetric bonus-malus scheme for operating targets (ie environment and safety for workers minimum quality requirements critical infrastructure protection) A description of the tariff methodology for the period 2021-2024 is published in English at the following link httpswwwe-controlatenmarktteilnehmergasnetzentgeltemethodenbeschreibung Electricity Distribution The current 4th regulatory period for electricity DSOs has been effective since 1 January 2019 and lasts until 31 December 2023 (a five-year period) The regulatory framework was adopted for the 4th regulatory period to be in line with the methodology that was established for the gas distribution sector one year in advance
The TOTEX inflation-adjusted budget constraint with general and individual productivity offsets was replaced by a similar procedure to OPEX and an introduction of an efficiency-adjusted WACC for the cost of capital While depreciation is a pass-through based on a t-2 principle the income of occurred investments is granted The return on these investments is adjusted with the company specific efficiency values taken from a national benchmarking analysis that relies on the two methods MOLS (modified ordinary least squares) and DEA (data envelopment analysis) and varies between a bandwidth of +- 05 around the WACC of 488 for the average efficient DSO A calibration mechanism ensures that the system is cost neutral ie the rewards for above average performance equal the penalties for below average performance The OPEX which is determined for the base year of a regulatory period is adjusted via a network price index (consisting of a consumer price index and a wage index) a general productivity offset (095) and an individual efficiency factor annually The individual efficiency factor is derived from a national relative efficiency estimate (with the benchmarking models based on TOTEX MOLS and DEA across a time span of 75 years (one and a half regulatory periods) in which the inefficiencies have to be removed In the previous period this time span amounted to ten years Investments occurring during the regulatory period are treated as average-efficient until a new benchmarking analysis is performed at the beginning of the next period The capital costs of these investments are considered with a t-2 delay A mark-up on the WACC is also applied to encourage investments Besides the annual treatment of the capital costs an operating cost factor is adjusting the budget during the regulatory period for a change in service provision This change is measured as an annual deviation in line length of high medium and low voltage level as well as metering points to the corresponding values in the base year The deviations (increase or decrease of line lengths and metering points) are multiplied with specific operating cost estimates and increase or decrease the approved budged during the regulatory period The OPEX cost+ mechanism for the smart metering roll-out was replaced for the 4th period with a lump sum remuneration that not only provides an incentive to undercut this granted flat-value but also to decrease the administrative burden for the NRA
Ref C20-IRB-54-03
CEER Report on Regulatory Frameworks for European Energy Networks 2020
13156
A regulatory account further ensures that effects due to the t-2 principle do not translate into windfall profits or losses to the network operators Gas Distribution The current 3rd regulatory period for gas DSOs started on 1 January 2018 and ends on 31 December 2022 (five-year period) and includes major changes when compared to the 2nd regulatory period The TOTEX inflation adjusted budget constraint with general and individual productivity offsets was replaced by a similar procedure to OPEX and an introduction of an efficiency-adjusted WACC for the cost of capital While depreciation is a pass-through based on a t-2 principle the income of occurred investments is granted The return on these investments is adjusted with the company specific efficiency values taken from a national benchmarking analysis that relies on the two methods MOLS and DEA and varies between a bandwidth of +- 05 around the WACC of 488 for the average efficient DSO The initially introduced parameters k1 and k2 ensure a setting where the outcome is not cost-neutral and rewards above-average efficient DSOs This means that a total of five million euros per year for above average performance and -2 million euros per year for below average efficiency Investments occurring during the regulatory period are treated as average-efficient until a new benchmarking analysis is performed at the beginning of the next period The capital costs of these investments are considered with a t-2 delay A mark-up on the WACC is also applied to encourage investments Besides the annual treatment of the capital costs an operating cost factor is adjusting the budget during the regulatory period for a change in service provision This OPEX-factor is similar to the factor for electricity DSOs as mentioned above with two further incentives for DSOs to acquire new customers and to encourage development of the gridrsquos density (providing services to more customers with the existing grid lengths) A regulatory account further ensures that effects due to the t-2 principle do not translate into windfall profits or losses to the network operators Both customer representatives ndash the Austrian Chamber of Commerce and the Austrian Chamber of Labour ndash have appealed against the official decisions (the cost determinations according to the controversial regulatory model) of all gas DSOs In autumn 2019 and spring 2020 around a third of all cases have been settled by the respective DSOs and the customer representatives The settlement consists of an adjustment of k1 and k2 in a cost-neutral manner as well as an increase in the general productivity requirement (slight increase from 067 to 083 pa) Due to the settlement the bandwidth of the efficiency dependent WACC is further narrowed and spans now between 455 for the minimum efficient DSO to 505 for the efficient DSO (with 488 to the average efficient DSO) The remaining cases are still pending at the federal administrative court but are expected to be settled with the same outcome A quality regulation is considered inappropriate as suitable indicators have not been identified yet Despite this minimal quality standards on commercial quality besides norms for product quality are already in effect The description of the 3rd regulatory period for gas DSOs is only available in German and published at the following link httpswwwe-controlatmarktteilnehmergasnetzentgelteentgeltermittlungsverfahren
Ref C20-IRB-54-03
CEER Report on Regulatory Frameworks for European Energy Networks 2020
14156
22 Belgium Gas TSO Gas DSO Electricity TSO Electricity DSO
Ma
rke
t
str
uc
ture
Network operators
1
Network length
+- 4200 km
Ownership Public
Ge
ne
ral
fra
me
wo
rk
Authority CREG
System Incentive regulation revenue cap
Period 4 years current period 2016-2019
Base year for next period
3rd year in current regulatory period
Transparency Evolution of Regulatory account
Main elements for
determining the revenue
cap
Non-controllable and controllable
costs depreciation costs taxes and fair
margin
Legal framework
Belgian Law and by CREG approved Tariff Methodology
Rate
of
retu
rn
Type of WACC No use of WACC
Determination of the rate of
return on equity
Sum of a nominal risk-free rate and a risk premium (market risk premium multiplied with a risk factor) multiplied with (1+illiquidity premium) multiplied with a corporate tax factor
Rate of return on equity
before taxes 576 = (090+35065)(1+020)1513
Use of rate of return
Granted for existing assets to a maximum of 33 of the imputed business assets Any available equity capital in the capital structure in excess of this will be subject to another
equity interest rate
Reg
ula
tory
as
se
t
ba
se
Components of RAB
Fixed assets working capital assets under construction
Regulatory asset value
23 Beuro (2016)
RAB adjustments
Investments (+) divestments (-) depreciation (-)
subsidies (-)
Dep
rec
iati
on
s
Method Straight line
Depreciation ratio
Depending on assets pipes 2 compressors 3
Consideration
Non controllable
For 2020 the National Regulatory Authority was not able to author the descriptive part of this subchapter nor complete the above fact sheet
Ref C20-IRB-54-03
CEER Report on Regulatory Frameworks for European Energy Networks 2020
15156
23 Croatia Gas TSO Gas DSO Electricity TSO Electricity DSO
Ma
rke
t
str
uc
ture
Network operators
1 35 1 1
Network length
2531 km 19673 km 7758 km 140067 km
Ownership Public ownership
Private and local public ownership
Ge
ne
ral
fram
ew
ork
Authority Croatian Energy Regulatory Agency (HERA)
System Incentive Regulation Revenue cap
Cost plus method (cost of service rate of return)
Period
5 years current regulatory period 2017-2021
Business costs and costs of development are based on business
and development plans prepared adjusted and adopted for every year based on a three-year development
plan with the Agencyrsquos consent
Base year for next period
Base year is 2015 for 2nd regulatory period 2017-2021
Base year is 2019 for regulatory period 2018-2020
Transparency
For gas TSO httpwwwplinacrohrdefaultaspxid=5
92
For gas DSO information about
regulation and prices are published
on HERAs web-site wwwherahr
For Electricity TSO httpswwwhopshr
For Electricity DSO information about regulation and prices are published on HERAs web-
site wwwherahr
Main elements for
determining the revenue
cap OPEX and CAPEX OPEX is projected for regulatory period based on 1+CPI-X formula without ex-post adjustment if realised above but with profit-sharing mechanism if realised OPEX is below projected level Budgeted-planned CAPEX with an ex-post adjustment based on real values (only up to the economically efficient level)
OPEX and CAPEX Operating costs TPpos include the following
bull Costs of network maintenance
bull Costs of loss coverage in the network
bull Costs of gross salaries
bull Other staff costs
bull Other business-related costs
bull Other costs determined by the law
Costs of capital TPkap equal the following
TPkap = PRim + A whereby individual items are the following PRim ndash revenues from regulated
assets (regulated asset base) [kn] and A - Depreciation of the regulated
assets in the considered year [kn]
Legal framework
Methodology for the Determination of the Amount of Tariff Items for Gas Transmission (Official Gazette No 481858187920) Methodology for the Determination of the Amount of Tariff Items for Gas Distribution (Official Gazette No 4818)
Meanings of the expressions used in this Tariff System are determined by the Energy Act (ldquoOfficial Gazetterdquo No 6801 and 17704) the Act on the Electricity Market (ldquoOfficial Gazetterdquo No 17704) the General Conditions of Electricity Supply (ldquoOfficial Gazetterdquo No 1406) and the Grid Code for the Electric Power System (ldquoOfficial gazetterdquo No 3606)
Rate
of
retu
rn Type of WACC Nominal pre-tax WACC WACC before taxation
Determination of the rate of
The rate of return on equity (re) is determined by applying the capital asset pricing model
The rate of return on equity (re) is determined
Re= r
f + (r
m - r
f) middot
Ref C20-IRB-54-03
CEER Report on Regulatory Frameworks for European Energy Networks 2020
16156
return on equity
(CAPM) according to the formula re = rf + β times (rm - rf) wherein the following items are rf - the risk-free rate of return () rm - the rate of return on the diversified market portfolio () rm - rf - the market risk premium () β - the coefficient of variability of return on the operatorrsquos shares in relation to the average variability of return on the market portfolio
rf -Return from risk-free investments ()
(rm
- rf)- Average return on risky
investments (expected return on market portfolio) ()
- Variability coefficient of return on energy operators shares in relation to average variability of return on all shares quoted on the market
Rate of return on equity
before taxes Rate of return on equity 534 Risk-free rate of return 275 Coefficient β 054 Market risk premium 480 Rate of return on diversified market portfolio 755 Share of equity in total capital 50 Rate of return on debt 392 Share of debt in total capital 50 Rate of return on profit 18 Amount of WACC for the regulatory period 522
Rate of return on equity 684 Risk-free rate of return 425 Coefficient β 054 Market risk premium 480 Rate of return on diversified market portfolio 905 Share of equity in total capital 50 Rate of return on debt 488 (maximum value) Share of debt in total capital 50 Rate of return on profit 20 Amount of WACC for the regulatory period 672 (maximum value)
Risk-free rate of return 270 Coefficient β038 Market risk premium 645 Cost of equity 485 Cost of debt 336 Share of equity in total capital 40 Share of debt in total capital 60 Rate of return on profit 18 Amount of WACC for the regulatory period 403
Risk-free rate of return 270 Coefficient β 038 Market risk premium 645 Cost of equity 485 Cost of debt 336 Share of equity in total capital 40 (maximum value) Share of debt in total capital 60 Rate of return on profit 18
Amount of WACC for the
regulatory period 403
Use of rate of return
The nominal weighted average cost of capital before tax (WACC) is used as the rate of return on regulated assets As a measure of avoiding systemic risk the rate of return on equity is calculated using the CAPM model and the rate of return on debt capital is determined as the average weighted interest rate on investment loans used by the system operator to finance regulated assets The shares of debt and equity capital are defined as target shares in the amount of 50 which is theoretically optimal capital distribution and approximates the effect of the financial leverage to a good extent
The rate of return is usually calculated using the weighted average cost of capital formula (WACC) The WACC reflects two types of finance used to fund investments debt and equity respectively The cost of equity is calculated using the Capital Asset Pricing Model (CAPM)
Reg
ula
tory
as
se
t b
ase
Components of RAB
RAB includes both tangible and intangible assets which is in operation and also planned investments which will be put in operation for each year of the regulatory period
RAB at the end of the year is equal -value of regulated assets in the beginning of the year and does not include the value of assets received without charge [kn] plus value of new investments in the considered year financed from depreciation profit credits co-financing donations and from issuing bonds and other securities [kn] minus value of assets received without charge in the considered year [kn] minus depreciation of the
Ref C20-IRB-54-03
CEER Report on Regulatory Frameworks for European Energy Networks 2020
17156
regulated assets in the considered year minus appropriated and decommissioned assets [kn]
Regulatory asset value
RAB is calculated as historical cost of the assets such as depreciated book value of the assets
RAB is calculated as historical cost of the assets such as depreciated book value of the assets
RAB adjustments
In the last year of the regulatory period revision of allowed revenues is performed RAB is revised in way that the revised value of regulated assets at the end of each regulatory year t is equal to the realised value determined on the basis of balance sheet in part that HERA considers reasonable For the TSO value of pipelines is adjusted according to utilisation rate
By the ordinance defined investments after the base year eg expansions lead to an adjustments of the non-controllable costs and therefore of the revenue cap The assets of the base year are used as RAB
De
pre
cia
tio
ns Method Linear method Linear method
Depreciation ratio
286 for gas pipelines measuring and regulating stations and office buildings while for other types of assets 5 - 10
Depending on asset type Ratio between 15 and 5 eg lines amp cables ~2 stations ~4
Consideration Amount of annual depreciation of regulated assets is added to the allowed revenue
Amount of annual depreciation of regulated assets is added to the allowed revenue
Regulatory Framework for Tariff Determination for Gas Infrastructure Activities The Croatian NRA is the Croatian Energy Regulatory Agency (HERA) The methodologies for determining the tariffs for gas infrastructure activities in the Republic of Croatia are based on the incentive regulation method ie on the revenue cap method Thereby projected allowed revenue shall cover reasonable operating expenses generated when performing the energy activity and ensure the return on regulated assets The revenue cap method applied stipulates the regulatory period as a multiannual period for which separately for each regulatory year the allowed revenues are defined which consist of eligible OPEX and the eligible CAPEX and the amount of tariff items The duration of the first regulatory period was three years (2014 - 2016) the second regulatory period (2017 - 2021) and the subsequent regulatory periods are five years The allowed OPEX is projected for the regulatory period on the basis of the 1+CPI-X formula (CPI = projected consumer price index for the regulatory year) In addition to the efficiency factor X in the OPEX part as an important incentive element for the system operator a profit-sharing mechanism is also stipulated which is implemented in such a manner that after expiry of the regulatory period the base OPEX for the following regulatory period is defined so that the system operator retains 50 of the realised savings from the base year The eligible CAPEX which includes depreciation cost and the return on regulated assets recognises an equity capital investment into a regulated energy entity ie provides sufficient funds for the required investments into the construction and reconstruction of the system and to cover the regulated return on invested capital The regulated assets consist of tangible and intangible assets in use which is a part of a particular gas system and investments under an approved system development plan that are taken into account for the regulatory year in which it shall be in use Capital expenses ie depreciation and return on regulated assets are not included in direct efficiency improvement mechanisms but are defined by an ex-ante approach as part of approving the investment plans and the amount of tariff items which reduces the investment risk and provides more investment incentives Namely the risk of not covering the costs of infrastructure projects if they are eligible and economically efficient is eliminated Additional incentives in terms of CAPEX may lead to overinvestment and are therefore not required
Ref C20-IRB-54-03
CEER Report on Regulatory Frameworks for European Energy Networks 2020
18156
An important incentive element within the applied regulatory method is the regular audit of the allowed revenues which is performed in the last year of the regulatory period and as part of which the difference is determined between the realised revenue (R) and the audited allowed revenue (AI) to be distributed to the following regulatory period Since the applied revenue cap method guarantees to the system operator the level of revenue in the medium term a significant part of the market risk is shifted to the system users The reduction of market risk also affects the reduction of the liquidity risk and hence the reduction of the cost of financing the investment activities An additional measure aimed at mitigating the risk of the system operator business is the option of performing an extraordinary audit of the allowed revenue also during the current regulatory period at the request of the operator or according to the estimates by HERA The extraordinary audit of allowed revenue is performed due to unexpected changes in the market that have a significant impact on the conditions of providing the energy activity which the system operator could not have foreseen nor prevented eliminated or avoided As part of the extraordinary audit an audit may be performed of all the elements used in the calculation of the allowed revenue and in the calculation of the amount of tariff items for the current regulatory period An additional measure in gas distribution is the possibility of introducing a regulatory account This is an optional model of economic regulation which provides the possibility for the system operator in the later years of the regulatory account the reimbursement of the revenue realised in the early years in the amount less than the allowed revenue that would have resulted from the application of the standard regulation model That is in the case of significant investments in the existing infrastructure or with entirely new infrastructure the standard regulation model is not appropriate since significant investments which by being put into use are included in the regulatory asset base affect the strong growth in the amount of allowed capital expenses in the first years of the project At the same time large investments in the initial period are often accompanied by low system usage level The aforementioned situation would result in uncompetitive high tariffs for using the system in the same period which would represent a negative factor for the decision to invest in the project Therefore the regulatory account is approved in such a manner that the gas system operator achieves cumulatively the same allowed revenue as without the use of the regulatory account but with different time dynamics The period for which a regulatory account is established may not be shorter than two regulatory periods nor longer than the period for which the operator has concluded a concession contract Such a mechanism also prevents discrimination against new users that use the system in the early years since the tariff items are unified and without fluctuations throughout the entire period for which the regulatory account is kept The nominal WACC before tax is used as the rate of return on regulated assets As a measure of avoiding systemic risk the rate of return on equity is calculated using the CAPM model and the rate of return on debt capital is determined as the average weighted interest rate on investment loans used by the system operator to finance regulated assets The shares of debt and equity capital are defined as target shares in the amount of 50 which is theoretically optimal capital distribution and approximates the effect of the financial leverage to a good extent In this respect a pre-defined ratio of debt and equity capital in the WACC calculation significantly reduces the regulatory risk while at the same time encourages the system operator to consider the actual capital structure used In addition applying a targeted ratio provides for equal treatment and approach to WACC calculation for all energy entities in gas infrastructure activities The decision on the actual capital structure in regular business and project financing remains with the system operator while the target ratio defined by the methodologies for determining the amount of tariff items for gas infrastructure activities in the Republic of Croatia refers solely to the WACC calculation
Ref C20-IRB-54-03
CEER Report on Regulatory Frameworks for European Energy Networks 2020
19156
Regulatory framework for tariff determination for electricity infrastructure activities Introduction The electricity networks are examples of what are known as natural monopolies where effective competition is restricted To ensure that network operators (DSOs = Distribution System Operators TSOs = Transmission System Operators) do not make any monopoly profits but still operate their networks as cost effectively as possible the electricity network operators are subject to regulation This task is performed by the HERA as the regulatory authority responsible in Croatia for the networks in various sectors including electricity and gas Historical development Regulation by the HERA began in 2006 as cost-plus regulation Under this regime the revenue that network operators are allowed to earn within a certain period (regulatory period) is determined using a mathematical formula and fixed for the period It therefore incentivises network operators to lower their costs within the regulatory period (work efficiently) so as to increase their profits within the limits of the framework (revenue (fixed) minimum income realised by implementation of tariff items should cover the acknowledged total costs of electricity distribution) Allowed revenue shall cover reasonable operating expenses generated when performing the energy activity and ensure the return on regulated assets The revenue cap method applied stipulates the regulatory period as a multiannual period for which separately for each regulatory year the allowed revenues are defined consisting of eligible OPEX and eligible CAPEX In the course of the current regulatory year based on business data from the Annex 1 of this Tariff System the Agency shall determine the total acknowledged operating costs for the previous regulatory year - the realised income according to tariff items and the value of their difference ΔUTPpret The difference between the realised income by implementation of tariff items the acknowledged total operating costs from the previous regulatory year ΔUTPpret and the estimated difference for the current regulatory year ΔUTPsad shall be taken into consideration when determining the amounts of tariff items for electricity distribution of tariff customers for the considered future regulatory year
Determining the revenue caps
A regulatory period equals one regulatory year Determining the amounts of tariff items for the future regulatory year is based on the acknowledged operating costs from the previous regulatory year realised and estimated operating costs for the present regulatory year and accepted planned costs for the considered future regulatory year The revenue caps for network operators are set for a regulatory period The costs data is supplemented by a calculated return on equity The premium covering network-specific risks is determined using the capital asset pricing model (CAPM) and is derived from the product of an imputed market risk premium and a risk factor (beta factor) A pre-defined ratio of debt and equity capital in the WACC calculation significantly reduces the regulatory risk while at the same time encourages the system operator to consider the actual capital structure used
Transparency
The data is published on the regulatory authority website
Ref C20-IRB-54-03
CEER Report on Regulatory Frameworks for European Energy Networks 2020
20156
24 Czech Republic Gas TSO Gas DSO Electricity TSO Electricity DSO
Ma
rke
t
str
uc
ture
Network operators
1 3 regional 65 local
1 4 regional 250 local
Network length 3822 km (2019) 62171 km (2019 regional and local
DSOs) 5601 km (2019)
244240 km (2019 regional DSOs)
Ownership Private ownership Private and local public ownership
Public ownership Private and local public ownership
Ge
ne
ral
fra
me
wo
rk
Authority Energy Regulatory Office wwwerucz
System Incentive regulation
Revenue cap Price cap
Incentive regulation Revenue cap
Period Originally set as 3-year (2016-2018) later it was prolonged until 2020
Base year for next period
No specific base year applied
Transparency Price decisions Regulatory methodology
Main elements for determining the revenue cap
Allowed costs Allowed depreciation
RAB WACC
Legal framework
Act No 4582000 on the Conditions of Business and State Administration in Energy Industries and on Changes to Certain Laws (the Energy Act) Public notice no 1952015 on price control in gas sector
Act No 4582000 on the Conditions of Business and State Administration in Energy Industries and on Changes to Certain Laws (the Energy Act) Public notice no 1942015 on price control in electricity sector
Rate
of
retu
rn
Type of WACC Nominal pre-tax WACC
Determination of the rate of return
on equity
Sum of nominal risk-free rate and a risk premium (market risk premium multiplied by beta factor)
Rate of return on equity before
taxes 966 = (382 + 500 0801) (1 ndash 019) 1028 = (382 + 500 0901) (1 ndash 019)
Use of rate of return
The whole RAB is multiplied by the WACC When setting the nominal pre-tax WACC the DE ratio of 38486152 was used
The whole RAB is multiplied by the WACC When setting the nominal pre-tax WACC the DE ratio of 45755425 was used
Reg
ula
tory
as
se
t
ba
se
Components of RAB
Fixed assets investments in progress leased assets no working capital
Regulatory asset value
The RAB is based on re-evaluated values of assets that are recorded in the annual financial statements
RAB adjustments
The adjustment is similar to the net book value calculation (investment - depreciation) the formula for RAB adjustment is ldquoinvestment ndash depreciation x krdquo k is revaluation coefficient which is set annually and which is calculated as the result of dividing the planned value of the regulatory asset base in year ldquoi-1rdquo by the planned residual value of assets in year i-1 k = lt01gt
Dep
rec
iati
on
s
Method Straight line
Depreciation ratio
Buildings 2 Pipes 25
Pumps Compressors 5
Electricity transmission system operator calculates
the depreciation in accordance with national
accounting standards
Buildings 2 Overhead lines and Cables 25
Transformers VHV 4 Transformers MV LV 33
Metering devices 66
Consideration 100 of the depreciation is used to determine the allowed revenue
Ref C20-IRB-54-03
CEER Report on Regulatory Frameworks for European Energy Networks 2020
21156
Introduction Electricity and gas distribution and electricity and gas transmission are so-called natural monopolies the operation of which relies on only one network because the rollout of a parallel infrastructure is not effective in economic terms To prevent monopolies from dictating prices uncontrollably they have to be regulated by the state A regulatory authority is usually authorised to do this in the case of regulation In the Czech Republic Act No 4582000 (the Energy Act) sets up the Energy Regulatory Office (ERO) for the purpose of regulation in the energy sector Under the Energy Act the ERO is obliged to set out in implementing legal regulations the method of regulation in energy industries and price control procedures To this end public notices no 1942015 on price control in electricity sector and no 1952015 on price control in gas sector were published in August 2015 they came into effect with the beginning of the fourth regulatory period (RP) in 2016 Furthermore ERO published a document called ldquoPrinciples of price regulation for the period from 2016 to 2018 in electricity and gas sector and for the market operatorrsquos activitiesrdquo in which the price methodology for the fourth RP is described in more detail The fourth RP was originally set as a three-year period (2016-2018) but in January 2018 it was prolonged until the end of 2020 without any changes in the price methodology The purpose of the methodology for the fourth RP was to determine a reasonable level of profit for companies during the whole RP to ensure adequate quality of the services provided to customers with effective spending of costs to support future investments to provide for the resources required for network renovation and to continue to improve efficiencies from which customers also benefit Price Control in the Electricity Industry The resulting price of electricity supply for all categories of final customers is comprised of five basic components The first component is the uncontrolled price of commodity ie the electrical energy itself [in Czech called ldquosilovaacute elektřinardquo still ldquoenergyrdquo or ldquoelectricityrdquo in English] which is priced on market principles and in line with the various electricity suppliersrsquo business strategies The other components of the price are as follows regulated activities of a monopoly nature which include electricity transport and distribution from the generating plant over the transmission and distribution systems to the final customer and also activities related to ensuring the stability of the electricity system from the technical point of view (the so-called provision of system services) and from the commercial point of view (primarily the electricity market operatorrsquos activity in the area of imbalance clearing) The last component of the resulting price of electricity supply is the contribution to support of electricity from promoted sources The above is the approach to electricity supply pricing for all customer categories with effect from 1 January 2006 when the Czech electricity market was completely liberalised Price Control in the Gas Industry The price of natural gas supply for final customers is comprised of four basic components The first component is the charge for commodity ie natural gas itself which is priced on market principles and in line with the various gas suppliersrsquo business strategies The other three components are the price for gas transmission gas distribution and market operatorrsquos activities The prices for these three components are regulated and determined by ERO Regulatory Methodology Framework A revenue cap methodology is used for setting the allowed revenue in the Czech Republic The length of the RP is mainly five years The basic formula for determining allowed revenue is
Ref C20-IRB-54-03
CEER Report on Regulatory Frameworks for European Energy Networks 2020
22156
AR = AC + AD + P
where
AR is the value of the allowed revenue AC is the value of the allowed costs AD is the value of the allowed depreciation P is the value of the allowed profit Allowed Costs The generally adopted theory of regulation assumes that the costs that enter into the subsequent RP are determined based on the analysis of values achieved in the preceding period This theory is based on the assumption that during the RP the companies reduce their costs under the pressure for efficiency thereby achieving higher profits than those set for them by regulator ERO decided to determine the initial level of allowed costs as the arithmetic average of actual accounting costs for two particular years specifically years 2012 and 2013 for which the audited actual values were available ERO considered such procedure for the fourth RP to be objective transparent fair and acceptable for all market participants For setting the cost base ndash to obtain the input value of costs ndash rigorous classification of reported costs for the defined reference years had to be carried out for regulated entities and the anomalies that were not accepted for this input data were separated from the reported and eligible justified costs Costs base was netted for extraordinary costs and at the same time it was submitted to a thorough check Extraordinary costs are the costs that are not related to the standard activity performed by the regulated entity and which are not of regular nature (they are not repeated every year) or the costs that were incurred just once The values ascertained in such a manner for years 2012 and 2013 were adjusted with an escalation factor to the time value 2015 The arithmetic average of these values thus became the initial value of allowed costs for the fourth RP The regulation principle of the revenue cap is then consistently applied to these costs throughout the RP This costs base is annually adjusted with escalation factor and efficiency factor Escalation Factor The initial cost base is indexed to the following years by the escalation factor The escalation factor for the fourth RP is composed by the annual business service price index with the weight of 70 and the annual consumer price index with 1 bonus and the weight of 30 published by the Czech Statistical Office for April of the relevant year Efficiency Factor (X Factor) The efficiency factor makes companies on the energy market behave more efficiently and reduce costs over the RP At the beginning of the RP the regulator sets the value of the required efficiency which the companies are obliged to observe The ERO set this value to 3 for the fourth RP (2016-2018) and it represents the year on year decrease of the costs by 101 (according to the formula 119883=1minus sup3radic097=101 ) For the additional years of the fourth regulatory period (2019 and 2020) the same value of efficiency factor (101) has been applied
Ref C20-IRB-54-03
CEER Report on Regulatory Frameworks for European Energy Networks 2020
23156
Allowed Depreciation The allowed depreciation is determined on the basis of the planned values in individual years of the RP The planned values of the depreciation are adjusted in the year ldquoi+2rdquo based on the actual values using the time value of money Profit
The profit of the regulated entity is simplified calculated as follows
P = RAB x WACC
where RAB is the value of the regulatory asset base WACC is the rate of return Regulatory Asset Base The calculation of the regulatory asset base in the fourth RP uses for its input the planned values which are corrected (in two-year lag) based on the actual values In order to maintain continuity between the third and the fourth RP the initial level of the regulatory asset base (RAB0) was set at the planned value of the regulatory asset base for the year 2015 In the subsequent years of the RP the initial level of the regulatory asset base is increased (or decreased) by the differences between the capitalised investments and the depreciation which is adjusted with the revaluation coefficient utilised in the third RP The assets under construction are also included into RAB These assets are part of RAB under certain conditions namely the planned acquisition period of the investments is more than two years (the time of preparation is not included) and the total planned price of individual investment exceeds 500 million CZK Rate of Return (WACC) The WACC parameter (nominal pre-tax) is used for calculating profit in the Czech Republic When determining the rate of return as the key parameter for investment conditions (and decisions) in the regulated environment the ERO analysed the market environment risk rate of individual environments as well as overall economic position of similar ndash peer ndash companies in the Czech Republic and also in the other EU countries ERO set the values of the WACC parameter as fixed for the entire RP except for cases when the income tax rate of legal entities is changed ndash considering the relevant specific conditions and indicators for electricity and gas industries The rate of return is set as the uniform value for the electricity industry and the uniform value for the gas industry (ie the same rate for the DSO as well as the TSO in the given industry) Inflation Rate ndash Time Value of Money To adjust the planned values that are included into the parameters of regulation the standard cases are covered by inflation rate parameter which is derived from the index of industrial producersrsquo prices The inflation rate parameter is defined annually based on the ratio of rolling averages reported by the Czech Statistical Office in the table ldquoIndustrial Producer Price Index by Section and Subsection of CZ-CPA in the Czech Republic (ratio of rolling averages)rdquoIn the specific cases the WACC value is used as the time value of money
Ref C20-IRB-54-03
CEER Report on Regulatory Frameworks for European Energy Networks 2020
24156
25 Denmark Gas TSO Gas DSO Electricity TSO Electricity DSO
Ma
rke
t s
tru
ctu
re
Network operators
1 (Energinet) 3 (2017) 1 (Energinet) 44 (2018)
Network length
861 km (2017) ~ 18000 km (2016) 6913 km (2017) ~ 165000 km
(2016)
Ownership Independent public enterprise owned by the Danish Ministry of Climate Utilities and Energy (SOV)
Public ownership
Independent public enterprise owned
by the Danish Ministry of Climate Utilities and Energy
(SOV)
Private and local public ownership
Ge
ne
ral
fra
me
wo
rk
Authority Danish Utility Regulator (DUR)
Danish Utility Regulator (DUR)
Danish Utility Regulator (DUR)
Danish Utility Regulator (DUR)
System Strict cost plus Revenue Cap Strict cost plus Revenue Cap
Period Yearly
4 years current period 2018-2021
Yearly 5 years current
period 2018-2022
Base year for next period
Strict cost-plus regulation (ex post regulation)
4 previous years Strict cost-plus regulation (ex post regulation)
5 previous years
Transparency Strict cost-plus regulation (ex post)
Efficiency scores efficiency model
parameters WACC specific cost data
Strict cost-plus regulation ex post)
Efficiency scores efficiency model
parameters WACC specific cost data
Main elements for
determining the revenue
cap Danish TSO
regulation doesnacutet fit to this scheme For further details
see section ldquoRegulation of
transmission grid (el and gas)rdquo in the text
below
Costs in previous period
Fixed interest rates 4-year period
Danish TSO regulation does not fit this scheme For further details see
section ldquoRegulation of transmission grid (el and gas)rdquo in the
text below
The revenue cap consists of three
main components a cap on costs
allowed returns and efficiency
requirements The cap on costs are
based on an average of actual
costs in the previous regulatory period The allowed
returns are determined from the
RAB and a specified rate of
return
Legal framework
The Natural Gas Supply Act The Energinet Act Notice BEK nr816 af 27062016
The Natural Gas Supply Act
Notice BEK nr 768
23062016
The Electricity Supply Act
The Energinet Act
Notice BEK nr 816
27062016
The Electricity Supply Act
Notice BEK nr 969
27062018 and 1595 18122017
Rate
of
retu
rn
Type of WACC Danish TSO regulation does not fit to this scheme For further details
see section ldquoRegulation of
transmission grid (el and gas)rdquo in the text
below
Nominal WACC pre-tax
451 (2017)
Danish TSO regulation does not fit to this scheme For further details
see section ldquoRegulation of
transmission grid (el and gas)rdquo in the text
below
Nominal WACC pre-tax
366 (2018-2022)
Determination of the rate of
return on equity
Danish TSO regulation does not fit to this scheme For further details
Sum of a nominal risk-free rate and a
risk premium (market risk
Danish TSO regulation does not fit to this scheme For further details
Sum of a nominal risk-free rate and a
risk premium (market risk
Ref C20-IRB-54-03
CEER Report on Regulatory Frameworks for European Energy Networks 2020
25156
see section ldquoRegulation of
transmission grid (el and gas)rdquo in the text
below
premium multiplied with a beta risk
factor)
see section ldquoRegulation of
transmission grid (el and gas)rdquo in the text
below
premium multiplied with a beta risk
factor)
Rate of return on equity
before taxes
Danish TSO regulation does not fit to this scheme For further details
see section ldquoRegulation of
transmission grid (el and gas)rdquo in the text
below
900
Danish TSO regulation does not fit to this scheme For further details
see section ldquoRegulation of
transmission grid (el and gas)rdquo in the text
below
563
Use of rate of return
Danish TSO regulation does not fit to this scheme For further details
see section ldquoRegulation of
transmission grid (el and gas)rdquo in the text
below
A risk-free interest rate calculated as an average of the last three months
available daily observations of four-year zero
coupon rates for Danish government
bonds
Danish TSO regulation does not fit to this scheme For further details
see section ldquoRegulation of
transmission grid (el and gas)rdquo in the text
below
A risk-free interest rate calculated as an average of the last three months
available daily observations of ten-year zero coupon rates for Danish
government bonds
Reg
ula
tory
as
se
t b
ase
Components of RAB
Danish TSO regulation doesnacutet fit to this scheme For further details
see section ldquoRegulation of
transmission grid (el and gas)rdquo in the text
below
Fixed assets working capital
assets under construction and
historical debt
Danish TSO regulation doesnacutet fit to this scheme For further details
see section ldquoRegulation of
transmission grid (el and gas)rdquo in the text
below
All assets related to licensed activity of a
DSO working capital and assets under construction
Regulatory asset value
Danish TSO regulation doesnacutet fit to this scheme For further details
see section ldquoRegulation of
transmission grid (el and gas)rdquo in the text
below
Historical costs included return on
capital
Danish TSO regulation doesnacutet fit to this scheme For further details
see section ldquoRegulation of
transmission grid (el and gas)rdquo in the text
below
Historical costs included return on
capital
RAB adjustments
Danish TSO regulation does not fit to this scheme For further details
see section ldquoRegulation of
transmission grid (el and gas)rdquo in the text
below
Investments in new assets after the
base year led to an adjustment of the
CAPEX
Danish TSO regulation does not fit to this scheme For further details
see section ldquoRegulation of
transmission grid (el and gas)rdquo in the
text below
Adjusted for non-controllable costs
Dep
rec
iati
on
s
Method Straight line Straight line Straight line Straight line
Depreciation ratio
Dependent on asset type
Dependent on asset type
Dependent on asset type
Dependent on asset type
Consideration Danish TSO regulation does not fit to this scheme For further details
see section ldquoRegulation of
transmission grid (el and gas)rdquo in the text
below
-
Danish TSO regulation does not fit to this scheme For further details
see section ldquoRegulation of
transmission grid (el and gas)rdquo in the text
below
-
Ref C20-IRB-54-03
CEER Report on Regulatory Frameworks for European Energy Networks 2020
26156
Introduction The Danish Utility Regulator (DUR) is independent of the government The tasks of DUR are stipulated in the supply acts for electricity natural gas and district heating Regulation of Electricity Grid Companies Danish electricity grid companies are natural monopolies As the distribution of electricity is a monopolistic activity the grid companies generally do not have the same incentives for financial efficiency as enterprises on a free competitive market The grid companies are therefore subject to financial regulation managed by DUR The regulation aims at reflecting the pressure on efficiency faced by enterprises subject to competition on the free market The financial regulation primarily consists of two mechanisms revenue caps and benchmarks Revenue caps set a ceiling on the operating revenues of grid companies The revenue caps for DSOs are set for a five-year regulatory period The first regulatory period runs from 2018 until 2022 The revenue caps consist of three main components a cap on costs allowed returns and efficiency requirements The cap on costs are based on an average of actual costs in the previous regulatory period The allowed returns are determined from the RAB and a specified rate of return Throughout a regulatory period the revenue caps are adjusted for changes in the price levels (inflation) and the specific activity level of a given DSO The efficiency requirements are related to the overall productivity changes in the Danish economy and individual performance calculated from benchmarking Benchmarking aims at ensuring that consumers do not pay more for the services of the grid companies than they would have done if the companies were subject to competition If the actual costs of a grid company are too high efficiency improvement requirements will be imposed on the company by DUR The RAB which is used to calculate the allowed returns and is divided into two parts a forward-looking asset base and a historical asset base Each asset base is coupled with its own rate of return and the WACC is only used as the rate of return on the forward-looking asset base The forward-looking asset base consists of regulatory assets invested from 1 January 2018 and forward The rate of return on the historical asset base is a continuation of the previous definition of allowed rate of return which is not comparable to the WACC definitions and methods Regulation of Gas Distribution Companies Grid companies are not subject to competition and therefore DUR regulations aim at encouraging these companies to be more efficient by lowering the cap on their revenues The revenue cap is made up by i) operating costs (decided activity level) ii) operating costs (imposed by external factors) iii) historic debt locked (remaining from 2004 balance) iv) asset base and v) costs to promote and realise reductions in energy consumption DUR sets efficiency demands on i) operating costs based on a benchmark between the DSOs to ensure external pressure to lower costs continuously Furthermore DUR sets a cap on i) operating costs based on historic cost levels and DSOs can achieve efficiency gains by realising operating costs that are lower this level of historic costs adjusted for efficiency demands The revenue cap is adjusted to actual level of ii) operating costs
Ref C20-IRB-54-03
CEER Report on Regulatory Frameworks for European Energy Networks 2020
27156
Before entering a regulation period DUR sets a level of interest rate for the iv) asset base using a WACC framework and a CAPM methodology The level of interest is fixed during the regulation period but the asset base can vary The revenue cap is adjusted by iv) actual costs to realise reductions in energy consumption Regulation of Transmission Grid (Electricity and Gas) Energinet is the TSO for both electricity and gas in Denmark The special provisions for Energinet were established by law on Energinet and executive order on economic regulation of Energinet Energinet is ex-post regulated in accordance with a ldquonon-profitrdquo principle whereby the companys tariffs may only cover the necessary costs incurred in efficient operation and an interest rate to ensure the real value of the companys capital base on 1 January 2005 (strict cost-plus regulation) Energinetrsquos capital base on 1 January 2005 was 3157 million DKK In 2016 the return of capital was 21 million DKK (07) The economic regulation of Energinet does not allow explicit efficiency requirements for Energinet However DUR may determine that a specific cost ndash or the amount thereof ndash does not constitute a necessary cost at efficient operation and therefore may not be included (or only partially included) in Energinetrsquos tariffs DUR and Energinet have participated in two European benchmarks of electricity TSOs the latest being in 2013 and also in the first European benchmark of gas TSOs which was concluded in 2016 The benchmarks play a role as background for DURrsquos economic regulation and assessment of Energinet DUR distributed the results of the benchmark analyses to the Minister of Energy Utilities and Climate in the ministryrsquos capacity as owner of the Energinet In its utility strategy (Regeringens forsyningsstrategi) in September 2016 the government presented its comprehensive utility strategy for Danish households and companies One of the proposals was a new incentive-based financial regulation of Energinet
Ref C20-IRB-54-03
CEER Report on Regulatory Frameworks for European Energy Networks 2020
28156
26 Estonia Gas TSO Gas DSO Electricity TSO Electricity DSO
Ma
rke
t
str
uc
ture
Network operators
1 23 1 33
Network length
885 km 2134 km 5202 km 65700 km
Ownership State owned Private investors State owned
State owned and private investors
Ge
ne
ral
fra
me
wo
rk
Authority Konkurentsiamet wwwkonkurentsiametee
System Rate-of-Return
Period There is no period There is no period
Base year for next period
na
Transparency specific cost data
Main elements for
determining the revenue
cap
1) Variable costs 2) Operating costs 3) Depreciation of RAB 4) Justified return of RAB
Legal framework
Natural Gas Act Electricity Market Act
Rate
of
retu
rn
Type of WACC Pre-tax WACC nominal
Determination of the rate of
return on equity
1) Germany 10 years average bonds yield 2) Estonian risk premium 3) McKinsey market risk premium 4) Beta
Rate of return on equity
before taxes
584 (141+079+ (07285))
592 (141+079+ (07445))
565 (141+079+(06905
))
573 (141+079+ (07065))
Use of rate of return
458 460 451 461
Reg
ula
tory
as
se
t b
ase Components
of RAB Fixed assets working capital leased assets
Regulatory asset value
Historical costs
RAB adjustments
The fixed assets do not include 1) long-term financial investments 2) intangible assets except for software licenses 3) fixed assets acquired with grant aid (including targeted funding) 4) fixed assets acquired with funds obtained from connection fees 5) fixed assets which the undertaking is not used for the purpose of providing network service
Dep
rec
iati
on
s
Method For depreciation of fixed assets we use a regulatory capital expenditure method which differs from accounting depreciation In the regulatory capital expenditure accounting a
principle is used in which from a certain moment in time fixed assets are divided into two parts the old ones and the new investments All assets acquired before the limit year are
considered old ones and for them an accelerated rate of depreciation is applied
Depreciation ratio
Depending on asset type For new assets (after year 2003) 286-333 from investment cost and for old assets (before year 2003) 714 from residual value
Consideration Present regulation started at 2003 legal framework
Ref C20-IRB-54-03
CEER Report on Regulatory Frameworks for European Energy Networks 2020
29156
Introduction The Estonian Competition Authority (ECA) establishes network charges for network operators The laws provide uniform price regulation for all network operators regardless of their size The ECA has prepared uniform methods for the calculation of network charges based on the WACC The methods are applied similarly and uniformly in analysing the activities and monitoring the prices of all the undertakings under the ECArsquos supervision in compliance with the principle of equal treatment and proportionality Variable Cost Variable costs are costs that vary in line with changes in the sales volume ie are directly dependent on the sales volume The following variable costs shall be included in network charges the costs of outsourced transmission andor distribution network services and the costs of electricity purchased for covering network losses ECA shall use the following methods to analyse network losses monitoring of the dynamics of network losses in time comparison of statistical indicators with other network operators analysis of technical indicators (eg length of lines number of substations etc) and analysis of the impact of investments on network losses The cost of the network electricity losses is the product of the forecast amount of network loss and the price The forecast price of the electricity purchased for covering network losses shall be justified and cost-effective An analysis of the justification of the price shall be based on the weighted average price determined on the basis of the price applicable in the Nord Pool Spot Estonian price region and the size of network losses in the 12 calendar months preceding the submission of the request plus justified costs necessary for purchasing electricity The weighted average price is calculated on the basis of the one-day forward hourly price in the electricity market during the aforementioned period and the network operatorrsquos amount of energy lost in the respective hour If the amount of electricity purchased for compensating network losses is below 5000 MWh a year the electricity price may be forecast on the basis of the electricity supply agreement In such a case the justification of the price as well as the conformity of the price with the market price shall be analysed and the organisation of a tender shall be expected In the case of a transmission network operator specific income and expenses are taken into account including the income and expenses of the transit flow compensation mechanism between transmission network operators (ITC) countertrade costs transmission capacity auction income etc Operating Cost Operating costs are all the justified costs necessary for the provision of network services which are not variable costs or capital expenditure Operating costs are divided into controlled operating costs and non-controlled operating costs The following justified costs are generally considered as operating costs the costs of maintenance and repairs performed by the network operator the costs of outsourced works and services transport costs information technology and communication costs labour expenses (including taxes) the state fee payable for the activity licence for providing network services fees for tolerating technical networks or structures other costs which must be listed and justified in the request ECA shall use the following methods to analyse operating costs monitoring of the dynamics of operating costs in time by quantity and as a special cost in regard to the sales volume comparison of statistical indicators with similar network operators performance of an in-depth analysis of the components of operating costs (using expert evaluations if necessary) and analysis of the impact of investments on operating costs Monitoring the dynamics of costs in time means a change in the operating costs of a network operator across the years in general
Ref C20-IRB-54-03
CEER Report on Regulatory Frameworks for European Energy Networks 2020
30156
it must not grow more than the CPI An in-depth analysis shall include a detailed distribution of operating costs between different activities The detailed distribution of operating costs shall include data across the three calendar years preceding the submission of the request The network operator shall justify the incurrence variation and cost-efficiency of the costs presented in the in-depth analysis The dynamics of the special costs of various cost types may be compared in conducting an in-depth analysis Upon comparing the costs of a network operator and the statistical indicators determined on the basis thereof with the costs of other similar network operators the special costs under the operating costs of similar network operators shall be compared (total operating costs per sales amount) If necessary ECA may also analyse the cost types and the special costs of similar network operators (eg the labour expenses of network operators per sales amount) Upon approval and verification of network charges ECA shall not accept the following cost items the cost of doubtful receivables costs related to ancillary activities costs arising from changes in the value of assets (change in the balance of inventories write-downs of current assets etc) penalties and fines for delays imposed on the network operator pursuant to law (fines for administrative violations penalty payments compensation for damages etc) costs not related to business activities (sponsorship gifts donations etc) other unjustified costs identified in the process of an economic analysis Regulated Assets and Capital Expenditure Determining the value of regulated assets (the fixed assets necessary for the provision of network services) is necessary for calculating capital expenditure and justified profitability The ECA shall analyse the justification of both made and forecast investments for the basis for accounting for regulated assets For the purpose of verifying the justification of investments
bull The Transmission System Operator shall submit a detailed five-year investment plan and a prospective ten-year investment plan The investment plan shall include the cost and justification of the investments the economy and cost-efficiency to be achieved and the criteria for improving the security of supply and quality
bull A Distribution System Operator (DSO) with more than 100000 consumers shall submit the same data as the Transmission System Operator and
bull A DSO with fewer than 100000 consumers shall submit a detailed five-year investment plan and a prospective ten-year investment plan upon the ECArsquos request
The ECA shall not accept the following costs incurred on fixed assets as regulated assets and capital expenditure long-term financial investments fixed assets acquired using connection charges paid by consumers fixed assets acquired using non-refundable aid (eg EU external aid programmes) intangible assets (excluding computer software licences and rights of use pertaining to land related to technical structures) fixed assets related to ancillary activities costs arising from changes in the value of assets (impairment of the value of fixed assets losses from sales and liquidations of property plant and equipment and intangible assets etc) assets which the network operator is not actually using for the provision of network services Capital expenditure is calculated on the basis of the value of the fixed assets (regulated assets) necessary for the provision of network services and the capital expenditure rate The capital expenditure rate is the reciprocal value of the useful technical life of the asset Individual assets may have different useful lives and therefore different capital expenditure rates Upon justifying the useful life of an asset the ECA shall verify the following - The expected period of use of the asset - The expected physical wear and tear of the asset and - The technical or moral obsolescence of the asset
Ref C20-IRB-54-03
CEER Report on Regulatory Frameworks for European Energy Networks 2020
31156
The accounting of regulated assets and capital expenditure shall be consistent and shall also continue in the event of changes in the ownership of the undertaking or the asset The calculation of the net assets underlying the network fees is as follows 1) Depreciation on fixed assets is calculated using the straight-line depreciation method 2) Depreciation rates for fixed assets are not justified if they differ substantially from the
depreciation rates set for similar life same uses and similar fixed assets or if the entity does not calculate the depreciation based on the useful (technical) life of the fixed assets
3) Depreciation is calculated based on the acquisition cost In this case deprecation of fixed assets to be included in the net fees is based on deprecation rate(s) set for assets acquired and
4) If necessary differentiation of fixed assets can be used using different depreciation rates of fixed assets
The working capital shall be calculated on the basis of 5 of the allowed revenue of the tariff year If necessary a more detailed working capital analysis may be performed The internal turnover of undertakings belonging to a vertically integrated group shall not be included in working capital accounts If necessary an additional working capital analysis shall be performed Justified Profitability The justified profitability to be included in the price shall be calculated on the basis of the fixed assets (both tangible and intangible assets) necessary for the provision of network services
Justified profitability (JP) is determined as the product of the regulated assets (RA) and the
WACC
The WACC is calculated using a capital structure of which 50 is debt capital and 50 equity and the same proportion shall also be taken as the basis in the case of all other regulated undertakings providing a similar service (ie a vital service provided by a dominating undertaking in the market eg electricity gas district heating water supply)
The risk-free rate of return is the average interest rate of German ten-year bonds in the preceding ten years plus Estoniarsquos state risk premium If Estonian government bonds exist the interest rate of the government bonds may be used as the risk-free rate of return As Estonia does not have long-term government bonds that are traded on the secondary market it is not possible to give a direct quantitative assessment on Estoniarsquos state risk This can only be done indirectly by comparing Estonia with countries that have issued state bonds The Ministry of Finance has recommended that the ECA take into account the average return on ten-year bonds of European countries with a credit rating similar to the one given to Estonia by rating agencies (SampPMoodyrsquosFitch) and use this to assess the return on Estoniarsquos long-term government bonds
The cost of debt is the sum of the risk-free rate of return (plus Estonia`s state risk premium) and the debt risk premium of the undertaking The cost of equity is calculated using the CAPM (capital assets pricing model) model (Ce = Rf + Rc + szlig x Rm) The value of the beta coefficient is determined on the basis of the relevant indicators of other European andor US regulated undertakings The market risk premium is determined on the basis of the long-term market risk premium of other European andor US undertakings
Ref C20-IRB-54-03
CEER Report on Regulatory Frameworks for European Energy Networks 2020
32156
Usually2 the ECA calculates WACC annually and publishes it on its website at wwwkonkurentsiametee
2 The period 2016-2019 was an exception because the German ten-year bonds in the preceding five years
decreased Therefore from 2020 the ECA introduced the German ten-year bonds in the preceding ten years
Ref C20-IRB-54-03
CEER Report on Regulatory Frameworks for European Energy Networks 2020
33156
27 Finland Gas TSO Gas DSO Electricity TSO Electricity DSO
Ma
rke
t
str
uc
ture
Network operators
1 19 1 77
Network length
~1200 km ~2000 km ~14500 km ~400000 km
Ownership State owned
State local public and private ownership
State and private ownership
State local public and private ownership
Ge
ne
ral
fra
me
wo
rk
Authority Energy Authority
System Revenue Cap
Period Current regulatory framework is set for 2 regulatory periods (2016-2019 and 2020-2023)
Base year for next period
No specific base year applied3
Transparency Decisions Regulatory Data Efficiency Scores Quality of networks
Main elements for
determining the revenue
cap
Efficiency- Quality- Innovation- and
Investment incentive WACC
return on RAB
Innovation- and Investment
incentive WACC return on RAB
Efficiency- Quality- Innovation- and
Investment incentive WACC
return on RAB
Efficiency- Quality- Security of supply-
Innovation- and Investment
incentive WACC return on RAB
Legal framework
Electricity market Act (5882013) Natural gas market Act (5872017) and Act on the supervision of the electricity and natural gas market (5902013)
Rate
of
retu
rn
Type of WACC Nominal pre-tax
Determination of the rate of
return on equity
Risk-free rate + betaMarket risk premium + Premium for lack of liquidity (+ additional risk premium for natural gas TSO and DSOs)
Rate of return on equity
before taxes
900 = (145+0695+06+
17) (1-02)
850 = (145+0695+06+
13) (1-02)
706 = (145+0725+06)
(1-02)
774 = (145+08285+06)
(1-02)
Use of rate of return
Reasonable return is calculated by multiplying the adjusted capital invested in network operations by the reasonable rate of return Therefore company receives reasonable
return on adjusted equity and interest-bearing debt invested in network operations
Reg
ula
tory
as
se
t b
as
e Components
of RAB Fixed assets working capital leased assets
Regulatory asset value
Regulatory asset value is calculated from network replacement value by applying network component-specific average age and lifetime selection
RAB adjustments
Book values taken to RAB annually from balance sheet
Dep
rec
iati
on
s Method Straight-line depreciation on replacement value of network Depreciation is inflation
corrected annually with CPI
Depreciation
ratio4 16 22 18 25
Consideration Depreciation level based on average adjusted straight line based on the selected component lifetimes Imputed straight-line depreciations are always allowed in full as far
as the component is in actual use
3 For electricity DSOs the average of regulatory data from years the 2015 ndash 2018 is used to determine the efficiency
incentive for the fifth regulatory period (2020 ndash 2023) The DSOsrsquo efficiency figure for fifth regulatory period was determined by the average of reasonable controllable operational costs (SKOPEX) and the average of realised controllable operational costs (KOPEX) from years 2015 ndash 2018 The efficiency frontier determining the individual DSOs SKOPEX was estimated by using regulatory data from years 2012 ndash 2018 For the electricity TSO and natural gas TSO the efficiency reference level (SKOPEX) is based merely on operators own historical costs In the first year of the regulatory period the average of the previous four-year regulatory period realised controllable operational costs is used as the benchmark for efficiency costs In the following years the benchmark will be the reasonable controllable costs of the previous year
4 Calculated Depreciation Replacement value of network
Ref C20-IRB-54-03
CEER Report on Regulatory Frameworks for European Energy Networks 2020
34156
Introduction In the Finnish energy sector the regulatory task is performed by the Energy Authority as an independent regulatory authority The responsibilities of the TSOs and DSOs are set by the Finnish Electricity Market Act and Natural Gas Market Act Guidelines for the regulatory procedures applied by the Energy Authority are provided by the Act on the supervision of the electricity and natural gas market The main objectives of regulation are the reasonableness of pricing and high quality of network services Therefore the Energy Authority seeks these with the entity formed by regulation methods specific incentives and with practical steering impacts of the methods on the network operatorrsquos business operations In addition to the main targets of regulation other key targets include equality and network development as well as the sustainability continuity development and efficiency of business operations Historical Development Until 2005 the Energy Authorityrsquos regulation methodology was ex-post regulation based on case-specific assessment Since 2005 determining reasonableness of the network operation prices has been based on ex-ante set regulation method with pre-defined regulatory periods Under this regime the allowed revenues are set for network operators before the start of the regulatory period The current regulatory period is four years but the methods are valid for two consecutive regulatory periods since the Electricity Market Act changed in 2013 Determining the Revenue Caps The Energy Authority does not regulate the actual charges and tariffs as TSOs and DSOs set them independently The regulation of the electricity grid and natural gas network services are based on the assessment of the reasonableness of the pricing in network services as a whole The method decisions are published before the start of the upcoming regulatory period and these method decisions determine how the allowed or target revenues are set for the period The supervision of the reasonableness of the pricing is direct to the accumulating entity comprised by different network service fees Regulatory methods consider capital invested in network operations and reasonable rate of return (WACC-) to it which constitute the reasonable return for a network operator In turn as a comparison to reasonable return is considered the realised adjusted profit from network operations which includes the effect of incentives The impact of incentives is deducted when calculating realised adjusted profits The incentive elements that are applied in regulatory methods varies between TSOs and DSOs and the set of incentives used are a quality incentive an efficiency incentive an innovation incentive a security of supply incentive and an investment incentive The Energy Authority monitors operatorsacute profits for the regulatory period and whether they exceed determined reasonable level If pricing exceeds the determined reasonable level the surplus will have to be returned to customers in the next regulatory periodrsquos pricing Efficiency Benchmarking Efficiency means that the service required by the customer is provided at the lowest cost possible The operation of a network operator is cost-effective when the input or costs used in its operations are as small as possible in relation to the output of operations The pricing of network operations is not subject to market pressure therefore the operator has no incentive to improve the efficiency of its operations In such a case without regulation any cost ineffectiveness could be compensated with higher prices The purpose of the efficiency incentive is therefore to encourage network operators to operate in a cost-effective way and to achieve a cost level that is achievable The Energy Authority applies efficiency incentives to the electricity TSO the natural gas TSO and the electricity DSOs Natural gas DSOs are not subject to efficiency incentives
Ref C20-IRB-54-03
CEER Report on Regulatory Frameworks for European Energy Networks 2020
35156
In the calculation of efficiency improvement potential the network operatorsrsquo realised controllable operational costs (KOPEX) is benchmarked with operatorsrsquo reasonable controllable operative costs (SKOPEX) For the electricity TSO and the natural gas TSO the efficiency reference level (SKOPEX) is based merely on operatorsrsquo own historical costs In the first year of the regulatory period the average of the previous four-year regulatory period realised controllable operational costs is used as the benchmark for efficiency costs In the following years the benchmark will be the reasonable controllable costs of the previous year With electricity DSOs the company-specific efficiency target is also observed by comparing individual DSOsrsquo KOPEX to DSOsrsquo SKOPEX DSOsrsquo reasonable controllable operational costs at an output level according to efficient operations are determined by using the efficiency frontier The efficiency frontier is estimated from combined cost and output data from all DSOs The variables included in the measurement of company-specific efficiency target consists of the input variables (KOPEX and replacement value of network) output variables (volume of transmitted energy number of metering points total length of the electricity network and regulatory outage costs) and operating environment variables (connectionsmetering points -ratio) In calculation of KOPEX and SKOPEX for the fourth regulatory period (2016 ndash 2019) the average of regulatory data for 2011 ndash 2014 was used and for the fifth regulatory period (2020 ndash 2023) the average of regulatory data for 2015 ndash 2018 The efficiency frontier was estimated for the fourth regulatory period by using regulatory data from 2008 ndash 2014 as the initial data for company specific efficiency measurement variables and these were adjusted with regard to the consumer price index to the 2014 level The efficiency frontier was re-estimated for the fifth regulatory period (2020 ndash 2023) in 2019 using regulatory data from 2012 ndash 2018 For electricity DSOs efficiency benchmarking has used the StoNED-method (Stochastic Non-Smooth Envelopment of Data) since 2012 In 2015 a method was developed further to its current form for regulatory periods 2016 ndash 2019 and 2020 ndash 2023 Quality Incentive The Energy Authority uses regulatory outage costs as a quality incentive Regulatory outage costs ie the disadvantage caused by outages are calculated based on the number and duration of outages as well as the unit prices of outages which are determined The DSOrsquos average realised regulatory outage costs for the two previous regulatory periods ie eight years are used as the reference level of regulatory outage costs The reference level is adjusted with the annual energy transmitted to the customers to make the reference level of regulatory outage costs comparable with the realised regulatory costs with respect to the transmitted energy The impact of the quality incentive is deducted when calculating realised adjusted profit The impact of the quality incentive is calculated so that the realised regulatory outage costs are deducted from the reference level of regulatory outage costs The maximum impact of the quality incentive in the calculation of realised adjusted profit is made reasonable The impact of the quality incentive may not be higher than 15 of the reasonable return in the year in question for electricity DSOs 3 for the electricity TSO and 2 for the gas TSO Natural gas DSOs are not subject to the quality incentive Innovation Incentive The purpose of the innovation incentive is to encourage the network operators to develop and use innovative technical and operational solutions in their network operations The key objectives of research and development activities are the development and introduction of smart grids and other new technologies and methods of operation As a result the network operator may incur research and development costs before the new technologies are in full
Ref C20-IRB-54-03
CEER Report on Regulatory Frameworks for European Energy Networks 2020
36156
use and utilisable The Energy Authority encourages the network operators to make active efforts in research and development by deducting reasonable research and development costs in the calculation of realised adjusted profit Acceptable research and development costs must be recorded in the unbundled profit and loss account as expenses as capitalised RampD costs are not accepted for inclusion in the calculation of the innovation incentive Acceptable research and development costs must be directly related to the creation of new knowledge technology products or methods of operation in network operations for the sector The impact of the innovation incentive is deducted when calculating realised adjusted profit The impact of the innovation incentive is calculated so that a share corresponding to a maximum of 1 of the DSOrsquos total turnover from network operations in the unbundled profit and loss accounts in the regulatory period are treated as reasonable research and development costs This incentive is applied to all network operators Investment Incentive The purpose of the investment incentive is to encourage DSOs and TSOs to make investments in a cost-effective manner and to enable replacement investments The investment incentive consists of the incentive impact of unit prices and the straight-line depreciation calculated from the adjusted replacement value The incentive impact of unit prices directs the network operators to invest more effectively than on average and to find more cost-effective methods of implementation than before The incentive impact arises from the difference between investments calculated with unit prices and the cost of realised investments Together with the net present value the incentive impact of the straight-line depreciation calculated from the network operatorrsquos adjusted replacement value directs the operator to maintain its network in accordance with the lifetimes it has selected in actual use as part of the network assets and enables the making of sufficient replacement investments The incentive impact arises from the fact that the methods allow for the operator an annual depreciation level based on average adjusted straight-line depreciation based on the lifetimes selected by the operator Imputed straight-line depreciations are always allowed in full as far as the component is in actual use Therefore imputed straight-line depreciation is calculated for the component even after the end of the lifetime if the component is still in actual use The impact of the investment incentive is deducted when calculating realised adjusted profit and this incentive is applied to all DSOs and TSOs Security of Supply Incentive With the new Electricity Market Act which entered into force in 2013 criteria for security of supply were set through a maximum duration of outage for electricity DSOs In order to implement the new security of supply obligations most of the electricity DSOs need to make extensive replacement investments and carry out maintenance For this reason the security of supply incentive was introduced into the methods for the fourth and fifth regulatory periods for the years 2016 ndash 2023 The write-downs of the security of supply incentive compensate for the demolition made regarding replacement investments which has been compulsory due to the security of supply criteria The write-downs of the security of supply incentive consider justifiable early replacement investments made in order to meet the security of supply criteria in so far as the investment incentive does not take them into account In other words the write-down of the security of supply incentive only compensates the potentially lost part of imputed straight-line depreciation which the DSO has not been able to predict when selecting the average lifetime for the fourth regulatory period
Ref C20-IRB-54-03
CEER Report on Regulatory Frameworks for European Energy Networks 2020
37156
The impact of the security of supply incentive is calculated by adding together the write-downs of the NPV residual value resulting from early replacement investments carried out to improve the security of supply and the reasonable costs of maintenance and contingency measures The security of supply incentive is only applied to electricity distribution system operators The minimum requirements of the security of supply set in the Electricity Market Act in 2013 and the transition to updated regulation methods in 2016 led to large tariff increases by a few large DSOs in Finland in 2016 In the aftermath of an extensive public debate the Energy Authority suggested amendments to the legislation and in 2017 the Electricity Market Act was changed in a way such that the DSOs are allowed to increase electricity transmission and distribution charges up to 15 compared to the charges collected during the 12 months prior to the increase Transparency The Energy Authority publishes regulatory methods decisions expert reports efficiency targets and the data used in the efficiency estimation on the Authorityrsquos website The Energy Authority also publishes the annually updated parameters regarding to the calculation of the reasonable pricing The Energy Authority has also prepared an Excel workbook for electricity DSOs to assess the reasonable return for the regulatory period and to evaluate the realised adjusted profit Outlook Although the current methodology is set out for two regulatory periods years 2016 to 2023 the Energy Authority strives to develop methodology in accordance with changing market conditions For example Energy Authority has ordered a survey about international regulatory methods supporting demand response
Ref C20-IRB-54-03
CEER Report on Regulatory Frameworks for European Energy Networks 2020
38156
28 France Gas TSO Gas DSO Electricity TSO Electricity DSO
Ma
rke
t
str
uc
ture
Network operators
2 26 1 ~143
Network length
~38000 km ~200000 km ~106000 km ~1400000 km
Ownership Private and public
ownership
Private and public ownership (indirect
and local)
Mainly public ownership (direct
and indirect)
Mainly indirect public ownership
Ge
ne
ral
fra
me
wo
rk
Authority Commission de Reacutegulation de lrsquoEnergie (CRE)
System Incentive Regulation Revenue cap
Period 4 years current period 2020-2024
4 years current period 2020-2024
4 years current period 2017-2021
Base year for next period
2nd year in current regulatory period
3rd year in current regulatory period
2nd year in current regulatory period
Transparency Cost data (detailed OPEX and CAPEX) WACC and its underlying parameters quality of service scores regulatory accounts
Main elements for
determining the revenue
cap
Non-controllable and controllable costs depreciation costs taxes and fair margin
Legal framework
French law (code de lrsquoeacutenergie) and CRE tariff decisions
Rate
of
retu
rn
Type of WACC Pre-tax real Pre-tax nominal NA
Determination of the rate of
return on equity
Sum of a nominal risk-free rate and a risk premium (market risk premium multiplied
by a beta risk factor) multiplied with a corporate tax factor and expressed in real
terms
Sum of a nominal risk-free rate and a
risk premium (market risk
premium multiplied by a beta risk
factor) multiplied with a corporate tax
factor
NA
Rate of return on equity
before taxes
86 = (17+52086)
(1-2802)
84 = (17+52083)
(1-2802)
97 = (27+50073)
(1-3443) NA
Use of rate of return
Multiplied with the whole RAB (except assets that were funded through subsidies or grants)
NA
Reg
ula
tory
as
se
t b
as
e Components
of RAB Fixed assets
Regulatory asset value
Historical revaluated costs (taking into account inflation and depreciation)
Net book value
RAB adjustments
Subsidies and grants are removed from the value of assets before entering the RAB
Dep
re-
cia
tio
ns Method Straight line
Depreciation ratio
Depending on asset type Ratio between 2 and 4 for network assets (lines pipes etc)
Consideration Integrated directly and with 100 (except assets that were funded through subsidies or grants)
due to the specificities of electricity distribution in France assets are not remunerated via a WACC
Ref C20-IRB-54-03
CEER Report on Regulatory Frameworks for European Energy Networks 2020
39156
Introduction In France the Commission de Reacutegulation de lrsquoEacutenergie (CRE) is the independent authority responsible for the regulation of electricity and gas markets CRE is in charge of setting up access rules and tariffs for the utilisation of electricity and gas grids It is also responsible for approving investments in upstream electricity and gas infrastructure (electricity and gas transmission gas storage and LNG terminals) In electricity there is a single Transmission System Operator (TSO) RTE which operates maintains and develops the high and very high voltage network With more than 100000 km of lines between 63000 and 400000 volts the network managed by RTE is the largest in Europe There are 143 electricity Distribution System Operators (DSOs) in France of various sizes Distribution is dominated by Enedis which operates 95 of the electricity distribution network representing 14 million km of lines and 35 million customers Six other DSOs serve more than 100000 customers (Geacutereacutedis SRD SER GEG URM and EDF SEI) and the remaining DSOs are local companies that serve less than 100000 customers In the gas sector there are two TSOs GRTgaz and Tereacutega (formerly TIGF) GRTgaz operates a pipeline network of approximately 32000 km Tereacutega operates a network of about 5000 km in South-West France Since 1 November 2018 with the implementation of Francersquos single market area there is only one market area but still two balancing zones one for each TSO who are each responsible for the balancing of its own area of operation On the distribution side there are 26 natural gas DSOs supplying about 115 million consumers GRDF is the main one with more than 96 of the market volume Reacutegaz-Bordeaux and Reacuteseau GDS each distribute to about 15 of the market while the 23 other DSOs represent less 1 of distribution in total TSO Certification and DSO Independence On 26 January 2012 CRE certified all the French TSOs under the Independent Transmission Operator (ITO) model Revisions were carried out for RTE and Tereacutega after changes in their shareholding RTErsquos certification was renewed by a decision on the 11 January 2018 Initially certified as an ITO Tereacutegarsquos status was changed in ownership unbundling (OU) on 3 July 2014 after a modification of the shareholding structure of the TSO Regarding DSOs CRE ensures they are effectively independent of their parent company For instance there must be clearly differentiation between companies engaged in the supply or production of gas or electricity within the vertically integrated company (Enterprise Verticallement Inteacutegreacutee or EVI) to which they belong This verification is based on internal organisation and governance rules operating autonomy and implementation of a compliance officer in charge of independence obligations and compliance with the code of good conduct Electricity Transmission and Distribution Tariffs In electricity the current transmission and distribution tariffs for RTE (TURPE-5 HTB) and Enedis (TURPE-5 HTA-BT) entered into force on 1 August 2017 for a period of approximately four years (in accordance with the CREs deliberations of 17 November 2016) During the elaboration process CRE conducted in-depth analyses of the projected expenses of French operators of practices in other European countries and on the evaluation of the WACC of electricity and natural gas infrastructure in France Operating expenditures and their comparison with those of other European network managers were also examined At the end of the process CRE largely kept the previous tariff structure while introducing some improvements regarding incentives relating to capital expenditures quality of service and losses
Ref C20-IRB-54-03
CEER Report on Regulatory Frameworks for European Energy Networks 2020
40156
Regarding distribution the tariff is equalised therefore the same applies for all DSOs Charges are calculated based on an average distribution cost plus a management fee and determined according to the level of voltage on which consumers are connected A specific device to ensure that the network operators have the necessary resources to meet the costs of research and development as well as deployment of smart grids has been introduced while encouraging operators to be efficient Gas Transmission Tariffs The tariff for the use of the GRTgaz and Tereacutega natural gas transmission networks is known as the ldquoATRTrdquo The current regulatory period (ATRT-7) entered into force on 1 April 2020 for a period of approximately four years It took into consideration the (EU) regulation 2017460 establishing a network code on harmonised transmission tariff structures for gas (ldquoTariff network coderdquo) and was adopted after extensive stakeholder consultation conducted in 2019 and relies on several studies which were published The ATRT7 tariff aims at giving gas TSOs the capacity to meet the challenges of the energy transition particularly with the development of bio-methane injection into the networks It also provides the capacity to take into account the changes in the gas market in the coming years especially to control the evolution of tariffs in a context marked by the expiration of certain long-term contracts and the end of major investment projects Gas Distribution Tariffs The sixth tariff period for the use of GRDFs natural gas distribution networks known as the ATRD-6 tariff entered into force on 1 July 2020 for a period of about four years As the previous tariff it encourages GRDF to improve its efficiency especially in a context of a drop in gas consumption while maintaining the gas distribution network at a maximum-security level It also aims at providing GRDF with the capacity to adapt to the energy transition in particular regarding the development of smart metering the injection of bio-methane and research and development activities The ATRD-6 tariff also includes the estimated expenses related to the ldquogas conversionrdquo project (converting the L gas zone to an H gas zone)
Ref C20-IRB-54-03
CEER Report on Regulatory Frameworks for European Energy Networks 2020
41156
29 Germany Gas TSO Gas DSO Electricity TSO Electricity DSO
Ma
rke
t
str
uc
ture
Network operators
16 ~700 4 ~880
Network length
~40000 km ~500000 km ~37000 km ~1800000 km
Ownership Mainly private investors indirect public ownership
Private and local public ownership
Mainly private investors indirect public ownership
Private and local public ownership
Ge
ne
ral
fra
me
wo
rk
Authority
Bundesnetzagentur
(wwwbundesnetzagenturde)
Bundesnetzagentur and federal state
authorities depending on size and network area
Bundesnetzagentur
(wwwbundesnetzagenturde)
Bundesnetzagentur and federal state
authorities depending on size and network area
System Incentive Regulation Revenue cap
Period 5 years current period 2018-2022 5 years current period 2019-2023
Base year for next period
3rd year in current regulatory period
Transparency Efficiency scores revenue caps
Main elements for
determining the revenue
cap
Non-controllable and controllable costs TOTEX
efficiency benchmark general
inflation and sectoral productivity factor volatile costs
Non-controllable and controllable costs TOTEX
efficiency benchmark
efficiency bonus general inflation and sectoral productivity factor volatile costs
Non-controllable and controllable costs TOTEX
efficiency benchmark general
inflation and sectoral productivity factor volatile costs
Non-controllable and controllable costs TOTEX
efficiency benchmark
efficiency bonus general inflation and sectoral productivity
factor quality element volatile
costs
Legal framework
EnWG ARegV GasNEV EnWG ARegV StromNEV
Rate
of
retu
rn
Type of WACC No use of WACC Determination of the rate of
return on equity
Sum of a nominal risk-free rate and a risk premium (market risk premium multiplied with a beta risk factor) multiplied with a corporate tax factor
Rate of return on equity
before taxes 691 = (249+38083) 1225
Use of rate of return
Granted for existing assets to a maximum of 40 of the imputed necessary business assets Any available equity capital in the capital structure in excess of this will be subject
to another equity interest rate
Reg
ula
tory
as
se
t b
ase
Components of RAB
Fixed assets working capital assets under construction
Regulatory asset value
Net substance preservation for business assets capitalised prior to 1st January 2006 real capital preservation for business assets as from 1st January 2006
RAB adjustments
By the ordinance defined investments after the base year
eg expansions lead to an
adjustments of the non-controllable
costs and therefore of the revenue cap
Investments in new assets after the
base year lead to an adjustment of the
CAPEX No distinction between replacements and enhancements or
expansions
By the ordinance defined investments after the base year
eg expansions lead to an
adjustments of the non-controllable
costs and therefore of the revenue cap
Investments in new assets after the
base year lead to an adjustment of the CAPEX No
distinction between replacements and enhancements or
expansions
Dep
re-
cia
tio
ns Method Straight line
Depreciation ratio
Depending on asset type Ratio between 15 and 4 eg lines amp cables ~2 stations ~4
Consideration Part of the examined controllable costs
Ref C20-IRB-54-03
CEER Report on Regulatory Frameworks for European Energy Networks 2020
42156
Introduction The electricity and gas networks are examples of what are known as natural monopolies where effective competition is restricted or does not exist at all To ensure that network operators (DSOs = Distribution System Operators TSOs = Transmission System Operators) do not make any monopoly profits but still operate their networks as cost effectively as possible the electricity and gas network operators are subject to regulation This task is performed by the Bundesnetzagentur (BNetzA) as the regulatory authority responsible in Germany for the networks in various sectors including electricity and gas BNetzA is responsible for regulating all operators with more than 100000 customers or whose network area covers more than one federal state All other network operators are regulated by the regulatory authorities in the federal states These federal state authorities can however also delegate regulation to BNetzA Historical Development Regulation by BNetzA began in 2005 as cost-plus regulation An incentive-based regulatory regime was introduced in 2009 to replace cost-plus regulation Under this regime the revenue that network operators are allowed to earn within a certain period (regulatory period) is determined using a mathematical formula and is fixed for the period It therefore makes sense (incentive) for network operators to lower their costs within the regulatory period (work efficiently) so as to increase their profits within the limits of the framework (revenue (fixed) minus costs (controllable) equals profit) Determining the Revenue Caps The revenue caps for network operators are set for a five-year regulatory period Each cap is composed of the permanently non-controllable costs temporarily non-controllable costs controllable costs (applying a distribution factor for reducing inefficiencies) a possible efficiency bonus (DSOs only) general inflation relative to the base year and a general sectoral productivity factor a CAPEX in period top-up to take account of the cost of capital for investments after the base year (DSOs only) quality element (electricity DSOs only) and volatile costs The difference between the allowed revenue and the development of actual volumes over the year is entered into a regulatory account Efficiency Benchmarking BNetzA carries out its efficiency benchmarking on the basis of the cost examination (TOTEX) and structural data validation before the start of each new regulatory period for gas and electricity network operators separately The efficiency benchmarking involves assessing the operators individual costs against the services they provide and determining each operators cost efficiency compared to the other operators In addition to the (input) cost parameters structural (or output) parameters are taken into account to replicate the services provided in each case as well as the regional characteristics Possible structural parameters could e g include the number of connection points peak load the amount of energy delivered or injected and transformer and compressor station data The costs and structural data collected always relate to the base year which is always the third year of a regulatory period The costs data mainly comprise staff and materials costs interest on borrowings depreciations and other operating costs Depreciations are prescribed in the regulations and are based on technical asset lives The costs data is supplemented by a calculated return on equity Anyone investing in a business enterprise expects a return on the capital employed that is competitive and reflects
Ref C20-IRB-54-03
CEER Report on Regulatory Frameworks for European Energy Networks 2020
43156
the industry-specific risks This return is usually a result of market forces and depends on the individual sector and the general level of interest rates If there is an imbalance between the risk of investment and potential earnings as a rule there will be no investment However since network operators ndash by virtue of their natural monopoly ndash are not fully subject to these market mechanisms yet still need to make vital investments in infrastructure the rate of return on equity is determined by the regulator The return on equity comprises a risk-free rate (determined on the basis of the ten-year average current yield of fixed-interest securities) and a risk premium The premium covering network-specific risks is determined using the capital asset pricing model (CAPM) and is derived from the product of an imputed market risk premium and a risk factor (beta factor) Corporate tax is accounted for through a factor applied to the sum of the risk-free rate and the risk premium Trade tax is by contrast determined on the basis of the return on equity The rate of return on equity is different for new and old assets The return on equity comprising the risk-free rate the risk premium and the corporate tax factor is applicable to new assets that first existed in or after 2006 A rate adjusted to take account of inflation is applicable to old assets that existed before 2006 The rate of return on equity is granted for existing assets to a maximum of 40 of the imputed necessary business assets Any available equity capital in the capital structure in excess of this will be subject to another equity interest rate This equity II interest rate is aligned with the standard rates of interest for procured capital and is set as a ten-year average based on the yields published by the German Bundesbank (federal bank) Existing borrowed capital is recognised at equal value insofar as any interest on borrowings does not exceed the customary market interest rate for comparable loans The costs known as the permanently non-controllable costs are deducted from this cost pool (materials costs staff costs costs of borrowing taxes other costs write-downs and return on equity minus revenue and income with cost-reducing effect) Permanently non-controllable costs are for example upstream network costs non-wage labour costs and concession fees Network operators can fully recoup the permanently non-controllable costs as revenue From the third regulatory period (2018 for gas and 2019 for electricity) there is an annual subtraction of the capital cost for the DSOs This subtraction takes account of the fall in capital expenditure for the asset base (total costs of depreciation the return on equity and the corporate tax each of which is imputed plus the costs of borrowing) over the duration of the regulatory period The CAPEX subtraction is also deducted from the cost pool The remaining controllable costs data and the structural data are then taken for the efficiency benchmarking model The structural cost parameters for all network operators are used to define groups or combinations of parameters that reflect the services provided by the network operators The optimum size of the parameter groups is also examined and defined The efficiency scores for the network operators are determined by applying the data envelopment analysis (DEA) and stochastic frontier analysis (SFA) methods to the defined parameter groups Since efficiency benchmarking is a comparative method the results for the individual network operators have a mutual influence on each other A network operator that provides the same scope of services as but has higher costs than another operator (100 efficiency) will have an efficiency score lower than 100 The efficiency scores are then applied to the controllable costs (total costs
Ref C20-IRB-54-03
CEER Report on Regulatory Frameworks for European Energy Networks 2020
44156
minus permanently non-controllable costs minus CAPEX subtraction) A network operator with an efficiency score of 80 for example will need to remedy the 20 of inefficiencies over the course of the upcoming regulatory period Each of the two methods used (DEA and SFA) offers only a restricted approach to determining efficiency scores This is why both methods are applied to determine more than one efficiency score for each network operator The network operators costs are also adjusted to take account of the networks different lifetime structures The DEA and SFA methods are then applied to determine further efficiency scores using these standardised costs Each network operator is then given the highest of the four efficiency scores calculated If the efficiency score calculated for a network operator using the two methods is lower than 60 the score is raised to 60 as the set minimum efficiency level A maximum efficiency level of 100 is also set The results are also examined to identify any network operators that appear as outliers and whose efficiency scores clearly dominate the efficiency scores of other network operators These network operators are no longer taken into account in the benchmarking and are given a fixed score of 100 without having any further influence on the efficiency scores of the other network operators The most efficient DSOs are eligible for a bonus added to the revenue cap on the basis of a super-efficiency analysis this bonus is limited to a maximum value of 5 This gives operators an incentive beyond the end of a regulatory period to improve efficiency in the long term even if they have already achieved an efficiency score of 100 General Sectoral Productivity Factor and Price Development Another component of the revenue cap is the general sectoral productivity factor which is always applicable for one regulatory period This factor is determined using scientific methods from the divergence between productivity gain in the network industry and productivity gain in the economy as a whole The idea behind this factor is to imitate market forces and thus simulate competitive pressure It is assumed that where competition exists productivity gains will lead to lower costs for companies and companies will pass on this competitive advantage to customers in the form of lower prices so as to attract customers away from competitors The productivity factor has the effect of reducing revenues The revenue caps also take account of the development of consumer prices in relation to the base year (CPI-X regime) General price increases lead to an increase in the revenue cap Quality Regulation Under a regulatory regime that provides incentives to cut costs there is a risk that operators will refrain from undertaking the necessary investments or measures in order to achieve the required or potential savings To counter this the regime includes quality regulation for electricity distribution networks This takes the form of a quality element in the formula for setting the revenue caps Operators achieving above-average quality in past years will have an amount added to their cap while operators with comparatively poor quality levels will have amounts deducted (bonuspenalty system) Adjusting the Revenue Caps After the Reference Year A CAPEX in period top-up for DSOs ensures that the revenue cap can be adjusted in line with the cost of capital for investments in new assets after the reference year No distinction is made here between replacement and enhancement or expansion expenditure Operators must apply for the top-up six months in advance
Ref C20-IRB-54-03
CEER Report on Regulatory Frameworks for European Energy Networks 2020
45156
TSOs (and in some cases DSOs) are able to refinance their necessary expansion and restructuring investments through investment measures Proposed expansion and restructuring investments can be approved provided they are required for the stability of the system as a whole incorporation into the national or international interconnected grid or expansion of the network to meet energy supply requirements Investments approved under the investment measures are factored into the revenue cap as permanently non-controllable costs In the event of changes in other permanently non-controllable costs of a network operator in the course of a regulatory period the revenue cap and thus the network charge can be adjusted accordingly National Specificities Electricity (Gas) DSOs with fewer than 30000 (15000) customers can choose to participate in what is known as the simplified procedure and are then not subject to efficiency benchmarking The efficiency score applicable to these operators is the weighted average of all adjusted efficiency levels from the national benchmarking exercise in the previous regulatory period For companies subject to the simplified procedure the portion allocated to permanently non-controllable costs is fixed at a flat rate of 5 Transparency The data published on the regulatory authorityrsquos websites include revenue caps and annual adjustments efficiency scores and efficiency bonuses Outlook There are currently no further plans to fundamentally change the incentive-based regulatory regime in Germany Various changes were made to the regime in 2016 Currently there are plans to introduce more incentives for supporting the grid extension related to the energy transition and for supporting the decrease of grid bottlenecks and the related costs of operating with these grid bottlenecks
Ref C20-IRB-54-03
CEER Report on Regulatory Frameworks for European Energy Networks 2020
46156
210 Great Britain Gas TSO Gas DSO Electricity TSO Electricity DSO
Ma
rke
t
str
uc
ture
Network operators
1 8 3 14
Network length
~7000 km ~265000 km ~25000 km ~800000 km
Ownership Private ownership Private ownership Private ownership Private ownership
Ge
ne
ral
fra
me
wo
rk
Authority GEMA (Gas and Electricity Markets Authority)
System Revenue Cap based on Rate-of-Return with Incentive-based Regulation
Period 8 years Current period 2013-21
8 years Current period 2015-23
Base year for next period
Transparency Full transparency through extensive consultation and publication
Main elements for determining
the revenueprice
cap
Bottom-up capital and operating expenditure (CAPEX and OPEX) benchmarkinganalysis complemented by top-down total expenditure (TOTEX) benchmarking efficiency
considerations RAB WACC RPI Real Price Effects performance against incentive schemes
Legal framework
Gas Act 1986 Electricity Act 1989 Utilities Act 2000 Competition Act 1998 Enterprise Act 2002 and measures set out in a number of Energy Acts
Rate
of
retu
rn
Type of WACC
Vanilla Real WACC
Determination of the rate of return on
equity
Sum of risk-free rate and a market risk premium multiplied by equity beta
Rate of return on equity
before taxes
Electricity transmission 7 Electricity distribution 6 Gas transmission 68 Gas distribution 67 (all in real terms)
Use of rate of return
Multiplied by the average period RAB
Reg
ula
tory
as
se
t b
as
e
Components of RAB Historical investment base (less depreciation removals) and capitalised element of total
expenditure in current control period
Regulatory asset value
Gas TSO pound5bn Gas DSO pound168bn Electricity TSO pound13bn Electricity DSO pound213bn
RAB adjustments
Annually updated for RPI and allowed additions less regulatory depreciation and cash proceeds from disposals
Dep
re-
cia
tio
ns Method Straight line for all except Gas DSO which is sum of digits
Depreciation ratio
Generally 45 years but some exceptions to avoid cliff edge effects
Consideration
Introduction
Ofgem is the Office of Gas and Electricity Markets5 It is a non-ministerial government department and an independent National Regulatory Authority recognised by EU Directives Ofgemrsquos principal objective when carrying out its functions is to protect the interests of existing and future electricity and gas consumers Ofgem works effectively with but is independent of government the energy industry and other stakeholders within a legal framework determined by the UK government
5 Note Ofgem regulates markets in Great Britain but not in Northern Ireland
Ref C20-IRB-54-03
CEER Report on Regulatory Frameworks for European Energy Networks 2020
47156
Ofgem is governed by the Gas and Electricity Markets Authority (GEMA) The Authority determines strategy sets policy priorities and makes decisions on a wide range of regulatory matters including price controls and enforcement Historical Development GB gas networks were privatised in 1986 and electricity networks in 1989 The form of regulation initially chosen was ldquoRPI-Xrdquo whereby the regulator limits average network charges from rising by more than the rate of inflation (measured by the Retail Price Index) less an efficiency factor (called X) Since the revenues for the regulated company are set ahead of the regulatory period it incentivises the company to reduce expenditure as much as possible to maximise profits This price revelation can then be used to set allowances for the next regulatory period allowing consumers to benefit from the resulting lower costs Although costs came down significantly over the course of successive iterations of price controls RPI-X was found to have a number of issues companies sometimes compromised on quality of service to maximise profits they had poor incentives to invest in the introduction of innovation and the regime had a bias towards capital intensive solutions Accordingly in 2013 Ofgem moved to the ldquoRIIOrdquo price control framework which is Revenues = Innovation + Incentives + Outputs Under RIIO companies are held accountable for delivering a high quality of service through the use of output targets they are given financial incentives and a longer control period to encourage investment in innovation projects and the bias towards capital spending was removed through the use of TOTEX allowances which means that a fixed proportion of a companyrsquos total expenditure is added to the RAB irrespective of whether it comprises capital or operating expenditure Determining the Revenue Caps The revenue caps for network operators are set for an eight-year regulatory period The current regulatory period for gas amp electricity transmission and gas distribution is April 2013 ndash March 2021 for electricity distribution the period is April 2015 ndash March 2023 The allowed revenues are built up as per the following diagram
Ref C20-IRB-54-03
CEER Report on Regulatory Frameworks for European Energy Networks 2020
48156
Baseline TOTEX is set taking a view on justification of investment and then if justified making an allowance for efficient costs Network operators are incentivised to beat these allowed costs through a sharing mechanism which allows them to keep a share of any underspend or bear a proportion of any overspend These revealed costs then help to set benchmarks for the cost levels in the following price control period Efficiency Requirements Investment plans for the entire regulatory period are approved ex-ante on the basis of established needs case and the having a positive cost benefit analysis Operators are allowed efficient costs and incentivised to beat these through a profitloss sharing mechanism Where costs or timing of investment need are not clear there are uncertainty mechanisms that allow for a revisiting of the justification at a later stage of the control period The efficient allowances will sometimes take consideration of factors such as efficiency gains (to mimic the expected gains in productivity that occur in competitive markets) and real price effects (those unavoidable business costs that develop at a different rate to the RPI annual revenue indexation) Price Development The allowed revenues are indexed to the retail prices index in relation to the base year and also take into account real price effects Quality Regulation Network operators have to meet performance outputs specified in their licences the categories of output are common within sectors but vary between sectors The performance targetsrequirements vary from licensee to licensee Failure to deliver outputs can be met by a variety of measures financial penalties claw back of revenues and in extreme cases enforcement action Adjustments after the Reference Year Each year Ofgem recalculates revenue allowances due to inflation investment non-controllable (pass-through) operating and maintenance costs licensee specific mechanisms and incentives This adjustment is done on an annual basis and feeds into tariffs that come into effect two years afterwards Transparency Price controls are set following extensive stakeholder consultation typically over a two-to-three-year timeframe in advance of the regulatory period Submissions responses and decisions are all published on the Ofgem website (subject to commercial confidentiality restrictions) Licensees are obliged to send in annual returns and Ofgem publishes reports that monitor how the licensees are performing against the price control settlement
Ref C20-IRB-54-03
CEER Report on Regulatory Frameworks for European Energy Networks 2020
49156
211 Greece Gas TSO Gas DSO Electricity TSO Electricity DSO
Ma
rke
t
str
uc
ture
Network operators
1 3 1 1
Network length 1466 km 6382 km 17340 circuit km 241179 circuit km
Ownership Private investors and State ownership
State ownership and private investors
State ownership and private investors
State ownership and private investors
Ge
ne
ral
fra
me
wo
rk
Authority Regulatory Authority for Energy (RAE)
System Cost plus Revenue cap Revenue cap Cost Plus
Period 4 years current period 2019-2022
4 years current period 2019-2022
4 years current period 2018-2021
1 year
Base year for next period
Year t-2 (actual) amp year t-1 (estimates)
Transparency Decisions Regulatory data Specific cost data
Main elements for determining
allowed revenue
OPEX (Non-controllable and
controllable costs) Depreciation
RAB (Assets and approved
investment plans working capital)
WACC
OPEX (Non-controllable and
controllable costs) Depreciation RAB
(Assets and approved
investment plans working capital)
WACC and WACC premium
OPEX (Non-controllable and
controllable costs) Depreciation RAB
(Assets and approved
investment plans working capital)
WACC and WACC premium
OPEX (Non-controllable and
controllable costs) Depreciation RAB
(Assets and approved
investment plans working capital)
WACC
Legal framework
Law 40012011
Rate
of
retu
rn
Type of WACC Nominal pre-tax Nominal pre-tax Real pre-tax Nominal pre-tax
Determination of the rate of
return on equity
WACC a) CAPM amp additional country risk premium for cost of equity and b) cost of debt based on operatorsrsquo proposal and actual figures of base year
Rate of return on equity
before taxes 876 875 83 780
Use of rate of return
WACC is applied on the value of Regulatory Asset Base (RAB) for each year of the Regulatory Period
Reg
ula
tory
as
se
t b
as
e Components of
RAB Fixed assets working capital assets under construction
Regulatory asset value
Historical costs Historical costs since 2009 (last revaluation
in 2004)
RAB adjustments
No adjustments historical values6
Dep
re-
cia
tio
n Method Straight line
Depreciation ratio
Most assets are depreciated over a period of 25-50 years
Consideration Depreciation ratio depends on asset type and it is integrated directly into the revenues
6 Only for Electricity TSO since Allowed Revenue is calculated in real terms an adjustment of RAB is taken place
based on CPI
Ref C20-IRB-54-03
CEER Report on Regulatory Frameworks for European Energy Networks 2020
50156
Introduction Electricity and natural gas networks are characterised as ldquonatural monopoliesrdquo in which effective competition is limited or does not exist at all In this context to ensure that network operators do not abuse their dominant position ie provide non-discriminatory access to the network at tariffs that reflect conditions of healthy competition and to stimulate cost effective operation of the network Transmission System Operators (TSOs) and Distribution System Operators (DSOs) are subject to regulation This task is performed by the Regulatory Authority for Energy (RAE) RAE among other tasks oversees and regulates the electricity and natural gas network operators in Greece Electricity transmission and distribution in Greece are conducted by one TSO (ADMIE-IPTO) and one DSO (HEDNO) Regarding natural gas there is one TSO (DESFA) and three DSOs (EDA Attikis EDA Thess7 DEDA) There is also a separate electricity DSO (privately owned) operating the network of Athens International Airport The Athens International Airportrsquos Electricity Grid Manager is regulated However only accounting obligations are applied since it has less than 100000 customers (Directive 722009) Historical Development Unbundling Following the Energy Law 40012011 the Public Power Corporation (PPC SA) established a 100 subsidiary ADMIE SA according to the Independent Transmission Operator (ITO) model In 2012 RAE certified ADMIE SA as the independent power transmission system operator and since 2017 ADMIE SA has followed the model of Ownership Unbundling and the shareholding structure is 51 Greek State (through ADMIE HOLDINGS Inc and DES ADMIE SA) 24 State Grid Europe Limited and 25 other institutional and private investors HEDNO SA (Hellenic Electricity Distribution Network Operator SA) was formed by the separation of the Distribution Department from PPC SA according to Law 40012011 and in compliance with 200972EC EU Directive HEDNO SA is a 100 subsidiary of PPC SA (51 owned by Greek State and 49 by institutional investors amp general public) however it is fully independent in operation and management retaining all the independence requirements that are incorporated within the aforementioned legislative framework HEDNO is organised as a distribution operator based on the ISO model PPC SA retains the ownership of distribution assets HEDNO is also the designated system amp market operator of the non-interconnected island electricity systems The Hellenic Natural Gas TSO (DESFA SA) was privatised during 2018 and the companyrsquos shareholding structure is now 34 the Greek State and 66 SENFLUGA SA (a consortium of the companies SNAM ENAGAS and FLUXYS) The three Natural Gas DSOs (EDA Attikis EDA Thess and DEDA8) were unbundled from supply activities in 2017 Tariff Regulation According to law9 RAE approves tariff setting methodologies for all non-competitive activities and sets relevant overarching principles and criteria Explicit allowed revenue methodologies are currently in place for electricity transmission (since 2015) gas transmission (since 2012) and for gas distribution (since 2016) The regulatory model is essentially a multi-year revenue-
7 Operator of the Natural Gas Distribution Network within the geographical areas of Thessaloniki Prefecture and
Thessaly Region 8 Operator of the Natural Gas Distribution Network for the Rest of Greece apart from Attiki and Thessaloniki ndash
Thessalia 9 Law 27731999 and Law 40012011
Ref C20-IRB-54-03
CEER Report on Regulatory Frameworks for European Energy Networks 2020
51156
cap on OPEX and cost-plus on CAPEX Allowed revenue for electricity distribution is currently calculated by relying on the principles underpinning the electricity transmission revenue methodology adapted to single-year regulatory periods and applied broadly as cost-plus on both OPEX and CAPEX Regulatory Decision Process Given the allowed revenue methodologies in place for the next period the process starts with regulatory submissions by operators due not later than seven months before the start of the next regulatory period The decision setting allowed revenue for the next period is issued two months before its start Decisions are taken separately for each TSO and DSO in the natural gas and electricity sectors Main Principles of the Tariff Regulation The Regulatory Period Duration of the regulatory period is set as part of the allowed revenue methodology decision For electricity and gas TSOs as well as for gas DSOs a four-year Regulatory Period applies10 For the electricity DSO the regulatory period can be set from three to five years defined also as part of the allowed revenue methodology decision (to be issued in 2020) The base (reference) year for all operators is year 119905 minus 2 Determining Allowed Expenditures The main building blocks of allowed revenue (OPEX and CAPEX) are determined in separate processes CAPEX streams are derived by approved network development plans (ten-year plan for electricity and gas TSO five-year plan for electricity and gas DSOs) that apply for the regulatory period under review These can be modified on an annual basis and are approved separate from allowed revenue decisions Modifications to approved development plans during a regulatory period are considered in ex-post treatment of CAPEX OPEX streams are determined in the context of the allowed revenue decision RAE set a reasonable OPEX allowance for the next period scrutinising operatorsrsquo expenditure proposals based on past performance and forecasts considering changes in relevant drivers conditions statutory and regulatory requirements etc Regulatory Asset Base ndash Depreciation The Regulatory Asset Base (RAB) includes the estimated capital employed for the regulated network activity for every year of the regulatory period which includes the following
i Undepreciated value of fixed assets (+) ii Assets under construction (+) iii Working capital (+) iv Grants and Contributions from Third Parties (-)
Depreciation is calculated for every year of the regulatory period for all assets that are expected to be in service during that year excluding assets funded by third parties Assets under construction are remunerated only for return on employed capital
10 In the recent past regulatory periods of three years were implemented while the current regulatory period for
gas TSO is 2 years (2017-2018)
Ref C20-IRB-54-03
CEER Report on Regulatory Frameworks for European Energy Networks 2020
52156
For the electricity TSO (ADMIE) and DSO (HEDNO) the historical values of 2009 have been considered (two revaluations took place before 2009 in 2000 and 2004 and the relevant surplus has been included in historical values) Since then no revaluation has been considered For the natural gas TSO and DSOs historical values are considered WACC and WACC Premium A weighted average cost of capital (WACC) is calculated as a rate of return for capital employed (RAB) WACC is estimated in real terms (pre-tax) only for the electricity TSO (since 2015) while for all the other operators a nominal pre-tax WACC is used Due to specific country conditions an extra premium (Country Risk Premium) is added to CAPM model For the electricity TSO and for specific projects that are characterised as Projects of Major Importance in the TYNDP a premium rate of return can be provided in addition to WACC The percentage of this premium varies between 1 and 25 and is decided by RAE For gas DSOs RAE can increase the allowed return (WACC) by 15 according to specific objectives (defined by RAE) mainly aiming to increase natural gas consumption WACC Calculation
119882119860119862119862119901119903119890minus119905119886119909119899119900119898119894119899119886119897 = 119892 lowast 119903119889 + (1 minus 119892) lowast 119903119890(119905 minus 1)
119903119890119901119900119904119905minus119905119886119909119899119900119898119894119899119886119897 = 119903119891 + 120573119890119902119906119894119905119910 lowast 119872119877119875 + 119862119877119875
Parameters electricity natural gas
Transmission (2020)
Distribution11 (2019)
transmission (2020)
distribution (2020)
Nominal risk-free rate 070 047 035 035
Country Risk Premium (CRP) 180 200 180 180
Cost of Debt 504 460 393 308
Market premium 500 530 530 530
Equity beta 067 060 080 080
Cost of Equity (pre-tax) 83 780 876 875
Gearing - D(D+E) 3627 2715 1890 1800
Tax rate12 2800 2800 2700 2700
Nominal pre-tax WACC 710 697 784 773
Treatment of OPEX amp CAPEX ndash Efficiency Incentives Except for extraordinary allowed revenue revisions the electricity TSOrsquos and gas DSOsrsquo OPEX allowances are not subject to ex-post adjustment or settlement either during or after the regulatory period As there is no efficiency sharing mechanism currently in place the scheme provides some incentives to these operators to operate more efficiently The electricity DSO is provided with similar incentives although these are further limited to plusmn3 of OPEX allowance deviations beyond this threshold are potentially subject to settlement ex-post
11 The relevant decision for 2020 is to be issued The above figures are according decision 5722019 for the Allowed
Revenue of 2019 12 At the end of 2019 according to Law 46462019 tax rate has been reduced to 24
Ref C20-IRB-54-03
CEER Report on Regulatory Frameworks for European Energy Networks 2020
53156
OPEX allowance of the gas TSO is fully adjusted based on actual figures (cost-plus approach) CAPEX is treated on a cost-plus basis for both electricity and gas TSOs and DSOs with settlements for differences between approved and realised expenditure carried out both on annual basis and at the end of the regulatory period Extraordinary Revisions of Allowed Revenue Extraordinary revisions of the allowed revenue can be performed in case of a substantial change on the legal economic or actual data that were considered when calculating the allowed revenue has occurred Adjusting During a Regulatory Period Inflation adjustments are made for all network operators during the regulatory period apart from the electricity DSO which has a one-year regulatory period Outlook Key plans to further develop the regulatory regime for electricity networks in Greece include introducing for the electricity DSO
bull a multi-year regulatory period (three-five years)
bull a revenue-cap methodology (probably for OPEX during the first period)
bull incentives to reduce network losses (penaltyreward scheme) and
bull a quality regulation (minimum guaranteed standards complemented with a penaltyreward scheme in the following period)
Ref C20-IRB-54-03
CEER Report on Regulatory Frameworks for European Energy Networks 2020
54156
212 Hungary Gas TSO Gas DSO Electricity TSO Electricity DSO
Ma
rke
t
str
uc
ture
Network operators
1 10 1 6
Network length
5874 km 83872 km 4856 km 161800 km
Ownership Private Ownership
2 state-owned 8 private
Public 1 public 5 private
Ge
ne
ral
fra
me
wo
rk
Authority Hungarian Energy and Public Utility Regulatory Authority (httpwwwmekhhuhome)
System Incentive Regulation
Period 4 years current period 2017 Jan-2021 Sep (longer than 4 years due to the change from Jan-Dec regulatory periods to Oct-Sep
periods)
4 years current period 2017-2020
Base year for next period
2018 2019 2019
Transparency The methodological guidelines for determining the justified costs and maintaining the prices during the regulation period are available on HEA website
Main elements for
determining the allowed
revenue
Allowed revenue is composed of
OPEX CAPEX Depreciation (all
adjusted to account for inflation)
efficiency improvement factor for OPEX (CPI-X)
Allowed revenue is composed of OPEX
CAPEX Depreciation (all
adjusted to account for inflation)
efficiency improvement factor for OPEX (CPI-X)
Hybrid model Hybrid model
Legal framework
Act 40 of 2008 on natural gas
Commission Regulation
2017460 (TAR NC)
Act 40 of 2008 on natural gas
Act 86 of 2007 on electricity
Rate
of
retu
rn
Type of WACC Real pre-tax
Determination of the rate of
return on equity
Sum of the real risk-free rate and risk premium (equity beta multiplied by market risk premium)
Rate of return on equity
before taxes 614 = (0188+1689+430072((1-019) 620 = (188+430073)(1-019)
Use of rate of return
WACC is multiplied with the whole value of RAB to calculate the return on capital
Reg
ula
tory
as
se
t
ba
se
Components of RAB
Tangible assets Fixed assets
Regulatory asset value
Network assets depreciated replacement value Non-network assets historical costs
RAB adjustments
The assets of the base year are modified yearly with modified CPI and T-1 yearrsquos
investments which were approved by the Authority
The assets of the base year are modified yearly with CPI and T-1 yearrsquos investments
minus depreciation minus connection charges
Dep
re-
cia
tio
ns Method Straight line
Depreciation ratio
Depending on asset type the useful lifetime (years) pipeline 50 compressor station 20
gas delivery station 30
Depending on asset type Ratio between 25 and 7 eg lines amp cables ~25
stations ~333
Consideration Based on expected useful lifetime Based on expected useful lifetime
Ref C20-IRB-54-03
CEER Report on Regulatory Frameworks for European Energy Networks 2020
55156
Introduction The electricity and gas networks are examples of what are known as natural monopolies where effective competition is limited or does not exist at all To ensure that network operators (DSOs and TSOs) do not make any monopoly profits but still operate their networks as cost effectively as possible the electricity and gas network operators are subject to regulation Electricity Historical Development Regulation began in Hungary after privatisation in 1997 with the first four-year regulatory period The regulation was incentive-based from the beginning but there were gradual changes in each period The developments in the electricity and gas sectors ran in parallel but there were some differences In electricity separate network tariffs have existed since 2003 The Capital Asset Pricing Model was first applied in the 2005-2008 pricing period while benchmarking was introduced in the 2009-2012 pricing period The present regulatory period has seen a transition from price caps to revenue caps as the quantity changes of the distributed energy are taken into account Determining the Price Caps The Hungarian incentive regulation is a price-cap-like system The price caps for network operators are set at the beginning of the four-year regulatory period The cap is calculated from the justified costs (operation amp maintenance (OampM) depreciation capital costs (RAB multiplied with WACC) network loss) and the transmitted or distributed energy The justified costs are determined through a detailed cost review Concerning the OampM cost there is an efficiency benchmarking the Regulatory Asset Base and the depreciation are calculated from the depreciated replacement value and the expected lifetime of the assets Efficiency Benchmarking The Hungarian Energy and Public Utility Regulatory Authority (hereinafter HEA) carries out its OampM cost-efficiency benchmarking prior to the start of each new regulatory period for gas and electricity network operators separately The efficiency benchmarking involves assessing the operators individual costs against the services they provide and determining each operators cost efficiency compared to the other operators The benchmarking is related to the DSOrsquos part- or sub-operations such as operation and maintenance metering and reading customer service The partial productivity index is used General Sectoral Productivity Factor and Price Development The idea behind this factor is to imitate market forces and thus simulate competitive pressure It is assumed that where competition exists productivity gains will lead to lower costs for companies and companies will pass on this competitive advantage to customers in the form of lower prices so as to attract customers away from competitors Quality Regulation Under a regulatory regime that provides incentives to cut costs there is a risk that operators will refrain from undertaking the necessary investments or measures in order to achieve the required or potential savings To counter this the regime includes quality regulation for electricity distribution networks This takes the form of a quality element in the formula for maintaining the price caps Operators achieving above the required quality (SAIDI SAIFI Outage Rate) in past years will have an amount added to their price cap while operators with comparatively poor quality levels will have amounts deducted (bonuspenalty system) The TSO is subject to a far softer quality regulation which is only a simple penalty system and which has not been activated so far
Ref C20-IRB-54-03
CEER Report on Regulatory Frameworks for European Energy Networks 2020
56156
Adjusting the Price Caps After the Reference Year The formula for maintaining the network tariffs during the regulation period consists of the following cost and revenue elements
- Forecasted CPI ndash X (OampM) forecasted CPI (depreciation and capital expenditure) - Investments - Forward electricity price changes (network losses) - The difference between the factual revenue and the forecasted revenue - Quality of service and - Other specific costs (only in case of the TSO)
National Specialities For electricity there are nation-wide uniform distribution tariffs with an inter-DSO compensation tool Transparency HEArsquos methodological guidelines for determining the justified costs and maintaining the prices during the regulation period are available on the HEA website Natural Gas Historical Development With regards to natural gas a separate system for tariffs has existed since 2004 Before their introduction between 1999 and 2004 regulated tariffs (containing both the costs related to system usage and commodity costs) consisted of two components (fixed and variable) Before 1999 a single component tariff (purely volume based) was in effect Since 2004 system tariffs have been regulated with regulatory periods ranging between two and six years The current regulatory period began on the 1st of January 2017 Due to the switch to regulatory periods with their beginnings coinciding with the beginning of the gas year the current regulatory period will be longer than four years and will last until the 30th of September 2021 Determining the Tariffs Tariffs are set for four-year (as a default) regulatory periods with annual tariff reviews during the regulatory period HEA carries out a cost and asset review before the beginning of each regulatory period during which it determines the regulatory asset base the justified operating costs and the level of the WACC to be applied during the next regulatory period Before the cost and asset review HEA issues methodological guidelines detailing the applied methodologies both for the setting of the initial tariffs and the annual tariff review during the regulatory period During the cost review mainly with regards to DSOs HEA benchmarks the efficiency of relevant activities among the system operators In 2015 HEA issued a guideline to DSOs in order to harmonise their cost accounting practices and thus help the benchmarking process HEA also determines the level of metering losses considered to be justified and the cost of the lost gas After determining the justified operating costs and the regulatory asset base HEA calculates the level of the costs to be recovered through the tariffs (cost base) Based on the cost base the relevant capacities and heating-degree day normalised volumetric data HEA determines the applicable tariffs In 2019 in line with the provisions of Commission Regulation (EU) 2017460 of 16 March 2017 establishing a network code on harmonised transmission tariff structures for gas HEA issued
Ref C20-IRB-54-03
CEER Report on Regulatory Frameworks for European Energy Networks 2020
57156
a reference price methodology following a public consultation which replaced the former methodological guidelines with regards to the transmission system operator A Short Overview of the Benchmarking Process Utilised During the Cost and Asset Review of DSOs The aim of benchmarking the relevant costs is to assess the efficiency of the different operators and to determine the justified level of operating costs For the benchmarking HEA used partial productivity indices HEA divided the activity of DSOs into comparable sub-activities allocated the relevant costs to the sub-activities and based on the relevant cost driversoutputs created per unit indices These per unit partial productivity indices form the basis of the benchmarking process The following sub-activities are used in the benchmarking process Activities related to the operation of infrastructure
bull Maintenance and operation of pressure regulators (with the exceptions of small-sized pressure regulators placed at end-users) and city gates
bull Maintenance and operation of gas lines
bull Maintenance and operation of gas meters and
bull Maintenance and operation of pressure regulators placed at end-users + costs related to malfunctions
Activities related to system users
bull Meter reading
bull Customer relations
bull Billing and
bull Technical review of end-user system plans and testing of end-user systems
Only operating costs are benchmarked The following categories of costs are not benchmarked pass-through costs costs of an insignificant level costs reviewed with other methodologies (eg network losses) Cost drivers used during the process were determined based on the following criteria
bull The data was available at all DSOs and it was determined with a sufficiently similar methodology
bull A strong correlation was found both on the level of individual DSOs and for their totality between the cost driver and the relevant cost base and
bull For activities with no sufficient cost drivers identified composite cost drivers with a better fit were created from the combination of the relevant drivers
In order to account for justified differences between the costs and operating circumstances of the DSOs the regulator had the right to modify cost drivers By dividing the relevant costs with the relevant cost drivers the regulator created the partial productivity indices regarding unit costs By dividing the sum of the relevant costs of all DSOs with the sum of the relevant cost drivers of all DSOs the regulator determined the average unit costs In the case of DSOs with higher-than-average unit costs only the average unit cost level is considered to be justified the part of the per unit costs above the average level are not accepted as a part of the justified cost base
Ref C20-IRB-54-03
CEER Report on Regulatory Frameworks for European Energy Networks 2020
58156
In order to avoid unjustified under recovery of costs due to different accounting and cost allocation practices between DSOs an ldquoefficiency reserverdquo is utilised The role of this ldquoefficiency reserverdquo is to allow the efficiency increase in those cost categories in which a DSOrsquos efficiency is more than average to compensate for lack of efficiency in those cost categories in which a DSOrsquos efficiency is less than average Adjusting the Tariffs During the Regulatory Period During the regulatory period annual tariff reviews are carried out in order to keep the tariffs updated During the annual tariff review the initial cost base is adjusted and tariffs are recalculated based on the adjusted cost base and the updated capacities and heating-degree day normalised volumetric data The adjustment takes into consideration the following factors
bull Inflation
bull Changes to the operating costs caused by legislative changes
bull Changes in the regulatory asset base depreciation and cost of capital
bull Investments arising from legislative changes or regulatory obligations
bull Changes in the recognised cost of the settlement difference
bull Adjustments to be made based on the ex-post examination of the system operatorrsquos profit with regards to its profit limit
bull Correction of errors if any and
bull Changes in data expressed in volumes and quantified non-financial parameters
National Specialities
bull Nation-wide uniform transmission tariffs
bull Separate distribution tariffs for each DSO (Before 2011 uniform distribution tariffs with an inter-DSO compensation mechanism were utilised however the system led to legal disputes Since 2011 separate distribution tariffs are used) and
bull Off-peak seasonal consumers
Transparency The methodological guidelines for both the cost and asset review and the within-period annual cost review are published on the regulatorrsquos website before the cost and asset review
Ref C20-IRB-54-03
CEER Report on Regulatory Frameworks for European Energy Networks 2020
59156
213 Iceland Gas TSO Gas DSO Electricity TSO Electricity DSO
Ma
rke
t
str
uc
ture
Network operators
No Gas TSO No Gas DSO 1 6
Network length
~3400 km ~22000 km
Ownership
Indirect public ownership
Private public and local public ownership
Ge
ne
ral
fra
me
wo
rk
Authority
The National Regulatory Authority (NRA) is a team within Orkustofnun National Energy Authority
(wwwosis)
System Incentive Regulation Revenue cap
Period 5 years current period 2016-2020
Base year for next period
Average of OPEX 2015 ndash 2019 base year 2020
Transparency All data behind the regulation model can be made available upon request
Main elements for
determining the revenue
cap
TOTEX OPEX (CPI adjusted average 2010-
2014) + CAPEX (previous year CPI
adjusted book values) + Non-controllable cost (less than 2)
Efficiency factor = 0 for this period
TOTEX OPEX (CPI adjusted average 2010-2014+non-
controllable OPEX from previous year) + CAPEX (previous year CPI adjusted
book values) + other non-
controllable cost (eg network
losses) Efficiency factor = 0 for this
period
Legal framework
The Electricity Act No 652003
Rate
of
retu
rn
Type of WACC Pre-tax WACC = dRd(1 - t) + eRe d=dept ratio e=equity ratio
WACC for energy intensive TSO (2018) = 665 WACC for general (TSO and DSO) = 708
Determination of the rate of
return on equity
Re = (rf + (rm - rf)β + specific risk)(1 - t) Sum of real risk-free rate and a risk premium (market risk premium multiplied with a beta
risk factor) plus a specific risk premium multiplied with a corporate tax factor
Rate of return on equity
before taxes
Energy intensive (TSO) = 102 = ((273+50089)+10)(1-02) (for 2018) General (TSO and DSO) = 107 = ((311+50089)+10)(1-02) (for 2018)
Use of rate of return
The Pre-Tax WACC is the rate of return it is granted for operating necessary business assets
Reg
ula
tory
as
se
t b
as
e Components
of RAB Fixed operating assets
Regulatory asset value
Book value
RAB adjustments
CPI adjusted book values
Dep
re-
cia
tio
ns Method Straight line
Depreciation ratio
Depending on asset type Ratio between 2 and 20 eg TSO lines amp cables ~2 stations ~25 DSO lines amp cables ~3-4
Consideration The regulator regularly inspects the RAB and the depreciations
Ref C20-IRB-54-03
CEER Report on Regulatory Frameworks for European Energy Networks 2020
60156
Introduction The National Regulatory Authority (NRA) in Iceland Orkustofnun is responsible for regulating natural monopolies in electricity and consists of a team of four people Iceland has no gas networks and the majority of space heating is conducted through direct use of geothermal energy Iceland has one TSO (Transmission System Operator) and ~75 of the energy produced is transmitted directly to Energy-Intensive Industries The other ~25 of the energy is transmitted to six DSOs (Distribution System Operators) with the number of customers ranging from ~900 to ~80 000 Two of the DSOs distribute both in rural and urban areas Historical Development The Electricity Act no 652003 came into force in 2003 and implements Directives 9692 and 200354 The 3rd Energy Package has not yet been implemented into national law Regulation by the NRA officially began in 2005 as revenue cap regulation with a team of two people The Electricity Act was changed in 2011 The changes in terms of regulation included eg a longer regulatory period from three to five years and rate of return changed from being based on government bonds directly to a WACC After the change of the regulation the team was enlarged and consists presently of four people Determining the Revenue Caps The revenue caps for network operators are set for a five-year regulatory period The last cap was set in 2015 for the period 2016ndash2020 based on data from 2010ndash2014 where the base year is 2015 The next cap will be set in 2020 for the 2021-2025 period The cap is composed of the five-year average of the controllable OPEX non-controllable OPEX and CAPEX Determining the Allowed Revenue The revenue cap is updated every year ex-post and is referred to as allowed revenue The allowed revenue is updated by CPI adjusting the controllable OPEX (relative to the base year) set by the revenue cap Non-controllable OPEX is based on real values and includes network losses and TSO tariffs (for DSOs) which the DSOs can fully recoup as revenue TSO network losses are not a part of their revenue capallowed revenue but the tariff for network losses is monitored by the NRA CAPEX includes the RAB times the WACC plus depreciations for the relevant year The RAB is based on inflation adjusted book values on 1 January for the relevant year Depreciations are linear and based on asset type The difference between the allowed revenue and the actual revenue from distributiontransmission is entered into a regulatory account containing accumulated surplus or deficit balances All change in tariffs are based on that account A network operator cannot have accumulated surplus that is higher than 10 of their last allowed revenue All accumulated deficits that are higher than 10 of the last allowed revenue are written off Split up Revenue Caps Both the TSO and two of the six DSOs in Iceland have split up revenue caps and allowed revenue and thus have two regulatory accounts The TSO has a revenue cap for transmission to the DSOs and a revenue cap for transmission to Energy-Intensive Industries Two of the DSOs have a revenue cap for their urban areas and a revenue cap for their rural areas Efficiency Benchmarking Orkustofnun is legally obliged to carry out an efficiency study of the network operators before the revenue cap is set every five years Such a study can only be carried out through independent specialists and not by the regulator Other than that the efficiency legislation is open in terms of methodology and data After a recommendation from the specialists the regulator can make a decision on an efficiency factor for the next period Before the last cap was set in 2015 independent specialists conducted such an efficiency study on the TSO and
Ref C20-IRB-54-03
CEER Report on Regulatory Frameworks for European Energy Networks 2020
61156
the six DSOs The TSO was evaluated independently and not benchmarked against other TSOs The six DSOs were evaluated as eight companies since two of them have split up revenue caps The evaluation for the DSOs was based on a DEA analysis and the controllable OPEX (input) and structural data Structural parameters can include peak load energy delivered length of lines and cables number of customer etc The result was used as a recommendation for an efficiency factor for the NRA and the NRA made an efficiency score decision based on that recommendation That decision was however appealed to an independent appeal committee that revoked the NRArsquos decision Rate of Return According to the Electricity Act the WACC is the rate of return on book values of all assets in the RAB Both the TSO and two of the DSOs have two RABs on account of their split of the revenue cap The WACC is the weighted average of the cost of debt and cost of equity calculated by the capital asset pricing model Corporate tax is accounted for through a factor applied to the WACC formula Inflation is however not accounted for in the WACC formula since the RAB is adjusted in terms of inflation every year All parameters in the WACC model are fixed in a regulation no 1922016 except the risk-free rate The risk-free rate is a moving average of the ten-year inflation-indexed US TIPS (Treasury Inflation-Protected Securities) plus a ten-year CDS (Credit Default Swap) spread for Energy-Intensive Industries and ten-year inflation-indexed Icelandic government bonds for the general user and DSOs The NRA calculates a new WACC every year based on the change in the risk-free rate Eg in April 2017 the NRA at Orkustofnun published new WACC for 2018 based on the average of the risk-free rate from 1 January 2007 to 31 December 2016 The WACC 2018 is the rate of return for the RAB when the allowed revenue for 2018 will be calculated in 2019 The WACC regulation mentioned above has a revision clause and is revised upon request The revision and recommendation for the parameters of the WACC formula is performed by independent group of specialists with the WACC committee appointed by the NRA Quality Regulation The Icelandic regulatory regime provides incentives to cut costs and to invest There is still a risk that operators will refrain from undertaking the necessary investments or measures in order to achieve the required or potential savings To counter this data on quality of the network is collected and monitored by the NRA The quality element is not a part of the revenue capallowed revenue formula although it has been considered and was included in the draft of the Electricity Act Investments The DSOs are not legally obligated to report their investment plans to the NRA The NRA can however request all such information especially when it comes to potential change in tariffs where the DSOs are obligated to provide a forecast for the allowed revenue to account for the effect on the regulatory account The TSO is obligated by law to deliver a three-year exact investment plan and ten-year network development plan to the NRA The NRA approves or rejects the investment plan The three-year plan is equivalent to an investment authorisation This plan includes all investments of the TSO Transparency The NRA plans to publish data on the regulatory website which will include revenue caps and annual adjustments WACC etc All data related to the regulation can be made available upon request
Ref C20-IRB-54-03
CEER Report on Regulatory Frameworks for European Energy Networks 2020
62156
Outlook There are currently no formal plans to develop the incentive-based regulatory regime in Iceland Various changes were last made to the regime in 2011
Ref C20-IRB-54-03
CEER Report on Regulatory Frameworks for European Energy Networks 2020
63156
214 Ireland Gas TSO Gas DSO Electricity TSO Electricity DSO
Ma
rke
t
str
uc
ture
Network operators
1 1 1 1
Network length
~2477 km ~11913 km ~6711 km ~172000 km
Ownership
Gas Networks Ireland (GNI)
EirGrid operate the System and ESB Networks own the
system
ESB Networks
Ge
ne
ral
fra
me
wo
rk
Authority Commission for Regulation of Utilities (CRU)
System Incentive Regulation Revenue cap
Period 5 years current period 2017 - 2022 5 years current period 2016 - 2020
Base year for next period
Fourth year of current regulatory period Fifth year of current regulatory period
Transparency
Performance reports (Customer Performance and System Performance)
are published annually by GNI Innovation reporting framework has been established
and GNI publish an annual report The CRU publishes its 5-year price control
decisions following public consultation The CRU also publishes an annual tariff
information paper
Performance reports are published annually by the network companies There is CAPEX
monitoring and reporting in place also CAPEX reports are published on annual basis There are Innovation reports published annually by ESBN and EirGrid Furthermore there is a
report on stakeholder engagement published annually by the CRU
The CRU publishes its 5-year price control decisions following public consultation The
CRU also publishes an annual tariff information paper
Main elements for
determining the revenue
cap
1Review of historic and forecast OPEX
2 Review of historic and forecast CAPEX 3 Value of Assets in TSOrsquosDSOrsquos RAB
4 Rate of Return and 5Inflation
6 Depreciation 7 Reporting and Incentives
Legal framework
The Department of Communications Climate Action and Environment (DCCAE)
is the lead government department (or ministry) with responsibility for energy policy In the natural gas sector the
Department determines policy in relation to security of energy supply and the
functioning of the market The Department is responsible for transposing EU gas
directives into national law and is responsible for financial oversight and corporate governance of state-owned
energy companies
The Commission for Regulation of Utilities is the independent economic regulator for
the natural gas electricity and water sectors in Ireland
Under Section 10A of the Gas Act 1976 as amended (the lsquoActrsquo) the CRU sets the tariffs
and the allowed revenue for the TSO
The Competition and Consumer Protection Commission is the government body
The Department of Communications Climate Action and Environment (DCCAE) is the lead
government department (or ministry) with responsibility for energy policy The
Department must ensure that Irish energy policy and legislation are in line with European
law It is within its remit to formulate and implement policy and legislation on the
liberalisation and regulation of the electricity markets
The Commission for Regulation of Utilities is the independent economic regulator for the natural gas electricity and water sectors in
Ireland
The CRUrsquos Legislative Basis for setting charges ndash
under Section 35 of the Electricity Regulation Act 1999 (ldquothe Actrdquo) the CRU approves
charges for the use of the electricity transmissiondistribution system in Ireland In
accordance with Section 35 of the Act the CRUrsquos Price Review decisions outline the
Ref C20-IRB-54-03
CEER Report on Regulatory Frameworks for European Energy Networks 2020
64156
responsible for enforcing Irish and European competition law in Ireland Generally it looks to the CRU (there is a Memorandum of Understanding between the two) for matters relating to the electricity and natural gas sectors
revenue that the TSO TAO DSO will be allowed to recover from customers during a Price Review Period Section 36 of the Act
states that the TSODSOrsquos statement of charges prepared in accordance with Section 35 must be submitted to the CRU for approval
and will not take effect until approved by the CRU
The Competition and Consumer Protection
Commission is the government body responsible for enforcing Irish and European competition law in Ireland Generally it looks
to the CRU (there is a Memorandum of Understanding between the two) for matters
relating to the electricity and natural gas sectors
Rate
of
retu
rn
Type of WACC WACC for the period 2017 ndash 2022 is 463
pre-tax real The CRU decided that a further aiming up allowance was not
required
WACC for the period 2016 ndash 2020 is made up of a baseline WACC plus an aiming up
allowance
The WACC for the TSO TAO and DSO is set at 495 (real pre-tax)
Determination of the rate of
return on equity
The CAPM methodology is used to calculate the cost of equity using the formula
119896119890 = 119903119891 + 120573 times (119903119898 minus 119903119891) where 119896119890 is the expected rate of return for the risky asset
119903119891 is the rate of return on a lsquorisk-freersquo asset (the ldquorisk-free raterdquo or ldquoRFRrdquo) 120573 is the lsquobetarsquo factor which is correlation of the return on the risk asset with the expected returns on a
diversified portfolio of all investable assets
and 119903119898 is the expected rate of return on a market value-weighted portfolio of all assets (the lsquomarket portfoliorsquo)
The term 119903119898 minus 119903119891 in the CAPM is referred to as the market risk premium (ldquoMRPrdquo)
Rate of return on equity
before taxes Cost of equity (pre-tax) 722
Cost of equity (pre-tax) ndash high 799 Low 562
Point Estimate 663
Use of rate of return
The Regulatory Asset Base (RAB) is the base to which the rate-of-return is applied when determining the return on capital
Reg
ula
tory
as
se
t b
ase
Components of RAB
Fixed assets assets under construction
Regulatory asset value
Replacement cost approach Historic cost indexed to present value using inflation
RAB adjustments
RAB adjusted for disposals
Assets are added to the RABs as costs are incurred not on the date of commissioning
The network companies receive a return on the assets from the middle of the
year in which the costs are incurred rather than when the asset is commissioned Assets which have been added to the RAB
but have not been energised within 5 years (except in the case where the
programme of work was scheduled to be longer than 5 years or where the SO can
satisfactorily show that the delay is beyond its control) will be temporarily removed or
ldquopausedrdquo from the RAB (with all return and depreciation paused) until the point at which
the asset can be energised and utilised
Dep
re-
cia
tio
ns Method Straight line
Depreciation ratio
Depends on asset category
Consideration Part of the examined controllable costs
Ref C20-IRB-54-03
CEER Report on Regulatory Frameworks for European Energy Networks 2020
65156
Introduction The Commission for Regulation of Utilities (CRU) is the independent body responsible for regulating the natural gas and electricity sectors in Ireland Part of its responsibilities involves regulating the level of revenue which the monopoly system operators can recover from its customers to cover its costs The electricity and gas networks in Ireland are described as ldquonatural monopoliesrdquo as the nature of it is that it would be inefficient to develop duplicate sets of wires and pipes to service customers Given the relatively small size of Ireland it would also be inefficient to break the current geographical area of the networks into smaller sections managed by individual DSOsTSOs although this is possible in larger jurisdictionsnetworks Gas Gas Networks Ireland (GNI) is the gas system owner and operator in Ireland GNI owns and operates both the Transmission Network and Distribution Network Companies must hold a licence issued by the CRU to distribute electricity or gas through the energy network The CRU is responsible for ensuring that customers and network users receive value for money while the network companies earn a fair return on their activities to make the necessary network investments Those investments go towards the efficient operation development and maintenance of the networks There are almost 700000 natural gas customers in Ireland Electricity The transmission business consists of EirGrid licensed by the CRU as the Transmission System Operator (TSO) and ESB acting through its ESB Networks business unit as the licensed Transmission Asset Owner (TAO) EirGrid is responsible for the operation and setting the maintenance and development policies of the transmission system while ESB Networks is responsible for maintaining the system and carrying out construction work for its development ESB Networks Ltd a wholly owned subsidiary of ESB is licensed by the CRU as Distribution System Operator (DSO) and is responsible for building maintaining and operating the distribution system ESB acting through its ESB Networks business unit is the licensed Distribution Asset Owner (DAO) and owns the distribution and transmission networks Determining the Revenue Cap The CRU uses a revenue-cap regulatory regime to determine the appropriate level of revenue required to allow the System Operators (SOs) to operate the networks in Ireland The CRU sets revenues ex-ante for a regulatory period of five years There are a number of key components required to estimate the level of revenue that will be sufficient to finance the SOs The building blocks of the regime are as follows Operational Expenditure The overall revenue figure for OPEX that is put in place by the CRU is the result of both rigorous scrutiny of the SOrsquos proposals and benchmarking The CRU applies both a top-down and bottom-up benchmarking approach to OPEX The objective of the bottom-up assessment is to develop a base year or stable run rate of normalised OPEX that represents the core historic lsquobusiness as usualrsquo OPEX (which can then be revised as to reflect additional items of core OPEX) forecast to be incurred in future years of the regulatory period There are two components to the top-down benchmarking assessment Firstly the SOs are benchmarked to comparable utility businesses to determine how expenditure compares to an efficiency benchmark for the relevant sector Secondly the CRU considers the degree of ongoing efficiency improvement or frontier shift that might be possible for the SO over the regulatory period
Ref C20-IRB-54-03
CEER Report on Regulatory Frameworks for European Energy Networks 2020
66156
Capital Expenditure In reviewing the SOrsquos CAPEX proposals the CRU analyses the proposals to determine whether they are appropriate fully justified whether they would deliver benefits to the customer and whether the estimated costs are realistic Determining the Appropriate Rate of Return The CRU sets the rate of return that the SO can earn on the efficiently incurred capital investments in its RAB This is known as the WACC This is essentially a weighted average of the cost of debt and the cost of equity The CRU sets a WACC that is used to derive a fair return on the capital investments made by the utility while also endeavouring to ensure that the SOs sits comfortably within an investment grade credit rating The CAPM is used to assess the cost of equity which is used to aid the determination of an appropriate WACC Uncertain Costs Uncertain costs are defined as those that could not reasonably be foreseen by the SOs The CRU decided that such costs should be dealt with on a case-by case basis In each case the SO would be expected to ensure that changes in OPEX or new CAPEX would take place in an efficient manner and this would be reflected in the allowance provided ndash that is there would not be an automatic pass-through of such costs Pass-through Items The price control model contains a provision for the pass-through of certain types of costs such as business rates that are deemed to lie outside the businessrsquos control In some cases pass-through items are subject to incentive mechanisms which shares savings between the SOs and the network customers for example in areas such as rates and safety K-factor Adjustments The CRU regulates the SOs through a form of revenue cap regulation which allows adjustments relating to one revenue control period to feed through into subsequent periods This adjustment mechanism is generally referred to as a k-factor mechanism The k-factor methodology is an adjustment used to allow for the fact that while the CRU approves a level of revenue to allow the SO to cover its costs over a regulatory period this level depends on assumptions about what happens over the course of that period but it may not necessarily reflect events as they occur The adjustment essentially corrects for these events by applying a correction to the annual revenue to be collected in subsequent periods Indexation The model used by the CRU uses a base allowable revenue which is indexed to take account of price inflation The index used should be the best reflection of the increases in prices faced by the utility such as wage inflation or materials inflation Also the index needs to be practical to implement robust and transparent In the recent review of allowable revenues for the SOs the CRU used Harmonised Index of Consumer Prices (HICP) The CRU accepts that no one index can precisely mirror the utilityrsquos input costs It is also accepted that the majority of the annual revenue which the utility receives covers depreciation and return on its asset base rather than operating costs
Ref C20-IRB-54-03
CEER Report on Regulatory Frameworks for European Energy Networks 2020
67156
Valuation of the RAB The SOsrsquo RAB is valued using a replacement cost approach The use of this approach has continued during the prevailing price control periods While it is recognised that there are advantages and disadvantages associated with each methodology the replacement cost approach was taken as it is more likely to result in the correct level of network investment The CRU notes that there are a number of variations of replacement cost that could be used The version used by the CRU uses the acquisition cost indexed with inflation as a proxy for the replacement cost Depreciation Method The CRU used the straight-line depreciation methodology in its recent price control decisions and for the prevailing price control decisions Determining the Allowed Revenue Combining all the component parts the CRU generates an overall revenue allowance for the SOs This revenue feeds through into setting the transmission and distribution tariffs for each tariff period ie 1 October to 30 September Outlook With regard to the gas Price Control (PC) the CRU is beginning work for the PC5 period keeping in mind issues such as movement towards a decarbonised economy and incentive mechanisms With regard to the electricity Price Review (PR) the CRU published in May 2018 its decision on reporting and incentives under PR4 The CRU introduced what the CRU considers improvements to the existing incentives and reporting regime through the decisions in that paper The aim is to provide the customer with better value for money and improve quality of services provided to the customer
Ref C20-IRB-54-03
CEER Report on Regulatory Frameworks for European Energy Networks 2020
68156
215 Italy Gas TSO Gas DSO Electricity TSO Electricity DSO
Ma
rke
t
str
uc
ture
Network operators
9 ~214 11 (1 SO) ~127
Network length
~35000 km ~264000 km ~73600 km ~1273000 km
Ownership Mainly private investors indirect public ownership
Mainly private and local public ownership
Mainly private investors indirect public ownership
Mainly private and local public ownership
Ge
ne
ral
fra
me
wo
rk
Authority ARERA
System
Cost-plus for CAPEX Price-cap for OPEX
Cost-plus for CAPEX Price-cap for OPEX
Standard cost approach for
centralised costs
Cost-plus for CAPEX Price-cap for OPEX
Cost-plus for CAPEX Price-cap for OPEX
Standard cost approach for smaller
DSOs
Period 4 years 2020-2023 6 years 2020-2025 4 years 2020-2023 4 years 2020-2023
Base year for next period
Transparency All data pursuant
Commission Regulation (EU)
2017460
Aggregated data at sectoral level published at beginning of
regulatory period
Aggregated data at sectoral level published at beginning of
regulatory period
Aggregated data at sectoral level published at beginning of
regulatory period
Main elements for
determining the revenue
cap
OPEX (updated with price-cap)
return on net RAB additional return for
incentives depreciation fuel
gas losses unaccounted-for
gas
OPEX (updated with price-cap) return on
net RAB and depreciation
OPEX (updated with price-cap)
return on net RAB additional return for
incentives depreciation
regulatory account ITC costsrevenues
OPEX (updated with price-cap)
return on net RAB additional return for
incentives depreciation
Legal framework
ARERA Res 1142019Rgas
ARERA Res 5702019Rgas
ARERA Res 5682019Reel
ARERA Res 5682019Reel
For WACC ARERA Res 5832015Rcom
Rate
of
retu
rn
Type of WACC Pre-tax real Determination of the rate of
return on equity
Sum of real risk-free rate (with a floor to 05) a country risk premium and a beta risk factor multiplied with an equity risk premium (determined as difference between Total
Market Return and risk-free rate)
119870119890119901119904119903119890119886119897 = 119898119886119909(
119877119865119901119899119900 119898119894119899 119886119897 minus 119894119904119903119901
1 + 119894119904119903119901
0005) + 120573119904119886119904119904119890119905 sdot [1 + (1 minus 119905119888119901) sdot
119892119901119904
1 minus 119892119901119904
] sdot (119879119872119877 minus 119898119886119909(119877119865119901
119899119900 119898119894119899 119886119897 minus 119894119904119903119901
1 + 119894119904119903119901
0005)) + 119862119877119875119901
Rate of return on equity
before taxes 54 58 53 57
Use of rate of return
Applied to the net value of RAB
Reg
ula
tory
as
se
t b
ase
Components of RAB
Fixed assets working capital assets under construction
Regulatory asset value
Historical cost re-valued for inflation net of depreciation
and grants
Both historical cost and standard unit
cost (sectoral average) depending on type (central vs local assets) Both are re-valued for
inflation and net of depreciation and
grants
Historical cost re-valued for inflation net of depreciation
and grants Investments prior to
2004 are considered as lump-sum with standard net value evolution and depreciation
Historical cost for bigger companies Standard unit cost (sectoral average)
for smaller companies Both are re-valued for
inflation and net of depreciation and
grants
RAB adjustments
New investments depreciation grants
New investments depreciation grants
New investments depreciation
New investments depreciation
Ref C20-IRB-54-03
CEER Report on Regulatory Frameworks for European Energy Networks 2020
69156
For standard costs changes in the
driver
grants For investment prior to
2004 standard evolution
grants For standard costs changes in
the driver
De
pre
cia
tio
ns Method Straight line
Depreciation ratio
Buildings 3 Pipelines 2 Stations 5
Metering 5-7 Other 10-20
Buildings 2-3 Pipelines 2 City gates 5
Metering 5-7 Other 14
Buildings 3 Lines 2
Stations 3 Metering 7
Other 5-20
Consideration Deducted from gross RAB to form net RAB
For 2020 the National Regulatory Authority was not able to author the descriptive part of this subchapter
Ref C20-IRB-54-03
CEER Report on Regulatory Frameworks for European Energy Networks 2020
70156
216 Latvia Gas TSO Gas DSO Electricity TSO Electricity DSO
Ma
rke
t
str
uc
ture
Network operators
1 1 1 11
Network length
1188 km 5206 km 5240 km 96500 km
Ownership Mainly private Mainly private Public ownership Public ownership
Ge
ne
ral
fra
me
wo
rk
Authority The Public Utilities Commission
System Revenue cap13
Period 2-5 years 14 2 years15
Not exceeding 5 years
2-5 years
Base year for next period
Tariffs are based on justified historical costs (some of the costs are justified based on historical 3-year average costs) and forecast of any other future costs
Transparency When submitting new tariff proposal overview with key indicators and figures is published on Regulatorrsquos website As a part of evaluation process public hearing takes place All
stakeholders are welcome to submit comments questions and proposals
Main elements for
determining the revenue
cap
OPEX + CAPEX (Depreciation + return on capital)
Legal framework
Energy Law Law on Regulators of Public Utilities Methodology for the Calculation of the Tariffs on the Natural Gas Transmission System Services Methodology for the Calculation of the Tariffs on the Natural Gas Distribution System Service
Electricity Market Law Law on Regulators of Public Utilities Methodology for the Calculation of the Tariffs on the Electricity Transmission System Services Methodology for the Calculation of the Tariffs on the Electricity Distribution System Services
Rate
of
retu
rn
Type of WACC
Pre-tax real
Determination of the rate of
return on equity
Return on equity Sum of a nominal risk-free rate16 country risk premium market risk
premium multiplied with a beta risk factor and a size premium which is applied only to small and micro-sized entities
Rate of return on equity
before taxes 681 676
Use of rate of return
WACC is applied to the value of RAB to calculate the return on capital which is a part of capital costs in tariff
Reg
ula
tory
as
se
t
ba
se
Components of RAB
Fixed assets intangible investment Does not include inventories and assets under construction
Regulatory asset value
Book value as per financial reports (taking into account asset revaluations carried out by the operator at replacement cost value)
RAB adjustments
The RAB is adjusted and set when the operator submits the tariff proposal during the period the tariff is in force there is no RAB adjustment taking place
Dep
re-
cia
tio
ns Method According to IAS and operators accounting policy (straight line is mostly applicable)
Depreciation ratio
According to the asset type Ratio between 1 and 20 eg gas pipelines 17-25 electricity lines 2-5 electricity transformation substations 25-125
Consideration Depreciation is a part of capital costs in the tariff
13 Methodology was set in July 2020 First tariff is in force from 1 January 14 According to methodology NRA can decide on a different length of regulatory and tariff period 15 According to methodology in tariff evaluating process NRA can extend the tariff period 16 To calculate real WACC the inflation rate is applied to the calculated nominal pre-tax WACC as a whole
Ref C20-IRB-54-03
CEER Report on Regulatory Frameworks for European Energy Networks 2020
71156
Introduction The unified multi-sector regulator in Latvia was established on 1 September 2001 The Public Utilities Commission (PUC) in accordance with the law ldquoOn Regulators of Public Utilitiesrdquo is an institutionally and functionally independent fully-fledged autonomous body governed by public law and independent in the implementation of its budget approved by law The regulator independently performs functions determined in law and within its competence independently adopts decisions and issues administrative acts which are binding for specific public utilities providers and users In accordance with the law ldquoOn Regulators of Public Utilitiesrdquo one of the regulatorrsquos main functions is to determine tariffs and the methodology for calculation of tariffs Tariff calculation methodologies of the different sectors are developed in accordance with the law ldquoOn Regulators of Public Utilitiesrdquo sectoral laws and other normative acts which are in force in the EU and Latvia All methodologies are regularly updated and renewed according to changes in the normative environment Corresponding with market opening (electricity 2015 gas 2017) former vertically integrated energy supply monopolies have been unbundled The task of the regulator is to ensure the availability of public services the availability of infrastructure to public service providers in all regulated sectors the correspondence of public service tariffsprices to their economic value as well as to promote competition transparency and availability of information Therefore tariffs are set by PUC Even though there are some differences in methodologies applied in tariff calculation between TSOs and DSOs and between the electricity and gas sectors the common goal remains the same In Latvia tariffs are currently set using revenue cap and cost-plus approach The tariff period may vary For gas the TSO methodology defines it as one-year period For electricity the TSO tariff periods do not exceed five years and the DSO TSO methodology for 2019 defines it as one-year period For other energy utilities a fixed period is not applied Furthermore PUC annually evaluates actual performance of TSOs and DSOs PUC has legal rights to request new tariff proposals from system operators in case of significant deviations from the set tariffs The system operator has similar rights to submit new tariff proposals if there is legal technical or economical reason for change Determining the Allowed Target Revenues The allowed revenues are calculated using the building-block approach The main parts of the allowed revenues are OPEX and CAPEX Capital costs consist of depreciation and return on capital which is calculated by applying a rate of return WACC determined by the regulator to the value of RAB The WACC is set yearly and the system operator must apply it when calculating the new tariff proposal that are planned to come into effect in the respective year From 1 January 2020 the applied WACC is pre-tax real Changes to the WACC calculation were made in 2019 and the main reason for introduction of real WACC was that the WACC calculation methodology is applied to different regulated sectors that have differing approaches to revaluation of regulated assets thus there was a need to create equal conditions for sectors where companies mainly use historic cost for regulated assets and sectors where companies regularly perform asset revaluation
Ref C20-IRB-54-03
CEER Report on Regulatory Frameworks for European Energy Networks 2020
72156
The general RAB definition used in all energy sector tariff calculation methodologies states that RAB consists of assets or part thereof used for providing the regulated service by the system operator The electricity transmission and distribution sectors as well as gas distribution sector exclude inventories from the RAB and assets under construction from RAB Instead they include the financing costs of maintaining the necessary inventory levels in the operating expenses For projects of common interest the costs of assets under construction can be included in RAB only if such incentive is granted to this project according to the Article 13 of the Regulation (EU) No 3472013 Transparency When approving new tariffs an overview with key indicators and figures is published on PUCrsquos website Public hearings are organised Outlook There are further plans to develop the regulatory regime in Latvia A methodology for setting
electricity TSO and gas DSO tariffs is planned to be developed based on an incentive-based
revenue cap principle
Ref C20-IRB-54-03
CEER Report on Regulatory Frameworks for European Energy Networks 2020
73156
217 Lithuania Gas TSO Gas DSO Electricity TSO Electricity DSO
Ma
rke
t
str
uc
ture
Network operators
1 (AB Amber Grid) 5 1 (LITGRID AB) 5
Network length
2115 km 9068 km 7220 km 125498 km
Ownership State owned
State owned private investors
State owned State owned
private investors
Ge
ne
ral
fra
me
wo
rk
Authority National Energy Regulatory Council (NERC)
System Revenue Cap Price cap
Period
5 years (2019ndash2023)
5 years (2019ndash2023 for the main DSO)
5 years with 1 year of extension (2016-
2021)
5 years with 1 year of extension for the main DSO (2016-2021) and 5 years (for small DSOs
2020-2024)
Base year for next period
2024 2024 for the main
DSO 2022
2022 (for the main DSO)
and 2025(for small DSOs)
Transparency Decisions
Main elements for
determining the revenue
cap
TOTEX RAB WACC technical losses efficiency benchmark
TOTEX RAB WACC technical losses
Legal framework
The Law on Natural Gas of the Republic of Lithuania
The Law on Electricity of the Republic of Lithuania
Rate
of
retu
rn
Type of WACC Nominal pre-tax
Determination of rate of return on
equity
Return on equity Sum of a nominal risk-free rate and market risk premium multiplied with a beta risk factor
Rate of return on equity
before taxes Rate of return on equity = 547
For the main DSO
Rate of return on equity = 551
858=35+706072
For the main DSO
858=35+706072
Use of rate of return
WACC is used to calculate return on investment WACC is a multiplied with whole RAB
Reg
ula
tory
as
se
t b
ase
Components of RAB
Fixed assets
Regulatory asset value
Historical values euro287 m (2019)
Historical values euro247 m (2019)
Current value (for the main network elements (lines
cables transformers) which will be
depreciated until 2020) and historical value (for the rest of
asset) ndash euro350474 m (2019)
Historical value for 5 small DSOs For main DSO current value (for the main network elements
(lines cables transformers) which will be
depreciated until 2020) and historical value (for the rest of
asset) ndash euro1406228 m (2019)
RAB adjustments New investments and depreciation
New investments and depreciation
Ref C20-IRB-54-03
CEER Report on Regulatory Frameworks for European Energy Networks 2020
74156
De
pre
-
cia
tio
ns Method Straight-line depreciation
Depreciation ratio
133-25 143-25 143 - 25
Consideration Depreciation ratio depends on asset type All depreciation of regulated assets is integrated into revenues
Introduction Natural gas electricity transmission and distribution are regulated activities under the Law on Energy of the Republic of Lithuania Law on Electricity of the Republic of Lithuania and Law on Natural Gas of the Republic of Lithuania The performance of TSOs and DSOs are licensed and regulated by National Energy Regulatory Council (NERC) NERC approves the requirements for keeping records of regulated activities approves methodologies for the setting of state-regulated prices sets state-regulated prices and price caps and controls the application of state-regulated prices and rates Moreover NERC sets requirements for reliable transport of energy and quality of services and control compliance therewith and performs other functions laid down by legal acts TSOs and DSOs are responsible for the stability and reliability of the transmissiondistribution system They are also responsible for the provision of system services in the territory of the Republic of Lithuania operation maintenance management and development of interconnectors to other systems TSOs and DSOs shall ensure objective and non-discriminatory conditions for access to the system by network users DSOs provide electricitynatural gas distribution connectiondisconnection of the customers and guaranteed17 natural gas supply (only gas DSO) services TSOs provide electricitynatural gas distribution transit and balancing services Moreover the natural gas TSO also performs the LNG terminal funds administrator function
Main Principles of the Tariff Regulation The main methodologies on which tariffs for natural gas and electricity transmission and distribution are calculated have been approved by NERC That is the Methodology of Electricity Transmission Distribution and Public Supply Services and Public Price Cap Calculation Methodology of setting state-regulated prices for natural gas sector Methodology for Determining Income and Prices of State Regulated Natural Gas Activities and Methodology on Rate of Return on Investments (ROI) A five-year regulatory period applies for the natural gas and electricity transmission and distribution prices regulated by NERC The allowable income levels are calculated as the sum of economically based costs consisting of CAPEX (cost of depreciation (using straight line method) and ROI) OPEX (repair and maintenance administrative cost wages etc) taxes and technical losses The WACC of the natural gas and electricity TSOs and DSOs is calculated in accordance with the Methodology on Rate of Return on Investments where cost of debt (the entitys actual long-term borrowing costs limited by the market average) and equity risk premium (the sum of the equity risk premium of the country with the developed capital market (the US) and the additional market risk premium of Lithuania) are evaluated The equity risk premium calculated for the entire regulatory period and the cost of debt must be adjusted annually NERC uses WACC to calculate ROI as well as the discount rate in approving capital investments of TSOs and DSOs
17 Guaranteed natural gas supply means the supply of natural gas are guaranteed to customers through the
provision of services of public interest
Ref C20-IRB-54-03
CEER Report on Regulatory Frameworks for European Energy Networks 2020
75156
Making Adjustments During a Regulation Period In the natural gas sector a NERC decision allows regulated price caps to be adjusted once a year These are subject to the change in the inflation rate prices of imported natural gas taxes amount of natural gas or the requirements of legal acts regulating activities of natural gas network operators investments by natural gas undertakings as agreed with NERC or deviation by natural gas network operators from the indicators determined in methodologies for the calculation of price caps approved by the NERC In the electricity sector the regulated price caps are adjusted each year following the change of the inflation rate (OPEX) new investments depreciation and change of WACC (CAPEX) the electricity price (technical losses) and the ROI adjustment from previous periods The actual ROI in natural gas and electricity sectors is estimated after the first two years of the regulatory period and after the entire regulatory period Taking into account the income earned cost incurred and effectiveness of regulated activities The ROI may be increased due to the decisions of regulated companies related to the reorganisation or other factors decreasing OPEX accordingly 50 or 100 of the proved savings Regulatory Decision Process The process of setting transmission and distribution prices starts with the provision of data for establishing price caps NERC evaluates the data provided by TSOs and DSOs sets or corrects the price caps and approves them by NERC resolutions The TSOs and DSOs provide NERC with an application to approve specific transmission and distribution prices Having verified and determined that prices are not calculated breaching the requirements for setting prices laid down in methodologies and that are discriminating against customers andor are false NERC gives instructions to natural gas network operators in relation to the calculation of specific prices and tariffs Specific prices approved by NERC resolution are published by the TSODSO and NERC no later than one month before the prices enter into force Investments Each year each TSO provides NERC with the ten-year network development plan (TYNDP) ndash the strategic document which covers main investment projects for the following ten years Where a TSO does not execute an investment NERC shall require the TSO to execute the investments or oblige the TSO to accept a capital increase to finance the necessary investments and allow independent investors to participate in the capital NERC determines whether the national TYNDP is consistent with the non-binding TYNDP of ENTSOG and ENTSO-E From 2018 DSOs also have an obligation to prepare a ten-year network development renovation upgrading and investment plan Concerning the RAB TSOs and DSOs can only include those investments which are already implemented18 and approved by NERC NERCrsquos approval of the TYNDP does not mean the approval of the concrete projects thus projects have to be also approved individually An investment project is considered as an investment if it exceeds a certain value (35 million EUR for the TSO or 15 million EUR for a DSO in the electricity sector and 2 million EUR or 5 of the companyrsquos yearly investments (but not lower than 015 million EUR) in the natural gas sector) Otherwise investments are provided in the simplified manner ndash as part of a yearly investment plan Investment projects are based on technical justification financial justification and economic justification eg CBA and impact on regulated prices However there are some exemptions
18 An exception is applied to PCI projects as assets under construction of PCIs is also included into RAB
Ref C20-IRB-54-03
CEER Report on Regulatory Frameworks for European Energy Networks 2020
76156
in the evaluation process For example financial justification is not necessary for most projects which do not increase the transport of the energy and CBA is not required for the upgrade of depreciated assets The yearly investment plan is composed of the list of investments with a value lower than that of an investment project NERC can oblige a company to exclude particular investments from the yearly plan and present it as an investment project All investments included into yearly investment plan must be reasoned and have technical justification Moreover the report of the previous yearly investment plan has to be provided and all the changes of the values of each investment have to be justified compared to the approved plan Quality Regulation NERC sets the minimum levels of the reliability indicators for electricity and natural gas (DSO SAIDI SAIFI and TSO MAIFI AIT) for the regulatory period These levels are estimated as the average of actual numbers of previous regulatory period (not worse than set for the last regulatory period) in electricity sector and as the average of actual numbers of the last three years in natural gas sector Actual ROI of electricity transmission and distribution services must be reduced by 1 (for each reliability indicator worse from 5 to 10 than set by NERC) or 2 (for each reliability indicator worse more than 10 than set by NERC) WACC of natural gas transmission and distribution services must be increasedreduced by 0005 (for each reliability indicator betterworse from 10 to 15 than set by NERC) and 0010 (for each reliability indicator betterworse than 15 than set by NERC)
Ref C20-IRB-54-03
CEER Report on Regulatory Frameworks for European Energy Networks 2020
77156
218 Luxembourg Gas TSO Gas DSO Electricity TSO Electricity DSO
Ma
rke
t
str
uc
ture
Network operators
1 3 1 5
Network length
283 km 3058 km 154 km 10768 km
Ownership Mainly direct and indirect public ownership
Ge
ne
ral
fra
me
wo
rk
Authority Institut Luxembourgeois de Reacutegulation (ILR)
System Revenue cap incentive regulation
Period 4-year period current period 2017-2020 4-year period current period 2017-2020
Base year for next period
2019
Transparency Public consultation before the tariff methodology can be adopted Methodology published in official journal and on NRA website
Possibility to contest NRA decisions
Main elements for
determining the revenue
cap
Remuneration on RAB depreciation Controllable OPEX
Non-controllable OPEX
Remuneration on RAB depreciation Controllable OPEX
Non-controllable OPEX
Remuneration on RAB depreciation Controllable OPEX
Non-controllable OPEX Ancillary
services
Remuneration on RAB depreciation Controllable OPEX
Non-controllable OPEX
Legal framework
Law modified 1 August 2007 relative to the organisation of the natural gas market
E1613ILR E1614ILR
Law modified 1 August 2007 relative to the organisation of the electricity market
E1612ILR E1614ILR
Rate
of
retu
rn
Type of WACC Nominal pre-tax WACC
Determination of the rate of
return on equity
Sum of cost of debt and cost of equity For more details see explanations
Rate of return on equity
before taxes
For natural gas and electricity 612 = 05 (215+145) + (1 ndash 05) (215 + 07946 480)(1 ndash 3093)
Use of rate of return
Granted for self-financed assets in the RAB and for work in progress according with respect to the dispositions of E1612ILR and E1613ILR
Reg
ula
tory
as
se
t
ba
se
Components of RAB
Fixed assets containing production costs work in progress
Regulatory asset value
For assets since 2010 historical costs Before asset financed by own funds (max 50) historical costs re-evaluated with
published indexes Remaining part historical costs
RAB adjustments
Adjustments not foreseen in the method After activation new assets also enter the RAB
Dep
re-
cia
tio
ns Method Linear
Depreciation ratio
Depending on the asset type Useful lifetime 25-50 years for technical assets and constructions and 3-20 years for IT related fixed assets
Consideration Depreciation is fully included in the allowed revenues
Introduction The Luxembourgish electricity market has about 315000 consumers and had a total consumption of 66 TWh in 2018 The natural gas sector accounts for some 90000 consumers with a total consumption of 89 TWh in 2018 The National Regulatory Authority (NRA) is the Institut Luxembourgeois de Reacutegulation (ILR) It is ILRrsquos role to supervise the market functioning in both electricity and gas sectors as well as to ensure universal service in the interest of all consumers As part of these tasks ILR has the power to determine a tariff calculation methodology and to take decisions in matters for which
Ref C20-IRB-54-03
CEER Report on Regulatory Frameworks for European Energy Networks 2020
78156
the national law explicitly entitles ILR for The tariff calculation methodology as well as changes to the methodology can only be decided after a public consultation process 2017 was the first year in which all network tariffs in electricity were equalised among all network operators on a national level This development helps the consumer to better understand the tariffs and makes it easier for suppliers to form their supply prices Network operators on the other hand will redistribute among themselves the part of the revenues which are over- or underachieved due to the fact that their respective tariffs would be different without national tariffs For natural gas the network tariffs remain different for each DSO Determining Revenue Caps The tariff calculation methodology is set for periods of four years with the current period being from 2017 to 2020 In principle the methodologies for natural gas and for electricity are alike Deviations will be explicitly mentioned in this description The current approach is a revenue cap method On an annual basis the network operators submit their tariff proposal for the following year along with the final regulatory accounts of the previous year ILR evaluates the submitted documents and approves the tariffs when no objections remain The yearly review of the closed accounts from the previous year allows adjusting the maximum allowed revenue according to the real costs observed Differences are transferred to a regulatory account which can be included in the next tariff proposal The main categories of costs forming the maximum allowed revenue are RAB remuneration depreciation controllable OPEX specific pass-through quality factor and the regulatory account term Investments and Depreciation The current tariff methodology distinguishes between two categories of investments
bull Small investments of less than 1 million EUR in the electricity sector and less than 500000 EUR in the natural gas sector are counted among the ldquolotsrdquo (batch investments) and
bull Individual investment projects contains projects which do not fall under the ldquolotsrdquo anymore as well as all projects with a cross-border impact regardless of the investment cost
For assets in the ldquolotsrdquo category the administrative burdens are considerably lower than for individual investment projects They have to be classified according to the voltage level (for natural gas according to the level of pressure) and pre-defined asset categories The operator also has to note whether the costs are considered as replacement of infrastructure or new investments In addition the network operator has to submit to the Institute its procedures for standard investments This allows the Institute to verify the efficiency of the procedure Costs under this category enter RAB in the year they occurred For individual investment projects the system operator informs the Institute annually about the progress of each project and informs the Institute about projects for which it foresees the start of the works before the end of the following year Documentation to be submitted for new projects include a justification an analysis of alternatives and other options for the project a cost-benefit analysis the detailed costs an analysis of events that could delay the project or have an influence on the total costs of the project and an operational plan
Ref C20-IRB-54-03
CEER Report on Regulatory Frameworks for European Energy Networks 2020
79156
The tariff methodology provides the possibility to make adjustments to individual investment projects during the realisation phase in case of unforeseen events which cannot be influenced by the network operator The date of activation as well as the total costs of the project can be adjusted upon approval by the Institute provided that the system operator immediately notifies the Institute of such deviations The work in progress from the start of the project until the planned activation date communicated in the operational plan is remunerated by the WACC In case of delays of the project remuneration the tariff methodology allows a reduction or the annulation of the remuneration for the years in question A project enters the RAB based on historical costs and is depreciated on a straight-line basis over the useful lifetime defined in the tariff method Parts of an asset subsidised by public funds or financed by third parties are not included in the RAB Remuneration ndash WACC The WACC used for the current regulatory period is a nominal pre-tax remuneration The final rate of 612 is a combination of the cost of equity and the cost of debt with an equal weighting This gearing represents an efficient capital structure protecting the interests of the consumer as well as allowing the system operator to access capital markets at reasonable costs The cost of debt is the sum of a risk-free rate (RFR) and a debt premium (DP) The RFR is based on a mid-term view of long-term interest rates published by the European Central Bank for Luxembourg The DP is based on current spreads on debt issued by firms having similar activities The issues had at least an A- rating and 7 to 13 years remaining to maturity The cost of equity adds the product of the equity risk premium (ERP) and an equity beta to the RFR This sum is discounted with the company tax rate for Luxembourg The ERP value is based on a study by Dimson Staunton and Marsh in 2015 The equity beta was determined by asset betas for comparable companies with the Modigliani-Miller method Hence remuneration is the product of the year end value of RAB and WACC Controllable Costs Controllable costs are set at the beginning of the regulatory period based on the profit and loss account of the reference year These costs are adjusted for price index network expansion (length of the network and consumers connected to it) and efficiency For the subsequent years the set costs are carried forward taking into account the previously mentioned adjustment factors Controllable costs are mainly salaries administrative costs and other operating costs for which no specific pass-through is foreseen Specific Pass-through Costs and revenues eligible under this category are subject to the annual review of the maximum allowed revenues in the year X+1 During this review the costs estimated during the calculation of tariffs are adjusted for real costs The non-controllable costs can be subdivided into operating costs and additional remunerations (financial incentives)
Ref C20-IRB-54-03
CEER Report on Regulatory Frameworks for European Energy Networks 2020
80156
The first part of these costs contains human resource costs such as training costs old commitments concerning supplementary pensions and costs related to the evolution of salaries in addition to the evolution of the automatic indexation The next part of non-controllable costs is for taxes and contributions Costs eligible under technical operation include network losses the use of third-party infrastructure ancillary services preparatory studies revenues from other transmission or distribution services not accounted separately and revenues from participations of third parties in investment costs Costs linked to cooperation between network operators can be accepted for realising transnational cooperation projects with the aim to increase market integration as well as costs linked to common projects of network operators aiming at enhancing market functioning or increasing the efficiency of the management of distribution networks Finally research and development costs can be accepted under the conditions defined in the tariff methodology Additional remunerations (financial incentives) can be claimed by the network operator for specific tasks which were identified by the regulator as being of particular interest for the consumer for market functioning or to maintain security of supply Projects targeted by this measure include establishing equalised electricity and natural gas network tariffs on a national level setting up a remote monitoring system of the electricity network dissociating activities of supply and network operation for integrated companies with fewer than 100000 connected consumers and establishing a central data hub for specific energy information or for the implementation of network tariffs that improve the consumersrsquo participation in order to increase the efficiency of the usage of the electricity network among others Quality The current methodology has a specific component allowing the integration of a quality factor into the maximum allowed revenue Since this factor has been introduced for the first time at the start of the current regulatory period the aim is to gather reliable data on the quality of service of the network operators As a consequence during this monitoring period no financial implications are caused by this factor For electricity the evolution of the system average interruption duration index (SAIDI) is observed In case of a deterioration of this index the network operator in question needs to analyse the situation and deliver a specific report which explains the reasons for this development Such a report will be published For natural gas the quality factor does not apply for the current regulatory period Regulatory Account The annual review of the maximum allowed revenue allows to adjust some of the elements forming the estimated maximum allowed revenue (MAR) for real costs Indeed RAB remuneration work in progress remuneration depreciation quantity factor for controllable costs and specific pass-through items will be adjusted The reviewed MAR will then be compared to the revenues from approved tariffs of the concerned year Differences will be allocated to the regulatory account and can be used in the following tariff exercises Due to the evolutions and developments in the sector for example the roll-out of smart meters the development of e-mobility more active consumers and a bigger share of decentralised production the Institute has launched a study to work out possible directions for the future tariff structure Elements of this study will have an impact on the tariff methodology for the next regulatory period
Ref C20-IRB-54-03
CEER Report on Regulatory Frameworks for European Energy Networks 2020
81156
219 Netherlands Gas TSO Gas DSO Electricity TSO Electricity DSO
Ma
rke
t
str
uc
ture
Network operators
1 (GTS) 7 1 (TenneT) 7
Network length
12000 km 124000 km 21000 km 318000 km
Ownership State owned (public
by law)
Local public ownership (public by
law)
State owned (public by law)
Local public ownership (public
by law)
Ge
ne
ral
fra
me
wo
rk
Authority Authority for Consumers and Markets (ACM) (wwwacmnl)
System Incentive regulation Revenue cap
Period 3-5 years (currently 2017-2021)
Base year for next period
TBD
Transparency Method and tariff decisions Regulatory data Efficiency scores Quality of networks
Main elements for
determining the revenue
cap
TOTEX CPI cost efficiency
benchmark productivity change
WACC RAB
TOTEX CPI yardstick
productivity change WACC RAB
TOTEX CPI cost efficiency
benchmark productivity change
WACC RAB
TOTEX CPI yardstick
productivity change WACC RAB
quality incentive
Legal framework
Gaswet (Gas Act) Electriciteitswet 1998 (Electricity Act)
Rate
of
retu
rn
Type of WACC Real pre-tax
Determination of the rate of
return on equity
Sum of (1) risk-free rate and (2) equity risk premium beta Equity risk premium is based
on data in individual Eurozone countries over the period 1900-2015 (Dimson Marsh and Staunton database) An average of both the geometric and arithmetic average is taken
Multiplied by beta based on comparator group
Rate of return on equity
before taxes
67 in 2021 (calculated based on 502 after taxes and 25 tax rate 67 = (128+505074)075)
Use of rate of return
Real WACC is currently based on a 50 debt and 50 equity capital structure Real WACC is multiplied with the indexed RAB
Reg
ula
tory
as
se
t
ba
se
Components of RAB
Fixed assets and certain intangible assets (such as software) are included no working capital
Regulatory asset value
Indexed historical costs
RAB adjustments
Annual indexation (with CPI) Also adjustment for certain specific (expansionary)
investments
Annual indexation (with CPI) Also adjustment for certain specific (replacement) investments
Annual indexation (with CPI) Also adjustment for certain specific (expansionary)
investments
Annual indexation (with CPI)
Dep
re-
cia
tio
ns Method Straight line depreciation corrected for inflation (CPI) each year
Depreciation ratio
Most assets are depreciated over a period of 35 ndash 55 years
Consideration Depreciation is part of the total costs which are subject to an x-factor over the course of the regulatory period
Introduction The Transmission and Distribution System Operators (TSOs and DSOs) in electricity and gas are neutral market facilitators The Dutch Electricity Act and Gas Act specify what responsibilities the TSOs and DSOs have These responsibilities are linked to two domains First TSOs and DSOs are tasked with the transport and distribution of electricity and natural gas in an efficient safe and secure manner Second they are responsible for creating and maintaining connection points with other networks and consumers TSOs are also responsible for system operations Furthermore TSOs and DSOs have a responsibility to share all relevant
Ref C20-IRB-54-03
CEER Report on Regulatory Frameworks for European Energy Networks 2020
82156
information in order for consumers and producers to make efficient decisions Finally they have the task to ensure the safety of the networks The electricity grids and gas networks are natural monopolies where effective competition is restricted or does not exist at all They are also legal monopolies To ensure that network tariffs reflect what is normal in competitive circumstances and to stimulate operators to operate their networks as cost effectively as possible electricity and gas network operators are subject to regulation This regulatory task is performed by the Authority for Consumers and Markets (ACM) Historical Development Regulation by (the predecessor of) ACM began in 2002 with an incentive-based regulatory regime which is still in place to date Under this regime the revenues that network operators are allowed to earn within a certain period (regulatory period) is determined using a mathematical formula and fixed for the period This incentivises network operators to lower their costs in order to maintain or increase profits Regulatory Decision Process The process of setting allowed revenues starts with the publication of a method decision (valid for a period between three to five years) before the start of that regulatory period Method decisions are taken separately for GTS (the gas TSO) TenneT (the electricity TSO) combined for gas DSOs and also combined for electricity DSOs In these decisions ACM determines how the allowed or target revenue is calculated Soon after this ACM publishes the so-called x-factor decisions In these decisions the base level of revenue for the regulatory period and the annual tariff cut (this is the x-factor) are set For the electricity DSO a quality incentive is also set (the q-factor see below) X-factor decisions are made for each TSO and each DSO individually Finally during the regulatory period ACM publishes tariff decisions annually also individually for each TSO and DSO Tariff decisions take the relevant x-factor decision as a starting point and also account for further tariff corrections due to changes during a regulatory period court decisions etc Main Principles of the Tariff Regulation The most important principle is a revenueprice cap based on exogenous efficient cost level ACM incentivises TSOs and DSOs to operate efficiently by setting the revenue of the operators before the start of the regulatory period (ie an ex-ante revenue cap or price cap) The allowed or target revenue is set equal to the expected efficient costs If a system operator operates more efficiently than the cap it may keep the resulting profits On the other hand if it operates less efficiently it also has to take the resulting losses Because the efficient cost level is not only based on the network operatorrsquos own costs the regulation also gives incentives for efficiency That is because the efficient cost level is based on mostly exogenous data the network operator knows that in future periods it is able to profit from efficient choices today This gives the system operator an incentive to be efficient in both the short term and the long term For each regulatory period ACM renews the revenue or price cap to the actual efficient cost level If cost reductions lead to a lower efficient cost level consumers will benefit from these cost reductions in the period following these cost reductions In this way network operators earn a bonus for efficient operation and consumers profit from lower cost levels in the long run Hence the Dutch incentive regulation also ensures affordability of energy network services In order to ensure the safety and security of the network TSOs and DSOs have to invest in their networks and they need capital for that The incentive scheme parameters (like the WACC) are set such that network operators receive an appropriate return on their investment
Ref C20-IRB-54-03
CEER Report on Regulatory Frameworks for European Energy Networks 2020
83156
so that they are able to compensate their investors This return should match the return a company would get in a competitive market However whether or not a network operator actually receives this return will depend on the decisions the network operator makes The regulation is technology-neutral ie it facilitates efficient investments regardless of their nature Quality of Transport By way of a so-called q-factor ACM gives an incentive to the electricity DSOs to maintain an optimal quality standard If a DSO has fewer or shorter outages than the norm it will gain extra revenue through a positive q-factor If it has more or longer outages than the norm it will lose a share of its revenues through a negative q-factor For the gas DSOs there is no q-factor as no informative indicator for quality has been identified so far By law q-factors are not implemented for TSOs Quality maintenance for the TSOs and the gas DSOs is therefore safeguarded by the minimum requirements embedded in the Electricity Act the Gas Act and the technical conditions which are also set by ACM through separate procedures Q-factors are added to x-factors when setting allowed revenues so they have a cumulative effect The Regulatory Period The law allows for a regulatory period of three to five years The current period started on 1 January 2017 and runs until 31 December 2021 In the past periods of three years were often implemented The advantages of a shorter period are the flexibility to actualise the method more frequently and that the gap between ex-ante estimates and ex-post realisations is lower The main advantage of a longer period is more stability and certainty for network operators and customers In addition a longer period creates stronger efficiency incentives because the network operators will have a longer period in which they are able to profit from efficient operations X-factor Mechanism The mechanism of the x-factor works as follows ACM determines the base revenue on the basis of the realised costs and the static efficiency measures Then using parameters that estimate future cost trends ACM determines the level of the revenue at the end of the period The annual revenue then gradually evolves from the base level to the level at the end of the period ie the x-factor is equal to the annual change in revenue This means that the x-factor is a price differential rather than an efficiency target Determining the Regulatory Cost Base The cost of a network operator includes operational costs and capital costs The operational costs are determined on the basis of data from the network operators The capital costs include the return on investment and depreciation These are calculated by ACM based on investment data from network operators For all types of investments regulated depreciation periods are set in the regulation Periods vary between classes of assets ranging from 5 to 55 years The tariffs include an appropriate return which is based on a WACC-method This WACC gives an allowance for both the cost of debt and the cost of equity When setting the WACC ACM looks at the market return instead of the actual costs the network operators face By looking at the market return it is ensured that the return is no higher than what would be appropriate in a competitive environment The WACC (real pre-tax) is the same for all network operators because the reference group used to set the WACC is representative for all network operators For 2016 it was set at 45 for 2021 at 30 The method takes into account embedded debt This is not necessary for expansion investments so for these investments
Ref C20-IRB-54-03
CEER Report on Regulatory Frameworks for European Energy Networks 2020
84156
the WACC is set at 38 in 2016 and 30 in 2021 Since a real WACC is used the regulatory asset base is indexed For TSOs the expected costs of regular expansion investments during the regulatory period are added as additional capital costs The expected costs are set equal to the average costs for regular expansion investments of the three most recent years Operational cost for expansion investments are estimated at 1 of the investment expense
European directives stipulate that tariffs should reflect the actual costs incurred insofar they correspond to those of an efficient and structurally comparable network operator Since there is only one gas TSO and one electricity TSO in the Netherlands ACM determines the efficient costs for the TSOs by comparing them with other European TSOs in a cost efficiency benchmark When setting the efficient cost level for TSOs ACM also takes into account the dynamic efficiency This is the expected scope for improving cost efficiency resulting from technological and economic trends Lower costs because of such dynamic efficiency are passed on to consumers during the regulatory period in the form of lower tariffs Effectively the result of cost efficiency studies is used when historic actual cost are translated to allowed revenues for a future period
For DSOs so-called yardstick competition is used to determine the static efficiency Two yardsticks are set one for electricity DSOs and one for gas DSOs ACM sets yardsticks equal to the cost per unit of output based on the actual cost of the DSOs Each service that is billed separately by a DSO adds to the output where the national tariff code prescribes what can be billed and what not For incomparable types of costs (so-called regional differences) a correction is made on individual basis For DSOs the dynamic efficiency is equal to the geometric mean of the annual difference in the costsoutput ratio This figure is used to adjust the yardstick The so-determined efficient cost levels constitute the basis for the cost estimates used to set the allowed revenues for the upcoming period Making Adjustments During a Regulation Period For some cost estimates ACM is obliged to correct estimates annually and correct the allowed revenue accordingly There can also be other circumstances that may call for intermediate corrections (a) by court ruling (b) if it turns out that the decision was based on incomplete or incorrect data (c) if deviations between estimates and realisations are disproportional or (d) if the revenue is based on services that a network operator no longer provides For circumstances b-d it is up to ACM to decide if and how corrections will be made
Ref C20-IRB-54-03
CEER Report on Regulatory Frameworks for European Energy Networks 2020
85156
220 Northern Ireland Gas TSO Gas DSO Electricity TSO Electricity DSO
Ma
rke
t
str
uc
ture
Network operators
3 3 2 1
Network length ~430 km ~6000 km ~ 2200 km ~45000 km
Ownership public private public public
Ge
ne
ral
fra
me
wo
rk
Authority Northern Ireland Authority for Utility Regulation [known as Utility Regulator]
System Mixture Incentive regulation ndash revenue amp price
cap
Incentive regulation ndash revenue cap
Incentive regulation ndash revenue cap
Period 2017-2022 (5yrs) 2017-2023 (6yrs) 2015-2020 (5yrs) 2017-2024 (65yrs)
Base year for next period
TBD TBD TBD TBD
Transparency Regulatory reporting in place for all TSOs and DSOs Cost and Performance Reports
published annually or at least covering the price control period
Main elements for determining
the revenueprice
cap
1Review of historic and
forecast OPEX 2 Productivity 3 WACC and
4Inflation
1Review of historic and forecast OPEX
amp CAPEX 2 Efficiency Scores
3 Productivity 4WACC
5Inflation and 6Future Growth
1Review of historic and
forecast OPEX and CAPEX
2 Productivity 3 WACC and
4Inflation
1Review of historic and forecast OPEX amp
CAPEX 2 Efficiency Scores
3 Productivity 4WACC and
5Inflation
Legal framework
Gas (NI) Order 1996 Electricity (NI) Order 1992
Rate
of
retu
rn
Type of WACC For GNI (UK)
only pre-tax real WACC
Pre-tax as well as Post-tax real
WACCs
Pre-tax real WACC
Post-tax real WACC
Determination of the rate of
return on equity
The Capital Assets Pricing Model (CAPM) is used to calculate the cost of equity This method relates the cost of equity (Re) to the risk-free rate (Rf) the expected return on the market portfolio (Rm) and a business specific measure of investorsrsquo exposure to
systematic risk (Beta or β) using this formula Re = Rf + (Rm ndash Rf) x β
Rate of return on equity
before taxes
538 (real pre-tax)
66 (real pre-tax) 951 (real pre-
tax) 550 (real pre-tax)
Use of rate of return
The Regulatory Asset Base (RAB) is the base to which the rate-of-return is applied when determining the return on capital
Reg
ula
tory
as
se
t b
ase
Components of RAB
Fixed assets only Fixed assets plus Profile Adjustment
Fixed assets and pre-construction
work for investments
according to the ten-year
development plan
Fixed assets and assets under construction
Regulatory asset value
Historic cost indexed to present value using inflation
RAB adjustments
None
RAB developments during a regulatory period taken into
account subject to Uncertainty
Mechanism and actual outputs
Transfer of cost to the TAO upon construction
RAB developments during a regulatory
period are taken into account and lead to
changes of the regulatory asset base
Ref C20-IRB-54-03
CEER Report on Regulatory Frameworks for European Energy Networks 2020
86156
De
pre
cia
t-
ion
s
Method Straight line (with Electricity DSO kinked line)
Depreciation ratio
Depends on asset type
Consideration Part of the examined costs
Introduction The Northern Ireland Authority for Utility Regulation (otherwise known as the Utility Regulator [UR) is the independent non-ministerial government department responsible for regulating Northern Irelandrsquos electricity gas water and sewerage industries to promote the short and long-term interests of consumers The Utility Regulatorrsquos statutory objectives are to
bull Protect the short and long-term interests of electricity and gas consumers with regard to price and quality of service
bull Promote competition where appropriate in the generation transmission and supply of electricity and
bull Promote the development and maintenance of an economic and co-ordinated natural gas industry
The Utility Regulatorrsquos work involves
bull Issuing and maintaining licences for gas and electricity companies to operate in Northern Ireland
bull Making sure that these companies meet relevant legislation and licence obligations
bull Challenging these companies to keep the prices they charge as low as they can be
bull Encouraging regulated companies to be more efficient and responsive to customers
bull Working to encourage competition in the gas and electricity markets
bull Setting the standards of service which regulated companies provide to customers and
bull Acting as an adjudicator on certain customer complaints disputes and appeals In carrying out its work the Utility Regulator also takes account of the needs of vulnerable consumers The UR also aim to contribute to the promotion of sustainable development in exercising its duties Historical Development The electricity industry in Northern Ireland was privatised in 1992-1993 The industry is split by wholesale network (transmission and distribution) and supply The regulator ensures that each licensed activity is ring-fenced from other activities in the same group of companies All consumers have metered supply but more sophisticated meters and tariffs are used for industrial consumers than for households There are three transmission licences a distribution licence and also a market operator licence System Operator for Northern Ireland Limited (SONI) holds the TSO licence for Northern Ireland SONI also holds the market operator licence for Northern Ireland in conjunction with EirGrid A transmission licence is held by NIE Networks Limited in respect of ownership of the main transmission system A second is held by Moyle Interconnector Limited a subsidiary of Mutual Energy Limited (MEL) which owns the Moyle Interconnector assets linking the network to the GB system in Scotland
Ref C20-IRB-54-03
CEER Report on Regulatory Frameworks for European Energy Networks 2020
87156
NIE Networks also hold a distribution licence for their distribution system The Utility Regulator sets price limits for the monopolistic components of the electricity industry and ensures that end prices for consumers reflect efficient costs and reasonable levels of profitability The gas sector is split into three main areas transmission distribution and supply Gas transmission deals with the large high-pressure pipelines that convey gas to the distribution systems There are four transmission pipelines in Northern Ireland
bull SNIP (Scotland to Northern Ireland Pipeline) is 135 kilometres long and runs from Twynholm in Scotland to Ballylumford The SNIP is owned by Premier Transmission Limited which is part of the Mutual Energy Ltd group of companies
bull BGTP (Belfast Gas Transmission pipeline) is 26 kilometres long and is connected to the SNIP and to the North West Pipeline It also supplies gas to the Belfast distribution network The BGTP is owned by Belfast Gas Transmission Limited (BGTL) which is part of the Mutual Energy Ltd group of companies
bull NWP (North West Pipeline) is 112 kilometres long and runs from Carrickfergus to Coolkeeragh Power-station It is owned by GNI (UK) and
bull SNP (South North Pipeline) is 156 kilometres long and runs from Gormanstown in Co Meath to Carrickfergus where it links into the NWP It is also owned by GNI (UK)
Gas distribution deals with the medium and low-pressure gas mains that convey gas licenced areas within Northern Ireland There are three distribution licensed areas within Northern Ireland
bull Greater Belfast and Larne area - operated by Phoenix Natural Gas Limited (PNGL)
bull Ten Towns distribution area - operated by Firmus Energy (Distribution) Limited (FEDL) and
bull West distribution licensed area - operated by SGN Natural Gas Limited (SGN) The legislative framework that governs the energy industry in Northern Ireland includes
bull Energy (NI) Order 2003 httpwwwlegislationgovuknisi2003419contents
bull Electricity (NI) Order 1992 httpwwwlegislationgovuknisi1992231contents and
bull Gas (NI) Order 1996 httpwwwlegislationgovuknisi1996275contents Current Regulatory Frameworks Electricity Transmission In Northern Ireland the transmission system is owned by NIE Networks (the TAO) and operated by SONI (the TSO) who are certified under Article 9(9) arrangements of Directive 200972EC Both NIE Networks and SONI are part of wider corporate structures under the ownership of the Irish state government Moyle Interconnector Limited is also a certified TSO but this asset is operated and administered by SONI SONI is regulated on a revenue cap framework Controllable costs are set on an ex-ante basis with a WACC return for capital projects A 5050 mechanism exists for overunderspend on controllable costs SONI also earn a margin for performing a revenue collection function Certain non-controllable costs such as ancillary services are provided on a pass-through basis Mechanisms are also in place to provide additional revenue within period for unforeseen projects or pre-construction work associated with investments prescribed by the ten-year network development plan
Ref C20-IRB-54-03
CEER Report on Regulatory Frameworks for European Energy Networks 2020
88156
Typically speaking no catch-up efficiency target is applied to the TSO Rather a general productivity challenge is applied alongside an assessment of real price effects As the company bears no volume risk tariffs are adjusted via a correction (K-factor) adjustment on a t-2 basis to account for any overunder recovery of revenue It is our intention to move the TSO to a more incentive based regulatory framework going forward (See httpswwwuregnigovukpublicationssoni-price-control-final-approach) For the transmission asset owner (NIE Networks) the Utility Regulatorrsquos methodology for setting an efficient transmission allowance follows a traditional RPI +- X regulatory approach NIE Networks transmission allowance is set alongside their distribution price control This is discussed further in the distribution section below The regulated electricity revenue entitlements for network and market costs for 2019 - 20 can be found at the following link httpswwwuregnigovuksitesuregnifilesmediafilesRegulated20Entitlement20Values20201920202020-20Information20Notepdf Gas Transmission The regulatory framework for gas transmission is different depending on the TSO All the TSOs are certified under the full ownership unbundled arrangements Premier Transmission Limited (PTL) and Belfast Gas Transmission Limited (BGTL) are part of the Mutual Energy Limited (MEL) group These companies are all subject to a lsquomutualisedrsquo model In this model NI gas consumers absorb deviations between forecast and actual operating costs in return for an absence of equity fundingreturns from the business These TSOs have a lsquoshadowrsquo price control which sets out expectations While they carry no cost risk the licence holders have a reputational incentive to manage costs effectively in line with the lsquoshadowrsquo allowance GNI (UK) is a subsidiary of Gas Networks Ireland which is part of Ervia a utility infrastructure company owned by the government of the Republic of Ireland GNI (UK) is subject to a traditional lsquorevenue caprsquo framework In the case of GNI (UK) the allowance for controllable OPEX represents a fixed amount the licence holder will recover from consumers Any variation between this allowance and actual controllable OPEX is absorbed (or retained) by the licence holder In this instance the consumer is exposed to no operating cost risk Instead this risk is borne entirely by the shareholders of the licence holder and is reflected in the rate of return This provides the licence holder with a very clear incentive to effectively manage costs For all three TSOs the only spend they incur is OPEX Any maintenance or replacement costs are treated as operational spend GNI (UK) earn a WACC return on their initial pipeline construction costs PTL and BGTL networks are entirely debt financed by way of bond repayments A description of the gas TSO price control methodology for the period 2017-2022 is published under the following link httpswwwuregnigovukpublicationsgt17-final-determination-main-document Electricity Distribution The current 6th regulatory period for the electricity DSO has been effective since 1 October 2017 and lasts until 2024 (a six-and-a-half year period) The regulatory framework that was adopted for this period follows a traditional RPI +- X revenue cap approach
Ref C20-IRB-54-03
CEER Report on Regulatory Frameworks for European Energy Networks 2020
89156
OPEX costs are subject to efficiency challenge via yardstick benchmark modelling against GB comparators This modelling takes account of local circumstances in the form of special factors and regional price adjustments for labour costs Revenues are inflated by RPI inflation but subject to real price effect considerations and a general productivity challenge Capital costs are treated in three ways
bull Investment for which an ex-ante allowance is included in the determination
bull Investment carried out under the re-opener mechanism where costs will be determined at a later date when the need for the project has been confirmed and
bull Investment which is subject to a volume driver Capital costs earn a WACC return of 318 (real) though this is subject to adjustment following refinancing There are various uncertainty mechanisms in place and a variety of incentives based on delivery of key outputs aligned with cost control A new Reliability Incentive was introduced with annual financial incentives and penalties around performance on customer minutes lost The final determination can be found at httpswwwuregnigovukrp6-final-determination Gas Distribution The current price control for the three gas DSOs in Northern Ireland began on 1 January 2017 for a period of six years Phoenix and Firmus both have a revenue cap while SGN has a price cap in order to provide it with an incentive to outperform on volumes as it develops its distribution network The focus of the price control is to grow and develop the network to maximise the number of connections possible of which incentives are in place to achieve this The price control is based on a standard RPI-X framework Efficient operational costs are set by virtue of top-down benchmarking a bottom-up build-up of costs and application of real price effects and productivity challenge Capital costs are challenged on a similar basis An innovation fund is available if DSOs can make an economic case and justify why the cost should be funded by customers Various uncertainty mechanisms are also available to reflect the actual outcomes of performance and provide flexibility on workload priorities The description of this regulatory period for gas DSOs is published under the following link httpswwwuregnigovukpublicationsgd17-final-determination-final
Ref C20-IRB-54-03
CEER Report on Regulatory Frameworks for European Energy Networks 2020
90156
221 Norway Gas TSO Gas DSO Electricity TSO Electricity DSO
Ma
rke
t
str
uc
ture
Network operators NA 2 1 128
Network length NA 740 km ~12500 km
~102500 km ndash HV ~204700 km ndash LV (le 1kV)
Ownership NA
Public and private ownership
State ownership Mainly municipality
local public ownership
Ge
ne
ral
fra
me
wo
rk
Authority NA NVE-RME
System Under development Incentive regulation Revenue cap
Period Under development
Data is updated every year important factors (ie WACC-model) fixed for five years
Base year for next period
Under development Annual regulation based on cost data two
years back
Transparency Under development
Full transparency - Revenue caps efficiency scores all data script for calculation in R
Main elements for determining the
revenue cap NA Under development
Controllable and pass-through cost TOTEX efficiency benchmark Averagely efficient
company receives RoR
Legal framework Act on common rules for the internal market for gas with underlying
regulations
Energy Act with underlying regulations accounting legislation
Rate
of
retu
rn Type of WACC Under development Nominal pre-tax
Determination of the rate of return on
equity Under development CAPM
Rate of return on equity before taxes
Under development (Rf + Infl + βe x MP)(1 - t) = (25 + 233 +
0875 500)(1-024) = 12 19
Use of rate of return WACC is multiplied with RAB
Reg
ula
tory
as
se
t b
as
e
Components of RAB
Book values from financial statement adjusted with 1 working capital premium assets under
construction and grants funded assets are excluded
Regulatory asset value
Book values from financial statements
RAB adjustments BV + 1 working capital premium
Dep
re-
cia
tio
n
s
Method Linear depreciations from financial statements
Depreciation ratio Depending on asset type must be approved by accountant
Consideration Part of examined controllable costs
Introduction The present Norwegian Energy Act came into force on 1 January 1991 The Act unbundled the activities of generation and supply which can operate in competitive markets from transmission and distribution of electricity In order to achieve a competitive and efficient electricity market The Norwegian Water Resources and Energy Directorate (NVE-RME) regulates transmission and distribution system operators with a combination of direct regulation and incentive based economic revenue cap regulation The goal of the regulation is to promote efficient transmission and distribution of energy Norway has 128 electricity Distribution System Operators (DSOs) Statnett is the only Transmission System Operator (TSO) Norway does not have gas TSOs
19 Rf = Risk free rate Infl = Inflation βe = Equity Beta MP = Market premium t = tax rate
Ref C20-IRB-54-03
CEER Report on Regulatory Frameworks for European Energy Networks 2020
91156
The electricity system operators set their tariffs based on the allowed revenue (AR) 119860119877119905 = 119877119862119905 + 119875119879119905 + 119879119862119905 + 119877amp119863119905 minus 119862119864119873119878119905 + 119879119871119905 The allowed revenue is the sum of the revenue cap (RC) pass-through costs related to property tax (PT) and tariff costs to other regulated networks (TC) Approved RampD costs are also included To remove the time lag (TL) in the cost of capital recovery the difference between actual cost of capital (depreciations and return on assets) in the revenue cap year and the cost base from two years previously is included Furthermore any Costs of Energy Not Supplied (CENS) during the year are deducted from the allowed revenue CENS is a measure of the calculated value of lost load for the customers The CENS arrangement is a quality regulation providing an incentive for network operators to maintain their assets properly and to ensure necessary investments at a socioeconomically efficient level in order to avoid power outages The revenue compliance is subject to regulatory control Excess or deficit revenue for a given year is calculated as the difference between actual collected revenues and allowed revenues in a year Actual collected revenues include tariff revenues from customers congestion revenue and revenue from system operations NVE-RME decides an excessdeficit revenue balance every year The decision is made approximately one year after the RC is set when the companies have reported their actual costs in the RC-year The balance is to be adjusted towards zero over time through tariff changes Excess revenues must be reimbursed to the customers while deficit revenues may be recovered According to the economic regulation of network companies transactions within a vertically integrated company and transactions between the network company and other companies in the same group needs to be based on competitive market conditions Furthermore the national regulator may impose a specific method for cost allocation between areas of operation in vertically integrated companies NVE-RME audits annually a selection of the companies to reveal any cross-subsidies
Historical Development In the first regulatory period from 1993-1996 NVE-RME used rate-of-return regulation for the industry During this period NVE-RME prepared the implementation of a framework for revenue cap regulation that would give better incentives for cost efficiency than possible in rate-of-return regulation NVE-RME developed systems to collect data from the DSOs and a revenue cap model that included the use of DEA to set general as well as company specific efficiency targets In the second regulatory period 1997-2001 NVE-RME introduced a revenue cap model with a cost base that was based on the DSOrsquos own historical cost The regulatory rate of return was fixed at 83 The cost base was adjusted yearly to calculate revenue caps the cost base was increased by CPI and reduced by an efficiency target X The general efficiency target was 15 and individual efficiency targets were between 0 and 3 The revenue caps were also adjusted for new investments with a factor deducted from growth in distributed electricity In this period the incentives for cost efficiency increased from the first regulatory period To avoid incentives to reduce costs resulting in low quality of service NVE-RME introduced an incentive mechanism for quality of service in 2001 see Langset (2002)20
20 Langset T (2002) Quality Dependent Revenues ndash Incentive Regulation of Quality of Supply Energy amp
Environment 13(4) 749-61
Ref C20-IRB-54-03
CEER Report on Regulatory Frameworks for European Energy Networks 2020
92156
CENS was calculated based on price per MWh for energy that was not delivered due to outages An expected value of CENS was added to the revenue caps and actual value of CENS was deducted from allowed revenue when this was settled The regulatory model in the third regulatory period from 2002-2006 was similar to the second period The cost base was updated and based on data from 1996 to 1999 and minor changes were introduced to the benchmarking models The CENS model was expanded to differ between more customer groups (from two to six) and adapted to implicitly take into account heterogeneity among DSOs Similar to the second regulatory period the decoupling of the DSOsrsquo costs and revenues due to the use of up to ten-year-old data gave strong incentives for efficiency At the same time the time delay between costs and revenues created weak incentives for investments It also took time before efficiency improvements resulted in lower tariffs for end users In the fourth regulatory period from 2007-2012 NVE-RME introduced major changes to the model To address the weaknesses described above the CPI-X model was abandoned It was replaced with a hybrid model where each DSOrsquos share of the revenue cap was decided by a combination of the DSOrsquos own costs (cost plus) whereas the rest was decided by a cost norm This cost norm was estimated through benchmarking methods based on the costs of other comparable DSOs (yardstick competition) The cost base in the model was no longer fixed for the period but updated yearly This contributed to increase incentives for investments After two regulatory periods with strong incentives for cost efficiency the change was partly motivated to strengthen the incentives for investments Around 2005 increasing investments were expected in the industry A large part of the asset base had become rather old and there was need for reinvestments Reducing the lag of the cost base increased the incentives to invest During this period the incentives for quality were strengthened through expansion of the CENS arrangement The incentives for cost efficiency were still strong but these incentives were applied differently than in traditional CPI-X regulation The cost norms were calibrated so that on the industry level the sum of cost norms was equal to the sum of cost bases With this mechanism the industry as a whole got the regulatory rate of return and also DSOs with average efficiency DSOs that were more efficient than the average earned a higher return and the opposite outcome for the less efficient Since this model was applied yearly the implication was that the DSOs ldquocompetedrdquo for their share of the total revenue cap In the model DSOs that lagged behind the average performance of DSOs would experience a lower rate of return This mechanism incentivised efficiency and at the same time reduced time lag between costs and revenues Another feature of this period was the incorporation of environmental variables (Z-factors) in the cost norm This was important in order to increase the credibility of the model These Z-factors were included as outputs in the model In 2007 the DEA-model had one input (total costs) and nine output variables Five of these were related to network structure and four were Z-factors
The fifth regulatory period started in 2013 The main model framework from 2007 was maintained but several elements in the model were improved Disincentives for mergers and acquisitions were removed and incentives for participation in research development and pilot projects were strengthened The number of outputs in DEA were reduced and the method for adjusting for Z-factors was revised see Amundsveen et al (2014)21 Already in 2010 the Z-
21 Amundsveen Kvile Kordahl and Langset (2014) Second Stage Adjustment for Firm Heterogeneity In DEA A
Novel Approach Used in Regulation of Norwegian Electricity DSOs in Recent Developments in Data Envelopment Analyses and its Applications Proceedings of the 12th International Conference of DEA
Ref C20-IRB-54-03
CEER Report on Regulatory Frameworks for European Energy Networks 2020
93156
factors were moved to a second stage regression but in 2013 the changes were applied in order to meet some of the criticism towards this approach Also the model for calculating the regulatory rate of return (based on a weighted average cost of capital model) was updated to ensure the DSOsrsquo ability to be able to earn a reasonable rate of return on their assets (Langset and Syvertsen 2015)22 Determining the Revenue Caps NVE-RME regulates the network companies using an incentive-based revenue cap (RC) model The RC is set annually based on a formula of 40 cost recovery and 60 cost norm resulting from benchmarking models There is a two-year lag in the cost data The model is applied to operators of all electricity networks Statnett is benchmarked together with other European TSOs while the other network operators are benchmarked in models based on DEA There are separate models for local and regional distribution NVE-RME announces the RC for the coming year in November and the network companies set the tariffs accordingly In principle the only difference between the announced and the final RC for a year are the actual prices inflation and WACC that has to be estimated in the notification In addition to this any errors in the companiesrsquo cost or technical data discovered after the notification are corrected in the final RC Any changes in the rules and regulations will be subject to a public consultation implemented before the RC-year begins Changes in the methodologies not stated in the regulation are mainly subject to a consultation with affected parties but are also publicly available on NVE-RMErsquos website The RCs are calculated based on expected total costs using inflation-adjusted cost data from two years back The deviation between the expected total costs and the actual total costs of all companies in a year is included in the RC calculation two years later (eg the deviation between expected and actual costs for 2017 will be corrected in the RC for 2019) The total cost deviation is distributed among the companies using their share of the sectorrsquos total regulatory asset base This mechanism does not apply to the regulation of Statnett Efficiency Benchmarking NVE-RME implements two different efficiency assessment models for determining the revenue caps for DSOs in the local and regional distribution grids Both models follow the same three stage procedure 1 DEA ndash Compares efficiency solving specific tasks 2 Z-factor correction - Adjusts DEA scores from the 1st stage for differences in environmental factors Efficiency may increase or decrease dependent on target units Z-factors 3 Calibration - Addition to cost norm such that total industry cost base equals cost norm Ensures that averagely efficient companies receive a return equal to the NVE-RME-interest The inputs in the first and second stage of the calculation are essentially what differ in the two models The differences are depicted in the table below
22 Langset amp Syvertsen (2015) The WACC Model in the Regulation of the Norwegian Electricity Network
Operators ICER Chronicle ed
Ref C20-IRB-54-03
CEER Report on Regulatory Frameworks for European Energy Networks 2020
94156
TOTEX is used in a single input cost-minimising DEA assuming constant returns to scale Also the weighted values used as outputs in the regional distribution grid capture a lot of the differences between companies This is one of the important reasons the second stage analysis includes more variables of the local distribution compared to the regional distribution For readers interested in calculation specifics see our script (in R) for calculation on httpsgithubcomNVEIRiR General Sectoral Productivity Factor and Price Development NVE-RME does not implement any productivity factor As described above the total revenue cap for the industry is given Since the model is updated annually there are strong incentives for each DSO to reduce costs In order to maintain a given level of rate of return a DSO has to keep up with the development of the ldquoaverage DSOrdquo The large number of DSOs limits the effects of cartelisation National Specificities Some smaller DSOs are exempted from the regular RC-model described above These companies are compared to their own historical average cost Outlook NVE-RME currently has no plans on major model revisions The method for determining the WACC was subject to a public hearing in 2018 The WACC-model is fixed for a minimum of five years and was last revised in 2013
23 Including depreciations on grants funded assets Estimated using Principal Component Analysis
Local distribution Regional Distribution
Stage 1 - DEA
Input Outputs Input Outputs
1) TOTEX = OPEX
+ Depreciations23 + Return on BV
+ Cost of Network Losses
+ CENS
1) Number of customers
2) Length of HV network KM
3) Number of substations
1) TOTEX = OPEX
+ Depreciations + Return on BV
+ CENS
1) Overhead lines weighted
value 2) Ground
cables weighted value
3) Sea cables weighted value 4) Substations weighted value
Stage 2 Z-factor correction
Z-factors Z-factors
Mountain environments Forest environments
Coastal environments
Cold environments
City (share of grid laid as underground cables)
Forest environments (share of overhead lines in coniferous forest)
Ref C20-IRB-54-03
CEER Report on Regulatory Frameworks for European Energy Networks 2020
95156
222 Poland Gas TSO Gas DSO Electricity TSO Electricity DSO
Ma
rke
t
str
uc
ture
Network operators
1 entity 1 main entity and 52
local DSOs 1 entity 184 local DSOs
Network length ~11611 km24 ~138975 km25 ~15000 km ~815000 km
Ownership State-owned
Indirect state-owned public and
private State-owned
Public partly public and private
Ge
ne
ral
fra
me
wo
rk
Authority The President of Energy Regulatory Office (URE) (wwwuregovpl)
System
Cost of service with elements of revenue cap
Cost of service with elements of revenue cap
Mixed (Revenue cap with elements of incentive-based
regulation and elements of quality
regulation)
Period Calendar year 12 months Calendar year 2016-2020
Base year for next period
Mainly a year preceding the year of tariff submission for approval for which audited
financial statement is available
Mainly a year preceding the year of tariff submission
for approval for which audited
financial statement is available
The basis will be set when
developing the assumptions for the
next regulatory period
Transparency The approved tariffs and guidelines on WACC issued by the President of URE For TSO also publication of information
according to article 29 and 30 of NC TAR26
The approved tariffs and guidelines on WACC issued by the President of
URE
Tariffs assumptions on benchmarking
models and WACC guidelines
Main elements for determining
the revenue cap
Justified operating expenditures
depreciation local taxes and other fees cost of gas
losses and return on capital employed
Justified operating expenditures
depreciation local taxes and other fees cost of gas
losses pass-through costs and return on capital
employed
RoC + OPEX depreciation
property taxes losses costs of maintaining the system-related
standards of quality and
reliability of current electricity supplies
RoC (determined also by quality
regulation factors) + OPEX
depreciation property taxes
losses and pass-through costs
Legal framework
Energy Law Act and regulations of the Minister of Energy
EU law
Rate
of
retu
rn
Type of WACC Pre-tax nominal Pre-tax nominal
Determination of the rate of
return on equity
Cequity pre-tax=(Risk-free rate + βequity equity risk premium)(1-corporate tax rate)
(Risk-free rate + βequity equity risk premium)(1-corporate tax rate)
Rate of return on equity
before taxes
726027 =(3187+05986450)(1-
19) 6754=(2430+0724420)(1-19)28
Use of rate of return
In allowed revenue we include RoC = WACC RAB
24 High-methane and low-methane natural gas transmission network (including SGT transit pipeline) 25 For main entity high-methane and low-methane natural gas network 26 Commission Regulation (EU) 2017460 of 16 March 2017 establishing a network code on harmonised
transmission tariff structures for gas (OJ L 72 of 17 March 2017 p 29) 27 Value included in the calculation of gas TSO tariff for 2020 28 The risk-free rate is updated every three months both for gas and electricity companies
Ref C20-IRB-54-03
CEER Report on Regulatory Frameworks for European Energy Networks 2020
96156
Re
gu
lato
ry a
sse
t
ba
se
Components of RAB Tangible fixed assets in use and intangible
assets deducted by assets financed by subsidy
Fixed assets assets under construction intangible assets
Regulatory asset value
Set for every tariff Re-evaluated assets
RAB adjustments
Adjustments of return of capital included in allowed revenue are possible during tariff
calculation Annually Annually
De
pre
cia
tio
ns
Method Straight-line Straight-line
Depreciation ratio
Economic useful life is set according to requirements of accountancy law for adequate groups of fixed assets Approximate EUL for compressors equals 5 years measuring stations 15 years pipelines and buildings 40 years
For transformers and substations economic useful life is 30-40 years For new investments an average depreciation value of all investments (eg transformers substations IT systems meters) equal to 4 is allowed
Consideration A component of allowed revenue
Regulatory Framework The President of URE29 is the head of a central body of government administration accountable for regulation of fuels and the energy economy Their competence referred to in article 23 of the Energy Law Act of 10 April 1997 embraces inter alia granting and revoking licences approving tariffs and controlling their application and the promotion of competition as well The President of URE regulates activities of energy enterprises with the aim of balancing interests of these companies and customers The legal framework for regulation of transmission and distribution of gaseous fuels and electricity is constituted by Energy Law Act and regulations of the Minister of the EconomyEnergy on detailed terms for structuring and calculation of tariffs and on detailed terms of the transmission systems operation Network Tariffs ndash Allowed Revenue Components Energy enterprises dealing with transmission and distribution (both of gas and electricity) are obliged to hold a licence and perform billing basing on tariffs approved by the President of URE According to article 47 of the Energy Law Act tariffs are set by energy enterprises and submitted for approval by the President of URE who approves the tariff or refuses it if they assess that the tariff has not been set in line with provisions of articles 44-46 thereof Generally gas transmission and distribution tariffs must cover justified costs of conducting the licensed activity (set ex-ante) and a justified return on capital employed Moreover the protection of the customerrsquos interest against unjustified level of prices and charges must be taken into account Allowed or target revenue in case of gas network tariffs consists of planned reasonable operating expenditures depreciation local taxes and other fees cost of gas losses and return on capital employed In the WACC calculation for 2017 and 2018 the notional gearing of 2575 and 3070 was applied respectively whereas before the year 2017 the actual one derived from the latest audited financial statement of the regulated entity According to the WACC setting methodology for gas system operators for years 2019-202330 the share of debt will increase annually by four percentage points starting from 34 in 2019
29 URE ndash Urząd Regulacji Energetyki (English Energy Regulatory Office) 30httpswwwuregovplplbiznestaryfy-zalozeniazalozenia-dla-kalkulacj-27834Pismo-Prezesa-Urzedu-
Regulacji-Energetyki-do-przedsiebiorstw-energetycznychhtml
Ref C20-IRB-54-03
CEER Report on Regulatory Frameworks for European Energy Networks 2020
97156
For electricity network companies allowed revenue consists of planned reasonable operating expenditures depreciation local taxes and other fees cost of losses return on capital employed and costs of maintaining the system-related standards of quality and reliability of current electricity supplies In WACC for electricity an equal ratio of debt to equity is applied The risk-free rate applied in the calculation of WACC for a specific quarter of the year is published by the President of URE at the beginning of each quarter It corresponded to the average profitability of the fixed rate ten-year Treasury bonds with the longest maturity listed on Treasury BondSpot Poland over 18 months preceding the current quarter for electricity infrastructure companies and over 36 months for gas system operators All data necessary for the WACC calculation is published Guidelines on WACC calculation for gas network companies are included in the document The methodology for a calculation of cost of capital employed by gas network companies for years 2019-2023 published on URErsquos website31 The main component of RAB for gas assets is made up by tangible fixed assets in use and intangible assets32 revealed in the latest audited financial statement of the gas network company deducted by assets financed by subsidy Remunerated assets include the average value (from tariff period and previous period) of planned capital expenditures from network development plans accepted by the President of URE deducted by planned connection fees and corrected in some cases by a coefficient indicating the average underperformance of planned capital expenditures in previous years Moreover an average planned depreciation for the tariff year and previous year is subtracted Guidelines on WACC calculation for electricity network companies are included in the document The methodology for a calculation of cost of capital employed by electricity network companies for years 2016-2020 published on URErsquos website33 RAB is based on re-evaluated assets The re-valuation of the RAB was done for 31 December 2008 In the subsequent years the RAB was adjusted primarily due to investments deprecation and connection fees The compliance of a proposed tariff with the specific provisions of law is verified under the administrative procedure which finishes with the decision of the President of URE (approving a tariff or refusing to approve it) In proceedings for tariff approval the President of URE carries out a detailed analysis of costs which constitute the basis for calculation of transmission and distribution charges making sure that there are no cross-subsidies between licensed and unlicensed activities and between different types of licensed activities Justified costs used for calculation are set according to articles 44 and 45 of the Energy Law Act and rules of cost recording stipulated in the accountancy act The basis of verification of these costs is the audited financial statement from previous year referred to in article 44 paragraph 2 of the Energy Law Act Additionally energy enterprises are obliged to deliver quarterly reports on their activity (including inter alia amounts of gas sold revenue costs and investment expenditures) according to URErsquos template The tariff decision of the President of URE together with the tariff itself (the document containing transmission charges and conditions of its application) are published in the Bulletin of URE available on URErsquos website within 14 days of the approval date Energy enterprises
31 httpbipuregovplbiptaryfy-i-inne-decyzjezalozenia-dla-kalkulacj2189Zalozenia-dla-kalkulacji-i-redakcji-taryf-przedsiebiorstw-sektora-gazowegohtml 32 net value ie deducted by depreciation 33 httpbipuregovplbiptaryfy-i-inne-decyzjezalozenia-dla-kalkulac2299Zalozenia-do-kalkulacji-taryf-OSD-na-
rok-2016html
Ref C20-IRB-54-03
CEER Report on Regulatory Frameworks for European Energy Networks 2020
98156
apply tariffs not earlier than after 14 days and not later than the 45th day from the publication date with the exception of tariffs for gas transmission which are applied in the period specified in the decision approving the tariff but not earlier than after 14 days from the publication thereof If a concerned energy enterprise is not satisfied with the President of URErsquos decision approving or denying approval of the tariff it can appeal against it within a 14-day period to the Court of Competition and Consumer Protection The appealed tariff is not applied Gas TSO Tariff There is one gas TSO in Poland ndash OGP GAZ-SYSTEM SA It operates its own transmission network and the network owned by SGT EuRoPol GAZ SA (Yamal pipeline) under the ISO formula The tariff methodology is compliant with European and domestic law supplemented by guidelines issued by the President of URE The postage stamp cost allocation methodology is applied There is no distinction between domestic and cross-border transmission tariffs ie the same tariff applies both for domestic and cross-border network users In the case of gas storage facilities and LNG facilities connected to the transmission system an 80 and 100 discount is applied respectively The transmission tariff is calculated and approved for a calendar year The regulatory period equals one year
The details of tariff calculation are included in the decision of the President of URE on reference price methodology for years 2020-2022 issued pursuant to article 27(4) of the NC TAR34 Gas DSOsrsquo Tariffs As of 31 December 2017 in Poland only one DSO was operating that was undergoing legal and functional unbundling requirements ndash Polska Spoacutełka Gazownictwa sp z oo35 whose main shareholder was PGNiG SA This company carries out its business activity involving the distribution of gaseous fuels using low- medium- and high-pressure distribution networks for customers located throughout Poland In addition in Poland 52 local DSOs were operating which were not obliged to unbundle their distribution and trading activities Very often the share of gas supplying revenues for these companies made up a marginal amount of total revenues The methodology of justified costs setting and return on capital employed calculation are much the same as for TSO tariffs but instead of entryexit tariffs a group tariffs approach is applied In case of companies conducting an integrated activity (distribution and supply of gas) the tariff incudes prices of gas for households because the obligation to apply regulated prices of gas will remain in force until 31 December 2023 (according to Energy Law Act art 62b) Electricity Grid Operators Regulation There is one Transmission System Operator (TSO) in Poland ndash a state-owned company PSE SA It runs its business activity under a licence for electricity transmission granted by the President of URE and valid until 31 December 2030 Distribution System Operators (DSOs) operating within vertically integrated companies and serving more than 100000 customers connected to their grids are obliged to be independent in terms of legal form organisational structure and decision-making (Article 9d of the Energy Law Act) There are 184 DSOs authorised by the President of URE including five entities
34httpbipuregovplbiptaryfy-i-inne-decyzje-binne-decyzje-informacj3777Inne-decyzje-informacje-
sprawozdania-opublikowane-w-2019-rhtml 35 Polish Gas Company Ltd
Ref C20-IRB-54-03
CEER Report on Regulatory Frameworks for European Energy Networks 2020
99156
legally separated from former integrated distribution companies and 179 DSOs not obliged to be legally unbundled Almost all DSOs not obliged to be legally unbundled perform their functions in systems not connected directly to the transmission grid but to the distribution networks of the five legally unbundled operators Tariffs for Electricity Grid Operators The TSO tariff is set as a one-year tariff and approved by the President of URE although tariffs are derived from a long-term (multi-year) regulation of the TSO Cost of service and revenue cap methods are used in tariff setting The WACC determining method was adopted for years 2016-2020 (both for TSO and DSOs) The regulatory period for five biggest DSOs is five years (the current one at time of writing being 2016-2020) Nevertheless the tariffs are approved annually by the President of URE Mixed type of regulation ie revenue cap with elements of incentive-based regulation and quality regulation is used Models for OPEX and grid losses were established for above mentioned regulatory period The X-coefficients were included in charges for the first year of regulatory period and were set for the next years A quality charge (for maintaining power system standards) is also included in tariffs of the TSO and DSOs For DSOs elements of quality regulation were introduced for regulatory period 2016-2020 The regulation assumes the use of a quality factor Qt which influences return on capital Qt factor depends on DSOrsquos performance in the field of supply quality measured inter alia by SAIDI and SAIFI indicators TSOsrsquo and DSOsrsquo Network Development Plans (Electricity and Gas) The network development plan should ensure a long-term maximising of capital expenditures efficiency and costs incurred by energy enterprises so that in particular years the capital expenditures and costs would not cause excessive increase in prices and charges for the supply of electricity and gas while ensuring continuity reliability and quality of supply CAPEX which influences the return on capital employed and depreciation included in tariff calculation is agreed by energy enterprises with the President of URE in the network development plans The energy enterprises involved in the transmission or distribution of electricity prepare network development plans for their area of operation in terms of satisfying current and future demand for electricity for a period not shorter than three years excluding the TSO preparing the plan for a ten-year period and DSOs for at least five years The plans are updated every three years The energy enterprises involved in the transmission or distribution of gaseous fuels are obliged to draft network development plans for their area of operation in terms of satisfying current and future demand for gas In the case of the TSO the plan is drafted for a ten-year period while in the case of DSOs for five-year period The plans of the TSO and DSOs are updated every two years excluding plans of the TSO pertaining to entrusted transmission networks which are updated on yearly intervals Currently such case applies only to Yamal Transmission Network which is entrusted by SGT EuRoPol GAZ SA (the owner) to OGP Gas-System SA (TSO) under the ldquoISOrdquo unbundling model It might be added that development plans are elaborated in case of distribution and transmission systems pertaining to natural gas but also to other gaseous fuels
Ref C20-IRB-54-03
CEER Report on Regulatory Frameworks for European Energy Networks 2020
100156
223 Portugal Gas TSO Gas DSO Electricity TSO Electricity DSO
Ma
rke
t
str
uc
ture
Network operators
1 (REN) 11 1 (REN) 1 (EDP)36
Network length
1375 km 18987 km 9002 km 226530 km
Ownership Private ownership
Ge
ne
ral
fra
me
wo
rk
Authority Entidade Reguladora dos Serviccedilos Energeacuteticos (ERSE)
System Price-cap (OPEX) and rate of return
(CAPEX)
Price-cap (OPEX) and rate of return
(CAPEX)
Price-cap (OPEX) and standard
costsrate of return (CAPEX)
Price-cap and rate of return (HVMV) and TOTEX (LV)
Period 4 years (current period 2020-2023) 3 years (current period 2018-2020)
Base year for next period
Last real year
Transparency Tariff code Tariff board and Tariff documents
Main elements for
determining the revenue
cap
Non-controllable and controllable
costs RAB WACC efficiency
benchmark inflation mechanism for
attenuation of tariff adjustments
Non-controllable and controllable
costs RAB WACC efficiency
benchmark inflation
Non-controllable and controllable costs RAB WACC efficiency benchmark
inflation incentives general economic interest costs
Legal framework
Decree-Law No 2312012 of 26 October Decree-Law No 215-B2012 of 8 October
Rate
of
retu
rn
Type of WACC Nominal pre-tax
The WACC (Pre-tax) is indexed to the Portuguese 10-year bond benchmark and depends in each year on its evolution with a cap and a floor
Tax rate = 315 Tax rate = 315
Determination of the rate of
return on equity
Capital Asset Pricing Model (CAPM)
The Market Risk Premium=Risk Premium for Mature Market+Country Risk spread
Risk Premium for Mature Market = Spread between SampP500 and USA 10 years treasury bond yields since 1961
Country Risk spread = Spread between Portuguese 10 year bond yields and 10 year bond yields of Germany Finland Austria Netherlands and France
Rate of return on equity
before taxes
67 71 79 85
Initial values for the regulatory period (July 2019)
Initial values for the regulatory period (January 2018)
Use of rate of return
WACC is currently based on 50 debt and 50 equity applied to RAB
WACC is currently based on 55 debt and 45 equity applied to RAB
Reg
ula
tory
as
se
t
ba
se
Components of RAB
Fixed assets deducted from third partiesrsquo contributions
Regulatory asset value
RAB is based on historical and re-evaluated costs
RAB is based on historical costs and
standard costs
RAB is based on historical costs
RAB adjustments
Each year the RAB is adjusted in order to consider new investments write-offs and depreciation
36 Due to the volume of information the table only include data about the regulated distribution network operator of
Mainland Portugal
Ref C20-IRB-54-03
CEER Report on Regulatory Frameworks for European Energy Networks 2020
101156
De
pre
-
cia
tio
ns Method Straight line depreciation
Depreciation ratio
5-45 years 5-40 years 15-30 years 5-40 years
Consideration Part of CAPEX
Introduction In Portugal the regulation of the electricity sector is focused on transmission system management distribution last resort supplier and energy purchase and sale activities In the Autonomous Regions of the Azores and Madeira in addition to those activities the regulation also focuses on the energy acquisition and global system management activity37
In addition to those activities in the natural gas sector (Mainland Portugal only) the regulation also focuses on the global system management activity underground storage activity and reception storage and regasification of LNG activity More recently a new regulated activity has been created the supplier switching activity ERSE is responsible for regulation which encompasses monitoring of markets and infrastructures and annual tariff fixing Historical development The regulation of the electricity sector began in 1999 having undergone a major change in 2007 with the liberalisation of the markets At that time the figure of the last resort supplier was autonomised which until then was under the purview of the distribution network operator In the natural gas sector regulation began in gas year 2007-2008 for the high-pressure activities and in gas year 2008-2009 for the remaining activities In both sectors regulation of regulated activities has been based mostly on incentive regulation (price-cap and revenue-cap) for OPEX and on the application of the rate of return to investments in CAPEX TOTEX approach has also been applied in some activities and standard investment cost in others However throughout the regulatory periods there has been a need to change to other methodologies Therefore there are also other incentives such as incentives for quality of service losses reduction and smart grids as outlined below The main aspects of the type of regulation followed by ERSE are (i) the application of reference costs in the electricity transmission activity from the 2009-2011 regulation period (ii) the modification in 2012 of the price cap methodology applied to TOTEX in the distribution activity to a price cap methodology applied to OPEX and rate of return to CAPEX and (iii) the application of the price-cap methodology to TOTEX in the low voltage distribution activity in the regulatory period 2018-202038 In the Autonomous Regions the definition of reference costs for fossil fuels consumed in electricity generation in the energy acquisition and the global system management activity should also be highlighted as well as the application of an incentive regulation to the three activities of the Autonomous Regions from the 2009-2011 regulatory period 39
37 The electricity generation activity in the Autonomous Regions of the Azores and Madeira is regulated and is not
liberalised because these regions benefit from a derogation from the application of Directive 200354 EC 38 TOTEX approach was applied into distribution activity between 1999 and 2011 39 In the activity of Energy Acquisition and Global System Management incentive regulation only started in 2012
Ref C20-IRB-54-03
CEER Report on Regulatory Frameworks for European Energy Networks 2020
102156
In natural gas at the beginning of the regulatory period 2016-2017 to 2018-2019 a mechanism was introduced to transmission and distribution activity that seeks to mitigate the effects associated with the volatility of demand in the amount of allowed revenues to be recovered by tariffs In the same period for the reception storage and regasification of LNG activity and subterranean storage activity a mechanism was applied to mitigate tariff adjustments recognising the positive externalities that this activity brings to all of the Natural Gas National System In the global system management activity regulation changed from an accepted cost model to an incentive regulation model (revenue cap) In natural gas a new regulatory period started in 2020 and goes to 2023 It was the first time that a regulatory period of four years was defined In addition the regulatory period coincides with the calendar year instead of the gas year (from June of one year to July of the following year) The main changes for this new regulatory period were differentiation in the investments with cost recovered though tariffs according to their nature and taking into account the fulfilment of their initial objectives sharing between companies and consumers of the results of efficiency targets application improvements in the reporting of audited information for regulatory purposes and the extinction of the mechanism applied to distribution activity to mitigate the effects associated with the volatility of demand Regulatory Process ERSE is responsible for preparing and approving the Tariff Code which establishes the methodology to be used for calculating tariffs as well as the ways to regulate the allowed revenues The approval of the Tariff Code is preceded by a public consultation and an opinion from ERSEs Tariff Board ERSErsquos tariff-setting process including its time frame is also defined in the code The allowed revenues of each regulated activities are recovered through specific tariffs each with its own tariff structure and characterised by a given set of billing variables The methodologies and parameters for the tariff calculation are evaluated and fixed at the beginning of each regulation period to be applied during that period Determining allowed revenues The allowed revenues are calculated based on the information sent annually by the regulated companies real audited data and estimated data At the beginning of each regulatory period the companies send their cost forecasts for the entire new regulation period The ldquocost basesrdquo considered in the price-cap and revenue-cap methodologies result from critical analysis of the companiesrsquo operating costs (net of additional income) controllable and non-controllable costs and investment costs It should be noted that there are other costs that are allowed outside the ldquocost basesrdquo therefore not subject to efficiency this is the case for concession rents and actuarial gains and losses The definition of efficiency targets with the objective of reducing controllable costs is based on international and national benchmarking studies through the application of parametric and non-parametric methods Specifically the Corrected Ordinary Least Squares (COLS) and Stochastic Frontier Analysis (SFA) methodologies are used in the parametric models and the Data Envelopment Analysis (DEA) methodology is used in the non-parametric models Regarding investments in addition to the analysis of the values sent by the companies each year ERSE also takes into account the Development and Investment Plan prepared every two years by each sectorrsquos transmission and distribution network operators in HVMV
Ref C20-IRB-54-03
CEER Report on Regulatory Frameworks for European Energy Networks 2020
103156
In addition to the definition of the accepted costs incentives are also defined For the electricity distribution activity these consist of incentives for quality of service losses reduction and for investments in smart grids Recently ERSE has defined a new output-based incentive which aims to lead the DSO to deliver to consumers value-added services enabled by smart grids The amount of this incentive is based on the sharing between the DSO and consumers of the benefits generated by such services To access it the DSO must demonstrate that it provides a package of ldquokey smart-grid servicesrdquo For the electricity transmission activity there is an incentive for efficient investment in the transmission network through the use of reference prices in the valuation of the new equipment to be integrated in the network and an incentive to increase the availability of the elements of the transmission network In the current regulatory period the incentive for the maintenance of end-of-life equipment was replaced by incentives to economic rationalisation of costs Asset base remuneration The remuneration of the asset base is calculated using a pre-tax nominal WACC The methodology used for setting the cost of equity is the Capital Asset Pricing Model and the cost of debt is set using a default spread model where a spread (debt premium) is added to the risk-free rate Due to some uncertainty remaining and volatility of the financial environment the rate of return is updated ex-post each year in order to reflect the evolution of financial market conditions The WACC (pre-tax) to be applied in the regulatory period is indexed to the Portuguese 10-year bond benchmark and depends each year on its evolution with a cap and a floor The floor is 450 for the electricity TSO and 475 for an electricity DSO The cap is 950 for the electricity TSO and 975 for an electricity DSO The floor is 450 for the gas TSO and 470 for a gas DSO The cap is 880 for the gas TSO and 900 for gas DSO For the electricity regulatory period 2018-2020 a 075pp (percentage points) premium is added to the electricity TSO WACC for investments after 2009 when their cost is considered efficient using a methodology where real and standard costs for those investments are compared
ROE parameters Portugal
GasElectricity Gas Electricity
TSO DSO TSO DSO
Risk free rate (nominal) 057 057 100 100
Tax rate 3150 3150 3150 3150
Equity risk premium 650 650 766 766
Equity beta 062 066 058 063
Cost of equity (before taxes) 668 708 794 850
Ref C20-IRB-54-03
CEER Report on Regulatory Frameworks for European Energy Networks 2020
104156
Allowed revenue adjustments The allowed revenues from each activity are adjusted after two years based on real audited values For price-cap and revenue-cap methodologies the adjustments made result from changes in the level of cost drivers In energy purchase and sale activities given their more volatile nature the adjustments are made after one year based on estimated values Costs accepted outside the cost base are also recalculated on the basis of actual values For the natural gas sector all activities undergo adjustments at the end of one year (estimated adjustment) and at the end of two years (actual adjustment) The values of the actual adjustments are deducted from the estimated adjustments in the activities where this calculation is made The values of the adjustments are incorporated into the allowed revenues of the year with the appropriate financial update National Specificities In the electricity sector there are regulated activities in Mainland Portugal and the Autonomous Regions while in the natural gas sector they operate only in Mainland Portugal In addition to the electricity distribution network operator in HVMV and LV there are ten LV distribution network operators that operate locally In the electricity sector 13 of allowed revenues recovered through tariffs are costs arising essentially from political decisions the so-called General Economic Interest Costs (CIEGs) In the natural gas sector the distribution activity is licensed by different geographic areas but is subject to the same regulatory methodologies As mentioned in the natural gas sector at the high-pressure level mechanisms have been created to mitigate extreme volatility of demand when it occurs
Ref C20-IRB-54-03
CEER Report on Regulatory Frameworks for European Energy Networks 2020
105156
224 Romania Gas TSO Gas DSO Electricity TSO Electricity DSO
Ma
rke
t s
tru
ctu
re Network
operators 1 36 1 8 (concessionaires)
46 (non-concessionaries)
Network length 13381 km 51015 km 8897 km
326241 km (+167204 km - final
connections)
Ownership Private and public
ownership Private and public
ownership Mainly public
ownership
Mainly private investors indirect public ownership
Ge
ne
ral
fra
me
wo
rk
Authority ANRE (National Regulatory Authority for Energy)
System Incentive Regulation Revenue cap Revenue cap Revenue cap Price cap Cost+
Period Generally 5 years current period 2019-2023(DSO) - 5 years current period July2012-Sept2019 (TSO) -7 years next period Oct 2019-Sept 2023
5 years current period
2020 - 2024
5 years current period
2019 ndash2023
Base year for next period
last year of current regulatory period 5th year in current regulatory period
Transparency Tariffs methodologies approved revenues and tariffs general rules for efficiency art
29 and 30 requirements of Reg (EU) 4602017
Tariffs methodologies approved tariffs general rules for efficiency
Main elements for determining
the revenueprice
cap
Non-controllable (pass-through) and controllable costs efficiency factor general inflation rentability of RAB
(RABxRoR) depreciation technological consumption
Non-controllable and controllable OPEX variable costs RAB depreciation rentability of RAB (RABxWACC)
Legal framework Energy and Gas Law 1232012
ANRE Order 2172018 for distribution activity and Order 412019 for transmission
activity
Energy and Gas Law 1232012
ANRE Order no 1712019
Energy and Gas Law 1232012 ANRE Ord no 1692018 and
Order no 1682018
Rate
of
retu
rn
Type of WACC Nominal WACC post-tax determined using CAPM method
WACC is used in determination of rate of return
Real Pre-TAX
Determination of the rate of
return on equity
WACC = CCPKp(1 ndash T) + CCIKi () CCP - equity cost of capital real post-tax () CCI ndash loan capital cost pre-tax () Kp ndash weight of equity capital in total capital Ki ndash weight of loan capital in total capital Ki=(1-Kp) T ndash rate of income tax for regulated period
Sum of risk-free rate and a market risk premium multiplied with beta
Rate of return on equity before
taxes
69 approved by
the government from April 2019
until 29 April 2020 566 for 30 April-
12 May 2020 RRR=639 for 13 May-until the end of the regulatory period namely
December 2023 The rates of 566
and 639 were approved by
ANRE
69 approved by the government from
April 2019 until 29 April 2020 566 for
30 April-12 May 2020
RRR=639 starting from 13 May-until the end of the regulatory
period namely September 2024
The rates of 566 and 639 were
approved by ANRE
RRR=69 approved by the
government starting with April
2019 Starting on 13 May
2020 ANRE approved a new
value for RRR=639
RRR=566 approved by ANRE from January until
March 2019 RRR=69
approved by the government
starting with April 2019 Starting on
13 May 2020 ANRE approved a
new value for RRR=639
Ref C20-IRB-54-03
CEER Report on Regulatory Frameworks for European Energy Networks 2020
106156
Use of rate of return
Granted for initial RAB (privatisation value) existing assets and new assets
- RAB value at the beginning of each regulatory period (Remaining value of initial privatisation RAB and the other existing assets) is multiplied with RoR an included in the regulated revenue
- Beginning with the 2nd year of the regulatory period each year new entries are multiplied with RoR and included in the regulated revenue
Granted for initial RAB (privatisation value) for existing assets and for new
assets RRR is multiplied with whole RAB Debt and equity percentages are 4060
Reg
ula
tory
as
se
t b
ase
Components of RAB
Fixed assets working capital
Historical costs multiplied with index costs
Investments in new assets after the base year led to an adjustment of the CAPEX
Regulatory asset value
The RAB value consists in historical assets value and value of the new investments
The value of the new investments included in RAB is considered to be the accounting
value For each year of the regulatory period the RAB value increases with the investment in new assets and decreases
with depreciation and the value of the asset that exits before complete depreciation
The assets of the base year used as initial RAB For each year of the regulatory
period the RAB value increases with the investment in new assets and decreases
with depreciation and the value of the asset that exits before complete
depreciation For RAB existing on 1 January 2005 or the privatisation date it was a fair value of the assets updated with inflation For the rest of the assets based on historical costs updated with
inflation
RAB adjustments
Investments in new assets after the base year and assets that exit before complete
depreciation led to an adjustment of
the CAPEX
Investments in new assets after the base year and assets that exit before complete depreciation led to
an adjustment of the CAPEX
The plus value that resulted from the
revaluation of assets but limited
to RAB adjusted with
CPI
RAB adjusted with CPI but limited by the current value of
the assets
Dep
rec
iati
on
s
Method Straight line
Depreciation ratio
Depending on asset type Buildings 50 years
Pipes and technical inst 40 years Other between 7 and 20 years
Land not included
Depending on asset type Ratio between 2 and 166 eg
lines amp cables 25-10 stations 2
Consideration Part of regulated revenue The depreciation calculated for the
previous year asset entries is directly and 100 integrated into the regulated
revenues Afterwards when the tariff adjustments are made the depreciation
already included in the regulated revenues is adjusted with inflation rate
Part of regulated revenue Depreciation is included directly and 100 in revenue
before the linearisation
Introduction The Romanian Energy Regulatory Authority (ANRE) is the regulatory authority responsible in Romania for approving methodologies and tariffs for electricity and gas networks For electricity ANRE is responsible for regulating the Romanian TSO (there is only one) eight operators holding the concession of distribution service (ODCs) and other distribution operators (ODs)
Ref C20-IRB-54-03
CEER Report on Regulatory Frameworks for European Energy Networks 2020
107156
For gas ANRE is responsible for regulating the Romanian TSO (there is only one) and 31 operators holding the concession of the distribution service (DSOs) Historical Development An incentive-based regulatory regime was introduced in 2005 for the two TSOs (for setting transmission tariffs) and ODCs The methodology for setting electricity transmission tariffs uses a revenue cap regulatory system ANRE uses a price cap methodology (tariffs basket cap) for setting electricity distribution tariffs applied by ODC For ODs (other electricity distribution operators then concessionaires) a cost-plus methodology is in force For setting regulated gas tariffs starting in 2019 ANRE uses for both distribution and transmission activities a revenue cap methodology Determining the RevenuePrice Caps For electricity the revenueprice caps for electricity network operators (the TSO and ODCs) are set for a five-year regulatory period The current regulatory period is from 2020 to 2024 for transmission and from 2019 to 2023 for distribution Each revenue cap is composed of the non-controllable operating and maintenance costs controllable operating and maintenance costs (applying an efficiency factor for reducing inefficiencies) costs of electricity losses costs of RAB depreciation and rentability of the RAB (RAB x WACC) There are efficiency requirements for controllable OPEX and for costs of electricity losses WACC is set in the reference year for the next regulatory period and can be updated during the regulatory period in order to reflect the evolution of the financial market conditions The following assets are eliminated from evaluating the RAB
bull Grants fees received from new customer connections
bull Assets which are conserved and assets that are still under construction and
bull Inefficient investments and other that do not follow the prudence criteria provided by regulations
For gas the revenue cap for the TSO and DSOs are set for a five-year regulatory period Each revenue cap is composed of the controllable (applying an efficiency factor for reducing inefficiencies) and non-controllable (pass-through) costs technological consumption costs costs of the RAB depreciation rentability of RAB (RAB x RoR40) and general inflation Efficiency Requirements Electricity The level of controllable operating and maintenance costs (controllable OPEX) for the first year of the regulatory period is set by ANRE based on an efficiency benchmarking An efficiency requirement (X-factor) is applied on controllable OPEX during the regulatory period An X-
40 Rate of Return
Ref C20-IRB-54-03
CEER Report on Regulatory Frameworks for European Energy Networks 2020
108156
factor equal to 2 is applied annually to the controllable OPEX for transmission in the current regulatory period For distribution (ODC) the X-factor is 2 for the regulatory period 2019-2023 For the level of electricity losses recognised in tariffs ANRE imposed targets at the beginning of the regulatory period that have a declining trend during the regulatory period For the electricity price recognised for acquiring the energy required to cover electricity losses ANRE considers a limit equal to the average of the prices recorded by ODC The investment plan for the entire regulatory period is verified in terms of necessity opportunity efficiency cost of investments The structure of the plan is also verified and the plan is approved ex-ante by ANRE The estimated benefits that justify the efficiency of every investment in electricity network is evaluated ex-ante and also ex-post by the network operator and reported to ANRE ANRE removes from the RAB the investments that prove ex-post to be inefficient because the expected benefits are not confirmed Gas The level of controllable and pass-through costs for the first year of the regulatory period is set by ANRE based on the analysis performed on the cost submitted by the TSO and DSOs An efficiency factor (X-factor) is applied on controllable OPEX during the regulatory period For distribution (DSO) the X-factor is set to 1 for each year of the regulatory period 2020-2023 For transmission (TSO) the efficiency was set to 15 for each year of the fourth regulatory period (1 October 2019 to 30 September 2024) Price Development The revenuetariffs basket caps take account of the development of consumer prices in relation to the base year (CPI-X regime) General price increases lead to an increase in the revenue cap Regulated tariffs for gas are yearly adjusted within each regulatory period and consideredreflected in the regulated prices Quality Regulation ANRE sets quality indicators for service quality and reliability for electricity and gas For electricity distribution there are also set minimum levels for individual indicators like number and duration of interruptions in power supply The distribution operator must pay compensation to the users of the grid when the minimum levels imposed are exceeded Compensation paid by the operator are not justified costs to be recognised in regulated tariffs Adjustments After the Reference Year Each year ANRE calculates revenue corrections due to inflation investment non-controllable (pass-through) operating and maintenance costs changes in energy volumes and losses (quantity and price of losses) The value of the revenue correction is included in the revenue used to determinate tariffs for the next year for both electricity and gas For electricity if the accomplished value of annual investments is less than 80 of the predicted value taken into consideration an annual revenue adjustment is made In this way ANRE ensures that unused revenues are recovered as quickly as possible These annual adjustments are considered at the end of the regulatory period for the final corrections
Ref C20-IRB-54-03
CEER Report on Regulatory Frameworks for European Energy Networks 2020
109156
For gas ANRE calculates revenue and tariff corrections due to differences in total revenue generated by volumes variations inflation investment pass-through costs and technological consumption Transparency The data published on the ANRE website include the tariffs and an informative note with details on the analysis used for calculating the revenue caps and annual adjustments For gas ANRE publishes on its website the tariffs for each operator (TSO and DSOs) Outlook For all regulated activities electricity distribution and transmission and gas distribution and transmission ANRE approved new methodologies starting with the fourth regulatory period The aim is to harmonise the provisions of the four methodologies For gas distribution activity the methodology has been changed from price cap to revenue cap and for gas transmission activity the methodology was modified in order to comply with article 26 requirements of Reg (EU) 2017460
Ref C20-IRB-54-03
CEER Report on Regulatory Frameworks for European Energy Networks 2020
110156
225 Slovakia Gas TSO Gas DSO Electricity TSO Electricity DSO
Ma
rke
t
str
uc
ture
Network operators
1 1 1 3
Network length 2332 km 33300 km 3008 km 94790 km
Ownership Private and public Private and public Public Private and public
Ge
ne
ral
fra
me
wo
rk
Authority UacuteRSO
System Benchmarking Price cap
Period 5 years 2017 - 2021
Base year for next period
TBD
Transparency Price decrees determining the tariff methodology Price decisions published
Main elements for determining
the revenueprice
cap
Analysis of entry-exit tariffs in other Member States of
the EU
Allowed costs Allowed depreciation RAB WACC
Legal framework
Act No 2502012 Coll on Regulation in Network Industries Act No 2512012 Coll on Energy Industry URSO Decree No 2232016 Coll (gas) URSO Decree No 182017 Coll (electricity)
Rate
of
retu
rn
Type of WACC NAP Real pre-tax WACC
Determination of the rate of
return on equity
NAP Sum of nominal risk-free rate and a risk premium (market risk
premium multiplied by beta factor)
Rate of return on equity
before taxes NAP 1071 = (107 + 666 111) (1 ndash 021)
Use of rate of return NAP
When setting the nominal pre-tax WACC the DE ratio of 6040 was used
The whole RAB is multiplied by the WACC
Reg
ula
tory
as
se
t b
ase Components of
RAB NAP Fixed assets no working capital
Regulatory asset value
NAP
Expertly appraised value of assets
necessarily used for regulated
activities as at 31 Dec 2015
Expertly appraised value of assets necessarily used for regulated activities as
at 1 Jan 2011
RAB adjustments
NAP There is no RAB adjustment taking place during the regulatory
period
Dep
rec
iati
on
s Method
NAP Regulatory depreciation (technical life cycle of assets)
Depreciation ratio
NAP Ratio between 125 and 20
Consideration
NAP A component of target revenue
Introduction The Regulatory Office for Network Industries (URSO) as an independent public authority was established on 1 August 2001 and performs regulation in the sectors of electricity gas district heating and water In September 2012 new acts on regulation in network industries (No 2502012 Coll) and the Energy Act (No 2512012 Coll) came into effect governing the position and powers of URSO The two acts also brought a significant shift in the protection of
Ref C20-IRB-54-03
CEER Report on Regulatory Frameworks for European Energy Networks 2020
111156
market participants as well as in the reinforcing of the Officersquos independence and competences Currently URSO is in the fifth regulatory period (2017 - 2021) which was set at five years In order to harmonise amendments to the primary legislation by the transposition of the Clean Energy Package with the new regulatory policy for the next regulatory period (2023 - 2027) the current regulatory period will be after the adoption of the amendment to the regulatory policy extended by one year The dominant activity of URSO is tariff (price) regulation The scope and manner of its implementation is set out in the implementing regulations in the form of price decrees and the terms and conditions of tariff application are set out in individual price decisions Historical development In 2001 SEPS Slovakiarsquos electricity TSO was unbundled and as a result three vertically integrated undertakings providing electricity distribution electricity supply and services were established In 2013 SEPS was certified based on the ownership unbundling model Eustream the sole gas transmission system operator was certified as an independent transmission system operator (ITO) in 2013 Gas transmission assets were not transferred to the transmission system operator but remained the property of the parent company SPP as SPP-distribuacutecia the only gas distribution system operator which was unbundled from SPP in 2006 The electricity and gas markets were fully liberalised as of July 2007 With entry into the 3rd regulatory period (2009 - 2011) URSO ceased to apply the original revenue cap method and established the incentive regulation principle based on the price cap methodology Since 2012 the three-year regulatory period has been replaced by a more stable regulatory framework with a five-year period Main principles of price regulation The basic principle of regulation of prices (tariffs) approved or set by URSO for the five-year regulatory period applies price cap as a method which guarantees profit only under real efficient business operation and incentivises network operators to reduce their own losses Since 2009 URSO has also regulated the quality of services which focuses primarily on consumer protection Network operators and suppliers must comply with the quality standards set by URSO decree in order for the consumers to receive adequate quality for the price they pay for electricity gas and heat In the event of non-compliance with the quality of supply and services the regulated entity is obliged to pay a compensatory payment to the consumer Additional adjustments during the regulatory period The price decision is valid for the entire regulatory period In the event of a significant change in the economic parameters on the basis of which URSO approved or set the price the regulated entity may request a change in the price decision URSO may also initiate a change in the price decision on its own initiative Basic formula for setting the price cap (electricity) Price cap = [OPEX allowance x (1 + core inflation - efficiency factor) + (RAB x WACC) + depreciation (from RAB + from planned CAPEX for next year) - revenues from connections] forecasted volume
Ref C20-IRB-54-03
CEER Report on Regulatory Frameworks for European Energy Networks 2020
112156
In electricity distribution the price cap is set for each voltage level separately (EHV ndash 110 kV HV - 22 kV LV - 04 kV) Basic formula for setting the price cap (gas) Price cap = [OPEX allowance x (1 + core inflation - efficiency factor) + (RAB x WACC) + depreciation (from RAB) + costs to cover losses and own consumption - revenues from connections] forecasted volume] Gas distribution tariffs are categorised based on a contractually agreed annual volume of distributed gas for each offtake (supply) point and the postage stamp principle is applied Eligible costs Operating costs are optimised through the JPI - X factor where JPI is the core inflation set by the Statistical Office and X is the efficiency factor of 35 If JPI ltX then JPI - X = 0 and overheads up to the amount of overheads in year t-1 are included in the eligible costs in year t Allowed depreciation The price proceeding for each year of the regulatory period will also assess the use of the declared costs for new investments in the form of depreciation Profit A reasonable profit within the price proceeding is multiplication of the RAB and WACC values It shall take into account the scope of the investments required to ensure a long-term reliable safe and efficient system operation an adequate return on operating assets and the stimulation of stable long-term business Regulatory Asset Base The value of the property is referred to as RAB - regulatory asset base RAB (for electricity) was determined on 1 January 2011 and its value is equal to the general value of assets determined on the basis of an expert opinion RAB (for gas) was determined as of 31 December 2015 WACC The WACC value (before tax nominal) is set at a maximum of 647 and is applied constantly throughout the whole regulatory period However if the difference of input parameters entering the WACC calculation exceeds 10 a new WACC value is determined for the relevant year and published on the URSO website by 30 June of the calendar year
WACC pre-tax nominal =119864
119864+119863+
119877119890
1minus119879+
119863
119864+119863 119909 119877119889
T ndash income tax rate for year t E ndash equity D ndash liabilities Rd ndash real price of liabilities for the regulatory period set at 373 (average rate of loans provided to non-financial corporations for a period of five years or more with a loan amount over 1 mil euros) Re ndash real price of equity and liabilities
Re = Rf + βlev x (Rm - Rf) Rf ndash return on risk-free assets for the regulatory period set at 303
Ref C20-IRB-54-03
CEER Report on Regulatory Frameworks for European Energy Networks 2020
113156
βlev ndash is a weighted coefficient β which defines the sensitivity of the companys share to market risk taking into account the income tax rate and the share of liabilities
βlev = βunlev x [1 + (1 minus 119879) 119909119863
119864]
βunlev ndash is an unweighted coefficient without the influence of the income tax rate and the share of liabilities set at 053 DE ndash ratio of liabilities to equity set at 60 in favour of liabilities (Rm - Rf) ndash total risk premium set at 454 Methodology for setting gas transmission tariffs The regulatory framework for gas transmission differs from gas distribution in that it consists of a method of comparing tariffs in EU Member States (international benchmarking) According to the Act on Regulation if there is effective pipeline-to-pipeline competition URSO shall by direct comparison approve or determine comparable prices for access to the transmission network and gas transmission which take the form of tariffs Tariffs are set for individual entry and exit points of the transmission network (entry-exit system) and apply for domestic and foreign users of the transmission network The submitted analysis compares the total average prices for gas transmission including conversion to length units taking into account the relevant distance of entry and exit points of the transmission network costs depreciation and revenues for the provision of services in the transmission networks The method allows TSOs to cover all costs while generating a reasonable profit which enables the company to make new investments required by the gas market develop sufficient flexibility in offering new products and services and adopt measures under EU legislation Tariffs are set for the entire regulatory period their final amount is subject to an annual increase equivalent to the inflation rate
Ref C20-IRB-54-03
CEER Report on Regulatory Frameworks for European Energy Networks 2020
114156
226 Slovenia
Gas TSO Gas DSO Electricity TSO Electricity DSO
Ma
rke
t
str
uc
ture
Network operators
1 13 1 1
Network length ~1174 km ~4740 km ~2890 km ~65400 km
Ownership Public Private and public Public Private and public
Ge
ne
ral
fra
me
wo
rk
Authority Energy Agency
System Incentive regulation Revenue cap
Period 3 years current period 2019-2021
Base year for next period
2nd or 3rd year in current regulatory period (2016 2017)
Transparency bull the methodology determining the regulatory framework and the methodology determining the network charge bull WACC study bull httpswwwagen-rssizemeljski-plin1 bull httpswwwagen-rssielektricna-energija3
Main elements for determining
the revenueprice
cap
Controllable OPEX (general
productivity) uncontrollable OPEX CAPEX (depreciation
regulated return on assets)
consumption incentives
Controllable OPEX (efficiency score
general productivity)
uncontrollable OPEX CAPEX (depreciation
regulated return on assets) incentives
Controllable OPEX (general
productivity) uncontrollable OPEX CAPEX (depreciation
regulated return on assets) losses
ancillary services consumption
incentives
Controllable OPEX (efficiency score
general productivity)
uncontrollable OPEX CAPEX (depreciation
regulated return on assets) losses consumption
incentives
Legal framework Act on the methodology for determining the
regulatory framework of the
natural gas transmission system
operator
Act on the methodology for determining the
regulatory framework of the gas distribution system operator
Act on the methodology determining the regulatory framework and the
methodology determining the network charge for the electricity system operators
Rate
of
retu
rn
Type of WACC Pre-tax WACC nominal (equity share 60 debt share 40) WACC 2019-2021 = 526
Determination of the rate of return
on equity
Cost of equity is determined on the ldquorisk premium modelrdquo (Cost of equity = cost of debt + 2) Cost of debt is 5-years average (2012-2016) for interest rate to non-financial
companies in Slovenia Premium of 2 is the difference between return on equity and cost of debt for Slovenian market
Rate of return on equity before
taxes Cost of equity = cost of debt + premium (368 + 2 = 568)
Use of rate of return
For each year of the regulatory period WACC is applied on the value of the Regulatory Asset Base (RAB)
Reg
ula
tory
as
se
t b
ase Components of
RAB bull Book values of tangible and intangible assets after RAB adjustment bull Ex-ante investments according to development plan bull No working capital no assets under construction
Regulatory asset value
bull Book value for existing assets bull Investment value according to development plan for new assets
RAB adjustments
RAB adjustments are bull value of assets acquired with subsidies and grants bull assets under construction bull value of assets acquired with disproportionate costs for connection to network bull value of assets acquired with congestion income
Ref C20-IRB-54-03
CEER Report on Regulatory Frameworks for European Energy Networks 2020
115156
De
pre
cia
tio
ns Method Straight line
Depreciation ratio For existing assets and new investments
the actual rate of depreciation is taken into account
bull existing assets (actual rate of depreciation depending on asset type) bull planned new investments in energy infrastructure (286) bull planned other assets (5)
Consideration 100 of depreciation is integrated into revenues
Regulation of Electricity Transmission and Distribution Operators The regulation in the regulatory period from 1 January 2019 to 31 December 2021 is carried out on the basis of the Act on the methodology determining the regulatory framework and the methodology determining the network charge for the electricity network operators The methodology for setting the network charge determines the principles of economic regulation of electricity services of general economic interest and sets the eligible costs of the electricity network operators The methodology is based on the regulated network charge with the aim that by setting the network charge and other revenues and taking into account identified deviations from previous years the system operator is to cover all eligible costs of the regulatory period
In establishing the regulatory framework for the period 20192021 the Slovenian NRA the Energy Agency addressed electricity consumption planned development of the infrastructure level of quality of supply eligible costs of the system operators and network charge tariffs for each consumer group The eligible costs of the electricity system operators consist of controlled operation and maintenance costs uncontrolled operation and maintenance costs costs of electricity losses depreciation costs and regulated return on assets The basic controlled operational and maintenance costs are calculated in accordance with requested yearly productivity improvement The yearly productivity improvement consists of planned general productivity and individual productivity For the Transmission System Operator (TSO) only the planned general productivity is used The individual productivity of each Distribution System Operator (DSO) is determined in the benchmark analysis The eligible costs are covered by the network charge and other revenues When determining the resources to cover the eligible costs due consideration is given to the deviations from the regulatory framework in previous years and the planned settlement for a current regulatory period The methodology for assessing the network charge determines the procedures and elements to assess the network charge and to divide consumers into various consumers groups For calculating the network charge the non-transaction postage-stamp method is used which means a system of uniform tariffs for calculating the network charge on the territory of Slovenia within the individual consumer group For the allocation of costs for different voltage levels the gross approach to calculating the network charge for transmission and distribution network is used
The methodology of the regulated network charge is also based on incentives which depend on incurred eligible costs achieved quality of supply level the provision of free ancillary services the acquisition of non-refundable European funds savings in the purchase of smart electricity meters with communications module realised investments in smart grids projects realised pilot projects and a special incentive for innovation
Ref C20-IRB-54-03
CEER Report on Regulatory Frameworks for European Energy Networks 2020
116156
If a system operator achieves higher or lower eligible costs of actually eligible costs this difference is reflected in its income statement Incentives concerning the achieved quality of supply level are determined according to the achieved level of supply continuity from the reference level and are reflected in increased or decreased eligible costs If the system operator provides one or more ancillary services free of charge which is not the result of legislation incentives equivalent to 10 of the saving that equals the amount paid for the ancillary service will be awarded to the system operator If the system operator obtains non-refundable European funds incentives of 05 of the current value of the assets is granted to the system operator in the year when the assets were put into service If the system operator achieves a lower annual average acquisition price than price-cap of smart meters in accordance with the methodology a single incentive of 10 of the realised annual saving is awarded to the system operator If the system operator realises the investments in smart grids that meet the requirements set out in the methodology a single incentive is acknowledged amounting to 3 of the current value of the asset in the year in which the asset was put into service If the system operator fulfils the conditions and criteria for the projects promoting investments in smart grids in accordance with the methodology for these projects pilot tariffs can be used
The electricity system operator must identify deviations from the regulatory framework after each year of the regulatory framework Deviations are established as a difference between planned and actual eligible costs of the system operator and a difference between planned and actual revenue sources which include the identified surplus or deficit of the network charge from previous years The Energy Agency issues a separate decision if it concludes that deviations were not calculated in accordance with the methodology The Energy Agency keeps under review the implementation of the regulatory framework during the regulatory period by monitoring the monthly realisation of the network charge by analysing the criteria of the costs and by calculating deviations from the regulatory framework Regulation of Gas Transmission and Distribution Operators The Energy Agency carries out the regulation in the regulatory period from 1 January 2019 to 31 December 2021 on the basis of the Act on the methodology for determining regulatory framework for the natural gas transmission system the Act on the methodology for determining the network charge for the natural gas transmission operator the Act on the methodology for determining regulatory framework for the natural gas distribution system and the Act on the methodology for determining the network charge for the natural gas distribution operator The methodology for setting the network charge determines the principles of economic regulation and sets the eligible costs of the gas operators The methodology is based on the regulated network charge with the aim that by setting the network charge and other revenues and taking into account identified deviations from previous years the system operator is able to cover all eligible costs of the regulatory period The regulation methodology is based on the method of the regulated annual income and regulated network charges of the TSODSO arising from a determination of eligible costs taking into account (in addition to the network charge) several other factors These other factors include all other revenues as sources for the system operator to cover eligible costs from the previous period the obligation of the TSODSO to transfer the surplus of the network charge and its dedicated use for covering eligible costs in the next regulatory period and the right of the TSODSO when determining the regulatory framework for the following years to take into account the coverage of the network charge deficit
Ref C20-IRB-54-03
CEER Report on Regulatory Frameworks for European Energy Networks 2020
117156
The eligible costs of the gas system operators consist of controlled operating and maintenance costs uncontrolled operating and maintenance costs depreciation costs and regulated return on assets Resources for covering eligible costs are the network charge and other revenues In determining the resources for covering eligible costs the deviations from the regulatory framework of the previous years are duly taken into account
By using the method of regulated annual income and regulated network charges the TSODSO determines the regulatory framework in a way that incorporates the planned annual income the surplus of network charges from the previous years the planned network charge deficit maximum up to the amount of depreciation charge that covers the costs up to the amount of eligible costs for the regulatory period and the corresponding deficit of previous years The TSODSO submits to the Energy Agency the request for granting consent to the regulatory framework network tariff items and tariff items for other services for the relevant regulatory period In the process of issuing approval the Energy Agency assesses the compliance of the proposed eligible costs the network charge and other network charge items with the applicable methodologies
At the end of each regulatory period the TSO must determine the deviations from the regulatory framework The deviations are determined as the difference between actual eligible costs and existing sources for covering eligible costs which include recorded income or the network charge deficit from previous years The Energy Agency issues a special decision when it finds that the deviations are not calculated in accordance with the methodology The Energy Agency monitors the implementation of the regulatory framework during the regulatory period
Three investment incentives are available in the area of electricity and gas If the system operator obtains non-refundable European funds incentives of 05 of the current value of the assets is granted to the system operator in the year when the assets were put into service In gas for a customer who consumes biomethane or synthetic biomethane the network charge for both the TSO and DSOs is reduced up to 20 depending on the portion of biogas in gas consumed The network charge is set to 50 for a filling station for compressed gas for vehicles
Ref C20-IRB-54-03
CEER Report on Regulatory Frameworks for European Energy Networks 2020
118156
227 Spain Gas TSO Gas DSO Electricity TSO Electricity DSO
Ma
rke
t
str
uc
ture
Network operators
1 large TSO (ENAGAS) 1 small
TSO and 12 transport co
19 DSOs that are part of 6 groups
1 TSO (REE)
5 large DSOs (gt90 system
revenues) and 327 small DSO
lt100000 clients
Network length
13749 km (2018) 73950 km (2018) 44173 km (2018) 896562 km (2018)
Ownership Private except for 5 stake of the
State in ENAGAS
Private utilities and investment funds
Private except for 20 stake of the
State in REE
Private 5 large DSO are part of
integrated utilities
Ge
ne
ral
fra
me
wo
rk
Authority CNMC sets revenues from 2020 on methodologies from 20202021 in electricitygas
System Rate of return Incentive Regulation
Period 6 years next 2021-2026 6 years 2020-2025
Base year for next period
For regulatory period (n n+5) review is made with n-1 available data so n-2 data
Transparency CNMC publishes its proposals and final decisions on its website There is a period for a hearing process Final decisions (Circulars) are published in the Official State Gazette
Main elements for
determining the revenue
cap
Investment amp OPEX reference values
RAB rate of return regulatory lifetime of assets revenues for continuity of supply
and extension of assetrsquos lifetime
The allowed revenue of the preceding year changes in the
number of clients changes in the volume of gas
distributed
Investment reference values OPEX reference
values RAB rate of return regulatory lifetime of assets
Incentives
Investment values OPEX values Other
regulated tasks reference values
RAB rate of return regulatory lifetime of assets number of clients Incentives
Legal framework
Law 341998 of the Hydrocarbons sector Law 182014 of 15 October
Law 242013 of the Electricity sector Circulars 22019 52019 62019 72019
Rate
of
retu
rn
Type of WACC Nominal post-tax WACC
Determination of the rate of
return
Electricity transmission and distribution CNMC has calculated the Rate of Return by using WACC It will be 6003 in 2020 and 558 over 2021-2025 Nominal pre-tax Gas transmission The current rate of return is set at 509 (the average yield on 10-year Bonds in the 24 months before the entry into force of the legislation plus a spread of 50 bp) An additional remuneration term (ldquoRemuneration for the continuity of supplyrdquo) increases the implicit return on gas transmission assets For the next regulatory period (2021-2026) CNMC has calculated the Rate of return by using the WACC formula Gas distribution a rate of return of 10-year Bond plus a spread of 150 bp was set in 2002 and from then on a parametric remuneration formula applies
Rate of return on equity
before taxes 640 = 297 + 072 475 (Electricity TSO amp DSOs)
Use of rate of return
Rate of return is applied (nominal pre-tax) on RAB in Gas TSO Electricity TSO and Electricity DSO A rate of return was set for gas distribution in 2002 and from then on a parametric remuneration formula applies
Reg
ula
tory
as
se
t b
ase
Components of RAB
Fixed assets (No working capital no assets under construction)
Regulatory asset value
Electricity depending on commissioning year Replacement cost Average between audited costs and Investment reference values Audited costs with some limitations For
TSO unique facilities and DSOTSO pilot projects Audited costs Gas transmission average between audited costs and investment reference values Audited costs for unique facilities Gas distribution RAB based on the inflated gross
investment value of assets in 2000 since then the parametric formula applies
RAB adjustments
Assets built year n-1 are added year n
RAB defined in 2002 and then
parametric formula
Assets built year n-2 are added year n
Assets built year n-2 are added year n
Dep
re-
cia
tio
ns Method Straight Line
Depreciation ratio
Generally 25 (Lines Cables Substations Transformers transmission pipelines) For gas distribution assets a 5 depreciation ratio was set in 2002 since then the
parametric remuneration formula applies
Consideration 100 of Depreciation is integrated into the revenues
Ref C20-IRB-54-03
CEER Report on Regulatory Frameworks for European Energy Networks 2020
119156
General facts Six-year regulatory periods are established for both electricity and gas activities Regulatory parameters are not updated by price indexes within the regulatory period Royal Decree Law 12019 gives CNMC (Spanish NRA) powers to set revenues and tariffs which was previously done by the Ministry Consequently CNMC has published new regulation to set revenues for gas and electricity TSOs and DSOs for the following regulatory periods (2020-2025 for electricity and 2021-2026 for gas) As changes in electricity apply from 2020 this chapter has been updated for electricity Electricity Transmission and Distribution Electricity DSO and TSO receive remuneration for investment (CAPEX) OampM (OPEX) and other regulatory tasks (only DSO) In addition they have incentivespenalties that can result in increased or decreased revenues depending on their performance A new regulatory period started in 2020 Investment remuneration (CAPEX)
Regulatory Asset Base (RAB) The RAB is updated every year by adding new investments and subtracting depreciation Assets under construction and working capital are not included in the RAB Subsidies and assets built or financed by third parties are also excluded When assets end their regulatory lifetime they are taken out of the RAB and stop receiving revenues for investment Assets commissioned in year n start receiving revenues in year n+2 To take this into account the RAB is increased by (1 + Rate of Return) ^(remuneration delay factor) This factor is calculated for each asset for TSOs while it is equal to 15 for DSOs
TSO
bull The RAB was set by taking into account the value of assets built before 1998 as a whole not asset by asset with an ldquoimplicit valuerdquo method
bull For assets built from 1998 to 2014 the RAB was set at replacement cost asset by asset taking into account the remaining regulatory asset lifetime of each asset
bull For assets built from 2015 onwards the RAB is calculated as the average between audited costs and investment reference values Therefore 1) If the TSO is able to build an asset at a cost below its reference value it retains half of the difference in the RAB as a reward but limited up to the 125 of the cost 2) On the other hand if the asset is built at a cost above the reference value only half of the difference will be taken into account in the RAB but limited to 125 of the reference value For assets built from 2018 onwards if the cost is higher than the reference value divided by 085 the transmission company has to submit a technical audit justifying the high costs
For unique TSO facilities such as international interconnectors or submarine cables connecting islands or to the mainland just audited costs are taken into account due to lack of reference values There are specific investment reference values for the TSO assets in the isolated energy systems of the Canary and Balearic Islands
DSO
bull For assets built until 2014 the RAB was set at replacement cost by multiplying the existing physical assets by the investment reference values for each asset type with an efficiency factor subtracting subsidies and assets built or financed by third parties This value was calculated for all RABs as of 31 December 2014 in aggregated terms
Ref C20-IRB-54-03
CEER Report on Regulatory Frameworks for European Energy Networks 2020
120156
taking into account the proportion of investments pending to recover in the statutory accounts of each DSO
bull For assets built from 2015 to 2017 the RAB is calculated as the average between audited costs and investment reference values If audited costs are lower than reference values only up to +125 of audited costs are considered
bull For assets built in 2018 RAB is calculated as the average between audited costs and investment reference values If audited costs are higher than reference values only up to +125 of reference values is considered if audited costs are lower than reference values only up to +125 of audited costs are considered
bull For assets built from 2019 onwards RAB is calculated considering the audited costs This introduces flexibility for companies in which type of assets to invest and allows them to make decisions based on technical reasons in order to adapt grids to the challenges of this period (digitalisation distributed generation and electrical vehicle) Nonetheless an adjustment is performed every three years in aggregated terms to set some limits average costs for each type of asset from year n-4 to n-2 are compared with investment reference values If they are higher than 105 there is a negative adjustment of 50 of the difference In contrast if costs are lower than 09 there is a positive adjustment of 50 of the difference
bull There are two specific terms in the RAB that account for investments in control centres remote control communications and in land where electrical assets are built after 1 January 2015 For them the RAB is based on audited costs
Depreciation (TSO amp DSO) RAB is recovered by a straight-line depreciation value Regulatory Asset Lifetime is set at 40 years for most assets (lines transformers etc) and 12 years for control centres Rate of Return (TSO amp DSO) Net RAB pending to recover is multiplied by the Rate of Return The Rate of Return has been calculated by using the WACC formula for this regulatory period (2020-2025) resulting 558 As it was set at 6503 previously it was exceptionally 6003 in 2020 so that the decrease per year is lower than 50 bp then dropping to 558 for 2021-2025 The CAPM model is used for the rate of return on equity Risk-free rate is the 10-year Spanish government bond beta coefficient is obtained as the average beta from a peer group of utilities Market Risk Premium is obtained from the DMS reportrsquos data for European countries The cost of debt is calculated as the average of IRS 10-year + CDS 10-year of the utilities in the peer group In the case that there were not CDS for a company its debt bonds (8-12 years) are used instead of IRS + CDS The proportion between debt and equity is set as the optimal regulatory gearing ratio -50 ndash but also taking into account the values of the peer group Operation amp Maintenance remuneration (OPEX) The TSO receives an allowance for OPEX that is calculated by multiplying the number of physical assets of each type by the OPEX reference values plus an efficiency term which allows TSO to retain part of the efficiencies gained in the previous regulatory period During the regulatory period the TSO has an incentive to operate and maintain the grid below reference values For TSO unique assets only unique OPEX values may apply There are also specific OPEX reference values for TSO assets in the isolated energy systems of the Islands
Ref C20-IRB-54-03
CEER Report on Regulatory Frameworks for European Energy Networks 2020
121156
DSOs receive an allowance for OampM (OPEX) included into a term named lsquoCOMGESrsquo which comprises OPEX and also a small part of investments not included in the electricity assets that have reference values It is updated within the regulatory period with a factor that establishes a proportion between this term and the investments in electric assets that have reference values An efficiency factor also adjusts COMGES to reflect the companyrsquos capacity to manage lsquoCOMGESrsquo costs Remuneration for the extended regulatory lifetime of assets (TSO amp DSO) Assets which regulatory lifetime has expired receive increased OPEX reference values to incentivise that they are kept under operation The increasing factor is 30 the first 5 years ranges from 30 to 35 from 5 to 10 years then from 35 to 45 from 10 to 15 years and after 15 years it keeps rising by 3 per year until it reaches 100 Remuneration for other regulated tasks (DSO only) DSOs receive the following revenues to perform other regulated tasks (1) metering (2) helping clients contract electricity revenues to support invoicing and to reduce non-payments by clients (3) Responding to telephone calls from clients (4) grid planning and (5) revenues to cover overhead costs Each type of revenues for other regulated tasks is calculated as a reference value multiplied by the number of clients There are different reference values for the first 1000 clients the first 10000 clients the first 100000 the first 1000000 the first 5000000 clients and above 5000000 clients DSOs are incentivised to perform these tasks at lower costs than those established as reference values per client as they retain the difference There is also a bonus term that takes into account the performance of the company in the previous regulatory period compared with an efficient company Incentivespenalties TSOs have an Incentive to maximise grid availability (-35 +25) DSOs have incentives to reduce grid losses (-2 +1 in 2020 and 2021 and to be determined later) and to improve quality of supply (-2 +2 the first 3 years and -3 +3 the last 3 years of the regulatory period) Penaltiesrsquo limits for quality of supply can be multiplied by 2 if the indicators are under a certain limit for 2 or more consecutive years An incentive to detect fraud (0 +15) will be also applied in 2020 and 2021 it will be later integrated into the incentive to reduce grid losses There is also a financial prudence penalty (after 2023) for both the TSO and DSOs with more than 100000 clients if a companyrsquos economic and financial ratios do not meet the recommended values of Communication 12019 It is limited to 1 of total revenues Gas Transmission and Distribution The current regulatory period ends 31 December 2020
TSO The current remuneration for the primary transmission network takes into account two components remuneration of availability and remuneration of continuity of supply The remuneration of availability includes OampM costs depreciation and financial remuneration calculated by applying the rate of return to the annual net value of the investment Regulatory Asset Base (RAB) For facilities commissioned before 2002 the assets value after the revaluation of 1996 (Royal Decree-Law 71996) minus subsidies received to finance these assets is considered For new facilities brought into service since 2002 the standard value of each investment set by the regulator is used while those investments that entail expansion are measured at actual cost Transport facilities brought into service since 2008 are valued at the average of the reference value and actual cost (audited)
Ref C20-IRB-54-03
CEER Report on Regulatory Frameworks for European Energy Networks 2020
122156
Depreciation The RAB is recovered by a straight-line depreciation value Regulatory lifetime is set at 40 years for all pipelines and 30 years for other transmission assets Rate of return The current rate of return is set at 509 For the next regulatory period the WACC formula will be used for the Rate of Return calculation Remuneration for Operation amp Maintenance (OPEX) Remuneration is based on technical characteristics by using reference OampM values Remuneration for continuity of supply It is a remuneration assigned to the following activities transmission regasification and underground storage which is then distributed to all facilities of each activity while they are in operation according to their standard replacement investment value The global remuneration is calculated on a yearly basis based on the prior-year remuneration multiplied by an efficiency factor and the changes in total national demand for gas Therefore it can be considered that the financial remuneration is made of two terms an explicit financial return (509 on the net value) and an implicit financial return obtained from the remuneration for continuity of supply Once the regulatory lifetime of the facilities has ended if the asset continues in operation the remuneration is calculated as OampM costs increased by a coefficient DSO The current remuneration has its origins in 2002 when it was established according to the real investments and operating costs of the Spanish distribution companies in 2000 The initial annual remuneration base was calculated for 2000 taking into account the following remuneration blocks Financial remuneration a rate of 677 (equivalent to a 10-year Spanish bond + 150 bp at that time) was applied to the inflated gross investment value of regulatory asset base in 2000 The RAB was obtained assuming the gross investment value of assets of 1996 updated to 2000 since this was the last balance sheet revaluation available Amortisation based on the gross asset investment costs in 2000 divided by the useful economic life of assets (20 years) Annual operating costs based on the accounting data from the industry players In a second step 2000 values were brought forward to 2002 This update was made taking into account the inflation rate and the average national demand growth over the period 2000-2002 adjusted with an efficiency factor of 07103 The remuneration of incremental distribution activities from 2002 to 2014 was based on the yearly updating of initial revenues set for 2002 according to a parametric formula that remunerated the increase (or loss) on new points of supply and delivery of higher (or lower) volumes of gas After Law 182014 the overall remuneration was reduced by euro110 million and the revenues are updated on a yearly basis by a parametric remuneration formula This formula calculates annual allowed revenue as the sum of the allowed revenue of the preceding year and additional revenue earned (or lost) during the current year from new points of supply acquired (or lost) and delivery of higher (or lower) volumes of gas In order to incentivise network expansion to non-gasified zones different reference values are used during the first 5 years depending on whether or not customers are in recently-gasified municipalities Additional regulated income (such as regulated inspections activation rights regulated services lines supply renewal revenues meter rents etc) is received by DSOs
Ref C20-IRB-54-03
CEER Report on Regulatory Frameworks for European Energy Networks 2020
123156
228 Sweden Gas TSO Gas DSO Electricity TSO Electricity DSO
Ma
rke
t
str
uc
ture
Network operators
1 6 2 170 (152+18)
Network length 600 km 3 429 km ~15 000 km 554 148 km Ownership
Foreign ownership
Municipality and foreign ownership
State owned (SVK) and private (Baltic
Cable)
State municipality private and foreign
ownership
Ge
ne
ral
fra
me
wo
rk
Authority Swedish energy markets inspectorate Ei
System Revenue cap
Period 4 Year (Current 2019-2022) 4 Year (Current 2020-2023)
Base year for next period
2021 2022
Transparency Information related to decisions are public on the NRAs webpage cost and production data efficiency scores different incentives calculations of the revenue caps and of the
WACC amongst other available data
Main elements for determining
the revenue cap
TOTEX (divided into CAPEX Non-
controllable OPEX and
Controllable OPEX) General efficiency target
of reducing 1 percent of
controllable OPEX annually
TOTEX (divided into CAPEX Non-
controllable OPEX and Controllable OPEX) General
efficiency target of reducing 1 percent
of controllable OPEX annually
TOTEX (divided into CAPEX Non-controllable OPEX and Controllable
OPEX) Incentives for good quality of supply General efficiency
target of reducing 1 percent of
controllable OPEX annually
TOTEX (divided into CAPEX Non-
controllable OPEX and Controllable
OPEX) Incentives for good quality of supply
Individual efficiency benchmark
(reduction of controllable OPEX)
Legal framework
Naturgaslagen (Gas Act) Ellagen (Electricity Act)
Rate
of
retu
rn
Type of WACC Real WACC pre- tax
Determination of the rate of
return on equity
CAPM 119903119890 = 119903119891 + 120573 lowast (119903119898 minus 119903119891) + 119864119909119905119903119886 119903119894119904119896119901119903119890119898119894119906119898
Rate of return on equity
before taxes
For gas in 1137 = (4+ 079 5 + 15) (1 - 021) For electricity in 544 = (09 + 051 668) (1 - 0208)
Use of rate of return
The debt share is derived from market values of European comparison companies that are publicly traded (49 debt 51 equity for electricity and 44 debt 56 equity for
gas)
Reg
ula
tory
as
se
t
ba
se
Components of RAB
Fixed assets divided into Meters pipelines stations storage and
regasification assets (not assets under construction)
Fixed assets divided into Lines Cables Buildings Shuntreactors transformers
switchgear stations cable cabinet control-equipment meters and IT-system (not
assets under construction)
Regulatory asset value
2018 SEK ~69 Billion
2018 SEK ~75 Billion
Replacement values 2018 in SEK
~69 Billion
Replacement values 2018 in SEK
~295 Billion
RAB adjustments
Adjusted for inflation adjustments ex post for new investments and disposals
Dep
rec
iati
on
s
Method Real linear (Straight line) depreciation
Depreciation ratio Meters 25 years
Pipelines 90 years Stations40 years (storage50 years)
Meters 12 years Pipelines90 years Stations 40 years
(Regasification assets 25 years)
In total 17 asset categories and 6
different depreciation times
Typically 60 year for lines and 40 for
cables
In total 17 asset categories and 6
different depreciation times Typically 40 year for lines and 50 for
cables
Consideration The depreciation is fully integrated into the revenue cap
Ref C20-IRB-54-03
CEER Report on Regulatory Frameworks for European Energy Networks 2020
124156
Introduction The electricity and gas networks are examples of natural monopolies as it would be both economically and environmentally unreasonable to have competing infrastructures available for each customer This means that the network operators (DSOs and TSOs) have limited or no competition To be the only seller in a price-inelastic market entails possibility for the operator to increase prices and thereby increase profits To ensure that the network operators do not make unreasonably high profits regulation needs to be in place The Swedish energy markets inspectorate Ei is the NRA responsible for designing the regulation in a way that minimises the welfare losses from monopoly power The main objective with the regulation is to ensure that the network operators do not make monopoly profits while retaining efficient operations of the grid with a good quality of supply In this way high quality and fair prices will be ensured for the customers Ei regulates both the gas and the electricity sector and the size of the regulated operators span from around 10 connections for the smallest operators to over 800000 customers for the largest operators In the electricity market there are currently 170 DSOs and two TSOs in Sweden The Swedish TSOs are Affaumlrsverket Svenska Kraftnaumlt (SVK) and Baltic Cable (BC) With a few exceptions SVK owns and operates all parts of the transmission system Baltic Cable (BC) owns one transmission line connecting the electricity grid between Sweden and Germany All other entities that operate power systems in Sweden are defined as DSOs The 170 DSOs are of varying size and ownership structure (state municipal private and other) and they each have a so-called concession (permission) for the distribution of electricity either for a defined geographical area (in total 152 local DSOs) or for specific lines (in total 18 regional DSOs) The concession means a privilege but also entails several obligations which are governed by laws and a regulation Ei monitors that the network operators follow the existing rules Eirsquos role as the NRA is for example to ensure that customers have access to a power distribution system to provide incentives for cost efficient operation with acceptable reliability and with objective reasonable and non-discriminatory tariffs The gas market is relatively small in Sweden and consists of one TSO Swedegas one storage facility owned by Swedegas (RAB value in SEK ~460 Million at 2015) one regasification facility (RAB value in SEK ~104 million at 2015) and 6 DSOs There is no distribution system for gas in the northern parts of Sweden Historical Development The Swedish electricity market was deregulated in 1996 since then generation and trading of electricity are exposed to competition The network operations in their capacity as natural monopolies are subject to regulation Since the deregulation multiple regulation methods have been implemented One example is that in 2003 a performance-based tariff regulation was introduced where fictive reference networks were used Until 2012 Sweden used ex-post regulation where each year was treated as a regulatory period From 2012 ex-ante revenue cap regulation has been used In the regulation the regulator shall decide on each network operatorsrsquo revenue caps after a proposal from each company The revenue cap shall cover reasonable operational costs and a reasonable return on the assets used in the distribution and transmission A trend in Sweden amongst the DSOs is that the operators merge into fewer and larger companies At the end of the 1950s there were more than 1500 companies and in the early 1980s the number had dropped to 380 companies Today there are under 200 network operators under Eirsquos regulation
Ref C20-IRB-54-03
CEER Report on Regulatory Frameworks for European Energy Networks 2020
125156
Determining the Revenue Caps The regulatory model of Sweden is based on different cost items Firstly there is the division between capital expenditure CAPEX and operating expenditure OPEX The latter cost is in turn divided in controllable and non-controllable OPEX The controllable OPEX is based on data reported from the network operators on historical costs the costs are reduced yearly by an efficiency target (see further on efficiency benchmarking) This requirement to increase productivity is not applied for the non-controllable OPEX The non-controllable OPEX are estimates provided by the network operators prior to the period that are corrected for actual outcome ex post For CAPEX the assessment of the regulatory asset base is the first (and plausibly the most important) part The regulatory asset base is valued by the principle of replacement value for the existing assets and adjusted for age Investments and disposals of assets under the regulatory period is estimated prior to the period and corrected for the actual outcome ex-post Investments and disposals are reported for every 6-month period The norm for rate of return is decided by the method of WACC The different costs are adjusted for inflation to have the same price level Any deviations from the revenue cap will be added to the cap in the next period For the electricity network operators there are incentives for efficient use of the network and to have a good security of supply The security of supply incentive is set as a norm for the period based on historic data on interruption (AIT AIF and CEMI) The data on interruptions after the regulatory period is compared to the historical norm and the return on capital is adjusted in relation to the change of quality The incentive for efficient use of the network has the same outline as the other incentive with a norm set prior to the period that is compared with the actual outcome after the period As indicators for efficient use of the network the average load factor and network losses are used Together the two incentives can affect the yearly return for the network operators with plusmn 33 For the gas network operators no such incentives exist According to Section 51-2sectsect of the Swedish Electricity Act the revenues will be fixed in advance for each regulatory period consisting of four calendar years unless there are special reasons to use another period of time In the decision of the revenue cap the data and methodology used in the determining the revenue cap should be described (3sect) The Electricity Act states that the cap should cover the reasonable costs of conducting grid activities during the supervisory period and provide a reasonable return on capital (equity) needed to carry out the activity Regarding the design of the tariffs the legislation says that ldquoGrid tariffs should be objective non-discriminatory and promote efficient use of the networkrdquo (Section 4 1sect law 2009892) Otherwise the network operators are free to design their tariffs as they please Ei have been given the right to design secondary legislation on how the electricity network operators can structure their tariffs and a project to overlook the tariff structure is ongoing Quality Regulation For electricity there are as mentioned above incentives for efficient use of the network and for good security of supply For the gas market there are currently no quality regulations in place Under a regulatory regime that provides incentives to cut costs there is a risk that operators will refrain from undertaking the necessary investments or measures to achieve the required or potential savings To counter this in the electricity market quality norms are integrated in the cap If norm values for delivery are exceeded (fewer outages than the norm indicates) during the regulatory period the operator will get an increased revenue cap for the coming regulatory period The purpose is to give incentives for future improvement in quality
Ref C20-IRB-54-03
CEER Report on Regulatory Frameworks for European Energy Networks 2020
126156
Operators achieving above-average quality in past years will have an amount added to their cap while operators with comparatively poor-quality levels will have amounts deducted Like the security of supply incentive the regulation includes incentives to reduce network losses and to have a stable average load factor Prior to the period reference values are set for losses and load factor If a company can outperform the reference value they will get an increase in the cap if they preform worse they will get a deduction of the cap The adjustments based on the incentives are calculated annually and are limited to plusmn33 of the operatorsrsquo return on the asset base Beyond this the network operators will need to economically compensate customers for outages longer than 12 hours Outages longer than 24 hours are illegal and when they happen the operators must come up with a plan for it not to happen in the future Every DSO should on a yearly basis submit data to Ei on a customer level For the reliability incentive scheme data about outages between 3 minutes and 12 hours is used (both longer and shorter outages are also reported) Outages above 12 hours are excluded to not punish DSOs twice Efficiency Benchmarking The gas network operators have a general efficiency requirement to annually reduce 1 percent of their controllable OPEX The reason for a general requirement rather than firm-specific efficiency targets is due to the small number of operators In a benchmarking analysis based on only a few operators the results are likely to underestimate the technological level making the operators look more efficient than they are There is also a lot of heterogeneity amongst the Swedish gas network operators making it difficult to compare them to each other The same target is set for the electricity TSOs also due to a lack of comparable operators For the electricity DSOs an efficiency benchmarking model is used to estimate firm-specific potential for efficiency improvements The benchmarking involves assessing the operators individual costs against the services they provide and determining each DSOs cost efficiency compared to the other DSOs In the benchmarking process Ei uses a DEA model to compare the inputs (controllable OPEX and CAPEX) to the outputs (number of customers delivered electricity high and low voltage the highest effect against overhead grid and number of network stations) for the DSOs By the choice of variables some structural differences are accounted for to some extent for example the number of network stations works as a proxy for customer density The calculations are based on the average of four years of historical data The efficiency requirement is based on the controllable OPEX The maximal improvement potential has been set to 30 with a realisation time of eight years (two regulatory periods) and the DSOs get to keep 50 of their realised improvements This results in a maximal requirement (lowering of the revenue cap) of 75 of a DSOs controllable OPEX To also incentivise the relative efficient operators to improve a minimum level have been set to 1 annually of the controllable OPEX Determining the Regulatory Asset Base and Reasonable Return For electricity the regulatory asset bases in Sweden are based on norm-values which is a way to estimate the replacement value for all assets In total there are 17 asset categories in the asset base with six different depreciation times for which the asset base is adjusted before calculating the operators allowed return In Sweden a real linear depreciation method is used to estimate depreciation costs The depreciation times are currently set between 10 to 60 years (with possibilities for the addition of 25 extra lifespan if the assets are functional after their regulatory lifespan) For the gas network operators indexed acquisition values are used
Ref C20-IRB-54-03
CEER Report on Regulatory Frameworks for European Energy Networks 2020
127156
as the primary method to determine the value of the asset base The depreciation times for gas assets are stated in the table above To determinate the rate of return for the network operators a weighted average cost of capital WACC method is used both for electricity and gas The WACC gives allowance for the cost of debt and the cost of equity To calculate an efficient debt ratio European network operators that are publicly traded are observed since they should have incentives to minimise their costs in order to maximise shareholdersrsquo utility The debt part of the WACC is based on the risk-free rate of return and a credit risk-premium based on the ratings for the publicly traded comparison networks To determinate the cost of equity the capital asset pricing model CAPM is used The same European comparison network operators as earlier are used for estimating the beta value while the market risk-premium and the risk-free rate of return are based on Swedish market data Except from this the gas network operators also receive an extra risk-premium due to differences in risk structure than the European comparison network operators no such risk premium exists on the electricity side How to determinate a reasonable rate of return for network operators has been widely discussed in Sweden and the network operators have multiple times appealed Eis decisions and argued for a higher rate of return For the electricity regulation period 2020-2023 the government have decided on new legislation on how to determine a reasonable rate of return and added more differentiated depreciation time for network assets this has lowered the real WACC pre-tax to 216 from previous 585 For the gas network operators where no such regulation exists Ei has decided on a real WACC before tax on 652 for the regulatory period 2019-2022 based on previous rulings in court Transparency Information guides to reporting and how to calculate the revenue cap along with Eirsquos calculations and decisions are published on the webpage of the NRA
Ref C20-IRB-54-03
CEER Report on Regulatory Frameworks for European Energy Networks 2020
128156
3 Economic Theory and the Regulatory System In the past cost-based regulation approaches (rate-of-return regulation or cost-plus regulation) were widely used for tariff regulation purposes The rate-of-return model guarantees the regulated company a certain pre-defined rate of return on its regulatory asset base Another approach is cost-plus regulation in which a pre-defined profit margin is added to the costs of the company Evidently the regulated company has no incentive to minimise its costs under a cost-based regulation framework because it can increase its profits by simply expanding the asset or cost base Under cost-plus regulation a company may have an incentive to signal incorrect costs to the regulator or to even opt for wasting resources in order to increase the cost base (ldquogold-platingrdquo) As a response to the major drawbacks of the cost-based regulation incentive-based approaches to tariff regulation were first developed in Great Britain and are currently applied in many other countries Incentive-based regulation can be characterised by the use of financial rewards and penalties to induce the regulated company to achieve the desired goals (generally in form of an efficient cost base) while the company is allowed some discretion in how to achieve them Rewards and penalties replace a lsquocommand and controlrsquo form of regulation and provide incentives to the company to achieve the goals by allowing it to share the lsquoextra profitrsquo in case it over-fulfils the targets set by the regulator In general incentive-based regulation aims at cost control ndash so that grid users later could benefit from lower costs in a quantitative way through lower tariffs in the future
31 Regulatory System in Place Most European countries use incentive-based regulation in the form of a revenue cap The tables in Annex 4 accompanying this report41 which contains the NRA answers to the questionnaires underline the usage of this regulatory instrument In general most countries use a mixture of a cap regulation (revenue or price) and a guaranteed rate of return A revenue cap regulation can thereby be seen as an indirect price cap regulation where the revenue is the result of price multiplied with the quantity Nowadays a cost-plus regulation is an exception and is only used in a few countries Electricity transmission is regulated by incentive methods in 19 out of 25 countries Revenue caps are set by 15 NRAs From the beginning of the regulatory period 2016 - 2019 for the transmission of electricity Belgium introduced a considerable number and amount of extra incentives to increase efficiencies foster market integration and security of supply and support related research activities The Belgian TSO has strongly taken those into account In electricity distribution 21 NRAs apply incentive regulation Price caps are used by seven NRAs and 14 NRAs use revenue caps Gas transmission is regulated by incentive methods in 21 countries A limitation by caps is used by 19 countries sometimes even with a mixture of price and revenue caps In six countries a rate of return is implemented In gas distribution incentive-based methods are applied by 22 countries In four countries a mixture of incentive and cost-based methods is applied and eight NRAs use a cost-based regulation
41 Annex 4 is uploaded as a separate document on the same webpage as this report
Ref C20-IRB-54-03
CEER Report on Regulatory Frameworks for European Energy Networks 2020
129156
32 Efficiency Requirements Efficiency requirements stimulate the network operators to reduce costs and to work more efficiently One way of implementing these requirements is to reduce the allowed revenues year by year The tables in Annex 4 show whether the NRAs set efficiency requirements (lsquoX-factorsrsquo) on OPEX and CAPEX The survey revealed that a majority of the NRAs in electricity and gas focus on cost saving on the OPEX side On the CAPEX side nearly 20 of respondents have efficiency requirements applied This result is independent of the type of energy (gaselectricity) and the market layer (TSODSO) In some cases an efficiency requirement is applied to TOTEX (CAPEX+OPEX) One country (Belgium) uses different efficiency requirements depending on the region of the country
33 General Overview of System Operators Some regulatory regimes distinguish between the TSO functions of transport and of system operation For electricity the tasks of a system operator cover the complete area of activities for operating electric power systems including security control and quality in terms of fixed technical standards principles and procedures but also the synchronous operation of interconnected power systems42 This activity includes balancing services primary and secondary reserves capacity management ancillary services (disturbance reserves voltage support) and the purchase of energy for congestion management and redispatching This activity excludes day-to-day management of the network functionality For gas system operation includes ancillary services and congestion management It also includes the maintenance of the security of supply in the natural gas system by the coordination of entry and exit agents and the balancing of the natural gas system This activity also excludes day-to-day management of the network functionality In almost all countries all functions are within one company and there is no separation of transport and system operation In some countries there is no separation but separated financial accounts per function Therefore there is no different regulatory treatment at this point In the gas sector only Finland and Spain separate the transport and system operation functions
331 Regulatory System in Place and Efficiency Requirements In most cases a common methodology for setting the revenues for both functions is used In case that there are separated market functions a separate x-factor (efficiency requirement) is applied on the OPEX or even on the TOTEX
332 Operational Expenses (OPEX) The operational expenses of the system operators consist of the components of personnel and operating cost Sometimes additional components are included and there are also operational expenses of the system operator that are excluded from the allowed revenue To obtain the items that integrate the OPEX the financial as well as the regulatory accounts are used
333 Capital Expenses (CAPEX) To calculate the rate of return for System Operator (SO) investments in all countries the same methodological components (WACC and CAPM) are used and the same rate is used as for the transmission investments
42 Definition used by the Agency for the Cooperation of Energy Regulators (ACER)
Ref C20-IRB-54-03
CEER Report on Regulatory Frameworks for European Energy Networks 2020
130156
334 Incentives and Penalties In general there are no incentives or penalties included in the methodology derived from the fulfilment of the system operator functions and therefore in most cases there is no related cap for the incentives or penalties In some countries there are incentives or penalties included in the methodology derived from the fulfilment of the system operator functions like a bonusmalus system for the procurement of balancing and loss energy in Germany or incentives for solving technical restrictions in Spain
335 Tariffs Half of the NRAs which have a separated treatment of system operators do not have a special tariff for the revenues of the system operators For these NRAs the general tariffs are used In other cases there is a special third-party access tariff (eg in Portugal) In Spain the remuneration of the electricity system operator is satisfied 50 by electricity producers according to their available capacity and 50 by retailers and direct consumers For the Spanish gas system operator the revenues are collected as a percentage of the tolls and fees collected
336 Allowed Revenue If there are deviations between the system operatorrsquos collected revenues and the system operatorrsquos allowed revenues most NRAs make an adjustment at the latest two years later after which the difference is settled In the Czech Republic a correction factor is applied
Ref C20-IRB-54-03
CEER Report on Regulatory Frameworks for European Energy Networks 2020
131156
4 Calculation of the Rate of Return Most regulatory systems allow for a rate of return on investments In this chapter we discuss how such returns are set
41 Methods Used of the Rate of Return There are different possible methods to calculate the rate of return Mostly a WACC factor (Weighted Average Cost of Capital) is used In general WACC can be expressed in a simplified manner by the following formula
WACC= 119864119902119906119894119905119910
(119864119902119906119894119905119910+119863119890119887119905)lowast 119862119900119904119905 119900119891 119890119902119906119894119905119910 +
119863119890119887119905
(119864119902119906119894119905119910+119863119890119887119905)lowast 119862119900119904119905 119900119891 119889119890119887119905
NRAs can distinguish between nominal or real and before and after taxation as well as a ldquoVanillardquo WACC43 For electricity network regulation the most popular approach is to use nominal WACC before taxation (as can be seen in the tables of Annex 4 accompanying this report) The otherwise most commonly used method for calculation of the rate of return is the real weighted average cost of capital before taxation which is used by about 25 of the NRAs In the gas sector the nominal WACC before taxation approach is popular as well however the real weighted average cost of capital before taxation is also frequently used (WACC nominal 50 WACC real 30) In addition it is remarkable that four NRAs do not use WACC in the regulation of electricity and gas TSOs and Germany also does not use WACC in the regulation of electricity and gas DSOs
42 Year of Rate of Return Estimation and Length of Regulatory Period To obtain information about the length of regulatory periods and the different tariff years in the individual regulatory systems a time series from 2009 to 2020 was considered In general the majority of NRAs evaluate (or adjust) the rate of return parameters in the year before the regulatory period starts The year before the regulatory period starts is used as a lsquophotorsquo or base year in which the rate of return parameters are evaluated or adjusted for TSOs as well as for DSOs Most NRAs make no distinction between gas and electricity There are only a few Member States that evaluate or adjust the parameters two or three years before start of the regulatory period The typical regulatory period is between three and five years regardless whether it is a TSO or a DSO the electricity sector or the gas sector Just a few Member States use a yearly regulatory period or a period which is longer than five years One country (Estonia) uses an undefined regulatory period so the operator can submit data at any time
43 Rate of Interest The weighted average cost of capital (WACC) is a factor applied to an asset volume to calculate a rate of return However as a companys capital generally consists of both equity and debt capital rates of interest for both of these must be calculated when determining a suitable return
43 This is the weighted average cost of capital using a pre-tax cost of debt and a post-tax cost of equity
Weighting factors
Ref C20-IRB-54-03
CEER Report on Regulatory Frameworks for European Energy Networks 2020
132156
431 Risk-free Rate The risk-free rate is the expected return on an asset which bears in theory no risk at all ie whose expected returns are certain44 In other words the risk-free rate is the minimum return an investor should expect for any investment as any amount of risk would not be tolerated unless the expected rate of return was greater than the risk-free rate The risk-free rate can be described as either ldquonominalrdquo or ldquorealrdquo The nominal interest rate is the amount in money terms of interest payable The real risk-free rate excludes inflation and reflects the pure time value of money to an investor The relationship between nominal and real risk-free rates and inflation can be expressed as follows45
(1 + nominal risk-free rate) = (1 + real risk-free rate) x (1 + inflation) In practice it is not possible to find an investment that is free of all risks However freely traded investment-grade government bonds can generally be regarded as having close to zero default risk and zero liquidity risk
4311 Evaluating Risk-free Rates There are only marginal differences in the individual regulatory systems concerning evaluating the risk-free rate Most NRAs evaluate the risk-free rate on the basis of government bondsrsquo interest rates The risk-free rates are usually evaluated on the basis of their own national government bond interest rates Some regulators however use the interest rates based on the government bonds of selected foreign countries (AA or higher rated) or OECD averages In most cases they use the same methodology for all network operators but in some countries there are differences in approaches between both electricity and gas sector and between transmission and distribution The main reason for such differences is that the risk-free rates have not been evaluated at the same time The most frequently used bonds have maturities of ten years but also lower year bonds appear In addition it is remarkable that Germany uses maturities of 1 2 5 10 20 and 30 years Most CEER Member countries use historical averages but in relation to the years of historical analysis there is no uniform usage The majority of NRAs apply 1 5 or 10 years of historical analysis independent of electricity or gas sector and TSO or DSO regulation
4312 Values of Nominal and Real Risk-free Rates There are different values of nominal and real risk-free rates used by regulators In order to compare the value of risk-free rates the Member States were also asked if the risk-free rate used is nominal or real The conclusions could be drawn that most of the NRAs use nominal risk-free rates (only a few countries use real risk-free rates) and the typical value of nominal risk-free rate is between 10 and 40 Nevertheless the values of the risk-free rates also depend on the year of assessment
44 IRG ndash Regulatory Accounting Principles of Implementation and Best Practice for WACC calculation February
2007 wwwergeuintdocpublicationserg_07_05_pib_s_on_waccpdf 45 S Ross R Westerfield B Jordan Essentials of Corporate Finance IrwinMcGraw-Hill 1996 p 248
Ref C20-IRB-54-03
CEER Report on Regulatory Frameworks for European Energy Networks 2020
133156
432 Debt Premiums In corporate debt finance the debt risk premium is the expected rate of return above a (determined) risk-free interest rate The risk premium is determined as the margin between the risk-free rate and the corporate bond rate It expresses the incentive for an investor to invest in the corporation instead of investing in for example secure government bonds
4321 Evaluating Debt Premiums In the tables of Annex 4 the approach towards debt premiums (where applied) their value the applicable year and a short description of the evaluation are shown The evaluation of the values of debt premiums differs from NRA to NRA They are usually estimated on the basis of market analysis provided by external experts and internal comparative analysis conducted by the NRAs but some of them also use country ratings The values rather reflect the borrowing conditions for network operators which are seen as companies with good ratings The values of debt premiums used by the regulators are in most cases between 040 and 200 Portugal uses a debt premium of 25 for electricity and 275 for gas The values of the debt premium differ marginally from electricity to gas regulation and TSOs to DSOs Only a few CEER Member countries do not use debt premiums in their regulatory system
4322 Real Cost of Debt in Tariff Calculation The tables in Annex 4 show the value of the real cost of debt In order to make the cost of debt applied by the NRAs more comparable the debt premium was (in most cases) added to the real risk-free rates The survey shows that for the majority of the analysed countries the real cost of debt is in a range between 15 and 40 Only a few countries use a real cost of debt at less than 1 or higher than 6 Concerning the year of evaluating real cost of debt most NRAs apply years between 2015 and 2019 Just a few countries use years before 2013
433 Market Risk Premiums Market risk premium could be defined as the excess return that the overall stock market provides over an investment at the risk-free rate This is determined by comparing the returns on equity and the returns on risk-free investments This excess return compensates investors for taking on the relatively higher risk of the equity market The size of the premium will vary as the risk changes (in the stock market as a whole) high-risk investments are compensated with a higher premium
4331 Evaluating Market Risk Premiums The surveyed countries should give information about the value of the market risk premium the year of evaluation and the NRArsquos approach for evaluating it The value of the market risk premium is often in the range of 4 to 5 independent of electricity or gas sector and TSO or DSO regulation Only a few NRAs use market risk premiums with a lower or higher value It is noteworthy that Romania uses the highest value for the gas market (69 for DSOs and TSOs) and Portugal uses the highest value for the electricity market (766 for DSOs ndash including a country risk spread) Concerning the year of evaluation of the market risk premium most Member States apply years between 2015 and 2019 As in the case of debt premiums the values of market risk premiums are also based on a market analysis NRAs also use the reports prepared by the expert group Dimson Marsh Staunton and the analysis provided by Damodaran46
46 httpspapersssrncomsol3paperscfmabstract_id=299335
Ref C20-IRB-54-03
CEER Report on Regulatory Frameworks for European Energy Networks 2020
134156
434 Capital Gearing Gearing could be defined as the proportion of assets that were funded from borrowed funds It is necessary for calculating the WACC when the weighting factors have to be determined
As shown in subchapter 41 the formula 119863119890119887119905
119864119902119906119894119905119910+119863119890119887119905 defines the gearing
4341 Evaluating the Gearing Ratio The questionnaire for this report included the values of the gearing for the year of evaluation and a short description of the evaluation by the NRAs Most of the countries use a gearing between 40 and 60 In general the same value is used for all sectors be they TSOs or DSOs Only a few countries make use of different values and if they do so the value changes only minimally Concerning the year of evaluation of the gearing most CEER Member countries apply years between 2015 and 2019 The majority of NRAs base the gearing ratio on expertsrsquo reports or market analysis
435 Taxes The tax value could be defined as the rate of income tax paid by the network operators
4351 Evaluating the Tax Value The tables in Annex 4 show the value of the tax rates used by the NRAs Additionally the year of evaluation and a short description of the evaluation is included The NRAs filled in the value of the corporate tax or the corporate income tax (depending on the name which is used) which apply to the network companies The value of corporate tax depends on the national tax system Most of the CEER Member countries use a corporate tax rate between 20 and 30 only a few NRAs are situated below or over this value In general the same value is used for all sectors be they TSOs or DSOs Only a few countries make use of different values if this is the case the value only changes slightly Concerning the year of the gearing ratio evaluation most countries apply years between 2015 and 2019 In many regulatory systems the tax value is defined by law
436 Beta An asset beta could be described as a quantitative measure of the volatility of a given stock mutual fund or portfolio relative to the overall market The asset beta therefore reflects the business risk in the specific market where the company operates A beta of one corresponds to the expectations of the market as a whole a beta above one is more volatile than the overall market while a beta below one is less volatile The beta of a company is calculated after subtracting its debt obligations thus measuring the non-diversifiable risk Asset (unlevered) beta removes the effects of leverage on the capital structure of a firm since the use of debt can result in tax rate adjustments that benefit a company Removing the debt component allows an investor to compare the base level of risk between various companies An equity beta could be defined as an indication of the systematic risk attached to the returns on ordinary stocks Equity beta accounts for the combined effects of market and financial risks that the stockholders of a company have to face It equates to the asset beta for an ungeared firm or is adjusted upwards to reflect the extra riskiness of stocks in a geared firm
Ref C20-IRB-54-03
CEER Report on Regulatory Frameworks for European Energy Networks 2020
135156
The dependence between the asset and equity beta is usually presented by the following formula
eszlig = aszlig[1+(1-t)(DE)] where eszlig = equity beta aszlig = asset beta t = tax rate D = Debt E = Equity DE ndash gearing ratio Sometimes in the calculation of the equity beta the influence of taxes is not taken into account In this case the formula for calculation equity beta is as follows
eszlig = aszlig[1+DE]
4361 Evaluating the Asset and Equity Beta The questionnaire included the NRAsrsquo approach for asset and equity beta evaluation The majority of NRAs evaluate beta values by using both external and internal market analyses The most frequently applied approach in the calculation of equity beta is to use the formula which includes tax Some regulators use a formula which does not include tax and Belgium Great Britain and Hungary use direct equity beta without a calculation of asset beta Due to the different gearing ratios a comparison of equity betas could be misleading In order to make the values comparable the asset beta was calculated The calculation was based on the value of equity betas and gearing ratios used by the regulators The formulas presented above were used in this calculation
4362 Betas in the Regulation The tables in Annex 4 show asset beta aszlig = eszlig[1+(1-t)(DE)] andor aszlig = eszlig(1+DE) used in tariff calculation for the electricity and gas TSOs and DSOs The values of asset beta calculated with [aszlig = eszlig[1+(1-t)(DE)] are in the electricity sector as well as in the gas sector typically in the range between 03 and 05 The values of asset betas calculated with [aszlig = eszlig[1+DE]] are generally lower The values for the electricity and gas sectors are between 026 and 04
Ref C20-IRB-54-03
CEER Report on Regulatory Frameworks for European Energy Networks 2020
136156
5 Regulatory Asset Base In general the Regulatory Asset Base (RAB) serves as an important parameter in utility regulation in order to determine the allowed profit The structure of individual components included into the RAB and their valuation differ significantly among CEER Member countries and even among the regulated sectors The RAB value is usually also linked with depreciation depending on an individual NRArsquos approach In general the RAB provides for remuneration of both historic and new investment The RAB should be formed by the assets necessary for the provision of the regulated service in their residual (depreciated) value The RAB can be comprised of several components such as fixed assets working capital or construction in progress Other elements such as capital contributions of customers government (eg subsidies) and third parties on the contrary are usually excluded The RAB may be valued according to different methods (eg historical costs indexed historical costs or actual re-purchasing costs) which will have an influence on the determination of the CAPEX A RAB based on indexed historical costs would therefore require the use of a real instead of a nominal WACC As a result it is important to understand the relation between the RAB definition and the WACC structure
51 Components of the RAB The following subchapter analyses the approach taken by NRAs towards fixed assets working capital assets under construction contribution from third parties and leased assets with respect to their inclusionexclusion to the RAB
511 Tariff Calculation In general the role of the RAB is very important for the tariff calculation Most of the countries use the RAB as one component (multiplied with the WACC) for calculating the allowed revenue With a determined revenue the necessary tariffs can also be calculated Concerning the question of whether 100 of RAB is used in tariff calculation all surveyed NRAs answered with lsquoyesrsquo for electricity TSOs For the other sectors (electricity DSOs gas DSOs gas TSOs) most of the countries use 100 of RAB in tariff calculation Only Poland (for gas DSOs and TSOs) does not use 100 of RAB for the tariff regulation
512 Fixed Assets Fixed assets also known as a lsquonon-current assetrsquo is a term used in accounting for assets and property which cannot easily be converted into cash Fixed assets normally include items such as lines and pipes land and buildings motor vehicles furniture office equipment computers fixtures and fittings and plant and machinery
According to the survey data submitted all NRAs count the fixed assets into the RAB In Poland gas network assets are included in the RAB at net present value
513 Working Capital Working capital represents operating liquidity available to company Working capital is considered as a part of operating capital Net working capital is calculated as current assets minus current liabilities
Working Capital = Current Assets Net Working Capital = Current Assets minus Current Liabilities
Ref C20-IRB-54-03
CEER Report on Regulatory Frameworks for European Energy Networks 2020
137156
The answers to the survey showed that approximately a third of the NRAs include working capital into the RAB therefore the majority of countries do not take working capital into the RAB It should be noted that only in parts of Belgium is working capital is taken into the RAB in the electricity and gas DSO regulation For the Flemish region they calculate working capital into the RAB whereas in the Walloon and Brussels regions they do not take working capital into the RAB In Finland accounts receivables and inventories are allowed into the RAB in book values however excluding cash equivalents or other receivables In Estonia the level of working capital is determined as 5 of the three-year average sales revenue and in Norway as 1 of the book value In Germany only working capital which is necessary for the operations is included and in Luxembourg the working capital is approved if duly justified
514 Assets Under Construction Assets under construction are a special form of tangible assets They are usually displayed as a separate balance sheet item and therefore require a separate account determination in their asset classes Cost includes all expenditures incurred for construction projects capitalised borrowing costs incurred on a specific borrowing for the construction of fixed assets incurred before it has reached the working condition for its intended use and other related expenses A fixed asset under construction is transferred to fixed assets once it has reached the working condition for its intended use Ordinary depreciation is not allowed for assets under construction in most countries Even if from the accounting point of view these assets are not included in the fixed assets the NRAs from a regulatory perspective do sometimes include such cost in the RAB for remuneration as shown in the survey About half of the NRAs responded that electricity transmission and distribution assets under construction are included in the RAB In gas transmission and distribution a few NRAs responded that assets under construction are included into the RAB Some countries have certain conditions for assets under construction to be included in the RAB eg for certain categories of investments as a transition before phase-out or a length of construction of more than two years In Luxembourg also financing costs of assets under construction may be considered under working capital
515 Contribution from Third Parties Contributions from third parties such as connection fees contributions from public institutions EU funding under cohesionstructural funds or EU grants under Decision No 13642006EC which lays down guidelines for trans-European energy networks are often deducted by the NRAs from the RAB (lsquoringfencingrsquo) This approach is based on the reasoning that to the extent the asset (partly or in total) was not financed by the regulated entity it should not be included in the RAB and remunerated The survey shows that the vast majority of the NRAs deduct such contributions from the RAB in the electricity and gas sector for both TSO and DSO regulation Only a few countries take contributions from third parties into the RAB in their regulation
Ref C20-IRB-54-03
CEER Report on Regulatory Frameworks for European Energy Networks 2020
138156
516 Leased Assets According to International Financial Reporting Standards (IFRS)47 finance lease assets must be shown on the balance sheet of the lessee with the amounts due on the lease also shown on the balance sheet as liabilities This is intended to prevent the use of lease finance to keep the lease liabilities off-balance sheet According to a number of national accounting standards however it is possible to consider these assets as the OPEX and keep them off-balance sheet The attached tables (in Annex 4) show that around 40 of the surveyed NRAs include leased assets into the RAB For DSO regulation Belgium includes leased assets only for the Flemish Region and not for the Walloon or Brussels Regions Most countries which do not include leased assets consider them as OPEX Some countries have certain conditions for leased assets to be included in the RAB eg for certain types of leases or do not always base them on IFRS
52 Determination of Initial Regulatory Asset Value The value of the RAB on which the companies earn a return in accordance with the regulatory cost of capital (ie the weighted average cost of capital where applicable) is crucial for the calculation of the regulatory revenue The value of the assets included into the RAB could be expressed either in terms of historical costs or re-evaluated values Whilst the historical cost approach values the RAB with reference to the costs that were actually incurred by the company to build or acquire the network the re-evaluated values represent the costs that would hypothetically be incurred at the time of re-evaluation of the assets
521 Historical Costs The method of valuation of the RAB in historical costs is applied in regulatory regimes where the assets of regulated companies were not re-evaluated or in the regimes where NRAs keep a regulatory database of the historical values of the assets As the historical costs do not reflect a decrease in the real value of the assets caused by the inflation some NRAs make use of the indexed historical cost method In electricity and gas TSO and DSO regulation most of the surveyed NRAs do not base RAB exclusively on historical value of assets
522 Re-evaluation of Assets The re-evaluation of fixed assets is a technique that may be required to accurately describe the true value of the capital goods a business owns The purpose of a re-evaluation is to bring into the books the fair market value of fixed assets This may be helpful in order to decide on selling one of its assets or inserting part of the company into a new company Re-evaluation of assets was conducted in many countries following the unbundling of vertically integrated companies where separate network companies were established
47 International Financial Reporting Standards (wwwifrsorg)
Ref C20-IRB-54-03
CEER Report on Regulatory Frameworks for European Energy Networks 2020
139156
Other reasons for re-evaluation mentioned in the survey were very high inflation rates and the consolidation processes of regulated companies In some regulatory regimes a re-evaluation of distribution assets is conducted annually according to the IFRS accounting standards Even though the most frequently applied method was depreciated replacement costs for the sake of comparison it is crucial to know when the last re-evaluation was performed This is the major difference among countries surveyed The re-evaluation is be done in two ways either once or on a frequent basis One of the main advantages of the annual re-evaluation is that an NRA works with the real asset values and does not need to deal with the significant increase of RAB of market circumstances The surveyed countries answered the question of whether the RAB is exclusively based on re-evaluated assets and if yes how they influence the level of RAB Overall it should be noted that only a few CEER Member countries (25) base the RAB on re-evaluated assets Some of them index RAB annually by using different index eg retail price index or construction industry index or they evaluate assets on the basis of historical costs In electricity transmission the RAB is exclusively based on the re-evaluated assets in six countries the Czech Republic Great Britain Italy Latvia Poland and Sweden For gas transmission and distribution the situation is almost the same The Czech Republic France Great Britain Hungary Ireland Italy Latvia and Sweden base the RAB exclusively on the re-evaluated assets
523 Mix of Historical and Re-evaluated Assets Six NRAs apply a mix of historical values and re-evaluated assets In Germany the equity-financed share of old assets is indexed at replacement values for the cost determination The debt-financed share of old assets is valued at historical values New assets are always valued at historical values In Luxembourg assets are valued at historical costs Old assets (capitalised before 1 January 2010) may as an option be evaluated as follows a fraction of old assets is valued at historical costs (up to the debt ratio 50 of all old assets) and at indexed historical costs (up to the equity ratio 50) In Hungary in the case of natural gas TSOs and DSOs the self-owned fixed assets were re-evaluated except the other technical machines equipment and tools which were accepted at book value Since one of the two natural gas TSOs was established in 2015 its assets were not re-evaluated at all but were accepted at book value
53 Difference Between the RAB Defined on the Net Book Values and the RAB Based on Re-evaluated Asset Base
The CEER Member countries were asked for the difference (in percentage terms) between the RAB defined on net book values according to national GAAP (or IFRS) and the RAB based on re-evaluated asset base The purpose of this question was to find out if there is any difference between net book value and RAB Regulated companies may have re-evaluated the assets but the NRA for regulation purposes could approve only part of those assets
Ref C20-IRB-54-03
CEER Report on Regulatory Frameworks for European Energy Networks 2020
140156
The survey shows that in the electricity as well as in gas sector in nearly 75 of the countries there is no difference between net book value and RAB If there is a difference between net book value and RAB the percentages vary greatly from 30 to over 120 It is noteworthy that Hungary generally has the highest percentage variance (RAB to NBV)
54 Monetary Value of Regulated Assets on Historical Cost Basis and Monetary Value of Re-evaluated Regulated Assets
The survey includes the question of the monetary value of regulated assets on a historical cost basis and the monetary value of re-evaluated regulated assets (in both cases aggregated for all companies) Nearly half of the surveyed NRAs are unable to make a statement concerning this and some of them are not allowed because of confidential information The monetary values of regulated assets and re-evaluated regulated assets are very different and vary from country to country It cannot be said that the amount of the values depends on a specific sector
55 RAB Adjustments The RAB is ordinarily adjusted annually within the regulatory period when the value of the new investments is taken into consideration and the value of the depreciation is deducted According to the survey responses almost three quarters of the NRAs adjust the RAB during the regulatory period and the annual recalculation of the net book value (new investment depreciation) is the most common approach Concerning the question of whether the adjustment affects net book values by accounting for new investments andor depreciation most countries confirm this Usually the book value is calculated by adding investments and subtracting depreciations The survey also enquired whether NRAs adjusted the RAB within the regulatory period to correspond the real values of the RAB by some kind of progression index In Great Britain the RAB is indexed for inflation using RPI (Government retail price index of inflation including interest costs) and in Italy the gross fixed investment deflator measured by the National Institute of Statistics is used
56 RAB Conclusions From a balance sheet perspective fixed assets are the most significant items in the energy industry Also according to the responses of the energy regulators fixed assets were without exception indicated as a component of the RAB A third of the regulators additionally include working capital in the RAB albeit with specific rules for its determination and inclusion Less than half of the regulators in the gas and electricity distribution sectors and in the gas transmission sector include the investment in progress in the RAB For electricity transmission on the other hand the ratio is inversed and investment in progress is more often than not included in the RAB The contribution by third parties is deducted from the RAB by nearly all NRAs with only a few exceptions From the responses one can conclude that the most common way of calculating the RAB components is the historical costs method followed by the re-evaluated assets method with the mixture of these two methods applied only rarely In all countries surveyed other adjustments were not mentioned
Ref C20-IRB-54-03
CEER Report on Regulatory Frameworks for European Energy Networks 2020
141156
6 Depreciations Depreciation decreases the asset value through use and the shortening of theoretical asset life and should also allow a firm to cover replacement investment costs during the economic lifetime of an asset Concerning the duration of depreciation the economic lifetime of the asset should be taken into account in a forward looking long-run approach
The two most common approaches towards depreciation are lsquostraight linersquo and lsquoacceleratedrsquo depreciation The straight-line depreciation method spreads the cost evenly over the life of an asset On the other hand a method of accelerated depreciation such as the double declining balance (DDB) allows the company to deduct a much higher share in the first years after purchase
61 Overview Almost all NRAs use the straight-line approach towards depreciations Once the NRA has decided on a depreciation method (straight line or accelerated depreciation) this method is applied for both gas and electricity system operators in the country For both electricity and gas regulation most NRAs have the same depreciation rate for typical TSO and DSO network assets even when not the case there is usually only a marginal difference One question to the NRAs was ldquoWhich values of depreciation are allowed into the regulationrdquo The regulators predominantly use the same value of depreciation for TSOs and DSOs There may be some minor differences between the two Additionally the NRAs use different depreciation values with the majority using historical values in different variations For the most part the linear method is applied for the depreciation of the regulated assets The lifetime of a typical network asset ranges from 30 to 50 years and the majority of NRAs use the individual depreciation rate for each type of asset However in some regulatory frameworks the average rate for all companies and all assets is applied As with RAB valuation the depreciation of assets could be based on historic values re-evaluated values or on a mixture of these two methods The vast majority of regulators allowed depreciation of tangible and intangible assets valued on the same basis as the RAB in their regulation hence clear correlation between these values can be observed
Ref C20-IRB-54-03
CEER Report on Regulatory Frameworks for European Energy Networks 2020
142156
7 Incentives and Improvements Incentives are one of the central elements of the regulatory regimes in European countries Due to the absence of a competitive environment for network operators regulation has been introduced Instead of defining all the working processes of the regulated network operators most regulatory regimes only constitute a certain framework that aims to give incentives to network operators in a certain direction The next subchapter and the corresponding tables in Annex 4 give an overview of the established incentives At the end of this chapter the trending topics and regulatory improvements which are currently planned or implemented are highlighted
71 Description of the Incentives Established The pace of technological changes has intensified in recent years These changes should be taken into account at the transmission and distribution network level Therefore at both network levels of the electricity sector we find some incentives regarding the installation and operation of smart grids and smart meters At the electricity DSO level there are also some incentives established for the integration of renewable distributed generation In general more incentives are implemented in the electricity sector than in the gas sector Furthermore some countries have individual incentives established in their regulatory regime For example the Spanish regulatory regime includes at the electricity TSO level incentives to not exceed the investment eligible for remuneration incentives to promote an adequate economic and financial capacity a suitable capitalisation and a sustainable debt structure and incentives to extent the useful remuneration lifetime of assets in order to avoid the electricity system to incur in unnecessary investment costs Finland as an example for gas TSO incentives regulation has established incentives for investments quality efficiency and innovation The investment incentive consists of the incentive impact of unit prices and the straight-line depreciation calculated from the adjusted replacement value The quality incentive is based on a quality bonus method in which the reward and sanction are defined on fixed steps and where undelivered energy is used as a quality indicator Annual undelivered energy is benchmarked against the TSOs reference level which is determined by undelivered energy over eight years The target level and upper and lower quarters determining reward andor sanction are derived from the reference level The efficiency reference level is based merely on the operatorrsquos own historical costs In the first year of the regulatory period the average of the previous four-year regulatory period realised controllable operational costs is used as the benchmark for efficiency costs In the following years the benchmark will be the reasonable controllable costs of the previous year Innovation incentive encourages the TSO to develop and use innovative technical and operational solutions in its network operations The key objectives of research and development activities are the development and introduction of smart grids and other new technologies and methods of operation Acceptable costs for research and development (RampD) must be directly related to creation of new knowledge technology products or methods of operations At the electricity DSO level again Spain is one of the countries which has implemented several additional incentives such as investment control incentive a financial prudence incentive an assets lifetime extension incentive and innovation support
Ref C20-IRB-54-03
CEER Report on Regulatory Frameworks for European Energy Networks 2020
143156
Finally Ireland could be mentioned as a country with individual incentives at the gas DSO level They have established incentives for building new connections a better customer performance an incentive to reduce shrinkage against target values and incentives for controllable OPEX and CAPEX
72 If There are no Incentives Established Several NRAs are planning to implement different incentives in their regulatory regime to react to the changes occurring in energy markets For instance Luxembourg will continue to have specific measures for interconnection projects within the new tariff methodology for 2021 Norway is considering changing the tariff structure in order for the demand for MW to influence the tariff for all customers This could give incentives for more demand response For the gas sector Croatia will have a review of the overall tariff setting regulation frame for third regulatory period (2022-2026) Spain is planning some incentives at TSO and DSO level integration of vehicular gas enhancement of cost-efficiency investments and operation incentive for financial prudence incentive to reduce losses in gas transmission pipelines and distribution network etc
73 Trending Topics and Regulatory Improvements The current trending topics which the network operators and the NRAs have to deal with are a mixture of general tasks and new tasks and strategies caused by changes in energy markets Many NRAs are preparing for the next regulatory period As such the existing current situation of the tariffs is analysed and adjustments are made The use or change of the WACC system is also one of the trending topics for the NRAs Due to the energy transition NRAs have to deal with new tasks such as the integration of renewable energies e g wind solar and biogas the installation of smart grids and meters and the necessary investments in new lines pipes and new technology Here the right adjustments and the implementation of incentives are needed to prepare the networks for their new andor changed tasks The integration of flexibility also plays an important role for NRAs here The upgrading of networks to what is often termed a lsquosmart gridrsquo usually comes with a need to be able to transfer huge amounts of data Thus the implementation of data hubs to manage these data is also currently growing in importance
Ref C20-IRB-54-03
CEER Report on Regulatory Frameworks for European Energy Networks 2020
144156
8 Conclusions This CEER report analysed different regulatory systems of electricity and gas networks in most individual EU Member States Great Britain Northern Ireland Iceland and Norway It provides a general overview of the regulatory practices in place the calculation of a rate of return the determination of the regulatory asset base (RAB) and the depreciation of assets in different regulatory systems All these components give an impression of the conditions for possible investments in electricity and gas networks in Europe It is not the intention of this report to paint a complete picture of the existing regulatory framework For example the costs of OPEX and their treatment within the regulatory systems are not considered in this report Furthermore other important factors which are difficult to measure (such as the stability of the regulatory framework or regulatory processes) are not addressed in this report although they play a key role in the decisions of investors When interpreting the figures which are used as the background for the reportrsquos content and which are presented in the tables of Annex 4 accompanying this report the regulatory framework must be considered as a whole as singling out selected parameters would distort the overall picture Nevertheless this report provides detailed information about the regulatory framework and indirect information about the investment conditions in each country offering helpful insights The report shows that different countries have different characteristics in their respective regulatory systems But also that there are many parallels between the regulatory regimes that can be identified (as seen in chapter 2) For the method of asset valuation the WACC is the preferred method by many NRAs Whereas the real WACC was used for the profitability calculation of the re-evaluated assets the nominal WACC is used for the assets in historical values The RAB can be comprised of several components including fixed assets working capital or constructions in progress There is thus some variation amongst NRAs According to the survey data almost all NRAs include the fixed assets in the RAB In contrast with respect to the working capital more than half of NRAs do not include working capital in the RAB or use a derived notion of that working capital depending on whether the electricity or gas system operator is considered The ldquoconstruction in progressrdquo component gives the same result as working capital Less than half of the NRAs surveyed allow assets under construction in the RAB The RAB value is usually linked with depreciation depending on the NRA In gas and electricity regulation straight line depreciation is applied by most NRAs The surveyed NRAs use different depreciation values with the majority using the historical values in different variations The lifetime of the typical network asset ranges from 30 to 50 years and the majority of the NRAs use the individual depreciation ratio for each type of asset
For a deeper analysis of investment conditions it would be useful to take a closer look at other parameters such as costs per unit share of CAPEX TOTEX or the consideration of total costs
Ref C20-IRB-54-03
CEER Report on Regulatory Frameworks for European Energy Networks 2020
145156
Finally the developments of the energy networks in Europe should regularly be analysed closely in the future due to changes caused by the energy transition The switch from conventional to renewable energy sources a growing cooperation between (and inside) European energy networks and the integration of smart elements into the networks can be seen as the next challenges for network operators but also for the national authorities
Ref C20-IRB-54-03
CEER Report on Regulatory Frameworks for European Energy Networks 2020
146156
Annex 1 ndash Lists of Abbreviations
General Abbreviations
Term Definition
ACM Authority for Consumers and Markets (Netherlands)
ANRE National Regulatory Authority for Energy (Romania)
BNetzA Bundesnetzagentur (Germany)
bp Basis Point
CEER Council of European Energy Regulators
CAPEX Capital expenditure
CAPM Capital Asset Pricing Model
CBA Cost-benefit analysis
CPI Consumer price index
CRE Commission de Reacutegulation de lrsquoEacutenergie (France)
CRU Commission for Regulation of Utilities (Ireland)
DDB Double declining balance
DEA Data Envelopment Analysis
DSO Distribution System Operator
DUR Danish Utility Regulator
ECA Estonian Competition Authority
Ei Swedish Energy Markets Inspectorate
ERO Energy Regulatory Office (Czech Republic)
ERSE Entidade Reguladora dos Serviccedilos Energeacuteticos (Portugal)
GAAP General Accepted Accounting Principles
HEA Hungarian Energy and Public Utility Regulatory Authority
HERA Croatian Energy Regulatory Agency
HICP Harmonised Index of Consumer Prices
IFRS International Financial Reporting Standards
ILR Institut Luxembourgeois de Reacutegulation (Luxembourg)
ITO Independent Transmission operator
LNG Liquefied natural gas
MOLS Modified ordinary least squares
NRA National Regulatory Authority
NBV Net Book Values
NERC National Energy Regulatory Council (Lithuania)
NPV Net Present Value
NVE-RME Norwegian Water Resources and Energy Directorate
OPEX Operational expenditure
PUC Public Utilities Commission (Latvia)
RAB Regulated asset base
Ref C20-IRB-54-03
CEER Report on Regulatory Frameworks for European Energy Networks 2020
147156
Term Definition
RAE Regulatory Authority for Energy (Greece)
RAV Regulatory asset value
ROI Return on Investment
RoR Rate of return
RP Regulatory Period
SFA Stochastic Frontier Analysis
TOTEX Total expenditures
TSO Transmission System Operator
TYNDP Ten-year network development plan
URE Urząd Regulacji Energetyki (Poland)
URSO Regulatory Office for Network Industries (Slovakia)
WACC Weighted average cost of capital
Ref C20-IRB-54-03
CEER Report on Regulatory Frameworks for European Energy Networks 2020
148156
Annex 2 ndash List of Questions
Ref C20-IRB-54-03
CEER Report on Regulatory Frameworks for European Energy Networks 2020
149156
Ref C20-IRB-54-03
CEER Report on Regulatory Frameworks for European Energy Networks 2020
150156
Ref C20-IRB-54-03
CEER Report on Regulatory Frameworks for European Energy Networks 2020
151156
Ref C20-IRB-54-03
CEER Report on Regulatory Frameworks for European Energy Networks 2020
152156
Ref C20-IRB-54-03
CEER Report on Regulatory Frameworks for European Energy Networks 2020
153156
Ref C20-IRB-54-03
CEER Report on Regulatory Frameworks for European Energy Networks 2020
154156
Ref C20-IRB-54-03
CEER Report on Regulatory Frameworks for European Energy Networks 2020
155156
Ref C20-IRB-54-03
CEER Report on Regulatory Frameworks for European Energy Networks 2020
156156
Annex 3 ndash About CEER The Council of European Energy Regulators (CEER) is the voice of Europes national energy regulators CEERrsquos Members and Observers comprise 39 national energy regulatory authorities (NRAs) from across Europe CEER is legally established as a not-for-profit association under Belgian law with a small Secretariat based in Brussels to assist the organisation CEER supports its NRA membersobservers in their responsibilities sharing experience and developing regulatory capacity and best practices It does so by facilitating expert working group meetings hosting workshops and events supporting the development and publication of regulatory papers and through an in-house Training Academy Through CEER European NRAs cooperate and develop common position papers advice and forward-thinking recommendations to improve the electricity and gas markets for the benefit of consumers and businesses In terms of policy CEER actively promotes an investment friendly harmonised regulatory environment and the consistent application of existing EU legislation A key objective of CEER is to facilitate the creation of a single competitive efficient and sustainable Internal Energy Market in Europe that works in the consumer interest Specifically CEER deals with a range of energy regulatory issues including wholesale and retail markets consumer issues distribution networks smart grids flexibility sustainability and international cooperation CEER wishes to thank in particular the following regulatory experts for their work in preparing this report Sina Wildenhain (BNetzA) Tim Harlinghausen (BNetzA) and Michiel Odijk (ACM) More information is available at wwwceereu
Ref C20-IRB-54-03
CEER Report on Regulatory Frameworks for European Energy Networks 2020
5156
32 Efficiency Requirements 129
33 General Overview of System Operators 129
331 Regulatory System in Place and Efficiency Requirements 129
332 Operational Expenses (OPEX) 129
333 Capital Expenses (CAPEX) 129
334 Incentives and Penalties 130
335 Tariffs 130
336 Allowed Revenue 130
4 CALCULATION OF THE RATE OF RETURN 131
41 Methods Used of the Rate of Return 131
42 Year of Rate of Return Estimation and Length of Regulatory Period 131
43 Rate of Interest 131
431 Risk-free Rate 132
432 Debt Premiums 133
433 Market Risk Premiums 133
434 Capital Gearing 134
435 Taxes 134
436 Beta 134
5 REGULATORY ASSET BASE 136
51 Components of the RAB 136
511 Tariff Calculation 136
512 Fixed Assets 136
513 Working Capital 136
514 Assets Under Construction 137
515 Contribution from Third Parties 137
516 Leased Assets 138
52 Determination of Initial Regulatory Asset Value 138
521 Historical Costs 138
522 Re-evaluation of Assets 138
523 Mix of Historical and Re-evaluated Assets 139
53 Difference Between the RAB Defined on the Net Book Values and the RAB Based on Re-evaluated Asset Base 139
54 Monetary Value of Regulated Assets on Historical Cost Basis and Monetary Value of Re-evaluated Regulated Assets 140
55 RAB Adjustments 140
56 RAB Conclusions 140
6 DEPRECIATIONS 141
61 Overview 141
Ref C20-IRB-54-03
CEER Report on Regulatory Frameworks for European Energy Networks 2020
6156
7 INCENTIVES AND IMPROVEMENTS 142
71 Description of the Incentives Established 142
72 If There are no Incentives Established 143
73 Trending Topics and Regulatory Improvements 143
8 CONCLUSIONS 144
ANNEX 1 ndash LISTS OF ABBREVIATIONS 146
ANNEX 2 ndash LIST OF QUESTIONS 148
ANNEX 3 ndash ABOUT CEER 156 ANNEX 4 ndash COLLECTED amp FILLED OUT TABLEShelliphelliphelliphelliphelliphelliphelliphelliphelliphelliphelliphelliphelliphellipSeparate files ANNEX 5 ndash CASE STUDIEShelliphelliphelliphelliphelliphelliphelliphelliphelliphelliphelliphelliphelliphelliphelliphelliphelliphelliphelliphelliphelliphelliphelliphelliphellipSeparate file
Ref C20-IRB-54-03
CEER Report on Regulatory Frameworks for European Energy Networks 2020
7156
1 Introduction This report is the 2020 version of a series of annual reports drafted and issued by the Council of European Energy Regulators (CEER) It provides a general overview of the regulatory systems for electricity and gas networks in most EU Member States Great Britain Northern Ireland Iceland and Norway in 2020 A major focus is placed on the calculation of a classic and adequate rate of return the determination of the regulatory asset base (RAB) and the depreciation of assets in the different regulatory regimes Other factors may also influence the work of the regulated network operators or the decisions of investors including for example the time required for permitting processes or the overall stability of the implemented regime However these equally important aspects go beyond the scope of this report and are therefore not covered in this analysis In respect to this the reader should be aware that the parameters presented in this study must be interpreted in the context of a whole country-specific regulatory regime CEER considers that in a system with a mature regulatory framework the regulatory review will generally be a package of different decisions which need to form a coherent whole As tariff regulation schemes are highly complex a direct comparison of certain parameters such as capital costs is difficult and should only be done in the context of the whole regulatory system CEER addressed this challenge by undertaking a survey among CEER Members which focused on the main elements for determining allowed revenues This data was then subject to a basic comparison and a number of conclusions were drawn This report includes data submitted by the National Regulatory Authorities (NRAs) of Austria Belgium Croatia Czech Republic Denmark Estonia Finland France Germany Great Britain Greece Hungary Iceland Ireland Italy Latvia Lithuania Luxembourg Netherlands Northern Ireland Norway Poland Portugal Romania Slovakia Slovenia Spain and Sweden (27 countries) The data collection covering the current regulatory regimes in 2020 took place in the first half of 2020 In comparison to the previous report no major changes were found in respect of the most important parameters The tables of chapter 3 and 7 used for the queries have been modified slightly for better clarity and understanding In addition to the second chapter two more countries took the opportunity of authoring a national case study which describes their regulatory regime in a more detailed manner with tables and calculation examples (Annex 4)1 For further details regarding differences or developments one can consult last yearrsquos report
1 Annex 4 is uploaded as a separate document on the same webpage of CEER as this report
Ref C20-IRB-54-03
CEER Report on Regulatory Frameworks for European Energy Networks 2020
8156
2 Compact Description of the Regulatory Framework There is some variation in the number size and structure of electricity and gas network operators across European countries partly because of how individual European countries have developed in the past However network operators are universally regarded as natural monopolies requiring regulation by NRAs As each country decides on the type and structure of its regulatory system it is not appropriate to compare individual systems directly Examining the different systems does however make it possible to identify similarities between them No one system is unique Rather each system makes use of a toolbox of regulatory instruments reflecting the current state of thinking about regulation in a country It is often the case that several regulatory systems employ the same tools or combinations of them However such tools are used in accordance with their suitability in the national context This chapter describes most European regulatory systems The subsections describe the regulatory framework per country without going into great detail Any questions regarding specific features should be directed to the individual NRA that provided the description This chapter is intended to provide assistance to both NRAs and potential investors It may provide supporting materialuseful background information in the event of a possible change in the national regulatory system or if key data from other regulated countries are compared In addition it gives investors an overview of the prevailing returns and terms for planned investments Each national description includes a fact sheet listing the key regulations and figures that provides an overview
Ref C20-IRB-54-03
CEER Report on Regulatory Frameworks for European Energy Networks 2020
9156
21 Austria
Gas TSO Gas DSO Electricity TSO Electricity DSO
Ma
rke
t
str
uc
ture
Network operators
2 21 2 130
Network length
Electricity UHV 6700km HV 11400km MV 69000km LV 173400 km Gas transm amp regional distrib 3100km high-pressure distrib 4100km local low-pressure distrib
35600km
Ownership Private and public Private and public Private and public Private and public
Ge
ne
ral
fra
me
wo
rk
Authority E-Control
System Incentive regulation ndash price cap
Incentive regulation ndash price cap
Cost+ regulation Incentive regulation
ndash price cap
Period 2021-2024 (4yrs) 2018-2022 (5yrs) Annual 2019-2023(5yrs)
Base year for next period
TBD TBD 2019 TBD
Transparency Method decision
Current regulatory framework
FAQs Current regulatory
framework
Main elements for
determining the revenue
cap
Efficiency scores increase in WACC
for taking full volume risk
indexed historic depreciated costs to
determine RAB
Efficiency scores and general
productivity offset network price index
and expansion factors efficiency dependent WACC
Costs of t-2 ex ante costs
according to network
development plan
Efficiency scores and general
productivity offset network price index
and expansion factors efficiency dependent WACC
Legal framework
Gas act 2011 (GWG 2011) Electricity act 2010 (ElWOG 2010)
Rate
of
retu
rn
Type of WACC Mixed WACC pre-taxes based on real cost of equity (share 40) and nominal cost of debt (share
60) beta transformation Modigliani-Miller
Nominal WACC pre-taxes (equity share 40 debt share 60 beta transformation Modigliani-Miller)
Determination of the rate of
return on equity
rE=(real risk-free rate + levered Beta
x MRP)(1 - tax rate) +volume risk
premium
rE=(nominal risk-free rate + levered Beta x MRP)(1 - tax rate)
Rate of return on equity
before taxes
894 (real pre-tax set in 2020 incl volume risk
premium of 35) = (026 +
08545)(1-025)+35
816 (nominal pre-tax set in 2017 granted for the
average efficient DSO)
=(187+0855)(1-025)
816 (nominal pre-tax set in 2017)
=(187+0855)(1-025)
816 (nominal pre-tax set in 2018 granted for the
average efficient DSO)
=(187+0855)(1-025)
Use of rate of return
rE real pre-taxes indexed equity
financed RAB + rD book values of debt
financed RAB
WACC nominal pre-taxes RAB (book values)
Reg
ula
tory
as
se
t
ba
se
Components of RAB
Intangible and fixed assets book values
for debt financed share of assets and
indexed historic costs for equity
financed share of assets
Intangible and fixed assets book values
Intangible and fixed assets book values
and ex-ante determination of
investments according to the
network development plan
Intangible and fixed assets book values
Regulatory asset value
Historic cost appr for debt and
Historic cost approach
Ref C20-IRB-54-03
CEER Report on Regulatory Frameworks for European Energy Networks 2020
10156
Introduction
E-Control the Austrian NRA for the electricity and gas industry was established in 2001 in concert with liberalising the electricity market on 1 January 2001 and the gas market on 1 October 2002 Regulated tariffs for the transmission and distribution of electricity and gas apply in contrast to generation and supply of energy where a market operates On an annual basis E-Control is obliged to determine the costs and volumes of two electricity TSOs approximately 60 electricity DSOs and 21 gas DSOs Furthermore the regulator has to approve a tariff methodology as proposed by the two gas TSOs The regulatory commission then performs the task of setting the tariffs with the costs and volumes provided by E-Control For the relevant legislation of the electricity sector (most pertinently the Electricity Act ElWOG 2010) please refer to httpswwwe-controlatrechtbundesrechtstromgesetze and of the gas sector (mainly the gas act GWG 2011) to httpswwwe-controlatrechtbundesrechtgasgesetze respectively Historical Development While the electricity TSOs are still regulated with an annual cost+ methodology attempts to introduce an incentive regulation framework for the electricity DSOs started in 2003 Two intensive rounds of cost auditing procedures (in 2004 and 2005) delivered an agreement that a long-term incentive regulation framework with stable and predictive conditions would be preferable The first incentive regulation period started in 2006 for electricity DSOs and the first for the gas DSOs in 2008
With the introduction of the Electricity Act 2010 and the Gas Act 2011 the scope for legal appeals were not only extended to the companies under regulatory control but also to the Austrian Chamber of Commerce and the Austrian Chamber of Labour two major customer representatives These Chambers have the same legal rights to challenge the official decision fixing the previously mentioned costs and volumes that are determined by E-Control Not only do the customer representatives have the right to appeal but they are also included in negotiations with industry representatives and associations over various regulatory parameters such as the weighted average cost of capital (WACC) general productivity factors (XGen) and the regulatory framework in general
indexed historic cost appr for equity
up to 2020 For investments
occurring 2021 and onwards a nominal WACC approach
applies
RAB adjustments
None
RAB developments during a regulatory
period are taken into account and lead to
changes of the regulated cost base
None
RAB developments during a regulatory period are taken into account and
lead to changes of the regulated cost
base
De
pre
ci-
ati
on
s Method Straight line
Depreciation ratio
Depending on asset type lines 2-3 transformers 4-5 substations 4
Consideration Pass through Pass through Pass through Pass through
Ref C20-IRB-54-03
CEER Report on Regulatory Frameworks for European Energy Networks 2020
11156
Current Regulatory Frameworks Electricity Transmission The two Austrian electricity TSOs are regulated with an annual cost+ methodology Those costs and volumes are audited on an annual basis on the least available costs in t-2 (historical values) to the year (t) where the tariffs are in force This general framework to rely on historical values is abrogated for investments according to the ten-year network plan which is subject to approval by E-Control Capital costs are recognised ex-ante in line with paragraph 38(4) of ElWOG 2010 In order to overcome the t-2 delay the approved historic controllable costs are adjusted with a network price index and an individual efficiency offset besides a general efficiency requirement to current costs Non-controllable costs consist of ancillary services secondary control network losses and costs due to network expansion within the ten-year network plan among others where no efficiency requirements are applied in line with paragraph 59(6) of ElWOG 2010 The individual efficiency factor stems either from CEERrsquos international E3Grid Benchmarking procedure (if the TSO participated) or from other sources that are appropriate (eg the efficiency outcome of the distribution grid) Additional elements included into the cost+ framework permit the companies to earn a bonus if ex-ante set targets on various market relevant duties (eg facilitation of competition in reserve markets) are met The regulatory account ensures that the company bears no volume risk at all Differences resulting from deviations between planned (t-2) volumes and actual volumes are considered when setting new tariffs in the following years An adder is granted to the nominal weighted average cost of capital (WACC) to promote and facilitate investments Although both electricity TSOs are cost+ regulated annually the WACC and its adder are granted for a time-span in line with the 3rd regulatory period for gas DSOs (ie 2018-2022) Gas Transmission In contrast to both the electricity and the gas distribution sectors E-Control is not obliged to approve the costs and volumes on an annual basis E-Control approves a tariff methodology which is submitted by the TSOs as a proposal After approval the NRA sets costs and volumes according to these principles for the whole duration of a regulatory period of four years The tariffs are set for this period and do not change within the period
The regulatory framework for gas transmission is quite different from the other sectors as it consists of a forward-looking tariff methodology It applies to the regulatory period of 2021-2024 The regulatory asset value (RAV) is split into debt and equity financed shares and consists of book values for the former and current indexed values for the latter This differentiation is applied to all assets commissioned prior to 2021 Due to this procedure the debt finance share of the RAV is remunerated with a nominal rate of debt (161) and the equity financed RAV with a real rate of equity (544 before taxes excl volume risk premium) For investments occurring in 2021 and onwards a nominal WACC pre-tax of 358 is granted As there is by law no regulatory account (to account for differences in estimated or historical volumes and actual ones) foreseen for the gas TSOs these entities bear the full volume risk in contrast to the three other sectors To compensate these companies for the volume of risk they bear the real rate of equity is lifted by 350 basis points (bp) Forward-looking costs are adjusted with an efficiency factor consisting of an individual and a general component In total the requirement amounts to 15 pa and is the result of negotiations between customer representatives and the TSOs This value is based on a self-assessment by the TSOs Costs for planned investments are considered ex-ante and aligned with actual investments in the next regulatory period
Ref C20-IRB-54-03
CEER Report on Regulatory Frameworks for European Energy Networks 2020
12156
The current methodology for gas TSOs foresees an uplift of the equity return by 150 bp in case of RampD investments (pilot projects) Eligible pilot projects must enhance the efficiency of operation and should bear a positive economic surplus (cost benefit analysis) If external research funds grant a subsidy these grants are not deducted from allowed OPEX A major change from previous methodologies is a now symmetric bonus-malus scheme for operating targets (ie environment and safety for workers minimum quality requirements critical infrastructure protection) A description of the tariff methodology for the period 2021-2024 is published in English at the following link httpswwwe-controlatenmarktteilnehmergasnetzentgeltemethodenbeschreibung Electricity Distribution The current 4th regulatory period for electricity DSOs has been effective since 1 January 2019 and lasts until 31 December 2023 (a five-year period) The regulatory framework was adopted for the 4th regulatory period to be in line with the methodology that was established for the gas distribution sector one year in advance
The TOTEX inflation-adjusted budget constraint with general and individual productivity offsets was replaced by a similar procedure to OPEX and an introduction of an efficiency-adjusted WACC for the cost of capital While depreciation is a pass-through based on a t-2 principle the income of occurred investments is granted The return on these investments is adjusted with the company specific efficiency values taken from a national benchmarking analysis that relies on the two methods MOLS (modified ordinary least squares) and DEA (data envelopment analysis) and varies between a bandwidth of +- 05 around the WACC of 488 for the average efficient DSO A calibration mechanism ensures that the system is cost neutral ie the rewards for above average performance equal the penalties for below average performance The OPEX which is determined for the base year of a regulatory period is adjusted via a network price index (consisting of a consumer price index and a wage index) a general productivity offset (095) and an individual efficiency factor annually The individual efficiency factor is derived from a national relative efficiency estimate (with the benchmarking models based on TOTEX MOLS and DEA across a time span of 75 years (one and a half regulatory periods) in which the inefficiencies have to be removed In the previous period this time span amounted to ten years Investments occurring during the regulatory period are treated as average-efficient until a new benchmarking analysis is performed at the beginning of the next period The capital costs of these investments are considered with a t-2 delay A mark-up on the WACC is also applied to encourage investments Besides the annual treatment of the capital costs an operating cost factor is adjusting the budget during the regulatory period for a change in service provision This change is measured as an annual deviation in line length of high medium and low voltage level as well as metering points to the corresponding values in the base year The deviations (increase or decrease of line lengths and metering points) are multiplied with specific operating cost estimates and increase or decrease the approved budged during the regulatory period The OPEX cost+ mechanism for the smart metering roll-out was replaced for the 4th period with a lump sum remuneration that not only provides an incentive to undercut this granted flat-value but also to decrease the administrative burden for the NRA
Ref C20-IRB-54-03
CEER Report on Regulatory Frameworks for European Energy Networks 2020
13156
A regulatory account further ensures that effects due to the t-2 principle do not translate into windfall profits or losses to the network operators Gas Distribution The current 3rd regulatory period for gas DSOs started on 1 January 2018 and ends on 31 December 2022 (five-year period) and includes major changes when compared to the 2nd regulatory period The TOTEX inflation adjusted budget constraint with general and individual productivity offsets was replaced by a similar procedure to OPEX and an introduction of an efficiency-adjusted WACC for the cost of capital While depreciation is a pass-through based on a t-2 principle the income of occurred investments is granted The return on these investments is adjusted with the company specific efficiency values taken from a national benchmarking analysis that relies on the two methods MOLS and DEA and varies between a bandwidth of +- 05 around the WACC of 488 for the average efficient DSO The initially introduced parameters k1 and k2 ensure a setting where the outcome is not cost-neutral and rewards above-average efficient DSOs This means that a total of five million euros per year for above average performance and -2 million euros per year for below average efficiency Investments occurring during the regulatory period are treated as average-efficient until a new benchmarking analysis is performed at the beginning of the next period The capital costs of these investments are considered with a t-2 delay A mark-up on the WACC is also applied to encourage investments Besides the annual treatment of the capital costs an operating cost factor is adjusting the budget during the regulatory period for a change in service provision This OPEX-factor is similar to the factor for electricity DSOs as mentioned above with two further incentives for DSOs to acquire new customers and to encourage development of the gridrsquos density (providing services to more customers with the existing grid lengths) A regulatory account further ensures that effects due to the t-2 principle do not translate into windfall profits or losses to the network operators Both customer representatives ndash the Austrian Chamber of Commerce and the Austrian Chamber of Labour ndash have appealed against the official decisions (the cost determinations according to the controversial regulatory model) of all gas DSOs In autumn 2019 and spring 2020 around a third of all cases have been settled by the respective DSOs and the customer representatives The settlement consists of an adjustment of k1 and k2 in a cost-neutral manner as well as an increase in the general productivity requirement (slight increase from 067 to 083 pa) Due to the settlement the bandwidth of the efficiency dependent WACC is further narrowed and spans now between 455 for the minimum efficient DSO to 505 for the efficient DSO (with 488 to the average efficient DSO) The remaining cases are still pending at the federal administrative court but are expected to be settled with the same outcome A quality regulation is considered inappropriate as suitable indicators have not been identified yet Despite this minimal quality standards on commercial quality besides norms for product quality are already in effect The description of the 3rd regulatory period for gas DSOs is only available in German and published at the following link httpswwwe-controlatmarktteilnehmergasnetzentgelteentgeltermittlungsverfahren
Ref C20-IRB-54-03
CEER Report on Regulatory Frameworks for European Energy Networks 2020
14156
22 Belgium Gas TSO Gas DSO Electricity TSO Electricity DSO
Ma
rke
t
str
uc
ture
Network operators
1
Network length
+- 4200 km
Ownership Public
Ge
ne
ral
fra
me
wo
rk
Authority CREG
System Incentive regulation revenue cap
Period 4 years current period 2016-2019
Base year for next period
3rd year in current regulatory period
Transparency Evolution of Regulatory account
Main elements for
determining the revenue
cap
Non-controllable and controllable
costs depreciation costs taxes and fair
margin
Legal framework
Belgian Law and by CREG approved Tariff Methodology
Rate
of
retu
rn
Type of WACC No use of WACC
Determination of the rate of
return on equity
Sum of a nominal risk-free rate and a risk premium (market risk premium multiplied with a risk factor) multiplied with (1+illiquidity premium) multiplied with a corporate tax factor
Rate of return on equity
before taxes 576 = (090+35065)(1+020)1513
Use of rate of return
Granted for existing assets to a maximum of 33 of the imputed business assets Any available equity capital in the capital structure in excess of this will be subject to another
equity interest rate
Reg
ula
tory
as
se
t
ba
se
Components of RAB
Fixed assets working capital assets under construction
Regulatory asset value
23 Beuro (2016)
RAB adjustments
Investments (+) divestments (-) depreciation (-)
subsidies (-)
Dep
rec
iati
on
s
Method Straight line
Depreciation ratio
Depending on assets pipes 2 compressors 3
Consideration
Non controllable
For 2020 the National Regulatory Authority was not able to author the descriptive part of this subchapter nor complete the above fact sheet
Ref C20-IRB-54-03
CEER Report on Regulatory Frameworks for European Energy Networks 2020
15156
23 Croatia Gas TSO Gas DSO Electricity TSO Electricity DSO
Ma
rke
t
str
uc
ture
Network operators
1 35 1 1
Network length
2531 km 19673 km 7758 km 140067 km
Ownership Public ownership
Private and local public ownership
Ge
ne
ral
fram
ew
ork
Authority Croatian Energy Regulatory Agency (HERA)
System Incentive Regulation Revenue cap
Cost plus method (cost of service rate of return)
Period
5 years current regulatory period 2017-2021
Business costs and costs of development are based on business
and development plans prepared adjusted and adopted for every year based on a three-year development
plan with the Agencyrsquos consent
Base year for next period
Base year is 2015 for 2nd regulatory period 2017-2021
Base year is 2019 for regulatory period 2018-2020
Transparency
For gas TSO httpwwwplinacrohrdefaultaspxid=5
92
For gas DSO information about
regulation and prices are published
on HERAs web-site wwwherahr
For Electricity TSO httpswwwhopshr
For Electricity DSO information about regulation and prices are published on HERAs web-
site wwwherahr
Main elements for
determining the revenue
cap OPEX and CAPEX OPEX is projected for regulatory period based on 1+CPI-X formula without ex-post adjustment if realised above but with profit-sharing mechanism if realised OPEX is below projected level Budgeted-planned CAPEX with an ex-post adjustment based on real values (only up to the economically efficient level)
OPEX and CAPEX Operating costs TPpos include the following
bull Costs of network maintenance
bull Costs of loss coverage in the network
bull Costs of gross salaries
bull Other staff costs
bull Other business-related costs
bull Other costs determined by the law
Costs of capital TPkap equal the following
TPkap = PRim + A whereby individual items are the following PRim ndash revenues from regulated
assets (regulated asset base) [kn] and A - Depreciation of the regulated
assets in the considered year [kn]
Legal framework
Methodology for the Determination of the Amount of Tariff Items for Gas Transmission (Official Gazette No 481858187920) Methodology for the Determination of the Amount of Tariff Items for Gas Distribution (Official Gazette No 4818)
Meanings of the expressions used in this Tariff System are determined by the Energy Act (ldquoOfficial Gazetterdquo No 6801 and 17704) the Act on the Electricity Market (ldquoOfficial Gazetterdquo No 17704) the General Conditions of Electricity Supply (ldquoOfficial Gazetterdquo No 1406) and the Grid Code for the Electric Power System (ldquoOfficial gazetterdquo No 3606)
Rate
of
retu
rn Type of WACC Nominal pre-tax WACC WACC before taxation
Determination of the rate of
The rate of return on equity (re) is determined by applying the capital asset pricing model
The rate of return on equity (re) is determined
Re= r
f + (r
m - r
f) middot
Ref C20-IRB-54-03
CEER Report on Regulatory Frameworks for European Energy Networks 2020
16156
return on equity
(CAPM) according to the formula re = rf + β times (rm - rf) wherein the following items are rf - the risk-free rate of return () rm - the rate of return on the diversified market portfolio () rm - rf - the market risk premium () β - the coefficient of variability of return on the operatorrsquos shares in relation to the average variability of return on the market portfolio
rf -Return from risk-free investments ()
(rm
- rf)- Average return on risky
investments (expected return on market portfolio) ()
- Variability coefficient of return on energy operators shares in relation to average variability of return on all shares quoted on the market
Rate of return on equity
before taxes Rate of return on equity 534 Risk-free rate of return 275 Coefficient β 054 Market risk premium 480 Rate of return on diversified market portfolio 755 Share of equity in total capital 50 Rate of return on debt 392 Share of debt in total capital 50 Rate of return on profit 18 Amount of WACC for the regulatory period 522
Rate of return on equity 684 Risk-free rate of return 425 Coefficient β 054 Market risk premium 480 Rate of return on diversified market portfolio 905 Share of equity in total capital 50 Rate of return on debt 488 (maximum value) Share of debt in total capital 50 Rate of return on profit 20 Amount of WACC for the regulatory period 672 (maximum value)
Risk-free rate of return 270 Coefficient β038 Market risk premium 645 Cost of equity 485 Cost of debt 336 Share of equity in total capital 40 Share of debt in total capital 60 Rate of return on profit 18 Amount of WACC for the regulatory period 403
Risk-free rate of return 270 Coefficient β 038 Market risk premium 645 Cost of equity 485 Cost of debt 336 Share of equity in total capital 40 (maximum value) Share of debt in total capital 60 Rate of return on profit 18
Amount of WACC for the
regulatory period 403
Use of rate of return
The nominal weighted average cost of capital before tax (WACC) is used as the rate of return on regulated assets As a measure of avoiding systemic risk the rate of return on equity is calculated using the CAPM model and the rate of return on debt capital is determined as the average weighted interest rate on investment loans used by the system operator to finance regulated assets The shares of debt and equity capital are defined as target shares in the amount of 50 which is theoretically optimal capital distribution and approximates the effect of the financial leverage to a good extent
The rate of return is usually calculated using the weighted average cost of capital formula (WACC) The WACC reflects two types of finance used to fund investments debt and equity respectively The cost of equity is calculated using the Capital Asset Pricing Model (CAPM)
Reg
ula
tory
as
se
t b
ase
Components of RAB
RAB includes both tangible and intangible assets which is in operation and also planned investments which will be put in operation for each year of the regulatory period
RAB at the end of the year is equal -value of regulated assets in the beginning of the year and does not include the value of assets received without charge [kn] plus value of new investments in the considered year financed from depreciation profit credits co-financing donations and from issuing bonds and other securities [kn] minus value of assets received without charge in the considered year [kn] minus depreciation of the
Ref C20-IRB-54-03
CEER Report on Regulatory Frameworks for European Energy Networks 2020
17156
regulated assets in the considered year minus appropriated and decommissioned assets [kn]
Regulatory asset value
RAB is calculated as historical cost of the assets such as depreciated book value of the assets
RAB is calculated as historical cost of the assets such as depreciated book value of the assets
RAB adjustments
In the last year of the regulatory period revision of allowed revenues is performed RAB is revised in way that the revised value of regulated assets at the end of each regulatory year t is equal to the realised value determined on the basis of balance sheet in part that HERA considers reasonable For the TSO value of pipelines is adjusted according to utilisation rate
By the ordinance defined investments after the base year eg expansions lead to an adjustments of the non-controllable costs and therefore of the revenue cap The assets of the base year are used as RAB
De
pre
cia
tio
ns Method Linear method Linear method
Depreciation ratio
286 for gas pipelines measuring and regulating stations and office buildings while for other types of assets 5 - 10
Depending on asset type Ratio between 15 and 5 eg lines amp cables ~2 stations ~4
Consideration Amount of annual depreciation of regulated assets is added to the allowed revenue
Amount of annual depreciation of regulated assets is added to the allowed revenue
Regulatory Framework for Tariff Determination for Gas Infrastructure Activities The Croatian NRA is the Croatian Energy Regulatory Agency (HERA) The methodologies for determining the tariffs for gas infrastructure activities in the Republic of Croatia are based on the incentive regulation method ie on the revenue cap method Thereby projected allowed revenue shall cover reasonable operating expenses generated when performing the energy activity and ensure the return on regulated assets The revenue cap method applied stipulates the regulatory period as a multiannual period for which separately for each regulatory year the allowed revenues are defined which consist of eligible OPEX and the eligible CAPEX and the amount of tariff items The duration of the first regulatory period was three years (2014 - 2016) the second regulatory period (2017 - 2021) and the subsequent regulatory periods are five years The allowed OPEX is projected for the regulatory period on the basis of the 1+CPI-X formula (CPI = projected consumer price index for the regulatory year) In addition to the efficiency factor X in the OPEX part as an important incentive element for the system operator a profit-sharing mechanism is also stipulated which is implemented in such a manner that after expiry of the regulatory period the base OPEX for the following regulatory period is defined so that the system operator retains 50 of the realised savings from the base year The eligible CAPEX which includes depreciation cost and the return on regulated assets recognises an equity capital investment into a regulated energy entity ie provides sufficient funds for the required investments into the construction and reconstruction of the system and to cover the regulated return on invested capital The regulated assets consist of tangible and intangible assets in use which is a part of a particular gas system and investments under an approved system development plan that are taken into account for the regulatory year in which it shall be in use Capital expenses ie depreciation and return on regulated assets are not included in direct efficiency improvement mechanisms but are defined by an ex-ante approach as part of approving the investment plans and the amount of tariff items which reduces the investment risk and provides more investment incentives Namely the risk of not covering the costs of infrastructure projects if they are eligible and economically efficient is eliminated Additional incentives in terms of CAPEX may lead to overinvestment and are therefore not required
Ref C20-IRB-54-03
CEER Report on Regulatory Frameworks for European Energy Networks 2020
18156
An important incentive element within the applied regulatory method is the regular audit of the allowed revenues which is performed in the last year of the regulatory period and as part of which the difference is determined between the realised revenue (R) and the audited allowed revenue (AI) to be distributed to the following regulatory period Since the applied revenue cap method guarantees to the system operator the level of revenue in the medium term a significant part of the market risk is shifted to the system users The reduction of market risk also affects the reduction of the liquidity risk and hence the reduction of the cost of financing the investment activities An additional measure aimed at mitigating the risk of the system operator business is the option of performing an extraordinary audit of the allowed revenue also during the current regulatory period at the request of the operator or according to the estimates by HERA The extraordinary audit of allowed revenue is performed due to unexpected changes in the market that have a significant impact on the conditions of providing the energy activity which the system operator could not have foreseen nor prevented eliminated or avoided As part of the extraordinary audit an audit may be performed of all the elements used in the calculation of the allowed revenue and in the calculation of the amount of tariff items for the current regulatory period An additional measure in gas distribution is the possibility of introducing a regulatory account This is an optional model of economic regulation which provides the possibility for the system operator in the later years of the regulatory account the reimbursement of the revenue realised in the early years in the amount less than the allowed revenue that would have resulted from the application of the standard regulation model That is in the case of significant investments in the existing infrastructure or with entirely new infrastructure the standard regulation model is not appropriate since significant investments which by being put into use are included in the regulatory asset base affect the strong growth in the amount of allowed capital expenses in the first years of the project At the same time large investments in the initial period are often accompanied by low system usage level The aforementioned situation would result in uncompetitive high tariffs for using the system in the same period which would represent a negative factor for the decision to invest in the project Therefore the regulatory account is approved in such a manner that the gas system operator achieves cumulatively the same allowed revenue as without the use of the regulatory account but with different time dynamics The period for which a regulatory account is established may not be shorter than two regulatory periods nor longer than the period for which the operator has concluded a concession contract Such a mechanism also prevents discrimination against new users that use the system in the early years since the tariff items are unified and without fluctuations throughout the entire period for which the regulatory account is kept The nominal WACC before tax is used as the rate of return on regulated assets As a measure of avoiding systemic risk the rate of return on equity is calculated using the CAPM model and the rate of return on debt capital is determined as the average weighted interest rate on investment loans used by the system operator to finance regulated assets The shares of debt and equity capital are defined as target shares in the amount of 50 which is theoretically optimal capital distribution and approximates the effect of the financial leverage to a good extent In this respect a pre-defined ratio of debt and equity capital in the WACC calculation significantly reduces the regulatory risk while at the same time encourages the system operator to consider the actual capital structure used In addition applying a targeted ratio provides for equal treatment and approach to WACC calculation for all energy entities in gas infrastructure activities The decision on the actual capital structure in regular business and project financing remains with the system operator while the target ratio defined by the methodologies for determining the amount of tariff items for gas infrastructure activities in the Republic of Croatia refers solely to the WACC calculation
Ref C20-IRB-54-03
CEER Report on Regulatory Frameworks for European Energy Networks 2020
19156
Regulatory framework for tariff determination for electricity infrastructure activities Introduction The electricity networks are examples of what are known as natural monopolies where effective competition is restricted To ensure that network operators (DSOs = Distribution System Operators TSOs = Transmission System Operators) do not make any monopoly profits but still operate their networks as cost effectively as possible the electricity network operators are subject to regulation This task is performed by the HERA as the regulatory authority responsible in Croatia for the networks in various sectors including electricity and gas Historical development Regulation by the HERA began in 2006 as cost-plus regulation Under this regime the revenue that network operators are allowed to earn within a certain period (regulatory period) is determined using a mathematical formula and fixed for the period It therefore incentivises network operators to lower their costs within the regulatory period (work efficiently) so as to increase their profits within the limits of the framework (revenue (fixed) minimum income realised by implementation of tariff items should cover the acknowledged total costs of electricity distribution) Allowed revenue shall cover reasonable operating expenses generated when performing the energy activity and ensure the return on regulated assets The revenue cap method applied stipulates the regulatory period as a multiannual period for which separately for each regulatory year the allowed revenues are defined consisting of eligible OPEX and eligible CAPEX In the course of the current regulatory year based on business data from the Annex 1 of this Tariff System the Agency shall determine the total acknowledged operating costs for the previous regulatory year - the realised income according to tariff items and the value of their difference ΔUTPpret The difference between the realised income by implementation of tariff items the acknowledged total operating costs from the previous regulatory year ΔUTPpret and the estimated difference for the current regulatory year ΔUTPsad shall be taken into consideration when determining the amounts of tariff items for electricity distribution of tariff customers for the considered future regulatory year
Determining the revenue caps
A regulatory period equals one regulatory year Determining the amounts of tariff items for the future regulatory year is based on the acknowledged operating costs from the previous regulatory year realised and estimated operating costs for the present regulatory year and accepted planned costs for the considered future regulatory year The revenue caps for network operators are set for a regulatory period The costs data is supplemented by a calculated return on equity The premium covering network-specific risks is determined using the capital asset pricing model (CAPM) and is derived from the product of an imputed market risk premium and a risk factor (beta factor) A pre-defined ratio of debt and equity capital in the WACC calculation significantly reduces the regulatory risk while at the same time encourages the system operator to consider the actual capital structure used
Transparency
The data is published on the regulatory authority website
Ref C20-IRB-54-03
CEER Report on Regulatory Frameworks for European Energy Networks 2020
20156
24 Czech Republic Gas TSO Gas DSO Electricity TSO Electricity DSO
Ma
rke
t
str
uc
ture
Network operators
1 3 regional 65 local
1 4 regional 250 local
Network length 3822 km (2019) 62171 km (2019 regional and local
DSOs) 5601 km (2019)
244240 km (2019 regional DSOs)
Ownership Private ownership Private and local public ownership
Public ownership Private and local public ownership
Ge
ne
ral
fra
me
wo
rk
Authority Energy Regulatory Office wwwerucz
System Incentive regulation
Revenue cap Price cap
Incentive regulation Revenue cap
Period Originally set as 3-year (2016-2018) later it was prolonged until 2020
Base year for next period
No specific base year applied
Transparency Price decisions Regulatory methodology
Main elements for determining the revenue cap
Allowed costs Allowed depreciation
RAB WACC
Legal framework
Act No 4582000 on the Conditions of Business and State Administration in Energy Industries and on Changes to Certain Laws (the Energy Act) Public notice no 1952015 on price control in gas sector
Act No 4582000 on the Conditions of Business and State Administration in Energy Industries and on Changes to Certain Laws (the Energy Act) Public notice no 1942015 on price control in electricity sector
Rate
of
retu
rn
Type of WACC Nominal pre-tax WACC
Determination of the rate of return
on equity
Sum of nominal risk-free rate and a risk premium (market risk premium multiplied by beta factor)
Rate of return on equity before
taxes 966 = (382 + 500 0801) (1 ndash 019) 1028 = (382 + 500 0901) (1 ndash 019)
Use of rate of return
The whole RAB is multiplied by the WACC When setting the nominal pre-tax WACC the DE ratio of 38486152 was used
The whole RAB is multiplied by the WACC When setting the nominal pre-tax WACC the DE ratio of 45755425 was used
Reg
ula
tory
as
se
t
ba
se
Components of RAB
Fixed assets investments in progress leased assets no working capital
Regulatory asset value
The RAB is based on re-evaluated values of assets that are recorded in the annual financial statements
RAB adjustments
The adjustment is similar to the net book value calculation (investment - depreciation) the formula for RAB adjustment is ldquoinvestment ndash depreciation x krdquo k is revaluation coefficient which is set annually and which is calculated as the result of dividing the planned value of the regulatory asset base in year ldquoi-1rdquo by the planned residual value of assets in year i-1 k = lt01gt
Dep
rec
iati
on
s
Method Straight line
Depreciation ratio
Buildings 2 Pipes 25
Pumps Compressors 5
Electricity transmission system operator calculates
the depreciation in accordance with national
accounting standards
Buildings 2 Overhead lines and Cables 25
Transformers VHV 4 Transformers MV LV 33
Metering devices 66
Consideration 100 of the depreciation is used to determine the allowed revenue
Ref C20-IRB-54-03
CEER Report on Regulatory Frameworks for European Energy Networks 2020
21156
Introduction Electricity and gas distribution and electricity and gas transmission are so-called natural monopolies the operation of which relies on only one network because the rollout of a parallel infrastructure is not effective in economic terms To prevent monopolies from dictating prices uncontrollably they have to be regulated by the state A regulatory authority is usually authorised to do this in the case of regulation In the Czech Republic Act No 4582000 (the Energy Act) sets up the Energy Regulatory Office (ERO) for the purpose of regulation in the energy sector Under the Energy Act the ERO is obliged to set out in implementing legal regulations the method of regulation in energy industries and price control procedures To this end public notices no 1942015 on price control in electricity sector and no 1952015 on price control in gas sector were published in August 2015 they came into effect with the beginning of the fourth regulatory period (RP) in 2016 Furthermore ERO published a document called ldquoPrinciples of price regulation for the period from 2016 to 2018 in electricity and gas sector and for the market operatorrsquos activitiesrdquo in which the price methodology for the fourth RP is described in more detail The fourth RP was originally set as a three-year period (2016-2018) but in January 2018 it was prolonged until the end of 2020 without any changes in the price methodology The purpose of the methodology for the fourth RP was to determine a reasonable level of profit for companies during the whole RP to ensure adequate quality of the services provided to customers with effective spending of costs to support future investments to provide for the resources required for network renovation and to continue to improve efficiencies from which customers also benefit Price Control in the Electricity Industry The resulting price of electricity supply for all categories of final customers is comprised of five basic components The first component is the uncontrolled price of commodity ie the electrical energy itself [in Czech called ldquosilovaacute elektřinardquo still ldquoenergyrdquo or ldquoelectricityrdquo in English] which is priced on market principles and in line with the various electricity suppliersrsquo business strategies The other components of the price are as follows regulated activities of a monopoly nature which include electricity transport and distribution from the generating plant over the transmission and distribution systems to the final customer and also activities related to ensuring the stability of the electricity system from the technical point of view (the so-called provision of system services) and from the commercial point of view (primarily the electricity market operatorrsquos activity in the area of imbalance clearing) The last component of the resulting price of electricity supply is the contribution to support of electricity from promoted sources The above is the approach to electricity supply pricing for all customer categories with effect from 1 January 2006 when the Czech electricity market was completely liberalised Price Control in the Gas Industry The price of natural gas supply for final customers is comprised of four basic components The first component is the charge for commodity ie natural gas itself which is priced on market principles and in line with the various gas suppliersrsquo business strategies The other three components are the price for gas transmission gas distribution and market operatorrsquos activities The prices for these three components are regulated and determined by ERO Regulatory Methodology Framework A revenue cap methodology is used for setting the allowed revenue in the Czech Republic The length of the RP is mainly five years The basic formula for determining allowed revenue is
Ref C20-IRB-54-03
CEER Report on Regulatory Frameworks for European Energy Networks 2020
22156
AR = AC + AD + P
where
AR is the value of the allowed revenue AC is the value of the allowed costs AD is the value of the allowed depreciation P is the value of the allowed profit Allowed Costs The generally adopted theory of regulation assumes that the costs that enter into the subsequent RP are determined based on the analysis of values achieved in the preceding period This theory is based on the assumption that during the RP the companies reduce their costs under the pressure for efficiency thereby achieving higher profits than those set for them by regulator ERO decided to determine the initial level of allowed costs as the arithmetic average of actual accounting costs for two particular years specifically years 2012 and 2013 for which the audited actual values were available ERO considered such procedure for the fourth RP to be objective transparent fair and acceptable for all market participants For setting the cost base ndash to obtain the input value of costs ndash rigorous classification of reported costs for the defined reference years had to be carried out for regulated entities and the anomalies that were not accepted for this input data were separated from the reported and eligible justified costs Costs base was netted for extraordinary costs and at the same time it was submitted to a thorough check Extraordinary costs are the costs that are not related to the standard activity performed by the regulated entity and which are not of regular nature (they are not repeated every year) or the costs that were incurred just once The values ascertained in such a manner for years 2012 and 2013 were adjusted with an escalation factor to the time value 2015 The arithmetic average of these values thus became the initial value of allowed costs for the fourth RP The regulation principle of the revenue cap is then consistently applied to these costs throughout the RP This costs base is annually adjusted with escalation factor and efficiency factor Escalation Factor The initial cost base is indexed to the following years by the escalation factor The escalation factor for the fourth RP is composed by the annual business service price index with the weight of 70 and the annual consumer price index with 1 bonus and the weight of 30 published by the Czech Statistical Office for April of the relevant year Efficiency Factor (X Factor) The efficiency factor makes companies on the energy market behave more efficiently and reduce costs over the RP At the beginning of the RP the regulator sets the value of the required efficiency which the companies are obliged to observe The ERO set this value to 3 for the fourth RP (2016-2018) and it represents the year on year decrease of the costs by 101 (according to the formula 119883=1minus sup3radic097=101 ) For the additional years of the fourth regulatory period (2019 and 2020) the same value of efficiency factor (101) has been applied
Ref C20-IRB-54-03
CEER Report on Regulatory Frameworks for European Energy Networks 2020
23156
Allowed Depreciation The allowed depreciation is determined on the basis of the planned values in individual years of the RP The planned values of the depreciation are adjusted in the year ldquoi+2rdquo based on the actual values using the time value of money Profit
The profit of the regulated entity is simplified calculated as follows
P = RAB x WACC
where RAB is the value of the regulatory asset base WACC is the rate of return Regulatory Asset Base The calculation of the regulatory asset base in the fourth RP uses for its input the planned values which are corrected (in two-year lag) based on the actual values In order to maintain continuity between the third and the fourth RP the initial level of the regulatory asset base (RAB0) was set at the planned value of the regulatory asset base for the year 2015 In the subsequent years of the RP the initial level of the regulatory asset base is increased (or decreased) by the differences between the capitalised investments and the depreciation which is adjusted with the revaluation coefficient utilised in the third RP The assets under construction are also included into RAB These assets are part of RAB under certain conditions namely the planned acquisition period of the investments is more than two years (the time of preparation is not included) and the total planned price of individual investment exceeds 500 million CZK Rate of Return (WACC) The WACC parameter (nominal pre-tax) is used for calculating profit in the Czech Republic When determining the rate of return as the key parameter for investment conditions (and decisions) in the regulated environment the ERO analysed the market environment risk rate of individual environments as well as overall economic position of similar ndash peer ndash companies in the Czech Republic and also in the other EU countries ERO set the values of the WACC parameter as fixed for the entire RP except for cases when the income tax rate of legal entities is changed ndash considering the relevant specific conditions and indicators for electricity and gas industries The rate of return is set as the uniform value for the electricity industry and the uniform value for the gas industry (ie the same rate for the DSO as well as the TSO in the given industry) Inflation Rate ndash Time Value of Money To adjust the planned values that are included into the parameters of regulation the standard cases are covered by inflation rate parameter which is derived from the index of industrial producersrsquo prices The inflation rate parameter is defined annually based on the ratio of rolling averages reported by the Czech Statistical Office in the table ldquoIndustrial Producer Price Index by Section and Subsection of CZ-CPA in the Czech Republic (ratio of rolling averages)rdquoIn the specific cases the WACC value is used as the time value of money
Ref C20-IRB-54-03
CEER Report on Regulatory Frameworks for European Energy Networks 2020
24156
25 Denmark Gas TSO Gas DSO Electricity TSO Electricity DSO
Ma
rke
t s
tru
ctu
re
Network operators
1 (Energinet) 3 (2017) 1 (Energinet) 44 (2018)
Network length
861 km (2017) ~ 18000 km (2016) 6913 km (2017) ~ 165000 km
(2016)
Ownership Independent public enterprise owned by the Danish Ministry of Climate Utilities and Energy (SOV)
Public ownership
Independent public enterprise owned
by the Danish Ministry of Climate Utilities and Energy
(SOV)
Private and local public ownership
Ge
ne
ral
fra
me
wo
rk
Authority Danish Utility Regulator (DUR)
Danish Utility Regulator (DUR)
Danish Utility Regulator (DUR)
Danish Utility Regulator (DUR)
System Strict cost plus Revenue Cap Strict cost plus Revenue Cap
Period Yearly
4 years current period 2018-2021
Yearly 5 years current
period 2018-2022
Base year for next period
Strict cost-plus regulation (ex post regulation)
4 previous years Strict cost-plus regulation (ex post regulation)
5 previous years
Transparency Strict cost-plus regulation (ex post)
Efficiency scores efficiency model
parameters WACC specific cost data
Strict cost-plus regulation ex post)
Efficiency scores efficiency model
parameters WACC specific cost data
Main elements for
determining the revenue
cap Danish TSO
regulation doesnacutet fit to this scheme For further details
see section ldquoRegulation of
transmission grid (el and gas)rdquo in the text
below
Costs in previous period
Fixed interest rates 4-year period
Danish TSO regulation does not fit this scheme For further details see
section ldquoRegulation of transmission grid (el and gas)rdquo in the
text below
The revenue cap consists of three
main components a cap on costs
allowed returns and efficiency
requirements The cap on costs are
based on an average of actual
costs in the previous regulatory period The allowed
returns are determined from the
RAB and a specified rate of
return
Legal framework
The Natural Gas Supply Act The Energinet Act Notice BEK nr816 af 27062016
The Natural Gas Supply Act
Notice BEK nr 768
23062016
The Electricity Supply Act
The Energinet Act
Notice BEK nr 816
27062016
The Electricity Supply Act
Notice BEK nr 969
27062018 and 1595 18122017
Rate
of
retu
rn
Type of WACC Danish TSO regulation does not fit to this scheme For further details
see section ldquoRegulation of
transmission grid (el and gas)rdquo in the text
below
Nominal WACC pre-tax
451 (2017)
Danish TSO regulation does not fit to this scheme For further details
see section ldquoRegulation of
transmission grid (el and gas)rdquo in the text
below
Nominal WACC pre-tax
366 (2018-2022)
Determination of the rate of
return on equity
Danish TSO regulation does not fit to this scheme For further details
Sum of a nominal risk-free rate and a
risk premium (market risk
Danish TSO regulation does not fit to this scheme For further details
Sum of a nominal risk-free rate and a
risk premium (market risk
Ref C20-IRB-54-03
CEER Report on Regulatory Frameworks for European Energy Networks 2020
25156
see section ldquoRegulation of
transmission grid (el and gas)rdquo in the text
below
premium multiplied with a beta risk
factor)
see section ldquoRegulation of
transmission grid (el and gas)rdquo in the text
below
premium multiplied with a beta risk
factor)
Rate of return on equity
before taxes
Danish TSO regulation does not fit to this scheme For further details
see section ldquoRegulation of
transmission grid (el and gas)rdquo in the text
below
900
Danish TSO regulation does not fit to this scheme For further details
see section ldquoRegulation of
transmission grid (el and gas)rdquo in the text
below
563
Use of rate of return
Danish TSO regulation does not fit to this scheme For further details
see section ldquoRegulation of
transmission grid (el and gas)rdquo in the text
below
A risk-free interest rate calculated as an average of the last three months
available daily observations of four-year zero
coupon rates for Danish government
bonds
Danish TSO regulation does not fit to this scheme For further details
see section ldquoRegulation of
transmission grid (el and gas)rdquo in the text
below
A risk-free interest rate calculated as an average of the last three months
available daily observations of ten-year zero coupon rates for Danish
government bonds
Reg
ula
tory
as
se
t b
ase
Components of RAB
Danish TSO regulation doesnacutet fit to this scheme For further details
see section ldquoRegulation of
transmission grid (el and gas)rdquo in the text
below
Fixed assets working capital
assets under construction and
historical debt
Danish TSO regulation doesnacutet fit to this scheme For further details
see section ldquoRegulation of
transmission grid (el and gas)rdquo in the text
below
All assets related to licensed activity of a
DSO working capital and assets under construction
Regulatory asset value
Danish TSO regulation doesnacutet fit to this scheme For further details
see section ldquoRegulation of
transmission grid (el and gas)rdquo in the text
below
Historical costs included return on
capital
Danish TSO regulation doesnacutet fit to this scheme For further details
see section ldquoRegulation of
transmission grid (el and gas)rdquo in the text
below
Historical costs included return on
capital
RAB adjustments
Danish TSO regulation does not fit to this scheme For further details
see section ldquoRegulation of
transmission grid (el and gas)rdquo in the text
below
Investments in new assets after the
base year led to an adjustment of the
CAPEX
Danish TSO regulation does not fit to this scheme For further details
see section ldquoRegulation of
transmission grid (el and gas)rdquo in the
text below
Adjusted for non-controllable costs
Dep
rec
iati
on
s
Method Straight line Straight line Straight line Straight line
Depreciation ratio
Dependent on asset type
Dependent on asset type
Dependent on asset type
Dependent on asset type
Consideration Danish TSO regulation does not fit to this scheme For further details
see section ldquoRegulation of
transmission grid (el and gas)rdquo in the text
below
-
Danish TSO regulation does not fit to this scheme For further details
see section ldquoRegulation of
transmission grid (el and gas)rdquo in the text
below
-
Ref C20-IRB-54-03
CEER Report on Regulatory Frameworks for European Energy Networks 2020
26156
Introduction The Danish Utility Regulator (DUR) is independent of the government The tasks of DUR are stipulated in the supply acts for electricity natural gas and district heating Regulation of Electricity Grid Companies Danish electricity grid companies are natural monopolies As the distribution of electricity is a monopolistic activity the grid companies generally do not have the same incentives for financial efficiency as enterprises on a free competitive market The grid companies are therefore subject to financial regulation managed by DUR The regulation aims at reflecting the pressure on efficiency faced by enterprises subject to competition on the free market The financial regulation primarily consists of two mechanisms revenue caps and benchmarks Revenue caps set a ceiling on the operating revenues of grid companies The revenue caps for DSOs are set for a five-year regulatory period The first regulatory period runs from 2018 until 2022 The revenue caps consist of three main components a cap on costs allowed returns and efficiency requirements The cap on costs are based on an average of actual costs in the previous regulatory period The allowed returns are determined from the RAB and a specified rate of return Throughout a regulatory period the revenue caps are adjusted for changes in the price levels (inflation) and the specific activity level of a given DSO The efficiency requirements are related to the overall productivity changes in the Danish economy and individual performance calculated from benchmarking Benchmarking aims at ensuring that consumers do not pay more for the services of the grid companies than they would have done if the companies were subject to competition If the actual costs of a grid company are too high efficiency improvement requirements will be imposed on the company by DUR The RAB which is used to calculate the allowed returns and is divided into two parts a forward-looking asset base and a historical asset base Each asset base is coupled with its own rate of return and the WACC is only used as the rate of return on the forward-looking asset base The forward-looking asset base consists of regulatory assets invested from 1 January 2018 and forward The rate of return on the historical asset base is a continuation of the previous definition of allowed rate of return which is not comparable to the WACC definitions and methods Regulation of Gas Distribution Companies Grid companies are not subject to competition and therefore DUR regulations aim at encouraging these companies to be more efficient by lowering the cap on their revenues The revenue cap is made up by i) operating costs (decided activity level) ii) operating costs (imposed by external factors) iii) historic debt locked (remaining from 2004 balance) iv) asset base and v) costs to promote and realise reductions in energy consumption DUR sets efficiency demands on i) operating costs based on a benchmark between the DSOs to ensure external pressure to lower costs continuously Furthermore DUR sets a cap on i) operating costs based on historic cost levels and DSOs can achieve efficiency gains by realising operating costs that are lower this level of historic costs adjusted for efficiency demands The revenue cap is adjusted to actual level of ii) operating costs
Ref C20-IRB-54-03
CEER Report on Regulatory Frameworks for European Energy Networks 2020
27156
Before entering a regulation period DUR sets a level of interest rate for the iv) asset base using a WACC framework and a CAPM methodology The level of interest is fixed during the regulation period but the asset base can vary The revenue cap is adjusted by iv) actual costs to realise reductions in energy consumption Regulation of Transmission Grid (Electricity and Gas) Energinet is the TSO for both electricity and gas in Denmark The special provisions for Energinet were established by law on Energinet and executive order on economic regulation of Energinet Energinet is ex-post regulated in accordance with a ldquonon-profitrdquo principle whereby the companys tariffs may only cover the necessary costs incurred in efficient operation and an interest rate to ensure the real value of the companys capital base on 1 January 2005 (strict cost-plus regulation) Energinetrsquos capital base on 1 January 2005 was 3157 million DKK In 2016 the return of capital was 21 million DKK (07) The economic regulation of Energinet does not allow explicit efficiency requirements for Energinet However DUR may determine that a specific cost ndash or the amount thereof ndash does not constitute a necessary cost at efficient operation and therefore may not be included (or only partially included) in Energinetrsquos tariffs DUR and Energinet have participated in two European benchmarks of electricity TSOs the latest being in 2013 and also in the first European benchmark of gas TSOs which was concluded in 2016 The benchmarks play a role as background for DURrsquos economic regulation and assessment of Energinet DUR distributed the results of the benchmark analyses to the Minister of Energy Utilities and Climate in the ministryrsquos capacity as owner of the Energinet In its utility strategy (Regeringens forsyningsstrategi) in September 2016 the government presented its comprehensive utility strategy for Danish households and companies One of the proposals was a new incentive-based financial regulation of Energinet
Ref C20-IRB-54-03
CEER Report on Regulatory Frameworks for European Energy Networks 2020
28156
26 Estonia Gas TSO Gas DSO Electricity TSO Electricity DSO
Ma
rke
t
str
uc
ture
Network operators
1 23 1 33
Network length
885 km 2134 km 5202 km 65700 km
Ownership State owned Private investors State owned
State owned and private investors
Ge
ne
ral
fra
me
wo
rk
Authority Konkurentsiamet wwwkonkurentsiametee
System Rate-of-Return
Period There is no period There is no period
Base year for next period
na
Transparency specific cost data
Main elements for
determining the revenue
cap
1) Variable costs 2) Operating costs 3) Depreciation of RAB 4) Justified return of RAB
Legal framework
Natural Gas Act Electricity Market Act
Rate
of
retu
rn
Type of WACC Pre-tax WACC nominal
Determination of the rate of
return on equity
1) Germany 10 years average bonds yield 2) Estonian risk premium 3) McKinsey market risk premium 4) Beta
Rate of return on equity
before taxes
584 (141+079+ (07285))
592 (141+079+ (07445))
565 (141+079+(06905
))
573 (141+079+ (07065))
Use of rate of return
458 460 451 461
Reg
ula
tory
as
se
t b
ase Components
of RAB Fixed assets working capital leased assets
Regulatory asset value
Historical costs
RAB adjustments
The fixed assets do not include 1) long-term financial investments 2) intangible assets except for software licenses 3) fixed assets acquired with grant aid (including targeted funding) 4) fixed assets acquired with funds obtained from connection fees 5) fixed assets which the undertaking is not used for the purpose of providing network service
Dep
rec
iati
on
s
Method For depreciation of fixed assets we use a regulatory capital expenditure method which differs from accounting depreciation In the regulatory capital expenditure accounting a
principle is used in which from a certain moment in time fixed assets are divided into two parts the old ones and the new investments All assets acquired before the limit year are
considered old ones and for them an accelerated rate of depreciation is applied
Depreciation ratio
Depending on asset type For new assets (after year 2003) 286-333 from investment cost and for old assets (before year 2003) 714 from residual value
Consideration Present regulation started at 2003 legal framework
Ref C20-IRB-54-03
CEER Report on Regulatory Frameworks for European Energy Networks 2020
29156
Introduction The Estonian Competition Authority (ECA) establishes network charges for network operators The laws provide uniform price regulation for all network operators regardless of their size The ECA has prepared uniform methods for the calculation of network charges based on the WACC The methods are applied similarly and uniformly in analysing the activities and monitoring the prices of all the undertakings under the ECArsquos supervision in compliance with the principle of equal treatment and proportionality Variable Cost Variable costs are costs that vary in line with changes in the sales volume ie are directly dependent on the sales volume The following variable costs shall be included in network charges the costs of outsourced transmission andor distribution network services and the costs of electricity purchased for covering network losses ECA shall use the following methods to analyse network losses monitoring of the dynamics of network losses in time comparison of statistical indicators with other network operators analysis of technical indicators (eg length of lines number of substations etc) and analysis of the impact of investments on network losses The cost of the network electricity losses is the product of the forecast amount of network loss and the price The forecast price of the electricity purchased for covering network losses shall be justified and cost-effective An analysis of the justification of the price shall be based on the weighted average price determined on the basis of the price applicable in the Nord Pool Spot Estonian price region and the size of network losses in the 12 calendar months preceding the submission of the request plus justified costs necessary for purchasing electricity The weighted average price is calculated on the basis of the one-day forward hourly price in the electricity market during the aforementioned period and the network operatorrsquos amount of energy lost in the respective hour If the amount of electricity purchased for compensating network losses is below 5000 MWh a year the electricity price may be forecast on the basis of the electricity supply agreement In such a case the justification of the price as well as the conformity of the price with the market price shall be analysed and the organisation of a tender shall be expected In the case of a transmission network operator specific income and expenses are taken into account including the income and expenses of the transit flow compensation mechanism between transmission network operators (ITC) countertrade costs transmission capacity auction income etc Operating Cost Operating costs are all the justified costs necessary for the provision of network services which are not variable costs or capital expenditure Operating costs are divided into controlled operating costs and non-controlled operating costs The following justified costs are generally considered as operating costs the costs of maintenance and repairs performed by the network operator the costs of outsourced works and services transport costs information technology and communication costs labour expenses (including taxes) the state fee payable for the activity licence for providing network services fees for tolerating technical networks or structures other costs which must be listed and justified in the request ECA shall use the following methods to analyse operating costs monitoring of the dynamics of operating costs in time by quantity and as a special cost in regard to the sales volume comparison of statistical indicators with similar network operators performance of an in-depth analysis of the components of operating costs (using expert evaluations if necessary) and analysis of the impact of investments on operating costs Monitoring the dynamics of costs in time means a change in the operating costs of a network operator across the years in general
Ref C20-IRB-54-03
CEER Report on Regulatory Frameworks for European Energy Networks 2020
30156
it must not grow more than the CPI An in-depth analysis shall include a detailed distribution of operating costs between different activities The detailed distribution of operating costs shall include data across the three calendar years preceding the submission of the request The network operator shall justify the incurrence variation and cost-efficiency of the costs presented in the in-depth analysis The dynamics of the special costs of various cost types may be compared in conducting an in-depth analysis Upon comparing the costs of a network operator and the statistical indicators determined on the basis thereof with the costs of other similar network operators the special costs under the operating costs of similar network operators shall be compared (total operating costs per sales amount) If necessary ECA may also analyse the cost types and the special costs of similar network operators (eg the labour expenses of network operators per sales amount) Upon approval and verification of network charges ECA shall not accept the following cost items the cost of doubtful receivables costs related to ancillary activities costs arising from changes in the value of assets (change in the balance of inventories write-downs of current assets etc) penalties and fines for delays imposed on the network operator pursuant to law (fines for administrative violations penalty payments compensation for damages etc) costs not related to business activities (sponsorship gifts donations etc) other unjustified costs identified in the process of an economic analysis Regulated Assets and Capital Expenditure Determining the value of regulated assets (the fixed assets necessary for the provision of network services) is necessary for calculating capital expenditure and justified profitability The ECA shall analyse the justification of both made and forecast investments for the basis for accounting for regulated assets For the purpose of verifying the justification of investments
bull The Transmission System Operator shall submit a detailed five-year investment plan and a prospective ten-year investment plan The investment plan shall include the cost and justification of the investments the economy and cost-efficiency to be achieved and the criteria for improving the security of supply and quality
bull A Distribution System Operator (DSO) with more than 100000 consumers shall submit the same data as the Transmission System Operator and
bull A DSO with fewer than 100000 consumers shall submit a detailed five-year investment plan and a prospective ten-year investment plan upon the ECArsquos request
The ECA shall not accept the following costs incurred on fixed assets as regulated assets and capital expenditure long-term financial investments fixed assets acquired using connection charges paid by consumers fixed assets acquired using non-refundable aid (eg EU external aid programmes) intangible assets (excluding computer software licences and rights of use pertaining to land related to technical structures) fixed assets related to ancillary activities costs arising from changes in the value of assets (impairment of the value of fixed assets losses from sales and liquidations of property plant and equipment and intangible assets etc) assets which the network operator is not actually using for the provision of network services Capital expenditure is calculated on the basis of the value of the fixed assets (regulated assets) necessary for the provision of network services and the capital expenditure rate The capital expenditure rate is the reciprocal value of the useful technical life of the asset Individual assets may have different useful lives and therefore different capital expenditure rates Upon justifying the useful life of an asset the ECA shall verify the following - The expected period of use of the asset - The expected physical wear and tear of the asset and - The technical or moral obsolescence of the asset
Ref C20-IRB-54-03
CEER Report on Regulatory Frameworks for European Energy Networks 2020
31156
The accounting of regulated assets and capital expenditure shall be consistent and shall also continue in the event of changes in the ownership of the undertaking or the asset The calculation of the net assets underlying the network fees is as follows 1) Depreciation on fixed assets is calculated using the straight-line depreciation method 2) Depreciation rates for fixed assets are not justified if they differ substantially from the
depreciation rates set for similar life same uses and similar fixed assets or if the entity does not calculate the depreciation based on the useful (technical) life of the fixed assets
3) Depreciation is calculated based on the acquisition cost In this case deprecation of fixed assets to be included in the net fees is based on deprecation rate(s) set for assets acquired and
4) If necessary differentiation of fixed assets can be used using different depreciation rates of fixed assets
The working capital shall be calculated on the basis of 5 of the allowed revenue of the tariff year If necessary a more detailed working capital analysis may be performed The internal turnover of undertakings belonging to a vertically integrated group shall not be included in working capital accounts If necessary an additional working capital analysis shall be performed Justified Profitability The justified profitability to be included in the price shall be calculated on the basis of the fixed assets (both tangible and intangible assets) necessary for the provision of network services
Justified profitability (JP) is determined as the product of the regulated assets (RA) and the
WACC
The WACC is calculated using a capital structure of which 50 is debt capital and 50 equity and the same proportion shall also be taken as the basis in the case of all other regulated undertakings providing a similar service (ie a vital service provided by a dominating undertaking in the market eg electricity gas district heating water supply)
The risk-free rate of return is the average interest rate of German ten-year bonds in the preceding ten years plus Estoniarsquos state risk premium If Estonian government bonds exist the interest rate of the government bonds may be used as the risk-free rate of return As Estonia does not have long-term government bonds that are traded on the secondary market it is not possible to give a direct quantitative assessment on Estoniarsquos state risk This can only be done indirectly by comparing Estonia with countries that have issued state bonds The Ministry of Finance has recommended that the ECA take into account the average return on ten-year bonds of European countries with a credit rating similar to the one given to Estonia by rating agencies (SampPMoodyrsquosFitch) and use this to assess the return on Estoniarsquos long-term government bonds
The cost of debt is the sum of the risk-free rate of return (plus Estonia`s state risk premium) and the debt risk premium of the undertaking The cost of equity is calculated using the CAPM (capital assets pricing model) model (Ce = Rf + Rc + szlig x Rm) The value of the beta coefficient is determined on the basis of the relevant indicators of other European andor US regulated undertakings The market risk premium is determined on the basis of the long-term market risk premium of other European andor US undertakings
Ref C20-IRB-54-03
CEER Report on Regulatory Frameworks for European Energy Networks 2020
32156
Usually2 the ECA calculates WACC annually and publishes it on its website at wwwkonkurentsiametee
2 The period 2016-2019 was an exception because the German ten-year bonds in the preceding five years
decreased Therefore from 2020 the ECA introduced the German ten-year bonds in the preceding ten years
Ref C20-IRB-54-03
CEER Report on Regulatory Frameworks for European Energy Networks 2020
33156
27 Finland Gas TSO Gas DSO Electricity TSO Electricity DSO
Ma
rke
t
str
uc
ture
Network operators
1 19 1 77
Network length
~1200 km ~2000 km ~14500 km ~400000 km
Ownership State owned
State local public and private ownership
State and private ownership
State local public and private ownership
Ge
ne
ral
fra
me
wo
rk
Authority Energy Authority
System Revenue Cap
Period Current regulatory framework is set for 2 regulatory periods (2016-2019 and 2020-2023)
Base year for next period
No specific base year applied3
Transparency Decisions Regulatory Data Efficiency Scores Quality of networks
Main elements for
determining the revenue
cap
Efficiency- Quality- Innovation- and
Investment incentive WACC
return on RAB
Innovation- and Investment
incentive WACC return on RAB
Efficiency- Quality- Innovation- and
Investment incentive WACC
return on RAB
Efficiency- Quality- Security of supply-
Innovation- and Investment
incentive WACC return on RAB
Legal framework
Electricity market Act (5882013) Natural gas market Act (5872017) and Act on the supervision of the electricity and natural gas market (5902013)
Rate
of
retu
rn
Type of WACC Nominal pre-tax
Determination of the rate of
return on equity
Risk-free rate + betaMarket risk premium + Premium for lack of liquidity (+ additional risk premium for natural gas TSO and DSOs)
Rate of return on equity
before taxes
900 = (145+0695+06+
17) (1-02)
850 = (145+0695+06+
13) (1-02)
706 = (145+0725+06)
(1-02)
774 = (145+08285+06)
(1-02)
Use of rate of return
Reasonable return is calculated by multiplying the adjusted capital invested in network operations by the reasonable rate of return Therefore company receives reasonable
return on adjusted equity and interest-bearing debt invested in network operations
Reg
ula
tory
as
se
t b
as
e Components
of RAB Fixed assets working capital leased assets
Regulatory asset value
Regulatory asset value is calculated from network replacement value by applying network component-specific average age and lifetime selection
RAB adjustments
Book values taken to RAB annually from balance sheet
Dep
rec
iati
on
s Method Straight-line depreciation on replacement value of network Depreciation is inflation
corrected annually with CPI
Depreciation
ratio4 16 22 18 25
Consideration Depreciation level based on average adjusted straight line based on the selected component lifetimes Imputed straight-line depreciations are always allowed in full as far
as the component is in actual use
3 For electricity DSOs the average of regulatory data from years the 2015 ndash 2018 is used to determine the efficiency
incentive for the fifth regulatory period (2020 ndash 2023) The DSOsrsquo efficiency figure for fifth regulatory period was determined by the average of reasonable controllable operational costs (SKOPEX) and the average of realised controllable operational costs (KOPEX) from years 2015 ndash 2018 The efficiency frontier determining the individual DSOs SKOPEX was estimated by using regulatory data from years 2012 ndash 2018 For the electricity TSO and natural gas TSO the efficiency reference level (SKOPEX) is based merely on operators own historical costs In the first year of the regulatory period the average of the previous four-year regulatory period realised controllable operational costs is used as the benchmark for efficiency costs In the following years the benchmark will be the reasonable controllable costs of the previous year
4 Calculated Depreciation Replacement value of network
Ref C20-IRB-54-03
CEER Report on Regulatory Frameworks for European Energy Networks 2020
34156
Introduction In the Finnish energy sector the regulatory task is performed by the Energy Authority as an independent regulatory authority The responsibilities of the TSOs and DSOs are set by the Finnish Electricity Market Act and Natural Gas Market Act Guidelines for the regulatory procedures applied by the Energy Authority are provided by the Act on the supervision of the electricity and natural gas market The main objectives of regulation are the reasonableness of pricing and high quality of network services Therefore the Energy Authority seeks these with the entity formed by regulation methods specific incentives and with practical steering impacts of the methods on the network operatorrsquos business operations In addition to the main targets of regulation other key targets include equality and network development as well as the sustainability continuity development and efficiency of business operations Historical Development Until 2005 the Energy Authorityrsquos regulation methodology was ex-post regulation based on case-specific assessment Since 2005 determining reasonableness of the network operation prices has been based on ex-ante set regulation method with pre-defined regulatory periods Under this regime the allowed revenues are set for network operators before the start of the regulatory period The current regulatory period is four years but the methods are valid for two consecutive regulatory periods since the Electricity Market Act changed in 2013 Determining the Revenue Caps The Energy Authority does not regulate the actual charges and tariffs as TSOs and DSOs set them independently The regulation of the electricity grid and natural gas network services are based on the assessment of the reasonableness of the pricing in network services as a whole The method decisions are published before the start of the upcoming regulatory period and these method decisions determine how the allowed or target revenues are set for the period The supervision of the reasonableness of the pricing is direct to the accumulating entity comprised by different network service fees Regulatory methods consider capital invested in network operations and reasonable rate of return (WACC-) to it which constitute the reasonable return for a network operator In turn as a comparison to reasonable return is considered the realised adjusted profit from network operations which includes the effect of incentives The impact of incentives is deducted when calculating realised adjusted profits The incentive elements that are applied in regulatory methods varies between TSOs and DSOs and the set of incentives used are a quality incentive an efficiency incentive an innovation incentive a security of supply incentive and an investment incentive The Energy Authority monitors operatorsacute profits for the regulatory period and whether they exceed determined reasonable level If pricing exceeds the determined reasonable level the surplus will have to be returned to customers in the next regulatory periodrsquos pricing Efficiency Benchmarking Efficiency means that the service required by the customer is provided at the lowest cost possible The operation of a network operator is cost-effective when the input or costs used in its operations are as small as possible in relation to the output of operations The pricing of network operations is not subject to market pressure therefore the operator has no incentive to improve the efficiency of its operations In such a case without regulation any cost ineffectiveness could be compensated with higher prices The purpose of the efficiency incentive is therefore to encourage network operators to operate in a cost-effective way and to achieve a cost level that is achievable The Energy Authority applies efficiency incentives to the electricity TSO the natural gas TSO and the electricity DSOs Natural gas DSOs are not subject to efficiency incentives
Ref C20-IRB-54-03
CEER Report on Regulatory Frameworks for European Energy Networks 2020
35156
In the calculation of efficiency improvement potential the network operatorsrsquo realised controllable operational costs (KOPEX) is benchmarked with operatorsrsquo reasonable controllable operative costs (SKOPEX) For the electricity TSO and the natural gas TSO the efficiency reference level (SKOPEX) is based merely on operatorsrsquo own historical costs In the first year of the regulatory period the average of the previous four-year regulatory period realised controllable operational costs is used as the benchmark for efficiency costs In the following years the benchmark will be the reasonable controllable costs of the previous year With electricity DSOs the company-specific efficiency target is also observed by comparing individual DSOsrsquo KOPEX to DSOsrsquo SKOPEX DSOsrsquo reasonable controllable operational costs at an output level according to efficient operations are determined by using the efficiency frontier The efficiency frontier is estimated from combined cost and output data from all DSOs The variables included in the measurement of company-specific efficiency target consists of the input variables (KOPEX and replacement value of network) output variables (volume of transmitted energy number of metering points total length of the electricity network and regulatory outage costs) and operating environment variables (connectionsmetering points -ratio) In calculation of KOPEX and SKOPEX for the fourth regulatory period (2016 ndash 2019) the average of regulatory data for 2011 ndash 2014 was used and for the fifth regulatory period (2020 ndash 2023) the average of regulatory data for 2015 ndash 2018 The efficiency frontier was estimated for the fourth regulatory period by using regulatory data from 2008 ndash 2014 as the initial data for company specific efficiency measurement variables and these were adjusted with regard to the consumer price index to the 2014 level The efficiency frontier was re-estimated for the fifth regulatory period (2020 ndash 2023) in 2019 using regulatory data from 2012 ndash 2018 For electricity DSOs efficiency benchmarking has used the StoNED-method (Stochastic Non-Smooth Envelopment of Data) since 2012 In 2015 a method was developed further to its current form for regulatory periods 2016 ndash 2019 and 2020 ndash 2023 Quality Incentive The Energy Authority uses regulatory outage costs as a quality incentive Regulatory outage costs ie the disadvantage caused by outages are calculated based on the number and duration of outages as well as the unit prices of outages which are determined The DSOrsquos average realised regulatory outage costs for the two previous regulatory periods ie eight years are used as the reference level of regulatory outage costs The reference level is adjusted with the annual energy transmitted to the customers to make the reference level of regulatory outage costs comparable with the realised regulatory costs with respect to the transmitted energy The impact of the quality incentive is deducted when calculating realised adjusted profit The impact of the quality incentive is calculated so that the realised regulatory outage costs are deducted from the reference level of regulatory outage costs The maximum impact of the quality incentive in the calculation of realised adjusted profit is made reasonable The impact of the quality incentive may not be higher than 15 of the reasonable return in the year in question for electricity DSOs 3 for the electricity TSO and 2 for the gas TSO Natural gas DSOs are not subject to the quality incentive Innovation Incentive The purpose of the innovation incentive is to encourage the network operators to develop and use innovative technical and operational solutions in their network operations The key objectives of research and development activities are the development and introduction of smart grids and other new technologies and methods of operation As a result the network operator may incur research and development costs before the new technologies are in full
Ref C20-IRB-54-03
CEER Report on Regulatory Frameworks for European Energy Networks 2020
36156
use and utilisable The Energy Authority encourages the network operators to make active efforts in research and development by deducting reasonable research and development costs in the calculation of realised adjusted profit Acceptable research and development costs must be recorded in the unbundled profit and loss account as expenses as capitalised RampD costs are not accepted for inclusion in the calculation of the innovation incentive Acceptable research and development costs must be directly related to the creation of new knowledge technology products or methods of operation in network operations for the sector The impact of the innovation incentive is deducted when calculating realised adjusted profit The impact of the innovation incentive is calculated so that a share corresponding to a maximum of 1 of the DSOrsquos total turnover from network operations in the unbundled profit and loss accounts in the regulatory period are treated as reasonable research and development costs This incentive is applied to all network operators Investment Incentive The purpose of the investment incentive is to encourage DSOs and TSOs to make investments in a cost-effective manner and to enable replacement investments The investment incentive consists of the incentive impact of unit prices and the straight-line depreciation calculated from the adjusted replacement value The incentive impact of unit prices directs the network operators to invest more effectively than on average and to find more cost-effective methods of implementation than before The incentive impact arises from the difference between investments calculated with unit prices and the cost of realised investments Together with the net present value the incentive impact of the straight-line depreciation calculated from the network operatorrsquos adjusted replacement value directs the operator to maintain its network in accordance with the lifetimes it has selected in actual use as part of the network assets and enables the making of sufficient replacement investments The incentive impact arises from the fact that the methods allow for the operator an annual depreciation level based on average adjusted straight-line depreciation based on the lifetimes selected by the operator Imputed straight-line depreciations are always allowed in full as far as the component is in actual use Therefore imputed straight-line depreciation is calculated for the component even after the end of the lifetime if the component is still in actual use The impact of the investment incentive is deducted when calculating realised adjusted profit and this incentive is applied to all DSOs and TSOs Security of Supply Incentive With the new Electricity Market Act which entered into force in 2013 criteria for security of supply were set through a maximum duration of outage for electricity DSOs In order to implement the new security of supply obligations most of the electricity DSOs need to make extensive replacement investments and carry out maintenance For this reason the security of supply incentive was introduced into the methods for the fourth and fifth regulatory periods for the years 2016 ndash 2023 The write-downs of the security of supply incentive compensate for the demolition made regarding replacement investments which has been compulsory due to the security of supply criteria The write-downs of the security of supply incentive consider justifiable early replacement investments made in order to meet the security of supply criteria in so far as the investment incentive does not take them into account In other words the write-down of the security of supply incentive only compensates the potentially lost part of imputed straight-line depreciation which the DSO has not been able to predict when selecting the average lifetime for the fourth regulatory period
Ref C20-IRB-54-03
CEER Report on Regulatory Frameworks for European Energy Networks 2020
37156
The impact of the security of supply incentive is calculated by adding together the write-downs of the NPV residual value resulting from early replacement investments carried out to improve the security of supply and the reasonable costs of maintenance and contingency measures The security of supply incentive is only applied to electricity distribution system operators The minimum requirements of the security of supply set in the Electricity Market Act in 2013 and the transition to updated regulation methods in 2016 led to large tariff increases by a few large DSOs in Finland in 2016 In the aftermath of an extensive public debate the Energy Authority suggested amendments to the legislation and in 2017 the Electricity Market Act was changed in a way such that the DSOs are allowed to increase electricity transmission and distribution charges up to 15 compared to the charges collected during the 12 months prior to the increase Transparency The Energy Authority publishes regulatory methods decisions expert reports efficiency targets and the data used in the efficiency estimation on the Authorityrsquos website The Energy Authority also publishes the annually updated parameters regarding to the calculation of the reasonable pricing The Energy Authority has also prepared an Excel workbook for electricity DSOs to assess the reasonable return for the regulatory period and to evaluate the realised adjusted profit Outlook Although the current methodology is set out for two regulatory periods years 2016 to 2023 the Energy Authority strives to develop methodology in accordance with changing market conditions For example Energy Authority has ordered a survey about international regulatory methods supporting demand response
Ref C20-IRB-54-03
CEER Report on Regulatory Frameworks for European Energy Networks 2020
38156
28 France Gas TSO Gas DSO Electricity TSO Electricity DSO
Ma
rke
t
str
uc
ture
Network operators
2 26 1 ~143
Network length
~38000 km ~200000 km ~106000 km ~1400000 km
Ownership Private and public
ownership
Private and public ownership (indirect
and local)
Mainly public ownership (direct
and indirect)
Mainly indirect public ownership
Ge
ne
ral
fra
me
wo
rk
Authority Commission de Reacutegulation de lrsquoEnergie (CRE)
System Incentive Regulation Revenue cap
Period 4 years current period 2020-2024
4 years current period 2020-2024
4 years current period 2017-2021
Base year for next period
2nd year in current regulatory period
3rd year in current regulatory period
2nd year in current regulatory period
Transparency Cost data (detailed OPEX and CAPEX) WACC and its underlying parameters quality of service scores regulatory accounts
Main elements for
determining the revenue
cap
Non-controllable and controllable costs depreciation costs taxes and fair margin
Legal framework
French law (code de lrsquoeacutenergie) and CRE tariff decisions
Rate
of
retu
rn
Type of WACC Pre-tax real Pre-tax nominal NA
Determination of the rate of
return on equity
Sum of a nominal risk-free rate and a risk premium (market risk premium multiplied
by a beta risk factor) multiplied with a corporate tax factor and expressed in real
terms
Sum of a nominal risk-free rate and a
risk premium (market risk
premium multiplied by a beta risk
factor) multiplied with a corporate tax
factor
NA
Rate of return on equity
before taxes
86 = (17+52086)
(1-2802)
84 = (17+52083)
(1-2802)
97 = (27+50073)
(1-3443) NA
Use of rate of return
Multiplied with the whole RAB (except assets that were funded through subsidies or grants)
NA
Reg
ula
tory
as
se
t b
as
e Components
of RAB Fixed assets
Regulatory asset value
Historical revaluated costs (taking into account inflation and depreciation)
Net book value
RAB adjustments
Subsidies and grants are removed from the value of assets before entering the RAB
Dep
re-
cia
tio
ns Method Straight line
Depreciation ratio
Depending on asset type Ratio between 2 and 4 for network assets (lines pipes etc)
Consideration Integrated directly and with 100 (except assets that were funded through subsidies or grants)
due to the specificities of electricity distribution in France assets are not remunerated via a WACC
Ref C20-IRB-54-03
CEER Report on Regulatory Frameworks for European Energy Networks 2020
39156
Introduction In France the Commission de Reacutegulation de lrsquoEacutenergie (CRE) is the independent authority responsible for the regulation of electricity and gas markets CRE is in charge of setting up access rules and tariffs for the utilisation of electricity and gas grids It is also responsible for approving investments in upstream electricity and gas infrastructure (electricity and gas transmission gas storage and LNG terminals) In electricity there is a single Transmission System Operator (TSO) RTE which operates maintains and develops the high and very high voltage network With more than 100000 km of lines between 63000 and 400000 volts the network managed by RTE is the largest in Europe There are 143 electricity Distribution System Operators (DSOs) in France of various sizes Distribution is dominated by Enedis which operates 95 of the electricity distribution network representing 14 million km of lines and 35 million customers Six other DSOs serve more than 100000 customers (Geacutereacutedis SRD SER GEG URM and EDF SEI) and the remaining DSOs are local companies that serve less than 100000 customers In the gas sector there are two TSOs GRTgaz and Tereacutega (formerly TIGF) GRTgaz operates a pipeline network of approximately 32000 km Tereacutega operates a network of about 5000 km in South-West France Since 1 November 2018 with the implementation of Francersquos single market area there is only one market area but still two balancing zones one for each TSO who are each responsible for the balancing of its own area of operation On the distribution side there are 26 natural gas DSOs supplying about 115 million consumers GRDF is the main one with more than 96 of the market volume Reacutegaz-Bordeaux and Reacuteseau GDS each distribute to about 15 of the market while the 23 other DSOs represent less 1 of distribution in total TSO Certification and DSO Independence On 26 January 2012 CRE certified all the French TSOs under the Independent Transmission Operator (ITO) model Revisions were carried out for RTE and Tereacutega after changes in their shareholding RTErsquos certification was renewed by a decision on the 11 January 2018 Initially certified as an ITO Tereacutegarsquos status was changed in ownership unbundling (OU) on 3 July 2014 after a modification of the shareholding structure of the TSO Regarding DSOs CRE ensures they are effectively independent of their parent company For instance there must be clearly differentiation between companies engaged in the supply or production of gas or electricity within the vertically integrated company (Enterprise Verticallement Inteacutegreacutee or EVI) to which they belong This verification is based on internal organisation and governance rules operating autonomy and implementation of a compliance officer in charge of independence obligations and compliance with the code of good conduct Electricity Transmission and Distribution Tariffs In electricity the current transmission and distribution tariffs for RTE (TURPE-5 HTB) and Enedis (TURPE-5 HTA-BT) entered into force on 1 August 2017 for a period of approximately four years (in accordance with the CREs deliberations of 17 November 2016) During the elaboration process CRE conducted in-depth analyses of the projected expenses of French operators of practices in other European countries and on the evaluation of the WACC of electricity and natural gas infrastructure in France Operating expenditures and their comparison with those of other European network managers were also examined At the end of the process CRE largely kept the previous tariff structure while introducing some improvements regarding incentives relating to capital expenditures quality of service and losses
Ref C20-IRB-54-03
CEER Report on Regulatory Frameworks for European Energy Networks 2020
40156
Regarding distribution the tariff is equalised therefore the same applies for all DSOs Charges are calculated based on an average distribution cost plus a management fee and determined according to the level of voltage on which consumers are connected A specific device to ensure that the network operators have the necessary resources to meet the costs of research and development as well as deployment of smart grids has been introduced while encouraging operators to be efficient Gas Transmission Tariffs The tariff for the use of the GRTgaz and Tereacutega natural gas transmission networks is known as the ldquoATRTrdquo The current regulatory period (ATRT-7) entered into force on 1 April 2020 for a period of approximately four years It took into consideration the (EU) regulation 2017460 establishing a network code on harmonised transmission tariff structures for gas (ldquoTariff network coderdquo) and was adopted after extensive stakeholder consultation conducted in 2019 and relies on several studies which were published The ATRT7 tariff aims at giving gas TSOs the capacity to meet the challenges of the energy transition particularly with the development of bio-methane injection into the networks It also provides the capacity to take into account the changes in the gas market in the coming years especially to control the evolution of tariffs in a context marked by the expiration of certain long-term contracts and the end of major investment projects Gas Distribution Tariffs The sixth tariff period for the use of GRDFs natural gas distribution networks known as the ATRD-6 tariff entered into force on 1 July 2020 for a period of about four years As the previous tariff it encourages GRDF to improve its efficiency especially in a context of a drop in gas consumption while maintaining the gas distribution network at a maximum-security level It also aims at providing GRDF with the capacity to adapt to the energy transition in particular regarding the development of smart metering the injection of bio-methane and research and development activities The ATRD-6 tariff also includes the estimated expenses related to the ldquogas conversionrdquo project (converting the L gas zone to an H gas zone)
Ref C20-IRB-54-03
CEER Report on Regulatory Frameworks for European Energy Networks 2020
41156
29 Germany Gas TSO Gas DSO Electricity TSO Electricity DSO
Ma
rke
t
str
uc
ture
Network operators
16 ~700 4 ~880
Network length
~40000 km ~500000 km ~37000 km ~1800000 km
Ownership Mainly private investors indirect public ownership
Private and local public ownership
Mainly private investors indirect public ownership
Private and local public ownership
Ge
ne
ral
fra
me
wo
rk
Authority
Bundesnetzagentur
(wwwbundesnetzagenturde)
Bundesnetzagentur and federal state
authorities depending on size and network area
Bundesnetzagentur
(wwwbundesnetzagenturde)
Bundesnetzagentur and federal state
authorities depending on size and network area
System Incentive Regulation Revenue cap
Period 5 years current period 2018-2022 5 years current period 2019-2023
Base year for next period
3rd year in current regulatory period
Transparency Efficiency scores revenue caps
Main elements for
determining the revenue
cap
Non-controllable and controllable costs TOTEX
efficiency benchmark general
inflation and sectoral productivity factor volatile costs
Non-controllable and controllable costs TOTEX
efficiency benchmark
efficiency bonus general inflation and sectoral productivity factor volatile costs
Non-controllable and controllable costs TOTEX
efficiency benchmark general
inflation and sectoral productivity factor volatile costs
Non-controllable and controllable costs TOTEX
efficiency benchmark
efficiency bonus general inflation and sectoral productivity
factor quality element volatile
costs
Legal framework
EnWG ARegV GasNEV EnWG ARegV StromNEV
Rate
of
retu
rn
Type of WACC No use of WACC Determination of the rate of
return on equity
Sum of a nominal risk-free rate and a risk premium (market risk premium multiplied with a beta risk factor) multiplied with a corporate tax factor
Rate of return on equity
before taxes 691 = (249+38083) 1225
Use of rate of return
Granted for existing assets to a maximum of 40 of the imputed necessary business assets Any available equity capital in the capital structure in excess of this will be subject
to another equity interest rate
Reg
ula
tory
as
se
t b
ase
Components of RAB
Fixed assets working capital assets under construction
Regulatory asset value
Net substance preservation for business assets capitalised prior to 1st January 2006 real capital preservation for business assets as from 1st January 2006
RAB adjustments
By the ordinance defined investments after the base year
eg expansions lead to an
adjustments of the non-controllable
costs and therefore of the revenue cap
Investments in new assets after the
base year lead to an adjustment of the
CAPEX No distinction between replacements and enhancements or
expansions
By the ordinance defined investments after the base year
eg expansions lead to an
adjustments of the non-controllable
costs and therefore of the revenue cap
Investments in new assets after the
base year lead to an adjustment of the CAPEX No
distinction between replacements and enhancements or
expansions
Dep
re-
cia
tio
ns Method Straight line
Depreciation ratio
Depending on asset type Ratio between 15 and 4 eg lines amp cables ~2 stations ~4
Consideration Part of the examined controllable costs
Ref C20-IRB-54-03
CEER Report on Regulatory Frameworks for European Energy Networks 2020
42156
Introduction The electricity and gas networks are examples of what are known as natural monopolies where effective competition is restricted or does not exist at all To ensure that network operators (DSOs = Distribution System Operators TSOs = Transmission System Operators) do not make any monopoly profits but still operate their networks as cost effectively as possible the electricity and gas network operators are subject to regulation This task is performed by the Bundesnetzagentur (BNetzA) as the regulatory authority responsible in Germany for the networks in various sectors including electricity and gas BNetzA is responsible for regulating all operators with more than 100000 customers or whose network area covers more than one federal state All other network operators are regulated by the regulatory authorities in the federal states These federal state authorities can however also delegate regulation to BNetzA Historical Development Regulation by BNetzA began in 2005 as cost-plus regulation An incentive-based regulatory regime was introduced in 2009 to replace cost-plus regulation Under this regime the revenue that network operators are allowed to earn within a certain period (regulatory period) is determined using a mathematical formula and is fixed for the period It therefore makes sense (incentive) for network operators to lower their costs within the regulatory period (work efficiently) so as to increase their profits within the limits of the framework (revenue (fixed) minus costs (controllable) equals profit) Determining the Revenue Caps The revenue caps for network operators are set for a five-year regulatory period Each cap is composed of the permanently non-controllable costs temporarily non-controllable costs controllable costs (applying a distribution factor for reducing inefficiencies) a possible efficiency bonus (DSOs only) general inflation relative to the base year and a general sectoral productivity factor a CAPEX in period top-up to take account of the cost of capital for investments after the base year (DSOs only) quality element (electricity DSOs only) and volatile costs The difference between the allowed revenue and the development of actual volumes over the year is entered into a regulatory account Efficiency Benchmarking BNetzA carries out its efficiency benchmarking on the basis of the cost examination (TOTEX) and structural data validation before the start of each new regulatory period for gas and electricity network operators separately The efficiency benchmarking involves assessing the operators individual costs against the services they provide and determining each operators cost efficiency compared to the other operators In addition to the (input) cost parameters structural (or output) parameters are taken into account to replicate the services provided in each case as well as the regional characteristics Possible structural parameters could e g include the number of connection points peak load the amount of energy delivered or injected and transformer and compressor station data The costs and structural data collected always relate to the base year which is always the third year of a regulatory period The costs data mainly comprise staff and materials costs interest on borrowings depreciations and other operating costs Depreciations are prescribed in the regulations and are based on technical asset lives The costs data is supplemented by a calculated return on equity Anyone investing in a business enterprise expects a return on the capital employed that is competitive and reflects
Ref C20-IRB-54-03
CEER Report on Regulatory Frameworks for European Energy Networks 2020
43156
the industry-specific risks This return is usually a result of market forces and depends on the individual sector and the general level of interest rates If there is an imbalance between the risk of investment and potential earnings as a rule there will be no investment However since network operators ndash by virtue of their natural monopoly ndash are not fully subject to these market mechanisms yet still need to make vital investments in infrastructure the rate of return on equity is determined by the regulator The return on equity comprises a risk-free rate (determined on the basis of the ten-year average current yield of fixed-interest securities) and a risk premium The premium covering network-specific risks is determined using the capital asset pricing model (CAPM) and is derived from the product of an imputed market risk premium and a risk factor (beta factor) Corporate tax is accounted for through a factor applied to the sum of the risk-free rate and the risk premium Trade tax is by contrast determined on the basis of the return on equity The rate of return on equity is different for new and old assets The return on equity comprising the risk-free rate the risk premium and the corporate tax factor is applicable to new assets that first existed in or after 2006 A rate adjusted to take account of inflation is applicable to old assets that existed before 2006 The rate of return on equity is granted for existing assets to a maximum of 40 of the imputed necessary business assets Any available equity capital in the capital structure in excess of this will be subject to another equity interest rate This equity II interest rate is aligned with the standard rates of interest for procured capital and is set as a ten-year average based on the yields published by the German Bundesbank (federal bank) Existing borrowed capital is recognised at equal value insofar as any interest on borrowings does not exceed the customary market interest rate for comparable loans The costs known as the permanently non-controllable costs are deducted from this cost pool (materials costs staff costs costs of borrowing taxes other costs write-downs and return on equity minus revenue and income with cost-reducing effect) Permanently non-controllable costs are for example upstream network costs non-wage labour costs and concession fees Network operators can fully recoup the permanently non-controllable costs as revenue From the third regulatory period (2018 for gas and 2019 for electricity) there is an annual subtraction of the capital cost for the DSOs This subtraction takes account of the fall in capital expenditure for the asset base (total costs of depreciation the return on equity and the corporate tax each of which is imputed plus the costs of borrowing) over the duration of the regulatory period The CAPEX subtraction is also deducted from the cost pool The remaining controllable costs data and the structural data are then taken for the efficiency benchmarking model The structural cost parameters for all network operators are used to define groups or combinations of parameters that reflect the services provided by the network operators The optimum size of the parameter groups is also examined and defined The efficiency scores for the network operators are determined by applying the data envelopment analysis (DEA) and stochastic frontier analysis (SFA) methods to the defined parameter groups Since efficiency benchmarking is a comparative method the results for the individual network operators have a mutual influence on each other A network operator that provides the same scope of services as but has higher costs than another operator (100 efficiency) will have an efficiency score lower than 100 The efficiency scores are then applied to the controllable costs (total costs
Ref C20-IRB-54-03
CEER Report on Regulatory Frameworks for European Energy Networks 2020
44156
minus permanently non-controllable costs minus CAPEX subtraction) A network operator with an efficiency score of 80 for example will need to remedy the 20 of inefficiencies over the course of the upcoming regulatory period Each of the two methods used (DEA and SFA) offers only a restricted approach to determining efficiency scores This is why both methods are applied to determine more than one efficiency score for each network operator The network operators costs are also adjusted to take account of the networks different lifetime structures The DEA and SFA methods are then applied to determine further efficiency scores using these standardised costs Each network operator is then given the highest of the four efficiency scores calculated If the efficiency score calculated for a network operator using the two methods is lower than 60 the score is raised to 60 as the set minimum efficiency level A maximum efficiency level of 100 is also set The results are also examined to identify any network operators that appear as outliers and whose efficiency scores clearly dominate the efficiency scores of other network operators These network operators are no longer taken into account in the benchmarking and are given a fixed score of 100 without having any further influence on the efficiency scores of the other network operators The most efficient DSOs are eligible for a bonus added to the revenue cap on the basis of a super-efficiency analysis this bonus is limited to a maximum value of 5 This gives operators an incentive beyond the end of a regulatory period to improve efficiency in the long term even if they have already achieved an efficiency score of 100 General Sectoral Productivity Factor and Price Development Another component of the revenue cap is the general sectoral productivity factor which is always applicable for one regulatory period This factor is determined using scientific methods from the divergence between productivity gain in the network industry and productivity gain in the economy as a whole The idea behind this factor is to imitate market forces and thus simulate competitive pressure It is assumed that where competition exists productivity gains will lead to lower costs for companies and companies will pass on this competitive advantage to customers in the form of lower prices so as to attract customers away from competitors The productivity factor has the effect of reducing revenues The revenue caps also take account of the development of consumer prices in relation to the base year (CPI-X regime) General price increases lead to an increase in the revenue cap Quality Regulation Under a regulatory regime that provides incentives to cut costs there is a risk that operators will refrain from undertaking the necessary investments or measures in order to achieve the required or potential savings To counter this the regime includes quality regulation for electricity distribution networks This takes the form of a quality element in the formula for setting the revenue caps Operators achieving above-average quality in past years will have an amount added to their cap while operators with comparatively poor quality levels will have amounts deducted (bonuspenalty system) Adjusting the Revenue Caps After the Reference Year A CAPEX in period top-up for DSOs ensures that the revenue cap can be adjusted in line with the cost of capital for investments in new assets after the reference year No distinction is made here between replacement and enhancement or expansion expenditure Operators must apply for the top-up six months in advance
Ref C20-IRB-54-03
CEER Report on Regulatory Frameworks for European Energy Networks 2020
45156
TSOs (and in some cases DSOs) are able to refinance their necessary expansion and restructuring investments through investment measures Proposed expansion and restructuring investments can be approved provided they are required for the stability of the system as a whole incorporation into the national or international interconnected grid or expansion of the network to meet energy supply requirements Investments approved under the investment measures are factored into the revenue cap as permanently non-controllable costs In the event of changes in other permanently non-controllable costs of a network operator in the course of a regulatory period the revenue cap and thus the network charge can be adjusted accordingly National Specificities Electricity (Gas) DSOs with fewer than 30000 (15000) customers can choose to participate in what is known as the simplified procedure and are then not subject to efficiency benchmarking The efficiency score applicable to these operators is the weighted average of all adjusted efficiency levels from the national benchmarking exercise in the previous regulatory period For companies subject to the simplified procedure the portion allocated to permanently non-controllable costs is fixed at a flat rate of 5 Transparency The data published on the regulatory authorityrsquos websites include revenue caps and annual adjustments efficiency scores and efficiency bonuses Outlook There are currently no further plans to fundamentally change the incentive-based regulatory regime in Germany Various changes were made to the regime in 2016 Currently there are plans to introduce more incentives for supporting the grid extension related to the energy transition and for supporting the decrease of grid bottlenecks and the related costs of operating with these grid bottlenecks
Ref C20-IRB-54-03
CEER Report on Regulatory Frameworks for European Energy Networks 2020
46156
210 Great Britain Gas TSO Gas DSO Electricity TSO Electricity DSO
Ma
rke
t
str
uc
ture
Network operators
1 8 3 14
Network length
~7000 km ~265000 km ~25000 km ~800000 km
Ownership Private ownership Private ownership Private ownership Private ownership
Ge
ne
ral
fra
me
wo
rk
Authority GEMA (Gas and Electricity Markets Authority)
System Revenue Cap based on Rate-of-Return with Incentive-based Regulation
Period 8 years Current period 2013-21
8 years Current period 2015-23
Base year for next period
Transparency Full transparency through extensive consultation and publication
Main elements for determining
the revenueprice
cap
Bottom-up capital and operating expenditure (CAPEX and OPEX) benchmarkinganalysis complemented by top-down total expenditure (TOTEX) benchmarking efficiency
considerations RAB WACC RPI Real Price Effects performance against incentive schemes
Legal framework
Gas Act 1986 Electricity Act 1989 Utilities Act 2000 Competition Act 1998 Enterprise Act 2002 and measures set out in a number of Energy Acts
Rate
of
retu
rn
Type of WACC
Vanilla Real WACC
Determination of the rate of return on
equity
Sum of risk-free rate and a market risk premium multiplied by equity beta
Rate of return on equity
before taxes
Electricity transmission 7 Electricity distribution 6 Gas transmission 68 Gas distribution 67 (all in real terms)
Use of rate of return
Multiplied by the average period RAB
Reg
ula
tory
as
se
t b
as
e
Components of RAB Historical investment base (less depreciation removals) and capitalised element of total
expenditure in current control period
Regulatory asset value
Gas TSO pound5bn Gas DSO pound168bn Electricity TSO pound13bn Electricity DSO pound213bn
RAB adjustments
Annually updated for RPI and allowed additions less regulatory depreciation and cash proceeds from disposals
Dep
re-
cia
tio
ns Method Straight line for all except Gas DSO which is sum of digits
Depreciation ratio
Generally 45 years but some exceptions to avoid cliff edge effects
Consideration
Introduction
Ofgem is the Office of Gas and Electricity Markets5 It is a non-ministerial government department and an independent National Regulatory Authority recognised by EU Directives Ofgemrsquos principal objective when carrying out its functions is to protect the interests of existing and future electricity and gas consumers Ofgem works effectively with but is independent of government the energy industry and other stakeholders within a legal framework determined by the UK government
5 Note Ofgem regulates markets in Great Britain but not in Northern Ireland
Ref C20-IRB-54-03
CEER Report on Regulatory Frameworks for European Energy Networks 2020
47156
Ofgem is governed by the Gas and Electricity Markets Authority (GEMA) The Authority determines strategy sets policy priorities and makes decisions on a wide range of regulatory matters including price controls and enforcement Historical Development GB gas networks were privatised in 1986 and electricity networks in 1989 The form of regulation initially chosen was ldquoRPI-Xrdquo whereby the regulator limits average network charges from rising by more than the rate of inflation (measured by the Retail Price Index) less an efficiency factor (called X) Since the revenues for the regulated company are set ahead of the regulatory period it incentivises the company to reduce expenditure as much as possible to maximise profits This price revelation can then be used to set allowances for the next regulatory period allowing consumers to benefit from the resulting lower costs Although costs came down significantly over the course of successive iterations of price controls RPI-X was found to have a number of issues companies sometimes compromised on quality of service to maximise profits they had poor incentives to invest in the introduction of innovation and the regime had a bias towards capital intensive solutions Accordingly in 2013 Ofgem moved to the ldquoRIIOrdquo price control framework which is Revenues = Innovation + Incentives + Outputs Under RIIO companies are held accountable for delivering a high quality of service through the use of output targets they are given financial incentives and a longer control period to encourage investment in innovation projects and the bias towards capital spending was removed through the use of TOTEX allowances which means that a fixed proportion of a companyrsquos total expenditure is added to the RAB irrespective of whether it comprises capital or operating expenditure Determining the Revenue Caps The revenue caps for network operators are set for an eight-year regulatory period The current regulatory period for gas amp electricity transmission and gas distribution is April 2013 ndash March 2021 for electricity distribution the period is April 2015 ndash March 2023 The allowed revenues are built up as per the following diagram
Ref C20-IRB-54-03
CEER Report on Regulatory Frameworks for European Energy Networks 2020
48156
Baseline TOTEX is set taking a view on justification of investment and then if justified making an allowance for efficient costs Network operators are incentivised to beat these allowed costs through a sharing mechanism which allows them to keep a share of any underspend or bear a proportion of any overspend These revealed costs then help to set benchmarks for the cost levels in the following price control period Efficiency Requirements Investment plans for the entire regulatory period are approved ex-ante on the basis of established needs case and the having a positive cost benefit analysis Operators are allowed efficient costs and incentivised to beat these through a profitloss sharing mechanism Where costs or timing of investment need are not clear there are uncertainty mechanisms that allow for a revisiting of the justification at a later stage of the control period The efficient allowances will sometimes take consideration of factors such as efficiency gains (to mimic the expected gains in productivity that occur in competitive markets) and real price effects (those unavoidable business costs that develop at a different rate to the RPI annual revenue indexation) Price Development The allowed revenues are indexed to the retail prices index in relation to the base year and also take into account real price effects Quality Regulation Network operators have to meet performance outputs specified in their licences the categories of output are common within sectors but vary between sectors The performance targetsrequirements vary from licensee to licensee Failure to deliver outputs can be met by a variety of measures financial penalties claw back of revenues and in extreme cases enforcement action Adjustments after the Reference Year Each year Ofgem recalculates revenue allowances due to inflation investment non-controllable (pass-through) operating and maintenance costs licensee specific mechanisms and incentives This adjustment is done on an annual basis and feeds into tariffs that come into effect two years afterwards Transparency Price controls are set following extensive stakeholder consultation typically over a two-to-three-year timeframe in advance of the regulatory period Submissions responses and decisions are all published on the Ofgem website (subject to commercial confidentiality restrictions) Licensees are obliged to send in annual returns and Ofgem publishes reports that monitor how the licensees are performing against the price control settlement
Ref C20-IRB-54-03
CEER Report on Regulatory Frameworks for European Energy Networks 2020
49156
211 Greece Gas TSO Gas DSO Electricity TSO Electricity DSO
Ma
rke
t
str
uc
ture
Network operators
1 3 1 1
Network length 1466 km 6382 km 17340 circuit km 241179 circuit km
Ownership Private investors and State ownership
State ownership and private investors
State ownership and private investors
State ownership and private investors
Ge
ne
ral
fra
me
wo
rk
Authority Regulatory Authority for Energy (RAE)
System Cost plus Revenue cap Revenue cap Cost Plus
Period 4 years current period 2019-2022
4 years current period 2019-2022
4 years current period 2018-2021
1 year
Base year for next period
Year t-2 (actual) amp year t-1 (estimates)
Transparency Decisions Regulatory data Specific cost data
Main elements for determining
allowed revenue
OPEX (Non-controllable and
controllable costs) Depreciation
RAB (Assets and approved
investment plans working capital)
WACC
OPEX (Non-controllable and
controllable costs) Depreciation RAB
(Assets and approved
investment plans working capital)
WACC and WACC premium
OPEX (Non-controllable and
controllable costs) Depreciation RAB
(Assets and approved
investment plans working capital)
WACC and WACC premium
OPEX (Non-controllable and
controllable costs) Depreciation RAB
(Assets and approved
investment plans working capital)
WACC
Legal framework
Law 40012011
Rate
of
retu
rn
Type of WACC Nominal pre-tax Nominal pre-tax Real pre-tax Nominal pre-tax
Determination of the rate of
return on equity
WACC a) CAPM amp additional country risk premium for cost of equity and b) cost of debt based on operatorsrsquo proposal and actual figures of base year
Rate of return on equity
before taxes 876 875 83 780
Use of rate of return
WACC is applied on the value of Regulatory Asset Base (RAB) for each year of the Regulatory Period
Reg
ula
tory
as
se
t b
as
e Components of
RAB Fixed assets working capital assets under construction
Regulatory asset value
Historical costs Historical costs since 2009 (last revaluation
in 2004)
RAB adjustments
No adjustments historical values6
Dep
re-
cia
tio
n Method Straight line
Depreciation ratio
Most assets are depreciated over a period of 25-50 years
Consideration Depreciation ratio depends on asset type and it is integrated directly into the revenues
6 Only for Electricity TSO since Allowed Revenue is calculated in real terms an adjustment of RAB is taken place
based on CPI
Ref C20-IRB-54-03
CEER Report on Regulatory Frameworks for European Energy Networks 2020
50156
Introduction Electricity and natural gas networks are characterised as ldquonatural monopoliesrdquo in which effective competition is limited or does not exist at all In this context to ensure that network operators do not abuse their dominant position ie provide non-discriminatory access to the network at tariffs that reflect conditions of healthy competition and to stimulate cost effective operation of the network Transmission System Operators (TSOs) and Distribution System Operators (DSOs) are subject to regulation This task is performed by the Regulatory Authority for Energy (RAE) RAE among other tasks oversees and regulates the electricity and natural gas network operators in Greece Electricity transmission and distribution in Greece are conducted by one TSO (ADMIE-IPTO) and one DSO (HEDNO) Regarding natural gas there is one TSO (DESFA) and three DSOs (EDA Attikis EDA Thess7 DEDA) There is also a separate electricity DSO (privately owned) operating the network of Athens International Airport The Athens International Airportrsquos Electricity Grid Manager is regulated However only accounting obligations are applied since it has less than 100000 customers (Directive 722009) Historical Development Unbundling Following the Energy Law 40012011 the Public Power Corporation (PPC SA) established a 100 subsidiary ADMIE SA according to the Independent Transmission Operator (ITO) model In 2012 RAE certified ADMIE SA as the independent power transmission system operator and since 2017 ADMIE SA has followed the model of Ownership Unbundling and the shareholding structure is 51 Greek State (through ADMIE HOLDINGS Inc and DES ADMIE SA) 24 State Grid Europe Limited and 25 other institutional and private investors HEDNO SA (Hellenic Electricity Distribution Network Operator SA) was formed by the separation of the Distribution Department from PPC SA according to Law 40012011 and in compliance with 200972EC EU Directive HEDNO SA is a 100 subsidiary of PPC SA (51 owned by Greek State and 49 by institutional investors amp general public) however it is fully independent in operation and management retaining all the independence requirements that are incorporated within the aforementioned legislative framework HEDNO is organised as a distribution operator based on the ISO model PPC SA retains the ownership of distribution assets HEDNO is also the designated system amp market operator of the non-interconnected island electricity systems The Hellenic Natural Gas TSO (DESFA SA) was privatised during 2018 and the companyrsquos shareholding structure is now 34 the Greek State and 66 SENFLUGA SA (a consortium of the companies SNAM ENAGAS and FLUXYS) The three Natural Gas DSOs (EDA Attikis EDA Thess and DEDA8) were unbundled from supply activities in 2017 Tariff Regulation According to law9 RAE approves tariff setting methodologies for all non-competitive activities and sets relevant overarching principles and criteria Explicit allowed revenue methodologies are currently in place for electricity transmission (since 2015) gas transmission (since 2012) and for gas distribution (since 2016) The regulatory model is essentially a multi-year revenue-
7 Operator of the Natural Gas Distribution Network within the geographical areas of Thessaloniki Prefecture and
Thessaly Region 8 Operator of the Natural Gas Distribution Network for the Rest of Greece apart from Attiki and Thessaloniki ndash
Thessalia 9 Law 27731999 and Law 40012011
Ref C20-IRB-54-03
CEER Report on Regulatory Frameworks for European Energy Networks 2020
51156
cap on OPEX and cost-plus on CAPEX Allowed revenue for electricity distribution is currently calculated by relying on the principles underpinning the electricity transmission revenue methodology adapted to single-year regulatory periods and applied broadly as cost-plus on both OPEX and CAPEX Regulatory Decision Process Given the allowed revenue methodologies in place for the next period the process starts with regulatory submissions by operators due not later than seven months before the start of the next regulatory period The decision setting allowed revenue for the next period is issued two months before its start Decisions are taken separately for each TSO and DSO in the natural gas and electricity sectors Main Principles of the Tariff Regulation The Regulatory Period Duration of the regulatory period is set as part of the allowed revenue methodology decision For electricity and gas TSOs as well as for gas DSOs a four-year Regulatory Period applies10 For the electricity DSO the regulatory period can be set from three to five years defined also as part of the allowed revenue methodology decision (to be issued in 2020) The base (reference) year for all operators is year 119905 minus 2 Determining Allowed Expenditures The main building blocks of allowed revenue (OPEX and CAPEX) are determined in separate processes CAPEX streams are derived by approved network development plans (ten-year plan for electricity and gas TSO five-year plan for electricity and gas DSOs) that apply for the regulatory period under review These can be modified on an annual basis and are approved separate from allowed revenue decisions Modifications to approved development plans during a regulatory period are considered in ex-post treatment of CAPEX OPEX streams are determined in the context of the allowed revenue decision RAE set a reasonable OPEX allowance for the next period scrutinising operatorsrsquo expenditure proposals based on past performance and forecasts considering changes in relevant drivers conditions statutory and regulatory requirements etc Regulatory Asset Base ndash Depreciation The Regulatory Asset Base (RAB) includes the estimated capital employed for the regulated network activity for every year of the regulatory period which includes the following
i Undepreciated value of fixed assets (+) ii Assets under construction (+) iii Working capital (+) iv Grants and Contributions from Third Parties (-)
Depreciation is calculated for every year of the regulatory period for all assets that are expected to be in service during that year excluding assets funded by third parties Assets under construction are remunerated only for return on employed capital
10 In the recent past regulatory periods of three years were implemented while the current regulatory period for
gas TSO is 2 years (2017-2018)
Ref C20-IRB-54-03
CEER Report on Regulatory Frameworks for European Energy Networks 2020
52156
For the electricity TSO (ADMIE) and DSO (HEDNO) the historical values of 2009 have been considered (two revaluations took place before 2009 in 2000 and 2004 and the relevant surplus has been included in historical values) Since then no revaluation has been considered For the natural gas TSO and DSOs historical values are considered WACC and WACC Premium A weighted average cost of capital (WACC) is calculated as a rate of return for capital employed (RAB) WACC is estimated in real terms (pre-tax) only for the electricity TSO (since 2015) while for all the other operators a nominal pre-tax WACC is used Due to specific country conditions an extra premium (Country Risk Premium) is added to CAPM model For the electricity TSO and for specific projects that are characterised as Projects of Major Importance in the TYNDP a premium rate of return can be provided in addition to WACC The percentage of this premium varies between 1 and 25 and is decided by RAE For gas DSOs RAE can increase the allowed return (WACC) by 15 according to specific objectives (defined by RAE) mainly aiming to increase natural gas consumption WACC Calculation
119882119860119862119862119901119903119890minus119905119886119909119899119900119898119894119899119886119897 = 119892 lowast 119903119889 + (1 minus 119892) lowast 119903119890(119905 minus 1)
119903119890119901119900119904119905minus119905119886119909119899119900119898119894119899119886119897 = 119903119891 + 120573119890119902119906119894119905119910 lowast 119872119877119875 + 119862119877119875
Parameters electricity natural gas
Transmission (2020)
Distribution11 (2019)
transmission (2020)
distribution (2020)
Nominal risk-free rate 070 047 035 035
Country Risk Premium (CRP) 180 200 180 180
Cost of Debt 504 460 393 308
Market premium 500 530 530 530
Equity beta 067 060 080 080
Cost of Equity (pre-tax) 83 780 876 875
Gearing - D(D+E) 3627 2715 1890 1800
Tax rate12 2800 2800 2700 2700
Nominal pre-tax WACC 710 697 784 773
Treatment of OPEX amp CAPEX ndash Efficiency Incentives Except for extraordinary allowed revenue revisions the electricity TSOrsquos and gas DSOsrsquo OPEX allowances are not subject to ex-post adjustment or settlement either during or after the regulatory period As there is no efficiency sharing mechanism currently in place the scheme provides some incentives to these operators to operate more efficiently The electricity DSO is provided with similar incentives although these are further limited to plusmn3 of OPEX allowance deviations beyond this threshold are potentially subject to settlement ex-post
11 The relevant decision for 2020 is to be issued The above figures are according decision 5722019 for the Allowed
Revenue of 2019 12 At the end of 2019 according to Law 46462019 tax rate has been reduced to 24
Ref C20-IRB-54-03
CEER Report on Regulatory Frameworks for European Energy Networks 2020
53156
OPEX allowance of the gas TSO is fully adjusted based on actual figures (cost-plus approach) CAPEX is treated on a cost-plus basis for both electricity and gas TSOs and DSOs with settlements for differences between approved and realised expenditure carried out both on annual basis and at the end of the regulatory period Extraordinary Revisions of Allowed Revenue Extraordinary revisions of the allowed revenue can be performed in case of a substantial change on the legal economic or actual data that were considered when calculating the allowed revenue has occurred Adjusting During a Regulatory Period Inflation adjustments are made for all network operators during the regulatory period apart from the electricity DSO which has a one-year regulatory period Outlook Key plans to further develop the regulatory regime for electricity networks in Greece include introducing for the electricity DSO
bull a multi-year regulatory period (three-five years)
bull a revenue-cap methodology (probably for OPEX during the first period)
bull incentives to reduce network losses (penaltyreward scheme) and
bull a quality regulation (minimum guaranteed standards complemented with a penaltyreward scheme in the following period)
Ref C20-IRB-54-03
CEER Report on Regulatory Frameworks for European Energy Networks 2020
54156
212 Hungary Gas TSO Gas DSO Electricity TSO Electricity DSO
Ma
rke
t
str
uc
ture
Network operators
1 10 1 6
Network length
5874 km 83872 km 4856 km 161800 km
Ownership Private Ownership
2 state-owned 8 private
Public 1 public 5 private
Ge
ne
ral
fra
me
wo
rk
Authority Hungarian Energy and Public Utility Regulatory Authority (httpwwwmekhhuhome)
System Incentive Regulation
Period 4 years current period 2017 Jan-2021 Sep (longer than 4 years due to the change from Jan-Dec regulatory periods to Oct-Sep
periods)
4 years current period 2017-2020
Base year for next period
2018 2019 2019
Transparency The methodological guidelines for determining the justified costs and maintaining the prices during the regulation period are available on HEA website
Main elements for
determining the allowed
revenue
Allowed revenue is composed of
OPEX CAPEX Depreciation (all
adjusted to account for inflation)
efficiency improvement factor for OPEX (CPI-X)
Allowed revenue is composed of OPEX
CAPEX Depreciation (all
adjusted to account for inflation)
efficiency improvement factor for OPEX (CPI-X)
Hybrid model Hybrid model
Legal framework
Act 40 of 2008 on natural gas
Commission Regulation
2017460 (TAR NC)
Act 40 of 2008 on natural gas
Act 86 of 2007 on electricity
Rate
of
retu
rn
Type of WACC Real pre-tax
Determination of the rate of
return on equity
Sum of the real risk-free rate and risk premium (equity beta multiplied by market risk premium)
Rate of return on equity
before taxes 614 = (0188+1689+430072((1-019) 620 = (188+430073)(1-019)
Use of rate of return
WACC is multiplied with the whole value of RAB to calculate the return on capital
Reg
ula
tory
as
se
t
ba
se
Components of RAB
Tangible assets Fixed assets
Regulatory asset value
Network assets depreciated replacement value Non-network assets historical costs
RAB adjustments
The assets of the base year are modified yearly with modified CPI and T-1 yearrsquos
investments which were approved by the Authority
The assets of the base year are modified yearly with CPI and T-1 yearrsquos investments
minus depreciation minus connection charges
Dep
re-
cia
tio
ns Method Straight line
Depreciation ratio
Depending on asset type the useful lifetime (years) pipeline 50 compressor station 20
gas delivery station 30
Depending on asset type Ratio between 25 and 7 eg lines amp cables ~25
stations ~333
Consideration Based on expected useful lifetime Based on expected useful lifetime
Ref C20-IRB-54-03
CEER Report on Regulatory Frameworks for European Energy Networks 2020
55156
Introduction The electricity and gas networks are examples of what are known as natural monopolies where effective competition is limited or does not exist at all To ensure that network operators (DSOs and TSOs) do not make any monopoly profits but still operate their networks as cost effectively as possible the electricity and gas network operators are subject to regulation Electricity Historical Development Regulation began in Hungary after privatisation in 1997 with the first four-year regulatory period The regulation was incentive-based from the beginning but there were gradual changes in each period The developments in the electricity and gas sectors ran in parallel but there were some differences In electricity separate network tariffs have existed since 2003 The Capital Asset Pricing Model was first applied in the 2005-2008 pricing period while benchmarking was introduced in the 2009-2012 pricing period The present regulatory period has seen a transition from price caps to revenue caps as the quantity changes of the distributed energy are taken into account Determining the Price Caps The Hungarian incentive regulation is a price-cap-like system The price caps for network operators are set at the beginning of the four-year regulatory period The cap is calculated from the justified costs (operation amp maintenance (OampM) depreciation capital costs (RAB multiplied with WACC) network loss) and the transmitted or distributed energy The justified costs are determined through a detailed cost review Concerning the OampM cost there is an efficiency benchmarking the Regulatory Asset Base and the depreciation are calculated from the depreciated replacement value and the expected lifetime of the assets Efficiency Benchmarking The Hungarian Energy and Public Utility Regulatory Authority (hereinafter HEA) carries out its OampM cost-efficiency benchmarking prior to the start of each new regulatory period for gas and electricity network operators separately The efficiency benchmarking involves assessing the operators individual costs against the services they provide and determining each operators cost efficiency compared to the other operators The benchmarking is related to the DSOrsquos part- or sub-operations such as operation and maintenance metering and reading customer service The partial productivity index is used General Sectoral Productivity Factor and Price Development The idea behind this factor is to imitate market forces and thus simulate competitive pressure It is assumed that where competition exists productivity gains will lead to lower costs for companies and companies will pass on this competitive advantage to customers in the form of lower prices so as to attract customers away from competitors Quality Regulation Under a regulatory regime that provides incentives to cut costs there is a risk that operators will refrain from undertaking the necessary investments or measures in order to achieve the required or potential savings To counter this the regime includes quality regulation for electricity distribution networks This takes the form of a quality element in the formula for maintaining the price caps Operators achieving above the required quality (SAIDI SAIFI Outage Rate) in past years will have an amount added to their price cap while operators with comparatively poor quality levels will have amounts deducted (bonuspenalty system) The TSO is subject to a far softer quality regulation which is only a simple penalty system and which has not been activated so far
Ref C20-IRB-54-03
CEER Report on Regulatory Frameworks for European Energy Networks 2020
56156
Adjusting the Price Caps After the Reference Year The formula for maintaining the network tariffs during the regulation period consists of the following cost and revenue elements
- Forecasted CPI ndash X (OampM) forecasted CPI (depreciation and capital expenditure) - Investments - Forward electricity price changes (network losses) - The difference between the factual revenue and the forecasted revenue - Quality of service and - Other specific costs (only in case of the TSO)
National Specialities For electricity there are nation-wide uniform distribution tariffs with an inter-DSO compensation tool Transparency HEArsquos methodological guidelines for determining the justified costs and maintaining the prices during the regulation period are available on the HEA website Natural Gas Historical Development With regards to natural gas a separate system for tariffs has existed since 2004 Before their introduction between 1999 and 2004 regulated tariffs (containing both the costs related to system usage and commodity costs) consisted of two components (fixed and variable) Before 1999 a single component tariff (purely volume based) was in effect Since 2004 system tariffs have been regulated with regulatory periods ranging between two and six years The current regulatory period began on the 1st of January 2017 Due to the switch to regulatory periods with their beginnings coinciding with the beginning of the gas year the current regulatory period will be longer than four years and will last until the 30th of September 2021 Determining the Tariffs Tariffs are set for four-year (as a default) regulatory periods with annual tariff reviews during the regulatory period HEA carries out a cost and asset review before the beginning of each regulatory period during which it determines the regulatory asset base the justified operating costs and the level of the WACC to be applied during the next regulatory period Before the cost and asset review HEA issues methodological guidelines detailing the applied methodologies both for the setting of the initial tariffs and the annual tariff review during the regulatory period During the cost review mainly with regards to DSOs HEA benchmarks the efficiency of relevant activities among the system operators In 2015 HEA issued a guideline to DSOs in order to harmonise their cost accounting practices and thus help the benchmarking process HEA also determines the level of metering losses considered to be justified and the cost of the lost gas After determining the justified operating costs and the regulatory asset base HEA calculates the level of the costs to be recovered through the tariffs (cost base) Based on the cost base the relevant capacities and heating-degree day normalised volumetric data HEA determines the applicable tariffs In 2019 in line with the provisions of Commission Regulation (EU) 2017460 of 16 March 2017 establishing a network code on harmonised transmission tariff structures for gas HEA issued
Ref C20-IRB-54-03
CEER Report on Regulatory Frameworks for European Energy Networks 2020
57156
a reference price methodology following a public consultation which replaced the former methodological guidelines with regards to the transmission system operator A Short Overview of the Benchmarking Process Utilised During the Cost and Asset Review of DSOs The aim of benchmarking the relevant costs is to assess the efficiency of the different operators and to determine the justified level of operating costs For the benchmarking HEA used partial productivity indices HEA divided the activity of DSOs into comparable sub-activities allocated the relevant costs to the sub-activities and based on the relevant cost driversoutputs created per unit indices These per unit partial productivity indices form the basis of the benchmarking process The following sub-activities are used in the benchmarking process Activities related to the operation of infrastructure
bull Maintenance and operation of pressure regulators (with the exceptions of small-sized pressure regulators placed at end-users) and city gates
bull Maintenance and operation of gas lines
bull Maintenance and operation of gas meters and
bull Maintenance and operation of pressure regulators placed at end-users + costs related to malfunctions
Activities related to system users
bull Meter reading
bull Customer relations
bull Billing and
bull Technical review of end-user system plans and testing of end-user systems
Only operating costs are benchmarked The following categories of costs are not benchmarked pass-through costs costs of an insignificant level costs reviewed with other methodologies (eg network losses) Cost drivers used during the process were determined based on the following criteria
bull The data was available at all DSOs and it was determined with a sufficiently similar methodology
bull A strong correlation was found both on the level of individual DSOs and for their totality between the cost driver and the relevant cost base and
bull For activities with no sufficient cost drivers identified composite cost drivers with a better fit were created from the combination of the relevant drivers
In order to account for justified differences between the costs and operating circumstances of the DSOs the regulator had the right to modify cost drivers By dividing the relevant costs with the relevant cost drivers the regulator created the partial productivity indices regarding unit costs By dividing the sum of the relevant costs of all DSOs with the sum of the relevant cost drivers of all DSOs the regulator determined the average unit costs In the case of DSOs with higher-than-average unit costs only the average unit cost level is considered to be justified the part of the per unit costs above the average level are not accepted as a part of the justified cost base
Ref C20-IRB-54-03
CEER Report on Regulatory Frameworks for European Energy Networks 2020
58156
In order to avoid unjustified under recovery of costs due to different accounting and cost allocation practices between DSOs an ldquoefficiency reserverdquo is utilised The role of this ldquoefficiency reserverdquo is to allow the efficiency increase in those cost categories in which a DSOrsquos efficiency is more than average to compensate for lack of efficiency in those cost categories in which a DSOrsquos efficiency is less than average Adjusting the Tariffs During the Regulatory Period During the regulatory period annual tariff reviews are carried out in order to keep the tariffs updated During the annual tariff review the initial cost base is adjusted and tariffs are recalculated based on the adjusted cost base and the updated capacities and heating-degree day normalised volumetric data The adjustment takes into consideration the following factors
bull Inflation
bull Changes to the operating costs caused by legislative changes
bull Changes in the regulatory asset base depreciation and cost of capital
bull Investments arising from legislative changes or regulatory obligations
bull Changes in the recognised cost of the settlement difference
bull Adjustments to be made based on the ex-post examination of the system operatorrsquos profit with regards to its profit limit
bull Correction of errors if any and
bull Changes in data expressed in volumes and quantified non-financial parameters
National Specialities
bull Nation-wide uniform transmission tariffs
bull Separate distribution tariffs for each DSO (Before 2011 uniform distribution tariffs with an inter-DSO compensation mechanism were utilised however the system led to legal disputes Since 2011 separate distribution tariffs are used) and
bull Off-peak seasonal consumers
Transparency The methodological guidelines for both the cost and asset review and the within-period annual cost review are published on the regulatorrsquos website before the cost and asset review
Ref C20-IRB-54-03
CEER Report on Regulatory Frameworks for European Energy Networks 2020
59156
213 Iceland Gas TSO Gas DSO Electricity TSO Electricity DSO
Ma
rke
t
str
uc
ture
Network operators
No Gas TSO No Gas DSO 1 6
Network length
~3400 km ~22000 km
Ownership
Indirect public ownership
Private public and local public ownership
Ge
ne
ral
fra
me
wo
rk
Authority
The National Regulatory Authority (NRA) is a team within Orkustofnun National Energy Authority
(wwwosis)
System Incentive Regulation Revenue cap
Period 5 years current period 2016-2020
Base year for next period
Average of OPEX 2015 ndash 2019 base year 2020
Transparency All data behind the regulation model can be made available upon request
Main elements for
determining the revenue
cap
TOTEX OPEX (CPI adjusted average 2010-
2014) + CAPEX (previous year CPI
adjusted book values) + Non-controllable cost (less than 2)
Efficiency factor = 0 for this period
TOTEX OPEX (CPI adjusted average 2010-2014+non-
controllable OPEX from previous year) + CAPEX (previous year CPI adjusted
book values) + other non-
controllable cost (eg network
losses) Efficiency factor = 0 for this
period
Legal framework
The Electricity Act No 652003
Rate
of
retu
rn
Type of WACC Pre-tax WACC = dRd(1 - t) + eRe d=dept ratio e=equity ratio
WACC for energy intensive TSO (2018) = 665 WACC for general (TSO and DSO) = 708
Determination of the rate of
return on equity
Re = (rf + (rm - rf)β + specific risk)(1 - t) Sum of real risk-free rate and a risk premium (market risk premium multiplied with a beta
risk factor) plus a specific risk premium multiplied with a corporate tax factor
Rate of return on equity
before taxes
Energy intensive (TSO) = 102 = ((273+50089)+10)(1-02) (for 2018) General (TSO and DSO) = 107 = ((311+50089)+10)(1-02) (for 2018)
Use of rate of return
The Pre-Tax WACC is the rate of return it is granted for operating necessary business assets
Reg
ula
tory
as
se
t b
as
e Components
of RAB Fixed operating assets
Regulatory asset value
Book value
RAB adjustments
CPI adjusted book values
Dep
re-
cia
tio
ns Method Straight line
Depreciation ratio
Depending on asset type Ratio between 2 and 20 eg TSO lines amp cables ~2 stations ~25 DSO lines amp cables ~3-4
Consideration The regulator regularly inspects the RAB and the depreciations
Ref C20-IRB-54-03
CEER Report on Regulatory Frameworks for European Energy Networks 2020
60156
Introduction The National Regulatory Authority (NRA) in Iceland Orkustofnun is responsible for regulating natural monopolies in electricity and consists of a team of four people Iceland has no gas networks and the majority of space heating is conducted through direct use of geothermal energy Iceland has one TSO (Transmission System Operator) and ~75 of the energy produced is transmitted directly to Energy-Intensive Industries The other ~25 of the energy is transmitted to six DSOs (Distribution System Operators) with the number of customers ranging from ~900 to ~80 000 Two of the DSOs distribute both in rural and urban areas Historical Development The Electricity Act no 652003 came into force in 2003 and implements Directives 9692 and 200354 The 3rd Energy Package has not yet been implemented into national law Regulation by the NRA officially began in 2005 as revenue cap regulation with a team of two people The Electricity Act was changed in 2011 The changes in terms of regulation included eg a longer regulatory period from three to five years and rate of return changed from being based on government bonds directly to a WACC After the change of the regulation the team was enlarged and consists presently of four people Determining the Revenue Caps The revenue caps for network operators are set for a five-year regulatory period The last cap was set in 2015 for the period 2016ndash2020 based on data from 2010ndash2014 where the base year is 2015 The next cap will be set in 2020 for the 2021-2025 period The cap is composed of the five-year average of the controllable OPEX non-controllable OPEX and CAPEX Determining the Allowed Revenue The revenue cap is updated every year ex-post and is referred to as allowed revenue The allowed revenue is updated by CPI adjusting the controllable OPEX (relative to the base year) set by the revenue cap Non-controllable OPEX is based on real values and includes network losses and TSO tariffs (for DSOs) which the DSOs can fully recoup as revenue TSO network losses are not a part of their revenue capallowed revenue but the tariff for network losses is monitored by the NRA CAPEX includes the RAB times the WACC plus depreciations for the relevant year The RAB is based on inflation adjusted book values on 1 January for the relevant year Depreciations are linear and based on asset type The difference between the allowed revenue and the actual revenue from distributiontransmission is entered into a regulatory account containing accumulated surplus or deficit balances All change in tariffs are based on that account A network operator cannot have accumulated surplus that is higher than 10 of their last allowed revenue All accumulated deficits that are higher than 10 of the last allowed revenue are written off Split up Revenue Caps Both the TSO and two of the six DSOs in Iceland have split up revenue caps and allowed revenue and thus have two regulatory accounts The TSO has a revenue cap for transmission to the DSOs and a revenue cap for transmission to Energy-Intensive Industries Two of the DSOs have a revenue cap for their urban areas and a revenue cap for their rural areas Efficiency Benchmarking Orkustofnun is legally obliged to carry out an efficiency study of the network operators before the revenue cap is set every five years Such a study can only be carried out through independent specialists and not by the regulator Other than that the efficiency legislation is open in terms of methodology and data After a recommendation from the specialists the regulator can make a decision on an efficiency factor for the next period Before the last cap was set in 2015 independent specialists conducted such an efficiency study on the TSO and
Ref C20-IRB-54-03
CEER Report on Regulatory Frameworks for European Energy Networks 2020
61156
the six DSOs The TSO was evaluated independently and not benchmarked against other TSOs The six DSOs were evaluated as eight companies since two of them have split up revenue caps The evaluation for the DSOs was based on a DEA analysis and the controllable OPEX (input) and structural data Structural parameters can include peak load energy delivered length of lines and cables number of customer etc The result was used as a recommendation for an efficiency factor for the NRA and the NRA made an efficiency score decision based on that recommendation That decision was however appealed to an independent appeal committee that revoked the NRArsquos decision Rate of Return According to the Electricity Act the WACC is the rate of return on book values of all assets in the RAB Both the TSO and two of the DSOs have two RABs on account of their split of the revenue cap The WACC is the weighted average of the cost of debt and cost of equity calculated by the capital asset pricing model Corporate tax is accounted for through a factor applied to the WACC formula Inflation is however not accounted for in the WACC formula since the RAB is adjusted in terms of inflation every year All parameters in the WACC model are fixed in a regulation no 1922016 except the risk-free rate The risk-free rate is a moving average of the ten-year inflation-indexed US TIPS (Treasury Inflation-Protected Securities) plus a ten-year CDS (Credit Default Swap) spread for Energy-Intensive Industries and ten-year inflation-indexed Icelandic government bonds for the general user and DSOs The NRA calculates a new WACC every year based on the change in the risk-free rate Eg in April 2017 the NRA at Orkustofnun published new WACC for 2018 based on the average of the risk-free rate from 1 January 2007 to 31 December 2016 The WACC 2018 is the rate of return for the RAB when the allowed revenue for 2018 will be calculated in 2019 The WACC regulation mentioned above has a revision clause and is revised upon request The revision and recommendation for the parameters of the WACC formula is performed by independent group of specialists with the WACC committee appointed by the NRA Quality Regulation The Icelandic regulatory regime provides incentives to cut costs and to invest There is still a risk that operators will refrain from undertaking the necessary investments or measures in order to achieve the required or potential savings To counter this data on quality of the network is collected and monitored by the NRA The quality element is not a part of the revenue capallowed revenue formula although it has been considered and was included in the draft of the Electricity Act Investments The DSOs are not legally obligated to report their investment plans to the NRA The NRA can however request all such information especially when it comes to potential change in tariffs where the DSOs are obligated to provide a forecast for the allowed revenue to account for the effect on the regulatory account The TSO is obligated by law to deliver a three-year exact investment plan and ten-year network development plan to the NRA The NRA approves or rejects the investment plan The three-year plan is equivalent to an investment authorisation This plan includes all investments of the TSO Transparency The NRA plans to publish data on the regulatory website which will include revenue caps and annual adjustments WACC etc All data related to the regulation can be made available upon request
Ref C20-IRB-54-03
CEER Report on Regulatory Frameworks for European Energy Networks 2020
62156
Outlook There are currently no formal plans to develop the incentive-based regulatory regime in Iceland Various changes were last made to the regime in 2011
Ref C20-IRB-54-03
CEER Report on Regulatory Frameworks for European Energy Networks 2020
63156
214 Ireland Gas TSO Gas DSO Electricity TSO Electricity DSO
Ma
rke
t
str
uc
ture
Network operators
1 1 1 1
Network length
~2477 km ~11913 km ~6711 km ~172000 km
Ownership
Gas Networks Ireland (GNI)
EirGrid operate the System and ESB Networks own the
system
ESB Networks
Ge
ne
ral
fra
me
wo
rk
Authority Commission for Regulation of Utilities (CRU)
System Incentive Regulation Revenue cap
Period 5 years current period 2017 - 2022 5 years current period 2016 - 2020
Base year for next period
Fourth year of current regulatory period Fifth year of current regulatory period
Transparency
Performance reports (Customer Performance and System Performance)
are published annually by GNI Innovation reporting framework has been established
and GNI publish an annual report The CRU publishes its 5-year price control
decisions following public consultation The CRU also publishes an annual tariff
information paper
Performance reports are published annually by the network companies There is CAPEX
monitoring and reporting in place also CAPEX reports are published on annual basis There are Innovation reports published annually by ESBN and EirGrid Furthermore there is a
report on stakeholder engagement published annually by the CRU
The CRU publishes its 5-year price control decisions following public consultation The
CRU also publishes an annual tariff information paper
Main elements for
determining the revenue
cap
1Review of historic and forecast OPEX
2 Review of historic and forecast CAPEX 3 Value of Assets in TSOrsquosDSOrsquos RAB
4 Rate of Return and 5Inflation
6 Depreciation 7 Reporting and Incentives
Legal framework
The Department of Communications Climate Action and Environment (DCCAE)
is the lead government department (or ministry) with responsibility for energy policy In the natural gas sector the
Department determines policy in relation to security of energy supply and the
functioning of the market The Department is responsible for transposing EU gas
directives into national law and is responsible for financial oversight and corporate governance of state-owned
energy companies
The Commission for Regulation of Utilities is the independent economic regulator for
the natural gas electricity and water sectors in Ireland
Under Section 10A of the Gas Act 1976 as amended (the lsquoActrsquo) the CRU sets the tariffs
and the allowed revenue for the TSO
The Competition and Consumer Protection Commission is the government body
The Department of Communications Climate Action and Environment (DCCAE) is the lead
government department (or ministry) with responsibility for energy policy The
Department must ensure that Irish energy policy and legislation are in line with European
law It is within its remit to formulate and implement policy and legislation on the
liberalisation and regulation of the electricity markets
The Commission for Regulation of Utilities is the independent economic regulator for the natural gas electricity and water sectors in
Ireland
The CRUrsquos Legislative Basis for setting charges ndash
under Section 35 of the Electricity Regulation Act 1999 (ldquothe Actrdquo) the CRU approves
charges for the use of the electricity transmissiondistribution system in Ireland In
accordance with Section 35 of the Act the CRUrsquos Price Review decisions outline the
Ref C20-IRB-54-03
CEER Report on Regulatory Frameworks for European Energy Networks 2020
64156
responsible for enforcing Irish and European competition law in Ireland Generally it looks to the CRU (there is a Memorandum of Understanding between the two) for matters relating to the electricity and natural gas sectors
revenue that the TSO TAO DSO will be allowed to recover from customers during a Price Review Period Section 36 of the Act
states that the TSODSOrsquos statement of charges prepared in accordance with Section 35 must be submitted to the CRU for approval
and will not take effect until approved by the CRU
The Competition and Consumer Protection
Commission is the government body responsible for enforcing Irish and European competition law in Ireland Generally it looks
to the CRU (there is a Memorandum of Understanding between the two) for matters
relating to the electricity and natural gas sectors
Rate
of
retu
rn
Type of WACC WACC for the period 2017 ndash 2022 is 463
pre-tax real The CRU decided that a further aiming up allowance was not
required
WACC for the period 2016 ndash 2020 is made up of a baseline WACC plus an aiming up
allowance
The WACC for the TSO TAO and DSO is set at 495 (real pre-tax)
Determination of the rate of
return on equity
The CAPM methodology is used to calculate the cost of equity using the formula
119896119890 = 119903119891 + 120573 times (119903119898 minus 119903119891) where 119896119890 is the expected rate of return for the risky asset
119903119891 is the rate of return on a lsquorisk-freersquo asset (the ldquorisk-free raterdquo or ldquoRFRrdquo) 120573 is the lsquobetarsquo factor which is correlation of the return on the risk asset with the expected returns on a
diversified portfolio of all investable assets
and 119903119898 is the expected rate of return on a market value-weighted portfolio of all assets (the lsquomarket portfoliorsquo)
The term 119903119898 minus 119903119891 in the CAPM is referred to as the market risk premium (ldquoMRPrdquo)
Rate of return on equity
before taxes Cost of equity (pre-tax) 722
Cost of equity (pre-tax) ndash high 799 Low 562
Point Estimate 663
Use of rate of return
The Regulatory Asset Base (RAB) is the base to which the rate-of-return is applied when determining the return on capital
Reg
ula
tory
as
se
t b
ase
Components of RAB
Fixed assets assets under construction
Regulatory asset value
Replacement cost approach Historic cost indexed to present value using inflation
RAB adjustments
RAB adjusted for disposals
Assets are added to the RABs as costs are incurred not on the date of commissioning
The network companies receive a return on the assets from the middle of the
year in which the costs are incurred rather than when the asset is commissioned Assets which have been added to the RAB
but have not been energised within 5 years (except in the case where the
programme of work was scheduled to be longer than 5 years or where the SO can
satisfactorily show that the delay is beyond its control) will be temporarily removed or
ldquopausedrdquo from the RAB (with all return and depreciation paused) until the point at which
the asset can be energised and utilised
Dep
re-
cia
tio
ns Method Straight line
Depreciation ratio
Depends on asset category
Consideration Part of the examined controllable costs
Ref C20-IRB-54-03
CEER Report on Regulatory Frameworks for European Energy Networks 2020
65156
Introduction The Commission for Regulation of Utilities (CRU) is the independent body responsible for regulating the natural gas and electricity sectors in Ireland Part of its responsibilities involves regulating the level of revenue which the monopoly system operators can recover from its customers to cover its costs The electricity and gas networks in Ireland are described as ldquonatural monopoliesrdquo as the nature of it is that it would be inefficient to develop duplicate sets of wires and pipes to service customers Given the relatively small size of Ireland it would also be inefficient to break the current geographical area of the networks into smaller sections managed by individual DSOsTSOs although this is possible in larger jurisdictionsnetworks Gas Gas Networks Ireland (GNI) is the gas system owner and operator in Ireland GNI owns and operates both the Transmission Network and Distribution Network Companies must hold a licence issued by the CRU to distribute electricity or gas through the energy network The CRU is responsible for ensuring that customers and network users receive value for money while the network companies earn a fair return on their activities to make the necessary network investments Those investments go towards the efficient operation development and maintenance of the networks There are almost 700000 natural gas customers in Ireland Electricity The transmission business consists of EirGrid licensed by the CRU as the Transmission System Operator (TSO) and ESB acting through its ESB Networks business unit as the licensed Transmission Asset Owner (TAO) EirGrid is responsible for the operation and setting the maintenance and development policies of the transmission system while ESB Networks is responsible for maintaining the system and carrying out construction work for its development ESB Networks Ltd a wholly owned subsidiary of ESB is licensed by the CRU as Distribution System Operator (DSO) and is responsible for building maintaining and operating the distribution system ESB acting through its ESB Networks business unit is the licensed Distribution Asset Owner (DAO) and owns the distribution and transmission networks Determining the Revenue Cap The CRU uses a revenue-cap regulatory regime to determine the appropriate level of revenue required to allow the System Operators (SOs) to operate the networks in Ireland The CRU sets revenues ex-ante for a regulatory period of five years There are a number of key components required to estimate the level of revenue that will be sufficient to finance the SOs The building blocks of the regime are as follows Operational Expenditure The overall revenue figure for OPEX that is put in place by the CRU is the result of both rigorous scrutiny of the SOrsquos proposals and benchmarking The CRU applies both a top-down and bottom-up benchmarking approach to OPEX The objective of the bottom-up assessment is to develop a base year or stable run rate of normalised OPEX that represents the core historic lsquobusiness as usualrsquo OPEX (which can then be revised as to reflect additional items of core OPEX) forecast to be incurred in future years of the regulatory period There are two components to the top-down benchmarking assessment Firstly the SOs are benchmarked to comparable utility businesses to determine how expenditure compares to an efficiency benchmark for the relevant sector Secondly the CRU considers the degree of ongoing efficiency improvement or frontier shift that might be possible for the SO over the regulatory period
Ref C20-IRB-54-03
CEER Report on Regulatory Frameworks for European Energy Networks 2020
66156
Capital Expenditure In reviewing the SOrsquos CAPEX proposals the CRU analyses the proposals to determine whether they are appropriate fully justified whether they would deliver benefits to the customer and whether the estimated costs are realistic Determining the Appropriate Rate of Return The CRU sets the rate of return that the SO can earn on the efficiently incurred capital investments in its RAB This is known as the WACC This is essentially a weighted average of the cost of debt and the cost of equity The CRU sets a WACC that is used to derive a fair return on the capital investments made by the utility while also endeavouring to ensure that the SOs sits comfortably within an investment grade credit rating The CAPM is used to assess the cost of equity which is used to aid the determination of an appropriate WACC Uncertain Costs Uncertain costs are defined as those that could not reasonably be foreseen by the SOs The CRU decided that such costs should be dealt with on a case-by case basis In each case the SO would be expected to ensure that changes in OPEX or new CAPEX would take place in an efficient manner and this would be reflected in the allowance provided ndash that is there would not be an automatic pass-through of such costs Pass-through Items The price control model contains a provision for the pass-through of certain types of costs such as business rates that are deemed to lie outside the businessrsquos control In some cases pass-through items are subject to incentive mechanisms which shares savings between the SOs and the network customers for example in areas such as rates and safety K-factor Adjustments The CRU regulates the SOs through a form of revenue cap regulation which allows adjustments relating to one revenue control period to feed through into subsequent periods This adjustment mechanism is generally referred to as a k-factor mechanism The k-factor methodology is an adjustment used to allow for the fact that while the CRU approves a level of revenue to allow the SO to cover its costs over a regulatory period this level depends on assumptions about what happens over the course of that period but it may not necessarily reflect events as they occur The adjustment essentially corrects for these events by applying a correction to the annual revenue to be collected in subsequent periods Indexation The model used by the CRU uses a base allowable revenue which is indexed to take account of price inflation The index used should be the best reflection of the increases in prices faced by the utility such as wage inflation or materials inflation Also the index needs to be practical to implement robust and transparent In the recent review of allowable revenues for the SOs the CRU used Harmonised Index of Consumer Prices (HICP) The CRU accepts that no one index can precisely mirror the utilityrsquos input costs It is also accepted that the majority of the annual revenue which the utility receives covers depreciation and return on its asset base rather than operating costs
Ref C20-IRB-54-03
CEER Report on Regulatory Frameworks for European Energy Networks 2020
67156
Valuation of the RAB The SOsrsquo RAB is valued using a replacement cost approach The use of this approach has continued during the prevailing price control periods While it is recognised that there are advantages and disadvantages associated with each methodology the replacement cost approach was taken as it is more likely to result in the correct level of network investment The CRU notes that there are a number of variations of replacement cost that could be used The version used by the CRU uses the acquisition cost indexed with inflation as a proxy for the replacement cost Depreciation Method The CRU used the straight-line depreciation methodology in its recent price control decisions and for the prevailing price control decisions Determining the Allowed Revenue Combining all the component parts the CRU generates an overall revenue allowance for the SOs This revenue feeds through into setting the transmission and distribution tariffs for each tariff period ie 1 October to 30 September Outlook With regard to the gas Price Control (PC) the CRU is beginning work for the PC5 period keeping in mind issues such as movement towards a decarbonised economy and incentive mechanisms With regard to the electricity Price Review (PR) the CRU published in May 2018 its decision on reporting and incentives under PR4 The CRU introduced what the CRU considers improvements to the existing incentives and reporting regime through the decisions in that paper The aim is to provide the customer with better value for money and improve quality of services provided to the customer
Ref C20-IRB-54-03
CEER Report on Regulatory Frameworks for European Energy Networks 2020
68156
215 Italy Gas TSO Gas DSO Electricity TSO Electricity DSO
Ma
rke
t
str
uc
ture
Network operators
9 ~214 11 (1 SO) ~127
Network length
~35000 km ~264000 km ~73600 km ~1273000 km
Ownership Mainly private investors indirect public ownership
Mainly private and local public ownership
Mainly private investors indirect public ownership
Mainly private and local public ownership
Ge
ne
ral
fra
me
wo
rk
Authority ARERA
System
Cost-plus for CAPEX Price-cap for OPEX
Cost-plus for CAPEX Price-cap for OPEX
Standard cost approach for
centralised costs
Cost-plus for CAPEX Price-cap for OPEX
Cost-plus for CAPEX Price-cap for OPEX
Standard cost approach for smaller
DSOs
Period 4 years 2020-2023 6 years 2020-2025 4 years 2020-2023 4 years 2020-2023
Base year for next period
Transparency All data pursuant
Commission Regulation (EU)
2017460
Aggregated data at sectoral level published at beginning of
regulatory period
Aggregated data at sectoral level published at beginning of
regulatory period
Aggregated data at sectoral level published at beginning of
regulatory period
Main elements for
determining the revenue
cap
OPEX (updated with price-cap)
return on net RAB additional return for
incentives depreciation fuel
gas losses unaccounted-for
gas
OPEX (updated with price-cap) return on
net RAB and depreciation
OPEX (updated with price-cap)
return on net RAB additional return for
incentives depreciation
regulatory account ITC costsrevenues
OPEX (updated with price-cap)
return on net RAB additional return for
incentives depreciation
Legal framework
ARERA Res 1142019Rgas
ARERA Res 5702019Rgas
ARERA Res 5682019Reel
ARERA Res 5682019Reel
For WACC ARERA Res 5832015Rcom
Rate
of
retu
rn
Type of WACC Pre-tax real Determination of the rate of
return on equity
Sum of real risk-free rate (with a floor to 05) a country risk premium and a beta risk factor multiplied with an equity risk premium (determined as difference between Total
Market Return and risk-free rate)
119870119890119901119904119903119890119886119897 = 119898119886119909(
119877119865119901119899119900 119898119894119899 119886119897 minus 119894119904119903119901
1 + 119894119904119903119901
0005) + 120573119904119886119904119904119890119905 sdot [1 + (1 minus 119905119888119901) sdot
119892119901119904
1 minus 119892119901119904
] sdot (119879119872119877 minus 119898119886119909(119877119865119901
119899119900 119898119894119899 119886119897 minus 119894119904119903119901
1 + 119894119904119903119901
0005)) + 119862119877119875119901
Rate of return on equity
before taxes 54 58 53 57
Use of rate of return
Applied to the net value of RAB
Reg
ula
tory
as
se
t b
ase
Components of RAB
Fixed assets working capital assets under construction
Regulatory asset value
Historical cost re-valued for inflation net of depreciation
and grants
Both historical cost and standard unit
cost (sectoral average) depending on type (central vs local assets) Both are re-valued for
inflation and net of depreciation and
grants
Historical cost re-valued for inflation net of depreciation
and grants Investments prior to
2004 are considered as lump-sum with standard net value evolution and depreciation
Historical cost for bigger companies Standard unit cost (sectoral average)
for smaller companies Both are re-valued for
inflation and net of depreciation and
grants
RAB adjustments
New investments depreciation grants
New investments depreciation grants
New investments depreciation
New investments depreciation
Ref C20-IRB-54-03
CEER Report on Regulatory Frameworks for European Energy Networks 2020
69156
For standard costs changes in the
driver
grants For investment prior to
2004 standard evolution
grants For standard costs changes in
the driver
De
pre
cia
tio
ns Method Straight line
Depreciation ratio
Buildings 3 Pipelines 2 Stations 5
Metering 5-7 Other 10-20
Buildings 2-3 Pipelines 2 City gates 5
Metering 5-7 Other 14
Buildings 3 Lines 2
Stations 3 Metering 7
Other 5-20
Consideration Deducted from gross RAB to form net RAB
For 2020 the National Regulatory Authority was not able to author the descriptive part of this subchapter
Ref C20-IRB-54-03
CEER Report on Regulatory Frameworks for European Energy Networks 2020
70156
216 Latvia Gas TSO Gas DSO Electricity TSO Electricity DSO
Ma
rke
t
str
uc
ture
Network operators
1 1 1 11
Network length
1188 km 5206 km 5240 km 96500 km
Ownership Mainly private Mainly private Public ownership Public ownership
Ge
ne
ral
fra
me
wo
rk
Authority The Public Utilities Commission
System Revenue cap13
Period 2-5 years 14 2 years15
Not exceeding 5 years
2-5 years
Base year for next period
Tariffs are based on justified historical costs (some of the costs are justified based on historical 3-year average costs) and forecast of any other future costs
Transparency When submitting new tariff proposal overview with key indicators and figures is published on Regulatorrsquos website As a part of evaluation process public hearing takes place All
stakeholders are welcome to submit comments questions and proposals
Main elements for
determining the revenue
cap
OPEX + CAPEX (Depreciation + return on capital)
Legal framework
Energy Law Law on Regulators of Public Utilities Methodology for the Calculation of the Tariffs on the Natural Gas Transmission System Services Methodology for the Calculation of the Tariffs on the Natural Gas Distribution System Service
Electricity Market Law Law on Regulators of Public Utilities Methodology for the Calculation of the Tariffs on the Electricity Transmission System Services Methodology for the Calculation of the Tariffs on the Electricity Distribution System Services
Rate
of
retu
rn
Type of WACC
Pre-tax real
Determination of the rate of
return on equity
Return on equity Sum of a nominal risk-free rate16 country risk premium market risk
premium multiplied with a beta risk factor and a size premium which is applied only to small and micro-sized entities
Rate of return on equity
before taxes 681 676
Use of rate of return
WACC is applied to the value of RAB to calculate the return on capital which is a part of capital costs in tariff
Reg
ula
tory
as
se
t
ba
se
Components of RAB
Fixed assets intangible investment Does not include inventories and assets under construction
Regulatory asset value
Book value as per financial reports (taking into account asset revaluations carried out by the operator at replacement cost value)
RAB adjustments
The RAB is adjusted and set when the operator submits the tariff proposal during the period the tariff is in force there is no RAB adjustment taking place
Dep
re-
cia
tio
ns Method According to IAS and operators accounting policy (straight line is mostly applicable)
Depreciation ratio
According to the asset type Ratio between 1 and 20 eg gas pipelines 17-25 electricity lines 2-5 electricity transformation substations 25-125
Consideration Depreciation is a part of capital costs in the tariff
13 Methodology was set in July 2020 First tariff is in force from 1 January 14 According to methodology NRA can decide on a different length of regulatory and tariff period 15 According to methodology in tariff evaluating process NRA can extend the tariff period 16 To calculate real WACC the inflation rate is applied to the calculated nominal pre-tax WACC as a whole
Ref C20-IRB-54-03
CEER Report on Regulatory Frameworks for European Energy Networks 2020
71156
Introduction The unified multi-sector regulator in Latvia was established on 1 September 2001 The Public Utilities Commission (PUC) in accordance with the law ldquoOn Regulators of Public Utilitiesrdquo is an institutionally and functionally independent fully-fledged autonomous body governed by public law and independent in the implementation of its budget approved by law The regulator independently performs functions determined in law and within its competence independently adopts decisions and issues administrative acts which are binding for specific public utilities providers and users In accordance with the law ldquoOn Regulators of Public Utilitiesrdquo one of the regulatorrsquos main functions is to determine tariffs and the methodology for calculation of tariffs Tariff calculation methodologies of the different sectors are developed in accordance with the law ldquoOn Regulators of Public Utilitiesrdquo sectoral laws and other normative acts which are in force in the EU and Latvia All methodologies are regularly updated and renewed according to changes in the normative environment Corresponding with market opening (electricity 2015 gas 2017) former vertically integrated energy supply monopolies have been unbundled The task of the regulator is to ensure the availability of public services the availability of infrastructure to public service providers in all regulated sectors the correspondence of public service tariffsprices to their economic value as well as to promote competition transparency and availability of information Therefore tariffs are set by PUC Even though there are some differences in methodologies applied in tariff calculation between TSOs and DSOs and between the electricity and gas sectors the common goal remains the same In Latvia tariffs are currently set using revenue cap and cost-plus approach The tariff period may vary For gas the TSO methodology defines it as one-year period For electricity the TSO tariff periods do not exceed five years and the DSO TSO methodology for 2019 defines it as one-year period For other energy utilities a fixed period is not applied Furthermore PUC annually evaluates actual performance of TSOs and DSOs PUC has legal rights to request new tariff proposals from system operators in case of significant deviations from the set tariffs The system operator has similar rights to submit new tariff proposals if there is legal technical or economical reason for change Determining the Allowed Target Revenues The allowed revenues are calculated using the building-block approach The main parts of the allowed revenues are OPEX and CAPEX Capital costs consist of depreciation and return on capital which is calculated by applying a rate of return WACC determined by the regulator to the value of RAB The WACC is set yearly and the system operator must apply it when calculating the new tariff proposal that are planned to come into effect in the respective year From 1 January 2020 the applied WACC is pre-tax real Changes to the WACC calculation were made in 2019 and the main reason for introduction of real WACC was that the WACC calculation methodology is applied to different regulated sectors that have differing approaches to revaluation of regulated assets thus there was a need to create equal conditions for sectors where companies mainly use historic cost for regulated assets and sectors where companies regularly perform asset revaluation
Ref C20-IRB-54-03
CEER Report on Regulatory Frameworks for European Energy Networks 2020
72156
The general RAB definition used in all energy sector tariff calculation methodologies states that RAB consists of assets or part thereof used for providing the regulated service by the system operator The electricity transmission and distribution sectors as well as gas distribution sector exclude inventories from the RAB and assets under construction from RAB Instead they include the financing costs of maintaining the necessary inventory levels in the operating expenses For projects of common interest the costs of assets under construction can be included in RAB only if such incentive is granted to this project according to the Article 13 of the Regulation (EU) No 3472013 Transparency When approving new tariffs an overview with key indicators and figures is published on PUCrsquos website Public hearings are organised Outlook There are further plans to develop the regulatory regime in Latvia A methodology for setting
electricity TSO and gas DSO tariffs is planned to be developed based on an incentive-based
revenue cap principle
Ref C20-IRB-54-03
CEER Report on Regulatory Frameworks for European Energy Networks 2020
73156
217 Lithuania Gas TSO Gas DSO Electricity TSO Electricity DSO
Ma
rke
t
str
uc
ture
Network operators
1 (AB Amber Grid) 5 1 (LITGRID AB) 5
Network length
2115 km 9068 km 7220 km 125498 km
Ownership State owned
State owned private investors
State owned State owned
private investors
Ge
ne
ral
fra
me
wo
rk
Authority National Energy Regulatory Council (NERC)
System Revenue Cap Price cap
Period
5 years (2019ndash2023)
5 years (2019ndash2023 for the main DSO)
5 years with 1 year of extension (2016-
2021)
5 years with 1 year of extension for the main DSO (2016-2021) and 5 years (for small DSOs
2020-2024)
Base year for next period
2024 2024 for the main
DSO 2022
2022 (for the main DSO)
and 2025(for small DSOs)
Transparency Decisions
Main elements for
determining the revenue
cap
TOTEX RAB WACC technical losses efficiency benchmark
TOTEX RAB WACC technical losses
Legal framework
The Law on Natural Gas of the Republic of Lithuania
The Law on Electricity of the Republic of Lithuania
Rate
of
retu
rn
Type of WACC Nominal pre-tax
Determination of rate of return on
equity
Return on equity Sum of a nominal risk-free rate and market risk premium multiplied with a beta risk factor
Rate of return on equity
before taxes Rate of return on equity = 547
For the main DSO
Rate of return on equity = 551
858=35+706072
For the main DSO
858=35+706072
Use of rate of return
WACC is used to calculate return on investment WACC is a multiplied with whole RAB
Reg
ula
tory
as
se
t b
ase
Components of RAB
Fixed assets
Regulatory asset value
Historical values euro287 m (2019)
Historical values euro247 m (2019)
Current value (for the main network elements (lines
cables transformers) which will be
depreciated until 2020) and historical value (for the rest of
asset) ndash euro350474 m (2019)
Historical value for 5 small DSOs For main DSO current value (for the main network elements
(lines cables transformers) which will be
depreciated until 2020) and historical value (for the rest of
asset) ndash euro1406228 m (2019)
RAB adjustments New investments and depreciation
New investments and depreciation
Ref C20-IRB-54-03
CEER Report on Regulatory Frameworks for European Energy Networks 2020
74156
De
pre
-
cia
tio
ns Method Straight-line depreciation
Depreciation ratio
133-25 143-25 143 - 25
Consideration Depreciation ratio depends on asset type All depreciation of regulated assets is integrated into revenues
Introduction Natural gas electricity transmission and distribution are regulated activities under the Law on Energy of the Republic of Lithuania Law on Electricity of the Republic of Lithuania and Law on Natural Gas of the Republic of Lithuania The performance of TSOs and DSOs are licensed and regulated by National Energy Regulatory Council (NERC) NERC approves the requirements for keeping records of regulated activities approves methodologies for the setting of state-regulated prices sets state-regulated prices and price caps and controls the application of state-regulated prices and rates Moreover NERC sets requirements for reliable transport of energy and quality of services and control compliance therewith and performs other functions laid down by legal acts TSOs and DSOs are responsible for the stability and reliability of the transmissiondistribution system They are also responsible for the provision of system services in the territory of the Republic of Lithuania operation maintenance management and development of interconnectors to other systems TSOs and DSOs shall ensure objective and non-discriminatory conditions for access to the system by network users DSOs provide electricitynatural gas distribution connectiondisconnection of the customers and guaranteed17 natural gas supply (only gas DSO) services TSOs provide electricitynatural gas distribution transit and balancing services Moreover the natural gas TSO also performs the LNG terminal funds administrator function
Main Principles of the Tariff Regulation The main methodologies on which tariffs for natural gas and electricity transmission and distribution are calculated have been approved by NERC That is the Methodology of Electricity Transmission Distribution and Public Supply Services and Public Price Cap Calculation Methodology of setting state-regulated prices for natural gas sector Methodology for Determining Income and Prices of State Regulated Natural Gas Activities and Methodology on Rate of Return on Investments (ROI) A five-year regulatory period applies for the natural gas and electricity transmission and distribution prices regulated by NERC The allowable income levels are calculated as the sum of economically based costs consisting of CAPEX (cost of depreciation (using straight line method) and ROI) OPEX (repair and maintenance administrative cost wages etc) taxes and technical losses The WACC of the natural gas and electricity TSOs and DSOs is calculated in accordance with the Methodology on Rate of Return on Investments where cost of debt (the entitys actual long-term borrowing costs limited by the market average) and equity risk premium (the sum of the equity risk premium of the country with the developed capital market (the US) and the additional market risk premium of Lithuania) are evaluated The equity risk premium calculated for the entire regulatory period and the cost of debt must be adjusted annually NERC uses WACC to calculate ROI as well as the discount rate in approving capital investments of TSOs and DSOs
17 Guaranteed natural gas supply means the supply of natural gas are guaranteed to customers through the
provision of services of public interest
Ref C20-IRB-54-03
CEER Report on Regulatory Frameworks for European Energy Networks 2020
75156
Making Adjustments During a Regulation Period In the natural gas sector a NERC decision allows regulated price caps to be adjusted once a year These are subject to the change in the inflation rate prices of imported natural gas taxes amount of natural gas or the requirements of legal acts regulating activities of natural gas network operators investments by natural gas undertakings as agreed with NERC or deviation by natural gas network operators from the indicators determined in methodologies for the calculation of price caps approved by the NERC In the electricity sector the regulated price caps are adjusted each year following the change of the inflation rate (OPEX) new investments depreciation and change of WACC (CAPEX) the electricity price (technical losses) and the ROI adjustment from previous periods The actual ROI in natural gas and electricity sectors is estimated after the first two years of the regulatory period and after the entire regulatory period Taking into account the income earned cost incurred and effectiveness of regulated activities The ROI may be increased due to the decisions of regulated companies related to the reorganisation or other factors decreasing OPEX accordingly 50 or 100 of the proved savings Regulatory Decision Process The process of setting transmission and distribution prices starts with the provision of data for establishing price caps NERC evaluates the data provided by TSOs and DSOs sets or corrects the price caps and approves them by NERC resolutions The TSOs and DSOs provide NERC with an application to approve specific transmission and distribution prices Having verified and determined that prices are not calculated breaching the requirements for setting prices laid down in methodologies and that are discriminating against customers andor are false NERC gives instructions to natural gas network operators in relation to the calculation of specific prices and tariffs Specific prices approved by NERC resolution are published by the TSODSO and NERC no later than one month before the prices enter into force Investments Each year each TSO provides NERC with the ten-year network development plan (TYNDP) ndash the strategic document which covers main investment projects for the following ten years Where a TSO does not execute an investment NERC shall require the TSO to execute the investments or oblige the TSO to accept a capital increase to finance the necessary investments and allow independent investors to participate in the capital NERC determines whether the national TYNDP is consistent with the non-binding TYNDP of ENTSOG and ENTSO-E From 2018 DSOs also have an obligation to prepare a ten-year network development renovation upgrading and investment plan Concerning the RAB TSOs and DSOs can only include those investments which are already implemented18 and approved by NERC NERCrsquos approval of the TYNDP does not mean the approval of the concrete projects thus projects have to be also approved individually An investment project is considered as an investment if it exceeds a certain value (35 million EUR for the TSO or 15 million EUR for a DSO in the electricity sector and 2 million EUR or 5 of the companyrsquos yearly investments (but not lower than 015 million EUR) in the natural gas sector) Otherwise investments are provided in the simplified manner ndash as part of a yearly investment plan Investment projects are based on technical justification financial justification and economic justification eg CBA and impact on regulated prices However there are some exemptions
18 An exception is applied to PCI projects as assets under construction of PCIs is also included into RAB
Ref C20-IRB-54-03
CEER Report on Regulatory Frameworks for European Energy Networks 2020
76156
in the evaluation process For example financial justification is not necessary for most projects which do not increase the transport of the energy and CBA is not required for the upgrade of depreciated assets The yearly investment plan is composed of the list of investments with a value lower than that of an investment project NERC can oblige a company to exclude particular investments from the yearly plan and present it as an investment project All investments included into yearly investment plan must be reasoned and have technical justification Moreover the report of the previous yearly investment plan has to be provided and all the changes of the values of each investment have to be justified compared to the approved plan Quality Regulation NERC sets the minimum levels of the reliability indicators for electricity and natural gas (DSO SAIDI SAIFI and TSO MAIFI AIT) for the regulatory period These levels are estimated as the average of actual numbers of previous regulatory period (not worse than set for the last regulatory period) in electricity sector and as the average of actual numbers of the last three years in natural gas sector Actual ROI of electricity transmission and distribution services must be reduced by 1 (for each reliability indicator worse from 5 to 10 than set by NERC) or 2 (for each reliability indicator worse more than 10 than set by NERC) WACC of natural gas transmission and distribution services must be increasedreduced by 0005 (for each reliability indicator betterworse from 10 to 15 than set by NERC) and 0010 (for each reliability indicator betterworse than 15 than set by NERC)
Ref C20-IRB-54-03
CEER Report on Regulatory Frameworks for European Energy Networks 2020
77156
218 Luxembourg Gas TSO Gas DSO Electricity TSO Electricity DSO
Ma
rke
t
str
uc
ture
Network operators
1 3 1 5
Network length
283 km 3058 km 154 km 10768 km
Ownership Mainly direct and indirect public ownership
Ge
ne
ral
fra
me
wo
rk
Authority Institut Luxembourgeois de Reacutegulation (ILR)
System Revenue cap incentive regulation
Period 4-year period current period 2017-2020 4-year period current period 2017-2020
Base year for next period
2019
Transparency Public consultation before the tariff methodology can be adopted Methodology published in official journal and on NRA website
Possibility to contest NRA decisions
Main elements for
determining the revenue
cap
Remuneration on RAB depreciation Controllable OPEX
Non-controllable OPEX
Remuneration on RAB depreciation Controllable OPEX
Non-controllable OPEX
Remuneration on RAB depreciation Controllable OPEX
Non-controllable OPEX Ancillary
services
Remuneration on RAB depreciation Controllable OPEX
Non-controllable OPEX
Legal framework
Law modified 1 August 2007 relative to the organisation of the natural gas market
E1613ILR E1614ILR
Law modified 1 August 2007 relative to the organisation of the electricity market
E1612ILR E1614ILR
Rate
of
retu
rn
Type of WACC Nominal pre-tax WACC
Determination of the rate of
return on equity
Sum of cost of debt and cost of equity For more details see explanations
Rate of return on equity
before taxes
For natural gas and electricity 612 = 05 (215+145) + (1 ndash 05) (215 + 07946 480)(1 ndash 3093)
Use of rate of return
Granted for self-financed assets in the RAB and for work in progress according with respect to the dispositions of E1612ILR and E1613ILR
Reg
ula
tory
as
se
t
ba
se
Components of RAB
Fixed assets containing production costs work in progress
Regulatory asset value
For assets since 2010 historical costs Before asset financed by own funds (max 50) historical costs re-evaluated with
published indexes Remaining part historical costs
RAB adjustments
Adjustments not foreseen in the method After activation new assets also enter the RAB
Dep
re-
cia
tio
ns Method Linear
Depreciation ratio
Depending on the asset type Useful lifetime 25-50 years for technical assets and constructions and 3-20 years for IT related fixed assets
Consideration Depreciation is fully included in the allowed revenues
Introduction The Luxembourgish electricity market has about 315000 consumers and had a total consumption of 66 TWh in 2018 The natural gas sector accounts for some 90000 consumers with a total consumption of 89 TWh in 2018 The National Regulatory Authority (NRA) is the Institut Luxembourgeois de Reacutegulation (ILR) It is ILRrsquos role to supervise the market functioning in both electricity and gas sectors as well as to ensure universal service in the interest of all consumers As part of these tasks ILR has the power to determine a tariff calculation methodology and to take decisions in matters for which
Ref C20-IRB-54-03
CEER Report on Regulatory Frameworks for European Energy Networks 2020
78156
the national law explicitly entitles ILR for The tariff calculation methodology as well as changes to the methodology can only be decided after a public consultation process 2017 was the first year in which all network tariffs in electricity were equalised among all network operators on a national level This development helps the consumer to better understand the tariffs and makes it easier for suppliers to form their supply prices Network operators on the other hand will redistribute among themselves the part of the revenues which are over- or underachieved due to the fact that their respective tariffs would be different without national tariffs For natural gas the network tariffs remain different for each DSO Determining Revenue Caps The tariff calculation methodology is set for periods of four years with the current period being from 2017 to 2020 In principle the methodologies for natural gas and for electricity are alike Deviations will be explicitly mentioned in this description The current approach is a revenue cap method On an annual basis the network operators submit their tariff proposal for the following year along with the final regulatory accounts of the previous year ILR evaluates the submitted documents and approves the tariffs when no objections remain The yearly review of the closed accounts from the previous year allows adjusting the maximum allowed revenue according to the real costs observed Differences are transferred to a regulatory account which can be included in the next tariff proposal The main categories of costs forming the maximum allowed revenue are RAB remuneration depreciation controllable OPEX specific pass-through quality factor and the regulatory account term Investments and Depreciation The current tariff methodology distinguishes between two categories of investments
bull Small investments of less than 1 million EUR in the electricity sector and less than 500000 EUR in the natural gas sector are counted among the ldquolotsrdquo (batch investments) and
bull Individual investment projects contains projects which do not fall under the ldquolotsrdquo anymore as well as all projects with a cross-border impact regardless of the investment cost
For assets in the ldquolotsrdquo category the administrative burdens are considerably lower than for individual investment projects They have to be classified according to the voltage level (for natural gas according to the level of pressure) and pre-defined asset categories The operator also has to note whether the costs are considered as replacement of infrastructure or new investments In addition the network operator has to submit to the Institute its procedures for standard investments This allows the Institute to verify the efficiency of the procedure Costs under this category enter RAB in the year they occurred For individual investment projects the system operator informs the Institute annually about the progress of each project and informs the Institute about projects for which it foresees the start of the works before the end of the following year Documentation to be submitted for new projects include a justification an analysis of alternatives and other options for the project a cost-benefit analysis the detailed costs an analysis of events that could delay the project or have an influence on the total costs of the project and an operational plan
Ref C20-IRB-54-03
CEER Report on Regulatory Frameworks for European Energy Networks 2020
79156
The tariff methodology provides the possibility to make adjustments to individual investment projects during the realisation phase in case of unforeseen events which cannot be influenced by the network operator The date of activation as well as the total costs of the project can be adjusted upon approval by the Institute provided that the system operator immediately notifies the Institute of such deviations The work in progress from the start of the project until the planned activation date communicated in the operational plan is remunerated by the WACC In case of delays of the project remuneration the tariff methodology allows a reduction or the annulation of the remuneration for the years in question A project enters the RAB based on historical costs and is depreciated on a straight-line basis over the useful lifetime defined in the tariff method Parts of an asset subsidised by public funds or financed by third parties are not included in the RAB Remuneration ndash WACC The WACC used for the current regulatory period is a nominal pre-tax remuneration The final rate of 612 is a combination of the cost of equity and the cost of debt with an equal weighting This gearing represents an efficient capital structure protecting the interests of the consumer as well as allowing the system operator to access capital markets at reasonable costs The cost of debt is the sum of a risk-free rate (RFR) and a debt premium (DP) The RFR is based on a mid-term view of long-term interest rates published by the European Central Bank for Luxembourg The DP is based on current spreads on debt issued by firms having similar activities The issues had at least an A- rating and 7 to 13 years remaining to maturity The cost of equity adds the product of the equity risk premium (ERP) and an equity beta to the RFR This sum is discounted with the company tax rate for Luxembourg The ERP value is based on a study by Dimson Staunton and Marsh in 2015 The equity beta was determined by asset betas for comparable companies with the Modigliani-Miller method Hence remuneration is the product of the year end value of RAB and WACC Controllable Costs Controllable costs are set at the beginning of the regulatory period based on the profit and loss account of the reference year These costs are adjusted for price index network expansion (length of the network and consumers connected to it) and efficiency For the subsequent years the set costs are carried forward taking into account the previously mentioned adjustment factors Controllable costs are mainly salaries administrative costs and other operating costs for which no specific pass-through is foreseen Specific Pass-through Costs and revenues eligible under this category are subject to the annual review of the maximum allowed revenues in the year X+1 During this review the costs estimated during the calculation of tariffs are adjusted for real costs The non-controllable costs can be subdivided into operating costs and additional remunerations (financial incentives)
Ref C20-IRB-54-03
CEER Report on Regulatory Frameworks for European Energy Networks 2020
80156
The first part of these costs contains human resource costs such as training costs old commitments concerning supplementary pensions and costs related to the evolution of salaries in addition to the evolution of the automatic indexation The next part of non-controllable costs is for taxes and contributions Costs eligible under technical operation include network losses the use of third-party infrastructure ancillary services preparatory studies revenues from other transmission or distribution services not accounted separately and revenues from participations of third parties in investment costs Costs linked to cooperation between network operators can be accepted for realising transnational cooperation projects with the aim to increase market integration as well as costs linked to common projects of network operators aiming at enhancing market functioning or increasing the efficiency of the management of distribution networks Finally research and development costs can be accepted under the conditions defined in the tariff methodology Additional remunerations (financial incentives) can be claimed by the network operator for specific tasks which were identified by the regulator as being of particular interest for the consumer for market functioning or to maintain security of supply Projects targeted by this measure include establishing equalised electricity and natural gas network tariffs on a national level setting up a remote monitoring system of the electricity network dissociating activities of supply and network operation for integrated companies with fewer than 100000 connected consumers and establishing a central data hub for specific energy information or for the implementation of network tariffs that improve the consumersrsquo participation in order to increase the efficiency of the usage of the electricity network among others Quality The current methodology has a specific component allowing the integration of a quality factor into the maximum allowed revenue Since this factor has been introduced for the first time at the start of the current regulatory period the aim is to gather reliable data on the quality of service of the network operators As a consequence during this monitoring period no financial implications are caused by this factor For electricity the evolution of the system average interruption duration index (SAIDI) is observed In case of a deterioration of this index the network operator in question needs to analyse the situation and deliver a specific report which explains the reasons for this development Such a report will be published For natural gas the quality factor does not apply for the current regulatory period Regulatory Account The annual review of the maximum allowed revenue allows to adjust some of the elements forming the estimated maximum allowed revenue (MAR) for real costs Indeed RAB remuneration work in progress remuneration depreciation quantity factor for controllable costs and specific pass-through items will be adjusted The reviewed MAR will then be compared to the revenues from approved tariffs of the concerned year Differences will be allocated to the regulatory account and can be used in the following tariff exercises Due to the evolutions and developments in the sector for example the roll-out of smart meters the development of e-mobility more active consumers and a bigger share of decentralised production the Institute has launched a study to work out possible directions for the future tariff structure Elements of this study will have an impact on the tariff methodology for the next regulatory period
Ref C20-IRB-54-03
CEER Report on Regulatory Frameworks for European Energy Networks 2020
81156
219 Netherlands Gas TSO Gas DSO Electricity TSO Electricity DSO
Ma
rke
t
str
uc
ture
Network operators
1 (GTS) 7 1 (TenneT) 7
Network length
12000 km 124000 km 21000 km 318000 km
Ownership State owned (public
by law)
Local public ownership (public by
law)
State owned (public by law)
Local public ownership (public
by law)
Ge
ne
ral
fra
me
wo
rk
Authority Authority for Consumers and Markets (ACM) (wwwacmnl)
System Incentive regulation Revenue cap
Period 3-5 years (currently 2017-2021)
Base year for next period
TBD
Transparency Method and tariff decisions Regulatory data Efficiency scores Quality of networks
Main elements for
determining the revenue
cap
TOTEX CPI cost efficiency
benchmark productivity change
WACC RAB
TOTEX CPI yardstick
productivity change WACC RAB
TOTEX CPI cost efficiency
benchmark productivity change
WACC RAB
TOTEX CPI yardstick
productivity change WACC RAB
quality incentive
Legal framework
Gaswet (Gas Act) Electriciteitswet 1998 (Electricity Act)
Rate
of
retu
rn
Type of WACC Real pre-tax
Determination of the rate of
return on equity
Sum of (1) risk-free rate and (2) equity risk premium beta Equity risk premium is based
on data in individual Eurozone countries over the period 1900-2015 (Dimson Marsh and Staunton database) An average of both the geometric and arithmetic average is taken
Multiplied by beta based on comparator group
Rate of return on equity
before taxes
67 in 2021 (calculated based on 502 after taxes and 25 tax rate 67 = (128+505074)075)
Use of rate of return
Real WACC is currently based on a 50 debt and 50 equity capital structure Real WACC is multiplied with the indexed RAB
Reg
ula
tory
as
se
t
ba
se
Components of RAB
Fixed assets and certain intangible assets (such as software) are included no working capital
Regulatory asset value
Indexed historical costs
RAB adjustments
Annual indexation (with CPI) Also adjustment for certain specific (expansionary)
investments
Annual indexation (with CPI) Also adjustment for certain specific (replacement) investments
Annual indexation (with CPI) Also adjustment for certain specific (expansionary)
investments
Annual indexation (with CPI)
Dep
re-
cia
tio
ns Method Straight line depreciation corrected for inflation (CPI) each year
Depreciation ratio
Most assets are depreciated over a period of 35 ndash 55 years
Consideration Depreciation is part of the total costs which are subject to an x-factor over the course of the regulatory period
Introduction The Transmission and Distribution System Operators (TSOs and DSOs) in electricity and gas are neutral market facilitators The Dutch Electricity Act and Gas Act specify what responsibilities the TSOs and DSOs have These responsibilities are linked to two domains First TSOs and DSOs are tasked with the transport and distribution of electricity and natural gas in an efficient safe and secure manner Second they are responsible for creating and maintaining connection points with other networks and consumers TSOs are also responsible for system operations Furthermore TSOs and DSOs have a responsibility to share all relevant
Ref C20-IRB-54-03
CEER Report on Regulatory Frameworks for European Energy Networks 2020
82156
information in order for consumers and producers to make efficient decisions Finally they have the task to ensure the safety of the networks The electricity grids and gas networks are natural monopolies where effective competition is restricted or does not exist at all They are also legal monopolies To ensure that network tariffs reflect what is normal in competitive circumstances and to stimulate operators to operate their networks as cost effectively as possible electricity and gas network operators are subject to regulation This regulatory task is performed by the Authority for Consumers and Markets (ACM) Historical Development Regulation by (the predecessor of) ACM began in 2002 with an incentive-based regulatory regime which is still in place to date Under this regime the revenues that network operators are allowed to earn within a certain period (regulatory period) is determined using a mathematical formula and fixed for the period This incentivises network operators to lower their costs in order to maintain or increase profits Regulatory Decision Process The process of setting allowed revenues starts with the publication of a method decision (valid for a period between three to five years) before the start of that regulatory period Method decisions are taken separately for GTS (the gas TSO) TenneT (the electricity TSO) combined for gas DSOs and also combined for electricity DSOs In these decisions ACM determines how the allowed or target revenue is calculated Soon after this ACM publishes the so-called x-factor decisions In these decisions the base level of revenue for the regulatory period and the annual tariff cut (this is the x-factor) are set For the electricity DSO a quality incentive is also set (the q-factor see below) X-factor decisions are made for each TSO and each DSO individually Finally during the regulatory period ACM publishes tariff decisions annually also individually for each TSO and DSO Tariff decisions take the relevant x-factor decision as a starting point and also account for further tariff corrections due to changes during a regulatory period court decisions etc Main Principles of the Tariff Regulation The most important principle is a revenueprice cap based on exogenous efficient cost level ACM incentivises TSOs and DSOs to operate efficiently by setting the revenue of the operators before the start of the regulatory period (ie an ex-ante revenue cap or price cap) The allowed or target revenue is set equal to the expected efficient costs If a system operator operates more efficiently than the cap it may keep the resulting profits On the other hand if it operates less efficiently it also has to take the resulting losses Because the efficient cost level is not only based on the network operatorrsquos own costs the regulation also gives incentives for efficiency That is because the efficient cost level is based on mostly exogenous data the network operator knows that in future periods it is able to profit from efficient choices today This gives the system operator an incentive to be efficient in both the short term and the long term For each regulatory period ACM renews the revenue or price cap to the actual efficient cost level If cost reductions lead to a lower efficient cost level consumers will benefit from these cost reductions in the period following these cost reductions In this way network operators earn a bonus for efficient operation and consumers profit from lower cost levels in the long run Hence the Dutch incentive regulation also ensures affordability of energy network services In order to ensure the safety and security of the network TSOs and DSOs have to invest in their networks and they need capital for that The incentive scheme parameters (like the WACC) are set such that network operators receive an appropriate return on their investment
Ref C20-IRB-54-03
CEER Report on Regulatory Frameworks for European Energy Networks 2020
83156
so that they are able to compensate their investors This return should match the return a company would get in a competitive market However whether or not a network operator actually receives this return will depend on the decisions the network operator makes The regulation is technology-neutral ie it facilitates efficient investments regardless of their nature Quality of Transport By way of a so-called q-factor ACM gives an incentive to the electricity DSOs to maintain an optimal quality standard If a DSO has fewer or shorter outages than the norm it will gain extra revenue through a positive q-factor If it has more or longer outages than the norm it will lose a share of its revenues through a negative q-factor For the gas DSOs there is no q-factor as no informative indicator for quality has been identified so far By law q-factors are not implemented for TSOs Quality maintenance for the TSOs and the gas DSOs is therefore safeguarded by the minimum requirements embedded in the Electricity Act the Gas Act and the technical conditions which are also set by ACM through separate procedures Q-factors are added to x-factors when setting allowed revenues so they have a cumulative effect The Regulatory Period The law allows for a regulatory period of three to five years The current period started on 1 January 2017 and runs until 31 December 2021 In the past periods of three years were often implemented The advantages of a shorter period are the flexibility to actualise the method more frequently and that the gap between ex-ante estimates and ex-post realisations is lower The main advantage of a longer period is more stability and certainty for network operators and customers In addition a longer period creates stronger efficiency incentives because the network operators will have a longer period in which they are able to profit from efficient operations X-factor Mechanism The mechanism of the x-factor works as follows ACM determines the base revenue on the basis of the realised costs and the static efficiency measures Then using parameters that estimate future cost trends ACM determines the level of the revenue at the end of the period The annual revenue then gradually evolves from the base level to the level at the end of the period ie the x-factor is equal to the annual change in revenue This means that the x-factor is a price differential rather than an efficiency target Determining the Regulatory Cost Base The cost of a network operator includes operational costs and capital costs The operational costs are determined on the basis of data from the network operators The capital costs include the return on investment and depreciation These are calculated by ACM based on investment data from network operators For all types of investments regulated depreciation periods are set in the regulation Periods vary between classes of assets ranging from 5 to 55 years The tariffs include an appropriate return which is based on a WACC-method This WACC gives an allowance for both the cost of debt and the cost of equity When setting the WACC ACM looks at the market return instead of the actual costs the network operators face By looking at the market return it is ensured that the return is no higher than what would be appropriate in a competitive environment The WACC (real pre-tax) is the same for all network operators because the reference group used to set the WACC is representative for all network operators For 2016 it was set at 45 for 2021 at 30 The method takes into account embedded debt This is not necessary for expansion investments so for these investments
Ref C20-IRB-54-03
CEER Report on Regulatory Frameworks for European Energy Networks 2020
84156
the WACC is set at 38 in 2016 and 30 in 2021 Since a real WACC is used the regulatory asset base is indexed For TSOs the expected costs of regular expansion investments during the regulatory period are added as additional capital costs The expected costs are set equal to the average costs for regular expansion investments of the three most recent years Operational cost for expansion investments are estimated at 1 of the investment expense
European directives stipulate that tariffs should reflect the actual costs incurred insofar they correspond to those of an efficient and structurally comparable network operator Since there is only one gas TSO and one electricity TSO in the Netherlands ACM determines the efficient costs for the TSOs by comparing them with other European TSOs in a cost efficiency benchmark When setting the efficient cost level for TSOs ACM also takes into account the dynamic efficiency This is the expected scope for improving cost efficiency resulting from technological and economic trends Lower costs because of such dynamic efficiency are passed on to consumers during the regulatory period in the form of lower tariffs Effectively the result of cost efficiency studies is used when historic actual cost are translated to allowed revenues for a future period
For DSOs so-called yardstick competition is used to determine the static efficiency Two yardsticks are set one for electricity DSOs and one for gas DSOs ACM sets yardsticks equal to the cost per unit of output based on the actual cost of the DSOs Each service that is billed separately by a DSO adds to the output where the national tariff code prescribes what can be billed and what not For incomparable types of costs (so-called regional differences) a correction is made on individual basis For DSOs the dynamic efficiency is equal to the geometric mean of the annual difference in the costsoutput ratio This figure is used to adjust the yardstick The so-determined efficient cost levels constitute the basis for the cost estimates used to set the allowed revenues for the upcoming period Making Adjustments During a Regulation Period For some cost estimates ACM is obliged to correct estimates annually and correct the allowed revenue accordingly There can also be other circumstances that may call for intermediate corrections (a) by court ruling (b) if it turns out that the decision was based on incomplete or incorrect data (c) if deviations between estimates and realisations are disproportional or (d) if the revenue is based on services that a network operator no longer provides For circumstances b-d it is up to ACM to decide if and how corrections will be made
Ref C20-IRB-54-03
CEER Report on Regulatory Frameworks for European Energy Networks 2020
85156
220 Northern Ireland Gas TSO Gas DSO Electricity TSO Electricity DSO
Ma
rke
t
str
uc
ture
Network operators
3 3 2 1
Network length ~430 km ~6000 km ~ 2200 km ~45000 km
Ownership public private public public
Ge
ne
ral
fra
me
wo
rk
Authority Northern Ireland Authority for Utility Regulation [known as Utility Regulator]
System Mixture Incentive regulation ndash revenue amp price
cap
Incentive regulation ndash revenue cap
Incentive regulation ndash revenue cap
Period 2017-2022 (5yrs) 2017-2023 (6yrs) 2015-2020 (5yrs) 2017-2024 (65yrs)
Base year for next period
TBD TBD TBD TBD
Transparency Regulatory reporting in place for all TSOs and DSOs Cost and Performance Reports
published annually or at least covering the price control period
Main elements for determining
the revenueprice
cap
1Review of historic and
forecast OPEX 2 Productivity 3 WACC and
4Inflation
1Review of historic and forecast OPEX
amp CAPEX 2 Efficiency Scores
3 Productivity 4WACC
5Inflation and 6Future Growth
1Review of historic and
forecast OPEX and CAPEX
2 Productivity 3 WACC and
4Inflation
1Review of historic and forecast OPEX amp
CAPEX 2 Efficiency Scores
3 Productivity 4WACC and
5Inflation
Legal framework
Gas (NI) Order 1996 Electricity (NI) Order 1992
Rate
of
retu
rn
Type of WACC For GNI (UK)
only pre-tax real WACC
Pre-tax as well as Post-tax real
WACCs
Pre-tax real WACC
Post-tax real WACC
Determination of the rate of
return on equity
The Capital Assets Pricing Model (CAPM) is used to calculate the cost of equity This method relates the cost of equity (Re) to the risk-free rate (Rf) the expected return on the market portfolio (Rm) and a business specific measure of investorsrsquo exposure to
systematic risk (Beta or β) using this formula Re = Rf + (Rm ndash Rf) x β
Rate of return on equity
before taxes
538 (real pre-tax)
66 (real pre-tax) 951 (real pre-
tax) 550 (real pre-tax)
Use of rate of return
The Regulatory Asset Base (RAB) is the base to which the rate-of-return is applied when determining the return on capital
Reg
ula
tory
as
se
t b
ase
Components of RAB
Fixed assets only Fixed assets plus Profile Adjustment
Fixed assets and pre-construction
work for investments
according to the ten-year
development plan
Fixed assets and assets under construction
Regulatory asset value
Historic cost indexed to present value using inflation
RAB adjustments
None
RAB developments during a regulatory period taken into
account subject to Uncertainty
Mechanism and actual outputs
Transfer of cost to the TAO upon construction
RAB developments during a regulatory
period are taken into account and lead to
changes of the regulatory asset base
Ref C20-IRB-54-03
CEER Report on Regulatory Frameworks for European Energy Networks 2020
86156
De
pre
cia
t-
ion
s
Method Straight line (with Electricity DSO kinked line)
Depreciation ratio
Depends on asset type
Consideration Part of the examined costs
Introduction The Northern Ireland Authority for Utility Regulation (otherwise known as the Utility Regulator [UR) is the independent non-ministerial government department responsible for regulating Northern Irelandrsquos electricity gas water and sewerage industries to promote the short and long-term interests of consumers The Utility Regulatorrsquos statutory objectives are to
bull Protect the short and long-term interests of electricity and gas consumers with regard to price and quality of service
bull Promote competition where appropriate in the generation transmission and supply of electricity and
bull Promote the development and maintenance of an economic and co-ordinated natural gas industry
The Utility Regulatorrsquos work involves
bull Issuing and maintaining licences for gas and electricity companies to operate in Northern Ireland
bull Making sure that these companies meet relevant legislation and licence obligations
bull Challenging these companies to keep the prices they charge as low as they can be
bull Encouraging regulated companies to be more efficient and responsive to customers
bull Working to encourage competition in the gas and electricity markets
bull Setting the standards of service which regulated companies provide to customers and
bull Acting as an adjudicator on certain customer complaints disputes and appeals In carrying out its work the Utility Regulator also takes account of the needs of vulnerable consumers The UR also aim to contribute to the promotion of sustainable development in exercising its duties Historical Development The electricity industry in Northern Ireland was privatised in 1992-1993 The industry is split by wholesale network (transmission and distribution) and supply The regulator ensures that each licensed activity is ring-fenced from other activities in the same group of companies All consumers have metered supply but more sophisticated meters and tariffs are used for industrial consumers than for households There are three transmission licences a distribution licence and also a market operator licence System Operator for Northern Ireland Limited (SONI) holds the TSO licence for Northern Ireland SONI also holds the market operator licence for Northern Ireland in conjunction with EirGrid A transmission licence is held by NIE Networks Limited in respect of ownership of the main transmission system A second is held by Moyle Interconnector Limited a subsidiary of Mutual Energy Limited (MEL) which owns the Moyle Interconnector assets linking the network to the GB system in Scotland
Ref C20-IRB-54-03
CEER Report on Regulatory Frameworks for European Energy Networks 2020
87156
NIE Networks also hold a distribution licence for their distribution system The Utility Regulator sets price limits for the monopolistic components of the electricity industry and ensures that end prices for consumers reflect efficient costs and reasonable levels of profitability The gas sector is split into three main areas transmission distribution and supply Gas transmission deals with the large high-pressure pipelines that convey gas to the distribution systems There are four transmission pipelines in Northern Ireland
bull SNIP (Scotland to Northern Ireland Pipeline) is 135 kilometres long and runs from Twynholm in Scotland to Ballylumford The SNIP is owned by Premier Transmission Limited which is part of the Mutual Energy Ltd group of companies
bull BGTP (Belfast Gas Transmission pipeline) is 26 kilometres long and is connected to the SNIP and to the North West Pipeline It also supplies gas to the Belfast distribution network The BGTP is owned by Belfast Gas Transmission Limited (BGTL) which is part of the Mutual Energy Ltd group of companies
bull NWP (North West Pipeline) is 112 kilometres long and runs from Carrickfergus to Coolkeeragh Power-station It is owned by GNI (UK) and
bull SNP (South North Pipeline) is 156 kilometres long and runs from Gormanstown in Co Meath to Carrickfergus where it links into the NWP It is also owned by GNI (UK)
Gas distribution deals with the medium and low-pressure gas mains that convey gas licenced areas within Northern Ireland There are three distribution licensed areas within Northern Ireland
bull Greater Belfast and Larne area - operated by Phoenix Natural Gas Limited (PNGL)
bull Ten Towns distribution area - operated by Firmus Energy (Distribution) Limited (FEDL) and
bull West distribution licensed area - operated by SGN Natural Gas Limited (SGN) The legislative framework that governs the energy industry in Northern Ireland includes
bull Energy (NI) Order 2003 httpwwwlegislationgovuknisi2003419contents
bull Electricity (NI) Order 1992 httpwwwlegislationgovuknisi1992231contents and
bull Gas (NI) Order 1996 httpwwwlegislationgovuknisi1996275contents Current Regulatory Frameworks Electricity Transmission In Northern Ireland the transmission system is owned by NIE Networks (the TAO) and operated by SONI (the TSO) who are certified under Article 9(9) arrangements of Directive 200972EC Both NIE Networks and SONI are part of wider corporate structures under the ownership of the Irish state government Moyle Interconnector Limited is also a certified TSO but this asset is operated and administered by SONI SONI is regulated on a revenue cap framework Controllable costs are set on an ex-ante basis with a WACC return for capital projects A 5050 mechanism exists for overunderspend on controllable costs SONI also earn a margin for performing a revenue collection function Certain non-controllable costs such as ancillary services are provided on a pass-through basis Mechanisms are also in place to provide additional revenue within period for unforeseen projects or pre-construction work associated with investments prescribed by the ten-year network development plan
Ref C20-IRB-54-03
CEER Report on Regulatory Frameworks for European Energy Networks 2020
88156
Typically speaking no catch-up efficiency target is applied to the TSO Rather a general productivity challenge is applied alongside an assessment of real price effects As the company bears no volume risk tariffs are adjusted via a correction (K-factor) adjustment on a t-2 basis to account for any overunder recovery of revenue It is our intention to move the TSO to a more incentive based regulatory framework going forward (See httpswwwuregnigovukpublicationssoni-price-control-final-approach) For the transmission asset owner (NIE Networks) the Utility Regulatorrsquos methodology for setting an efficient transmission allowance follows a traditional RPI +- X regulatory approach NIE Networks transmission allowance is set alongside their distribution price control This is discussed further in the distribution section below The regulated electricity revenue entitlements for network and market costs for 2019 - 20 can be found at the following link httpswwwuregnigovuksitesuregnifilesmediafilesRegulated20Entitlement20Values20201920202020-20Information20Notepdf Gas Transmission The regulatory framework for gas transmission is different depending on the TSO All the TSOs are certified under the full ownership unbundled arrangements Premier Transmission Limited (PTL) and Belfast Gas Transmission Limited (BGTL) are part of the Mutual Energy Limited (MEL) group These companies are all subject to a lsquomutualisedrsquo model In this model NI gas consumers absorb deviations between forecast and actual operating costs in return for an absence of equity fundingreturns from the business These TSOs have a lsquoshadowrsquo price control which sets out expectations While they carry no cost risk the licence holders have a reputational incentive to manage costs effectively in line with the lsquoshadowrsquo allowance GNI (UK) is a subsidiary of Gas Networks Ireland which is part of Ervia a utility infrastructure company owned by the government of the Republic of Ireland GNI (UK) is subject to a traditional lsquorevenue caprsquo framework In the case of GNI (UK) the allowance for controllable OPEX represents a fixed amount the licence holder will recover from consumers Any variation between this allowance and actual controllable OPEX is absorbed (or retained) by the licence holder In this instance the consumer is exposed to no operating cost risk Instead this risk is borne entirely by the shareholders of the licence holder and is reflected in the rate of return This provides the licence holder with a very clear incentive to effectively manage costs For all three TSOs the only spend they incur is OPEX Any maintenance or replacement costs are treated as operational spend GNI (UK) earn a WACC return on their initial pipeline construction costs PTL and BGTL networks are entirely debt financed by way of bond repayments A description of the gas TSO price control methodology for the period 2017-2022 is published under the following link httpswwwuregnigovukpublicationsgt17-final-determination-main-document Electricity Distribution The current 6th regulatory period for the electricity DSO has been effective since 1 October 2017 and lasts until 2024 (a six-and-a-half year period) The regulatory framework that was adopted for this period follows a traditional RPI +- X revenue cap approach
Ref C20-IRB-54-03
CEER Report on Regulatory Frameworks for European Energy Networks 2020
89156
OPEX costs are subject to efficiency challenge via yardstick benchmark modelling against GB comparators This modelling takes account of local circumstances in the form of special factors and regional price adjustments for labour costs Revenues are inflated by RPI inflation but subject to real price effect considerations and a general productivity challenge Capital costs are treated in three ways
bull Investment for which an ex-ante allowance is included in the determination
bull Investment carried out under the re-opener mechanism where costs will be determined at a later date when the need for the project has been confirmed and
bull Investment which is subject to a volume driver Capital costs earn a WACC return of 318 (real) though this is subject to adjustment following refinancing There are various uncertainty mechanisms in place and a variety of incentives based on delivery of key outputs aligned with cost control A new Reliability Incentive was introduced with annual financial incentives and penalties around performance on customer minutes lost The final determination can be found at httpswwwuregnigovukrp6-final-determination Gas Distribution The current price control for the three gas DSOs in Northern Ireland began on 1 January 2017 for a period of six years Phoenix and Firmus both have a revenue cap while SGN has a price cap in order to provide it with an incentive to outperform on volumes as it develops its distribution network The focus of the price control is to grow and develop the network to maximise the number of connections possible of which incentives are in place to achieve this The price control is based on a standard RPI-X framework Efficient operational costs are set by virtue of top-down benchmarking a bottom-up build-up of costs and application of real price effects and productivity challenge Capital costs are challenged on a similar basis An innovation fund is available if DSOs can make an economic case and justify why the cost should be funded by customers Various uncertainty mechanisms are also available to reflect the actual outcomes of performance and provide flexibility on workload priorities The description of this regulatory period for gas DSOs is published under the following link httpswwwuregnigovukpublicationsgd17-final-determination-final
Ref C20-IRB-54-03
CEER Report on Regulatory Frameworks for European Energy Networks 2020
90156
221 Norway Gas TSO Gas DSO Electricity TSO Electricity DSO
Ma
rke
t
str
uc
ture
Network operators NA 2 1 128
Network length NA 740 km ~12500 km
~102500 km ndash HV ~204700 km ndash LV (le 1kV)
Ownership NA
Public and private ownership
State ownership Mainly municipality
local public ownership
Ge
ne
ral
fra
me
wo
rk
Authority NA NVE-RME
System Under development Incentive regulation Revenue cap
Period Under development
Data is updated every year important factors (ie WACC-model) fixed for five years
Base year for next period
Under development Annual regulation based on cost data two
years back
Transparency Under development
Full transparency - Revenue caps efficiency scores all data script for calculation in R
Main elements for determining the
revenue cap NA Under development
Controllable and pass-through cost TOTEX efficiency benchmark Averagely efficient
company receives RoR
Legal framework Act on common rules for the internal market for gas with underlying
regulations
Energy Act with underlying regulations accounting legislation
Rate
of
retu
rn Type of WACC Under development Nominal pre-tax
Determination of the rate of return on
equity Under development CAPM
Rate of return on equity before taxes
Under development (Rf + Infl + βe x MP)(1 - t) = (25 + 233 +
0875 500)(1-024) = 12 19
Use of rate of return WACC is multiplied with RAB
Reg
ula
tory
as
se
t b
as
e
Components of RAB
Book values from financial statement adjusted with 1 working capital premium assets under
construction and grants funded assets are excluded
Regulatory asset value
Book values from financial statements
RAB adjustments BV + 1 working capital premium
Dep
re-
cia
tio
n
s
Method Linear depreciations from financial statements
Depreciation ratio Depending on asset type must be approved by accountant
Consideration Part of examined controllable costs
Introduction The present Norwegian Energy Act came into force on 1 January 1991 The Act unbundled the activities of generation and supply which can operate in competitive markets from transmission and distribution of electricity In order to achieve a competitive and efficient electricity market The Norwegian Water Resources and Energy Directorate (NVE-RME) regulates transmission and distribution system operators with a combination of direct regulation and incentive based economic revenue cap regulation The goal of the regulation is to promote efficient transmission and distribution of energy Norway has 128 electricity Distribution System Operators (DSOs) Statnett is the only Transmission System Operator (TSO) Norway does not have gas TSOs
19 Rf = Risk free rate Infl = Inflation βe = Equity Beta MP = Market premium t = tax rate
Ref C20-IRB-54-03
CEER Report on Regulatory Frameworks for European Energy Networks 2020
91156
The electricity system operators set their tariffs based on the allowed revenue (AR) 119860119877119905 = 119877119862119905 + 119875119879119905 + 119879119862119905 + 119877amp119863119905 minus 119862119864119873119878119905 + 119879119871119905 The allowed revenue is the sum of the revenue cap (RC) pass-through costs related to property tax (PT) and tariff costs to other regulated networks (TC) Approved RampD costs are also included To remove the time lag (TL) in the cost of capital recovery the difference between actual cost of capital (depreciations and return on assets) in the revenue cap year and the cost base from two years previously is included Furthermore any Costs of Energy Not Supplied (CENS) during the year are deducted from the allowed revenue CENS is a measure of the calculated value of lost load for the customers The CENS arrangement is a quality regulation providing an incentive for network operators to maintain their assets properly and to ensure necessary investments at a socioeconomically efficient level in order to avoid power outages The revenue compliance is subject to regulatory control Excess or deficit revenue for a given year is calculated as the difference between actual collected revenues and allowed revenues in a year Actual collected revenues include tariff revenues from customers congestion revenue and revenue from system operations NVE-RME decides an excessdeficit revenue balance every year The decision is made approximately one year after the RC is set when the companies have reported their actual costs in the RC-year The balance is to be adjusted towards zero over time through tariff changes Excess revenues must be reimbursed to the customers while deficit revenues may be recovered According to the economic regulation of network companies transactions within a vertically integrated company and transactions between the network company and other companies in the same group needs to be based on competitive market conditions Furthermore the national regulator may impose a specific method for cost allocation between areas of operation in vertically integrated companies NVE-RME audits annually a selection of the companies to reveal any cross-subsidies
Historical Development In the first regulatory period from 1993-1996 NVE-RME used rate-of-return regulation for the industry During this period NVE-RME prepared the implementation of a framework for revenue cap regulation that would give better incentives for cost efficiency than possible in rate-of-return regulation NVE-RME developed systems to collect data from the DSOs and a revenue cap model that included the use of DEA to set general as well as company specific efficiency targets In the second regulatory period 1997-2001 NVE-RME introduced a revenue cap model with a cost base that was based on the DSOrsquos own historical cost The regulatory rate of return was fixed at 83 The cost base was adjusted yearly to calculate revenue caps the cost base was increased by CPI and reduced by an efficiency target X The general efficiency target was 15 and individual efficiency targets were between 0 and 3 The revenue caps were also adjusted for new investments with a factor deducted from growth in distributed electricity In this period the incentives for cost efficiency increased from the first regulatory period To avoid incentives to reduce costs resulting in low quality of service NVE-RME introduced an incentive mechanism for quality of service in 2001 see Langset (2002)20
20 Langset T (2002) Quality Dependent Revenues ndash Incentive Regulation of Quality of Supply Energy amp
Environment 13(4) 749-61
Ref C20-IRB-54-03
CEER Report on Regulatory Frameworks for European Energy Networks 2020
92156
CENS was calculated based on price per MWh for energy that was not delivered due to outages An expected value of CENS was added to the revenue caps and actual value of CENS was deducted from allowed revenue when this was settled The regulatory model in the third regulatory period from 2002-2006 was similar to the second period The cost base was updated and based on data from 1996 to 1999 and minor changes were introduced to the benchmarking models The CENS model was expanded to differ between more customer groups (from two to six) and adapted to implicitly take into account heterogeneity among DSOs Similar to the second regulatory period the decoupling of the DSOsrsquo costs and revenues due to the use of up to ten-year-old data gave strong incentives for efficiency At the same time the time delay between costs and revenues created weak incentives for investments It also took time before efficiency improvements resulted in lower tariffs for end users In the fourth regulatory period from 2007-2012 NVE-RME introduced major changes to the model To address the weaknesses described above the CPI-X model was abandoned It was replaced with a hybrid model where each DSOrsquos share of the revenue cap was decided by a combination of the DSOrsquos own costs (cost plus) whereas the rest was decided by a cost norm This cost norm was estimated through benchmarking methods based on the costs of other comparable DSOs (yardstick competition) The cost base in the model was no longer fixed for the period but updated yearly This contributed to increase incentives for investments After two regulatory periods with strong incentives for cost efficiency the change was partly motivated to strengthen the incentives for investments Around 2005 increasing investments were expected in the industry A large part of the asset base had become rather old and there was need for reinvestments Reducing the lag of the cost base increased the incentives to invest During this period the incentives for quality were strengthened through expansion of the CENS arrangement The incentives for cost efficiency were still strong but these incentives were applied differently than in traditional CPI-X regulation The cost norms were calibrated so that on the industry level the sum of cost norms was equal to the sum of cost bases With this mechanism the industry as a whole got the regulatory rate of return and also DSOs with average efficiency DSOs that were more efficient than the average earned a higher return and the opposite outcome for the less efficient Since this model was applied yearly the implication was that the DSOs ldquocompetedrdquo for their share of the total revenue cap In the model DSOs that lagged behind the average performance of DSOs would experience a lower rate of return This mechanism incentivised efficiency and at the same time reduced time lag between costs and revenues Another feature of this period was the incorporation of environmental variables (Z-factors) in the cost norm This was important in order to increase the credibility of the model These Z-factors were included as outputs in the model In 2007 the DEA-model had one input (total costs) and nine output variables Five of these were related to network structure and four were Z-factors
The fifth regulatory period started in 2013 The main model framework from 2007 was maintained but several elements in the model were improved Disincentives for mergers and acquisitions were removed and incentives for participation in research development and pilot projects were strengthened The number of outputs in DEA were reduced and the method for adjusting for Z-factors was revised see Amundsveen et al (2014)21 Already in 2010 the Z-
21 Amundsveen Kvile Kordahl and Langset (2014) Second Stage Adjustment for Firm Heterogeneity In DEA A
Novel Approach Used in Regulation of Norwegian Electricity DSOs in Recent Developments in Data Envelopment Analyses and its Applications Proceedings of the 12th International Conference of DEA
Ref C20-IRB-54-03
CEER Report on Regulatory Frameworks for European Energy Networks 2020
93156
factors were moved to a second stage regression but in 2013 the changes were applied in order to meet some of the criticism towards this approach Also the model for calculating the regulatory rate of return (based on a weighted average cost of capital model) was updated to ensure the DSOsrsquo ability to be able to earn a reasonable rate of return on their assets (Langset and Syvertsen 2015)22 Determining the Revenue Caps NVE-RME regulates the network companies using an incentive-based revenue cap (RC) model The RC is set annually based on a formula of 40 cost recovery and 60 cost norm resulting from benchmarking models There is a two-year lag in the cost data The model is applied to operators of all electricity networks Statnett is benchmarked together with other European TSOs while the other network operators are benchmarked in models based on DEA There are separate models for local and regional distribution NVE-RME announces the RC for the coming year in November and the network companies set the tariffs accordingly In principle the only difference between the announced and the final RC for a year are the actual prices inflation and WACC that has to be estimated in the notification In addition to this any errors in the companiesrsquo cost or technical data discovered after the notification are corrected in the final RC Any changes in the rules and regulations will be subject to a public consultation implemented before the RC-year begins Changes in the methodologies not stated in the regulation are mainly subject to a consultation with affected parties but are also publicly available on NVE-RMErsquos website The RCs are calculated based on expected total costs using inflation-adjusted cost data from two years back The deviation between the expected total costs and the actual total costs of all companies in a year is included in the RC calculation two years later (eg the deviation between expected and actual costs for 2017 will be corrected in the RC for 2019) The total cost deviation is distributed among the companies using their share of the sectorrsquos total regulatory asset base This mechanism does not apply to the regulation of Statnett Efficiency Benchmarking NVE-RME implements two different efficiency assessment models for determining the revenue caps for DSOs in the local and regional distribution grids Both models follow the same three stage procedure 1 DEA ndash Compares efficiency solving specific tasks 2 Z-factor correction - Adjusts DEA scores from the 1st stage for differences in environmental factors Efficiency may increase or decrease dependent on target units Z-factors 3 Calibration - Addition to cost norm such that total industry cost base equals cost norm Ensures that averagely efficient companies receive a return equal to the NVE-RME-interest The inputs in the first and second stage of the calculation are essentially what differ in the two models The differences are depicted in the table below
22 Langset amp Syvertsen (2015) The WACC Model in the Regulation of the Norwegian Electricity Network
Operators ICER Chronicle ed
Ref C20-IRB-54-03
CEER Report on Regulatory Frameworks for European Energy Networks 2020
94156
TOTEX is used in a single input cost-minimising DEA assuming constant returns to scale Also the weighted values used as outputs in the regional distribution grid capture a lot of the differences between companies This is one of the important reasons the second stage analysis includes more variables of the local distribution compared to the regional distribution For readers interested in calculation specifics see our script (in R) for calculation on httpsgithubcomNVEIRiR General Sectoral Productivity Factor and Price Development NVE-RME does not implement any productivity factor As described above the total revenue cap for the industry is given Since the model is updated annually there are strong incentives for each DSO to reduce costs In order to maintain a given level of rate of return a DSO has to keep up with the development of the ldquoaverage DSOrdquo The large number of DSOs limits the effects of cartelisation National Specificities Some smaller DSOs are exempted from the regular RC-model described above These companies are compared to their own historical average cost Outlook NVE-RME currently has no plans on major model revisions The method for determining the WACC was subject to a public hearing in 2018 The WACC-model is fixed for a minimum of five years and was last revised in 2013
23 Including depreciations on grants funded assets Estimated using Principal Component Analysis
Local distribution Regional Distribution
Stage 1 - DEA
Input Outputs Input Outputs
1) TOTEX = OPEX
+ Depreciations23 + Return on BV
+ Cost of Network Losses
+ CENS
1) Number of customers
2) Length of HV network KM
3) Number of substations
1) TOTEX = OPEX
+ Depreciations + Return on BV
+ CENS
1) Overhead lines weighted
value 2) Ground
cables weighted value
3) Sea cables weighted value 4) Substations weighted value
Stage 2 Z-factor correction
Z-factors Z-factors
Mountain environments Forest environments
Coastal environments
Cold environments
City (share of grid laid as underground cables)
Forest environments (share of overhead lines in coniferous forest)
Ref C20-IRB-54-03
CEER Report on Regulatory Frameworks for European Energy Networks 2020
95156
222 Poland Gas TSO Gas DSO Electricity TSO Electricity DSO
Ma
rke
t
str
uc
ture
Network operators
1 entity 1 main entity and 52
local DSOs 1 entity 184 local DSOs
Network length ~11611 km24 ~138975 km25 ~15000 km ~815000 km
Ownership State-owned
Indirect state-owned public and
private State-owned
Public partly public and private
Ge
ne
ral
fra
me
wo
rk
Authority The President of Energy Regulatory Office (URE) (wwwuregovpl)
System
Cost of service with elements of revenue cap
Cost of service with elements of revenue cap
Mixed (Revenue cap with elements of incentive-based
regulation and elements of quality
regulation)
Period Calendar year 12 months Calendar year 2016-2020
Base year for next period
Mainly a year preceding the year of tariff submission for approval for which audited
financial statement is available
Mainly a year preceding the year of tariff submission
for approval for which audited
financial statement is available
The basis will be set when
developing the assumptions for the
next regulatory period
Transparency The approved tariffs and guidelines on WACC issued by the President of URE For TSO also publication of information
according to article 29 and 30 of NC TAR26
The approved tariffs and guidelines on WACC issued by the President of
URE
Tariffs assumptions on benchmarking
models and WACC guidelines
Main elements for determining
the revenue cap
Justified operating expenditures
depreciation local taxes and other fees cost of gas
losses and return on capital employed
Justified operating expenditures
depreciation local taxes and other fees cost of gas
losses pass-through costs and return on capital
employed
RoC + OPEX depreciation
property taxes losses costs of maintaining the system-related
standards of quality and
reliability of current electricity supplies
RoC (determined also by quality
regulation factors) + OPEX
depreciation property taxes
losses and pass-through costs
Legal framework
Energy Law Act and regulations of the Minister of Energy
EU law
Rate
of
retu
rn
Type of WACC Pre-tax nominal Pre-tax nominal
Determination of the rate of
return on equity
Cequity pre-tax=(Risk-free rate + βequity equity risk premium)(1-corporate tax rate)
(Risk-free rate + βequity equity risk premium)(1-corporate tax rate)
Rate of return on equity
before taxes
726027 =(3187+05986450)(1-
19) 6754=(2430+0724420)(1-19)28
Use of rate of return
In allowed revenue we include RoC = WACC RAB
24 High-methane and low-methane natural gas transmission network (including SGT transit pipeline) 25 For main entity high-methane and low-methane natural gas network 26 Commission Regulation (EU) 2017460 of 16 March 2017 establishing a network code on harmonised
transmission tariff structures for gas (OJ L 72 of 17 March 2017 p 29) 27 Value included in the calculation of gas TSO tariff for 2020 28 The risk-free rate is updated every three months both for gas and electricity companies
Ref C20-IRB-54-03
CEER Report on Regulatory Frameworks for European Energy Networks 2020
96156
Re
gu
lato
ry a
sse
t
ba
se
Components of RAB Tangible fixed assets in use and intangible
assets deducted by assets financed by subsidy
Fixed assets assets under construction intangible assets
Regulatory asset value
Set for every tariff Re-evaluated assets
RAB adjustments
Adjustments of return of capital included in allowed revenue are possible during tariff
calculation Annually Annually
De
pre
cia
tio
ns
Method Straight-line Straight-line
Depreciation ratio
Economic useful life is set according to requirements of accountancy law for adequate groups of fixed assets Approximate EUL for compressors equals 5 years measuring stations 15 years pipelines and buildings 40 years
For transformers and substations economic useful life is 30-40 years For new investments an average depreciation value of all investments (eg transformers substations IT systems meters) equal to 4 is allowed
Consideration A component of allowed revenue
Regulatory Framework The President of URE29 is the head of a central body of government administration accountable for regulation of fuels and the energy economy Their competence referred to in article 23 of the Energy Law Act of 10 April 1997 embraces inter alia granting and revoking licences approving tariffs and controlling their application and the promotion of competition as well The President of URE regulates activities of energy enterprises with the aim of balancing interests of these companies and customers The legal framework for regulation of transmission and distribution of gaseous fuels and electricity is constituted by Energy Law Act and regulations of the Minister of the EconomyEnergy on detailed terms for structuring and calculation of tariffs and on detailed terms of the transmission systems operation Network Tariffs ndash Allowed Revenue Components Energy enterprises dealing with transmission and distribution (both of gas and electricity) are obliged to hold a licence and perform billing basing on tariffs approved by the President of URE According to article 47 of the Energy Law Act tariffs are set by energy enterprises and submitted for approval by the President of URE who approves the tariff or refuses it if they assess that the tariff has not been set in line with provisions of articles 44-46 thereof Generally gas transmission and distribution tariffs must cover justified costs of conducting the licensed activity (set ex-ante) and a justified return on capital employed Moreover the protection of the customerrsquos interest against unjustified level of prices and charges must be taken into account Allowed or target revenue in case of gas network tariffs consists of planned reasonable operating expenditures depreciation local taxes and other fees cost of gas losses and return on capital employed In the WACC calculation for 2017 and 2018 the notional gearing of 2575 and 3070 was applied respectively whereas before the year 2017 the actual one derived from the latest audited financial statement of the regulated entity According to the WACC setting methodology for gas system operators for years 2019-202330 the share of debt will increase annually by four percentage points starting from 34 in 2019
29 URE ndash Urząd Regulacji Energetyki (English Energy Regulatory Office) 30httpswwwuregovplplbiznestaryfy-zalozeniazalozenia-dla-kalkulacj-27834Pismo-Prezesa-Urzedu-
Regulacji-Energetyki-do-przedsiebiorstw-energetycznychhtml
Ref C20-IRB-54-03
CEER Report on Regulatory Frameworks for European Energy Networks 2020
97156
For electricity network companies allowed revenue consists of planned reasonable operating expenditures depreciation local taxes and other fees cost of losses return on capital employed and costs of maintaining the system-related standards of quality and reliability of current electricity supplies In WACC for electricity an equal ratio of debt to equity is applied The risk-free rate applied in the calculation of WACC for a specific quarter of the year is published by the President of URE at the beginning of each quarter It corresponded to the average profitability of the fixed rate ten-year Treasury bonds with the longest maturity listed on Treasury BondSpot Poland over 18 months preceding the current quarter for electricity infrastructure companies and over 36 months for gas system operators All data necessary for the WACC calculation is published Guidelines on WACC calculation for gas network companies are included in the document The methodology for a calculation of cost of capital employed by gas network companies for years 2019-2023 published on URErsquos website31 The main component of RAB for gas assets is made up by tangible fixed assets in use and intangible assets32 revealed in the latest audited financial statement of the gas network company deducted by assets financed by subsidy Remunerated assets include the average value (from tariff period and previous period) of planned capital expenditures from network development plans accepted by the President of URE deducted by planned connection fees and corrected in some cases by a coefficient indicating the average underperformance of planned capital expenditures in previous years Moreover an average planned depreciation for the tariff year and previous year is subtracted Guidelines on WACC calculation for electricity network companies are included in the document The methodology for a calculation of cost of capital employed by electricity network companies for years 2016-2020 published on URErsquos website33 RAB is based on re-evaluated assets The re-valuation of the RAB was done for 31 December 2008 In the subsequent years the RAB was adjusted primarily due to investments deprecation and connection fees The compliance of a proposed tariff with the specific provisions of law is verified under the administrative procedure which finishes with the decision of the President of URE (approving a tariff or refusing to approve it) In proceedings for tariff approval the President of URE carries out a detailed analysis of costs which constitute the basis for calculation of transmission and distribution charges making sure that there are no cross-subsidies between licensed and unlicensed activities and between different types of licensed activities Justified costs used for calculation are set according to articles 44 and 45 of the Energy Law Act and rules of cost recording stipulated in the accountancy act The basis of verification of these costs is the audited financial statement from previous year referred to in article 44 paragraph 2 of the Energy Law Act Additionally energy enterprises are obliged to deliver quarterly reports on their activity (including inter alia amounts of gas sold revenue costs and investment expenditures) according to URErsquos template The tariff decision of the President of URE together with the tariff itself (the document containing transmission charges and conditions of its application) are published in the Bulletin of URE available on URErsquos website within 14 days of the approval date Energy enterprises
31 httpbipuregovplbiptaryfy-i-inne-decyzjezalozenia-dla-kalkulacj2189Zalozenia-dla-kalkulacji-i-redakcji-taryf-przedsiebiorstw-sektora-gazowegohtml 32 net value ie deducted by depreciation 33 httpbipuregovplbiptaryfy-i-inne-decyzjezalozenia-dla-kalkulac2299Zalozenia-do-kalkulacji-taryf-OSD-na-
rok-2016html
Ref C20-IRB-54-03
CEER Report on Regulatory Frameworks for European Energy Networks 2020
98156
apply tariffs not earlier than after 14 days and not later than the 45th day from the publication date with the exception of tariffs for gas transmission which are applied in the period specified in the decision approving the tariff but not earlier than after 14 days from the publication thereof If a concerned energy enterprise is not satisfied with the President of URErsquos decision approving or denying approval of the tariff it can appeal against it within a 14-day period to the Court of Competition and Consumer Protection The appealed tariff is not applied Gas TSO Tariff There is one gas TSO in Poland ndash OGP GAZ-SYSTEM SA It operates its own transmission network and the network owned by SGT EuRoPol GAZ SA (Yamal pipeline) under the ISO formula The tariff methodology is compliant with European and domestic law supplemented by guidelines issued by the President of URE The postage stamp cost allocation methodology is applied There is no distinction between domestic and cross-border transmission tariffs ie the same tariff applies both for domestic and cross-border network users In the case of gas storage facilities and LNG facilities connected to the transmission system an 80 and 100 discount is applied respectively The transmission tariff is calculated and approved for a calendar year The regulatory period equals one year
The details of tariff calculation are included in the decision of the President of URE on reference price methodology for years 2020-2022 issued pursuant to article 27(4) of the NC TAR34 Gas DSOsrsquo Tariffs As of 31 December 2017 in Poland only one DSO was operating that was undergoing legal and functional unbundling requirements ndash Polska Spoacutełka Gazownictwa sp z oo35 whose main shareholder was PGNiG SA This company carries out its business activity involving the distribution of gaseous fuels using low- medium- and high-pressure distribution networks for customers located throughout Poland In addition in Poland 52 local DSOs were operating which were not obliged to unbundle their distribution and trading activities Very often the share of gas supplying revenues for these companies made up a marginal amount of total revenues The methodology of justified costs setting and return on capital employed calculation are much the same as for TSO tariffs but instead of entryexit tariffs a group tariffs approach is applied In case of companies conducting an integrated activity (distribution and supply of gas) the tariff incudes prices of gas for households because the obligation to apply regulated prices of gas will remain in force until 31 December 2023 (according to Energy Law Act art 62b) Electricity Grid Operators Regulation There is one Transmission System Operator (TSO) in Poland ndash a state-owned company PSE SA It runs its business activity under a licence for electricity transmission granted by the President of URE and valid until 31 December 2030 Distribution System Operators (DSOs) operating within vertically integrated companies and serving more than 100000 customers connected to their grids are obliged to be independent in terms of legal form organisational structure and decision-making (Article 9d of the Energy Law Act) There are 184 DSOs authorised by the President of URE including five entities
34httpbipuregovplbiptaryfy-i-inne-decyzje-binne-decyzje-informacj3777Inne-decyzje-informacje-
sprawozdania-opublikowane-w-2019-rhtml 35 Polish Gas Company Ltd
Ref C20-IRB-54-03
CEER Report on Regulatory Frameworks for European Energy Networks 2020
99156
legally separated from former integrated distribution companies and 179 DSOs not obliged to be legally unbundled Almost all DSOs not obliged to be legally unbundled perform their functions in systems not connected directly to the transmission grid but to the distribution networks of the five legally unbundled operators Tariffs for Electricity Grid Operators The TSO tariff is set as a one-year tariff and approved by the President of URE although tariffs are derived from a long-term (multi-year) regulation of the TSO Cost of service and revenue cap methods are used in tariff setting The WACC determining method was adopted for years 2016-2020 (both for TSO and DSOs) The regulatory period for five biggest DSOs is five years (the current one at time of writing being 2016-2020) Nevertheless the tariffs are approved annually by the President of URE Mixed type of regulation ie revenue cap with elements of incentive-based regulation and quality regulation is used Models for OPEX and grid losses were established for above mentioned regulatory period The X-coefficients were included in charges for the first year of regulatory period and were set for the next years A quality charge (for maintaining power system standards) is also included in tariffs of the TSO and DSOs For DSOs elements of quality regulation were introduced for regulatory period 2016-2020 The regulation assumes the use of a quality factor Qt which influences return on capital Qt factor depends on DSOrsquos performance in the field of supply quality measured inter alia by SAIDI and SAIFI indicators TSOsrsquo and DSOsrsquo Network Development Plans (Electricity and Gas) The network development plan should ensure a long-term maximising of capital expenditures efficiency and costs incurred by energy enterprises so that in particular years the capital expenditures and costs would not cause excessive increase in prices and charges for the supply of electricity and gas while ensuring continuity reliability and quality of supply CAPEX which influences the return on capital employed and depreciation included in tariff calculation is agreed by energy enterprises with the President of URE in the network development plans The energy enterprises involved in the transmission or distribution of electricity prepare network development plans for their area of operation in terms of satisfying current and future demand for electricity for a period not shorter than three years excluding the TSO preparing the plan for a ten-year period and DSOs for at least five years The plans are updated every three years The energy enterprises involved in the transmission or distribution of gaseous fuels are obliged to draft network development plans for their area of operation in terms of satisfying current and future demand for gas In the case of the TSO the plan is drafted for a ten-year period while in the case of DSOs for five-year period The plans of the TSO and DSOs are updated every two years excluding plans of the TSO pertaining to entrusted transmission networks which are updated on yearly intervals Currently such case applies only to Yamal Transmission Network which is entrusted by SGT EuRoPol GAZ SA (the owner) to OGP Gas-System SA (TSO) under the ldquoISOrdquo unbundling model It might be added that development plans are elaborated in case of distribution and transmission systems pertaining to natural gas but also to other gaseous fuels
Ref C20-IRB-54-03
CEER Report on Regulatory Frameworks for European Energy Networks 2020
100156
223 Portugal Gas TSO Gas DSO Electricity TSO Electricity DSO
Ma
rke
t
str
uc
ture
Network operators
1 (REN) 11 1 (REN) 1 (EDP)36
Network length
1375 km 18987 km 9002 km 226530 km
Ownership Private ownership
Ge
ne
ral
fra
me
wo
rk
Authority Entidade Reguladora dos Serviccedilos Energeacuteticos (ERSE)
System Price-cap (OPEX) and rate of return
(CAPEX)
Price-cap (OPEX) and rate of return
(CAPEX)
Price-cap (OPEX) and standard
costsrate of return (CAPEX)
Price-cap and rate of return (HVMV) and TOTEX (LV)
Period 4 years (current period 2020-2023) 3 years (current period 2018-2020)
Base year for next period
Last real year
Transparency Tariff code Tariff board and Tariff documents
Main elements for
determining the revenue
cap
Non-controllable and controllable
costs RAB WACC efficiency
benchmark inflation mechanism for
attenuation of tariff adjustments
Non-controllable and controllable
costs RAB WACC efficiency
benchmark inflation
Non-controllable and controllable costs RAB WACC efficiency benchmark
inflation incentives general economic interest costs
Legal framework
Decree-Law No 2312012 of 26 October Decree-Law No 215-B2012 of 8 October
Rate
of
retu
rn
Type of WACC Nominal pre-tax
The WACC (Pre-tax) is indexed to the Portuguese 10-year bond benchmark and depends in each year on its evolution with a cap and a floor
Tax rate = 315 Tax rate = 315
Determination of the rate of
return on equity
Capital Asset Pricing Model (CAPM)
The Market Risk Premium=Risk Premium for Mature Market+Country Risk spread
Risk Premium for Mature Market = Spread between SampP500 and USA 10 years treasury bond yields since 1961
Country Risk spread = Spread between Portuguese 10 year bond yields and 10 year bond yields of Germany Finland Austria Netherlands and France
Rate of return on equity
before taxes
67 71 79 85
Initial values for the regulatory period (July 2019)
Initial values for the regulatory period (January 2018)
Use of rate of return
WACC is currently based on 50 debt and 50 equity applied to RAB
WACC is currently based on 55 debt and 45 equity applied to RAB
Reg
ula
tory
as
se
t
ba
se
Components of RAB
Fixed assets deducted from third partiesrsquo contributions
Regulatory asset value
RAB is based on historical and re-evaluated costs
RAB is based on historical costs and
standard costs
RAB is based on historical costs
RAB adjustments
Each year the RAB is adjusted in order to consider new investments write-offs and depreciation
36 Due to the volume of information the table only include data about the regulated distribution network operator of
Mainland Portugal
Ref C20-IRB-54-03
CEER Report on Regulatory Frameworks for European Energy Networks 2020
101156
De
pre
-
cia
tio
ns Method Straight line depreciation
Depreciation ratio
5-45 years 5-40 years 15-30 years 5-40 years
Consideration Part of CAPEX
Introduction In Portugal the regulation of the electricity sector is focused on transmission system management distribution last resort supplier and energy purchase and sale activities In the Autonomous Regions of the Azores and Madeira in addition to those activities the regulation also focuses on the energy acquisition and global system management activity37
In addition to those activities in the natural gas sector (Mainland Portugal only) the regulation also focuses on the global system management activity underground storage activity and reception storage and regasification of LNG activity More recently a new regulated activity has been created the supplier switching activity ERSE is responsible for regulation which encompasses monitoring of markets and infrastructures and annual tariff fixing Historical development The regulation of the electricity sector began in 1999 having undergone a major change in 2007 with the liberalisation of the markets At that time the figure of the last resort supplier was autonomised which until then was under the purview of the distribution network operator In the natural gas sector regulation began in gas year 2007-2008 for the high-pressure activities and in gas year 2008-2009 for the remaining activities In both sectors regulation of regulated activities has been based mostly on incentive regulation (price-cap and revenue-cap) for OPEX and on the application of the rate of return to investments in CAPEX TOTEX approach has also been applied in some activities and standard investment cost in others However throughout the regulatory periods there has been a need to change to other methodologies Therefore there are also other incentives such as incentives for quality of service losses reduction and smart grids as outlined below The main aspects of the type of regulation followed by ERSE are (i) the application of reference costs in the electricity transmission activity from the 2009-2011 regulation period (ii) the modification in 2012 of the price cap methodology applied to TOTEX in the distribution activity to a price cap methodology applied to OPEX and rate of return to CAPEX and (iii) the application of the price-cap methodology to TOTEX in the low voltage distribution activity in the regulatory period 2018-202038 In the Autonomous Regions the definition of reference costs for fossil fuels consumed in electricity generation in the energy acquisition and the global system management activity should also be highlighted as well as the application of an incentive regulation to the three activities of the Autonomous Regions from the 2009-2011 regulatory period 39
37 The electricity generation activity in the Autonomous Regions of the Azores and Madeira is regulated and is not
liberalised because these regions benefit from a derogation from the application of Directive 200354 EC 38 TOTEX approach was applied into distribution activity between 1999 and 2011 39 In the activity of Energy Acquisition and Global System Management incentive regulation only started in 2012
Ref C20-IRB-54-03
CEER Report on Regulatory Frameworks for European Energy Networks 2020
102156
In natural gas at the beginning of the regulatory period 2016-2017 to 2018-2019 a mechanism was introduced to transmission and distribution activity that seeks to mitigate the effects associated with the volatility of demand in the amount of allowed revenues to be recovered by tariffs In the same period for the reception storage and regasification of LNG activity and subterranean storage activity a mechanism was applied to mitigate tariff adjustments recognising the positive externalities that this activity brings to all of the Natural Gas National System In the global system management activity regulation changed from an accepted cost model to an incentive regulation model (revenue cap) In natural gas a new regulatory period started in 2020 and goes to 2023 It was the first time that a regulatory period of four years was defined In addition the regulatory period coincides with the calendar year instead of the gas year (from June of one year to July of the following year) The main changes for this new regulatory period were differentiation in the investments with cost recovered though tariffs according to their nature and taking into account the fulfilment of their initial objectives sharing between companies and consumers of the results of efficiency targets application improvements in the reporting of audited information for regulatory purposes and the extinction of the mechanism applied to distribution activity to mitigate the effects associated with the volatility of demand Regulatory Process ERSE is responsible for preparing and approving the Tariff Code which establishes the methodology to be used for calculating tariffs as well as the ways to regulate the allowed revenues The approval of the Tariff Code is preceded by a public consultation and an opinion from ERSEs Tariff Board ERSErsquos tariff-setting process including its time frame is also defined in the code The allowed revenues of each regulated activities are recovered through specific tariffs each with its own tariff structure and characterised by a given set of billing variables The methodologies and parameters for the tariff calculation are evaluated and fixed at the beginning of each regulation period to be applied during that period Determining allowed revenues The allowed revenues are calculated based on the information sent annually by the regulated companies real audited data and estimated data At the beginning of each regulatory period the companies send their cost forecasts for the entire new regulation period The ldquocost basesrdquo considered in the price-cap and revenue-cap methodologies result from critical analysis of the companiesrsquo operating costs (net of additional income) controllable and non-controllable costs and investment costs It should be noted that there are other costs that are allowed outside the ldquocost basesrdquo therefore not subject to efficiency this is the case for concession rents and actuarial gains and losses The definition of efficiency targets with the objective of reducing controllable costs is based on international and national benchmarking studies through the application of parametric and non-parametric methods Specifically the Corrected Ordinary Least Squares (COLS) and Stochastic Frontier Analysis (SFA) methodologies are used in the parametric models and the Data Envelopment Analysis (DEA) methodology is used in the non-parametric models Regarding investments in addition to the analysis of the values sent by the companies each year ERSE also takes into account the Development and Investment Plan prepared every two years by each sectorrsquos transmission and distribution network operators in HVMV
Ref C20-IRB-54-03
CEER Report on Regulatory Frameworks for European Energy Networks 2020
103156
In addition to the definition of the accepted costs incentives are also defined For the electricity distribution activity these consist of incentives for quality of service losses reduction and for investments in smart grids Recently ERSE has defined a new output-based incentive which aims to lead the DSO to deliver to consumers value-added services enabled by smart grids The amount of this incentive is based on the sharing between the DSO and consumers of the benefits generated by such services To access it the DSO must demonstrate that it provides a package of ldquokey smart-grid servicesrdquo For the electricity transmission activity there is an incentive for efficient investment in the transmission network through the use of reference prices in the valuation of the new equipment to be integrated in the network and an incentive to increase the availability of the elements of the transmission network In the current regulatory period the incentive for the maintenance of end-of-life equipment was replaced by incentives to economic rationalisation of costs Asset base remuneration The remuneration of the asset base is calculated using a pre-tax nominal WACC The methodology used for setting the cost of equity is the Capital Asset Pricing Model and the cost of debt is set using a default spread model where a spread (debt premium) is added to the risk-free rate Due to some uncertainty remaining and volatility of the financial environment the rate of return is updated ex-post each year in order to reflect the evolution of financial market conditions The WACC (pre-tax) to be applied in the regulatory period is indexed to the Portuguese 10-year bond benchmark and depends each year on its evolution with a cap and a floor The floor is 450 for the electricity TSO and 475 for an electricity DSO The cap is 950 for the electricity TSO and 975 for an electricity DSO The floor is 450 for the gas TSO and 470 for a gas DSO The cap is 880 for the gas TSO and 900 for gas DSO For the electricity regulatory period 2018-2020 a 075pp (percentage points) premium is added to the electricity TSO WACC for investments after 2009 when their cost is considered efficient using a methodology where real and standard costs for those investments are compared
ROE parameters Portugal
GasElectricity Gas Electricity
TSO DSO TSO DSO
Risk free rate (nominal) 057 057 100 100
Tax rate 3150 3150 3150 3150
Equity risk premium 650 650 766 766
Equity beta 062 066 058 063
Cost of equity (before taxes) 668 708 794 850
Ref C20-IRB-54-03
CEER Report on Regulatory Frameworks for European Energy Networks 2020
104156
Allowed revenue adjustments The allowed revenues from each activity are adjusted after two years based on real audited values For price-cap and revenue-cap methodologies the adjustments made result from changes in the level of cost drivers In energy purchase and sale activities given their more volatile nature the adjustments are made after one year based on estimated values Costs accepted outside the cost base are also recalculated on the basis of actual values For the natural gas sector all activities undergo adjustments at the end of one year (estimated adjustment) and at the end of two years (actual adjustment) The values of the actual adjustments are deducted from the estimated adjustments in the activities where this calculation is made The values of the adjustments are incorporated into the allowed revenues of the year with the appropriate financial update National Specificities In the electricity sector there are regulated activities in Mainland Portugal and the Autonomous Regions while in the natural gas sector they operate only in Mainland Portugal In addition to the electricity distribution network operator in HVMV and LV there are ten LV distribution network operators that operate locally In the electricity sector 13 of allowed revenues recovered through tariffs are costs arising essentially from political decisions the so-called General Economic Interest Costs (CIEGs) In the natural gas sector the distribution activity is licensed by different geographic areas but is subject to the same regulatory methodologies As mentioned in the natural gas sector at the high-pressure level mechanisms have been created to mitigate extreme volatility of demand when it occurs
Ref C20-IRB-54-03
CEER Report on Regulatory Frameworks for European Energy Networks 2020
105156
224 Romania Gas TSO Gas DSO Electricity TSO Electricity DSO
Ma
rke
t s
tru
ctu
re Network
operators 1 36 1 8 (concessionaires)
46 (non-concessionaries)
Network length 13381 km 51015 km 8897 km
326241 km (+167204 km - final
connections)
Ownership Private and public
ownership Private and public
ownership Mainly public
ownership
Mainly private investors indirect public ownership
Ge
ne
ral
fra
me
wo
rk
Authority ANRE (National Regulatory Authority for Energy)
System Incentive Regulation Revenue cap Revenue cap Revenue cap Price cap Cost+
Period Generally 5 years current period 2019-2023(DSO) - 5 years current period July2012-Sept2019 (TSO) -7 years next period Oct 2019-Sept 2023
5 years current period
2020 - 2024
5 years current period
2019 ndash2023
Base year for next period
last year of current regulatory period 5th year in current regulatory period
Transparency Tariffs methodologies approved revenues and tariffs general rules for efficiency art
29 and 30 requirements of Reg (EU) 4602017
Tariffs methodologies approved tariffs general rules for efficiency
Main elements for determining
the revenueprice
cap
Non-controllable (pass-through) and controllable costs efficiency factor general inflation rentability of RAB
(RABxRoR) depreciation technological consumption
Non-controllable and controllable OPEX variable costs RAB depreciation rentability of RAB (RABxWACC)
Legal framework Energy and Gas Law 1232012
ANRE Order 2172018 for distribution activity and Order 412019 for transmission
activity
Energy and Gas Law 1232012
ANRE Order no 1712019
Energy and Gas Law 1232012 ANRE Ord no 1692018 and
Order no 1682018
Rate
of
retu
rn
Type of WACC Nominal WACC post-tax determined using CAPM method
WACC is used in determination of rate of return
Real Pre-TAX
Determination of the rate of
return on equity
WACC = CCPKp(1 ndash T) + CCIKi () CCP - equity cost of capital real post-tax () CCI ndash loan capital cost pre-tax () Kp ndash weight of equity capital in total capital Ki ndash weight of loan capital in total capital Ki=(1-Kp) T ndash rate of income tax for regulated period
Sum of risk-free rate and a market risk premium multiplied with beta
Rate of return on equity before
taxes
69 approved by
the government from April 2019
until 29 April 2020 566 for 30 April-
12 May 2020 RRR=639 for 13 May-until the end of the regulatory period namely
December 2023 The rates of 566
and 639 were approved by
ANRE
69 approved by the government from
April 2019 until 29 April 2020 566 for
30 April-12 May 2020
RRR=639 starting from 13 May-until the end of the regulatory
period namely September 2024
The rates of 566 and 639 were
approved by ANRE
RRR=69 approved by the
government starting with April
2019 Starting on 13 May
2020 ANRE approved a new
value for RRR=639
RRR=566 approved by ANRE from January until
March 2019 RRR=69
approved by the government
starting with April 2019 Starting on
13 May 2020 ANRE approved a
new value for RRR=639
Ref C20-IRB-54-03
CEER Report on Regulatory Frameworks for European Energy Networks 2020
106156
Use of rate of return
Granted for initial RAB (privatisation value) existing assets and new assets
- RAB value at the beginning of each regulatory period (Remaining value of initial privatisation RAB and the other existing assets) is multiplied with RoR an included in the regulated revenue
- Beginning with the 2nd year of the regulatory period each year new entries are multiplied with RoR and included in the regulated revenue
Granted for initial RAB (privatisation value) for existing assets and for new
assets RRR is multiplied with whole RAB Debt and equity percentages are 4060
Reg
ula
tory
as
se
t b
ase
Components of RAB
Fixed assets working capital
Historical costs multiplied with index costs
Investments in new assets after the base year led to an adjustment of the CAPEX
Regulatory asset value
The RAB value consists in historical assets value and value of the new investments
The value of the new investments included in RAB is considered to be the accounting
value For each year of the regulatory period the RAB value increases with the investment in new assets and decreases
with depreciation and the value of the asset that exits before complete depreciation
The assets of the base year used as initial RAB For each year of the regulatory
period the RAB value increases with the investment in new assets and decreases
with depreciation and the value of the asset that exits before complete
depreciation For RAB existing on 1 January 2005 or the privatisation date it was a fair value of the assets updated with inflation For the rest of the assets based on historical costs updated with
inflation
RAB adjustments
Investments in new assets after the base year and assets that exit before complete
depreciation led to an adjustment of
the CAPEX
Investments in new assets after the base year and assets that exit before complete depreciation led to
an adjustment of the CAPEX
The plus value that resulted from the
revaluation of assets but limited
to RAB adjusted with
CPI
RAB adjusted with CPI but limited by the current value of
the assets
Dep
rec
iati
on
s
Method Straight line
Depreciation ratio
Depending on asset type Buildings 50 years
Pipes and technical inst 40 years Other between 7 and 20 years
Land not included
Depending on asset type Ratio between 2 and 166 eg
lines amp cables 25-10 stations 2
Consideration Part of regulated revenue The depreciation calculated for the
previous year asset entries is directly and 100 integrated into the regulated
revenues Afterwards when the tariff adjustments are made the depreciation
already included in the regulated revenues is adjusted with inflation rate
Part of regulated revenue Depreciation is included directly and 100 in revenue
before the linearisation
Introduction The Romanian Energy Regulatory Authority (ANRE) is the regulatory authority responsible in Romania for approving methodologies and tariffs for electricity and gas networks For electricity ANRE is responsible for regulating the Romanian TSO (there is only one) eight operators holding the concession of distribution service (ODCs) and other distribution operators (ODs)
Ref C20-IRB-54-03
CEER Report on Regulatory Frameworks for European Energy Networks 2020
107156
For gas ANRE is responsible for regulating the Romanian TSO (there is only one) and 31 operators holding the concession of the distribution service (DSOs) Historical Development An incentive-based regulatory regime was introduced in 2005 for the two TSOs (for setting transmission tariffs) and ODCs The methodology for setting electricity transmission tariffs uses a revenue cap regulatory system ANRE uses a price cap methodology (tariffs basket cap) for setting electricity distribution tariffs applied by ODC For ODs (other electricity distribution operators then concessionaires) a cost-plus methodology is in force For setting regulated gas tariffs starting in 2019 ANRE uses for both distribution and transmission activities a revenue cap methodology Determining the RevenuePrice Caps For electricity the revenueprice caps for electricity network operators (the TSO and ODCs) are set for a five-year regulatory period The current regulatory period is from 2020 to 2024 for transmission and from 2019 to 2023 for distribution Each revenue cap is composed of the non-controllable operating and maintenance costs controllable operating and maintenance costs (applying an efficiency factor for reducing inefficiencies) costs of electricity losses costs of RAB depreciation and rentability of the RAB (RAB x WACC) There are efficiency requirements for controllable OPEX and for costs of electricity losses WACC is set in the reference year for the next regulatory period and can be updated during the regulatory period in order to reflect the evolution of the financial market conditions The following assets are eliminated from evaluating the RAB
bull Grants fees received from new customer connections
bull Assets which are conserved and assets that are still under construction and
bull Inefficient investments and other that do not follow the prudence criteria provided by regulations
For gas the revenue cap for the TSO and DSOs are set for a five-year regulatory period Each revenue cap is composed of the controllable (applying an efficiency factor for reducing inefficiencies) and non-controllable (pass-through) costs technological consumption costs costs of the RAB depreciation rentability of RAB (RAB x RoR40) and general inflation Efficiency Requirements Electricity The level of controllable operating and maintenance costs (controllable OPEX) for the first year of the regulatory period is set by ANRE based on an efficiency benchmarking An efficiency requirement (X-factor) is applied on controllable OPEX during the regulatory period An X-
40 Rate of Return
Ref C20-IRB-54-03
CEER Report on Regulatory Frameworks for European Energy Networks 2020
108156
factor equal to 2 is applied annually to the controllable OPEX for transmission in the current regulatory period For distribution (ODC) the X-factor is 2 for the regulatory period 2019-2023 For the level of electricity losses recognised in tariffs ANRE imposed targets at the beginning of the regulatory period that have a declining trend during the regulatory period For the electricity price recognised for acquiring the energy required to cover electricity losses ANRE considers a limit equal to the average of the prices recorded by ODC The investment plan for the entire regulatory period is verified in terms of necessity opportunity efficiency cost of investments The structure of the plan is also verified and the plan is approved ex-ante by ANRE The estimated benefits that justify the efficiency of every investment in electricity network is evaluated ex-ante and also ex-post by the network operator and reported to ANRE ANRE removes from the RAB the investments that prove ex-post to be inefficient because the expected benefits are not confirmed Gas The level of controllable and pass-through costs for the first year of the regulatory period is set by ANRE based on the analysis performed on the cost submitted by the TSO and DSOs An efficiency factor (X-factor) is applied on controllable OPEX during the regulatory period For distribution (DSO) the X-factor is set to 1 for each year of the regulatory period 2020-2023 For transmission (TSO) the efficiency was set to 15 for each year of the fourth regulatory period (1 October 2019 to 30 September 2024) Price Development The revenuetariffs basket caps take account of the development of consumer prices in relation to the base year (CPI-X regime) General price increases lead to an increase in the revenue cap Regulated tariffs for gas are yearly adjusted within each regulatory period and consideredreflected in the regulated prices Quality Regulation ANRE sets quality indicators for service quality and reliability for electricity and gas For electricity distribution there are also set minimum levels for individual indicators like number and duration of interruptions in power supply The distribution operator must pay compensation to the users of the grid when the minimum levels imposed are exceeded Compensation paid by the operator are not justified costs to be recognised in regulated tariffs Adjustments After the Reference Year Each year ANRE calculates revenue corrections due to inflation investment non-controllable (pass-through) operating and maintenance costs changes in energy volumes and losses (quantity and price of losses) The value of the revenue correction is included in the revenue used to determinate tariffs for the next year for both electricity and gas For electricity if the accomplished value of annual investments is less than 80 of the predicted value taken into consideration an annual revenue adjustment is made In this way ANRE ensures that unused revenues are recovered as quickly as possible These annual adjustments are considered at the end of the regulatory period for the final corrections
Ref C20-IRB-54-03
CEER Report on Regulatory Frameworks for European Energy Networks 2020
109156
For gas ANRE calculates revenue and tariff corrections due to differences in total revenue generated by volumes variations inflation investment pass-through costs and technological consumption Transparency The data published on the ANRE website include the tariffs and an informative note with details on the analysis used for calculating the revenue caps and annual adjustments For gas ANRE publishes on its website the tariffs for each operator (TSO and DSOs) Outlook For all regulated activities electricity distribution and transmission and gas distribution and transmission ANRE approved new methodologies starting with the fourth regulatory period The aim is to harmonise the provisions of the four methodologies For gas distribution activity the methodology has been changed from price cap to revenue cap and for gas transmission activity the methodology was modified in order to comply with article 26 requirements of Reg (EU) 2017460
Ref C20-IRB-54-03
CEER Report on Regulatory Frameworks for European Energy Networks 2020
110156
225 Slovakia Gas TSO Gas DSO Electricity TSO Electricity DSO
Ma
rke
t
str
uc
ture
Network operators
1 1 1 3
Network length 2332 km 33300 km 3008 km 94790 km
Ownership Private and public Private and public Public Private and public
Ge
ne
ral
fra
me
wo
rk
Authority UacuteRSO
System Benchmarking Price cap
Period 5 years 2017 - 2021
Base year for next period
TBD
Transparency Price decrees determining the tariff methodology Price decisions published
Main elements for determining
the revenueprice
cap
Analysis of entry-exit tariffs in other Member States of
the EU
Allowed costs Allowed depreciation RAB WACC
Legal framework
Act No 2502012 Coll on Regulation in Network Industries Act No 2512012 Coll on Energy Industry URSO Decree No 2232016 Coll (gas) URSO Decree No 182017 Coll (electricity)
Rate
of
retu
rn
Type of WACC NAP Real pre-tax WACC
Determination of the rate of
return on equity
NAP Sum of nominal risk-free rate and a risk premium (market risk
premium multiplied by beta factor)
Rate of return on equity
before taxes NAP 1071 = (107 + 666 111) (1 ndash 021)
Use of rate of return NAP
When setting the nominal pre-tax WACC the DE ratio of 6040 was used
The whole RAB is multiplied by the WACC
Reg
ula
tory
as
se
t b
ase Components of
RAB NAP Fixed assets no working capital
Regulatory asset value
NAP
Expertly appraised value of assets
necessarily used for regulated
activities as at 31 Dec 2015
Expertly appraised value of assets necessarily used for regulated activities as
at 1 Jan 2011
RAB adjustments
NAP There is no RAB adjustment taking place during the regulatory
period
Dep
rec
iati
on
s Method
NAP Regulatory depreciation (technical life cycle of assets)
Depreciation ratio
NAP Ratio between 125 and 20
Consideration
NAP A component of target revenue
Introduction The Regulatory Office for Network Industries (URSO) as an independent public authority was established on 1 August 2001 and performs regulation in the sectors of electricity gas district heating and water In September 2012 new acts on regulation in network industries (No 2502012 Coll) and the Energy Act (No 2512012 Coll) came into effect governing the position and powers of URSO The two acts also brought a significant shift in the protection of
Ref C20-IRB-54-03
CEER Report on Regulatory Frameworks for European Energy Networks 2020
111156
market participants as well as in the reinforcing of the Officersquos independence and competences Currently URSO is in the fifth regulatory period (2017 - 2021) which was set at five years In order to harmonise amendments to the primary legislation by the transposition of the Clean Energy Package with the new regulatory policy for the next regulatory period (2023 - 2027) the current regulatory period will be after the adoption of the amendment to the regulatory policy extended by one year The dominant activity of URSO is tariff (price) regulation The scope and manner of its implementation is set out in the implementing regulations in the form of price decrees and the terms and conditions of tariff application are set out in individual price decisions Historical development In 2001 SEPS Slovakiarsquos electricity TSO was unbundled and as a result three vertically integrated undertakings providing electricity distribution electricity supply and services were established In 2013 SEPS was certified based on the ownership unbundling model Eustream the sole gas transmission system operator was certified as an independent transmission system operator (ITO) in 2013 Gas transmission assets were not transferred to the transmission system operator but remained the property of the parent company SPP as SPP-distribuacutecia the only gas distribution system operator which was unbundled from SPP in 2006 The electricity and gas markets were fully liberalised as of July 2007 With entry into the 3rd regulatory period (2009 - 2011) URSO ceased to apply the original revenue cap method and established the incentive regulation principle based on the price cap methodology Since 2012 the three-year regulatory period has been replaced by a more stable regulatory framework with a five-year period Main principles of price regulation The basic principle of regulation of prices (tariffs) approved or set by URSO for the five-year regulatory period applies price cap as a method which guarantees profit only under real efficient business operation and incentivises network operators to reduce their own losses Since 2009 URSO has also regulated the quality of services which focuses primarily on consumer protection Network operators and suppliers must comply with the quality standards set by URSO decree in order for the consumers to receive adequate quality for the price they pay for electricity gas and heat In the event of non-compliance with the quality of supply and services the regulated entity is obliged to pay a compensatory payment to the consumer Additional adjustments during the regulatory period The price decision is valid for the entire regulatory period In the event of a significant change in the economic parameters on the basis of which URSO approved or set the price the regulated entity may request a change in the price decision URSO may also initiate a change in the price decision on its own initiative Basic formula for setting the price cap (electricity) Price cap = [OPEX allowance x (1 + core inflation - efficiency factor) + (RAB x WACC) + depreciation (from RAB + from planned CAPEX for next year) - revenues from connections] forecasted volume
Ref C20-IRB-54-03
CEER Report on Regulatory Frameworks for European Energy Networks 2020
112156
In electricity distribution the price cap is set for each voltage level separately (EHV ndash 110 kV HV - 22 kV LV - 04 kV) Basic formula for setting the price cap (gas) Price cap = [OPEX allowance x (1 + core inflation - efficiency factor) + (RAB x WACC) + depreciation (from RAB) + costs to cover losses and own consumption - revenues from connections] forecasted volume] Gas distribution tariffs are categorised based on a contractually agreed annual volume of distributed gas for each offtake (supply) point and the postage stamp principle is applied Eligible costs Operating costs are optimised through the JPI - X factor where JPI is the core inflation set by the Statistical Office and X is the efficiency factor of 35 If JPI ltX then JPI - X = 0 and overheads up to the amount of overheads in year t-1 are included in the eligible costs in year t Allowed depreciation The price proceeding for each year of the regulatory period will also assess the use of the declared costs for new investments in the form of depreciation Profit A reasonable profit within the price proceeding is multiplication of the RAB and WACC values It shall take into account the scope of the investments required to ensure a long-term reliable safe and efficient system operation an adequate return on operating assets and the stimulation of stable long-term business Regulatory Asset Base The value of the property is referred to as RAB - regulatory asset base RAB (for electricity) was determined on 1 January 2011 and its value is equal to the general value of assets determined on the basis of an expert opinion RAB (for gas) was determined as of 31 December 2015 WACC The WACC value (before tax nominal) is set at a maximum of 647 and is applied constantly throughout the whole regulatory period However if the difference of input parameters entering the WACC calculation exceeds 10 a new WACC value is determined for the relevant year and published on the URSO website by 30 June of the calendar year
WACC pre-tax nominal =119864
119864+119863+
119877119890
1minus119879+
119863
119864+119863 119909 119877119889
T ndash income tax rate for year t E ndash equity D ndash liabilities Rd ndash real price of liabilities for the regulatory period set at 373 (average rate of loans provided to non-financial corporations for a period of five years or more with a loan amount over 1 mil euros) Re ndash real price of equity and liabilities
Re = Rf + βlev x (Rm - Rf) Rf ndash return on risk-free assets for the regulatory period set at 303
Ref C20-IRB-54-03
CEER Report on Regulatory Frameworks for European Energy Networks 2020
113156
βlev ndash is a weighted coefficient β which defines the sensitivity of the companys share to market risk taking into account the income tax rate and the share of liabilities
βlev = βunlev x [1 + (1 minus 119879) 119909119863
119864]
βunlev ndash is an unweighted coefficient without the influence of the income tax rate and the share of liabilities set at 053 DE ndash ratio of liabilities to equity set at 60 in favour of liabilities (Rm - Rf) ndash total risk premium set at 454 Methodology for setting gas transmission tariffs The regulatory framework for gas transmission differs from gas distribution in that it consists of a method of comparing tariffs in EU Member States (international benchmarking) According to the Act on Regulation if there is effective pipeline-to-pipeline competition URSO shall by direct comparison approve or determine comparable prices for access to the transmission network and gas transmission which take the form of tariffs Tariffs are set for individual entry and exit points of the transmission network (entry-exit system) and apply for domestic and foreign users of the transmission network The submitted analysis compares the total average prices for gas transmission including conversion to length units taking into account the relevant distance of entry and exit points of the transmission network costs depreciation and revenues for the provision of services in the transmission networks The method allows TSOs to cover all costs while generating a reasonable profit which enables the company to make new investments required by the gas market develop sufficient flexibility in offering new products and services and adopt measures under EU legislation Tariffs are set for the entire regulatory period their final amount is subject to an annual increase equivalent to the inflation rate
Ref C20-IRB-54-03
CEER Report on Regulatory Frameworks for European Energy Networks 2020
114156
226 Slovenia
Gas TSO Gas DSO Electricity TSO Electricity DSO
Ma
rke
t
str
uc
ture
Network operators
1 13 1 1
Network length ~1174 km ~4740 km ~2890 km ~65400 km
Ownership Public Private and public Public Private and public
Ge
ne
ral
fra
me
wo
rk
Authority Energy Agency
System Incentive regulation Revenue cap
Period 3 years current period 2019-2021
Base year for next period
2nd or 3rd year in current regulatory period (2016 2017)
Transparency bull the methodology determining the regulatory framework and the methodology determining the network charge bull WACC study bull httpswwwagen-rssizemeljski-plin1 bull httpswwwagen-rssielektricna-energija3
Main elements for determining
the revenueprice
cap
Controllable OPEX (general
productivity) uncontrollable OPEX CAPEX (depreciation
regulated return on assets)
consumption incentives
Controllable OPEX (efficiency score
general productivity)
uncontrollable OPEX CAPEX (depreciation
regulated return on assets) incentives
Controllable OPEX (general
productivity) uncontrollable OPEX CAPEX (depreciation
regulated return on assets) losses
ancillary services consumption
incentives
Controllable OPEX (efficiency score
general productivity)
uncontrollable OPEX CAPEX (depreciation
regulated return on assets) losses consumption
incentives
Legal framework Act on the methodology for determining the
regulatory framework of the
natural gas transmission system
operator
Act on the methodology for determining the
regulatory framework of the gas distribution system operator
Act on the methodology determining the regulatory framework and the
methodology determining the network charge for the electricity system operators
Rate
of
retu
rn
Type of WACC Pre-tax WACC nominal (equity share 60 debt share 40) WACC 2019-2021 = 526
Determination of the rate of return
on equity
Cost of equity is determined on the ldquorisk premium modelrdquo (Cost of equity = cost of debt + 2) Cost of debt is 5-years average (2012-2016) for interest rate to non-financial
companies in Slovenia Premium of 2 is the difference between return on equity and cost of debt for Slovenian market
Rate of return on equity before
taxes Cost of equity = cost of debt + premium (368 + 2 = 568)
Use of rate of return
For each year of the regulatory period WACC is applied on the value of the Regulatory Asset Base (RAB)
Reg
ula
tory
as
se
t b
ase Components of
RAB bull Book values of tangible and intangible assets after RAB adjustment bull Ex-ante investments according to development plan bull No working capital no assets under construction
Regulatory asset value
bull Book value for existing assets bull Investment value according to development plan for new assets
RAB adjustments
RAB adjustments are bull value of assets acquired with subsidies and grants bull assets under construction bull value of assets acquired with disproportionate costs for connection to network bull value of assets acquired with congestion income
Ref C20-IRB-54-03
CEER Report on Regulatory Frameworks for European Energy Networks 2020
115156
De
pre
cia
tio
ns Method Straight line
Depreciation ratio For existing assets and new investments
the actual rate of depreciation is taken into account
bull existing assets (actual rate of depreciation depending on asset type) bull planned new investments in energy infrastructure (286) bull planned other assets (5)
Consideration 100 of depreciation is integrated into revenues
Regulation of Electricity Transmission and Distribution Operators The regulation in the regulatory period from 1 January 2019 to 31 December 2021 is carried out on the basis of the Act on the methodology determining the regulatory framework and the methodology determining the network charge for the electricity network operators The methodology for setting the network charge determines the principles of economic regulation of electricity services of general economic interest and sets the eligible costs of the electricity network operators The methodology is based on the regulated network charge with the aim that by setting the network charge and other revenues and taking into account identified deviations from previous years the system operator is to cover all eligible costs of the regulatory period
In establishing the regulatory framework for the period 20192021 the Slovenian NRA the Energy Agency addressed electricity consumption planned development of the infrastructure level of quality of supply eligible costs of the system operators and network charge tariffs for each consumer group The eligible costs of the electricity system operators consist of controlled operation and maintenance costs uncontrolled operation and maintenance costs costs of electricity losses depreciation costs and regulated return on assets The basic controlled operational and maintenance costs are calculated in accordance with requested yearly productivity improvement The yearly productivity improvement consists of planned general productivity and individual productivity For the Transmission System Operator (TSO) only the planned general productivity is used The individual productivity of each Distribution System Operator (DSO) is determined in the benchmark analysis The eligible costs are covered by the network charge and other revenues When determining the resources to cover the eligible costs due consideration is given to the deviations from the regulatory framework in previous years and the planned settlement for a current regulatory period The methodology for assessing the network charge determines the procedures and elements to assess the network charge and to divide consumers into various consumers groups For calculating the network charge the non-transaction postage-stamp method is used which means a system of uniform tariffs for calculating the network charge on the territory of Slovenia within the individual consumer group For the allocation of costs for different voltage levels the gross approach to calculating the network charge for transmission and distribution network is used
The methodology of the regulated network charge is also based on incentives which depend on incurred eligible costs achieved quality of supply level the provision of free ancillary services the acquisition of non-refundable European funds savings in the purchase of smart electricity meters with communications module realised investments in smart grids projects realised pilot projects and a special incentive for innovation
Ref C20-IRB-54-03
CEER Report on Regulatory Frameworks for European Energy Networks 2020
116156
If a system operator achieves higher or lower eligible costs of actually eligible costs this difference is reflected in its income statement Incentives concerning the achieved quality of supply level are determined according to the achieved level of supply continuity from the reference level and are reflected in increased or decreased eligible costs If the system operator provides one or more ancillary services free of charge which is not the result of legislation incentives equivalent to 10 of the saving that equals the amount paid for the ancillary service will be awarded to the system operator If the system operator obtains non-refundable European funds incentives of 05 of the current value of the assets is granted to the system operator in the year when the assets were put into service If the system operator achieves a lower annual average acquisition price than price-cap of smart meters in accordance with the methodology a single incentive of 10 of the realised annual saving is awarded to the system operator If the system operator realises the investments in smart grids that meet the requirements set out in the methodology a single incentive is acknowledged amounting to 3 of the current value of the asset in the year in which the asset was put into service If the system operator fulfils the conditions and criteria for the projects promoting investments in smart grids in accordance with the methodology for these projects pilot tariffs can be used
The electricity system operator must identify deviations from the regulatory framework after each year of the regulatory framework Deviations are established as a difference between planned and actual eligible costs of the system operator and a difference between planned and actual revenue sources which include the identified surplus or deficit of the network charge from previous years The Energy Agency issues a separate decision if it concludes that deviations were not calculated in accordance with the methodology The Energy Agency keeps under review the implementation of the regulatory framework during the regulatory period by monitoring the monthly realisation of the network charge by analysing the criteria of the costs and by calculating deviations from the regulatory framework Regulation of Gas Transmission and Distribution Operators The Energy Agency carries out the regulation in the regulatory period from 1 January 2019 to 31 December 2021 on the basis of the Act on the methodology for determining regulatory framework for the natural gas transmission system the Act on the methodology for determining the network charge for the natural gas transmission operator the Act on the methodology for determining regulatory framework for the natural gas distribution system and the Act on the methodology for determining the network charge for the natural gas distribution operator The methodology for setting the network charge determines the principles of economic regulation and sets the eligible costs of the gas operators The methodology is based on the regulated network charge with the aim that by setting the network charge and other revenues and taking into account identified deviations from previous years the system operator is able to cover all eligible costs of the regulatory period The regulation methodology is based on the method of the regulated annual income and regulated network charges of the TSODSO arising from a determination of eligible costs taking into account (in addition to the network charge) several other factors These other factors include all other revenues as sources for the system operator to cover eligible costs from the previous period the obligation of the TSODSO to transfer the surplus of the network charge and its dedicated use for covering eligible costs in the next regulatory period and the right of the TSODSO when determining the regulatory framework for the following years to take into account the coverage of the network charge deficit
Ref C20-IRB-54-03
CEER Report on Regulatory Frameworks for European Energy Networks 2020
117156
The eligible costs of the gas system operators consist of controlled operating and maintenance costs uncontrolled operating and maintenance costs depreciation costs and regulated return on assets Resources for covering eligible costs are the network charge and other revenues In determining the resources for covering eligible costs the deviations from the regulatory framework of the previous years are duly taken into account
By using the method of regulated annual income and regulated network charges the TSODSO determines the regulatory framework in a way that incorporates the planned annual income the surplus of network charges from the previous years the planned network charge deficit maximum up to the amount of depreciation charge that covers the costs up to the amount of eligible costs for the regulatory period and the corresponding deficit of previous years The TSODSO submits to the Energy Agency the request for granting consent to the regulatory framework network tariff items and tariff items for other services for the relevant regulatory period In the process of issuing approval the Energy Agency assesses the compliance of the proposed eligible costs the network charge and other network charge items with the applicable methodologies
At the end of each regulatory period the TSO must determine the deviations from the regulatory framework The deviations are determined as the difference between actual eligible costs and existing sources for covering eligible costs which include recorded income or the network charge deficit from previous years The Energy Agency issues a special decision when it finds that the deviations are not calculated in accordance with the methodology The Energy Agency monitors the implementation of the regulatory framework during the regulatory period
Three investment incentives are available in the area of electricity and gas If the system operator obtains non-refundable European funds incentives of 05 of the current value of the assets is granted to the system operator in the year when the assets were put into service In gas for a customer who consumes biomethane or synthetic biomethane the network charge for both the TSO and DSOs is reduced up to 20 depending on the portion of biogas in gas consumed The network charge is set to 50 for a filling station for compressed gas for vehicles
Ref C20-IRB-54-03
CEER Report on Regulatory Frameworks for European Energy Networks 2020
118156
227 Spain Gas TSO Gas DSO Electricity TSO Electricity DSO
Ma
rke
t
str
uc
ture
Network operators
1 large TSO (ENAGAS) 1 small
TSO and 12 transport co
19 DSOs that are part of 6 groups
1 TSO (REE)
5 large DSOs (gt90 system
revenues) and 327 small DSO
lt100000 clients
Network length
13749 km (2018) 73950 km (2018) 44173 km (2018) 896562 km (2018)
Ownership Private except for 5 stake of the
State in ENAGAS
Private utilities and investment funds
Private except for 20 stake of the
State in REE
Private 5 large DSO are part of
integrated utilities
Ge
ne
ral
fra
me
wo
rk
Authority CNMC sets revenues from 2020 on methodologies from 20202021 in electricitygas
System Rate of return Incentive Regulation
Period 6 years next 2021-2026 6 years 2020-2025
Base year for next period
For regulatory period (n n+5) review is made with n-1 available data so n-2 data
Transparency CNMC publishes its proposals and final decisions on its website There is a period for a hearing process Final decisions (Circulars) are published in the Official State Gazette
Main elements for
determining the revenue
cap
Investment amp OPEX reference values
RAB rate of return regulatory lifetime of assets revenues for continuity of supply
and extension of assetrsquos lifetime
The allowed revenue of the preceding year changes in the
number of clients changes in the volume of gas
distributed
Investment reference values OPEX reference
values RAB rate of return regulatory lifetime of assets
Incentives
Investment values OPEX values Other
regulated tasks reference values
RAB rate of return regulatory lifetime of assets number of clients Incentives
Legal framework
Law 341998 of the Hydrocarbons sector Law 182014 of 15 October
Law 242013 of the Electricity sector Circulars 22019 52019 62019 72019
Rate
of
retu
rn
Type of WACC Nominal post-tax WACC
Determination of the rate of
return
Electricity transmission and distribution CNMC has calculated the Rate of Return by using WACC It will be 6003 in 2020 and 558 over 2021-2025 Nominal pre-tax Gas transmission The current rate of return is set at 509 (the average yield on 10-year Bonds in the 24 months before the entry into force of the legislation plus a spread of 50 bp) An additional remuneration term (ldquoRemuneration for the continuity of supplyrdquo) increases the implicit return on gas transmission assets For the next regulatory period (2021-2026) CNMC has calculated the Rate of return by using the WACC formula Gas distribution a rate of return of 10-year Bond plus a spread of 150 bp was set in 2002 and from then on a parametric remuneration formula applies
Rate of return on equity
before taxes 640 = 297 + 072 475 (Electricity TSO amp DSOs)
Use of rate of return
Rate of return is applied (nominal pre-tax) on RAB in Gas TSO Electricity TSO and Electricity DSO A rate of return was set for gas distribution in 2002 and from then on a parametric remuneration formula applies
Reg
ula
tory
as
se
t b
ase
Components of RAB
Fixed assets (No working capital no assets under construction)
Regulatory asset value
Electricity depending on commissioning year Replacement cost Average between audited costs and Investment reference values Audited costs with some limitations For
TSO unique facilities and DSOTSO pilot projects Audited costs Gas transmission average between audited costs and investment reference values Audited costs for unique facilities Gas distribution RAB based on the inflated gross
investment value of assets in 2000 since then the parametric formula applies
RAB adjustments
Assets built year n-1 are added year n
RAB defined in 2002 and then
parametric formula
Assets built year n-2 are added year n
Assets built year n-2 are added year n
Dep
re-
cia
tio
ns Method Straight Line
Depreciation ratio
Generally 25 (Lines Cables Substations Transformers transmission pipelines) For gas distribution assets a 5 depreciation ratio was set in 2002 since then the
parametric remuneration formula applies
Consideration 100 of Depreciation is integrated into the revenues
Ref C20-IRB-54-03
CEER Report on Regulatory Frameworks for European Energy Networks 2020
119156
General facts Six-year regulatory periods are established for both electricity and gas activities Regulatory parameters are not updated by price indexes within the regulatory period Royal Decree Law 12019 gives CNMC (Spanish NRA) powers to set revenues and tariffs which was previously done by the Ministry Consequently CNMC has published new regulation to set revenues for gas and electricity TSOs and DSOs for the following regulatory periods (2020-2025 for electricity and 2021-2026 for gas) As changes in electricity apply from 2020 this chapter has been updated for electricity Electricity Transmission and Distribution Electricity DSO and TSO receive remuneration for investment (CAPEX) OampM (OPEX) and other regulatory tasks (only DSO) In addition they have incentivespenalties that can result in increased or decreased revenues depending on their performance A new regulatory period started in 2020 Investment remuneration (CAPEX)
Regulatory Asset Base (RAB) The RAB is updated every year by adding new investments and subtracting depreciation Assets under construction and working capital are not included in the RAB Subsidies and assets built or financed by third parties are also excluded When assets end their regulatory lifetime they are taken out of the RAB and stop receiving revenues for investment Assets commissioned in year n start receiving revenues in year n+2 To take this into account the RAB is increased by (1 + Rate of Return) ^(remuneration delay factor) This factor is calculated for each asset for TSOs while it is equal to 15 for DSOs
TSO
bull The RAB was set by taking into account the value of assets built before 1998 as a whole not asset by asset with an ldquoimplicit valuerdquo method
bull For assets built from 1998 to 2014 the RAB was set at replacement cost asset by asset taking into account the remaining regulatory asset lifetime of each asset
bull For assets built from 2015 onwards the RAB is calculated as the average between audited costs and investment reference values Therefore 1) If the TSO is able to build an asset at a cost below its reference value it retains half of the difference in the RAB as a reward but limited up to the 125 of the cost 2) On the other hand if the asset is built at a cost above the reference value only half of the difference will be taken into account in the RAB but limited to 125 of the reference value For assets built from 2018 onwards if the cost is higher than the reference value divided by 085 the transmission company has to submit a technical audit justifying the high costs
For unique TSO facilities such as international interconnectors or submarine cables connecting islands or to the mainland just audited costs are taken into account due to lack of reference values There are specific investment reference values for the TSO assets in the isolated energy systems of the Canary and Balearic Islands
DSO
bull For assets built until 2014 the RAB was set at replacement cost by multiplying the existing physical assets by the investment reference values for each asset type with an efficiency factor subtracting subsidies and assets built or financed by third parties This value was calculated for all RABs as of 31 December 2014 in aggregated terms
Ref C20-IRB-54-03
CEER Report on Regulatory Frameworks for European Energy Networks 2020
120156
taking into account the proportion of investments pending to recover in the statutory accounts of each DSO
bull For assets built from 2015 to 2017 the RAB is calculated as the average between audited costs and investment reference values If audited costs are lower than reference values only up to +125 of audited costs are considered
bull For assets built in 2018 RAB is calculated as the average between audited costs and investment reference values If audited costs are higher than reference values only up to +125 of reference values is considered if audited costs are lower than reference values only up to +125 of audited costs are considered
bull For assets built from 2019 onwards RAB is calculated considering the audited costs This introduces flexibility for companies in which type of assets to invest and allows them to make decisions based on technical reasons in order to adapt grids to the challenges of this period (digitalisation distributed generation and electrical vehicle) Nonetheless an adjustment is performed every three years in aggregated terms to set some limits average costs for each type of asset from year n-4 to n-2 are compared with investment reference values If they are higher than 105 there is a negative adjustment of 50 of the difference In contrast if costs are lower than 09 there is a positive adjustment of 50 of the difference
bull There are two specific terms in the RAB that account for investments in control centres remote control communications and in land where electrical assets are built after 1 January 2015 For them the RAB is based on audited costs
Depreciation (TSO amp DSO) RAB is recovered by a straight-line depreciation value Regulatory Asset Lifetime is set at 40 years for most assets (lines transformers etc) and 12 years for control centres Rate of Return (TSO amp DSO) Net RAB pending to recover is multiplied by the Rate of Return The Rate of Return has been calculated by using the WACC formula for this regulatory period (2020-2025) resulting 558 As it was set at 6503 previously it was exceptionally 6003 in 2020 so that the decrease per year is lower than 50 bp then dropping to 558 for 2021-2025 The CAPM model is used for the rate of return on equity Risk-free rate is the 10-year Spanish government bond beta coefficient is obtained as the average beta from a peer group of utilities Market Risk Premium is obtained from the DMS reportrsquos data for European countries The cost of debt is calculated as the average of IRS 10-year + CDS 10-year of the utilities in the peer group In the case that there were not CDS for a company its debt bonds (8-12 years) are used instead of IRS + CDS The proportion between debt and equity is set as the optimal regulatory gearing ratio -50 ndash but also taking into account the values of the peer group Operation amp Maintenance remuneration (OPEX) The TSO receives an allowance for OPEX that is calculated by multiplying the number of physical assets of each type by the OPEX reference values plus an efficiency term which allows TSO to retain part of the efficiencies gained in the previous regulatory period During the regulatory period the TSO has an incentive to operate and maintain the grid below reference values For TSO unique assets only unique OPEX values may apply There are also specific OPEX reference values for TSO assets in the isolated energy systems of the Islands
Ref C20-IRB-54-03
CEER Report on Regulatory Frameworks for European Energy Networks 2020
121156
DSOs receive an allowance for OampM (OPEX) included into a term named lsquoCOMGESrsquo which comprises OPEX and also a small part of investments not included in the electricity assets that have reference values It is updated within the regulatory period with a factor that establishes a proportion between this term and the investments in electric assets that have reference values An efficiency factor also adjusts COMGES to reflect the companyrsquos capacity to manage lsquoCOMGESrsquo costs Remuneration for the extended regulatory lifetime of assets (TSO amp DSO) Assets which regulatory lifetime has expired receive increased OPEX reference values to incentivise that they are kept under operation The increasing factor is 30 the first 5 years ranges from 30 to 35 from 5 to 10 years then from 35 to 45 from 10 to 15 years and after 15 years it keeps rising by 3 per year until it reaches 100 Remuneration for other regulated tasks (DSO only) DSOs receive the following revenues to perform other regulated tasks (1) metering (2) helping clients contract electricity revenues to support invoicing and to reduce non-payments by clients (3) Responding to telephone calls from clients (4) grid planning and (5) revenues to cover overhead costs Each type of revenues for other regulated tasks is calculated as a reference value multiplied by the number of clients There are different reference values for the first 1000 clients the first 10000 clients the first 100000 the first 1000000 the first 5000000 clients and above 5000000 clients DSOs are incentivised to perform these tasks at lower costs than those established as reference values per client as they retain the difference There is also a bonus term that takes into account the performance of the company in the previous regulatory period compared with an efficient company Incentivespenalties TSOs have an Incentive to maximise grid availability (-35 +25) DSOs have incentives to reduce grid losses (-2 +1 in 2020 and 2021 and to be determined later) and to improve quality of supply (-2 +2 the first 3 years and -3 +3 the last 3 years of the regulatory period) Penaltiesrsquo limits for quality of supply can be multiplied by 2 if the indicators are under a certain limit for 2 or more consecutive years An incentive to detect fraud (0 +15) will be also applied in 2020 and 2021 it will be later integrated into the incentive to reduce grid losses There is also a financial prudence penalty (after 2023) for both the TSO and DSOs with more than 100000 clients if a companyrsquos economic and financial ratios do not meet the recommended values of Communication 12019 It is limited to 1 of total revenues Gas Transmission and Distribution The current regulatory period ends 31 December 2020
TSO The current remuneration for the primary transmission network takes into account two components remuneration of availability and remuneration of continuity of supply The remuneration of availability includes OampM costs depreciation and financial remuneration calculated by applying the rate of return to the annual net value of the investment Regulatory Asset Base (RAB) For facilities commissioned before 2002 the assets value after the revaluation of 1996 (Royal Decree-Law 71996) minus subsidies received to finance these assets is considered For new facilities brought into service since 2002 the standard value of each investment set by the regulator is used while those investments that entail expansion are measured at actual cost Transport facilities brought into service since 2008 are valued at the average of the reference value and actual cost (audited)
Ref C20-IRB-54-03
CEER Report on Regulatory Frameworks for European Energy Networks 2020
122156
Depreciation The RAB is recovered by a straight-line depreciation value Regulatory lifetime is set at 40 years for all pipelines and 30 years for other transmission assets Rate of return The current rate of return is set at 509 For the next regulatory period the WACC formula will be used for the Rate of Return calculation Remuneration for Operation amp Maintenance (OPEX) Remuneration is based on technical characteristics by using reference OampM values Remuneration for continuity of supply It is a remuneration assigned to the following activities transmission regasification and underground storage which is then distributed to all facilities of each activity while they are in operation according to their standard replacement investment value The global remuneration is calculated on a yearly basis based on the prior-year remuneration multiplied by an efficiency factor and the changes in total national demand for gas Therefore it can be considered that the financial remuneration is made of two terms an explicit financial return (509 on the net value) and an implicit financial return obtained from the remuneration for continuity of supply Once the regulatory lifetime of the facilities has ended if the asset continues in operation the remuneration is calculated as OampM costs increased by a coefficient DSO The current remuneration has its origins in 2002 when it was established according to the real investments and operating costs of the Spanish distribution companies in 2000 The initial annual remuneration base was calculated for 2000 taking into account the following remuneration blocks Financial remuneration a rate of 677 (equivalent to a 10-year Spanish bond + 150 bp at that time) was applied to the inflated gross investment value of regulatory asset base in 2000 The RAB was obtained assuming the gross investment value of assets of 1996 updated to 2000 since this was the last balance sheet revaluation available Amortisation based on the gross asset investment costs in 2000 divided by the useful economic life of assets (20 years) Annual operating costs based on the accounting data from the industry players In a second step 2000 values were brought forward to 2002 This update was made taking into account the inflation rate and the average national demand growth over the period 2000-2002 adjusted with an efficiency factor of 07103 The remuneration of incremental distribution activities from 2002 to 2014 was based on the yearly updating of initial revenues set for 2002 according to a parametric formula that remunerated the increase (or loss) on new points of supply and delivery of higher (or lower) volumes of gas After Law 182014 the overall remuneration was reduced by euro110 million and the revenues are updated on a yearly basis by a parametric remuneration formula This formula calculates annual allowed revenue as the sum of the allowed revenue of the preceding year and additional revenue earned (or lost) during the current year from new points of supply acquired (or lost) and delivery of higher (or lower) volumes of gas In order to incentivise network expansion to non-gasified zones different reference values are used during the first 5 years depending on whether or not customers are in recently-gasified municipalities Additional regulated income (such as regulated inspections activation rights regulated services lines supply renewal revenues meter rents etc) is received by DSOs
Ref C20-IRB-54-03
CEER Report on Regulatory Frameworks for European Energy Networks 2020
123156
228 Sweden Gas TSO Gas DSO Electricity TSO Electricity DSO
Ma
rke
t
str
uc
ture
Network operators
1 6 2 170 (152+18)
Network length 600 km 3 429 km ~15 000 km 554 148 km Ownership
Foreign ownership
Municipality and foreign ownership
State owned (SVK) and private (Baltic
Cable)
State municipality private and foreign
ownership
Ge
ne
ral
fra
me
wo
rk
Authority Swedish energy markets inspectorate Ei
System Revenue cap
Period 4 Year (Current 2019-2022) 4 Year (Current 2020-2023)
Base year for next period
2021 2022
Transparency Information related to decisions are public on the NRAs webpage cost and production data efficiency scores different incentives calculations of the revenue caps and of the
WACC amongst other available data
Main elements for determining
the revenue cap
TOTEX (divided into CAPEX Non-
controllable OPEX and
Controllable OPEX) General efficiency target
of reducing 1 percent of
controllable OPEX annually
TOTEX (divided into CAPEX Non-
controllable OPEX and Controllable OPEX) General
efficiency target of reducing 1 percent
of controllable OPEX annually
TOTEX (divided into CAPEX Non-controllable OPEX and Controllable
OPEX) Incentives for good quality of supply General efficiency
target of reducing 1 percent of
controllable OPEX annually
TOTEX (divided into CAPEX Non-
controllable OPEX and Controllable
OPEX) Incentives for good quality of supply
Individual efficiency benchmark
(reduction of controllable OPEX)
Legal framework
Naturgaslagen (Gas Act) Ellagen (Electricity Act)
Rate
of
retu
rn
Type of WACC Real WACC pre- tax
Determination of the rate of
return on equity
CAPM 119903119890 = 119903119891 + 120573 lowast (119903119898 minus 119903119891) + 119864119909119905119903119886 119903119894119904119896119901119903119890119898119894119906119898
Rate of return on equity
before taxes
For gas in 1137 = (4+ 079 5 + 15) (1 - 021) For electricity in 544 = (09 + 051 668) (1 - 0208)
Use of rate of return
The debt share is derived from market values of European comparison companies that are publicly traded (49 debt 51 equity for electricity and 44 debt 56 equity for
gas)
Reg
ula
tory
as
se
t
ba
se
Components of RAB
Fixed assets divided into Meters pipelines stations storage and
regasification assets (not assets under construction)
Fixed assets divided into Lines Cables Buildings Shuntreactors transformers
switchgear stations cable cabinet control-equipment meters and IT-system (not
assets under construction)
Regulatory asset value
2018 SEK ~69 Billion
2018 SEK ~75 Billion
Replacement values 2018 in SEK
~69 Billion
Replacement values 2018 in SEK
~295 Billion
RAB adjustments
Adjusted for inflation adjustments ex post for new investments and disposals
Dep
rec
iati
on
s
Method Real linear (Straight line) depreciation
Depreciation ratio Meters 25 years
Pipelines 90 years Stations40 years (storage50 years)
Meters 12 years Pipelines90 years Stations 40 years
(Regasification assets 25 years)
In total 17 asset categories and 6
different depreciation times
Typically 60 year for lines and 40 for
cables
In total 17 asset categories and 6
different depreciation times Typically 40 year for lines and 50 for
cables
Consideration The depreciation is fully integrated into the revenue cap
Ref C20-IRB-54-03
CEER Report on Regulatory Frameworks for European Energy Networks 2020
124156
Introduction The electricity and gas networks are examples of natural monopolies as it would be both economically and environmentally unreasonable to have competing infrastructures available for each customer This means that the network operators (DSOs and TSOs) have limited or no competition To be the only seller in a price-inelastic market entails possibility for the operator to increase prices and thereby increase profits To ensure that the network operators do not make unreasonably high profits regulation needs to be in place The Swedish energy markets inspectorate Ei is the NRA responsible for designing the regulation in a way that minimises the welfare losses from monopoly power The main objective with the regulation is to ensure that the network operators do not make monopoly profits while retaining efficient operations of the grid with a good quality of supply In this way high quality and fair prices will be ensured for the customers Ei regulates both the gas and the electricity sector and the size of the regulated operators span from around 10 connections for the smallest operators to over 800000 customers for the largest operators In the electricity market there are currently 170 DSOs and two TSOs in Sweden The Swedish TSOs are Affaumlrsverket Svenska Kraftnaumlt (SVK) and Baltic Cable (BC) With a few exceptions SVK owns and operates all parts of the transmission system Baltic Cable (BC) owns one transmission line connecting the electricity grid between Sweden and Germany All other entities that operate power systems in Sweden are defined as DSOs The 170 DSOs are of varying size and ownership structure (state municipal private and other) and they each have a so-called concession (permission) for the distribution of electricity either for a defined geographical area (in total 152 local DSOs) or for specific lines (in total 18 regional DSOs) The concession means a privilege but also entails several obligations which are governed by laws and a regulation Ei monitors that the network operators follow the existing rules Eirsquos role as the NRA is for example to ensure that customers have access to a power distribution system to provide incentives for cost efficient operation with acceptable reliability and with objective reasonable and non-discriminatory tariffs The gas market is relatively small in Sweden and consists of one TSO Swedegas one storage facility owned by Swedegas (RAB value in SEK ~460 Million at 2015) one regasification facility (RAB value in SEK ~104 million at 2015) and 6 DSOs There is no distribution system for gas in the northern parts of Sweden Historical Development The Swedish electricity market was deregulated in 1996 since then generation and trading of electricity are exposed to competition The network operations in their capacity as natural monopolies are subject to regulation Since the deregulation multiple regulation methods have been implemented One example is that in 2003 a performance-based tariff regulation was introduced where fictive reference networks were used Until 2012 Sweden used ex-post regulation where each year was treated as a regulatory period From 2012 ex-ante revenue cap regulation has been used In the regulation the regulator shall decide on each network operatorsrsquo revenue caps after a proposal from each company The revenue cap shall cover reasonable operational costs and a reasonable return on the assets used in the distribution and transmission A trend in Sweden amongst the DSOs is that the operators merge into fewer and larger companies At the end of the 1950s there were more than 1500 companies and in the early 1980s the number had dropped to 380 companies Today there are under 200 network operators under Eirsquos regulation
Ref C20-IRB-54-03
CEER Report on Regulatory Frameworks for European Energy Networks 2020
125156
Determining the Revenue Caps The regulatory model of Sweden is based on different cost items Firstly there is the division between capital expenditure CAPEX and operating expenditure OPEX The latter cost is in turn divided in controllable and non-controllable OPEX The controllable OPEX is based on data reported from the network operators on historical costs the costs are reduced yearly by an efficiency target (see further on efficiency benchmarking) This requirement to increase productivity is not applied for the non-controllable OPEX The non-controllable OPEX are estimates provided by the network operators prior to the period that are corrected for actual outcome ex post For CAPEX the assessment of the regulatory asset base is the first (and plausibly the most important) part The regulatory asset base is valued by the principle of replacement value for the existing assets and adjusted for age Investments and disposals of assets under the regulatory period is estimated prior to the period and corrected for the actual outcome ex-post Investments and disposals are reported for every 6-month period The norm for rate of return is decided by the method of WACC The different costs are adjusted for inflation to have the same price level Any deviations from the revenue cap will be added to the cap in the next period For the electricity network operators there are incentives for efficient use of the network and to have a good security of supply The security of supply incentive is set as a norm for the period based on historic data on interruption (AIT AIF and CEMI) The data on interruptions after the regulatory period is compared to the historical norm and the return on capital is adjusted in relation to the change of quality The incentive for efficient use of the network has the same outline as the other incentive with a norm set prior to the period that is compared with the actual outcome after the period As indicators for efficient use of the network the average load factor and network losses are used Together the two incentives can affect the yearly return for the network operators with plusmn 33 For the gas network operators no such incentives exist According to Section 51-2sectsect of the Swedish Electricity Act the revenues will be fixed in advance for each regulatory period consisting of four calendar years unless there are special reasons to use another period of time In the decision of the revenue cap the data and methodology used in the determining the revenue cap should be described (3sect) The Electricity Act states that the cap should cover the reasonable costs of conducting grid activities during the supervisory period and provide a reasonable return on capital (equity) needed to carry out the activity Regarding the design of the tariffs the legislation says that ldquoGrid tariffs should be objective non-discriminatory and promote efficient use of the networkrdquo (Section 4 1sect law 2009892) Otherwise the network operators are free to design their tariffs as they please Ei have been given the right to design secondary legislation on how the electricity network operators can structure their tariffs and a project to overlook the tariff structure is ongoing Quality Regulation For electricity there are as mentioned above incentives for efficient use of the network and for good security of supply For the gas market there are currently no quality regulations in place Under a regulatory regime that provides incentives to cut costs there is a risk that operators will refrain from undertaking the necessary investments or measures to achieve the required or potential savings To counter this in the electricity market quality norms are integrated in the cap If norm values for delivery are exceeded (fewer outages than the norm indicates) during the regulatory period the operator will get an increased revenue cap for the coming regulatory period The purpose is to give incentives for future improvement in quality
Ref C20-IRB-54-03
CEER Report on Regulatory Frameworks for European Energy Networks 2020
126156
Operators achieving above-average quality in past years will have an amount added to their cap while operators with comparatively poor-quality levels will have amounts deducted Like the security of supply incentive the regulation includes incentives to reduce network losses and to have a stable average load factor Prior to the period reference values are set for losses and load factor If a company can outperform the reference value they will get an increase in the cap if they preform worse they will get a deduction of the cap The adjustments based on the incentives are calculated annually and are limited to plusmn33 of the operatorsrsquo return on the asset base Beyond this the network operators will need to economically compensate customers for outages longer than 12 hours Outages longer than 24 hours are illegal and when they happen the operators must come up with a plan for it not to happen in the future Every DSO should on a yearly basis submit data to Ei on a customer level For the reliability incentive scheme data about outages between 3 minutes and 12 hours is used (both longer and shorter outages are also reported) Outages above 12 hours are excluded to not punish DSOs twice Efficiency Benchmarking The gas network operators have a general efficiency requirement to annually reduce 1 percent of their controllable OPEX The reason for a general requirement rather than firm-specific efficiency targets is due to the small number of operators In a benchmarking analysis based on only a few operators the results are likely to underestimate the technological level making the operators look more efficient than they are There is also a lot of heterogeneity amongst the Swedish gas network operators making it difficult to compare them to each other The same target is set for the electricity TSOs also due to a lack of comparable operators For the electricity DSOs an efficiency benchmarking model is used to estimate firm-specific potential for efficiency improvements The benchmarking involves assessing the operators individual costs against the services they provide and determining each DSOs cost efficiency compared to the other DSOs In the benchmarking process Ei uses a DEA model to compare the inputs (controllable OPEX and CAPEX) to the outputs (number of customers delivered electricity high and low voltage the highest effect against overhead grid and number of network stations) for the DSOs By the choice of variables some structural differences are accounted for to some extent for example the number of network stations works as a proxy for customer density The calculations are based on the average of four years of historical data The efficiency requirement is based on the controllable OPEX The maximal improvement potential has been set to 30 with a realisation time of eight years (two regulatory periods) and the DSOs get to keep 50 of their realised improvements This results in a maximal requirement (lowering of the revenue cap) of 75 of a DSOs controllable OPEX To also incentivise the relative efficient operators to improve a minimum level have been set to 1 annually of the controllable OPEX Determining the Regulatory Asset Base and Reasonable Return For electricity the regulatory asset bases in Sweden are based on norm-values which is a way to estimate the replacement value for all assets In total there are 17 asset categories in the asset base with six different depreciation times for which the asset base is adjusted before calculating the operators allowed return In Sweden a real linear depreciation method is used to estimate depreciation costs The depreciation times are currently set between 10 to 60 years (with possibilities for the addition of 25 extra lifespan if the assets are functional after their regulatory lifespan) For the gas network operators indexed acquisition values are used
Ref C20-IRB-54-03
CEER Report on Regulatory Frameworks for European Energy Networks 2020
127156
as the primary method to determine the value of the asset base The depreciation times for gas assets are stated in the table above To determinate the rate of return for the network operators a weighted average cost of capital WACC method is used both for electricity and gas The WACC gives allowance for the cost of debt and the cost of equity To calculate an efficient debt ratio European network operators that are publicly traded are observed since they should have incentives to minimise their costs in order to maximise shareholdersrsquo utility The debt part of the WACC is based on the risk-free rate of return and a credit risk-premium based on the ratings for the publicly traded comparison networks To determinate the cost of equity the capital asset pricing model CAPM is used The same European comparison network operators as earlier are used for estimating the beta value while the market risk-premium and the risk-free rate of return are based on Swedish market data Except from this the gas network operators also receive an extra risk-premium due to differences in risk structure than the European comparison network operators no such risk premium exists on the electricity side How to determinate a reasonable rate of return for network operators has been widely discussed in Sweden and the network operators have multiple times appealed Eis decisions and argued for a higher rate of return For the electricity regulation period 2020-2023 the government have decided on new legislation on how to determine a reasonable rate of return and added more differentiated depreciation time for network assets this has lowered the real WACC pre-tax to 216 from previous 585 For the gas network operators where no such regulation exists Ei has decided on a real WACC before tax on 652 for the regulatory period 2019-2022 based on previous rulings in court Transparency Information guides to reporting and how to calculate the revenue cap along with Eirsquos calculations and decisions are published on the webpage of the NRA
Ref C20-IRB-54-03
CEER Report on Regulatory Frameworks for European Energy Networks 2020
128156
3 Economic Theory and the Regulatory System In the past cost-based regulation approaches (rate-of-return regulation or cost-plus regulation) were widely used for tariff regulation purposes The rate-of-return model guarantees the regulated company a certain pre-defined rate of return on its regulatory asset base Another approach is cost-plus regulation in which a pre-defined profit margin is added to the costs of the company Evidently the regulated company has no incentive to minimise its costs under a cost-based regulation framework because it can increase its profits by simply expanding the asset or cost base Under cost-plus regulation a company may have an incentive to signal incorrect costs to the regulator or to even opt for wasting resources in order to increase the cost base (ldquogold-platingrdquo) As a response to the major drawbacks of the cost-based regulation incentive-based approaches to tariff regulation were first developed in Great Britain and are currently applied in many other countries Incentive-based regulation can be characterised by the use of financial rewards and penalties to induce the regulated company to achieve the desired goals (generally in form of an efficient cost base) while the company is allowed some discretion in how to achieve them Rewards and penalties replace a lsquocommand and controlrsquo form of regulation and provide incentives to the company to achieve the goals by allowing it to share the lsquoextra profitrsquo in case it over-fulfils the targets set by the regulator In general incentive-based regulation aims at cost control ndash so that grid users later could benefit from lower costs in a quantitative way through lower tariffs in the future
31 Regulatory System in Place Most European countries use incentive-based regulation in the form of a revenue cap The tables in Annex 4 accompanying this report41 which contains the NRA answers to the questionnaires underline the usage of this regulatory instrument In general most countries use a mixture of a cap regulation (revenue or price) and a guaranteed rate of return A revenue cap regulation can thereby be seen as an indirect price cap regulation where the revenue is the result of price multiplied with the quantity Nowadays a cost-plus regulation is an exception and is only used in a few countries Electricity transmission is regulated by incentive methods in 19 out of 25 countries Revenue caps are set by 15 NRAs From the beginning of the regulatory period 2016 - 2019 for the transmission of electricity Belgium introduced a considerable number and amount of extra incentives to increase efficiencies foster market integration and security of supply and support related research activities The Belgian TSO has strongly taken those into account In electricity distribution 21 NRAs apply incentive regulation Price caps are used by seven NRAs and 14 NRAs use revenue caps Gas transmission is regulated by incentive methods in 21 countries A limitation by caps is used by 19 countries sometimes even with a mixture of price and revenue caps In six countries a rate of return is implemented In gas distribution incentive-based methods are applied by 22 countries In four countries a mixture of incentive and cost-based methods is applied and eight NRAs use a cost-based regulation
41 Annex 4 is uploaded as a separate document on the same webpage as this report
Ref C20-IRB-54-03
CEER Report on Regulatory Frameworks for European Energy Networks 2020
129156
32 Efficiency Requirements Efficiency requirements stimulate the network operators to reduce costs and to work more efficiently One way of implementing these requirements is to reduce the allowed revenues year by year The tables in Annex 4 show whether the NRAs set efficiency requirements (lsquoX-factorsrsquo) on OPEX and CAPEX The survey revealed that a majority of the NRAs in electricity and gas focus on cost saving on the OPEX side On the CAPEX side nearly 20 of respondents have efficiency requirements applied This result is independent of the type of energy (gaselectricity) and the market layer (TSODSO) In some cases an efficiency requirement is applied to TOTEX (CAPEX+OPEX) One country (Belgium) uses different efficiency requirements depending on the region of the country
33 General Overview of System Operators Some regulatory regimes distinguish between the TSO functions of transport and of system operation For electricity the tasks of a system operator cover the complete area of activities for operating electric power systems including security control and quality in terms of fixed technical standards principles and procedures but also the synchronous operation of interconnected power systems42 This activity includes balancing services primary and secondary reserves capacity management ancillary services (disturbance reserves voltage support) and the purchase of energy for congestion management and redispatching This activity excludes day-to-day management of the network functionality For gas system operation includes ancillary services and congestion management It also includes the maintenance of the security of supply in the natural gas system by the coordination of entry and exit agents and the balancing of the natural gas system This activity also excludes day-to-day management of the network functionality In almost all countries all functions are within one company and there is no separation of transport and system operation In some countries there is no separation but separated financial accounts per function Therefore there is no different regulatory treatment at this point In the gas sector only Finland and Spain separate the transport and system operation functions
331 Regulatory System in Place and Efficiency Requirements In most cases a common methodology for setting the revenues for both functions is used In case that there are separated market functions a separate x-factor (efficiency requirement) is applied on the OPEX or even on the TOTEX
332 Operational Expenses (OPEX) The operational expenses of the system operators consist of the components of personnel and operating cost Sometimes additional components are included and there are also operational expenses of the system operator that are excluded from the allowed revenue To obtain the items that integrate the OPEX the financial as well as the regulatory accounts are used
333 Capital Expenses (CAPEX) To calculate the rate of return for System Operator (SO) investments in all countries the same methodological components (WACC and CAPM) are used and the same rate is used as for the transmission investments
42 Definition used by the Agency for the Cooperation of Energy Regulators (ACER)
Ref C20-IRB-54-03
CEER Report on Regulatory Frameworks for European Energy Networks 2020
130156
334 Incentives and Penalties In general there are no incentives or penalties included in the methodology derived from the fulfilment of the system operator functions and therefore in most cases there is no related cap for the incentives or penalties In some countries there are incentives or penalties included in the methodology derived from the fulfilment of the system operator functions like a bonusmalus system for the procurement of balancing and loss energy in Germany or incentives for solving technical restrictions in Spain
335 Tariffs Half of the NRAs which have a separated treatment of system operators do not have a special tariff for the revenues of the system operators For these NRAs the general tariffs are used In other cases there is a special third-party access tariff (eg in Portugal) In Spain the remuneration of the electricity system operator is satisfied 50 by electricity producers according to their available capacity and 50 by retailers and direct consumers For the Spanish gas system operator the revenues are collected as a percentage of the tolls and fees collected
336 Allowed Revenue If there are deviations between the system operatorrsquos collected revenues and the system operatorrsquos allowed revenues most NRAs make an adjustment at the latest two years later after which the difference is settled In the Czech Republic a correction factor is applied
Ref C20-IRB-54-03
CEER Report on Regulatory Frameworks for European Energy Networks 2020
131156
4 Calculation of the Rate of Return Most regulatory systems allow for a rate of return on investments In this chapter we discuss how such returns are set
41 Methods Used of the Rate of Return There are different possible methods to calculate the rate of return Mostly a WACC factor (Weighted Average Cost of Capital) is used In general WACC can be expressed in a simplified manner by the following formula
WACC= 119864119902119906119894119905119910
(119864119902119906119894119905119910+119863119890119887119905)lowast 119862119900119904119905 119900119891 119890119902119906119894119905119910 +
119863119890119887119905
(119864119902119906119894119905119910+119863119890119887119905)lowast 119862119900119904119905 119900119891 119889119890119887119905
NRAs can distinguish between nominal or real and before and after taxation as well as a ldquoVanillardquo WACC43 For electricity network regulation the most popular approach is to use nominal WACC before taxation (as can be seen in the tables of Annex 4 accompanying this report) The otherwise most commonly used method for calculation of the rate of return is the real weighted average cost of capital before taxation which is used by about 25 of the NRAs In the gas sector the nominal WACC before taxation approach is popular as well however the real weighted average cost of capital before taxation is also frequently used (WACC nominal 50 WACC real 30) In addition it is remarkable that four NRAs do not use WACC in the regulation of electricity and gas TSOs and Germany also does not use WACC in the regulation of electricity and gas DSOs
42 Year of Rate of Return Estimation and Length of Regulatory Period To obtain information about the length of regulatory periods and the different tariff years in the individual regulatory systems a time series from 2009 to 2020 was considered In general the majority of NRAs evaluate (or adjust) the rate of return parameters in the year before the regulatory period starts The year before the regulatory period starts is used as a lsquophotorsquo or base year in which the rate of return parameters are evaluated or adjusted for TSOs as well as for DSOs Most NRAs make no distinction between gas and electricity There are only a few Member States that evaluate or adjust the parameters two or three years before start of the regulatory period The typical regulatory period is between three and five years regardless whether it is a TSO or a DSO the electricity sector or the gas sector Just a few Member States use a yearly regulatory period or a period which is longer than five years One country (Estonia) uses an undefined regulatory period so the operator can submit data at any time
43 Rate of Interest The weighted average cost of capital (WACC) is a factor applied to an asset volume to calculate a rate of return However as a companys capital generally consists of both equity and debt capital rates of interest for both of these must be calculated when determining a suitable return
43 This is the weighted average cost of capital using a pre-tax cost of debt and a post-tax cost of equity
Weighting factors
Ref C20-IRB-54-03
CEER Report on Regulatory Frameworks for European Energy Networks 2020
132156
431 Risk-free Rate The risk-free rate is the expected return on an asset which bears in theory no risk at all ie whose expected returns are certain44 In other words the risk-free rate is the minimum return an investor should expect for any investment as any amount of risk would not be tolerated unless the expected rate of return was greater than the risk-free rate The risk-free rate can be described as either ldquonominalrdquo or ldquorealrdquo The nominal interest rate is the amount in money terms of interest payable The real risk-free rate excludes inflation and reflects the pure time value of money to an investor The relationship between nominal and real risk-free rates and inflation can be expressed as follows45
(1 + nominal risk-free rate) = (1 + real risk-free rate) x (1 + inflation) In practice it is not possible to find an investment that is free of all risks However freely traded investment-grade government bonds can generally be regarded as having close to zero default risk and zero liquidity risk
4311 Evaluating Risk-free Rates There are only marginal differences in the individual regulatory systems concerning evaluating the risk-free rate Most NRAs evaluate the risk-free rate on the basis of government bondsrsquo interest rates The risk-free rates are usually evaluated on the basis of their own national government bond interest rates Some regulators however use the interest rates based on the government bonds of selected foreign countries (AA or higher rated) or OECD averages In most cases they use the same methodology for all network operators but in some countries there are differences in approaches between both electricity and gas sector and between transmission and distribution The main reason for such differences is that the risk-free rates have not been evaluated at the same time The most frequently used bonds have maturities of ten years but also lower year bonds appear In addition it is remarkable that Germany uses maturities of 1 2 5 10 20 and 30 years Most CEER Member countries use historical averages but in relation to the years of historical analysis there is no uniform usage The majority of NRAs apply 1 5 or 10 years of historical analysis independent of electricity or gas sector and TSO or DSO regulation
4312 Values of Nominal and Real Risk-free Rates There are different values of nominal and real risk-free rates used by regulators In order to compare the value of risk-free rates the Member States were also asked if the risk-free rate used is nominal or real The conclusions could be drawn that most of the NRAs use nominal risk-free rates (only a few countries use real risk-free rates) and the typical value of nominal risk-free rate is between 10 and 40 Nevertheless the values of the risk-free rates also depend on the year of assessment
44 IRG ndash Regulatory Accounting Principles of Implementation and Best Practice for WACC calculation February
2007 wwwergeuintdocpublicationserg_07_05_pib_s_on_waccpdf 45 S Ross R Westerfield B Jordan Essentials of Corporate Finance IrwinMcGraw-Hill 1996 p 248
Ref C20-IRB-54-03
CEER Report on Regulatory Frameworks for European Energy Networks 2020
133156
432 Debt Premiums In corporate debt finance the debt risk premium is the expected rate of return above a (determined) risk-free interest rate The risk premium is determined as the margin between the risk-free rate and the corporate bond rate It expresses the incentive for an investor to invest in the corporation instead of investing in for example secure government bonds
4321 Evaluating Debt Premiums In the tables of Annex 4 the approach towards debt premiums (where applied) their value the applicable year and a short description of the evaluation are shown The evaluation of the values of debt premiums differs from NRA to NRA They are usually estimated on the basis of market analysis provided by external experts and internal comparative analysis conducted by the NRAs but some of them also use country ratings The values rather reflect the borrowing conditions for network operators which are seen as companies with good ratings The values of debt premiums used by the regulators are in most cases between 040 and 200 Portugal uses a debt premium of 25 for electricity and 275 for gas The values of the debt premium differ marginally from electricity to gas regulation and TSOs to DSOs Only a few CEER Member countries do not use debt premiums in their regulatory system
4322 Real Cost of Debt in Tariff Calculation The tables in Annex 4 show the value of the real cost of debt In order to make the cost of debt applied by the NRAs more comparable the debt premium was (in most cases) added to the real risk-free rates The survey shows that for the majority of the analysed countries the real cost of debt is in a range between 15 and 40 Only a few countries use a real cost of debt at less than 1 or higher than 6 Concerning the year of evaluating real cost of debt most NRAs apply years between 2015 and 2019 Just a few countries use years before 2013
433 Market Risk Premiums Market risk premium could be defined as the excess return that the overall stock market provides over an investment at the risk-free rate This is determined by comparing the returns on equity and the returns on risk-free investments This excess return compensates investors for taking on the relatively higher risk of the equity market The size of the premium will vary as the risk changes (in the stock market as a whole) high-risk investments are compensated with a higher premium
4331 Evaluating Market Risk Premiums The surveyed countries should give information about the value of the market risk premium the year of evaluation and the NRArsquos approach for evaluating it The value of the market risk premium is often in the range of 4 to 5 independent of electricity or gas sector and TSO or DSO regulation Only a few NRAs use market risk premiums with a lower or higher value It is noteworthy that Romania uses the highest value for the gas market (69 for DSOs and TSOs) and Portugal uses the highest value for the electricity market (766 for DSOs ndash including a country risk spread) Concerning the year of evaluation of the market risk premium most Member States apply years between 2015 and 2019 As in the case of debt premiums the values of market risk premiums are also based on a market analysis NRAs also use the reports prepared by the expert group Dimson Marsh Staunton and the analysis provided by Damodaran46
46 httpspapersssrncomsol3paperscfmabstract_id=299335
Ref C20-IRB-54-03
CEER Report on Regulatory Frameworks for European Energy Networks 2020
134156
434 Capital Gearing Gearing could be defined as the proportion of assets that were funded from borrowed funds It is necessary for calculating the WACC when the weighting factors have to be determined
As shown in subchapter 41 the formula 119863119890119887119905
119864119902119906119894119905119910+119863119890119887119905 defines the gearing
4341 Evaluating the Gearing Ratio The questionnaire for this report included the values of the gearing for the year of evaluation and a short description of the evaluation by the NRAs Most of the countries use a gearing between 40 and 60 In general the same value is used for all sectors be they TSOs or DSOs Only a few countries make use of different values and if they do so the value changes only minimally Concerning the year of evaluation of the gearing most CEER Member countries apply years between 2015 and 2019 The majority of NRAs base the gearing ratio on expertsrsquo reports or market analysis
435 Taxes The tax value could be defined as the rate of income tax paid by the network operators
4351 Evaluating the Tax Value The tables in Annex 4 show the value of the tax rates used by the NRAs Additionally the year of evaluation and a short description of the evaluation is included The NRAs filled in the value of the corporate tax or the corporate income tax (depending on the name which is used) which apply to the network companies The value of corporate tax depends on the national tax system Most of the CEER Member countries use a corporate tax rate between 20 and 30 only a few NRAs are situated below or over this value In general the same value is used for all sectors be they TSOs or DSOs Only a few countries make use of different values if this is the case the value only changes slightly Concerning the year of the gearing ratio evaluation most countries apply years between 2015 and 2019 In many regulatory systems the tax value is defined by law
436 Beta An asset beta could be described as a quantitative measure of the volatility of a given stock mutual fund or portfolio relative to the overall market The asset beta therefore reflects the business risk in the specific market where the company operates A beta of one corresponds to the expectations of the market as a whole a beta above one is more volatile than the overall market while a beta below one is less volatile The beta of a company is calculated after subtracting its debt obligations thus measuring the non-diversifiable risk Asset (unlevered) beta removes the effects of leverage on the capital structure of a firm since the use of debt can result in tax rate adjustments that benefit a company Removing the debt component allows an investor to compare the base level of risk between various companies An equity beta could be defined as an indication of the systematic risk attached to the returns on ordinary stocks Equity beta accounts for the combined effects of market and financial risks that the stockholders of a company have to face It equates to the asset beta for an ungeared firm or is adjusted upwards to reflect the extra riskiness of stocks in a geared firm
Ref C20-IRB-54-03
CEER Report on Regulatory Frameworks for European Energy Networks 2020
135156
The dependence between the asset and equity beta is usually presented by the following formula
eszlig = aszlig[1+(1-t)(DE)] where eszlig = equity beta aszlig = asset beta t = tax rate D = Debt E = Equity DE ndash gearing ratio Sometimes in the calculation of the equity beta the influence of taxes is not taken into account In this case the formula for calculation equity beta is as follows
eszlig = aszlig[1+DE]
4361 Evaluating the Asset and Equity Beta The questionnaire included the NRAsrsquo approach for asset and equity beta evaluation The majority of NRAs evaluate beta values by using both external and internal market analyses The most frequently applied approach in the calculation of equity beta is to use the formula which includes tax Some regulators use a formula which does not include tax and Belgium Great Britain and Hungary use direct equity beta without a calculation of asset beta Due to the different gearing ratios a comparison of equity betas could be misleading In order to make the values comparable the asset beta was calculated The calculation was based on the value of equity betas and gearing ratios used by the regulators The formulas presented above were used in this calculation
4362 Betas in the Regulation The tables in Annex 4 show asset beta aszlig = eszlig[1+(1-t)(DE)] andor aszlig = eszlig(1+DE) used in tariff calculation for the electricity and gas TSOs and DSOs The values of asset beta calculated with [aszlig = eszlig[1+(1-t)(DE)] are in the electricity sector as well as in the gas sector typically in the range between 03 and 05 The values of asset betas calculated with [aszlig = eszlig[1+DE]] are generally lower The values for the electricity and gas sectors are between 026 and 04
Ref C20-IRB-54-03
CEER Report on Regulatory Frameworks for European Energy Networks 2020
136156
5 Regulatory Asset Base In general the Regulatory Asset Base (RAB) serves as an important parameter in utility regulation in order to determine the allowed profit The structure of individual components included into the RAB and their valuation differ significantly among CEER Member countries and even among the regulated sectors The RAB value is usually also linked with depreciation depending on an individual NRArsquos approach In general the RAB provides for remuneration of both historic and new investment The RAB should be formed by the assets necessary for the provision of the regulated service in their residual (depreciated) value The RAB can be comprised of several components such as fixed assets working capital or construction in progress Other elements such as capital contributions of customers government (eg subsidies) and third parties on the contrary are usually excluded The RAB may be valued according to different methods (eg historical costs indexed historical costs or actual re-purchasing costs) which will have an influence on the determination of the CAPEX A RAB based on indexed historical costs would therefore require the use of a real instead of a nominal WACC As a result it is important to understand the relation between the RAB definition and the WACC structure
51 Components of the RAB The following subchapter analyses the approach taken by NRAs towards fixed assets working capital assets under construction contribution from third parties and leased assets with respect to their inclusionexclusion to the RAB
511 Tariff Calculation In general the role of the RAB is very important for the tariff calculation Most of the countries use the RAB as one component (multiplied with the WACC) for calculating the allowed revenue With a determined revenue the necessary tariffs can also be calculated Concerning the question of whether 100 of RAB is used in tariff calculation all surveyed NRAs answered with lsquoyesrsquo for electricity TSOs For the other sectors (electricity DSOs gas DSOs gas TSOs) most of the countries use 100 of RAB in tariff calculation Only Poland (for gas DSOs and TSOs) does not use 100 of RAB for the tariff regulation
512 Fixed Assets Fixed assets also known as a lsquonon-current assetrsquo is a term used in accounting for assets and property which cannot easily be converted into cash Fixed assets normally include items such as lines and pipes land and buildings motor vehicles furniture office equipment computers fixtures and fittings and plant and machinery
According to the survey data submitted all NRAs count the fixed assets into the RAB In Poland gas network assets are included in the RAB at net present value
513 Working Capital Working capital represents operating liquidity available to company Working capital is considered as a part of operating capital Net working capital is calculated as current assets minus current liabilities
Working Capital = Current Assets Net Working Capital = Current Assets minus Current Liabilities
Ref C20-IRB-54-03
CEER Report on Regulatory Frameworks for European Energy Networks 2020
137156
The answers to the survey showed that approximately a third of the NRAs include working capital into the RAB therefore the majority of countries do not take working capital into the RAB It should be noted that only in parts of Belgium is working capital is taken into the RAB in the electricity and gas DSO regulation For the Flemish region they calculate working capital into the RAB whereas in the Walloon and Brussels regions they do not take working capital into the RAB In Finland accounts receivables and inventories are allowed into the RAB in book values however excluding cash equivalents or other receivables In Estonia the level of working capital is determined as 5 of the three-year average sales revenue and in Norway as 1 of the book value In Germany only working capital which is necessary for the operations is included and in Luxembourg the working capital is approved if duly justified
514 Assets Under Construction Assets under construction are a special form of tangible assets They are usually displayed as a separate balance sheet item and therefore require a separate account determination in their asset classes Cost includes all expenditures incurred for construction projects capitalised borrowing costs incurred on a specific borrowing for the construction of fixed assets incurred before it has reached the working condition for its intended use and other related expenses A fixed asset under construction is transferred to fixed assets once it has reached the working condition for its intended use Ordinary depreciation is not allowed for assets under construction in most countries Even if from the accounting point of view these assets are not included in the fixed assets the NRAs from a regulatory perspective do sometimes include such cost in the RAB for remuneration as shown in the survey About half of the NRAs responded that electricity transmission and distribution assets under construction are included in the RAB In gas transmission and distribution a few NRAs responded that assets under construction are included into the RAB Some countries have certain conditions for assets under construction to be included in the RAB eg for certain categories of investments as a transition before phase-out or a length of construction of more than two years In Luxembourg also financing costs of assets under construction may be considered under working capital
515 Contribution from Third Parties Contributions from third parties such as connection fees contributions from public institutions EU funding under cohesionstructural funds or EU grants under Decision No 13642006EC which lays down guidelines for trans-European energy networks are often deducted by the NRAs from the RAB (lsquoringfencingrsquo) This approach is based on the reasoning that to the extent the asset (partly or in total) was not financed by the regulated entity it should not be included in the RAB and remunerated The survey shows that the vast majority of the NRAs deduct such contributions from the RAB in the electricity and gas sector for both TSO and DSO regulation Only a few countries take contributions from third parties into the RAB in their regulation
Ref C20-IRB-54-03
CEER Report on Regulatory Frameworks for European Energy Networks 2020
138156
516 Leased Assets According to International Financial Reporting Standards (IFRS)47 finance lease assets must be shown on the balance sheet of the lessee with the amounts due on the lease also shown on the balance sheet as liabilities This is intended to prevent the use of lease finance to keep the lease liabilities off-balance sheet According to a number of national accounting standards however it is possible to consider these assets as the OPEX and keep them off-balance sheet The attached tables (in Annex 4) show that around 40 of the surveyed NRAs include leased assets into the RAB For DSO regulation Belgium includes leased assets only for the Flemish Region and not for the Walloon or Brussels Regions Most countries which do not include leased assets consider them as OPEX Some countries have certain conditions for leased assets to be included in the RAB eg for certain types of leases or do not always base them on IFRS
52 Determination of Initial Regulatory Asset Value The value of the RAB on which the companies earn a return in accordance with the regulatory cost of capital (ie the weighted average cost of capital where applicable) is crucial for the calculation of the regulatory revenue The value of the assets included into the RAB could be expressed either in terms of historical costs or re-evaluated values Whilst the historical cost approach values the RAB with reference to the costs that were actually incurred by the company to build or acquire the network the re-evaluated values represent the costs that would hypothetically be incurred at the time of re-evaluation of the assets
521 Historical Costs The method of valuation of the RAB in historical costs is applied in regulatory regimes where the assets of regulated companies were not re-evaluated or in the regimes where NRAs keep a regulatory database of the historical values of the assets As the historical costs do not reflect a decrease in the real value of the assets caused by the inflation some NRAs make use of the indexed historical cost method In electricity and gas TSO and DSO regulation most of the surveyed NRAs do not base RAB exclusively on historical value of assets
522 Re-evaluation of Assets The re-evaluation of fixed assets is a technique that may be required to accurately describe the true value of the capital goods a business owns The purpose of a re-evaluation is to bring into the books the fair market value of fixed assets This may be helpful in order to decide on selling one of its assets or inserting part of the company into a new company Re-evaluation of assets was conducted in many countries following the unbundling of vertically integrated companies where separate network companies were established
47 International Financial Reporting Standards (wwwifrsorg)
Ref C20-IRB-54-03
CEER Report on Regulatory Frameworks for European Energy Networks 2020
139156
Other reasons for re-evaluation mentioned in the survey were very high inflation rates and the consolidation processes of regulated companies In some regulatory regimes a re-evaluation of distribution assets is conducted annually according to the IFRS accounting standards Even though the most frequently applied method was depreciated replacement costs for the sake of comparison it is crucial to know when the last re-evaluation was performed This is the major difference among countries surveyed The re-evaluation is be done in two ways either once or on a frequent basis One of the main advantages of the annual re-evaluation is that an NRA works with the real asset values and does not need to deal with the significant increase of RAB of market circumstances The surveyed countries answered the question of whether the RAB is exclusively based on re-evaluated assets and if yes how they influence the level of RAB Overall it should be noted that only a few CEER Member countries (25) base the RAB on re-evaluated assets Some of them index RAB annually by using different index eg retail price index or construction industry index or they evaluate assets on the basis of historical costs In electricity transmission the RAB is exclusively based on the re-evaluated assets in six countries the Czech Republic Great Britain Italy Latvia Poland and Sweden For gas transmission and distribution the situation is almost the same The Czech Republic France Great Britain Hungary Ireland Italy Latvia and Sweden base the RAB exclusively on the re-evaluated assets
523 Mix of Historical and Re-evaluated Assets Six NRAs apply a mix of historical values and re-evaluated assets In Germany the equity-financed share of old assets is indexed at replacement values for the cost determination The debt-financed share of old assets is valued at historical values New assets are always valued at historical values In Luxembourg assets are valued at historical costs Old assets (capitalised before 1 January 2010) may as an option be evaluated as follows a fraction of old assets is valued at historical costs (up to the debt ratio 50 of all old assets) and at indexed historical costs (up to the equity ratio 50) In Hungary in the case of natural gas TSOs and DSOs the self-owned fixed assets were re-evaluated except the other technical machines equipment and tools which were accepted at book value Since one of the two natural gas TSOs was established in 2015 its assets were not re-evaluated at all but were accepted at book value
53 Difference Between the RAB Defined on the Net Book Values and the RAB Based on Re-evaluated Asset Base
The CEER Member countries were asked for the difference (in percentage terms) between the RAB defined on net book values according to national GAAP (or IFRS) and the RAB based on re-evaluated asset base The purpose of this question was to find out if there is any difference between net book value and RAB Regulated companies may have re-evaluated the assets but the NRA for regulation purposes could approve only part of those assets
Ref C20-IRB-54-03
CEER Report on Regulatory Frameworks for European Energy Networks 2020
140156
The survey shows that in the electricity as well as in gas sector in nearly 75 of the countries there is no difference between net book value and RAB If there is a difference between net book value and RAB the percentages vary greatly from 30 to over 120 It is noteworthy that Hungary generally has the highest percentage variance (RAB to NBV)
54 Monetary Value of Regulated Assets on Historical Cost Basis and Monetary Value of Re-evaluated Regulated Assets
The survey includes the question of the monetary value of regulated assets on a historical cost basis and the monetary value of re-evaluated regulated assets (in both cases aggregated for all companies) Nearly half of the surveyed NRAs are unable to make a statement concerning this and some of them are not allowed because of confidential information The monetary values of regulated assets and re-evaluated regulated assets are very different and vary from country to country It cannot be said that the amount of the values depends on a specific sector
55 RAB Adjustments The RAB is ordinarily adjusted annually within the regulatory period when the value of the new investments is taken into consideration and the value of the depreciation is deducted According to the survey responses almost three quarters of the NRAs adjust the RAB during the regulatory period and the annual recalculation of the net book value (new investment depreciation) is the most common approach Concerning the question of whether the adjustment affects net book values by accounting for new investments andor depreciation most countries confirm this Usually the book value is calculated by adding investments and subtracting depreciations The survey also enquired whether NRAs adjusted the RAB within the regulatory period to correspond the real values of the RAB by some kind of progression index In Great Britain the RAB is indexed for inflation using RPI (Government retail price index of inflation including interest costs) and in Italy the gross fixed investment deflator measured by the National Institute of Statistics is used
56 RAB Conclusions From a balance sheet perspective fixed assets are the most significant items in the energy industry Also according to the responses of the energy regulators fixed assets were without exception indicated as a component of the RAB A third of the regulators additionally include working capital in the RAB albeit with specific rules for its determination and inclusion Less than half of the regulators in the gas and electricity distribution sectors and in the gas transmission sector include the investment in progress in the RAB For electricity transmission on the other hand the ratio is inversed and investment in progress is more often than not included in the RAB The contribution by third parties is deducted from the RAB by nearly all NRAs with only a few exceptions From the responses one can conclude that the most common way of calculating the RAB components is the historical costs method followed by the re-evaluated assets method with the mixture of these two methods applied only rarely In all countries surveyed other adjustments were not mentioned
Ref C20-IRB-54-03
CEER Report on Regulatory Frameworks for European Energy Networks 2020
141156
6 Depreciations Depreciation decreases the asset value through use and the shortening of theoretical asset life and should also allow a firm to cover replacement investment costs during the economic lifetime of an asset Concerning the duration of depreciation the economic lifetime of the asset should be taken into account in a forward looking long-run approach
The two most common approaches towards depreciation are lsquostraight linersquo and lsquoacceleratedrsquo depreciation The straight-line depreciation method spreads the cost evenly over the life of an asset On the other hand a method of accelerated depreciation such as the double declining balance (DDB) allows the company to deduct a much higher share in the first years after purchase
61 Overview Almost all NRAs use the straight-line approach towards depreciations Once the NRA has decided on a depreciation method (straight line or accelerated depreciation) this method is applied for both gas and electricity system operators in the country For both electricity and gas regulation most NRAs have the same depreciation rate for typical TSO and DSO network assets even when not the case there is usually only a marginal difference One question to the NRAs was ldquoWhich values of depreciation are allowed into the regulationrdquo The regulators predominantly use the same value of depreciation for TSOs and DSOs There may be some minor differences between the two Additionally the NRAs use different depreciation values with the majority using historical values in different variations For the most part the linear method is applied for the depreciation of the regulated assets The lifetime of a typical network asset ranges from 30 to 50 years and the majority of NRAs use the individual depreciation rate for each type of asset However in some regulatory frameworks the average rate for all companies and all assets is applied As with RAB valuation the depreciation of assets could be based on historic values re-evaluated values or on a mixture of these two methods The vast majority of regulators allowed depreciation of tangible and intangible assets valued on the same basis as the RAB in their regulation hence clear correlation between these values can be observed
Ref C20-IRB-54-03
CEER Report on Regulatory Frameworks for European Energy Networks 2020
142156
7 Incentives and Improvements Incentives are one of the central elements of the regulatory regimes in European countries Due to the absence of a competitive environment for network operators regulation has been introduced Instead of defining all the working processes of the regulated network operators most regulatory regimes only constitute a certain framework that aims to give incentives to network operators in a certain direction The next subchapter and the corresponding tables in Annex 4 give an overview of the established incentives At the end of this chapter the trending topics and regulatory improvements which are currently planned or implemented are highlighted
71 Description of the Incentives Established The pace of technological changes has intensified in recent years These changes should be taken into account at the transmission and distribution network level Therefore at both network levels of the electricity sector we find some incentives regarding the installation and operation of smart grids and smart meters At the electricity DSO level there are also some incentives established for the integration of renewable distributed generation In general more incentives are implemented in the electricity sector than in the gas sector Furthermore some countries have individual incentives established in their regulatory regime For example the Spanish regulatory regime includes at the electricity TSO level incentives to not exceed the investment eligible for remuneration incentives to promote an adequate economic and financial capacity a suitable capitalisation and a sustainable debt structure and incentives to extent the useful remuneration lifetime of assets in order to avoid the electricity system to incur in unnecessary investment costs Finland as an example for gas TSO incentives regulation has established incentives for investments quality efficiency and innovation The investment incentive consists of the incentive impact of unit prices and the straight-line depreciation calculated from the adjusted replacement value The quality incentive is based on a quality bonus method in which the reward and sanction are defined on fixed steps and where undelivered energy is used as a quality indicator Annual undelivered energy is benchmarked against the TSOs reference level which is determined by undelivered energy over eight years The target level and upper and lower quarters determining reward andor sanction are derived from the reference level The efficiency reference level is based merely on the operatorrsquos own historical costs In the first year of the regulatory period the average of the previous four-year regulatory period realised controllable operational costs is used as the benchmark for efficiency costs In the following years the benchmark will be the reasonable controllable costs of the previous year Innovation incentive encourages the TSO to develop and use innovative technical and operational solutions in its network operations The key objectives of research and development activities are the development and introduction of smart grids and other new technologies and methods of operation Acceptable costs for research and development (RampD) must be directly related to creation of new knowledge technology products or methods of operations At the electricity DSO level again Spain is one of the countries which has implemented several additional incentives such as investment control incentive a financial prudence incentive an assets lifetime extension incentive and innovation support
Ref C20-IRB-54-03
CEER Report on Regulatory Frameworks for European Energy Networks 2020
143156
Finally Ireland could be mentioned as a country with individual incentives at the gas DSO level They have established incentives for building new connections a better customer performance an incentive to reduce shrinkage against target values and incentives for controllable OPEX and CAPEX
72 If There are no Incentives Established Several NRAs are planning to implement different incentives in their regulatory regime to react to the changes occurring in energy markets For instance Luxembourg will continue to have specific measures for interconnection projects within the new tariff methodology for 2021 Norway is considering changing the tariff structure in order for the demand for MW to influence the tariff for all customers This could give incentives for more demand response For the gas sector Croatia will have a review of the overall tariff setting regulation frame for third regulatory period (2022-2026) Spain is planning some incentives at TSO and DSO level integration of vehicular gas enhancement of cost-efficiency investments and operation incentive for financial prudence incentive to reduce losses in gas transmission pipelines and distribution network etc
73 Trending Topics and Regulatory Improvements The current trending topics which the network operators and the NRAs have to deal with are a mixture of general tasks and new tasks and strategies caused by changes in energy markets Many NRAs are preparing for the next regulatory period As such the existing current situation of the tariffs is analysed and adjustments are made The use or change of the WACC system is also one of the trending topics for the NRAs Due to the energy transition NRAs have to deal with new tasks such as the integration of renewable energies e g wind solar and biogas the installation of smart grids and meters and the necessary investments in new lines pipes and new technology Here the right adjustments and the implementation of incentives are needed to prepare the networks for their new andor changed tasks The integration of flexibility also plays an important role for NRAs here The upgrading of networks to what is often termed a lsquosmart gridrsquo usually comes with a need to be able to transfer huge amounts of data Thus the implementation of data hubs to manage these data is also currently growing in importance
Ref C20-IRB-54-03
CEER Report on Regulatory Frameworks for European Energy Networks 2020
144156
8 Conclusions This CEER report analysed different regulatory systems of electricity and gas networks in most individual EU Member States Great Britain Northern Ireland Iceland and Norway It provides a general overview of the regulatory practices in place the calculation of a rate of return the determination of the regulatory asset base (RAB) and the depreciation of assets in different regulatory systems All these components give an impression of the conditions for possible investments in electricity and gas networks in Europe It is not the intention of this report to paint a complete picture of the existing regulatory framework For example the costs of OPEX and their treatment within the regulatory systems are not considered in this report Furthermore other important factors which are difficult to measure (such as the stability of the regulatory framework or regulatory processes) are not addressed in this report although they play a key role in the decisions of investors When interpreting the figures which are used as the background for the reportrsquos content and which are presented in the tables of Annex 4 accompanying this report the regulatory framework must be considered as a whole as singling out selected parameters would distort the overall picture Nevertheless this report provides detailed information about the regulatory framework and indirect information about the investment conditions in each country offering helpful insights The report shows that different countries have different characteristics in their respective regulatory systems But also that there are many parallels between the regulatory regimes that can be identified (as seen in chapter 2) For the method of asset valuation the WACC is the preferred method by many NRAs Whereas the real WACC was used for the profitability calculation of the re-evaluated assets the nominal WACC is used for the assets in historical values The RAB can be comprised of several components including fixed assets working capital or constructions in progress There is thus some variation amongst NRAs According to the survey data almost all NRAs include the fixed assets in the RAB In contrast with respect to the working capital more than half of NRAs do not include working capital in the RAB or use a derived notion of that working capital depending on whether the electricity or gas system operator is considered The ldquoconstruction in progressrdquo component gives the same result as working capital Less than half of the NRAs surveyed allow assets under construction in the RAB The RAB value is usually linked with depreciation depending on the NRA In gas and electricity regulation straight line depreciation is applied by most NRAs The surveyed NRAs use different depreciation values with the majority using the historical values in different variations The lifetime of the typical network asset ranges from 30 to 50 years and the majority of the NRAs use the individual depreciation ratio for each type of asset
For a deeper analysis of investment conditions it would be useful to take a closer look at other parameters such as costs per unit share of CAPEX TOTEX or the consideration of total costs
Ref C20-IRB-54-03
CEER Report on Regulatory Frameworks for European Energy Networks 2020
145156
Finally the developments of the energy networks in Europe should regularly be analysed closely in the future due to changes caused by the energy transition The switch from conventional to renewable energy sources a growing cooperation between (and inside) European energy networks and the integration of smart elements into the networks can be seen as the next challenges for network operators but also for the national authorities
Ref C20-IRB-54-03
CEER Report on Regulatory Frameworks for European Energy Networks 2020
146156
Annex 1 ndash Lists of Abbreviations
General Abbreviations
Term Definition
ACM Authority for Consumers and Markets (Netherlands)
ANRE National Regulatory Authority for Energy (Romania)
BNetzA Bundesnetzagentur (Germany)
bp Basis Point
CEER Council of European Energy Regulators
CAPEX Capital expenditure
CAPM Capital Asset Pricing Model
CBA Cost-benefit analysis
CPI Consumer price index
CRE Commission de Reacutegulation de lrsquoEacutenergie (France)
CRU Commission for Regulation of Utilities (Ireland)
DDB Double declining balance
DEA Data Envelopment Analysis
DSO Distribution System Operator
DUR Danish Utility Regulator
ECA Estonian Competition Authority
Ei Swedish Energy Markets Inspectorate
ERO Energy Regulatory Office (Czech Republic)
ERSE Entidade Reguladora dos Serviccedilos Energeacuteticos (Portugal)
GAAP General Accepted Accounting Principles
HEA Hungarian Energy and Public Utility Regulatory Authority
HERA Croatian Energy Regulatory Agency
HICP Harmonised Index of Consumer Prices
IFRS International Financial Reporting Standards
ILR Institut Luxembourgeois de Reacutegulation (Luxembourg)
ITO Independent Transmission operator
LNG Liquefied natural gas
MOLS Modified ordinary least squares
NRA National Regulatory Authority
NBV Net Book Values
NERC National Energy Regulatory Council (Lithuania)
NPV Net Present Value
NVE-RME Norwegian Water Resources and Energy Directorate
OPEX Operational expenditure
PUC Public Utilities Commission (Latvia)
RAB Regulated asset base
Ref C20-IRB-54-03
CEER Report on Regulatory Frameworks for European Energy Networks 2020
147156
Term Definition
RAE Regulatory Authority for Energy (Greece)
RAV Regulatory asset value
ROI Return on Investment
RoR Rate of return
RP Regulatory Period
SFA Stochastic Frontier Analysis
TOTEX Total expenditures
TSO Transmission System Operator
TYNDP Ten-year network development plan
URE Urząd Regulacji Energetyki (Poland)
URSO Regulatory Office for Network Industries (Slovakia)
WACC Weighted average cost of capital
Ref C20-IRB-54-03
CEER Report on Regulatory Frameworks for European Energy Networks 2020
148156
Annex 2 ndash List of Questions
Ref C20-IRB-54-03
CEER Report on Regulatory Frameworks for European Energy Networks 2020
149156
Ref C20-IRB-54-03
CEER Report on Regulatory Frameworks for European Energy Networks 2020
150156
Ref C20-IRB-54-03
CEER Report on Regulatory Frameworks for European Energy Networks 2020
151156
Ref C20-IRB-54-03
CEER Report on Regulatory Frameworks for European Energy Networks 2020
152156
Ref C20-IRB-54-03
CEER Report on Regulatory Frameworks for European Energy Networks 2020
153156
Ref C20-IRB-54-03
CEER Report on Regulatory Frameworks for European Energy Networks 2020
154156
Ref C20-IRB-54-03
CEER Report on Regulatory Frameworks for European Energy Networks 2020
155156
Ref C20-IRB-54-03
CEER Report on Regulatory Frameworks for European Energy Networks 2020
156156
Annex 3 ndash About CEER The Council of European Energy Regulators (CEER) is the voice of Europes national energy regulators CEERrsquos Members and Observers comprise 39 national energy regulatory authorities (NRAs) from across Europe CEER is legally established as a not-for-profit association under Belgian law with a small Secretariat based in Brussels to assist the organisation CEER supports its NRA membersobservers in their responsibilities sharing experience and developing regulatory capacity and best practices It does so by facilitating expert working group meetings hosting workshops and events supporting the development and publication of regulatory papers and through an in-house Training Academy Through CEER European NRAs cooperate and develop common position papers advice and forward-thinking recommendations to improve the electricity and gas markets for the benefit of consumers and businesses In terms of policy CEER actively promotes an investment friendly harmonised regulatory environment and the consistent application of existing EU legislation A key objective of CEER is to facilitate the creation of a single competitive efficient and sustainable Internal Energy Market in Europe that works in the consumer interest Specifically CEER deals with a range of energy regulatory issues including wholesale and retail markets consumer issues distribution networks smart grids flexibility sustainability and international cooperation CEER wishes to thank in particular the following regulatory experts for their work in preparing this report Sina Wildenhain (BNetzA) Tim Harlinghausen (BNetzA) and Michiel Odijk (ACM) More information is available at wwwceereu