Embed Size (px)
Citation preview

CEE DP 131
The Evaluation of English Education Policies
Stephen Machin
Sandra McNally
December 2011

Published by
Centre for the Economics of Education
London School of Economics
Houghton Street
London WC2A 2AE
© S.J. Machin and S. McNally, submitted December 2011
All rights reserved. No part of this publication may be reproduced, stored in a retrieval
system or transmitted in any form or by any means without the prior permission in writing of
the publisher nor be issued to the public or circulated in any form other than that in which it
is published.
Requests for permission to reproduce any article or part of the Working Paper should be
sent to the editor at the above address.
The Centre for the Economics of Education is an independent multidisciplinary research
centre. All errors and omissions remain the authors.

Executive Summary
Educational inequalities emerge even before children start school. They remain pronounced in the
years of compulsory schooling. Of particular concern are the test score differences associated with
family background. Data from the OECD PISA study shows that test score gaps vary systematically
by family background across countries with very different education systems.
Educational disadvantages acquired during schooling (and pre-school) strongly impact on whether
an individual participates in post-compulsory education. OECD data shows that in many countries
the percent of individuals who complete teritiary education is far higher if their parents also have
tertiary education. Furthermore, educational inequalities do not stop growing when people have
completed their full-time education. Data from many countries show that the probability of
undertaking non-formal job-related education is higher for those who already have higher levels
of education.
What is the role of policy in reducing these attainment gaps? While policies at all stages of the
lifecycle are relevant, we focus on a review of evidence about school-level policies in England. This
is because the years of compulsory schooling are a very important time for government
intervention in a way that potentially affects all students. Also, there is a body of good evaluation
research of school-level policies in England in recent years. We review evidence under the
following headings: the efficacy of school resources; market incentives; school autonomy and
pedagogical approaches for raising educational attainment in schools.
The evaluation challenge with regard to school resources is that additional resources are often
disproportionately allocated to disadvantaged students. Unless this is fully dealt with in the
methodological design, one can easily estimate a relationship than is too low. There have been
several recent studies looking at this issue for England using a census of all pupils (the National
Pupil Database). In general, the studies suggest a modest positive effect of additional school
resources. However, the most recent study (Gibbons et al. 2011) suggest that the effect could be
much larger – at least for students in disadvantaged, urban areas. In fact, most of these studies
suggest that school expenditure has a larger effect on disadvantaged students. This is good news
for policies like the Pupil Premium, although it also suggests that cuts to school expenditure are an
important concern.
Over the last thirty years, there has been a concerted effort to increase parental choice,
competition between schools and accountability for the performance of children. The evidence on
school choice suggests that it does not offer the same advantages to those from lower and higher
socio-economic groups. This is largely because parents from lower socio-economic groups cannot
afford to live close to a very popular school. When schools are over-subscribed, proximity to the
school is of key importance. Thus, school choice (although good in itself) does not help to reduce
socio-economic gaps in educational achievement. Furthermore, school competition does not
appear to improve educational attainment.

One reason why school competition may not be effective is because schools do not have enough
autonomy for their day-to-day organization. In some countries, more independent states schools
have been allowed to emerge. The rationale is that this greater autonomy will encourage more
innovative policies in schools and help to raise standards. In England, these schools are called
‘academies’ and they were originally established as a replacement for a failing secondary school in
an area of disadvantage. Evaluation evidence suggests that these schools started to perform
better and also helped to boost the performance of neighbouring schools. As the policy was
initially introduced to disadvantaged areas, it has been an instrument to reduce the attainment
gap along the socio-economic dimension (when viewed at a national level). However, one has to
be careful about any projection of effects from a relatively small number of schools that became
academies over this time period. Schools that are currently enrolling on the Academies
Programme have very different characteristics (e.g. on average they are less disadvantaged at
baseline). Furthermore, the expansion of the programme presents new challenges – for example,
for monitoring and accountability; for small schools; for services traditionally provided by Local
Authorities to all schools in their area.
Whereas school autonomy seems to have become a popular concept in England since 2000, this is
not true of some aspects of school organisation. For example, the National Literacy and Numeracy
Strategies were very prescriptive measures to raise standards in literacy and numeracy via
pedagogical methods. These Strategies were introduced in the late Nineties but preceded by the
‘National Literacy Project’ and ‘National Numeracy Project’ respectively. The fact that these
‘projects’ were not implemented across all Local Authorities has given researchers scope to
evaluate their effectiveness (by comparing schools where the ‘literacy hour’ and ‘numeracy hour’
were implemented relative to schools in a comparison group before and after the policy was
introduced). Evaluation evidence suggests that these pedagogical approaches were an extremely
effective way to raise pupil achievement at a low cost. However, there is still a hard core of
students for whom generic pedagogical approaches are not sufficient. One-to-one programmes
such as ‘Reading Recovery’ have been shown to be very effective for these students. However,
they are expensive programmes and need to be carefully targeted. Moreover, evidence is needed
on the long-term effects of such programmes to help guide future investment decisions.
England offers a useful setting for policy evaluation in education. A large number of policies have
been implemented and at least some of these have been rigorously evaluated. There is evidence
to suggest that policies can be effective in reducing (or reinforcing) socio-economic gaps in
educational achievement. Thus, we should not regard large socio-economic gaps as inevitable.
This partly has to do with the choices that are made in educational policy.

The Evaluation of English Education Policies
Stephen Machin
Sandra McNally
1. Introduction 1
2. Educational Inequalities 1
Pre-school education gaps 2
Compulsory schooling 2
Post-compulsory education 3
Adult learning 4
Summary 4
3. Policy Evaluation Relating to Schools in England 4
School resources 5
Incentives 9
School autonomy 11
Pedagogy 13
4. Conclusions 17
References 19
Figures 22
Tables 25

Acknowledgments
Stephen Machin is Director of the CEE, Director of Research at the Centre for Economic
Performance, London School of Economics and a Professor at the Department of Economics,
University College London. Sandra McNally is a Research Fellow and Director of the
Education & Skills Programme at the Centre for Economic Performance, London School of
Economics and Deputy Director of the Centre for the Economics of Education.

1
1. Introduction
One key feature of the English education system since the 1988 Education Act has been the
design and implementation of a number of educational policies aimed at improving
educational standards and achievement.2 There have been a range of policies introduced at
all stages of education, and by now there have been a number of evaluations of these
policies.
In this paper we take the opportunity to critically appraise these evaluations and consider
the scope that different policies have had to influence educational achievement. There are
now evaluations of policies aimed at different ways of trying to enhance educational
performance and/or reduce educational inequalities. Thus, we think it is timely to consider
these together, with an aim to develop a better understanding of which kinds of evaluations
have been successful and what kinds of policies have delivered education improvements in
England.
The structure of the paper is as follows. In the next Section, we describe educational
inequalities at different stages of the education sequence as a means of motivating the
need for implementation of education policies and for their evaluation. Section 3 focuses in
more detail on evaluation of particular school-level policies. Section 4 offers some
concluding remarks.
2. Educational Inequalities
Inequalities in educational achievement can be identified at different points throughout
individuals' lives. Indeed, inequalities in education emerge early in the lifecycle and gaps can
and do widen as the education sequence progresses. These inequalities are described in this
Section of the paper, with an aim to use them as motivation for why evaluation of
2 See Machin and Vignoles (2005) for a description of some of these policies and education reforms.

2
educational policies aimed at alleviating educational inequalities and reducing achievement
gaps is an important research area in the education field. The description we offer is
ordered by the education sequence that individuals follow, beginning with the pre-school
years, moving through the years of compulsory schooling, then on to post-compulsory
education and finally to adult, or lifelong, learning.
Pre-school education gaps
By now it is well known that gaps in educational achievement are present even before
children start school. The environments in which they grow up, and their family background,
means that children enter school with differing levels of cognitive (and non-cognitive) skills.
Consider the vocabulary skills of five year olds in the Millennium Cohort Study (MCS), as
reported in Table 1.3 The Table (taken from Dustmann et al, 2010) breaks down the MCS
vocabulary test by gender and ethnicity. The test scores have been standardised to have a
mean of 50 and a standard deviation of 10, so it is evident from the dispersion in the
numbers in the Table that sizeable gaps in vocabulary skills exist by gender and across
ethnic groups even at the time of school entry.
Compulsory schooling
The gaps seen at school entry evolve through the years of compulsory schooling. Some gaps
widen and others narrow as children's abilities at school lead them to move up or down the
distribution of educational outcomes. This, of course, can be affected by educational
policies that have scope to affect educational achievement.
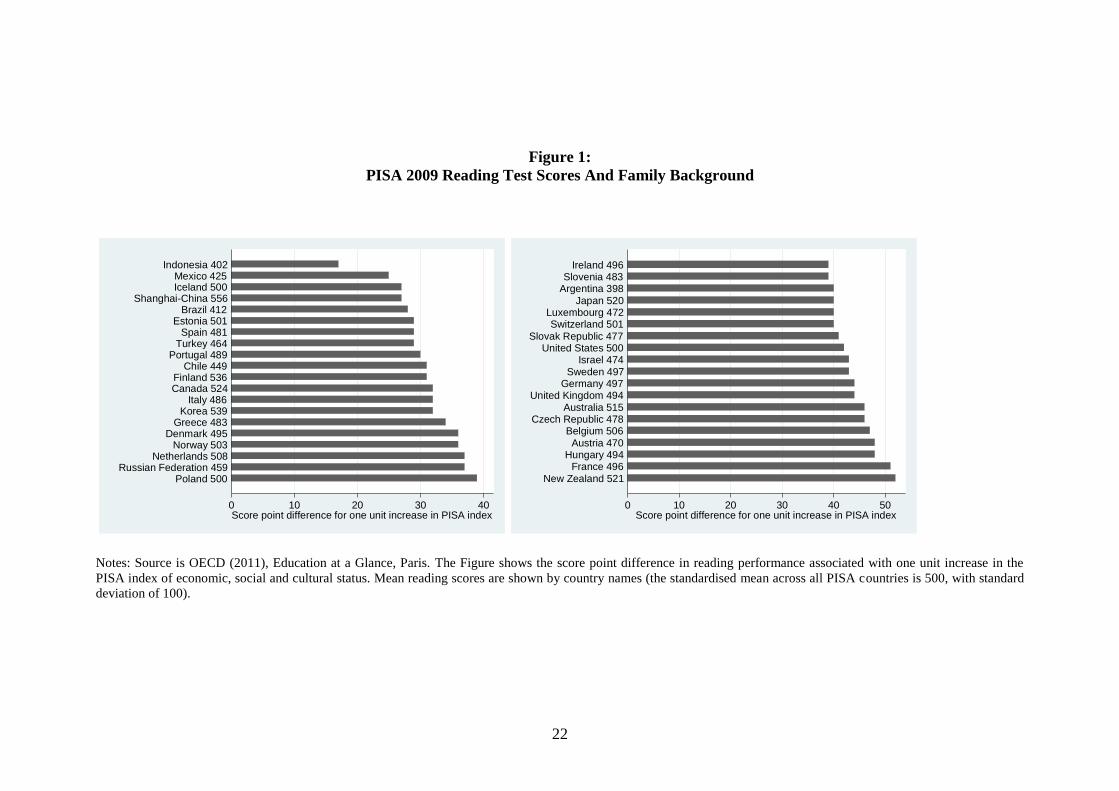
Educational inequalities remain pronounced in the years of compulsory schooling. Consider
Figure 1, which shows one example of educational inequality, namely test score differences
associated with family background. The Figure shows reading test score differences
3 The MCS is a longitudinal survey of around 19,000 children born in the UK over a twelve month period from
2000 to 2001. The first survey took place when the children were around nine months old. Follow-up interviews
have, at the time of writing, taken place when children were aged three, five and seven.

3
associated with a one unit increase in the PISA index of economic, social and cultural status
(ESCS) for 15 year olds in thirty nine countries, based upon data from the 2009 Programme
of International Student Assessment (PISA).4 The test scores have a mean of 500 and a
standard deviation of 100 and the mean score varies significantly by country (as shown on
the y-axis of the Figure). In all countries, however, there is a significant positive association
between family background measured by the ESCS index and test scores. The mean impact
of a unit increase in the index is 38 across countries (i.e. 38 percent of a standard deviation)
and the range of estimates goes from 17 (Indonesia) to 52 (New Zealand). The striking
finding from the PISA data is that test score gaps systematically vary by family background in
countries with very different education systems and where the quality of schooling varies.
Post-compulsory education
Educational disadvantages acquired in the years of pre-school and compulsory schooling
strongly impinge on whether individuals participate in post-compulsory tertiary education.
Figure 2 shows the percentage of individuals who complete tertiary education in thirteen
countries broken down by the level of their parents' education. The lightest bar corresponds
to parents with the lowest level of education (ISCED 0-2, those with completed education at
pre-primary, primary or upper secondary level) and the darkest to those with the highest
level (ISCED 5-6, those with a completed tertiary education). The gaps are sizeable and show
a consistent pattern across all the countries in the Figure - the percent of individuals who
complete tertiary education is far higher if their parents also have a tertiary education.
4 The PISA ESCS index is derived from the following variables: the International Socio-Economic Index of
Occupational Status (ISEI); the highest level of education of the student’s parents, converted into years of
schooling; the PISA index of family wealth; the PISA index of home educational resources; and the PISA index
of possessions related to “classical” culture in the family home. The variable is scaled to have a mean zero and a
standard deviation of one, so the numbers in the Figure can be read as a percent of a standard deviation. See
OECD (2011) for more information.
4
Adult learning
Educational inequalities do not stop increasing when individuals complete their full-time
education. They also tend to widen for adults in their working lives as adult education and
training occurs more for those who already have higher education levels. This is shown in
Figure 3, which shows the percentage of adults in twenty eight countries who received non-
formal job-related education in 2007 by education level. In all cases, this percentage is
higher if individuals have higher levels of education.
Summary
This Section makes it evident that educational inequalities emerge and persist at all stages
of the education sequence. Some educational achievement gaps widen out as individuals
progress further through the education sequence, especially those connected to
disadvantage. Thus, there is a significant need for careful evaluation of educational policies
that are designed to try to affect inequalities in education. The raft of education policies
introduced to the English education system in the last fifteen years or so offer a very good
setting to consider such evaluation methods, and their success (or otherwise) in enabling us
to gain a better understanding of what works in education, and this is what we consider in
the next Section of this paper.
3. Policy Evaluation Relating to Schools in England
Although policies at all stages of the lifecycle are relevant for improving educational
attainment and reducing inequality, in this Section we focus on school-level policies in
England. This is because the years of compulsory schooling are a very important time for
5
government intervention in a way that potentially affects all students.5 It is also because, in
addition, there is a body of good evaluation research of school-level policies in England in
recent years. We need to be selective of policy areas to be able to offer a rigorous critical
appraisal and so we therefore have chosen to discuss policies and their evaluation under the
following headings: the efficacy of school resources; market incentives; school autonomy;
and pedagogical approaches for raising educational attainment in schools.
School Resources
One of the perennial debates in the economics of education literature is whether additional
school expenditure has an effect on raising pupil attainment. It is also important to ask
whether such policies can be implemented in a way to reduce the kinds of attainment gaps
discussed earlier.
The relevant question is not about spending per se (which of course is necessary) but
whether additional spending can be cost effective at the typical levels found in developed
countries. Internationally, there are many studies about school expenditure but there are
different views about how to best interpret results. Hanushek (2008), for example, argues
that accumulated research suggests no clear, systematic relationship between resources
and student outcomes. However, others place more weight on studies with a particularly
strong methodological design that show positive effects (e.g. the class size studies of Angrist
and Lavy, 1999; Krueger, 1999; Krueger and Whitmore, 2001).
The difficult empirical issue in this area is that additional school resources are often
disproportionately allocated to disadvantaged students. Unless this is fully dealt with in the
methodological design, the relationship between resources and attainment is easily
obscured. The positive association between school resources and educational disadvantage
is counter-balanced against the negative association between educational disadvantage and
educational attainment. The net result can easily be an observed association between
school resources and educational attainment that is too low and does not reflect the true
5 Students are not forced to attend pre-primary education or to stay in education beyond age 16. The compulsory
years of education are the only time that government education policies can potentially affect all students.
6
causal relationship.6 It is very difficult to prove that this particular problem has been
overcome, particularly where it is not possible to implement randomised controlled
experiments. Yet as the third biggest category of government expenditure (in the UK)7, it is
important to get a sense of whether an increase or a reduction of spending is likely to affect
student outcomes – which are so important for the future of the economy as well as for the
individual’s future prosperity.
There have been several recent studies looking at this issue for English using a census of all
pupils (the National Pupil Database) and expenditure data for all schools. The English
National Curriculum is divided into four ‘key stages’, at the end of which students are
evaluated by their teachers (at age 7 and 14) or they undertake national tests that are
externally set and marked to the school (at age 11 and 16). Two studies that evaluate the
relationship between expenditure and attainment in secondary school are by Levăcić et al.
(2005) and Jenkins et al. (2006). They look at outcomes at age 14 (end of Key Stage 3) and
age 16 (end of Key Stage 4) respectively. Both studies find a small positive effect of
resources on pupil attainment. A difficulty is that they use political control as an instrument
for school expenditure. This involves making the assumption that political control of a Local
Authority only influences pupil-level outcomes through school expenditure. However,
Holmlund et al. (2008) show that changes in political control are correlated with changes in
the demographic characteristics of Local Authorities, even when the sample is restricted to
Local Authorities where the election outcome is ‘close’ and there is a small difference in the
share of seats of the two largest parties.
Government initiatives have provided a better framework to examine causal effects in this
context. Machin et al. (2004, 2010) evaluate a flagship policy of the Labour government in
the early 2000s – the Excellence in Cities (EiC) programme for English secondary schools. In
this programme, schools in disadvantaged, mainly urban, areas of England were given extra
resources to try to improve standards. Initially most of the funding was directed at core
strands (Learning Support Units; Learning Mentors; a Gifted and Talented Programme). Over
time, schools were allowed greater flexibility in how to use the funding. The methodological
approach is based on ‘differences-in-differences’, where schools in the ‘treatment group’ 6 Holmlund et al. (2010) illustrate that this is an important concern in an English context.
7 This refers to education spending as a whole, although most education spending is at school-level.

7
were compared to schools in appropriately defined comparison group before and after the
policy came into effect. Similarly to the study by Levăcić et al. (2005), they find evidence for
small average effects of additional resources for maths but not for English.
The studies looking at resource effects for primary schools (Gibbons et al, 2011; Holmlund
et al. 2010) find that effects are substantially higher for economically disadvantaged
students. For secondary schools, both Machin et al. (2010) and Levăcić et al. (2005) find
that resource effects are higher for disadvantaged students (although this is not found by
Jenkins et al, 2006). These findings are encouraging for policy because they suggest that
mechanisms have been in place to ensure that disadvantaged students benefit
disproportionately from increasing school resources. This helps to reduce the attainment
gap between socio-economic groups from what it might otherwise be. On the other hand, it
is interesting that both Machin et al. (2010) and Levăcić et al. (2005) find that high ability
students from disadvantaged backgrounds are most likely to benefit from these policies.
Machin et al. (2010) highlight a particular group of concern – low ability students from
disadvantaged backgrounds. These are ‘hard to reach’ students who may require more
resource-intensive programmes. Another important question is what to make of an effect
that appears to be small (at least on average). Levăcić et al. (2005) find that spending £100
more per pupil would raise maths attainment by 0.04 of a level whereas Machin et al.
(2011) find that spending £120 more per pupil raises maths attainment only by 0.01 of a
level (after about 3 years of the policy).8 Bradley and Taylor (2010) look at whether the
same policy (Excellence in Cities) and the ‘Specialist Schools’ policy had an effect on student
outcomes at age 16.9 They also report evidence of only modest effects.
To conduct an accurate Cost-Benefit Analysis, we need information both on costs and how
estimated educational benefits translate into a range of later outcomes – for example,
further education, probability of employment, wages, crime. Generally, it is not difficult to
estimate the costs of a policy. However, it is often difficult to estimate future benefits. In
the absence good information, Machin et al. (2010) ask how much the average benefits in
8 In the Key Stage attainment tests, progress is measured in ‘levels’. At each Key Stage, the National
Curriculum defines the level at which students are expected to achieve. In the Key Stage 3 test (i.e. the test used
in Levăcić et al. (2005) and Machin et al. (2011)), most children achieve within the range of levels 3-8. 9 Specialist schools are state-maintained secondary schools with a designated subject specialism. They need to
apply for specialist status and, if successful, receive significant additional funding.

8
terms of exam achievement would have to translate into higher wages for the policy to
break-even. In line with the literature, they assume an average rate of return to a year of
schooling to be about 8 per cent. Using the Family Resources Survey data for England and
Wales, they obtain a wage profile (an average of weekly earnings by age, for all individuals).
If pupils were to obtain the equivalent benefit of a whole year of education at age 14 and
then started work at age 16, the lifetime benefit of this extra year is estimated to be about
£20,000.10 According to the National Curriculum a one level improvement corresponds to
about 2 years of schooling. If this is true, the benefit of EiC is about 0.02 of a year of
schooling (i.e. 0.01 x 2) – which comes to about £400 over the lifetime (i.e. 0.02 x £20,000).
This is very similar to the cost of EiC policy (£120 x 3). This very simple analysis suggests that
EiC policy breaks even if improvement in Key Stage 3 results corresponds to years of
schooling in the way suggested by the National Curriculum. Even if this is way off the mark,
benefits of improved attendance at school and higher achievement at age 14 may lead to
economic benefits in the short and long term that we do not observe – for example,
increased probability of staying on at school beyond compulsory school-leaving, higher
probability of employment, lower probability of turning to crime.
There have been two recent papers about the effects of school expenditure in primary
schools (Holmlund et al. 2010; Gibbons et al. 2011). Holmlund et al. (2010) use the National
Pupil Database between 2002 and 2007 – a period of time in which there was a large
increase in school expenditure in England. They find evidence of a consistently positive
effect of expenditure across subjects. The magnitude is a little bigger than that found for
secondary schools but still modest. Gibbons et al. (2011) uses a very different strategy than
that used for other papers and the study applies to schools in urban areas that are close to
Local Authority boundaries. The percentage of poor children in these schools is much higher
than the national average (28% are eligible to receive free school meals, compared to 16%
nationally). The strategy uses the fact that closely neighbouring schools with similar pupil
intakes can receive markedly different levels of core funding if they are in different
education authorities. This is because of an anomaly in the funding formula which provides
an ‘area cost adjustment’ to compensate for differences in labour costs between areas 10
The estimated benefit is calculated based on the weekly earnings of all individuals in the Family Resources
Survey (2002/03) between the age of 16 and 64. The Net Present Value of an extra year of schooling at age 14
is then calculated using a discount rate of 3.5% - the recommended discount rate in the UK HM Treasury Green
Book (http://greenbook.treasury.gov.uk).

9
whereas in reality teachers are drawn from the same labour market and are paid according
to national pay scales. The study shows that schools on either side of Local Authority
boundaries receive different levels of funding and that this is associated with a sizeable
differential in pupil achievement at the end of primary school. For example, for an extra
£1,000 of spending, the effect is equivalent to moving 19% of students currently achieving
the expected level (or grade) in Maths (level 4) to the top grade (level 5) and 31% of
students currently achieving level 3 to level 4 (the expected grade at this age, according to
the National Curiculum). Bearing in mind that a one level improvement in the National
Curriculum has been interpreted as equivalent to two years of schooling (discussed above)
and that each extra year of schooling has an estimated benefit over the lifetime of £20,000,
the cost of additional school resources can be easily justified in a cost-benefit framework.
Taken together, the papers suggest that there is important heterogeneity in the effects of
pupil expenditure with stronger effects in poorer areas (which is good for reducing the
attainment gap between socio-economic groups). They suggest that school resources can, in
an appropriate setting, matter a lot and that government cuts in this area are of real
concern.11
Incentives
Over the last thirty years, there has been a concerted effort to increase parental choice,
competition between schools and accountability of schools for the performance of children.
If the ‘market’ works well, parents should be able to make an informed choice about what
school to send their child and schools should have an incentive to improve performance
because their funding is linked strongly to pupil numbers and information is made available
to parents through the accountability framework (school inspections and publication of
‘league tables’ of school performance).
11
In education, nominal spending is staying constant (apart from the ‘pupil premium’). However, simple
calculations suggest that even schools benefiting from the ‘pupil premium’ will experience a real decrease in
funding because of high inflation.

10
Legislation from the 1980s has enabled parents to apply to any state school. Schools are
only permitted to discriminate if there is over-subscription and according to an enforced
Code of Practice. The most important over-subscription criteria is usually proximity to the
school. Evidence that parents act on available information in making these choices is shown
in the literature relating school quality to house prices. In England, the positive relationship
between school quality and house prices is shown by Gibbons and Machin (2003), Rosenthal
(2003) and Gibbons et al. (2009).12 Burgess et al. (2009) also show that academic standards
are important in both parents’ stated and revealed preferences for school choice. Of course,
the link between choice and parental income means that many parents are unable to
exercise meaningful choice because of their lower income (i.e. they cannot afford to live
very close to a popular school). Furthermore, West and Pennell (1999) show that higher
socio-economic groups have better information and understanding of school performance.
Thus, ‘school choice’ (although good in itself) does not offer the same advantages to those
from lower and higher socio-economic groups. It does not help to address attainment gaps
by family background.
Parental choice and incentives for schools to perform well should give rise to competition
between schools. In the international literature, there have been many attempts to
investigate whether increased competition gives rise to improved educational attainment.
However, the international evidence is ‘voluminous and mixed’ (Gibbons et al. 2008) and
there are few papers in England. Bradley et al. (2001) look at this at school-level (for
secondary schools) and find that schools with the best examination performance have
grown more quickly. They argue that increased competition between schools led to
improved exam performance. The first pupil-level analysis on this subjects relates to primary
schools in the South East of England (Gibbons et al. 2008). The authors find no relationship
between the extent of school choice in an area and pupil performance. The study also
suggests that there is no causal relationship between measures of school competition and
pupils’ educational attainment. The only case where choice and competition might be
beneficial is in the case of faith schools.13 This might because many faith schools are
12
See reviews of the wider literature in Black and Machin (2010) and Machin (2011). 13
Faith primary schools are attended by about a fifth of all pupils. One third are Catholic Schools (voluntary
aided) and two-thirds are Church of England schools (under more direct control from the Local Authority), with
a very small number of schools aiming to educate children of other faiths. Such schools can only discriminate

11
voluntary aided and have great autonomy than other state schools (e.g. there is less
representation from the Local Authority on the board of governors; they control their own
admissions, although they must adhere to the Code of Practice). Therefore in might be the
case that competition would play a more important role in school performance if schools
were more autonomous.
School autonomy
In most countries, state schools operate within a framework imposed on them by their
jurisdiction in terms of rules about teacher pay and conditions, admissions, the curriculum,
composition of the governing body and so on. In some countries, more independent state
schools have been allowed to emerge. For example, there are ‘charter schools’ in the US,
‘free schools’ in Sweden and ‘academies’ in England (since the year 2000). The details vary
between countries but in all cases, the general idea is that a new school type emerges
where schools that are funded by the state are given more autonomy than the typical state
schools in how they are allowed to operate.14 The rationale is that this greater autonomy
will encourage more innovative policies in schools and help to raise standards. They may
also increase competition between schools in the local area, thereby raising attainment.
In England, ‘academies’ are managed by their sponsors and any governors they appoint.
They have responsibility for employing all staff, agreeing pay and conditions, freedom over
most of the curriculum (except for core subjects) and all aspects of school organisation.
Originally, academies were established as a replacement for a failing secondary school in an
area of economic disadvantage. Details of how the system operated are well documented
by Wilson (2011). More recently the nature of the academies programme has changed with
the prospect of becoming an academy school becoming much more widely available.
by religion in the event of over-subscription. As a result, many of these schools have a significant minority of
children from other faith traditions than their own. 14
See Machin and Vernoit (2011) for a more detailed discussion of how greater autonomy exists in one
particular type of these newer kinds of schools, academies in the English secondary school sector. In a nutshell,
there is more autonomy as compared to a traditional state school in that there is less control from the Local
Authority, as admissions and teacher hiring are under school control, governing bodies are both more diverse
and have more responsibility for school polices and the curriculum followed can be more broadly defined (as
the National Curriculum is only followed in english, maths, science and ICT).

12
Machin and Vernoit (2010) show that schools that have recently expressed an interest in
converting to an academy are characterised by a more advantaged student intake (e.g. a
lower proportion eligible to receive free school meals) and higher educational attainment.
Machin and Vernoit (2011) provide evidence on the effects of the programme for schools
that because academies between school years 2002/3 and 2008/9. All these schools were
secondary schools. They use the pupil census (the National Pupil Database) to implement a
difference-in-differences approach. That is, they estimate the impact of academy school
conversion on the school’s pupil intake and performance by comparing average outcomes in
these schools relative to an appropriately defined comparison group, before and after the
conversion took place. They adopt a similar approach to look at the effect of academy
school conversion on neighbouring schools.
There are three main findings. First, there was a step-change in the pupil intake of schools
after they converted to academy status. They started to attract and admit higher ability
pupils. Second, these school also started to perform significantly better in GCSE exams (even
accounting for their improved intake).15 Moreover, the achievement gains were most
marked in schools that made the biggest move in autonomy (i.e. changing from a
community school to an academy, as compared to moves to academy status from being
voluntary controlled or aided, from being a foundation school or from being a city
technology college). Third, neighbouring schools started to perform better even though they
were left with a lower pupil intake. The positive impact on neighbouring schools may be
because of increased choice and competition and/or the sharing of academy school facilities
(and expertise) with the wider community.
Thus, the idea of granting schools greater autonomy seems to have worked well in England.
Furthermore, because the policy was initially targeted at disadvantaged areas, it has been
an instrument to reduce attainment gaps along the socio-economic dimension (when
viewed at a national level). However, one has to be careful about any projection of effects
from a relatively small number of schools that became academies over this time period.
Schools that are enrolling into the Academies Programme now have different characteristics 15
GCSE stands for General Certificate of Secondary Education. The exams are undertaken by pupils in their
final year of compulsory schooling when they are aged 16.
13
(e.g. on average they are less disadvantaged at baseline) and it might be that the
Programme has different effects in such schools. Furthermore, concerns about the future
include whether centrally provided services provided by Local Authorities (e.g. for students
with special needs) will be undermined if too many schools become academies; whether
small schools will have the people and infrastructure to cope with new responsibilities;
whether more centralised regulation (i.e. a national Schools Commissioner rather than the
Local Authority) will be effective in identifying and dealing with problems that might arise. A
crucial aspect of markets that is hard to operationalize in the public sector is the exit of
schools (or management) that are doing badly for their students. It remains difficult,
unpopular and slow to close down schools, even if they are performing badly.
Pedagogy
Whereas school autonomy seems to have become a popular concept in England since 2000,
this is not true of some aspects of school organisation. There have been very prescriptive
measures to raise standards in literacy and numeracy via pedagogical methods.
Top-down policies to influence the teaching of literacy and numeracy in primary schools
were first introduced in the late 1990s to some Local Education Authorities (LEAs) in
England. For the most part, these were a handful of inner city LEAs – 12 LEAs with respect to
the ‘literacy hour’ and 13 LEAs with respect to the ‘numeracy hour’. There was very little
geographic overlap regarding where these policies were implemented. The background to
these initiatives was concerns about poor standards of literacy and numeracy in English
schools. Subsequently both these policies were rolled out nationally as the ‘National
Literacy Strategy’ and ‘National Numeracy Strategy’ respectively (in 1998 and 1999
respectively).
The core of these initiatives was a daily ‘literacy hour’ and ‘numeracy hour’ to be taught in
primary schools. They aimed to improve the quality of teaching through more focused
instruction and effective classroom management. Both the ‘literacy hour’ and ‘numeracy
hour’ were supported by a framework for teaching, which sets out termly objectives for the
14
5-11 age range and provides a practical structure of time and class management. With
regard to the ‘literacy hour’ a range of texts were specified and teaching objects set out at
three levels (text, sentence and word) to match the text types studied. The daily literacy
hour was divided between 10-15 minutes of whole class reading or writing; 10-15 minutes
whole-class session on word work (phonics, spelling and vocabulary) and sentence work
(grammar and punctuation); 25-30 minutes of directed group activities (on aspects of
writing or reading) and a plenary session at the end for pupils to revisit the objectives of the
lesson, reflect on what they have learnt and consider what they need to do next. The
framework document for the ‘numeracy hour’ also contained a booklet of examplar lessons
and training on strategies to teach mental calculation. The hour itself consisted of a three-
part template for daily mathematics lessons, starting with 10-15 minutes of oral/mental
arithmetic practice, then direct interactive teaching of whole classes and groups, and finally
10 minutes of plenary review.
Neither the literacy nor numeracy hour represented an increase in the overall time allotted
to teaching these subjects. But both represented a dramatic change in how these subjects
were taught. This is explained in detail by Machin and McNally (2008) with respect to the
literacy hour.
Since the National Strategies were preceded by de facto pilot projects (although they were
not seen to be such at the time), there has been opportunity to evaluate their effectiveness
via a difference-in-differences strategy. That is, one can compare educational attainment at
the end of primary school in ‘treatment schools’ to schools in an appropriately defined
comparison group, before and after the ‘pilot’ project was introduced. Machin and McNally
(2008) evaluate the ‘literacy hour’ using this methodology.16 The results point to a
significant impact of the literacy hour with their being a 2-3 percentage point improvement
in the reading and English skills of primary school children affected by the introduction of
the policy. Perhaps of most significance is that effects are generated at an extremely low
cost per pupil. The main costs were local centres and literacy consultants in each Local
Authority, with some funding to schools for teacher training and resources. Machin and
McNally (2008) estimate costs of only about £25 per pupil whereas (discounted) labour
16
Very similar results are found for the ‘numeracy hour’ in subsequent analysis (available on request).
15
market benefits for the improvement in reading are estimated at between £69 and £179 per
year of working in the labour market.
Although the National Literacy and Numeracy Strategies are likely to be responsible for a
considerable proportion of the improvement in educational performance of primary schools
in the 2000s, there is a hard core of students for whom generic pedagogical approaches are
not sufficient. About one-fifth of students still do not attain the government targets of ‘level
4 or above’ by the end of primary school (in the National Curriculum, ‘level 4’ is the
expected level of knowledge and skills at this age). Another more recent initiative to try to
address this was the ‘Every Child a Reader’ programme introduced to schools in some Local
Authorities in the mid-late 2000s. The core of this initiative is Reading Recovery, which
provides children in the greatest difficulty with daily one-to-one tuition for up to 20 weeks.
The programme has been evaluated by a consortium of research institutions (Tanner et al.
2010). The economic evaluation (by researchers at IFS17) is also based on a difference-in-
differences methodology (as described above). They find that schools introducing the policy
had significantly better educational attainment for children at age 7 in reading and writing
(i.e. the end of Key Stage 1). The overall effect is similar to the ‘literacy hour’ in that it
increases the proportion of students achieving the expected standard by about 2
percentage points. However, it is considerably more expensive. The programme costs
£3,000 per child in the first year and £2,600 per child thereafter. The future benefits depend
on how long the effects endure for. The authors estimate that for the policy to break-even,
it would have to increase the probability of obtaining better formal qualifications at age 18
by at least 4 percentage points.
Slavin et al. (2011) review a wide range of evidence on programs to help struggling readers
(using international evidence). This includes one-to-one programmes like Reading Recovery
but also one-to-one teaching programmes by para-professionals/volunteers; small group
tutorials; classroom instructional approaches; and instructional technology. The review is
very positive about the effectiveness of programmes like Reading Recovery. The authors
conclude that there should be a strong focus on improving classroom instruction and then
providing one-to-one tutoring to students who continue to experience difficulties. Given the
17
http://www.ifs.org.uk/pr/ecar_2011.pdf
16
likely costs involved (as documented by the IFS researchers for England) compared to the
costs of more classroom instructional methods (like the literacy and numeracy hours), it
would seem that the optimal programme would only implement one-to-one tuition in a
context where classroom instructional methods had already been improved as much as
possible. However, these more expensive programmes (if well targeted) might be especially
helpful for ‘hard to reach’ students who are not helped sufficiently by more generic
programmes. If they are successful, they might reduce problems much further down the line
such as drop-out at age 16/17 (which is a bigger problem in England than in many other
European countries). Another question is whether such programmes really need to be
prescribed from central government or whether they can be left to individual schools.
Arguments for intervention at a central or local level are economies of scale in the provision
of relevant infrastructure (e.g. training programmes) that are difficult to organize by
practitioners at a school level, who are mainly occupied with day-to-day activities in their
own school. However, too much prescription (especially from a high-level of government)
can mean that schools do not have the flexibility to adapt programmes in a suitable way for
their own circumstances and takes away the professional autonomy sought after in other
areas of educational policy. A more highly skilled and trained teaching workforce might
remove the need for prescribed methods of classroom instruction. There is little research
for England showing the importance of teacher quality because the relevant data is not
made available to researchers (and not collected at classroom level).18 However, the
importance of teacher quality is well illustrated in other countries such as for the US. For
example, Rivkin et al. (2002) show that having a teacher at the higher end of the quality
distribution is very important for raising student achievement. However, the cost of
recruiting, retaining and on-going training of teachers is expensive. Furthermore, a
consequence of the increase in graduate opportunities over recent decades (especially for
women) is that it is more difficult to attract and retain high qualified people in teaching.
18
While the new School Workforce Census will certainly help researchers, it is still the case that teachers are
not linked to classes they teach. There can be many classes in a year group.

17
4. Conclusions
In this paper, we began by describing educational inequalities that appear at all stages in the
lifecycle and used this as a motivation for then discussing evaluation of various school-level
policies in England. It is clear that educational attainment gaps along various dimensions are
evident from the earliest time these are measured and throughout the lifecycle. Of special
concern for social mobility is the gap according to family background. We therefore review
various school-level policies that have been implemented in England where there is at least
some economic evaluation of a high standard, with the aim of seeing how they have scope
to impinge on educational inequalities. We are necessarily selective and consider
evaluations in the areas of school resources, market incentives, school autonomy and
pedagogical approaches in turn.
There have been several recent studies about the effects of school resources on educational
attainment. Quite often, they find evidence of a modest effect of school resources on
educational attainment. The exception is the recent study by Gibbons et al. (2011), which
suggests larger effects. This study applies to schools in urban areas and is of particular
interest because of the larger proportion of disadvantaged students in these areas. In fact,
several of these studies suggest that expenditure effects are larger for economically
disadvantaged students. This suggests that school resource policies can help to reduce
attainment gaps by family background (especially if deliberately introduced to do so). This is
good news for the Pupil Premium policy, although worrying because school expenditure will
fall in real terms for most schools.
The evidence for the effects of choice and competition suggests that higher socio-economic
groups benefit more from school choice and competition does not seem to raise
educational standards. However, this might be because many schools have not had enough
flexibility to respond to competitive pressures. The evidence on school autonomy (i.e. in the
context of ‘the academies programme’) suggests that this produced positive educational
achievement gains both for participating schools and their neighbours in the areas where

18
they were first introduced. It can be viewed as a policy with some redistributive effects
because academies were first introduced to disadvantaged areas. However, the early effects
of academies cannot be extrapolated to a much bigger programme that no longer targets
particular areas. The expansion of the programme presents new challenges – for example
for monitoring and accountability; for small schools; for services traditionally provided by
Local Authorities to all schools in their area.
Pedagogical approaches have been shown to be important for improving educational
attainment. Classroom instructional methods (as manifest in the National Literacy and
Numeracy Strategies) can be extremely cost-effective. However, they will not necessarily be
enough to lift the performance of hard-to-reach children. If we are serious about improving
the prospects of these children, then programmes like Reading Recovery may be necessary.
Although they are expensive, they have been shown to be effective and may be important
for reducing serious problems down the line such reducing the number of people who are
‘not in education, training or employment’ at a young age. The need to actually prove such
effects (to help future investment decisions) is why longitudinal studies and high quality
economic evaluation should remain high on the policy agenda.
Finally, it is worth remarking that England offers a useful setting for an appraisal of
evaluations of education policies, due to the quest for evidence based policy formation and
because of the large number of policies that have been implemented. However, the policies
that seem to work best are those where a need or intervention can be identified (e.g.
because things are not working properly) and so one needs to be careful to recognise that
their scope to generate educational improvements is often place and context specific. There
is therefore a need to be very careful indeed if one wishes to try to generalise the results
from economic evaluations of education policies like the ones described in this paper to
other settings.
19
References
Angrist, J. and V. Lavy (1999) Using Maimonides’ rule to estimate the effect of class size on
scholastic achievement, Quarterly Journal of Economics, 114, 533-75.
Black, S. and S. Machin (2010) Housing Valuations of School Performance, in Hanushek, E., S.
Machin and L. Woessmann (eds.) Handbook of the Economics of Education, Volume
3, North Holland.
Bradley, S., G. Johnes and J. Millington (2001) School Choice, Competition and the Efficiency
of Secondary Schools in England, European Journal of Operational Research, 135,
527-544.
Bradley, S., and J. Taylor (2010) Diversity, Choice and the Quasi-Market: An Empirical
Analysis of Secondary Education Policy in England. Oxford Bulletin of Economics and
Statistics, 72, 1-26.
Burgess, S., E. Greaves, A. Vignoles and D. Wilson (2009) Parental Choice of Primary School
in England: What ‘type’ of School do Parents Choose? The Centre for Market and
Public Organisation, 09/224, Department of Economics, University of Bristol.
Dustmann, C., S. Machin and U. Schonberg (2010) Ethnicity and Educational Achievement in
Compulsory Schooling, Economic Journal, 120, F272-F297.
Eurostat (2009) The Bologna Process in Higher Education in Europe. Key indicators on the
Social Dimension and Mobility, Eurostat.
Gibbons, S., S. Machin and O. Silva (2009) Valuing school quality using boundary
discontinuity regressions, SERC DP0018. London School of Economics.
Gibbons, S, S Machin and O Silva (2008) Competition, Choice and Pupil Achievement,
Journal of the European Economic Association, 6, 912-47.
Gibbons S. and S. Machin (2003) Valuing English Primary Schools, Journal of Urban
Economics, 53, 197-219.
Gibbons, S., S. McNally and M. Viarengo (2011) Does Additional Spending Help Urban
Schools? An Evaluation Using Boundary Discontinuities? CEE Discussion Paper. No.
128. London School of Economics
Hanushek, E. A. (2008) Education Production Functions, in Durlauf, S. and L. Blume (eds.),
The New Palgrave Dictionary of Economics. Basingstoke: Palgrave Macmillan.
20
Holmlund, H., S. McNally, and M. Viarengo (2010) Does Money Matter for Schools?,
Economics of Education Review, 29, 1154-1164.
Holmlund, H., S. McNally and M. Viarengo (2008) Impact of School Resources on Attainment
at Key Stage 2, Research Report DCSF-RR043. Department of Children, Schools and
Families.
Jenkins, A, R. Levačić and A. Vignoles (2006) Estimating the Relationship between School
Resources and Pupil Attainment at GCSE, Research Report RR727, Department for
Education and Skills.
Krueger, A., and D. Whitmore (2001) The Effect of Attending a Small Class in the Early
Grades on College-Test Taking and Middle School Test Results: Evidence from Project
Star, Economic Journal 111: 1-28
Krueger, A. (1999) Experimental Estimates of Education Production Functions, Quarterly
Journal of Economics, 114, 497-532.
Levačić, R., A. Jenkins, A. Vignoles, F. Steele and R. Allen (2005) Estimating the Relationship
Between School Resources and Pupil Attainment at Key Stage 3, Research Report
RR679, Department for Education and Skills.
Machin, S. (2011) Houses and Schools: Valuation of School Quality Through the Housing
Market, Labour Economics, 18, 723-9
Machin, S., S. McNally and C. Meghir (2010) Resources and Standards in Urban Schools.
Journal of Human Capital, 4, 365-393.
Machin, S., S. McNally and C. Meghir (2004) Improving Pupil Performance in English
Secondary Schools: Excellence in Cities, Journal of the European Economics
Association, 2, 396-405.
Machin, S., and S. McNally (2008) The Literacy Hour Journal of Public Economics, 92, 1141-
1462.
Machin, S. and J. Vernoit (2010) A Note on Academy School Policy,
http://cep.lse.ac.uk/pubs/download/pa011.pdf
Machin, S., and J. Vernoit (2011) Changing School Autonomy: Academy Schools and Their
Introduction to England’s Education. CEE Discussion Paper. No. 123. London School
of Economics.
Machin, S. and A. Vignoles (2005) What’s the Good of Education? The Economics of
Education in the United Kingdom, Princeton University Press.

21
OECD (2011) Education at a Glance, OECD: Paris.
Rivkin, S., E. Hanushek and J. Kain (2002) Teachers, schools and academic achievement,
Econometrica, 73, 417-458.
Rosenthal L. (2003) The value of secondary school quality, Oxford Bulletin of Economics and
Statistics, 65, 329-355.
Slavin, R.E., C. Lake, S. Davis and N. A. Madden (2011) Effective Programs for Struggling
Readers: A Best-Evidence Synthesis, Educational Research Review, 6, 1-16.
Tanner, E., A. Brown, N. Day, M. Kotecha, N. Law, G. Morrell, O. Turczuk, V. Brown, A.
Collingwood, H. Chowdry, E. Greaves, C. Harrison, G. Johnson, and S. Purdon. (2010)
Evaluation of Every Child a Reader (ECAR). Department of Education, Research
Report DFE-RR114.
Wilson, J. (2011) Are England’s Academies More Inclusive or More ‘Exclusive’? The Impact of
Institutional Change on the Pupil Profile of Schools. CEE Discussion Paper. No. 125.
London School of Economics.
West, A. and H. Pennell (1999) School Admissions: increasing equity, accountability and
transparency, British Journal of Education Studies, 46, 188-200.
22
Figure 1:
PISA 2009 Reading Test Scores And Family Background
0 10 20 30 40Score point difference for one unit increase in PISA index
Poland 500Russian Federation 459
Netherlands 508Norway 503
Denmark 495Greece 483
Korea 539Italy 486
Canada 524Finland 536
Chile 449Portugal 489
Turkey 464Spain 481
Estonia 501Brazil 412
Shanghai-China 556Iceland 500Mexico 425
Indonesia 402
0 10 20 30 40 50Score point difference for one unit increase in PISA index
New Zealand 521France 496
Hungary 494Austria 470
Belgium 506Czech Republic 478
Australia 515United Kingdom 494
Germany 497Sweden 497
Israel 474United States 500
Slovak Republic 477Switzerland 501
Luxembourg 472Japan 520
Argentina 398Slovenia 483
Ireland 496
Notes: Source is OECD (2011), Education at a Glance, Paris. The Figure shows the score point difference in reading performance associated with one unit increase in the
PISA index of economic, social and cultural status. Mean reading scores are shown by country names (the standardised mean across all PISA countries is 500, with standard
deviation of 100).

23
Figure 2:
Percent of Individuals Having Completed Tertiary Education by
Educational Attainment of Their Parents, 2005
020
40
60
80
Perc
ent C
om
ple
ted
Tert
iary
Edu
ca
tion
AU BE DK FI GR IR IT LU NL NO SP SW UK
Parents ISCED 0-2 Parents ISCED 3-4
Parents ISCED 5-6
Notes: From Eurostat (2009) based upon EU Statistics on Income and Living Conditions (EU-SILC) data. The Figure excludes former Eastern European countries and
countries for which data was described as provisional or unreliable. ISCED 0-2 is completion of pre-primary, primary or upper secondary education, ISCED 3-4 is
completion of upper secondary or post-secondary non-tertiary education and ISCED 5-6 is completion of tertiary education.

24
Figure 3:
Participation Rate in Non-Formal Job-Related Education by Level of Educational Attainment, 2007
020
40
60
Perc
ent Job
Rela
ted
No
n-F
orm
al E
duca
tion
AU BE CA CH CZ DE ES FI FR GE GR HU IR IT
ISCED 0-2 ISCED 3-4
ISCED 5-6
020
40
60
80
Perc
ent Job
Rela
ted
No
n-F
orm
al E
duca
tion
KO NL NO NZ OZ PO PT SL SP SV SW TU UK US
ISCED 0-2 ISCED 3-4
ISCED 5-6
Notes: Source is OECD (2011). Data is for 2007 for most countries. Exceptions are: 2005 (US); 2006 (FI, FR, IT, NZ, PO, UK); 2008 (BE, CA, CZ, DK, IR, NL); 2009
(CH). ISCED 0-2 is completion of pre-primary, primary or upper secondary education, ISCED 3-4 is completion of upper secondary or post-secondary non-tertiary education
and ISCED 5-6 is completion of tertiary education.

25
Table 1:
Age 5 Differences in Vocabulary Tests by Gender and Ethnicity, Millennium Cohort Study
Ethnic Group Boys Girls
White British 55.9 56.5
Black, Caribbean 48.4* 51.0*
Black, Other 44.2* 47.2*
Bangladeshi 40.4* 41.7*
Pakistani 40.6* 40.7*
Indian 49.8* 50.3*
Chinese 41.2* 55.2
Number of Children 4,587 4,452
Notes: Based on Table 3 of Dustmann, Machin and Schonberg (2010). The vocabulary test is standardised to have mean 50 and a standard
deviation of 10. A * denotes statistically significant differences relative to White British boys or girls respectively.