Embed Size (px)
Citation preview
ONE AND THREE-DIMENSIONAL MODELLING FOR PROCES OF CHARGE EXCHANGE IN RECIPROCATING COMBSUTION ENGINE
M. Eng. Hussein Ali AHMED, Eng. Mateusz GANDYK, Marcin TKACZYK, Ph.D, Radosław WRÓBEL, Ph.D.
WROCŁAW UNIVERSITY OF TECHNOLOGY, CATHEDRAL OF AUTOMOTIVE ENGINEERING
1. AIM AND CONTENT Authors took up the issue of engine simulation and tuning. Engine taken into consideration is developed since 1983 and nowadays is one of the best engine used in speedway. That makes it hard to improve. Therefore the author decide to use modern computer design technics. In racing, where the few Nm is the difference between winning and losing, every improve is important. Aim of this description is show nowadays possibilities of improving engine parameters by changing characteristic of flow. 2. PRINCIPLE OF ENGINE TUNING
Every engine consists of block and cylinders, each cylinder has a bore and stroke. On this data it is possible to define displacement of the engine, bore to stroke ratio and mean piston speed (Cp). Cp parameter is very high for a racing used engines. Nowadays Moto GP engines has mean piston equal 25m/s.
Bore to stroke ratio: 𝐾𝑏𝑠 = 𝐵𝑆 (1.1)
Engine displacement 𝑉𝑒 = 𝜋4𝑥 𝐵𝑚𝑚
2
100𝑥 𝑆𝑚𝑚
10 (1.2)
Mean piston speed [m/s] 𝐶𝑝 = 2𝑥 𝑆𝑚𝑚
103𝑥 𝑁𝑟𝑝𝑚
60 (1.3)
Important factor, especially in racing engines is power and torque. Torque is taken from the engine dynamometers measurements or could be calculated from brake mean effective pressure (BMEP). Power is a value which results from torque and rotational speed of the engine. Power [kW]: 𝑁 = 2𝜋
103𝑥𝑇𝑂𝑅𝑄𝑈𝐸𝑁𝑚𝑥
𝑁𝑟𝑝𝑚60
(1.4)
or: 𝑁 = 𝐵𝑀𝐸𝑃𝑏𝑎𝑟𝑥105
103𝑥 𝑉𝑒106
𝑥 𝑁𝑟𝑝𝑚60
𝑥 𝑛𝑐𝑦𝑙2 𝑟𝑒𝑣𝑠 𝑝𝑒𝑟 𝑐𝑦𝑐𝑙𝑒
(1.5)
BMEP is proportional to the torque of the engine. Typical BMEP value in MotoGP engine is a 14 bar at 16,100 rpm. IMEP is 18,52 bar, PMEP is 1,26 bar and FMEP is a 3,26 bar. BMEP is rarely higher than 14 bar. For example racing motorcycle engine from 1955 has BMEP equal almost 14 bar. Nowadays MotoGP engines has BMEP also about 14 bar, but the power is taken from the rpm’s. Todays that BMEP is achieved in about 17 000 rpm and in old engines it was only 7000 rpm. Mechanical efficiency of that kind of modern engine is a 75,6 %. Another important factor is delivery ratio (DR). It is talking about how many air is taken by the engine.
𝐷𝑅 =𝑀𝑐𝑦𝑐𝑙𝑒𝑎𝑖𝑟
𝜌𝑟𝑒𝑓𝑉𝑒=
60𝑁360
∫ 𝐶𝑑𝜌𝑐𝐴𝑡𝑑𝜃𝑏𝑑𝑐𝑡𝑑𝑐
𝜌𝑟𝑒𝑓𝑉𝑒~ ∫ 𝐴𝑠𝑡𝑝𝑑𝜃
𝑏𝑑𝑐𝑡𝑑𝑐6𝑁𝑉𝑒
(1.6)
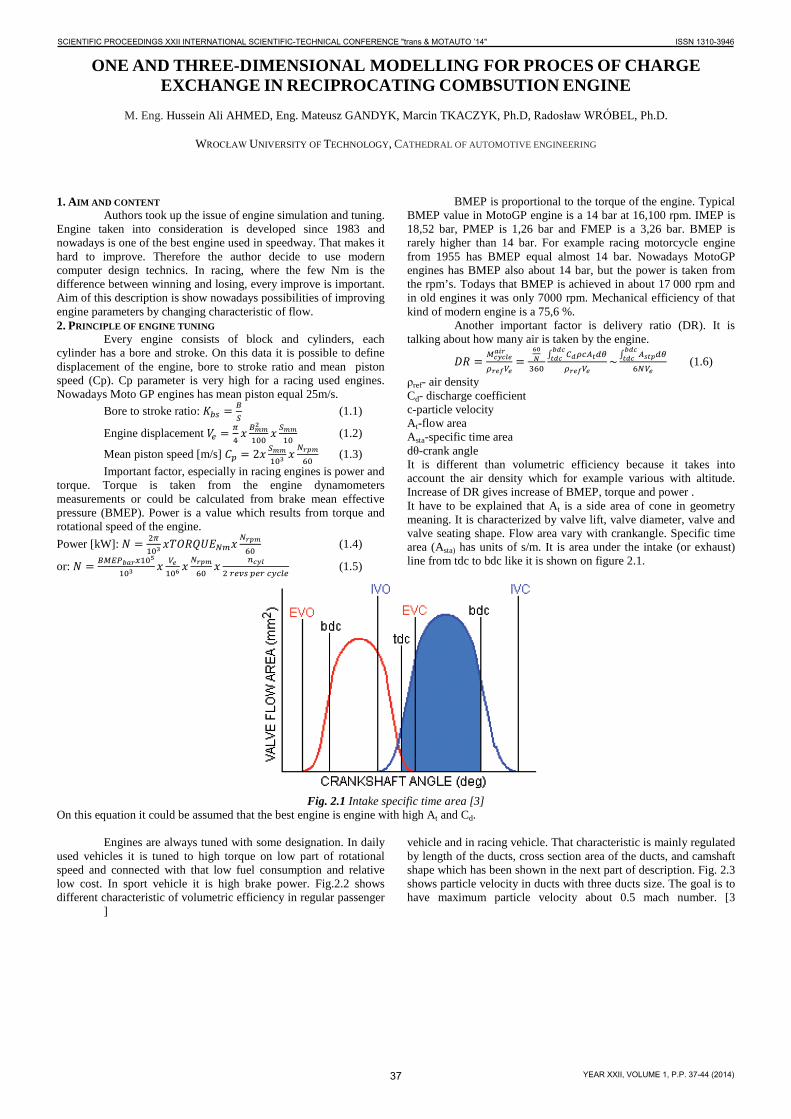
ρref- air density Cd- discharge coefficient c-particle velocity At-flow area Asta-specific time area dθ-crank angle It is different than volumetric efficiency because it takes into account the air density which for example various with altitude. Increase of DR gives increase of BMEP, torque and power . It have to be explained that At is a side area of cone in geometry meaning. It is characterized by valve lift, valve diameter, valve and valve seating shape. Flow area vary with crankangle. Specific time area (Asta) has units of s/m. It is area under the intake (or exhaust) line from tdc to bdc like it is shown on figure 2.1.
Fig. 2.1 Intake specific time area [3]
On this equation it could be assumed that the best engine is engine with high At and Cd. Engines are always tuned with some designation. In daily
used vehicles it is tuned to high torque on low part of rotational speed and connected with that low fuel consumption and relative low cost. In sport vehicle it is high brake power. Fig.2.2 shows different characteristic of volumetric efficiency in regular passenger
vehicle and in racing vehicle. That characteristic is mainly regulated by length of the ducts, cross section area of the ducts, and camshaft shape which has been shown in the next part of description. Fig. 2.3 shows particle velocity in ducts with three ducts size. The goal is to have maximum particle velocity about 0.5 mach number. [3
]
37
SCIENTIFIC PROCEEDINGS XXII INTERNATIONAL SCIENTIFIC-TECHNICAL CONFERENCE "trans & MOTAUTO ’14" ISSN 1310-3946
YEAR XXII, VOLUME 1, P.P. 37-44 (2014)
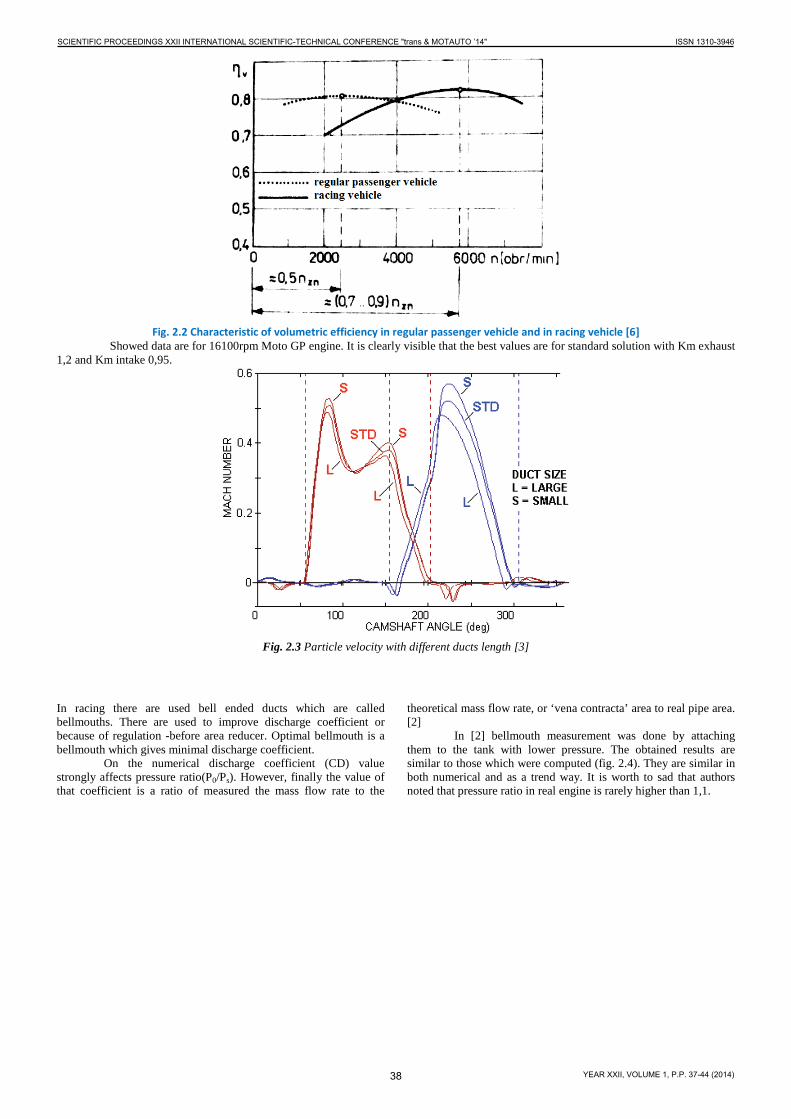
Fig. 2.2 Characteristic of volumetric efficiency in regular passenger vehicle and in racing vehicle [6]
Showed data are for 16100rpm Moto GP engine. It is clearly visible that the best values are for standard solution with Km exhaust 1,2 and Km intake 0,95.
Fig. 2.3 Particle velocity with different ducts length [3]
In racing there are used bell ended ducts which are called bellmouths. There are used to improve discharge coefficient or because of regulation -before area reducer. Optimal bellmouth is a bellmouth which gives minimal discharge coefficient.
On the numerical discharge coefficient (CD) value strongly affects pressure ratio(P0/Ps). However, finally the value of that coefficient is a ratio of measured the mass flow rate to the
theoretical mass flow rate, or ‘vena contracta’ area to real pipe area. [2]
In [2] bellmouth measurement was done by attaching them to the tank with lower pressure. The obtained results are similar to those which were computed (fig. 2.4). They are similar in both numerical and as a trend way. It is worth to sad that authors noted that pressure ratio in real engine is rarely higher than 1,1.
38
SCIENTIFIC PROCEEDINGS XXII INTERNATIONAL SCIENTIFIC-TECHNICAL CONFERENCE "trans & MOTAUTO ’14" ISSN 1310-3946
YEAR XXII, VOLUME 1, P.P. 37-44 (2014)
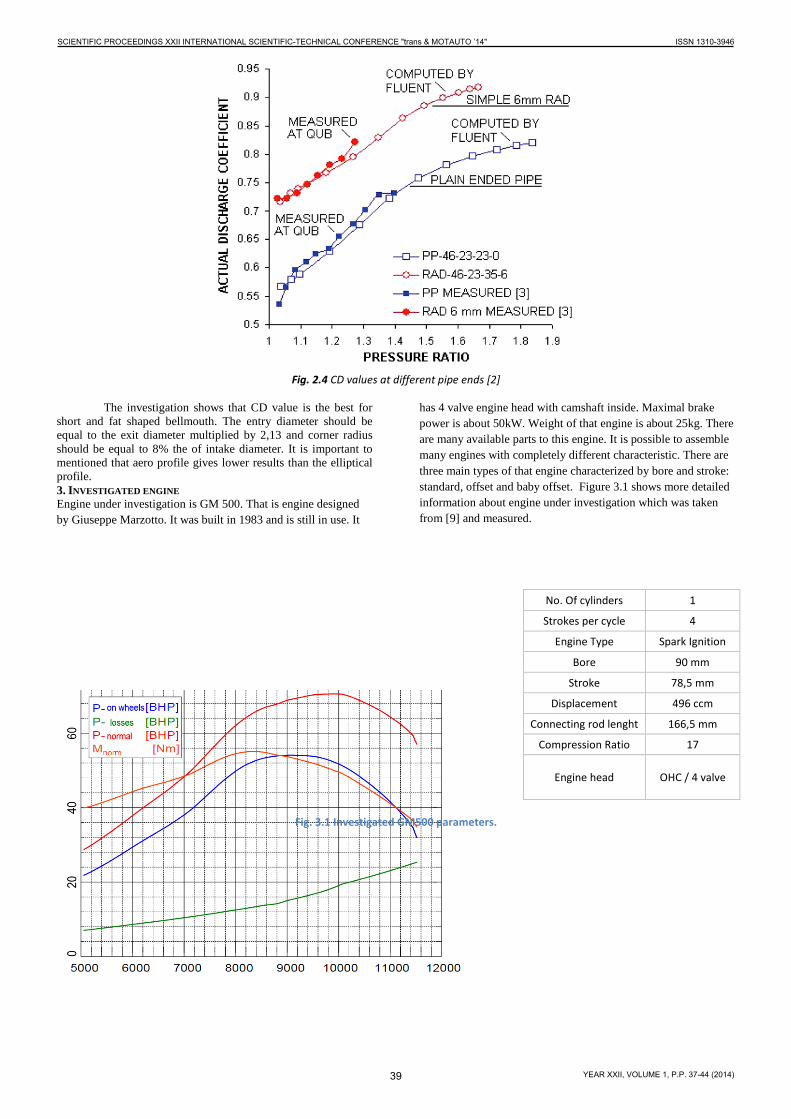
Fig. 2.4 CD values at different pipe ends [2]
The investigation shows that CD value is the best for
short and fat shaped bellmouth. The entry diameter should be equal to the exit diameter multiplied by 2,13 and corner radius should be equal to 8% the of intake diameter. It is important to mentioned that aero profile gives lower results than the elliptical profile. 3. INVESTIGATED ENGINE Engine under investigation is GM 500. That is engine designed by Giuseppe Marzotto. It was built in 1983 and is still in use. It
has 4 valve engine head with camshaft inside. Maximal brake power is about 50kW. Weight of that engine is about 25kg. There are many available parts to this engine. It is possible to assemble many engines with completely different characteristic. There are three main types of that engine characterized by bore and stroke: standard, offset and baby offset. Figure 3.1 shows more detailed information about engine under investigation which was taken from [9] and measured.
No. Of cylinders 1
Strokes per cycle 4
Engine Type Spark Ignition
Bore 90 mm
Stroke 78,5 mm
Displacement 496 ccm
Connecting rod lenght 166,5 mm
Compression Ratio 17
Engine head OHC / 4 valve
Fig. 3.1 Investigated GM500 parameters.
39
SCIENTIFIC PROCEEDINGS XXII INTERNATIONAL SCIENTIFIC-TECHNICAL CONFERENCE "trans & MOTAUTO ’14" ISSN 1310-3946
YEAR XXII, VOLUME 1, P.P. 37-44 (2014)
4. GEOMETRY
Fig. 4.1 Flow contours of bellmouth and carburettor.
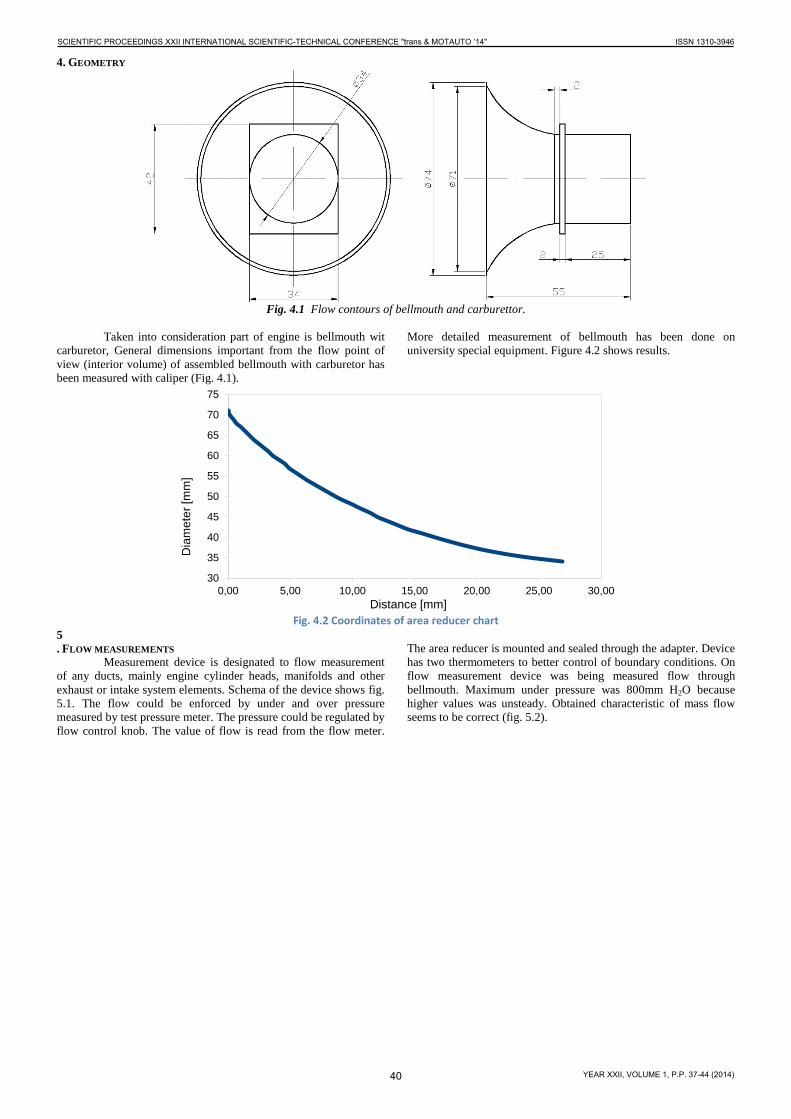
Taken into consideration part of engine is bellmouth wit
carburetor, General dimensions important from the flow point of view (interior volume) of assembled bellmouth with carburetor has been measured with caliper (Fig. 4.1).
More detailed measurement of bellmouth has been done on university special equipment. Figure 4.2 shows results.
Fig. 4.2 Coordinates of area reducer chart
5. FLOW MEASUREMENTS Measurement device is designated to flow measurement of any ducts, mainly engine cylinder heads, manifolds and other exhaust or intake system elements. Schema of the device shows fig. 5.1. The flow could be enforced by under and over pressure measured by test pressure meter. The pressure could be regulated by flow control knob. The value of flow is read from the flow meter.
The area reducer is mounted and sealed through the adapter. Device has two thermometers to better control of boundary conditions. On flow measurement device was being measured flow through bellmouth. Maximum under pressure was 800mm H2O because higher values was unsteady. Obtained characteristic of mass flow seems to be correct (fig. 5.2).
30
35
40
45
50
55
60
65
70
75
0,00 5,00 10,00 15,00 20,00 25,00 30,00
Dia
met
er [m
m]
Distance [mm]
40
SCIENTIFIC PROCEEDINGS XXII INTERNATIONAL SCIENTIFIC-TECHNICAL CONFERENCE "trans & MOTAUTO ’14" ISSN 1310-3946
YEAR XXII, VOLUME 1, P.P. 37-44 (2014)
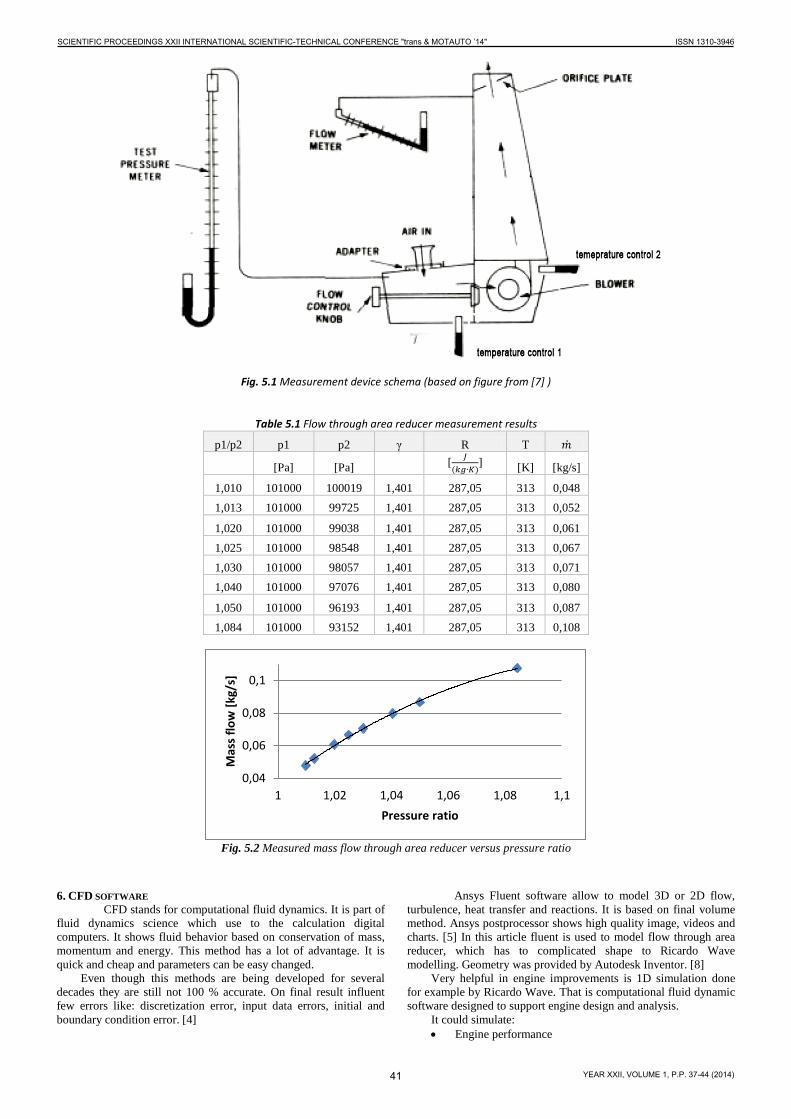
Fig. 5.1 Measurement device schema (based on figure from [7] )
Table 5.1 Flow through area reducer measurement results
p1/p2 p1 p2 γ R T �̇�
[Pa] [Pa]
[ 𝐽
(𝑘𝑔∙𝐾)] [K] [kg/s]
1,010 101000 100019 1,401 287,05 313 0,048 1,013 101000 99725 1,401 287,05 313 0,052
1,020 101000 99038 1,401 287,05 313 0,061 1,025 101000 98548 1,401 287,05 313 0,067 1,030 101000 98057 1,401 287,05 313 0,071 1,040 101000 97076 1,401 287,05 313 0,080
1,050 101000 96193 1,401 287,05 313 0,087 1,084 101000 93152 1,401 287,05 313 0,108
Fig. 5.2 Measured mass flow through area reducer versus pressure ratio
6. CFD SOFTWARE CFD stands for computational fluid dynamics. It is part of
fluid dynamics science which use to the calculation digital computers. It shows fluid behavior based on conservation of mass, momentum and energy. This method has a lot of advantage. It is quick and cheap and parameters can be easy changed.
Even though this methods are being developed for several decades they are still not 100 % accurate. On final result influent few errors like: discretization error, input data errors, initial and boundary condition error. [4]
Ansys Fluent software allow to model 3D or 2D flow, turbulence, heat transfer and reactions. It is based on final volume method. Ansys postprocessor shows high quality image, videos and charts. [5] In this article fluent is used to model flow through area reducer, which has to complicated shape to Ricardo Wave modelling. Geometry was provided by Autodesk Inventor. [8]
Very helpful in engine improvements is 1D simulation done for example by Ricardo Wave. That is computational fluid dynamic software designed to support engine design and analysis.
It could simulate: • Engine performance
0,04
0,06
0,08
0,1
1 1,02 1,04 1,06 1,08 1,1
Mas
s flo
w [k
g/s]
Pressure ratio
41
SCIENTIFIC PROCEEDINGS XXII INTERNATIONAL SCIENTIFIC-TECHNICAL CONFERENCE "trans & MOTAUTO ’14" ISSN 1310-3946
YEAR XXII, VOLUME 1, P.P. 37-44 (2014)
• Acoustic and noise • Combustion and emissions • Thermal phenomena
In this project especially important is performance part. It allows to choose the best intake, combustion and exhaust system configuration.
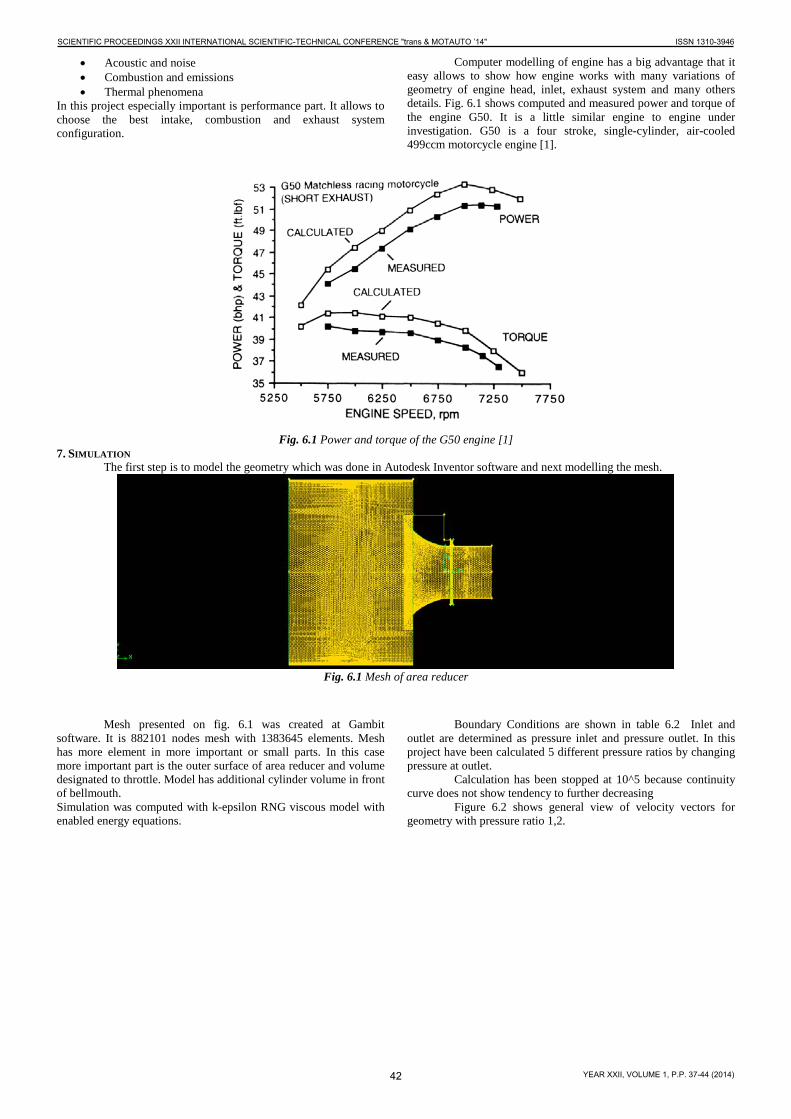
Computer modelling of engine has a big advantage that it easy allows to show how engine works with many variations of geometry of engine head, inlet, exhaust system and many others details. Fig. 6.1 shows computed and measured power and torque of the engine G50. It is a little similar engine to engine under investigation. G50 is a four stroke, single-cylinder, air-cooled 499ccm motorcycle engine [1].
Fig. 6.1 Power and torque of the G50 engine [1]
7. SIMULATION The first step is to model the geometry which was done in Autodesk Inventor software and next modelling the mesh.
Fig. 6.1 Mesh of area reducer
Mesh presented on fig. 6.1 was created at Gambit software. It is 882101 nodes mesh with 1383645 elements. Mesh has more element in more important or small parts. In this case more important part is the outer surface of area reducer and volume designated to throttle. Model has additional cylinder volume in front of bellmouth. Simulation was computed with k-epsilon RNG viscous model with enabled energy equations.
Boundary Conditions are shown in table 6.2 Inlet and outlet are determined as pressure inlet and pressure outlet. In this project have been calculated 5 different pressure ratios by changing pressure at outlet.
Calculation has been stopped at 10^5 because continuity curve does not show tendency to further decreasing
Figure 6.2 shows general view of velocity vectors for geometry with pressure ratio 1,2.
42
SCIENTIFIC PROCEEDINGS XXII INTERNATIONAL SCIENTIFIC-TECHNICAL CONFERENCE "trans & MOTAUTO ’14" ISSN 1310-3946
YEAR XXII, VOLUME 1, P.P. 37-44 (2014)
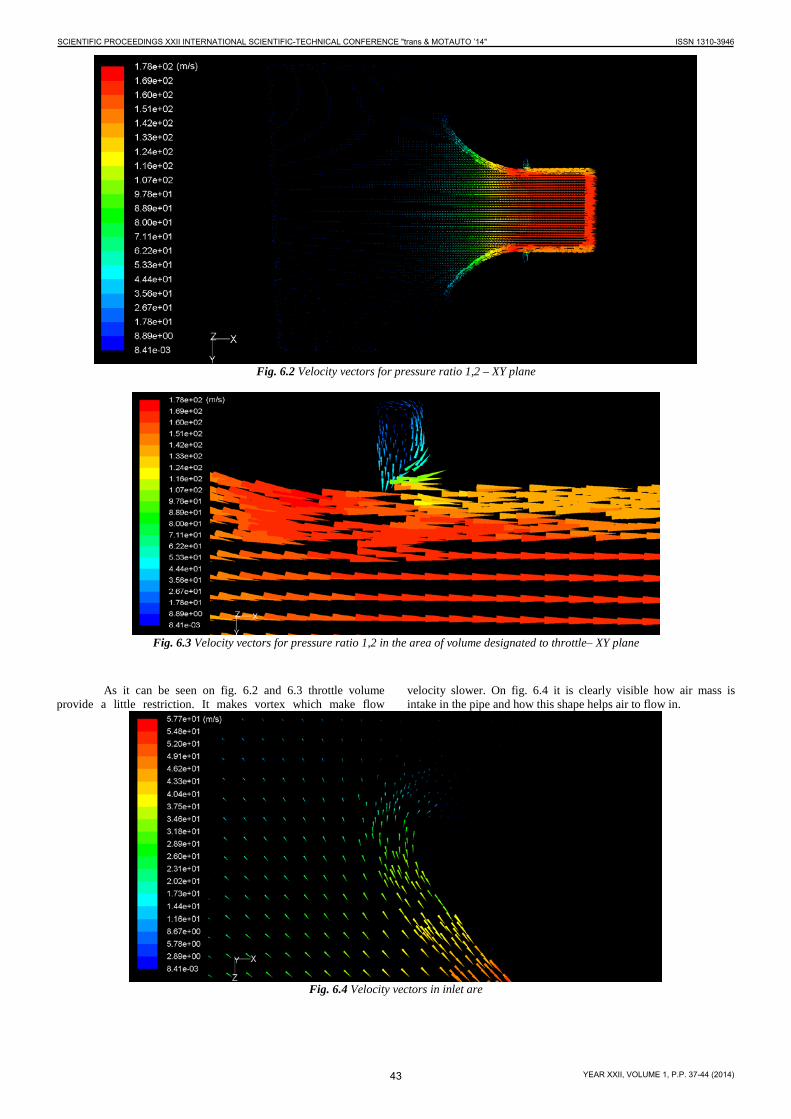
Fig. 6.2 Velocity vectors for pressure ratio 1,2 – XY plane
Fig. 6.3 Velocity vectors for pressure ratio 1,2 in the area of volume designated to throttle– XY plane
As it can be seen on fig. 6.2 and 6.3 throttle volume provide a little restriction. It makes vortex which make flow
velocity slower. On fig. 6.4 it is clearly visible how air mass is intake in the pipe and how this shape helps air to flow in.
Fig. 6.4 Velocity vectors in inlet are
43
SCIENTIFIC PROCEEDINGS XXII INTERNATIONAL SCIENTIFIC-TECHNICAL CONFERENCE "trans & MOTAUTO ’14" ISSN 1310-3946
YEAR XXII, VOLUME 1, P.P. 37-44 (2014)
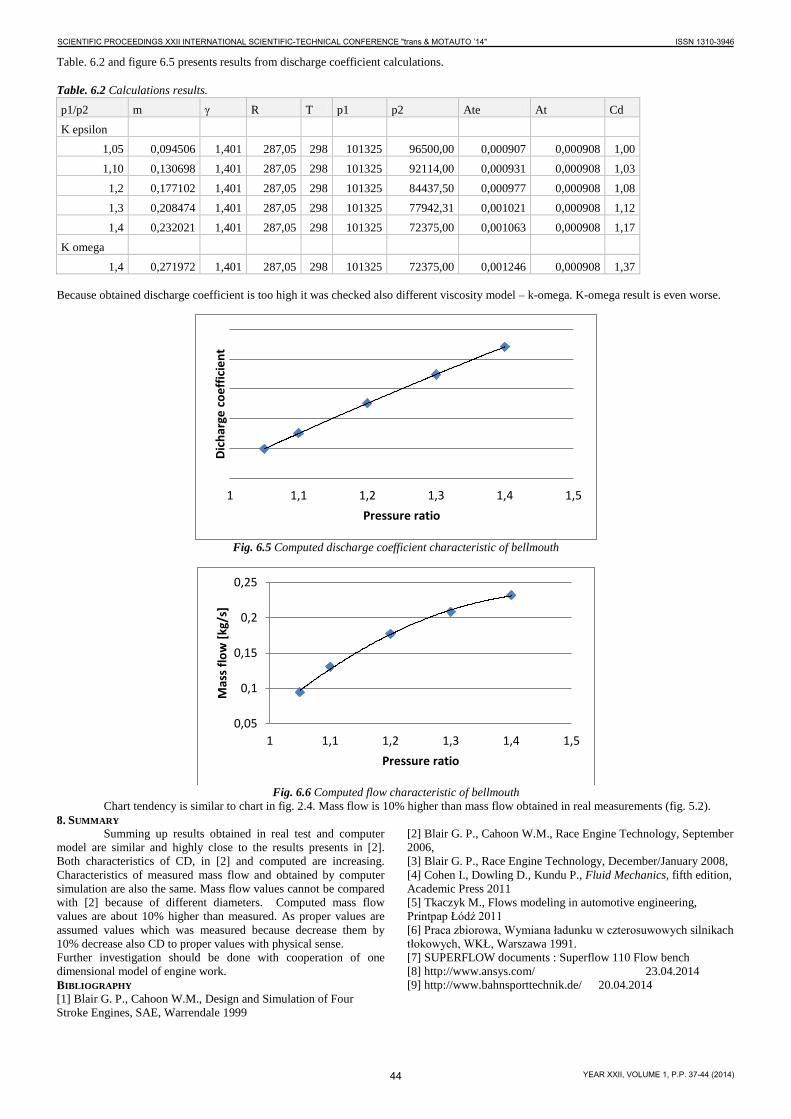
Table. 6.2 and figure 6.5 presents results from discharge coefficient calculations. Table. 6.2 Calculations results. p1/p2 m γ R T p1 p2 Ate At Cd K epsilon
1,05 0,094506 1,401 287,05 298 101325 96500,00 0,000907 0,000908 1,00 1,10 0,130698 1,401 287,05 298 101325 92114,00 0,000931 0,000908 1,03 1,2 0,177102 1,401 287,05 298 101325 84437,50 0,000977 0,000908 1,08 1,3 0,208474 1,401 287,05 298 101325 77942,31 0,001021 0,000908 1,12 1,4 0,232021 1,401 287,05 298 101325 72375,00 0,001063 0,000908 1,17
K omega 1,4 0,271972 1,401 287,05 298 101325 72375,00 0,001246 0,000908 1,37
Because obtained discharge coefficient is too high it was checked also different viscosity model – k-omega. K-omega result is even worse.
Fig. 6.5 Computed discharge coefficient characteristic of bellmouth
Fig. 6.6 Computed flow characteristic of bellmouth
Chart tendency is similar to chart in fig. 2.4. Mass flow is 10% higher than mass flow obtained in real measurements (fig. 5.2). 8. SUMMARY
Summing up results obtained in real test and computer model are similar and highly close to the results presents in [2]. Both characteristics of CD, in [2] and computed are increasing. Characteristics of measured mass flow and obtained by computer simulation are also the same. Mass flow values cannot be compared with [2] because of different diameters. Computed mass flow values are about 10% higher than measured. As proper values are assumed values which was measured because decrease them by 10% decrease also CD to proper values with physical sense. Further investigation should be done with cooperation of one dimensional model of engine work. BIBLIOGRAPHY [1] Blair G. P., Cahoon W.M., Design and Simulation of Four Stroke Engines, SAE, Warrendale 1999
[2] Blair G. P., Cahoon W.M., Race Engine Technology, September 2006, [3] Blair G. P., Race Engine Technology, December/January 2008, [4] Cohen I., Dowling D., Kundu P., Fluid Mechanics, fifth edition, Academic Press 2011 [5] Tkaczyk M., Flows modeling in automotive engineering, Printpap Łódź 2011 [6] Praca zbiorowa, Wymiana ładunku w czterosuwowych silnikach tłokowych, WKŁ, Warszawa 1991. [7] SUPERFLOW documents : Superflow 110 Flow bench [8] http://www.ansys.com/ 23.04.2014 [9] http://www.bahnsporttechnik.de/ 20.04.2014
1 1,1 1,2 1,3 1,4 1,5
Dich
arge
coe
ffici
ent
Pressure ratio
0,05
0,1
0,15
0,2
0,25
1 1,1 1,2 1,3 1,4 1,5
Mas
s flo
w [k
g/s]
Pressure ratio
44
SCIENTIFIC PROCEEDINGS XXII INTERNATIONAL SCIENTIFIC-TECHNICAL CONFERENCE "trans & MOTAUTO ’14" ISSN 1310-3946
YEAR XXII, VOLUME 1, P.P. 37-44 (2014)