Embed Size (px)
Citation preview

CE-LIF ANALYSIS OF INTACT MARINE MICROBES ALONG WITH THEIR CONSTITUENT PHYCOBILIPROTEINS AND PHYCOBILIN PIGMENTS
BY
BENJAMIN VAUGHAN
A Thesis Submitted to the Graduate Faculty of
WAKE FOREST UNIVERSITY GRADUATE SCHOOL OF ARTS AND SCIENCES
in Partial Fulfillment of Requirements
for the Degree of
MASTER OF SCIENCE
Chemistry
May 2015
Winston-Salem, North Carolina
Approved By:
Christa L. Colyer, Ph. D., Advisor
Bradley T. Jones, Ph. D., Chair
Rebecca Alexander, Ph. D.

ii
ACKNOWLEDGEMENTS
First, I would like to thank my family for their unending love and support
throughout my entire life; without them, I would have nothing. Thank you to my graduate
committee, Dr. Bradley Jones and Dr. Rebecca Alexander, for reading my work and
offering their expert help in improving this thesis. I’d also like to gratefully acknowledge
the National Science Foundation for their generosity in providing funding for this work.
Thank you to the professors, lab mates, and friends that I met while working towards my
degree, all of whom helped me grow as a scientist, and as a person, during my studies at
Wake Forest. Finally, I would like to give a very special thank you to my graduate
advisor, Dr. Christa Colyer, without whose optimism, encouragement, guidance, and
patience, I could never have made it as far as I have.
This thesis is dedicated in loving memory of my grandfather, Cary Ambler Garrett.

iii
TABLE OF CONTENTS ACKNOWLEDGEMENTS ................................................................................................ ii LIST OF TABLES AND FIGURES.................................................................................. iv
LIST OF ABBREVIATIONS ............................................................................................ vi ABSTRACT ..................................................................................................................... viii 1. INTRODUCTION ...........................................................................................................1
1.1 Theoretical Background .............................................................................................2
1.1.(i). Capillary Electrophoresis ......................................................................................... 2
1.1.(ii). Capillary Isotachophoresis and Capillary Transient Isotachophoresis ....................... 7
1.2 Intact Cyanobacteria Analysis .................................................................................12
1.3 Phycobiliprotein Pigment Analysis..........................................................................16
1.4 Bilin Chromophore Analysis ...................................................................................19
2. EXPERIMENTAL METHODS....................................................................................22 2.1 Reagents, Buffers, and Samples...............................................................................22
2.2 Sample Preparation ..................................................................................................24
2.3 Instrumentation ........................................................................................................25
2.4 CE Conditions ..........................................................................................................26
3. RESULTS & DISCUSSION..........................................................................................28 3.1 Bilin Cleavage from Phycobiliprotein Standards ....................................................28
3.2 Phycobiliprotein separation by CZE and PectI ........................................................31
3.3 CE and PectI Separations of Intact Cyanobacteria ..................................................39
4. CONCLUSIONS............................................................................................................53 REFERENCES ..................................................................................................................57 SCHOLASTIC VITA ........................................................................................................61
iv
LIST OF TABLES AND FIGURES TABLES Table 3-1: Final reaction conditions for phycobiliprotein bilin cleavage.. ....................... 30
Table 3-2: Molar absorptivities and fluorescence quantum yields of four PBPs. ............ 33
Table 3-3: Limits of detection for PBP using single channel 655 nm BP filter. .............. 34
Table 3-4: Limits of detection for PBP using a 585 nm BP filter in channel two ............ 36
Table 3-5: Limits of detection for phycobiliproteins using PectI focusing and 585 nm BP
filter in channel 2 .............................................................................................................. 40
FIGURES
Figure 1-1: A schematic diagram of a capillary electrophoresis instrument... ................... 3
Figure 1-2: The charged double layer formed at the BGE/capillary wall interface of an
uncoated fused-silica capillary. ........................................................................................... 5
Figure 1-3: The migration order and relative net velocities of analytes in the presence of
electroosmotic flow. ............................................................................................................ 6
Figure 1-4: A trailing electrolyte (TE) zone positioned behind a leading electrolyte (LE)
zone in the direction of the migration velocity (vep) ........................................................... 8
Figure 1-5: Capillary isotachophoresis (cITP) of three ions ............................................... 9
Figure 1-6: The shape of analyte sample zones during ITP.............................................. 11
Figure 1-7: Illustration of the separation of analyte ions by capillary transient
isotachophoresis (ctITP) ................................................................................................... 13
Figure 1- 8: The structure of phycobiliproteins and phycobilisomes ............................... 17
Figure 1-9: Structures of the four primary bilin chromophores ........................................ 20
Figure 1-10: Locations of bilin chromophores along primary structure of peptide .......... 20

v
Figure 3-1 Optimization of EDTA and TCEP concentrations for bilin cleavage ............ 29
Figure 3-2: Electropherograms demonstrating selective detection of PBPs ..................... 32
Figure 3-3: Calibration curves of PBP standards using only two 655 bandpass filters. ... 33
Figure 3-4: Electrophoretic profile of a mixture of APC, C-PC, R-PE, and B-PE. ......... 35
Figure 3-5: CE-LIF calibration curves for PBP standards using two 655 in channel 1, and
585 nm in channel 2 .......................................................................................................... 36
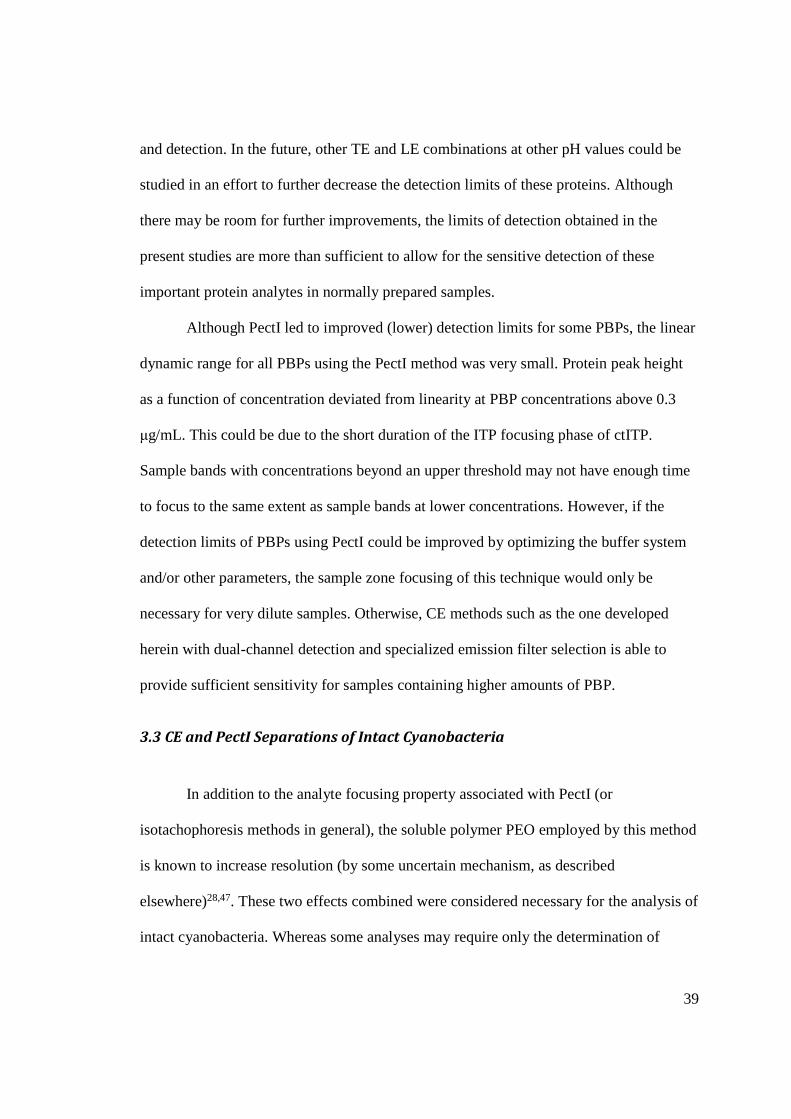
Figure 3-6: Calibration curves for PBP standards using PectI focusing.. ......................... 40
Figure 3-7: A comparison of CCMP 1333 and 833 signals in two detection channels.. .. 42
Figure 3-8: Electropherogram of CCMP 1333 samples obtained using TBE buffer with
various concentrations of PEO.......................................................................................... 44
Figure 3-9: A comparison between three replicate runs of CCMP 1333 by the PectI
method............................................................................................................................... 47
Figure 3- 10: PectI analysis of four concentrations of CCMP 1333. ................................ 48
Figure 3-11: PectI analysis of four concentrations of CCMP 833 .................................... 50
Figure 3-12: A separation of the cyanobacteria strains CCMP 1333 and CCMP 833 using
PectI .................................................................................................................................. 52

vi
LIST OF ABBREVIATIONS APC Allophycocyanin
BGE Background Electrolyte
BP Bandpass
Cc Culture Concentration
CE Capillary Electrophoresis
cITP Capillary Isotachophoresis
ctITP Capillary Transient Isotachophoresis
CZE Capillary Zone Electrophoresis
DTT Dithiothreitol
ELISA Enzyme-linked Immunosorbent Assay
EOF Electroosmotic Flow
ESI Electrospray Ionization
HPLC High-performance Liquid Chromatography
id Inner Diameter
LE Leading Electrolyte
LIF Laser-induced Fluorescence
MS Mass Spectrometry
PBP Phycobiliprotein
PC Phycocyanin
PCB Phycocyanobilin
PE Phycoerythrin
PEB Phycoerythrobilin
vii
PEC Phycoerythrocyanin
PectI Polymer-enhanced Capillary Transient Isotachophoresis
PEO Poly(ethylene oxide)
PUB Phycourobilin
PXB Phycobiliviolin
TCEP Tris-(2-carboxyethyl) phosphine
TE Trailing Electrolyte
TFA Trifluoroacetic acid

viii
ABSTRACT
CE-LIF ANALYSIS OF INTACT MARINE MICROBES ALONG WITH THEIR CONSTITUENT PHYCOBILIPROTEINS AND PHYCOBILIN PIGMENTS
Thesis under the direction of Christa L. Colyer, Ph.D., Professor of Chemistry
Cyanobacteria contribute significantly to the marine biosphere as primary
producers and as participants in global carbon and nitrogen cycles, and so it is vital to
develop efficient methods for cyanobacteria quantitation and characterization. Capillary
electrophoresis (CE) methods with dual-wavelength laser induced fluorescence (LIF)
detection schemes were developed to analyze cyanobacteria according to 1) the
separation and quantitation of their natively fluorescent phycobiliproteins, and 2) their
electrophoretic profiles as intact organisms. CE-LIF results were compared to those
obtained by way of a newly developed, high efficiency separation method known as
polymer enhanced capillary transient isotachophoresis (PectI). Four phycobiliproteins (R-
PE, B-PE, C-PC, and APC) were determined by CE and PectI, with detection limits
below 10 ppb achieved for each protein. Additionally, the phycobilin pigments giving
rise to the native fluorescence of these proteins were themselves studied by fluorimetry
after liberation from the proteins by way of chemical cleavage with DTT or TCEP.
Whereas conventional CE was unable to distinguish between two Synechoccocus sp.
bacteria (CCMP 1333 and CCMP 833) in a mixture, the new PectI method was shown to
improve the electrophoretic profiles of these intact bacteria samples and to differentiate
between them based on the method’s spectral and temporal resolution capabilities.

1
1. INTRODUCTION
Ocean ecosystems span over 70 percent of the earth’s surface and contribute
immensely to important natural cycles such as the carbon and nitrogen cycles.1 Major
contributors to aquatic (and thus global) ecosystem are photosynthetic microorganisms,
which act as the foundation of the food webs in which they participate and account for a
huge portion of the aquatic biomass. One of the most important and intriguing classes of
these microorganisms are cyanobacteria, which exhibit unique and strikingly efficient
mechanisms for harvesting sunlight for photosynthesis.2 The facile and continued
monitoring of cyanobacteria populations would allow for an important assessment of the
health of the ecosystems they support, since either a severe population boom or depletion
could be devastating to their environment. Electrophoretic analysis would allow for such
monitoring by the separation of species or strains of organisms from their populations in
the same way that one would separate a molecular mixture. It would also allow for the
analysis of their unique proteins and pigments.
Capillary electrophoresis (CE) is a fast, robust, and easily automated
electrophoretic analysis tool that has already proven useful for microbial analyses and is
adaptable to miniaturization on portable microchips for in-field testing.3,4 The
overarching goal of this project was to take a holistic approach to quantitative analysis of
cyanobacteria by CE on three levels: 1) the separation of intact microorganism species
from a population to directly assess the character and health of that population; 2) the
separation and sensitive detection of characteristic phycobiliprotein antenna pigments to
aid in the identification and characterization of the microorganisms; and 3) the cleavage
2
and quantification of the bilin chromophores within phycobiliproteins to provide further
identification power and a greater understanding of pigment adaptation.
1.1 Theoretical Background
1.1.(i). Capillary Electrophoresis
The separation mechanism of capillary zone electrophoresis (CZE) is based on the
differential migration of charged species under a constant electric field. This
electrophoretic migration mechanism eliminates the need for pressure-driven flow during
separation. The absence of pressure-driven flow reduces band broadening associated with
its characteristic laminar flow profile. Furthermore, the absence of pressure-driven flow
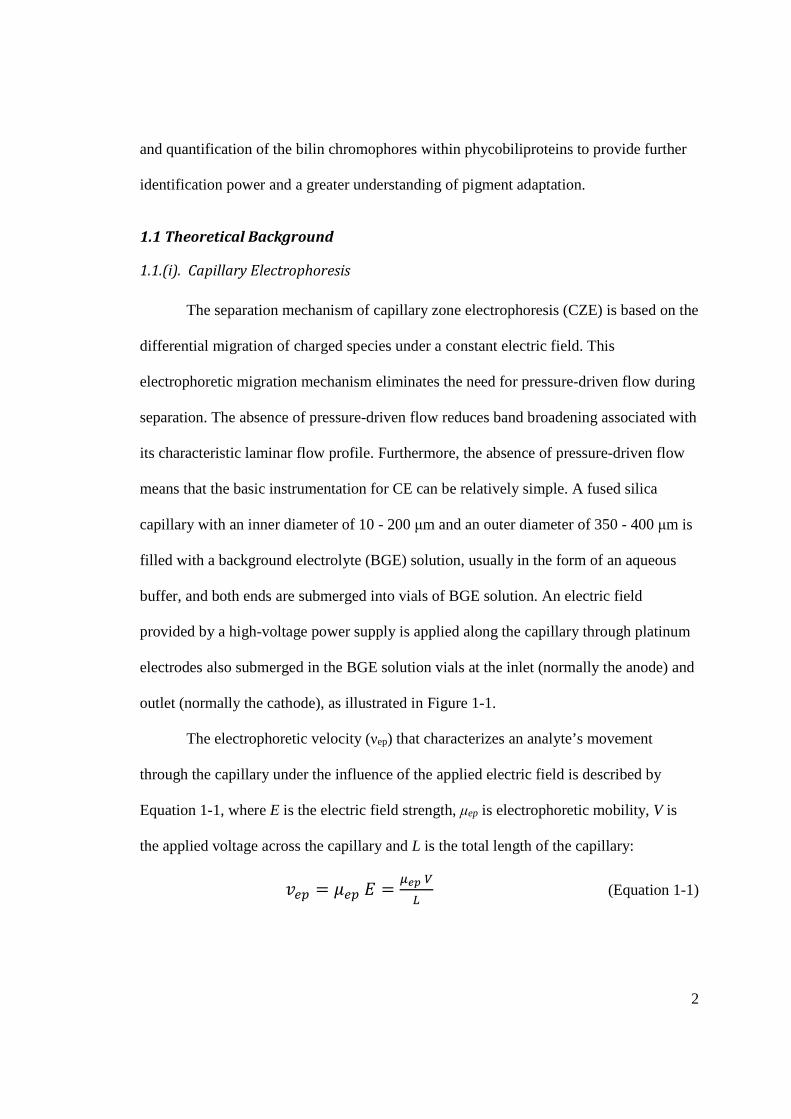
means that the basic instrumentation for CE can be relatively simple. A fused silica
capillary with an inner diameter of 10 - 200 μm and an outer diameter of 350 - 400 μm is
filled with a background electrolyte (BGE) solution, usually in the form of an aqueous
buffer, and both ends are submerged into vials of BGE solution. An electric field
provided by a high-voltage power supply is applied along the capillary through platinum
electrodes also submerged in the BGE solution vials at the inlet (normally the anode) and
outlet (normally the cathode), as illustrated in Figure 1-1.
The electrophoretic velocity (νep) that characterizes an analyte’s movement
through the capillary under the influence of the applied electric field is described by
Equation 1-1, where E is the electric field strength, μep is electrophoretic mobility, V is
the applied voltage across the capillary and L is the total length of the capillary:
��� = ��� � = � �� (Equation 1-1)
3
Figure 1-1: A schematic diagram of a capillary electrophoresis instrument. A buffer-filled capillary is submerged at both ends in vials containing background electrolyte or buffer solution. A high voltage power supply provides an electric field via platinum electrodes at the inlet (+) and outlet (-). A detector is positioned at a point close to the outlet of the capillary.
4
During an analysis in which all analytes experience the same electric field strength,
differential electrophoretic velocity depends solely on differences in electrophoretic
mobility. A species’ electrophoretic mobility is an intrinsic property in a medium of a
given viscosity (η) and is described by Equation 1-2, where q and r are the ionic charge
and ionic radius of the migrating species, respectively:
��� = ���� (Equation 1-2)
As is made clear in Equation 1-2, positively charged species will exhibit a positive
electrophoretic mobility and so will move towards the cathodic (outlet) end of the
capillary under normal polarity conditions. The detector is typically located towards the
cathodic end of the capillary, and so cationic sample species would be mobilized past the
detector. However, under the influence of electrophoretic mobility alone, anions would
migrate towards the anodic (inlet) end of the capillary and neutral species would not
migrate at all, precluding their detection. In many cases, however, there is another driving
force in CZE, which is known as electroosmotic flow (EOF), as described next.5
The inner wall of a fused silica capillary is replete with silanol groups, most with
either a pKa of 4.5 or 8.5.6 These silanol groups are deprotonated according to their pKa
when the capillary is rinsed with a basic solution, thus leading to a negatively charged
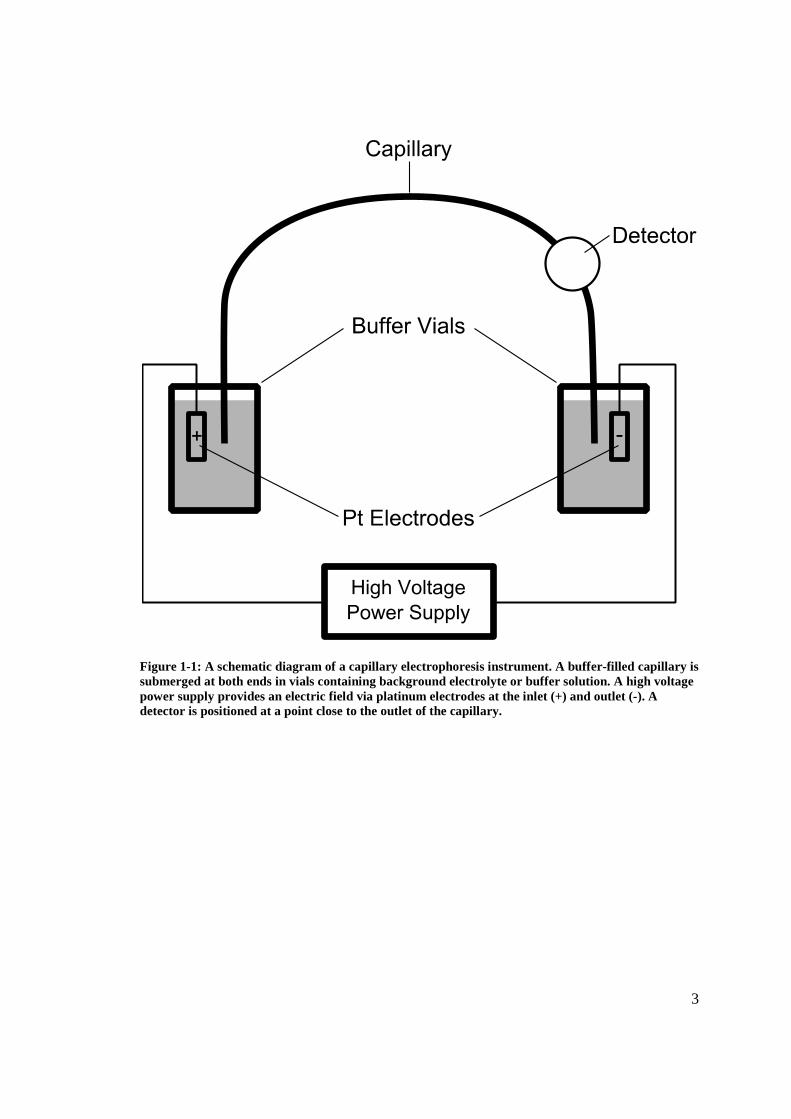
inner capillary wall.5 Positive ions in the buffer, or BGE solution, inside the capillary are
electrostatically attracted to silanate groups and form a charged double layer at the
BGE/capillary interface. The bilayer consists of a static layer and a diffuse, mobile layer
(Figure 1-2). The solvated cations in the diffuse layer are mobilized in the direction of the
cathode upon application of the electric field, and this, in turn, results in the movement of
5
the bulk solution associated with the solvated cations due to viscous drag effects. This
bulk solution transport through the capillary is known as electroosmotic flow (EOF).7
Figure 1-2: The charged double layer formed at the BGE/capillary wall interface of an uncoated fused-silica capillary. Deprotonated silanol groups at the capillary surface impart the capillary wall with negative charge. A thin, static layer of cations forms adjacent to the inner capillary wall and a mobile diffuse layer forms adjacent to the static layer. The diffuse layer will be mobilized in the direction of the cathode, taking the bulk solution with it.
The linear velocity of the EOF (veof) is proportional to the electric field strength
and the electroosmotic mobility of the solution (μeof) according to Equation 1-3:
���� = ����� (Equation 1-3)
Electroosmotic mobility is a property of the buffer/capillary system and is given by
Equation 1-4, where ε is the dielectric constant of the BGE solution, η is the viscosity of
that solution, and ζ is the zeta potential across the charged double layer:
���� = ����� (Equation 1-4)
6
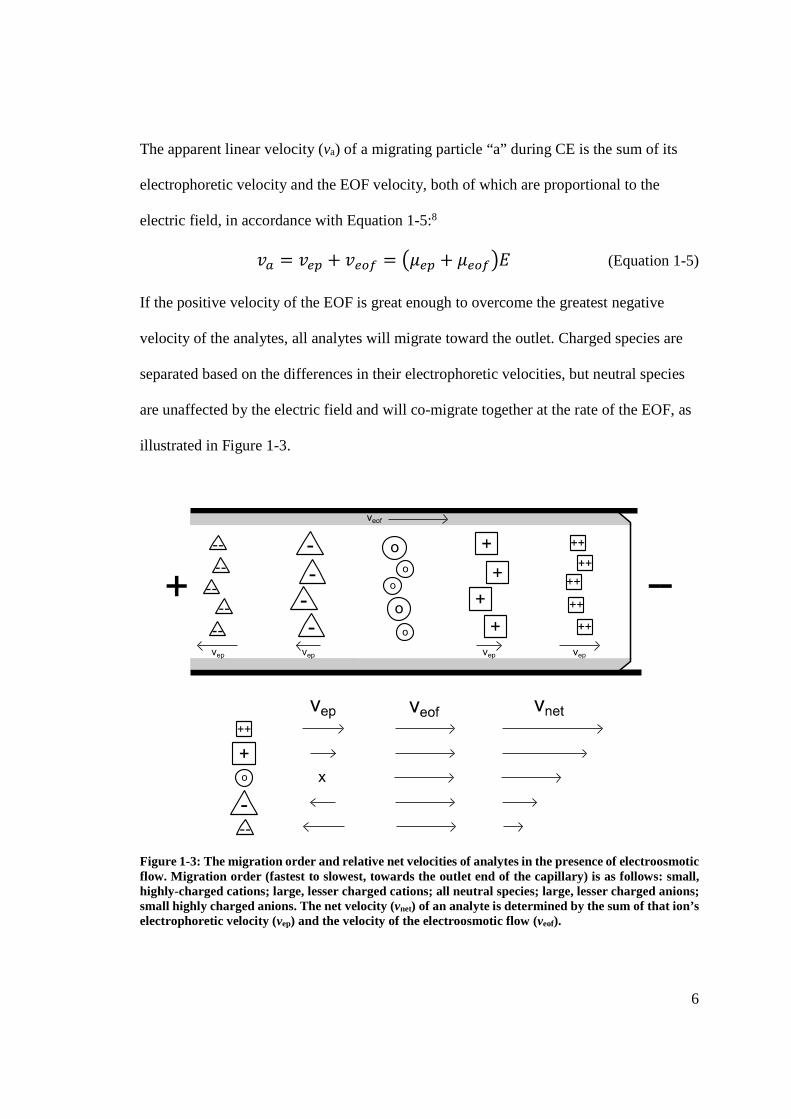
The apparent linear velocity (va) of a migrating particle “a” during CE is the sum of its
electrophoretic velocity and the EOF velocity, both of which are proportional to the
electric field, in accordance with Equation 1-5:8
�� = ��� + ���� = ���� + ������ (Equation 1-5)
If the positive velocity of the EOF is great enough to overcome the greatest negative
velocity of the analytes, all analytes will migrate toward the outlet. Charged species are
separated based on the differences in their electrophoretic velocities, but neutral species
are unaffected by the electric field and will co-migrate together at the rate of the EOF, as
illustrated in Figure 1-3.
Figure 1-3: The migration order and relative net velocities of analytes in the presence of electroosmotic flow. Migration order (fastest to slowest, towards the outlet end of the capillary) is as follows: small, highly-charged cations; large, lesser charged cations; all neutral species; large, lesser charged anions; small highly charged anions. The net velocity (vnet) of an analyte is determined by the sum of that ion’s electrophoretic velocity (vep) and the velocity of the electroosmotic flow (veof).
7
1.1.(ii). Capillary Isotachophoresis and Capillary Transient Isotachophoresis
Capillary isotachophoresis (cITP) is used to separate charged species on the basis
of electrophoretic mobility using a discontinuous buffer system. This buffer system is
comprised of a trailing electrolyte (TE) and a leading electrolyte (LE) that exhibit a lower
and higher electrophoretic mobility, respectively, than any analyte of interest within the
sample zone that is initially sandwiched between them. Introduced behind the LE, the TE
will never overtake the LE, because the LE has a higher mobility; the LE, however,
cannot migrate faster than the TE without creating a zone devoid of electrolytes. Such a
zone would break the current flow and would not permit the electric field to be
sustained.9 Consequently, a sharp boundary between the TE and LE zones is maintained.
Also, a consistent electrophoretic velocity for all zones (����) is established, as illustrated
in Equation 1-6 where subscripts 1 and 2 represent different ion zones up to the total
number of zones in the system (n), and E is the local electric field strength experienced
by those zones:7
���� = ���,��� = ���,��� … = ���,!�! (Equation 1-6)
Since migration velocity is constant for all ions in cITP, and the electrophoretic mobility
is constant for a given ion, the electric field strength must vary zone by zone, with
increased magnitude in zones of low electrophoretic mobility and decreased magnitude in
zones of high electrophoretic mobility. At the boundary between buffer zones, there is a
sharp change in electric field strength,9 as illustrated in Figure 1-4.

8
Figure 1-4: A trailing electrolyte (TE) zone positioned behind a leading electrolyte (LE) zone in the direction of the migration velocity (vep). A sharp change in electric field strength (E) is observed across the TE/LE boundary.
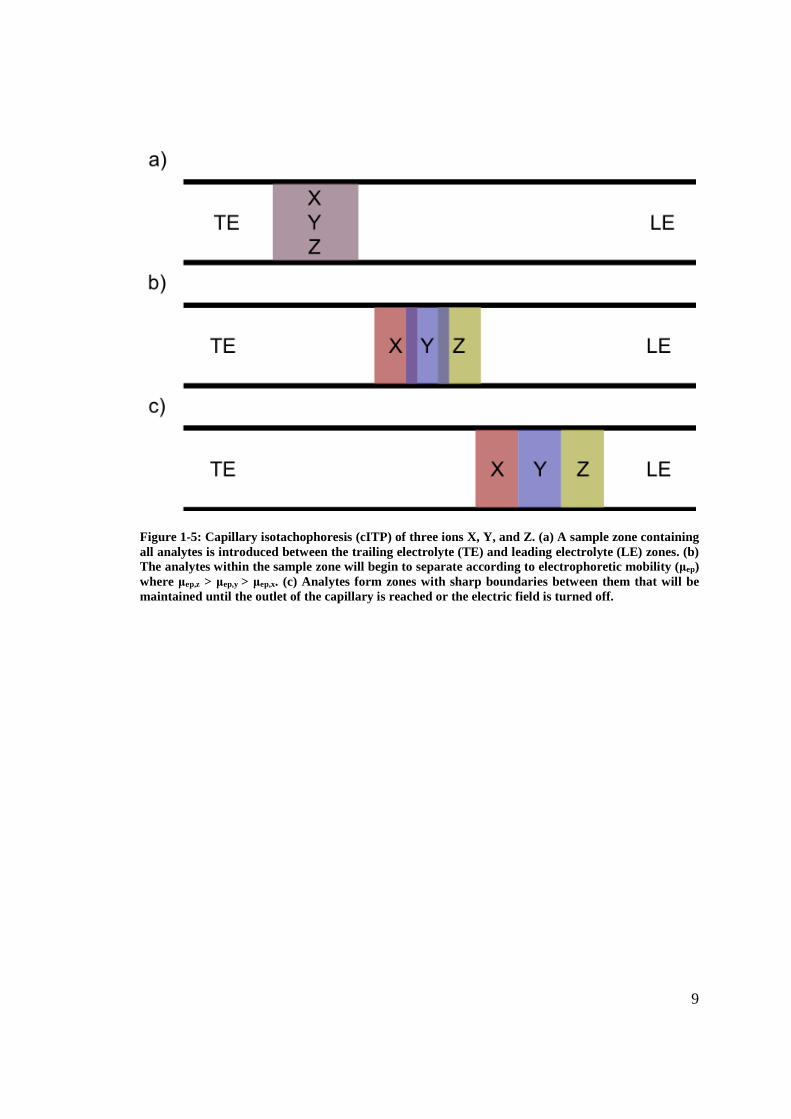
To achieve a cITP separation, sample is introduced between TE and LE zones,
which bracket the electrophoretic mobility of all analytes in the sample. An analyte that
enters into a zone of higher electrophoretic mobility (such as the LE zone) experiences a
sharp drop in electric field strength and the velocity of that ion is reduced; an analyte that
breaches into a zone of lower electrophoretic mobility will experience a sharp increase in
electric field strength and an increase in velocity until it is back into the analyte zone. In
this way, the analyte zones are separated and focused between the TE and LE zones
according to electrophoretic mobility. The analyte ions will continue to separate in this
way until each analyte zone develops sharp boundaries and reaches an equilibrium
concentration (Figure 1-5).9
The equilibrium concentration of a strong electrolyte (Ci) within its zone is
dependent on the concentration of the leading electrolyte (Cl) and is given by:
"# = "$�%(�'(�))+'�'(�%(�))+%
(Equation 1-7)
where μi, μl, and, μc are the electrophoretic mobilities of analyte ion i, the leading
electrolyte, and the counter ion, respectively; and zi and zl are the ionic charges of ion i
and the leading electrolyte, respectively.9,10 An analyte that is injected at a concentration
9
Figure 1-5: Capillary isotachophoresis (cITP) of three ions X, Y, and Z. (a) A sample zone containing all analytes is introduced between the trailing electrolyte (TE) and leading electrolyte (LE) zones. (b) The analytes within the sample zone will begin to separate according to electrophoretic mobility (μep) where μep,z > μep,y > μep,x. (c) Analytes form zones with sharp boundaries between them that will be maintained until the outlet of the capillary is reached or the electric field is turned off.

10
more dilute than the equilibrium concentration given by Equation 1-7 will be
concentrated during analysis, giving cITP its on-column, sample stacking ability. As
opposed to CZE separations, where the concentration of the analyte zone is proportional
to the concentration of the analyte injected, the analyte zone in cITP will increase in
volume proportionately with respect to increasing amount of analyte in order to maintain
equilibrium concentration. Using time-resolved detection, this results in a plateau-shaped
signal, whose height is constant for a given analyte in a given TE/LE system, but
increases in width with increasing amount of analyte.7
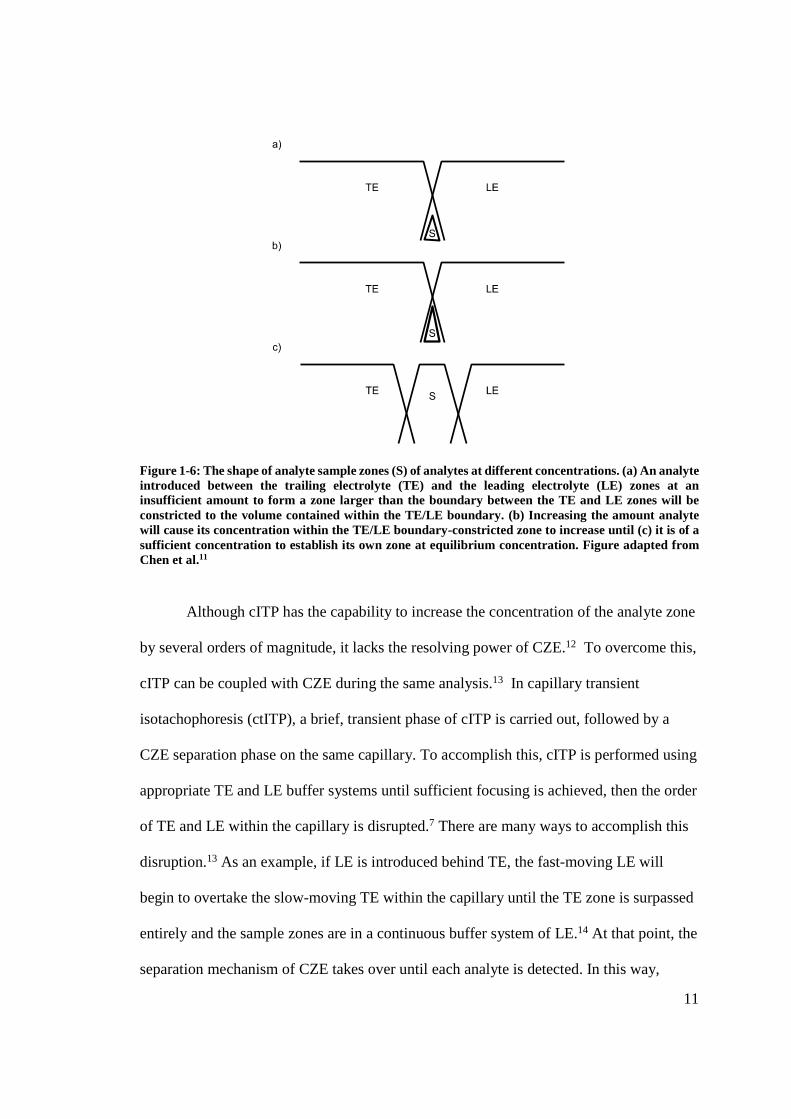
An analyte present in a quantity insufficient to form a zone that has a much
greater thickness than the boundary between adjacent electrolytes will instead form a
peak whose base is confined to the width of that boundary. The boundary width between
two adjacent electrolytes (ΘΒ) can be calculated using Equation 1-8, where �̅�� is the
average electrophoretic mobility of the electrolytes, Δμep is the difference between those
mobilities, R is the gas constant, F is Faraday’s constant, T is the absolute temperature,
and �- is the average electric field strength:
./ = 4 1 �23�
4 × 6789:-; (Equation 1-8)
Restricted to this width, an analyte zone will increase its maximum concentration linearly
with amount of sample injected until the amount of analyte is sufficient to form its own
zone at equilibrium concentration (Figure 1-6). During detection, this results in a peak-
like signal whose height is linearly correlated to the amount of sample injected.11
11
Figure 1-6: The shape of analyte sample zones (S) of analytes at different concentrations. (a) An analyte introduced between the trailing electrolyte (TE) and the leading electrolyte (LE) zones at an insufficient amount to form a zone larger than the boundary between the TE and LE zones will be constricted to the volume contained within the TE/LE boundary. (b) Increasing the amount analyte will cause its concentration within the TE/LE boundary-constricted zone to increase until (c) it is of a sufficient concentration to establish its own zone at equilibrium concentration. Figure adapted from Chen et al.11
Although cITP has the capability to increase the concentration of the analyte zone
by several orders of magnitude, it lacks the resolving power of CZE.12 To overcome this,
cITP can be coupled with CZE during the same analysis.13 In capillary transient
isotachophoresis (ctITP), a brief, transient phase of cITP is carried out, followed by a
CZE separation phase on the same capillary. To accomplish this, cITP is performed using
appropriate TE and LE buffer systems until sufficient focusing is achieved, then the order
of TE and LE within the capillary is disrupted.7 There are many ways to accomplish this
disruption.13 As an example, if LE is introduced behind TE, the fast-moving LE will
begin to overtake the slow-moving TE within the capillary until the TE zone is surpassed
entirely and the sample zones are in a continuous buffer system of LE.14 At that point, the
separation mechanism of CZE takes over until each analyte is detected. In this way,
12
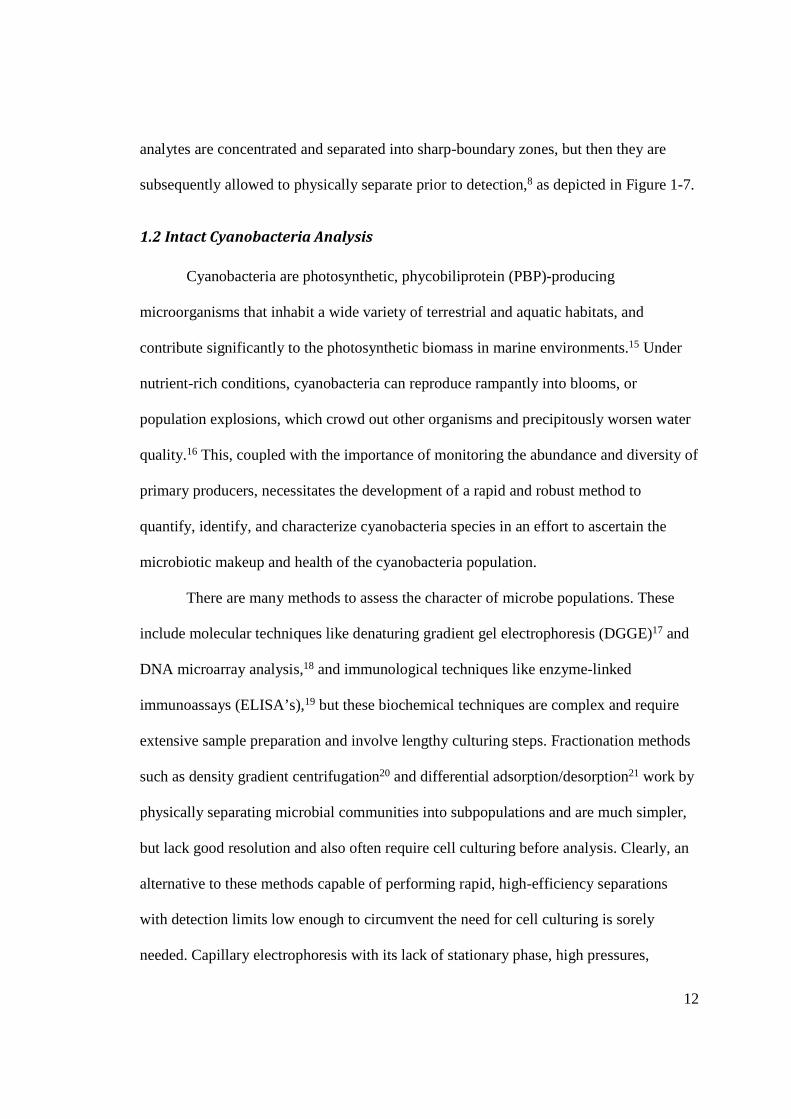
analytes are concentrated and separated into sharp-boundary zones, but then they are
subsequently allowed to physically separate prior to detection,8 as depicted in Figure 1-7.
1.2 Intact Cyanobacteria Analysis
Cyanobacteria are photosynthetic, phycobiliprotein (PBP)-producing
microorganisms that inhabit a wide variety of terrestrial and aquatic habitats, and
contribute significantly to the photosynthetic biomass in marine environments.15 Under
nutrient-rich conditions, cyanobacteria can reproduce rampantly into blooms, or
population explosions, which crowd out other organisms and precipitously worsen water
quality.16 This, coupled with the importance of monitoring the abundance and diversity of
primary producers, necessitates the development of a rapid and robust method to
quantify, identify, and characterize cyanobacteria species in an effort to ascertain the
microbiotic makeup and health of the cyanobacteria population.
There are many methods to assess the character of microbe populations. These
include molecular techniques like denaturing gradient gel electrophoresis (DGGE)17 and
DNA microarray analysis,18 and immunological techniques like enzyme-linked
immunoassays (ELISA’s),19 but these biochemical techniques are complex and require
extensive sample preparation and involve lengthy culturing steps. Fractionation methods
such as density gradient centrifugation20 and differential adsorption/desorption21 work by
physically separating microbial communities into subpopulations and are much simpler,
but lack good resolution and also often require cell culturing before analysis. Clearly, an
alternative to these methods capable of performing rapid, high-efficiency separations
with detection limits low enough to circumvent the need for cell culturing is sorely
needed. Capillary electrophoresis with its lack of stationary phase, high pressures,

13
Figure 1-7: Illustration of the separation of analyte ions X, Y, and Z by capillary transient isotachophoresis (ctITP). (a) Analyte-containing sample is introduced between the trailing electrolyte (TE) and the leading electrolyte (LE) zones. (b) Analytes are allowed to separate into discrete, adjacent sample zones by ITP and the TE/LE order is disturbed by injecting LE behind TE. (c) The LE zone overtakes the TE zone, putting the analyte zones into a continuous buffer system. At this point, the CZE separation mechanism takes over, allowing space to develop between analyte zones.

14
column packing, or harsh organic solvents is ideal for the analysis of large, complicated,
and sometimes delicate microbial analytes.
CE has been used to separate an exceptionally wide variety of biologically
relevant analytes spanning wide size regimes from small inorganic and organic
molecules, to proteins and polypeptides, to large colloid particles, all based on
electrophoretic mobility.22,23 In the case of gram-negative microorganisms such as
cyanobacteria, electrophoretic mobility arises from ionizable lipopolysaccharide surface
groups on the outer membrane that yield an overall negative charge at physiological pH
and above.24
The separation of intact microbes has been of great interest since it was first
suggested by Hjerten in 198725 but the first successful CE-based separation of individual
bacterial species from a mixture was not reported until 1993 by Ebersole et al..26 Despite
some advances, bacterial separations have presented significant challenges due to the
complex and dynamic nature of the analyte. Multiple, irreproducible signals are common
even when analyzing single strain sample populations due to the tendency of microbes to
form irregular aggregates, to interact with the capillary wall, to change their surface
chemistry during separation, and/or to excrete detectable contaminants into the sample
zone.27 In 1999, Armstrong et al.28 found that adding dilute polymers such as
poly(ethylene) oxide (PEO) to the run buffer of a microbe separation brought about a
remarkable focusing effect that produced well-resolved, efficient signals for several
bacterial analytes. Dilute PEO has also proved useful in conjunction with other
preconcentration and zone-focusing techniques. For example, Saito et al.29 recently
combined ctITP and PEO focusing into a single technique called polymer-enhanced
15
capillary transient isotachophoresis (PectI). In this work, Saito et al. used PectI to
accomplish on-column focusing of gram-positive Bacillus globigii spores to produce
sharp signals with good efficiency and reproducibility, which were highly correlated with
cell concentrations.
Pairing an effective separation mechanism with a sensitive detection mode is
essential for monitoring healthy or anemic cyanobacterial populations. Absorbance
detection has been used to detect microorganisms, 28,30,31 but lacks sensitivity when
compared to fluorescence-based detection modes. Laser-induced fluorescence detection
(LIF) is more sensitive and circumvents the undesired detection of UV-Vis absorbing
components of bacterial growth media. Normally, microorganisms are non-fluorescent
and thus need to be labeled with an emissive tag to be detected by LIF.29 Cyanobacteria,
however, contain PBP, which are highly emissive due to linear, tetrapyrrole bilin
chromophores that are covalently bound to the proteins.32 The presence of these pigments
imbues cyanobacterial cells with native fluorescence intense enough to be detected by
LIF. Although it is possible to achieve some detection of many different types of PBP in
a mixture by using a single excitation source,33 the excitation wavelength thus employed
would necessarily compromise each PBPs excitation maximum and so the resulting
emissions would likewise be compromised. Using two simultaneous excitation sources −
one tuned to the excitation maximum of phycoerythrin-type proteins and another tuned
more closely to the excitation maximum of phycocyanin-type proteins − should afford
greater sensitivity for all PBPs in a mixture.
Using CE-LIF to directly separate intact cyanobacteria species, or strains of
species, from a mixed community would allow for a robust, relatively simple, and high-
16
throughput method of ascertaining the microbiotic character of cyanobacterial
populations. Additionally, employing a dual excitation/detection scheme, whereby two
lasers of different wavelengths are simultaneously used to excite the analyte for emission
as it passes the detector, should allow for sensitive detection of, and qualitative insight
into, the PBP profile of separated organisms. Herein, PectI coupled with dual wavelength
LIF detection was applied to the separation of two Synechococcus strains of
cyanobacteria, namely CCMP 1333 and CCMP 833.
1.3 Phycobiliprotein Pigment Analysis
PBPs are produced by cyanobacteria in several varieties categorized by their
spectroscopic properties. These proteins are produced by cyanobacteria to serve as light-
harvesting antenna pigments. Chief among these are phycoerythrin (PE), phycocyanin
(PC), and allophycocyanin (APC). Variants among these are given designations such as
R-, B-, and C- that refer to the organism from which they were first extracted.
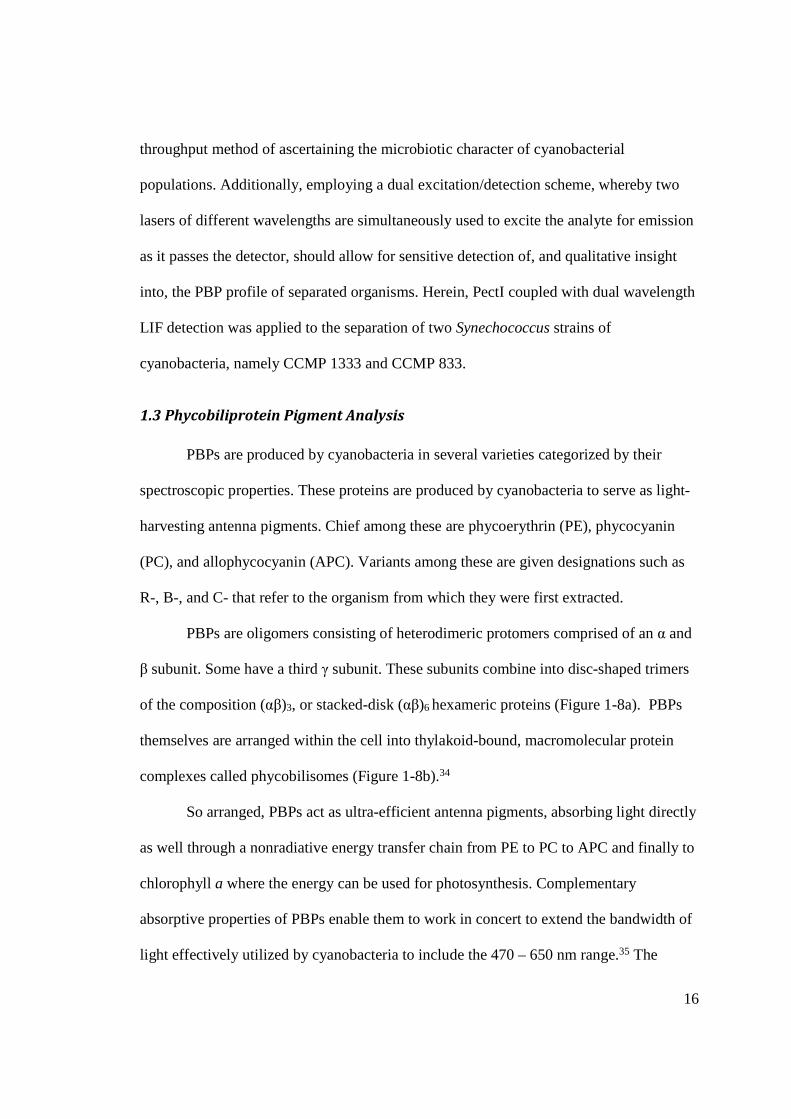
PBPs are oligomers consisting of heterodimeric protomers comprised of an α and
β subunit. Some have a third γ subunit. These subunits combine into disc-shaped trimers
of the composition (αβ)3, or stacked-disk (αβ)6 hexameric proteins (Figure 1-8a). PBPs
themselves are arranged within the cell into thylakoid-bound, macromolecular protein
complexes called phycobilisomes (Figure 1-8b).34
So arranged, PBPs act as ultra-efficient antenna pigments, absorbing light directly
as well through a nonradiative energy transfer chain from PE to PC to APC and finally to
chlorophyll a where the energy can be used for photosynthesis. Complementary
absorptive properties of PBPs enable them to work in concert to extend the bandwidth of
light effectively utilized by cyanobacteria to include the 470 – 650 nm range.35 The

17
Figure 1-8: The structure of phycobiliproteins and phycobilisomes. (a) Each monomer of a phycobiliprotein is comprised of at least an α and β subunit. Monomers are assembled into either an (αβ)3 trimer or an (αβ)6 hexamer. (b) Hexameric phycobiliproteins are assembled into thylakoid-bound protein complexes called phycobilisomes. Here, absorbed energy undergoes a phycoerythrin (PE) → phycocyanin (PC) → allophycocyanin (APC) transfer. Energy is then transferred from APC to photosystem II to be utilized by the organism in its photosynthesis processes.
18
relative abundance of pigments, including PBPs, is one of the taxonomic differentiators
of cyanobacteria.36,37 Changes in PBP constitution in cyanobacteria communities also
indicate changes in light and nutrient availability.38 An accurate and quantitative method
for PBP analysis would aid in the identification of cyanobacteria strains in pure culture or
probe the overall PBP constitution of a community for the purposes of evaluating the
effects of environmental fluctuations on cyanobacteria communities across seasons or
due to climate change.
A variety of chromatographic and electrophoretic techniques have been developed
to analyze PBPs.39 Zolla and Bianchetti40 showed the separation of PC and APC using
reversed phase high-performance liquid chromatography (HPLC) with electrospray
ionization/mass spectrometry (ESI-MS) detection in 2001, but their method required a
30-minute separation time using gradient elution.40 CE, which has the ability to be
miniaturized onto a microchip, is much more adaptable for easy ship-board
oceanographic analysis, for example.41 In 2002, Viskari and Colyer42 demonstrated the
resolution and sensitive detection of purified PC, PE, and APC by CE-LIF using a phytic
acid-enhanced borate buffer system that requiring an analysis time of less than 5 minutes,
a variant of which, performed on a CE microchip, achieved resolution of PE and PC
proteins in 30 seconds.39 Viskari et al.43 later demonstrated the practical utility of their
borate/phytic acid separation protocol by coupling it with a rapid, quantitative PBP
extraction method used to extract PBPs from Synechococcus cyanobacteria strain CCMP
833. Their method, however, has not yet been expanded for use with cultures of other
cyanobacteria species or natural samples. The sensitivity of their detection also suffered
from the limitation of only one excitation source, namely a 595 nm He-Ne laser. Herein,
19
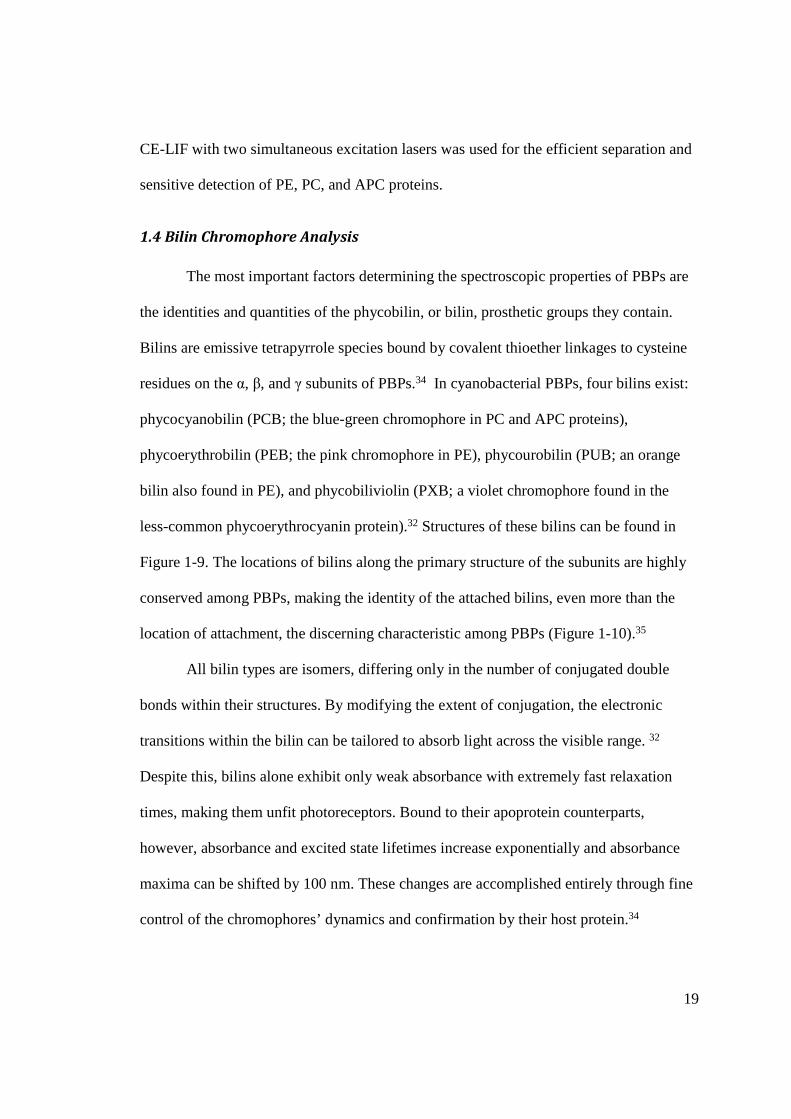
CE-LIF with two simultaneous excitation lasers was used for the efficient separation and
sensitive detection of PE, PC, and APC proteins.
1.4 Bilin Chromophore Analysis
The most important factors determining the spectroscopic properties of PBPs are
the identities and quantities of the phycobilin, or bilin, prosthetic groups they contain.
Bilins are emissive tetrapyrrole species bound by covalent thioether linkages to cysteine
residues on the α, β, and γ subunits of PBPs.34 In cyanobacterial PBPs, four bilins exist:
phycocyanobilin (PCB; the blue-green chromophore in PC and APC proteins),
phycoerythrobilin (PEB; the pink chromophore in PE), phycourobilin (PUB; an orange
bilin also found in PE), and phycobiliviolin (PXB; a violet chromophore found in the
less-common phycoerythrocyanin protein).32 Structures of these bilins can be found in
Figure 1-9. The locations of bilins along the primary structure of the subunits are highly
conserved among PBPs, making the identity of the attached bilins, even more than the
location of attachment, the discerning characteristic among PBPs (Figure 1-10).35
All bilin types are isomers, differing only in the number of conjugated double
bonds within their structures. By modifying the extent of conjugation, the electronic
transitions within the bilin can be tailored to absorb light across the visible range. 32
Despite this, bilins alone exhibit only weak absorbance with extremely fast relaxation
times, making them unfit photoreceptors. Bound to their apoprotein counterparts,
however, absorbance and excited state lifetimes increase exponentially and absorbance
maxima can be shifted by 100 nm. These changes are accomplished entirely through fine
control of the chromophores’ dynamics and confirmation by their host protein.34
20
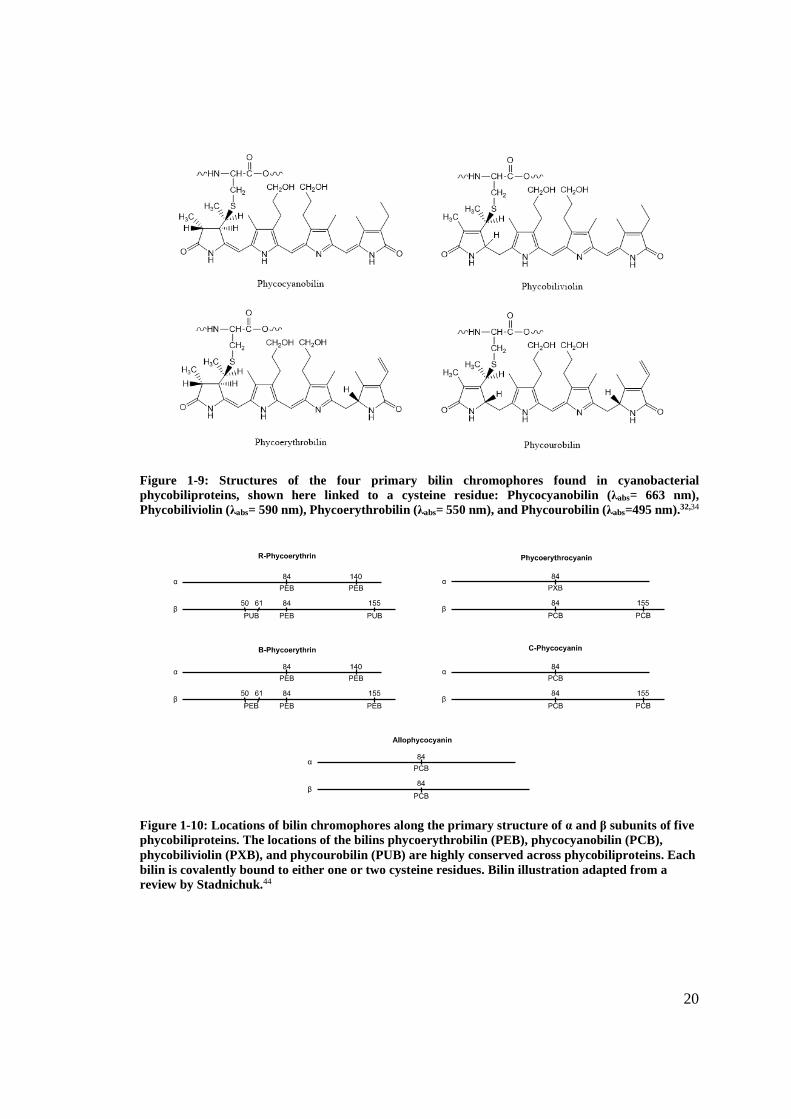
Figure 1-9: Structures of the four primary bilin chromophores found in cyanobacterial phycobiliproteins, shown here linked to a cysteine residue: Phycocyanobilin (λabs= 663 nm), Phycobiliviolin (λabs= 590 nm), Phycoerythrobilin (λabs= 550 nm), and Phycourobilin (λabs=495 nm).32,34
Figure 1-10: Locations of bilin chromophores along the primary structure of α and β subunits of five phycobiliproteins. The locations of the bilins phycoerythrobilin (PEB), phycocyanobilin (PCB), phycobiliviolin (PXB), and phycourobilin (PUB) are highly conserved across phycobiliproteins. Each bilin is covalently bound to either one or two cysteine residues. Bilin illustration adapted from a review by Stadnichuk.44
21
The bilin content of each phycobiliprotein has been evolutionarily honed to
optimize the absorptive properties of PBPs for the benefit of the organism that contains
them. Though the bilin content of many phycobiliproteins is known,35 some marine
cyanobacteria species have been reported to change the chromophore content of their
phycobiliproteins due to changes in light availability.45 The determination and
quantification of bilin content in PBPs on an analytical scale would give insight into the
adaptive mechanisms adopted by cyanobacteria containing those proteins.
In the past, methods such as HgCl2-assisted methanolysis46 and cleavage via
trifluoroacetic acid (TFA)/HBr followed by dichloromethane extraction34 have been used
to liberate bilin chromophores from PBPs before analysis by HPLC. These cleavage
reactions, however, are complex, use dangerous reagents, and can take hours to complete.
The development of a rapid method to easily cleave bilins from their PBPs and analyze
liberated bilins using sensitive CE-LIF would be far preferable.
In this work, reducing agents dithiothreitol (DTT), tris-(2-cyanoethyl) phosphine,
and tris-(2-carboxyethyl) phosphine (TCEP) were used in an attempt to cleave cysteine
linkages and liberate bilins from their protein substrates. Molecular weight cut-off filters
were used to isolate the desired bilins from the apoprotein after cleavage. Once the
quantitative liberation of bilins is achieved, CE-LIF will be used to separate and quantify
them. Since the structures of bilins are so similar, cyclodextrin- or micellar-modified CE
methods may be necessary to obtain good resolution. Any protocols established for pure
PBP standards are considered suitable for application to the bilins of PBPs extracted from
cultured or natural cyanobacterial samples.

22
2. EXPERIMENTAL METHODS
2.1 Reagents, Buffers, and Samples
Cyanobacteria species CCMP 1333 and CCMP 833 were ordered as pure cultures
from the Provasoli-Guillard National Center for Marine Algae and Microbiota at the
Bigelow Laboratory for Ocean Sciences (West Boothbay Harbor, Maine). Cyanobacteria
cultures arrived suspended in liquid growth medium (SNTR agar, ASP6, ASP8a, f/2-Si,
L1-Si) in a labeled, clear plastic 16 mL sample vial and were stored protected from light
at room temperature.
Buffer reagents used for intact microbe separations included: poly(ethylene oxide)
(PEO; 600,000 MW), tris[hydroxymethyl]aminomethane (tris), glycine, boric acid, and
citric acid from Sigma (St. Louis, MO, USA), and sodium bicarbonate and
electrophoresis-grade ethylenediaminetetraacetic acid disodium salt (EDTA) from Fisher
Scientific (Fair Lawn, NJ, USA). Buffers were prepared by dissolving the appropriate
amount of reagent in Milli-Q distilled, deionized water (Millipore, Bedford, MA, USA)
to form a stock solution, and then combining those stock solutions in appropriate volumes
to make the final buffer. In order to make a PEO stock solution, an appropriate amount of
PEO and water were added to a small Erlenmeyer flask that was then sonicated for 30-
minute intervals until the PEO dissolved entirely into solution. Each stock solution was
kept at room temperature and made fresh every four weeks (or sooner, if electrophoresis
performance was seen to decline or if any precipitation was observed).
Three buffers were used for PectI analysis, including a tris-glycine buffer, a
carbonate buffer, and a tris/boric acid/EDTA (TBE) buffer. The tris-glycine buffer
contained 3.2 mM tris, 50 mM glycine, and 0.0125% (w/v) PEO, which was measured to
23
have a pH of 8.3 (no pH adjustment). The carbonate buffer contained 10 mM carbonate
with 0.0125% (w/v) PEO, and was adjusted to a pH of 10.0. Any pH adjustments were
made by the dropwise addition of 1.0 or 0.1 M NaOH (Acros, NJ, USA), or 1.0 or 0.1 M
HCl (Fisher, Pittsburg, PA, USA). The TBE buffer contained 0.56 mM tris, 0.56 mM
boric acid, 0.013 mM EDTA and was adjusted to the desired pH of 8.4 with 0.1 M
NaOH. Run buffers containing PEO were always filtered through a 0.45 μm sterile
Acrodisc® syringe filter (Gelman Sciences, Ann Arbor, MI, USA) prior to use. Prepared
buffer solutions were stored at room temperature for up to one week.
For PBP separations, purified samples of 20 mg/mL R-phycoerythrin (R-PE), 6.0
mg/mL B-phycoerythrin (B-PE), 23.8 mg/mL allophycocyanin (APC) and 23.2 mg/mL
C-phycocyanin (C-PC) were received from Prozyme (Hayward, California) dissolved in
60% saturated ammonium sulfate solution with 50 mM potassium phosphate (pH 7.0)
and 5 mM sodium azide. These as-received protein standards were diluted with Milli-Q
water to yield 50 μg/mL stock solutions individually and in a four-protein mixture prior
to analysis. Boric acid and phytic acid from Sigma (St. Louis, MO, USA) were used as
buffer reagents to prepare a 50 mM borate/10 mM phytic acid buffer adjusted to a pH of
8.19 for CE-based PBP separations.
Thioester cleaving agents included dithiothreitol (DTT) and tris (2-carboxyethyl)
phosphine (TCEP), which were dissolved in Milli-Q water to a stock concentration of
either 1.0 or 5.0 mM. Metal catalysts for bilin cleavage by DTT included iron (III)
chloride hexahydrate (Acros, New Jersey, USA) and anhydrous magnesium chloride
(Acros, New Jersey, USA), which were dissolved in Milli-Q water to produce a 2 mM
stock solution. EDTA (Fisher) was dissolved in Milli-Q water to form a stock solution of
24
1-5 mM and was used as a chelator. Stock solutions of R-PE, B-PE, APC and C-PC were
dissolved in Milli-Q water to form working stock solutions between 5 and 220 μg/mL
prior to bilin cleavage. A 50 mM tris (Sigma) buffer stock solution was made for bilin
cleavage (with the pH adjusted to between 7 and 9).
2.2 Sample Preparation
For bilin cleavage, appropriate amounts of PBP, cleaving agent, metal catalyst (if
necessary), EDTA, tris buffer, and Milli-Q water were combined in a microcentrifuge
tube via micropipette and allowed to react from 10 min - 8 h at temperatures from room
temperature (RT, about 25°C) to 80°C. The samples were then transferred to a 10k
Nanosep® Omega™ membrane molecular weight cut-off (MWCO) filter centrifugal
device (Pall Life Sciences, Ann Arbor, Michigan, USA). The reaction mixture was forced
through the filter by centrifugation at 9 krpm for 10 - 15 min. The resulting filtrate was
analyzed for free bilins by fluorimetry.
For PBP separations, an appropriate volume of PBP solution was transferred via
micropipette from a 50 mM stock solution prepared in Milli-Q water to a 5.00-mL
volumetric flask and brought to volume with added separation buffer. If the concentration
of a desired protein solution required dilution of a volume of protein stock solution that
was too small to be reproducibly delivered by a micropipette, then the desired solution
concentration was prepared by serial dilution.
Samples of cyanobacteria were prepared using the following method at the
beginning of each day of experiments: the vial containing the cell culture being analyzed
was vortexed using a Vortex-Genie 2 (VWR, Bohemia, NY, USA) for one minute to
resuspend any cells that had settled out of solution over time. Then, 1 mL of the cell-
25
containing nutrient broth was transferred to a microcentrifuge tube via a 1000 μL
micropipette. The microcentrifuge tube was then centrifuged at 10,000 rpm for 20 min
using a VWR Scientific model V microcentrifuge to form a pellet of cells. The
supernatant was then removed via slow, careful pipetting using a Pasteur pipette, making
sure the pellet was not disrupted. Then the pellet was washed and resuspended in 1000
μL of tris-glycine buffer (delivered via a micropipette) by vortexing for 1 min. The
resuspension was then centrifuged for 10 min at 10,000 rpm until a pellet was formed
again. The vortex/ centrifuge/buffer replacement sequence was repeated 3 times. After
the final vortex, the pellet was resuspended in an appropriate volume (1,000 μL for 1×
culture concentration, 500 μL for 2× culture concentration etc.).
2.3 Instrumentation
All CE experiments were performed on a Beckman P/ACE MDQ Capillary
Electrophoresis system (Brea, CA, USA) equipped with a dual excitation LIF detection
module. Excitation lasers included an external Oz Optics 635 nm adjustable power-output
diode laser (Ottawa, Ontario, Canada), and a Beckman 488 nm air-cooled Ar-ion laser.
The detection module was equipped with a Beckman 488 nm notch filter with a 520 nm
bandpass (BP), two tandem 655 nm BP, a 650 nm long pass, and/or a 585 nm BP Omega
Optical filter(s) (Brattleboro, VT, USA). Uncoated fused-silica capillaries (Polymicro
Technologies, Phoenix, AZ, USA) of various length and inner diameter (id) were used in
all CE experiments.
Fluorescence measurements were made using a Perkin-Elmer LS50B
Luminescence Spectrometer (Shelton, CT, USA). Excitation and emission slit widths
26
were set to 5 nm, and scan speed was set to 200 nm/min. Samples were measured in
semi-micro 1 cm quartz cuvettes (VWR, Suwanee, GA, USA).
2.4 CE Conditions
CE-LIF analysis of cyanobacteria was conducted by applying a 15 kV separation
voltage across a 100 μm id capillary, which was 21 cm to the detector (31 cm total), and
was kept thermostated at 25ºC. A 0.56 /0.56/ 0.013 mM TBE buffer was used as the
BGE. Samples were injected for 5 s at 2.0 psi. Pre-injection capillary treatment consisted
of sequential 2 min water and 2 min buffer rinses. Brand-new capillaries were
conditioned with 20 min rinses (at 5 psi) of 1 M NaOH followed by MilliQ water. LIF
excitation wavelengths of 488 and 635 nm were used. Detector channel 1 was equipped
with a 660 nm long pass (LP) filter and channel 2 was equipped with a 488 notch filter
and 520 nm band pass (BP) filter.
PectI analyses of intact microbes were performed in 75 μm id capillaries with an
effective length of 50 cm (60 cm total). Samples were either sonicated with a Branson
2510 sonicator (Branson Ultrasonics, USA) for a specified period of time (1-6 min),
vortexed for 1 min, or both, immediately prior to injection. New capillaries were
conditioned with subsequent rinses of 1 M NaOH and MilliQ water, each for 20 min at 5
psi. Pre-injection capillary treatments, which took place between each separation,
included the following successive rinses: 1 min of 0.1 M NaOH, 1 min MilliQ water, and
2 min of carbonate buffer, each at a pressure of 5 psi. Electrophoretic separations were
performed at a constant applied voltage of 20 kV with the capillary thermostated at 25ºC.
An LIF excitation wavelength of 635 nm was used. Detector channel 1 was equipped
27
with two consecutive 655 nm BP filters and channel 2 was blocked with an opaque
plastic light blocker.
Protein separations were accomplished using a 50 μm id capillary with an
effective length of 40 cm (total length of 50 cm). New capillary was conditioned using
subsequent 20 min rinses (at 20 psi) of 1 M NaOH and MilliQ water. Samples were
injected for 5 s at 1 psi. Pre-injection capillary rinses with MilliQ water followed by
50/10 mM borate/phytic acid separation buffer (at 20 psi for 3 and 5 minutes,
respectively) were performed before each separation. A separation voltage of 15 kV was
used. LIF excitation wavelengths of 488 and 635 nm were used. Detector channel 1 was
equipped with 660 nm long pass (LP) filter and channel 2 was equipped with a 488 notch
filter and 520 nm band pass (BP) filter.
28
3. RESULTS & DISCUSSION
3.1 Bilin Cleavage from Phycobiliprotein Standards
CE-LIF analysis of the bilin chromophores that impart the light harvesting
properties to the PBPs requires quantitative cleavage of the cysteine linkages that
covalently bind the bilins to the peptide backbone of the PBP. To do this, a systematic
study of bilin cleavage using DTT and TCEP as cleaving agents for R-PE, B-PE, APC,
and C-PC was undertaken by collaborator Dr. Soad Selem. Fluorescence detection by
luminescence spectrometry was used to monitor the liberation of free bilins after PBP
standards were reacted with DTT or TCEP. In Dr. Selem’s preliminary studies, a variety
of conditions were explored. To begin, 0.2 µg/mL R-PE was used for method
optimization because of its strong fluorescence signal. To cleave the bilins from the
protein, R-PE was added to a solution with varying concentrations of DTT (0.05 to 0.25
mM), a metal catalyst (0.5 to1.25 mM of either FeCl3 or MgCl2), and EDTA (0 or 5 mM)
in a 20 mM tris buffer (adjusted to between pH 7 and 8). These digests were reacted for
10 minutes, then transferred to 10k Nanosep® MWCO filters and centrifuged for 15 min
at 9 krpm. The fluorescence of the filtrates was then measured (λex=488 nm). No bilin
fluorescence was detected in the filtrate of samples reacted under any of these conditions.
This indicated that the chromophores were either not cleaved from the protein (and so
were removed by the filter prior to fluorescence emission studies), or did not remain
intact enough to be emissive after the incubation. TCEP was then used in a 20 mM tris
(pH 7) solution (no metal catalyst required), and a fluorescence signal was obtained for
the resulting filtrate, indicating that the bilin chromophores were either cleaved entirely
or were attached to a small enough segment of peptide to pass through the filter. EDTA

29
was added to prevent sulfhydryl groups that are generated as a result of the reduction of
disulfide and thioester linkages from reoxidizing. When the EDTA concentration in the
digest was varied between 0.10 - 0.40 mM, 0.2 mM EDTA was found to be optimum
(Figure 3-1 A). This EDTA concentration was applied to an optimization of TCEP
concentrations whereby the greatest fluorescence was obtained with 0.2 mM TCEP and
0.2 mM EDTA (Figure 3-1 B). It is unclear at this point if TCEP was structurally
damaging the bilins, acting as an internal filter at concentrations that exceed the
optimum, or participating in another quenching mechanism. It is clear, however, that an
excess of TCEP decreases the fluorescent signal from the prepared samples.
Figure 3-1: Optimization of A) EDTA and B) TCEP concentrations for bilin cleavage from R-PE protein, yielding soluble, fluorescent bilin pigments (λex= 488nm). EDTA optimization digests contained 0.2 mM R-PE, 0.2 mM TCEP, 20 mM tris buffer (pH 7), and varying amounts of EDTA in Milli-Q water. TCEP optimization digests contained 0.20 mM R-PE, 0.20 mM EDTA, 20 mM tris buffer (pH 7), and varying amounts of TCEP.
These optimized concentrations for bilin cleavage were then used to process all
four PBPs. Reaction mixtures containing 0.2 mM EDTA, 0.2 mM TCEP, 20 mM tris

30
buffer (pH 7), and 0.2 µg/mL protein (R-PE, B-PE, APC or C-PC) were allowed to
incubate for 10 min at room temperature before being transferred to a 10k MWCO filter,
which was centrifuged for 15 min at 9 krpm. This resulted in fluorescence signals for the
R-PE and B-PE digest filtrates, but no signal for either C-PC or APC. The incubation
time for APC and C-PC was increased until a signal was detected. Protein concentrations
in the reaction mixtures were increased for all proteins, particularly for C-PC and APC,
before strong fluorescence was observed in the protein digest filtrates. Buffer and EDTA
concentrations, as well as pH, were then optimized individually for each PBP. Final bilin
cleavage conditions for R-PE, B-PE, C-PC, and APC can be found in Table 3-1.
Table 3-1: Final reaction and detection conditions for phycobiliprotein bilin cleavage. All protein digests were reacted at room temperature and filtered through a 10k Nanosep® MWCO filter via centrifugation at 9 krpm for 15 minutes prior to analysis by fluorimetry.
Protein (μg/mL)
TCEP (mM)
EDTA (mM)
Tris (mM)
pH Incubation Time (min)
λex (nm)
λem (nm)
Fluorescence (RFU)
R-PE 0.25 0.2 0.2 20 8 10 488 570 11.3 B-PE 0.35 0.2 0.2 20 8 10 545 572 121.6 APC 8 0.2 0.4 36 7 30 635 658 7.9 C-PC 8 0.2 0.2 36 7 30 620 637 0.7
The cleavage of bilins from their peptide backbones proved much more difficult
than originally thought. It is possible that much harsher reaction conditions are required
to quantitatively cleave the thioether bonds that hold the chromophores attached. More
reactive reducing agents or longer digestion times may improve recovery. Once the bilins
can be cleaved, method development on an electrophoretic separation technique can
begin. CE separation of the bilins liberated from a cyanobacteria’s PBPs could afford
quantitative insight into the overall chromophore constitution of an organism and aid in
31
the detection of novel or unusual bilins as they are found to be incorporated into PBPs.
Similar electrophoresis-based analyses of the intact proteins would give a possible means
of identification or monitoring of adaptive behaviors of cyanobacteria, and so method
development aimed at the separation and sensitive detection of PBPs was undertaken.
3.2 Phycobiliprotein separation by CZE and PectI
It has been shown that sensitive detection can be achieved when analyzing PBP
standards using a single LIF excitation source33. To increase sensitivity further, two
excitation sources were equipped to the LIF detection module: a red laser (either 635 or
650 nm) for detection of C-PC (λabs=615 nm) and APC (λabs=598, 629, 650 nm), and a
488 nm laser for the detection of R-PE (λabs=498, 545, 568 nm) and B-PE (λabs=498, 545,
568 nm). To compare detection of these PBPs between 635 and 488 nm excitation
sources, each laser was used independently (see Figure 3-2). C-PC and APC were
detectable when the 635 nm laser was in use, but B-PE and R-PE were not. Conversely,
when the 488 nm laser was used, no signal was observed for C-PC or APC, but B-PE and
R-PE were both detected. When both lasers were used simultaneously, and two emission
channels were monitored (two 655 nm BP filters in channel 1; 520 nm BP and 488 nm
notch filter in channel 2), more sensitive detection of C-PC and APC than of B-PE and R-
PE in channel 1 and exclusive detection of R-PE and B-PE in channel 2 was observed.
While signals for all four PBP were present in channel 1 for trials using both LIF sources,
only R-PE and B-PE signals were detected in channel 2 under these conditions (Figure 3-
2B).
32
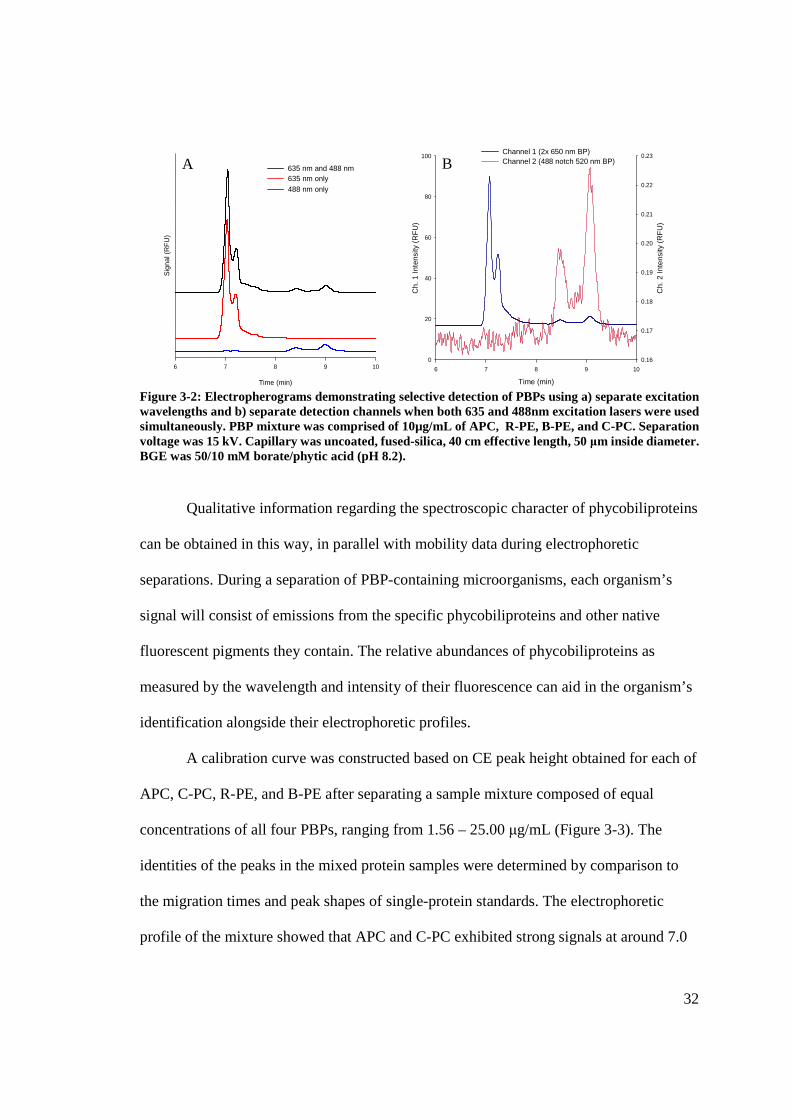
Figure 3-2: Electropherograms demonstrating selective detection of PBPs using a) separate excitation wavelengths and b) separate detection channels when both 635 and 488nm excitation lasers were used simultaneously. PBP mixture was comprised of 10µg/mL of APC, R-PE, B-PE, and C-PC. Separation voltage was 15 kV. Capillary was uncoated, fused-silica, 40 cm effective length, 50 μm inside diameter. BGE was 50/10 mM borate/phytic acid (pH 8.2).
Qualitative information regarding the spectroscopic character of phycobiliproteins
can be obtained in this way, in parallel with mobility data during electrophoretic
separations. During a separation of PBP-containing microorganisms, each organism’s
signal will consist of emissions from the specific phycobiliproteins and other native
fluorescent pigments they contain. The relative abundances of phycobiliproteins as
measured by the wavelength and intensity of their fluorescence can aid in the organism’s
identification alongside their electrophoretic profiles.
A calibration curve was constructed based on CE peak height obtained for each of
APC, C-PC, R-PE, and B-PE after separating a sample mixture composed of equal
concentrations of all four PBPs, ranging from 1.56 – 25.00 μg/mL (Figure 3-3). The
identities of the peaks in the mixed protein samples were determined by comparison to
the migration times and peak shapes of single-protein standards. The electrophoretic
profile of the mixture showed that APC and C-PC exhibited strong signals at around 7.0
Time (min)
6 7 8 9 10
Ch.
1 In
tens
ity (
RF
U)
0
20
40
60
80
100
Ch.
2 In
tens
ity (
RF
U)
0.16
0.17
0.18
0.19
0.20
0.21
0.22
0.23Channel 1 (2x 650 nm BP)Channel 2 (488 notch 520 nm BP)
Time (min)
6 7 8 9 10
Sig
nal (
RF
U)
635 nm and 488 nm
488 nm only635 nm only
A B
33
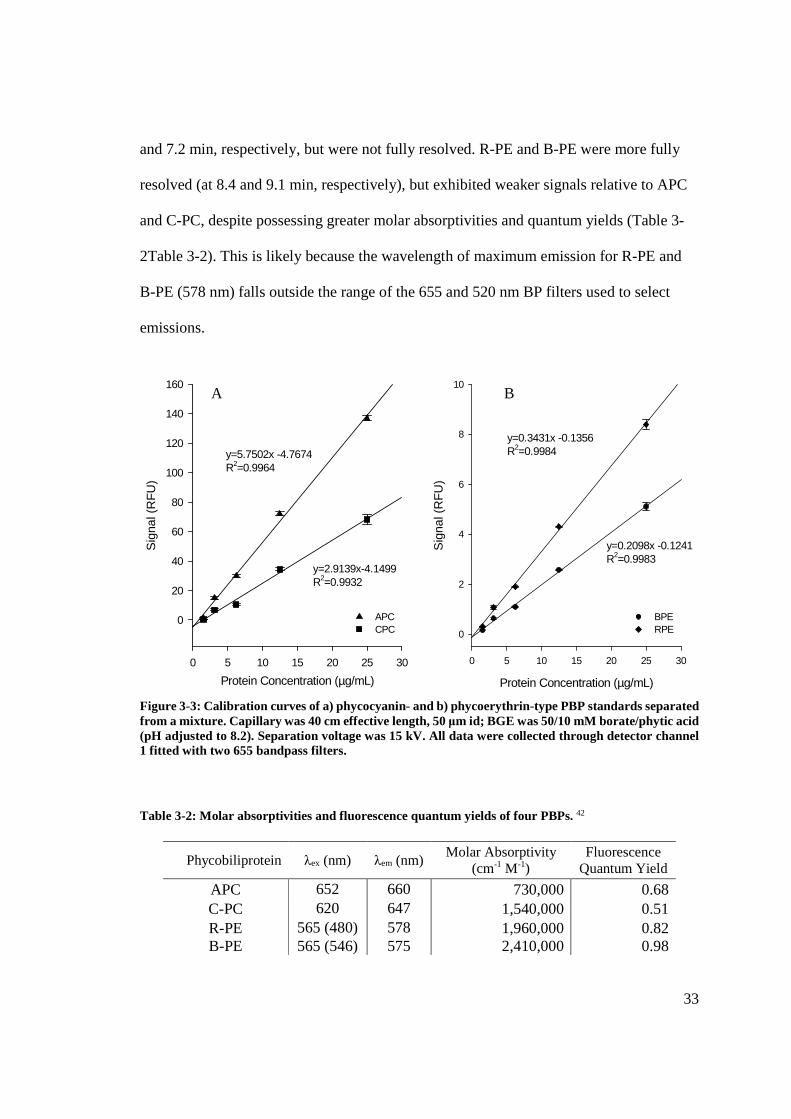
and 7.2 min, respectively, but were not fully resolved. R-PE and B-PE were more fully
resolved (at 8.4 and 9.1 min, respectively), but exhibited weaker signals relative to APC
and C-PC, despite possessing greater molar absorptivities and quantum yields (Table 3-
2Table 3-2). This is likely because the wavelength of maximum emission for R-PE and
B-PE (578 nm) falls outside the range of the 655 and 520 nm BP filters used to select
emissions.
Figure 3-3: Calibration curves of a) phycocyanin- and b) phycoerythrin-type PBP standards separated from a mixture. Capillary was 40 cm effective length, 50 μm id; BGE was 50/10 mM borate/phytic acid (pH adjusted to 8.2). Separation voltage was 15 kV. All data were collected through detector channel 1 fitted with two 655 bandpass filters. Table 3-2: Molar absorptivities and fluorescence quantum yields of four PBPs. 42
Phycobiliprotein λex (nm) λem (nm) Molar Absorptivity
(cm-1 M-1) Fluorescence
Quantum Yield
APC 652 660 730,000 0.68 C-PC 620 647 1,540,000 0.51 R-PE 565 (480) 578 1,960,000 0.82 B-PE 565 (546) 575 2,410,000 0.98
Protein Concentration (µg/mL)
0 5 10 15 20 25 30
Sig
nal (
RF
U)
0
2
4
6
8
10
BPERPE
y=0.3431x -0.1356R2=0.9984
y=0.2098x -0.1241R2=0.9983
Protein Concentration (µg/mL)
0 5 10 15 20 25 30
Sig
nal (
RF
U)
0
20
40
60
80
100
120
140
160
APCCPC
y=5.7502x -4.7674R2=0.9964
y=2.9139x-4.1499R2=0.9932
A B
34
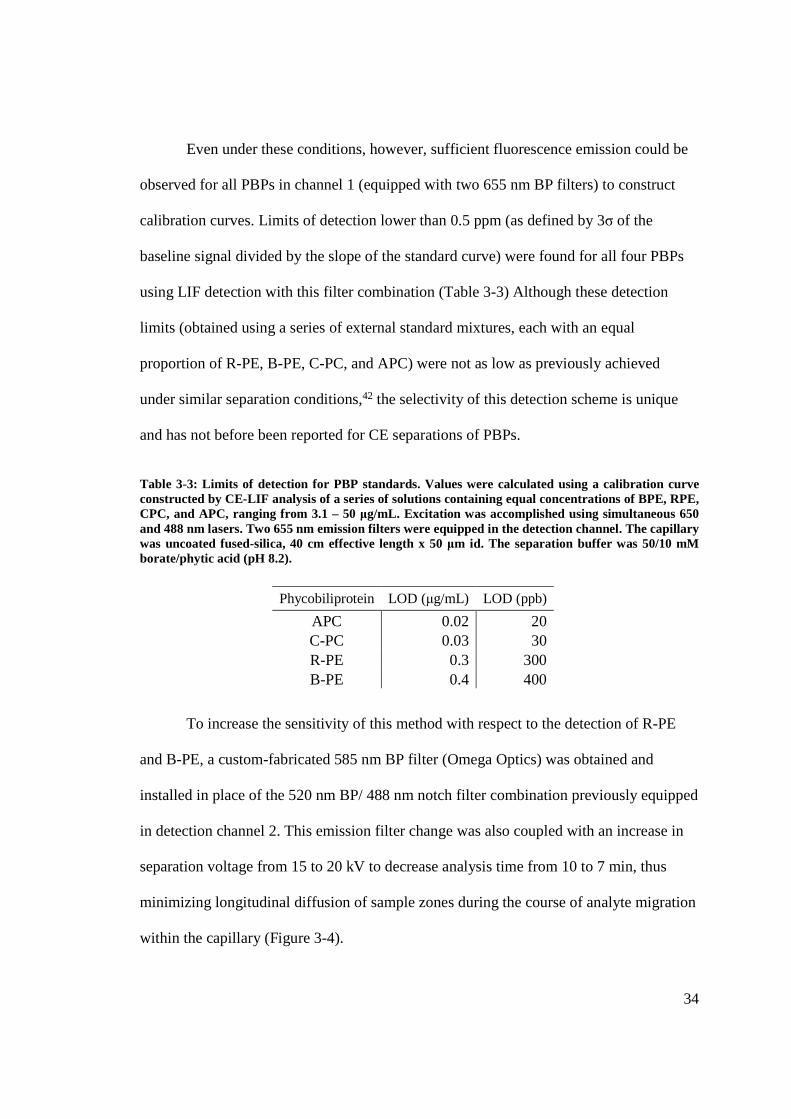
Even under these conditions, however, sufficient fluorescence emission could be
observed for all PBPs in channel 1 (equipped with two 655 nm BP filters) to construct
calibration curves. Limits of detection lower than 0.5 ppm (as defined by 3σ of the
baseline signal divided by the slope of the standard curve) were found for all four PBPs
using LIF detection with this filter combination (Table 3-3) Although these detection
limits (obtained using a series of external standard mixtures, each with an equal
proportion of R-PE, B-PE, C-PC, and APC) were not as low as previously achieved
under similar separation conditions,42 the selectivity of this detection scheme is unique
and has not before been reported for CE separations of PBPs.
Table 3-3: Limits of detection for PBP standards. Values were calculated using a calibration curve constructed by CE-LIF analysis of a series of solutions containing equal concentrations of BPE, RPE, CPC, and APC, ranging from 3.1 – 50 μg/mL. Excitation was accomplished using simultaneous 650 and 488 nm lasers. Two 655 nm emission filters were equipped in the detection channel. The capillary was uncoated fused-silica, 40 cm effective length x 50 μm id. The separation buffer was 50/10 mM borate/phytic acid (pH 8.2).
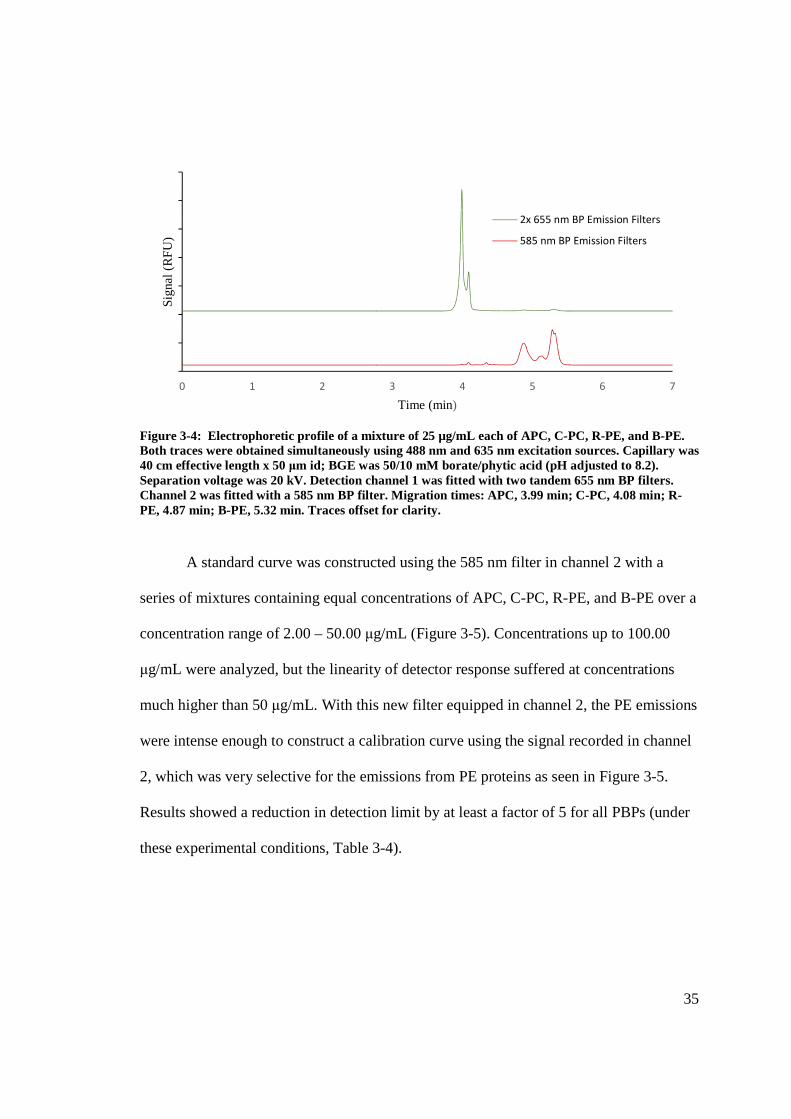
To increase the sensitivity of this method with respect to the detection of R-PE
and B-PE, a custom-fabricated 585 nm BP filter (Omega Optics) was obtained and
installed in place of the 520 nm BP/ 488 nm notch filter combination previously equipped
in detection channel 2. This emission filter change was also coupled with an increase in
separation voltage from 15 to 20 kV to decrease analysis time from 10 to 7 min, thus
minimizing longitudinal diffusion of sample zones during the course of analyte migration
within the capillary (Figure 3-4).
Phycobiliprotein LOD (μg/mL) LOD (ppb)
APC 0.02 20 C-PC 0.03 30 R-PE 0.3 300 B-PE 0.4 400
35
Figure 3-4: Electrophoretic profile of a mixture of 25 µg/mL each of APC, C-PC, R-PE, and B-PE. Both traces were obtained simultaneously using 488 nm and 635 nm excitation sources. Capillary was 40 cm effective length x 50 μm id; BGE was 50/10 mM borate/phytic acid (pH adjusted to 8.2). Separation voltage was 20 kV. Detection channel 1 was fitted with two tandem 655 nm BP filters. Channel 2 was fitted with a 585 nm BP filter. Migration times: APC, 3.99 min; C-PC, 4.08 min; R-PE, 4.87 min; B-PE, 5.32 min. Traces offset for clarity.
A standard curve was constructed using the 585 nm filter in channel 2 with a
series of mixtures containing equal concentrations of APC, C-PC, R-PE, and B-PE over a
concentration range of 2.00 – 50.00 μg/mL (Figure 3-5). Concentrations up to 100.00
μg/mL were analyzed, but the linearity of detector response suffered at concentrations
much higher than 50 μg/mL. With this new filter equipped in channel 2, the PE emissions
were intense enough to construct a calibration curve using the signal recorded in channel
2, which was very selective for the emissions from PE proteins as seen in Figure 3-5.
Results showed a reduction in detection limit by at least a factor of 5 for all PBPs (under
these experimental conditions, Table 3-4).
0 1 2 3 4 5 6 7
Sig
nal (
RF
U)
Time (min)
2x 655 nm BP Emission Filters
585 nm BP Emission Filters

36
Figure 3-5: CE-LIF calibration curves for a) phycocyanin- and b) phycoerythrin- type PBP standards separated from a mixture using optimized emission filters in detection channels. Capillary was 40 cm effective length x 50 μm id; BGE was 50/10 mM borate/phytic acid (pH adjusted to 8.2). Injection was 1 psi×5 s. Separation voltage was 20 kV. APC and C-PC data were collected through channel 1 fitted with two 655 bp filters. R-PE and B-PE data were collected through channel 2 fitted with a 585 nm BP filter.
Table 3-4: Limits of detection for phycobiliproteins using a 585 nm BP filter in channel two for the enhanced detection of phycoerythrins. Equal concentrations of B-PE, R-PE, C-PC, and APC in a mixture were analyzed by CE-LIF using 650 and 488 nm excitation lasers simultaneously. APC and C-PC were detected in channel 1 (equipped with two 655 nm BP emission filters). R-PE and B-PE were detected in channel 2 (equipped with a 585 nm BP emission filter). See Figure 3-5 for separation conditions.
Phycobiliprotein LOD (μg/mL) LOD (ppb) Detection Channel Emission Filter
APC 2·10-3 2 1 2x 655 nm BP
C-PC 6·10-3 6 R-PE 1·10-2 10
2 585 nm BP B-PE 7·10-3 7
y = 6.9922x - 9.1511
R² = 0.9981
y = 2.5226x - 5.4611
R² = 0.9994
0
50
100
150
200
250
300
350
400
0 20 40 60
Pe
ak
He
igh
t (R
FU
)
PBP Concentration (μg/mL)
A
APC
C-PC
y = 1.4465x - 0.6584
R² = 0.9995
y = 2.2474x - 0.1753
R² = 0.9989
0
20
40
60
80
100
120
140
0 20 40 60
Pe
ak
He
igh
t (R
FU
)
PBP Concentration (μg/mL)
B
R-PE
B-PE
37
By employing more targeted emission filters and increasing the separation
voltage, not only was the method made more sensitive to the detection of PE’s (with
lower limits of detection for all PBPs), but quantitation of different PBPs was achieved
on separate channels, each highly selective for the emission of either PC- or PE-type
proteins (even in a mixture with both PC and PE proteins present). The improvement in
detection limit for PC proteins detected via channel 1 (with unchanged, 635 nm BP
emission filters) is possibly due to the decrease in peak broadening during the faster
analysis. The detection limits using the new filter in channel 2 are not as low as expected
given the improved agreement between the emission range of PE’s and the bandpass
window of the new filter. This could be due to an increase in the irregularity of peak
height and shape that was observed during the faster separation. If greater resolution
could be achieved, peak areas could be used instead of peak heights, hopefully increasing
the sensitivity and reproducibility of analysis. Unfortunately, R-PE and B-PE signals
were not baseline resolved from one another, nor were APC and C-PC, precluding the
reliable use of peak areas for these quantitation studies. This need for increased resolution
without the accompanying peak broadening inherent in the increased longitudinal
diffusion of longer capillaries and lower separation voltages, made the utility of an on-
column focusing technique apparent.
To this end, a new CE-based method known as polymer enhanced capillary
transient isotachophoresis (PectI), which was developed previously in our laboratory for
the analysis of gram-positive bacteria,29 was applied for the very first time to the
separation of PBPs. A series of mixtures of dilute PBP standards were prepared in a 50
mM glycine/ 3.2 mM Tris/ 0.0125% (w/v) PEO buffer (pH 8.3), which functioned as the
38
trailing electrolyte TE, while a 10 mM carbonate/0.0125% (w/v) PEO (pH 10.0) buffer
was used as the separation buffer, which functioned as the leading electrolyte (LE).
Because the separation buffer for these PectI studies was more basic than the separation
buffer used in previous CE separations of PBPs (pH of 10.0 rather than 8.2), this had the
effect of increasing the EOF and reducing net migration times. As such, the separation
voltage needed to be greatly reduced from 15 kV to 7 kV for these studies in order to
allow sufficient time for the PBPs to separate and be resolved as they migrated along the
capillary. A calibration curve was constructed based on peak height for each PBP signal
arising in the PectI electropherograms as a function of protein concentration. The results,
as seen in Figure 3-6, showed good linearity for all PBPs studied by this PectI method.
As shown in Table 3-5, detection limits for all PBPs were less than 50 ppb (or ng/mL).
Comparing results obtained by PectI analysis to those obtained by CZE, the PC
proteins were not as sensitively detected using the PectI method as compared to the CZE
method previously used. For example, APC showed a detection limit of 20 ppb by way of
PectI analysis, which was approximately 8-times greater than the APC detection limit by
CZE (2 ppb). Likewise, C-PC had a detection limit of 50 ppb by PectI, which was
approximately 8-times greater than the C-PC detection limit by CZE (6 ppb). The PE
proteins, however, showed a decrease in detection limit by way of PectI analysis
compared to CZE analysis. B-PE showed a detection limit of 7 ppb by CZE versus 3 ppb
by PectI (a 60% improvement), while R-PE showed a detection limit of 10 ppb by CZE
vs. 4 ppb by PectI (also a 60% improvement). Since PectI is an on-column focusing
technique, detection limits for all proteins were expected to decrease, but this was not
observed. This could be due to the buffer system being suboptimal for PBP fluorescence
39
and detection. In the future, other TE and LE combinations at other pH values could be
studied in an effort to further decrease the detection limits of these proteins. Although
there may be room for further improvements, the limits of detection obtained in the
present studies are more than sufficient to allow for the sensitive detection of these
important protein analytes in normally prepared samples.
Although PectI led to improved (lower) detection limits for some PBPs, the linear
dynamic range for all PBPs using the PectI method was very small. Protein peak height
as a function of concentration deviated from linearity at PBP concentrations above 0.3
μg/mL. This could be due to the short duration of the ITP focusing phase of ctITP.
Sample bands with concentrations beyond an upper threshold may not have enough time
to focus to the same extent as sample bands at lower concentrations. However, if the
detection limits of PBPs using PectI could be improved by optimizing the buffer system
and/or other parameters, the sample zone focusing of this technique would only be
necessary for very dilute samples. Otherwise, CE methods such as the one developed
herein with dual-channel detection and specialized emission filter selection is able to
provide sufficient sensitivity for samples containing higher amounts of PBP.
3.3 CE and PectI Separations of Intact Cyanobacteria
In addition to the analyte focusing property associated with PectI (or
isotachophoresis methods in general), the soluble polymer PEO employed by this method
is known to increase resolution (by some uncertain mechanism, as described
elsewhere)28,47. These two effects combined were considered necessary for the analysis of
intact cyanobacteria. Whereas some analyses may require only the determination of
40
Figure 3-6: Calibration curves for A) phycocyanin- and B) phycoerythrin PBP standards separated from a sample mixture by using PectI. Capillary was 40 cm effective length x 50 μm id; run buffer (LE) was 10 mM carbonate buffer adjusted to pH 10.0; sample buffer (TE) was 50 mM glycine/3.2 mM tris (pH: 8.3). All buffers contained PEO (0.0125%, w/v). Separation voltage was 7 kV. APC and C-PC data were collected via channel 1 fitted with two 655 nm BP filters; R-PE and B-PE data were collected via channel 2 fitted with a 585 nm BP filter. Table 3-5: Limits of detection for phycobiliproteins by way of the PectI technique. Samples containing a mixture of equal concentrations of each of B-PE, R-PE, C-PC, and APC were analyzed using 650 and 488 nm excitation lasers simultaneously. APC and C-PC were detected in channel 1 equipped with two 655 nm BP emission filters; R-PE and B-PE were detected in channel 2 equipped with a 585 nm BP filter. See Figure 3-6 for separation conditions.
y = 0.5941x + 0.0274
R² = 0.9994
y = 0.2265x - 0.005
R² = 0.9908
0.00
0.05
0.10
0.15
0.20
0.25
0.30
0.35
0.40
0.45
0 0.2 0.4 0.6 0.8
Pe
ak
He
igh
t (R
FU)
PBP Concentration (μg/mL)
A
APC
C-PC
y = 2.1268x - 0.0417
R² = 0.9927
y = 3.543x - 0.0387
R² = 0.9947
0.00
0.50
1.00
1.50
2.00
2.50
0 0.2 0.4 0.6 0.8
Pe
ak
He
igh
t (R
FU
)
PBP Concentration (μg/mL)
B
R-PE
B-PE
Phycobiliprotein LOD (μg/mL) LOD (ppb) Detection Channel Emission Filters
APC 2·10-2 20 1 2x 635 nm BP
C-PC 5·10-2 50 R-PE 4·10-3 4
2 585 nm BP B-PE 3·10-3 3
41
pigmented PBPs liberated from their original host organisms, other analyses may require
the determination of intact cyanobacteria, a task for which PectI seems ideally suited. To
ascertain if PectI would, indeed, lead to improved separations of cyanobacteria, cultured
cyanobacteria samples were first analyzed by a simpler CE methodology for comparison.
Because the cyanobacteria themselves take on the spectroscopic properties of the
phycobiliproteins they contain, the detection principles from PBP analysis were used for
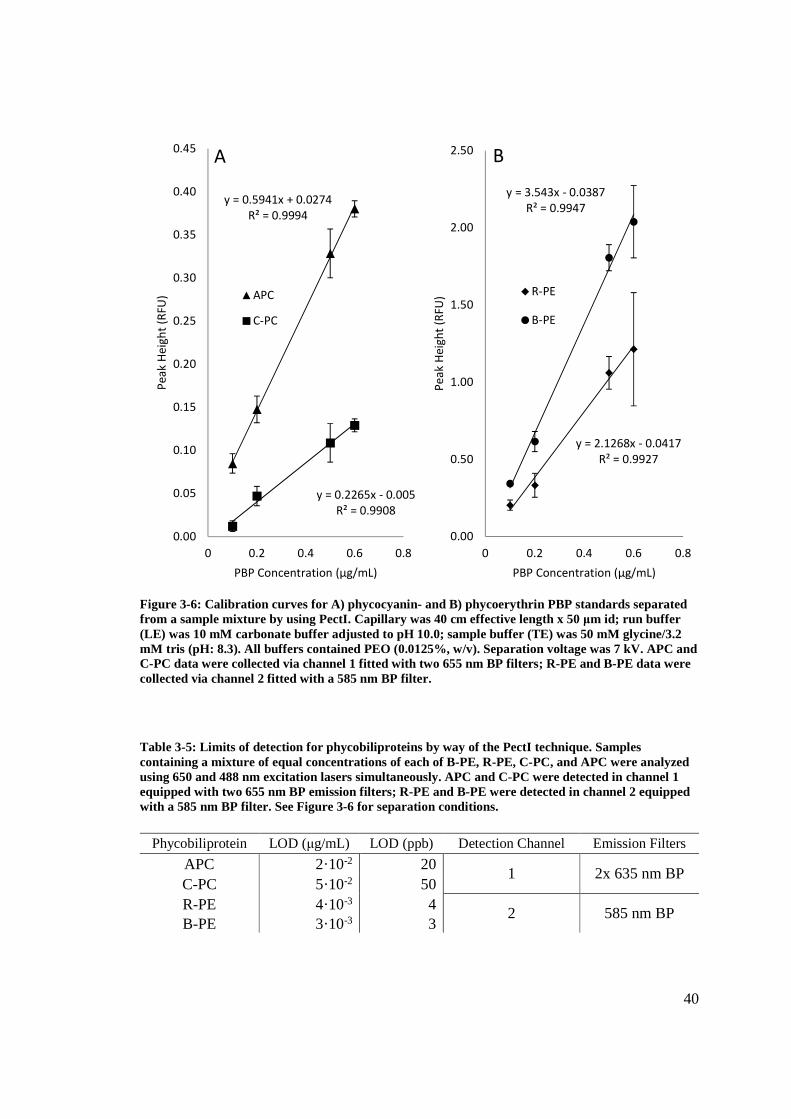
intact organism separations. Capillary zone electrophoresis (CZE) was performed on pure
culture samples of the Synechococcus cyanobacteria strains CCMP 1333 and CCMP 833
in a 0.56 /0.56/ 0.013 mM tris/boric acid/EDTA (TBE) run buffer adjusted to pH 8.4 with
concurrent LIF excitation wavelengths of 635 and 488 nm. Resulting electropherograms
for each of the two pure cell culture samples (as seen in Figure 3-7), analyzed
independently of one another by this CZE method, gave rise to very broad, non-Gaussian
signals centered at about 0.6 min, which would not likely have been resolved from one
another (in time) had the culture samples been mixed prior to analysis. However, the LIF
signal corresponding to the phycocyanin-rich CCMP 1333 sample was much stronger in
channel 1 (665 LP filter) while the phycoerythrin-rich CCMP 833 sample showed a much
stronger signal in channel 2 (488 nm notch filter and 520 nm BP filter). This discrete
detection can be thought of as spectroscopic resolution, which allows for qualitative
information to be obtained regarding the PBP content of intact microbes, despite their
poor temporal resolution by the CZE separation method. Ideally, if a population or
sample containing several different cyanobacteria strains could also be resolved
electrophoretically, each signal could then be assessed by its relative intensity as detected
42
in the “phycocyanin channel” and “phycoerythrin channel” to obtain information about
its PBP content (and hence, possible bacterial identity).
Figure 3-7: A comparison of electropherograms obtained for independent samples of CCMP 1333 and CCMP 833 cell cultures using two detection channels. Run buffer: 0.56 /0.56/ 0.013 mM TBE. Capillary: 100 μm id uncoated fused silica x 21 cm effective length. CE conditions: 15.0 kV separation voltage; 5 s × 2.0 psi sample injection; 25oC thermostated capillary and sample compartment.
In order to temporally resolve a mixture of CCMP 1333 and CCMP 833,
optimization of electrophoretic parameters for a single cyanobacteria strain (namely,
CCMP 1333) was first attempted. This strain was chosen to begin optimization because
of its stronger emission signal. Before any ctITP processes were employed, the impact of
adding polymer to the buffer employed in a simple CZE separation was explored to
assess the effectiveness of polymer focusing alone in these separations. To this effect,
poly(ethylene oxide) (PEO) was used as a buffer additive. The effect of polymer
concentration was determined by adding PEO to a 0.56 /0.56/ 0.013 mM TBE run buffer
C h a n n e l 1 (6 6 5 n m L P F ilte r )
T im e (m in )0 .0 0 .5 1 .0 1 .5 2 .0 2 .5
Sig
nal (
RF
U)
2 5
3 0
3 5
4 0
4 5
5 0 C C M P 8 3 3 C C M P 1 3 3 3
C h a n n e l 2 (4 8 8 n m N o tc h a n d 5 2 0 n m B P F i lte rs )
T im e (m in )0 .0 0 .5 1 .0 1 .5 2 .0 2 .5
Sig
nal (
RF
U)
0 .2
0 .3
0 .4
0 .5 C C M P 8 3 3C C M P 1 3 3 3
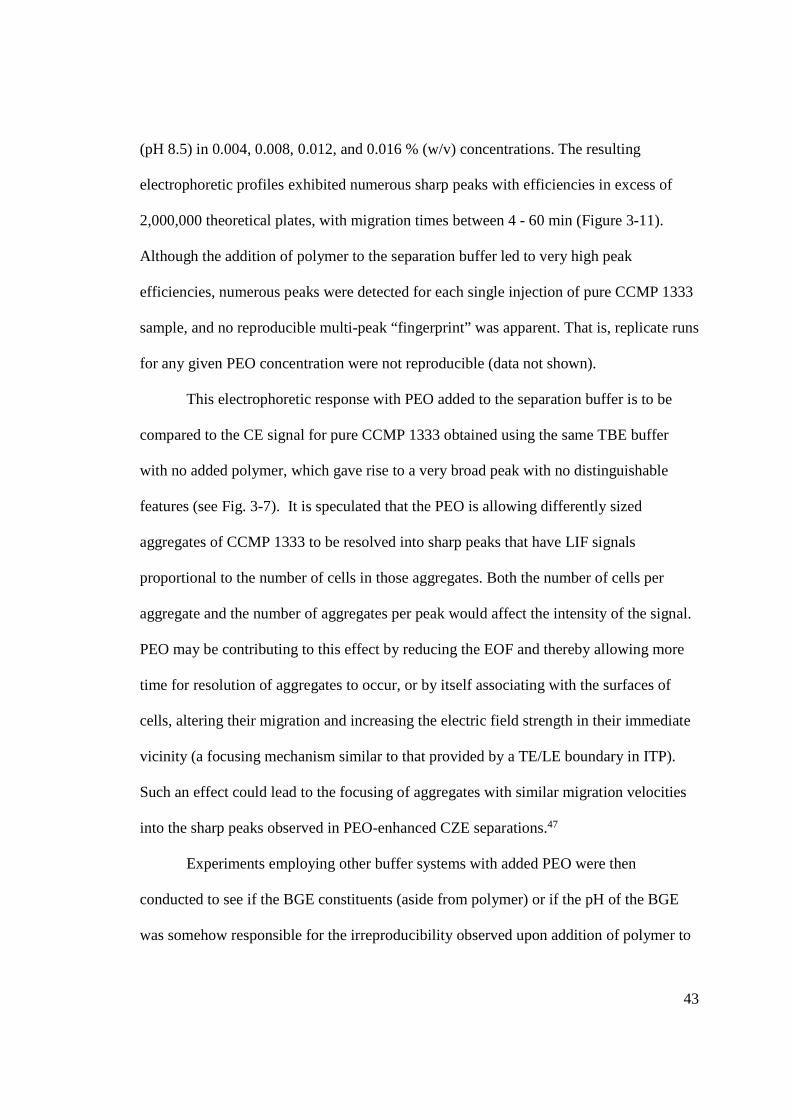
43
(pH 8.5) in 0.004, 0.008, 0.012, and 0.016 % (w/v) concentrations. The resulting
electrophoretic profiles exhibited numerous sharp peaks with efficiencies in excess of
2,000,000 theoretical plates, with migration times between 4 - 60 min (Figure 3-11).
Although the addition of polymer to the separation buffer led to very high peak
efficiencies, numerous peaks were detected for each single injection of pure CCMP 1333
sample, and no reproducible multi-peak “fingerprint” was apparent. That is, replicate runs
for any given PEO concentration were not reproducible (data not shown).
This electrophoretic response with PEO added to the separation buffer is to be
compared to the CE signal for pure CCMP 1333 obtained using the same TBE buffer
with no added polymer, which gave rise to a very broad peak with no distinguishable
features (see Fig. 3-7). It is speculated that the PEO is allowing differently sized
aggregates of CCMP 1333 to be resolved into sharp peaks that have LIF signals
proportional to the number of cells in those aggregates. Both the number of cells per
aggregate and the number of aggregates per peak would affect the intensity of the signal.
PEO may be contributing to this effect by reducing the EOF and thereby allowing more
time for resolution of aggregates to occur, or by itself associating with the surfaces of
cells, altering their migration and increasing the electric field strength in their immediate
vicinity (a focusing mechanism similar to that provided by a TE/LE boundary in ITP).
Such an effect could lead to the focusing of aggregates with similar migration velocities
into the sharp peaks observed in PEO-enhanced CZE separations.47
Experiments employing other buffer systems with added PEO were then
conducted to see if the BGE constituents (aside from polymer) or if the pH of the BGE
was somehow responsible for the irreproducibility observed upon addition of polymer to
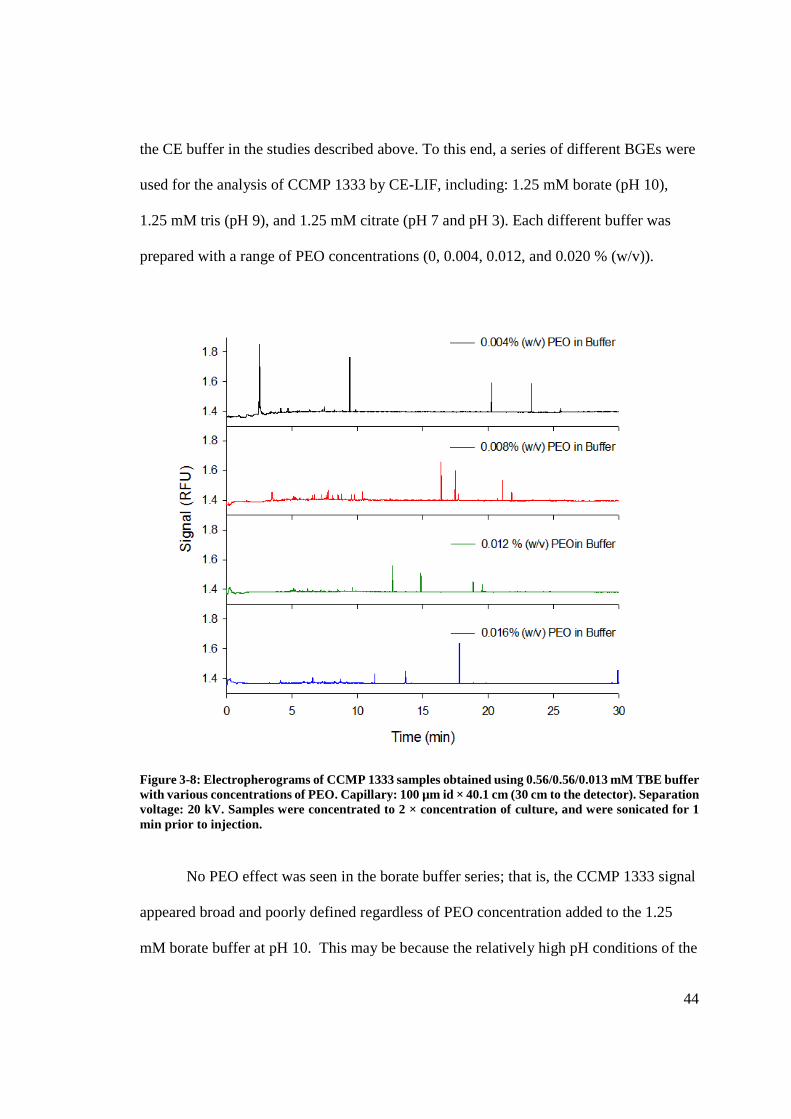
44
the CE buffer in the studies described above. To this end, a series of different BGEs were
used for the analysis of CCMP 1333 by CE-LIF, including: 1.25 mM borate (pH 10),
1.25 mM tris (pH 9), and 1.25 mM citrate (pH 7 and pH 3). Each different buffer was
prepared with a range of PEO concentrations (0, 0.004, 0.012, and 0.020 % (w/v)).
Figure 3-8: Electropherograms of CCMP 1333 samples obtained using 0.56/0.56/0.013 mM TBE buffer with various concentrations of PEO. Capillary: 100 µm id × 40.1 cm (30 cm to the detector). Separation voltage: 20 kV. Samples were concentrated to 2 × concentration of culture, and were sonicated for 1 min prior to injection.
No PEO effect was seen in the borate buffer series; that is, the CCMP 1333 signal
appeared broad and poorly defined regardless of PEO concentration added to the 1.25
mM borate buffer at pH 10. This may be because the relatively high pH conditions of the

45
borate buffer somehow inhibited physical interactions between the dilute polymer and the
microbe surface and/or capillary wall. However, a substantial change in CCMP 1333
signal was observed when PEO was added to the tris (pH 9) and citrate (pH 7) buffers.
Specifically, the addition of PEO (at any of the polymer concentrations studied)
led to the appearance of large groups of sharp, later-eluting, high-efficiency peaks (as
compared to runs using these buffers with no PEO added – data not shown). The tris
buffer with PEO yielded a much wider range of peak migration times (from 4 to 60
minutes) for the CCMP 1333 sample, whereas the citrate buffer showed large variations
in the number of peaks and migration time for CCMP 1333 upon addition of PEO.
Unfortunately, reproducibility (in terms of number of peaks, peak heights, and migration
times) was not achieved for any PEO concentration with tris (pH 9) and citrate (pH 7)
buffers. The most acidic buffer used in these studies (1.25 mM citrate buffer, pH 3)
afforded no signal for CCMP 1333 after an hour of separation time, with or without
added PEO. At this very low pH, it is possible that the EOF was extremely low due to
largely protonated inner-wall silanol groups within the capillary, and as such, the net
velocity of the sample band would have been so low as to require an inordinate amount of
time for the sample to migrate past the detector (much greater than 60 min).
The electrophoretic profile of CCMP 1333 only incurred significant changes (in
the form of the appearance of multiple, high-efficiency, later-migrating peaks) with the
addition of PEO when buffers were at pH 7 and 9. At a given PEO concentration, the tris
buffer showed the greatest impact on the migration of CCMP 1333, causing many sharp
peaks to be formed, but these peaks eluted over a large time span. It should be noted that,
amongst all of the buffers studied, no systematic change in the electrophoretic profile was
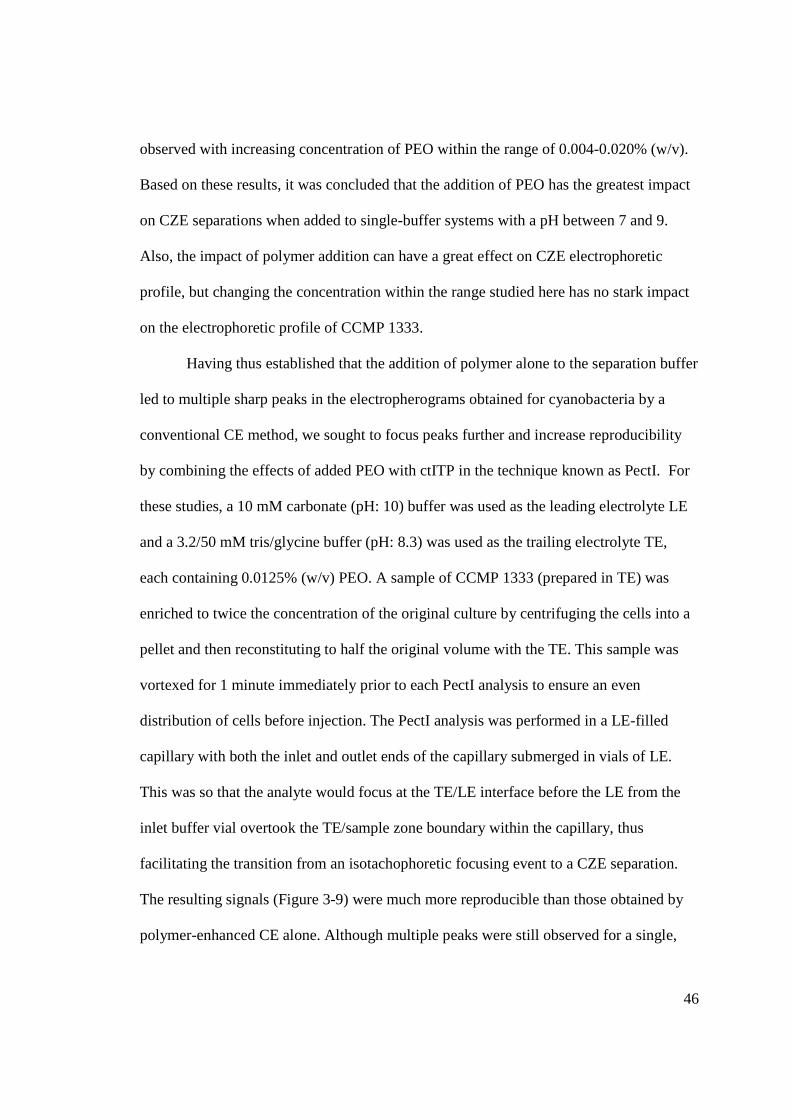
46
observed with increasing concentration of PEO within the range of 0.004-0.020% (w/v).
Based on these results, it was concluded that the addition of PEO has the greatest impact
on CZE separations when added to single-buffer systems with a pH between 7 and 9.
Also, the impact of polymer addition can have a great effect on CZE electrophoretic
profile, but changing the concentration within the range studied here has no stark impact
on the electrophoretic profile of CCMP 1333.
Having thus established that the addition of polymer alone to the separation buffer
led to multiple sharp peaks in the electropherograms obtained for cyanobacteria by a
conventional CE method, we sought to focus peaks further and increase reproducibility
by combining the effects of added PEO with ctITP in the technique known as PectI. For
these studies, a 10 mM carbonate (pH: 10) buffer was used as the leading electrolyte LE
and a 3.2/50 mM tris/glycine buffer (pH: 8.3) was used as the trailing electrolyte TE,
each containing 0.0125% (w/v) PEO. A sample of CCMP 1333 (prepared in TE) was
enriched to twice the concentration of the original culture by centrifuging the cells into a
pellet and then reconstituting to half the original volume with the TE. This sample was
vortexed for 1 minute immediately prior to each PectI analysis to ensure an even
distribution of cells before injection. The PectI analysis was performed in a LE-filled
capillary with both the inlet and outlet ends of the capillary submerged in vials of LE.
This was so that the analyte would focus at the TE/LE interface before the LE from the
inlet buffer vial overtook the TE/sample zone boundary within the capillary, thus
facilitating the transition from an isotachophoretic focusing event to a CZE separation.
The resulting signals (Figure 3-9) were much more reproducible than those obtained by
polymer-enhanced CE alone. Although multiple peaks were still observed for a single,
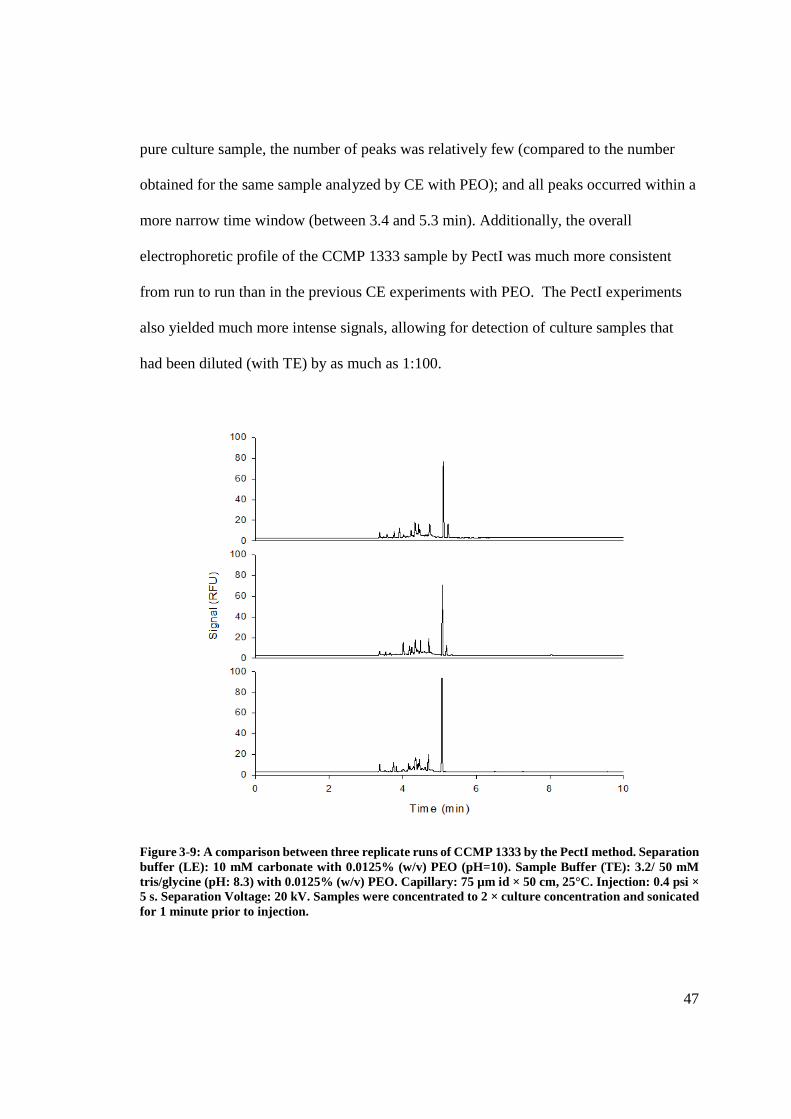
47
pure culture sample, the number of peaks was relatively few (compared to the number
obtained for the same sample analyzed by CE with PEO); and all peaks occurred within a
more narrow time window (between 3.4 and 5.3 min). Additionally, the overall
electrophoretic profile of the CCMP 1333 sample by PectI was much more consistent
from run to run than in the previous CE experiments with PEO. The PectI experiments
also yielded much more intense signals, allowing for detection of culture samples that
had been diluted (with TE) by as much as 1:100.
Figure 3-9: A comparison between three replicate runs of CCMP 1333 by the PectI method. Separation buffer (LE): 10 mM carbonate with 0.0125% (w/v) PEO (pH=10). Sample Buffer (TE): 3.2/ 50 mM tris/glycine (pH: 8.3) with 0.0125% (w/v) PEO. Capillary: 75 µm id × 50 cm, 25°C. Injection: 0.4 psi × 5 s. Separation Voltage: 20 kV. Samples were concentrated to 2 × culture concentration and sonicated for 1 minute prior to injection.
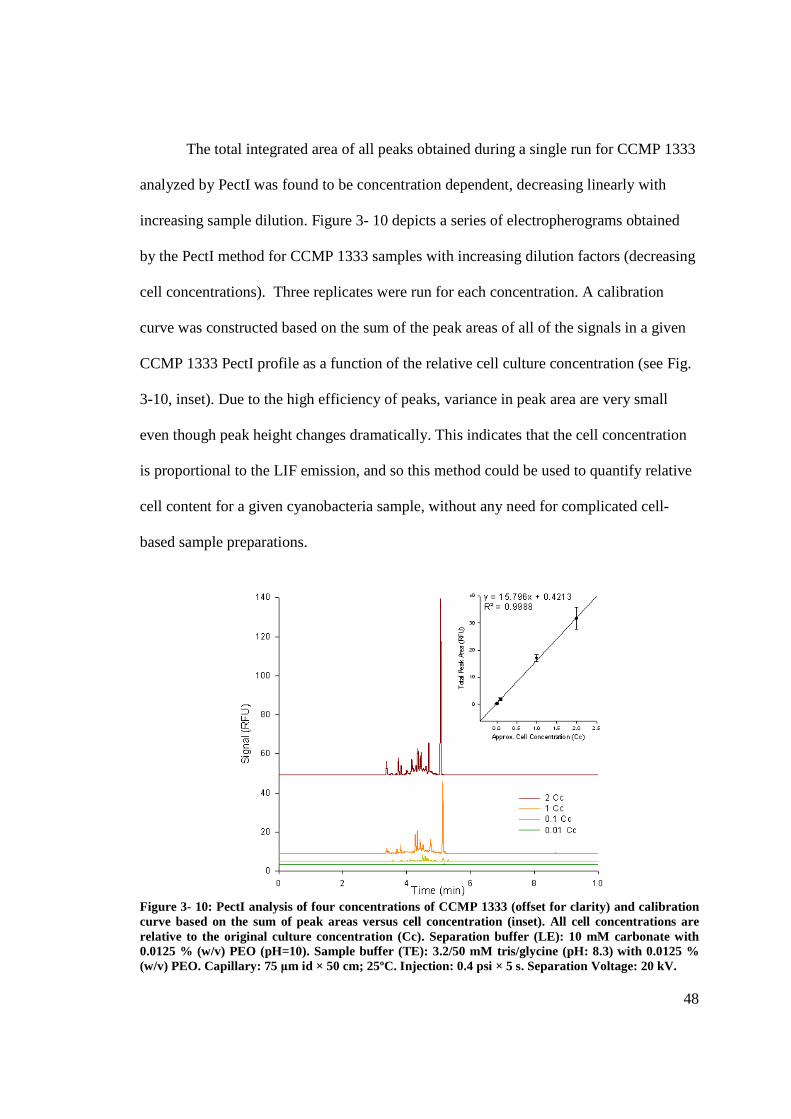
48
The total integrated area of all peaks obtained during a single run for CCMP 1333
analyzed by PectI was found to be concentration dependent, decreasing linearly with
increasing sample dilution. Figure 3- 10 depicts a series of electropherograms obtained
by the PectI method for CCMP 1333 samples with increasing dilution factors (decreasing
cell concentrations). Three replicates were run for each concentration. A calibration
curve was constructed based on the sum of the peak areas of all of the signals in a given
CCMP 1333 PectI profile as a function of the relative cell culture concentration (see Fig.
3-10, inset). Due to the high efficiency of peaks, variance in peak area are very small
even though peak height changes dramatically. This indicates that the cell concentration
is proportional to the LIF emission, and so this method could be used to quantify relative
cell content for a given cyanobacteria sample, without any need for complicated cell-
based sample preparations.
Figure 3- 10: PectI analysis of four concentrations of CCMP 1333 (offset for clarity) and calibration curve based on the sum of peak areas versus cell concentration (inset). All cell concentrations are relative to the original culture concentration (Cc). Separation buffer (LE): 10 mM carbonate with 0.0125 % (w/v) PEO (pH=10). Sample buffer (TE): 3.2/50 mM tris/glycine (pH: 8.3) with 0.0125 % (w/v) PEO. Capillary: 75 μm id × 50 cm; 25ºC. Injection: 0.4 psi × 5 s. Separation Voltage: 20 kV.
49
Simple methods aimed at reducing variability in bacterial aggregation were
considered. For example, it was postulated that a brief period of sonication of the bacteria
sample prior to injection would hopefully lead to a decreased number of discrete peaks
arising from an injection of a single microbial species. However, extended periods of
sample sonication run the risk of damaging cells or decreasing the viscosity of the PEO-
containing buffers, unpredictably changing the electrophoretic profile. To better
understand the potential impact of sample sonication on the migration behavior of CCMP
1333 during PectI analysis, a single sample of CCMP 1333 (represented as “one culture
concentration” unit, and abbreviated as 1 Cc herein) was vortexed for 1 min (to resuspend
any cells that might have settled out of solution in the sample vial during the period of
analysis), and then sonicated for 3 min immediately prior to injection and PectI analysis.
Another sample was subjected to this cycle 4 times, followed by a 15-minute sonication
period prior to injection and PectI analysis. No substantial pattern in the change of
number of peaks or overall migration time of the peak groups were observed with
increasing number of 3-min sonication cycles or after the 15-min sonication. Based on
these results, it was concluded that sonication did not significantly affect intermicrobial
interactions, nor did the process break CCMP 1333 cells apart to any measurable degree.
Having thus established a suitable PectI method for the analysis of CCMP 1333,
the next step was to see if a similar method would lead to the quantitative determination
of different cyanobacteria, CCMP 833. A series of CCMP 833 samples of varying
concentration from 0.10 to 0.40 Cc were prepared and subjected to the same PectI
separation conditions described above. The fluorescence emissions of CCMP 833 were
detected in channel 2 and selected for via a 585 nm BP filter. The resulting PectI profile
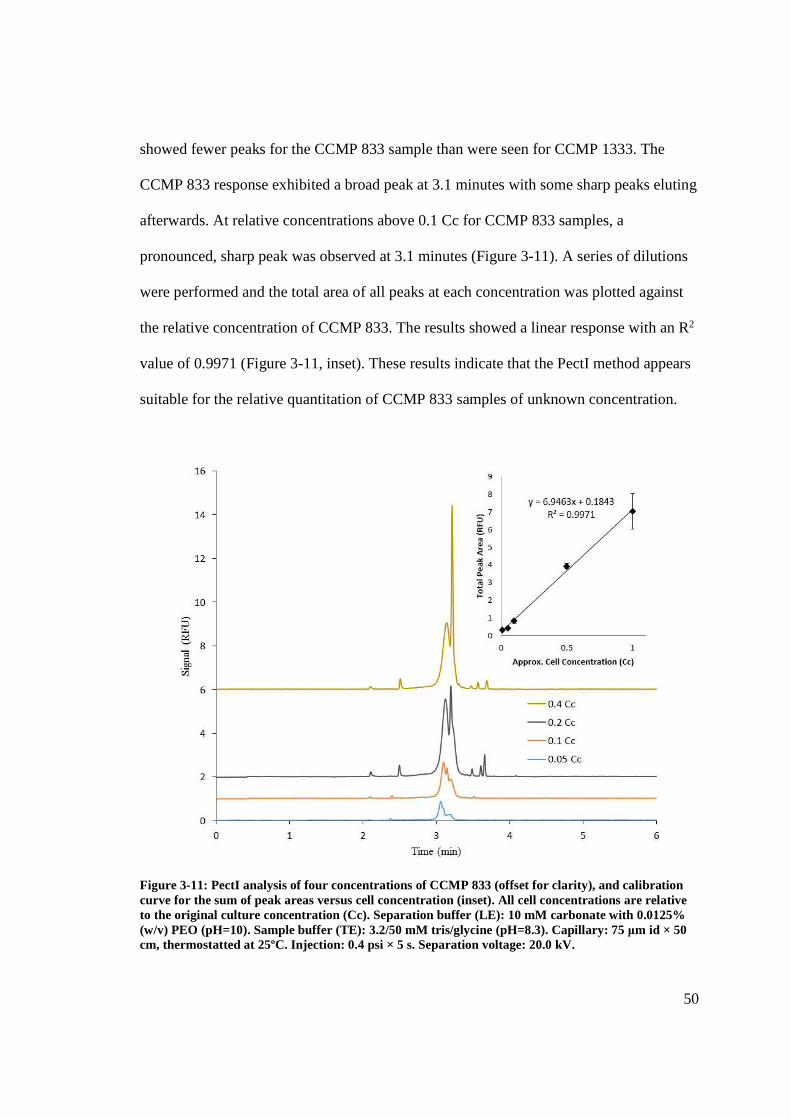
50
showed fewer peaks for the CCMP 833 sample than were seen for CCMP 1333. The
CCMP 833 response exhibited a broad peak at 3.1 minutes with some sharp peaks eluting
afterwards. At relative concentrations above 0.1 Cc for CCMP 833 samples, a
pronounced, sharp peak was observed at 3.1 minutes (Figure 3-11). A series of dilutions
were performed and the total area of all peaks at each concentration was plotted against
the relative concentration of CCMP 833. The results showed a linear response with an R2
value of 0.9971 (Figure 3-11, inset). These results indicate that the PectI method appears
suitable for the relative quantitation of CCMP 833 samples of unknown concentration.
Figure 3-11: PectI analysis of four concentrations of CCMP 833 (offset for clarity), and calibration curve for the sum of peak areas versus cell concentration (inset). All cell concentrations are relative to the original culture concentration (Cc). Separation buffer (LE): 10 mM carbonate with 0.0125% (w/v) PEO (pH=10). Sample buffer (TE): 3.2/50 mM tris/glycine (pH=8.3). Capillary: 75 μm id × 50 cm, thermostatted at 25ºC. Injection: 0.4 psi × 5 s. Separation voltage: 20.0 kV.
51
Although the PectI method did not focus the CCMP 833 sample into peaks as
sharp as those seen for the CCMP 1333 sample, the migration times for the two species
were significantly different, and so it was postulated that a mixture of the two species
could be resolved by this method. To this end, the cell cultures were combined to form a
sample mixture containing 0.5 Cc of CCMP 1333 and 0.5 Cc of CCMP 833. When the
PectI separation was performed, peaks with different fluorescence intensities were
observed in channel 1 and channel 2, as was expected for the two cyanobacteria species,
which have different proportions of PE and PC proteins. In channel 1 (equipped with two
655 nm LP filters, ideal for PC-type protein emissions), sharp peaks consistent with those
previously associated with CCMP 1333 (a PC-rich cyanobacteria) were observed at 3.6
min, while a broader-shaped signal consistent with CCMP 833 (a PE-rich cyanobacteria)
was detected in channel 2 (equipped with a 585 nm BP filter, ideal for PE-type protein
emissions) at 3.1 min (see Figure 3-12). Some signal bleed-over was observed in channel
2, possibly because the PC-dominated CCMP 1333 has some detectable amounts of PE’s,
although not nearly the amount that is characteristic of CCMP 833.
The strain CCMP 1333 was focused to a greater extent than was CCMP 833 in the
cyanobacteria mixture analyzed by this newly developed PectI method with dual-
wavelength detection. This could be due to dissimilar functional groups on the cellular
envelopes of the two species, which could interact differentially with the soluble polymer
employed in the separation and sample buffers, or which could present different net
charges to the applied electric field. These species may also exhibit different distributions
of other physical characteristics amongst their populations (such as variations in size, life
cycle, shape, etc.). It may be possible to further improve the focusing effect by
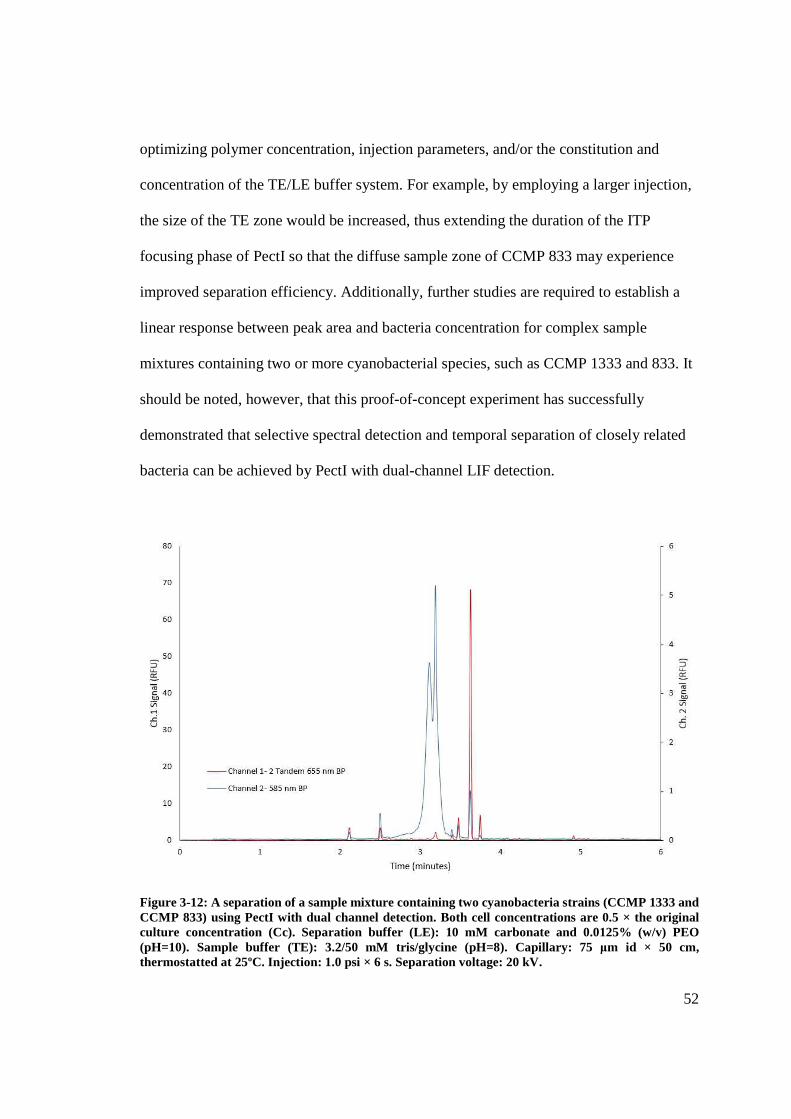
52
optimizing polymer concentration, injection parameters, and/or the constitution and
concentration of the TE/LE buffer system. For example, by employing a larger injection,
the size of the TE zone would be increased, thus extending the duration of the ITP
focusing phase of PectI so that the diffuse sample zone of CCMP 833 may experience
improved separation efficiency. Additionally, further studies are required to establish a
linear response between peak area and bacteria concentration for complex sample
mixtures containing two or more cyanobacterial species, such as CCMP 1333 and 833. It
should be noted, however, that this proof-of-concept experiment has successfully
demonstrated that selective spectral detection and temporal separation of closely related
bacteria can be achieved by PectI with dual-channel LIF detection.
Figure 3-12: A separation of a sample mixture containing two cyanobacteria strains (CCMP 1333 and CCMP 833) using PectI with dual channel detection. Both cell concentrations are 0.5 × the original culture concentration (Cc). Separation buffer (LE): 10 mM carbonate and 0.0125% (w/v) PEO (pH=10). Sample buffer (TE): 3.2/50 mM tris/glycine (pH=8). Capillary: 75 μm id × 50 cm, thermostatted at 25ºC. Injection: 1.0 psi × 6 s. Separation voltage: 20 kV.
53
4. CONCLUSIONS
Capillary electrophoresis (CE)-based methods employing laser-induced
fluorescence (LIF) detection are well suited to the separation and quantitation of not only
intact cyanobacteria but also the fluorescent proteins and pigments they contain. This
holistic approach to cyanobacteria analysis represents a valuable tool for studying these
organisms, since it allows for the analysis of (i) the bilin chromophores within
phycobiliproteins, (ii) the phycobiliproteins contained within the cyanobacteria cells, and
(iii) the cyanobacteria themselves as intact organisms, all by using a single instrument
without the need for long or overly complicated sample preparation.
In this work, the bilin chromophores that chiefly impart the characteristic
spectroscopic properties to phycobiliproteins were successfully cleaved from their
peptide backbone by using the oxidizing agents DTT and TCEP with varying
concentrations of catalysts and EDTA. Various reaction times and temperatures were
used to cleave the thioester bond(s) responsible for attaching the bilins to their proteins.
Although complete cleavage was not achieved, the fluorescence emissions characteristic
of free bilins were observed for the filtrates obtained from the filtration of
phycobiliprotein samples treated according to the cleavage protocol. For R-PE an B-PE,
this protocol involved a 10-minute digestion with 0.2 mM TCEP, 0.2mM EDTA, 20 mM
tris at a pH of 8; for C-PC the incubation was increased to 30 minutes in a 0.2 /0.2/36
mM TCEP/EDTA/tris solution, at a pH of 7; and APC was reacted in a 0.2 /0.4/36 mM
TCEP/EDTA/tris solution for 30 minutes. All digest were optimized at room temperature.
In future studies, it may be necessary to use more aggressive reaction conditions to

54
achieve 100% bilin liberation if the desire is to achieve quantitative recovery of bilins
from their phycobiliprotein sources.
It was also demonstrated that CE-LIF with dual-wavelength excitation and
detection can be used to sensitively quantify three of the major classes of
phycobiliproteins: phycoerythrin (R-PE and B-PE), phycocyanin (C-PC), and
allophycocyanin (APC). CE-LIF was used to separate and quantify these PBPs, then
sensitivity for the detection of all four studied proteins was increased by refinement of
separation conditions and by fitting detection channel 2 with a 585-nm BP emission filter,
which was better suited to the selection of R-PE and B-PE fluorescence emissions. By
employing CE conditions including a 25°C thermostated capillary with dimensions of 40
cm in length by 50 µm id, a BGE solution comprised of 50/10 mM borate/phytic acid
adjusted to pH of 8.2, and injection of 1 psi×5 s and a separation voltage of 20 kV we
were able to achieve limits of detection of 9.8, 6.8, 6.0, and 2.2 ppb for phycobiliproteins
R-PE, B-PE, C-PC, and APC, respectively.
In an effort to further improve the separation and detection of phycobiliproteins,
this work demonstrated the first-ever application of polymer-enhanced capillary transient
isotachophoresis (PectI) to phycobiliprotein analysis. PectI is an electrophoretic-based
separation strategy that blends the focusing effects of both soluble polymer and transient
isotachophoresis, which have separately been shown to be effective for protein and
bacterial analysis. However, by this method, the sensitivity achieved for R-PE and B-PE
(LOD = 4 and 2 ppb, respectively) was only slightly improved compared to that obtained
by CZE for these same proteins (LOD = 10 and 7 ppb, respectively), while the limits of
detection achieved for APC and C-PC by PectI analysis (20 and 50 ppb, respectively)
55
were actually higher than those achieved by CZE (APC = 2 ppb and C-PC = 6.0 ppb).
Thus, the simpler technique of CE-LIF with dual-channel detection has been shown to be
sufficient for the quantitation of purified phycobiliprotein standards, and in the future,
this method could be used to quantify proteins extracts obtained from single-strain
cyanobacteria samples to help identify or further characterize those samples. Also in the
future, studies involving PBP extracts obtained from multi-strain cultures or mixed
marine samples could be undertaken.
Of great importance was the demonstration of improved microbial quantitation by
PectI relative to more conventional CE-LIF methods. PectI conditions (TE sample buffer
of 3.2 mM tris/50 mM glycine/0.0125%(w/v) PEO at pH of 8.3 and LE run buffer of 10
mM carbonate/0.0125% (w/v) PEO with a pH of 10) were used to focus Synechoccocus
sp. CCMP 1333 (a phycocyanin-rich cyanobacteria culture sample) into multiple, sharp
peaks with reproducible migration times as compared to the results obtained for these
samples using CZE conditions (single 0.56/0.56/0.013 mM tris/borate/EDTA buffer)
which yielded an irreproducible, non-Gaussian sample zone. When the same PectI
separation conditions were applied to CCMP 833 (a phycoerythrin-rich cyanobacteria
culture sample), the result was a reproducible electrophoretic profile with one broad peak
followed by a narrower, more intense peak. Whereas conventional CE methods alone
could not resolve CCMP 833 and CCMP 1333 samples, the new PectI method with dual
channel LIF detection was able to demonstrate, for the first time, the spectral and
temporal resolution of the PE-rich CCMP 833 from the PC-rich CCMP 1333.
Significantly, the use of two detection channels, each equipped with a set of bandpass
emission filters chosen to select for the fluorescence emissions of either phycocyanins
56
(655 nm) or phycoerythrins (585 nm), allowed for the spectral resolution of the
cyanobacteria strains based on their relative PBP constitution, while the combination of
soluble polymer with transient isotachophoresis focusing allowed for the temporal
resolution of the two closely related bacteria. These findings should be applied to a wider
variety of cyanobacteria with varying proportions of phycobiliproteins in the future.
Such studies would necessitate the validation of PectI using new, single species samples,
followed by the analysis of mixtures of culture samples that approximate natural colonies
of cyanobacteria that could be found in authentic marine water samples. By assessing in
the future how a wide variety of cyanobacteria can be distinguished in each detector
channel (to establish spectral selectivity of the method) and how efficiently they can be
electrophoretically resolved (to establish temporal selectivity of the method), it should be
possible to devise rapid and sensitive assays for marine samples based on the PectI
method.
57
REFERENCES
(1) Yool, A. Modeling the Role of Nitrification in Open Ocean Productivity and the Nitrogen Cycle. Methods Enzymol. 2011, 486 (11), 3–32.
(2) Brouers, M.; Shi, D. J.; Hall, D. O. Cyanobacteria; Methods in Enzymology; Elsevier, 1988; Vol. 167.
(3) Ding, Y.; Garcia, C. D.; Rogers, K. R. Poly(dimethylsiloxane) Microchip Electrophoresis with Contactless Conductivity Detection for Measurement of Chemical Warfare Agent Degradation Products. Anal. Lett. 2008, 41 (2), 335–350.
(4) Fan, Z.; Ludi, H.; Widmers, H. M. Capillary Electrophoresis and Sample Injection Systems Integrated on a Planar Glass Chip. Anal. Chem. 1992, 7 (20), 249–255.
(5) Heiger, D. High Performance Capillary Electrophoresis - An Introduction, 3rd ed.; Hewlett Packard Company: France, 1997.
(6) Ong, S.; Zhao, X.; Eisenthal, K. B. Polarization of Water Molecules at a Charged Interface: Second Harmonic Studies of the Silica/water Interface. Chem. Phys. Lett. 1992, 191 (3-4), 327–335.
(7) Analysis and Detection by Capillary Electrophoresis; Marina, M. L., Rios, A., Valcarcel, M., Eds.; Elsevier B.V., 2005.
(8) Li, S. F. Y. Capillary Electrophoresis: Principles, Practice, and Applications; Elsevier Science: Amsterdam, The Netherlands, 1992.
(9) Holloway, C. J.; Trautschold, I. Principles of Isotachophoresis. Fresenius’ Zeitschrift Anal. Chemie 1982, 311 (2), 81–93.
(10) Xu, Y. A. N. Tutorial : Capillary Electrophoresis. Chem. Educ. 1996, 1 (2), 1–14.
(11) Chen, S.; Graves, S.; Lee, M. Zone Shape and Concentration in Isotachophoresis–capillary Electrophoresis. J. Microcolumn Sep. 1998, 11 (June), 341–345.
(12) Shihabi, Z. K. Stacking in Capillary Zone Electrophoresis. J. Chromatogr. A 2000, 902 (1), 107–117.
(13) Bahga, S. S.; Santiago, J. G. Coupling Isotachophoresis and Capillary Electrophoresis: A Review and Comparison of Methods. Analyst 2013, 138 (3), 735–754.
(14) Timerbaev, A. R.; Hirokawa, T. Recent Advances of Transient Isotachophoresis-Capillary Electrophoresis in the Analysis of Small Ions from High-Conductivity Matrices. Electrophoresis 2006, 27 (1), 323–340.
58
(15) Viskari, P. J.; Kinkade, C. S.; Colyer, C. L. Determination of Phycobiliproteins by Capillary Electrophoresis with Laser-Induced Fluorescence Detection. Electrophoresis 2001, 22 (11), 2327–2335.
(16) Skulberg, O. M.; Utkilen, H. Chapter 2 . Cyanobacteria in the Environment. In Toxic Cyanobacteria in Water; Chorus, I., Bartram, J., Eds.; Spon, London, UK, 1999; pp 15–40.
(17) Muyzer, G. DGGE/TGGE a Method for Identifying Genes from Natural Ecosystems. Curr. Opin. Microbiol. 1999, 2 (3), 317–322.
(18) Stin, O. C.; Carnahan, A.; Singh, R.; Powell, J.; Furuno, J. P.; Dorsey, A.; Silbergeld, E.; Williams, H. N.; Morris, J. G. Characterization of Microbial Communities from Coastal Waters Using Microarrays. Environ. Monit. Assess. 2003, 81 (1-3), 327–336.
(19) Analyzing Microbes: Manual of Molecular Biology Techniques; Arora, D. K., Das, S., Sukumar, M., Eds.; Springer: Heidelberg, New York, 2013.
(20) Inoue, K.; Nishimura, M.; Nayak, B. B.; Kogure, K. Separation of Marine Bacteria according to Buoyant Density by Use of the Density-Dependent Cell Sorting Method. Appl. Environ. Microbiol. 2007, 73 (4), 1049–1053.
(21) Kubota, M.; Matsui, M. Cell Adsorption and Selective Desorption for Separation of Microbial Cells by Using Chitosan-Immobilized Silica. Appl. … 2005, 71 (12), 8895–8902.
(22) Petr, J.; Maier, V. Analysis of Microorganisms by Capillary Electrophoresis. TrAC Trends Anal. Chem. 2011, 31, 9–22.
(23) Zhang, Z.; Zhang, F.; Liu, Y. Recent Advances in Enhancing the Sensitivity and Resolution of Capillary Electrophoresis. J. Chromatogr. Sci. 2013, 51 (7), 666–683.
(24) Sonohara, R.; Muramatsu, N.; Ohshima, H.; Kondo, T. Difference in Surface Properties between Escherichia Coli and Staphylococcus Aureus as Revealed by Electrophoretic Mobility Measurements. Biophys. Chem. 1995, 55 (3), 273–277.
(25) Hjerten, S.; Elenbring, K.; Kilar, F.; Liao, J.-L.; Chen, A.; Siebert, C.; Zhu, M.-D. Carrier-Free Zone Electrophoresis, Displacement Electrophoresis and Isoelectric Focusing in a High-Performance Electrophoresis Apparatus. J. Chromatogr. 1987, No. 403, 41–61.
(26) Ebersole, R. C.; Mcconnlck, R. M. Separation and Isolation of Viable Bacteria by Capillary Electrophoresis. Bio/Technology 1993, 11, 1278–1282.
59
(27) Kłodzińska, E.; Buszewski, B. Electrokinetic Detection and Characterization of Intact Microorganisms. Anal. Chem. 2009, 81 (1), 8–15.
(28) Armstrong, D. W.; Schulte, G.; Schneiderheinze, J. M.; Westenberg, D. J. Separating Microbes in the Manner of Molecules I. Capillary Electrokinetic Approaches. Anal. Chem. 1999, 71 (24), 5465–5469.
(29) Saito, S.; Massie, T. L.; Maeda, T.; Nakazumi, H.; Colyer, C. L. On-Column Labeling of Gram-Positive Bacteria with a Boronic Acid Functionalized Squarylium Cyanine Dye for Analysis by Polymer-Enhanced Capillary Transient Isotachophoresis. Anal. Chem. 2012, 84 (5), 2452–2458.
(30) Schneiderheinze, J. M.; Armstrong, D. W.; Schulte, G.; Westenberg, D. J. High Efficiency Separation of Microbial Aggregates Using Capillary Electrophoresis. FEMS Microbiol. Lett. 2000, 189 (1), 39–44.
(31) Oukacine, F.; Garrelly, L.; Romestand, B.; Goodall, D. M.; Zou, T.; Cottet, H. Focusing and Mobilization of Bacteria in Capillary Electrophoresis. Anal. Chem. 2011, 83, 1571–1578.
(32) Glazer, A. N. Light Guides. Directional Energy Transfer in a Photosynthetic Antenna. J. Biol. Chem. 1989, 264 (1), 1–4.
(33) Chichester, K. D. Capillary Electrophoresis with Laser Induced Fluorescence as a Tool for Whole Cell and Marine Microbial Protein Analysis, Wake Forest University, 2008.
(34) Zhao, K.-H.; Porra, R. J.; Scheer, H. Phycobiliproteins. In Phytoplankton Pigments: Characterization,Chemotaxonomy and Applications in Oceanography; Roy, S., Llewellyn, C., Egeland, E. S., Johsen, G., Eds.; Cambridge University Press: New York, NY, 2011; pp 375–411.
(35) MacColl, R. Cyanobacterial Phycobilisomes. J. Struct. Biol. 1998, 124 (2-3), 311–334.
(36) Hayes, P.; El-Semary, N.; Sánchez-Baracaldo, P. The Taxonomy of Cyanobacteria: Molecular Insights into a Difficult Problem. In Unravelling the algae: the past, present, and future of algal systematics; Brodie, J., Lewis, J., Eds.; Taylor & Francis: Hoboken, 2007; pp 93–102.
(37) National Research Council. Applications of Analytical Chemistry to Oceanic Carbon Cycle Studies; National Academy Press: Washington, DC, 1993.
(38) Grossman, A. R.; Schaefer, M. R.; Chiang, G. G.; Collier, J. L. The Phycobilisome, a Light-Harvesting Complex Responsive to Environmental Conditions. Microbiol. Rev. 1993, 57 (3), 725–749.
60
(39) Colyer, C. L.; Kinkade, C. S.; Viskari, P. J.; Landers, J. P. Analysis of Cyanobacterial Pigments and Proteins by Electrophoretic and Chromatographic Methods. Anal. Bioanal. Chem. 2005, 382 (3), 559–569.
(40) Zolla, L.; Bianchetti, M. High-Performance Liquid Chromatography Coupled on-Line with Electrospray Ionization Mass Spectrometry for the Simultaneous Separation and Identification of the Synechocystis PCC 6803 Phycobilisome Proteins. J. Chromatogr. A 2001, 912 (2), 269–279.
(41) Breadmore, M. C. Capillary and Microchip Electrophoresis: Challenging the Common Conceptions. J. Chromatogr. A 2012, 1221, 42–55.
(42) Viskari, P. J.; Colyer, C. L. Separation and Quantitation of Phycobiliproteins Using Phytic Acid in Capillary Electrophoresis with Laser-Induced Fluorescence Detection. J. Chromatogr. A 2002, 972, 269–276.
(43) Viskari, P. J.; Colyer, C. L. Rapid Extraction of Phycobiliproteins from Cultured Cyanobacteria Samples. Anal. Biochem. 2003, 319 (2), 263–271.
(44) Stadnichuk, I. N. Phycobiliproteins: Determination of Chromophore Composition and Content. Phytochem. Anal. 1995, 6, 281–288.
(45) Everroad, C.; Six, C.; Partensky, F.; Thomas, J.; Holtzendorff, J.; Michelle, A.; Wood, A. M. Biochemical Bases of Type IV Chromatic Adaptation in Marine Synechococcus Spp . Biochemical Bases of Type IV Chromatic Adaptation in Marine Synechococcus Spp. J. Bacteriol. 2006, 188 (9), 3345–3356.
(46) Terry, M. J. Biosynthesis and Analysis of Bilins. In Heme Chlorophyll, and Bilins: Methods and Protocols; Smith, A., Witty, M., Eds.; Springer: Dorderecht, 2008; pp 273–294.
(47) Desai, M. J.; Armstrong, D. W. Separation , Identification , and Characterization of Microorganisms by Capillary Electrophoresis. Microbiol. Mol. Biol. Rev. 2003, 67 (1), 38–51.
61
SCHOLASTIC VITA
BENJAMIN VAUGHAN BORN: January 25th, 1986 UNDERGRADUATE STUDY: Appalachian State University
Boone, North Carolina BS in Chemistry with an Emphasis on Forensics, Minor in Criminal Justice, 2008
GRADUATE STUDY: Wake Forest University
M.S. in Chemistry, 2014 (anticipated) Thesis Title: CE-LIF Analysis of Intact Marine Microbes Along with their Constituent Phycobiliproteins and Phycobilin Pigments
SCHOLASTIC AND PROFESIONAL EXPERIENCE:
Certifying Scientist I, PremierTox 2.0, Russell Spring, Kentucky, 2014-Present Reverse Logistics Intern, Inmar, Winston-Salem, North Carolina, 2013 Graduate Teaching Assistant, Wake Forest University, Winston-Salem, North Carolina 2008-2013 International Research Exchange Experience Participant (Award: NSF-CHE #0809756), Osaka Prefecture University, Osaka, Japan, June 2010 Merck/AAAS Cross-Disciplinary Summer Research Program Participant, Appalachian State University, Boone, NC, 2007
POSTER PRESENTATIONS:
Vaughan B, Colyer C., CE-LIF Analysis of Intact Marine Microbes Along wit h their Constituent Proteins and Pigments. The Annual Southeastern Regional Meeting of the American Chemical Society, Raleigh, NC, USA 2012 Vaughan B, Colyer C., CE-LIF Analysis of Intact Marine Microbes Along wit h their Constituent Proteins and Pigments. The Annual Meeting of the Triangle Chromatography Discussion Group, Raleigh, NC, USA 2012 Vaughan B., Colyer C., Sensitive Determination of Phycobiliproteins and Intact Cyanobacteria Using Dual-wavelength CE-LIF. Pittsburgh Conference, Atlanta, GA, USA, 2011
62
Vaughan B., Colyer C., CE-LIF Analysis of Intact Marine Microbes Along wit h their Constituent Proteins and Pigments. 11th Annual Syngenta CNC-ACS Poster and Vender Night, Greensboro, NC, USA, 2011 Vaughan B., Colyer C., CE-LIF Analysis of Intact Marine Microbes Along wit h Their Constituent Proteins and Pigments. Pittsburgh Conference, Orlando, FL, USA, 2010 Vaughan B., Colyer C., CE-LIF Analysis of Intact Marine Microbes Along wit h Their Constituent Proteins and Pigments. 10th Annual Syngenta CNC-ACS Poster and Vender Night, Greensboro, NC, USA, 2010 Vaughan B., Johnson E., Puckett L. Neufeld H., An Investigation into the Odor Associated with Galax Urceolata. The Annual Southeast Regional Meeting of the American Chemical Society, Greenville, SC, USA, 2007 Johnson E., Vaughan B., Puckett L. Neufeld H., Better Red than Dead: The Role of Anthocyanins in Plant Stems. The Annual Southeast Regional Meeting of the American Chemical Society, Greenville, SC, USA, 2007
PROFESSIONAL ORGANIZATIONS:
Society of Forensic Toxicologists (SOFT), Student Member, 2014-2015