Embed Size (px)
Citation preview
Reegional Variat
E
tions in
Evidenc
CE
n Adult
ce from
And
Al
Jan
EE DP 3
t Learn
m NCDS
rew Jen
ison Wo
nuary 20
37
ing and
S and W
nkins
olf
004
d Vocat
WERS 98
tional T
8
ISSN 2045
Trainin
5-6557
ng:

Published by Centre for the Economics of Education London School of Economics Houghton Street London WC2A 2AE © Andrew Jenkins and Alison Wolf, submitted September 2003 ISBN 07530 1731 8 Individual copy price: £5 The Centre for the Economics of Education is an independent research centre funded by the Department for Education and Skills. The views expressed in this work are those of the authors an do not necessarily reflect the views of the Department for Education and Skills. All errors remain the authors’.

Executive Summary
The purpose of this paper is to examine whether or not there are important regional
differences in skill formation and learning opportunities for adults, and whether adults’
behaviour and experiences tend to reinforce regional patterns apparent among young people.
Our underlying interest is in (a) how adults respond to local differences in the demand for
skills, and (b)whether differences in local levels of skill supply may affect employers’
willingness to adopt high-value-added work practices (and so demand, or develop, high skill
in their workforces). Both of these are important in determining the future economic
development of regions and localities.
There is accumulating evidence of regional variations in the proportion of young people
staying on in post-compulsory education. This appears to be a problem which has persisted
for some time but has not received as much attention as it may deserve. As for adult
learning, in reviewing existing literature and evidence we found that there is a lack of reliable
information on regional differences in adult learning and vocational training. National
surveys on these topics have insufficient sample sizes to enable robust conclusions to be
reached at regional level and tend to show large variations from year to year.
Analysis of cohort data has shown that respondents tended to migrate to London and the
South East in their twenties, but there was some tendency to move away from this area later
on, when they were in their thirties or early forties often back to their region of birth. The
North, East Anglia and the South West were regions attracting more well-qualified people,
while Yorkshire/Humberside and Wales lost some of their stock of well qualified cohort
members.
Estimates of the extent of participation in adult learning, drawing on data from the National
Child Development Study, varied by region but which regions had the highest participation
rates depended on the definition of adult learning adopted. For learning leading to
qualifications participation was highest in the North, North West and Wales; for work-related
training the South East had the highest proportion of learners, while for leisure courses
participation rates were highest in London.
Data from the 1998 Workplace Employee Relations Survey were used to analyse the regional
distribution of work-related training. Here the proportion of workers in receipt of some
training was highest in the North East, London and Eastern region, and lowest in the West
Midlands and Yorkshire/Humberside. In regression analyses of the likelihood of receiving
training, and controlling for both worker characteristics such as level of education and

occupation and workplace characteristics such as establishment size some regional effects
remained statistically significant with those in the East and North East more likely to obtain
some training.
Some key gaps in the evidence remain. The strength of the association between regional
economic performance and the skills base of the regions remains unclear and would certainly
benefit from further analysis. The extent to which sub-regional variations in economic
prosperity and in the presence of a well-qualified workforce align with the regional
differences in these variables is also not well-established in the research literature. This
implies some uncertainty as to whether the appropriate unit for policy action is the region or
the local area or some combination of the two.
Regional Variations in Adult Learning and
Vocational Training: Evidence from
NCDS and WERS 98
Andrew Jenkins
Alison Wolf
1. Introduction 1
2. Review of Literature and Existing Evidence 3
2.1. Supply of skills and qualifications 5
2.2. Adult Learning 6
2.3. Training 7
2.4. Demand for skills 8
2.5. The evidence on links between economic 9
performance and skills
3. Education and Qualifications in NCDS 11
4. Lifelong Learning in NCDS 14
5. Regional Variations in Vocational Training: Evidence 16
from WERS 98
Conclusion 21
References 23
Figures 25
Tables 31

Acknowledgements
Some of the results reported here build on earlier work conducted in collaboration with Anna
Vignoles and Fernando Galindo-Rueda of LSE. We are grateful to participants in a Bedford
Group seminar at the Institute of Education for helpful comments on an earlier version of the
paper. We thank Magdalen Meade for help with the layout of figures and tables.
Andrew Jenkins is a research officer for the Centre for the Economics of Education and the
Institute of Education. Alison Wolf is Professor of Management and Professional
Development at King’s College London, and a strand leader for the Centre for the Economics
of Education.
1
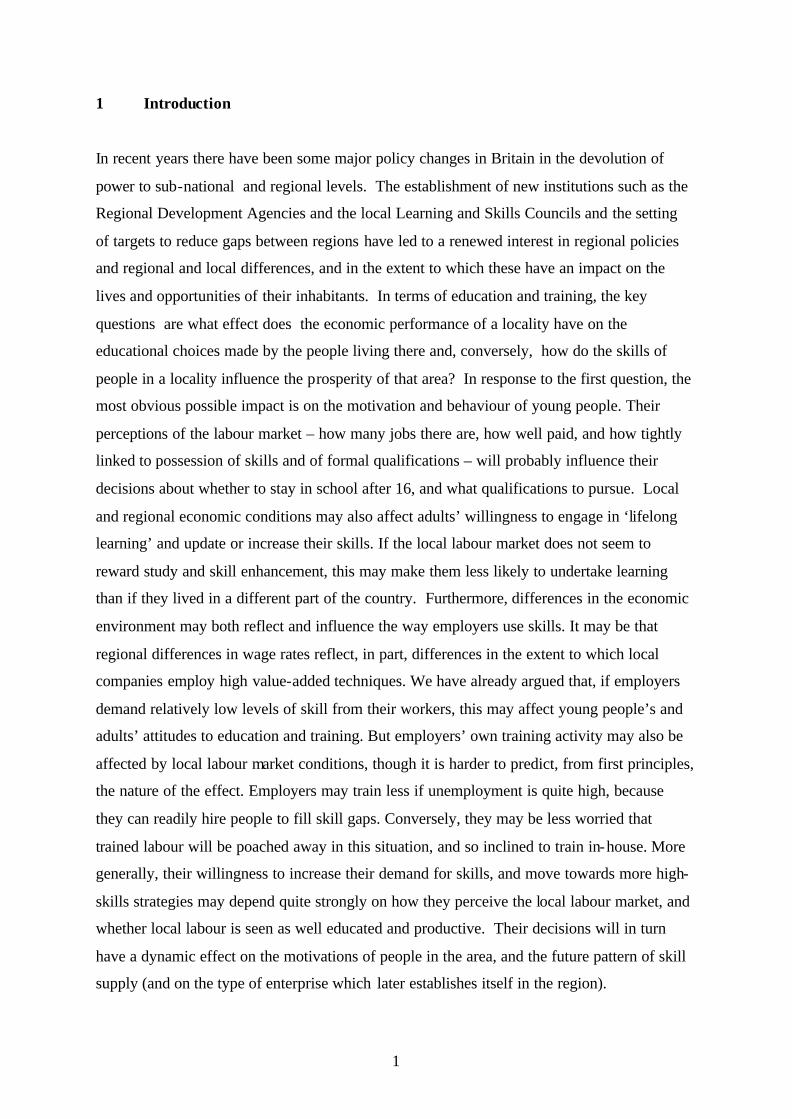
1 Introduction
In recent years there have been some major policy changes in Britain in the devolution of
power to sub-national and regional levels. The establishment of new institutions such as the
Regional Development Agencies and the local Learning and Skills Councils and the setting
of targets to reduce gaps between regions have led to a renewed interest in regional policies
and regional and local differences, and in the extent to which these have an impact on the
lives and opportunities of their inhabitants. In terms of education and training, the key
questions are what effect does the economic performance of a locality have on the
educational choices made by the people living there and, conversely, how do the skills of
people in a locality influence the prosperity of that area? In response to the first question, the
most obvious possible impact is on the motivation and behaviour of young people. Their
perceptions of the labour market – how many jobs there are, how well paid, and how tightly
linked to possession of skills and of formal qualifications – will probably influence their
decisions about whether to stay in school after 16, and what qualifications to pursue. Local
and regional economic conditions may also affect adults’ willingness to engage in ‘lifelong
learning’ and update or increase their skills. If the local labour market does not seem to
reward study and skill enhancement, this may make them less likely to undertake learning
than if they lived in a different part of the country. Furthermore, differences in the economic
environment may both reflect and influence the way employers use skills. It may be that
regional differences in wage rates reflect, in part, differences in the extent to which local
companies employ high value-added techniques. We have already argued that, if employers
demand relatively low levels of skill from their workers, this may affect young people’s and
adults’ attitudes to education and training. But employers’ own training activity may also be
affected by local labour market conditions, though it is harder to predict, from first principles,
the nature of the effect. Employers may train less if unemployment is quite high, because
they can readily hire people to fill skill gaps. Conversely, they may be less worried that
trained labour will be poached away in this situation, and so inclined to train in-house. More
generally, their willingness to increase their demand for skills, and move towards more high-
skills strategies may depend quite strongly on how they perceive the local labour market, and
whether local labour is seen as well educated and productive. Their decisions will in turn
have a dynamic effect on the motivations of people in the area, and the future pattern of skill
supply (and on the type of enterprise which later establishes itself in the region).
2
The idea that it is low employer demand for skills which needs to be acted upon if the drive
to improve skills is to succeed has influenced policy makers (e.g. PIU, 2001) but remains
contentious. The presence of “latent skill gaps” is inherently difficult to measure. Survey
data gathered for the National Skills Task Force (NSTF) revealed that approximately half of
the employers surveyed anticipated problems with skills if they attempted to move towards
the production of high value-added goods or services (see PIU, 2001, p 33). A more recent
survey in Green et al (2003) which asked a sample of over 1,000 employers whether they
would like to produce more complex products but were constrained by the limited skills of
their current workforce found that some one in five respondents agreed slightly or strongly
with this statement. Analyses have also been conducted which suggest that, for employers at
present utilising a cost minimising strategy, a very cons iderable improvement in the skills
of their workforce would be required if they were to switch to high value-added strategies
(see the discussion in Campbell et al, 2001). These analyses are necessarily inconclusive but
suggest that, if low employer demand is regionally concentrated it could set up vicious
circles/negative feedback for teenagers and adults wishing to learn and train.
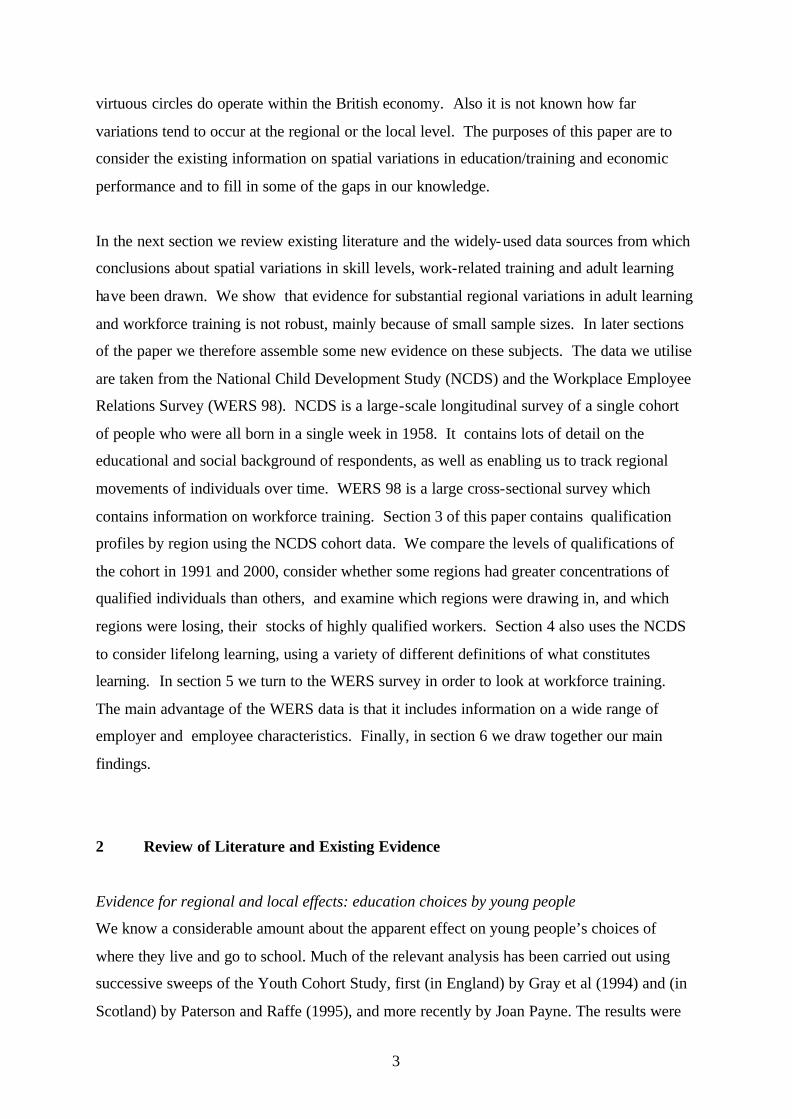
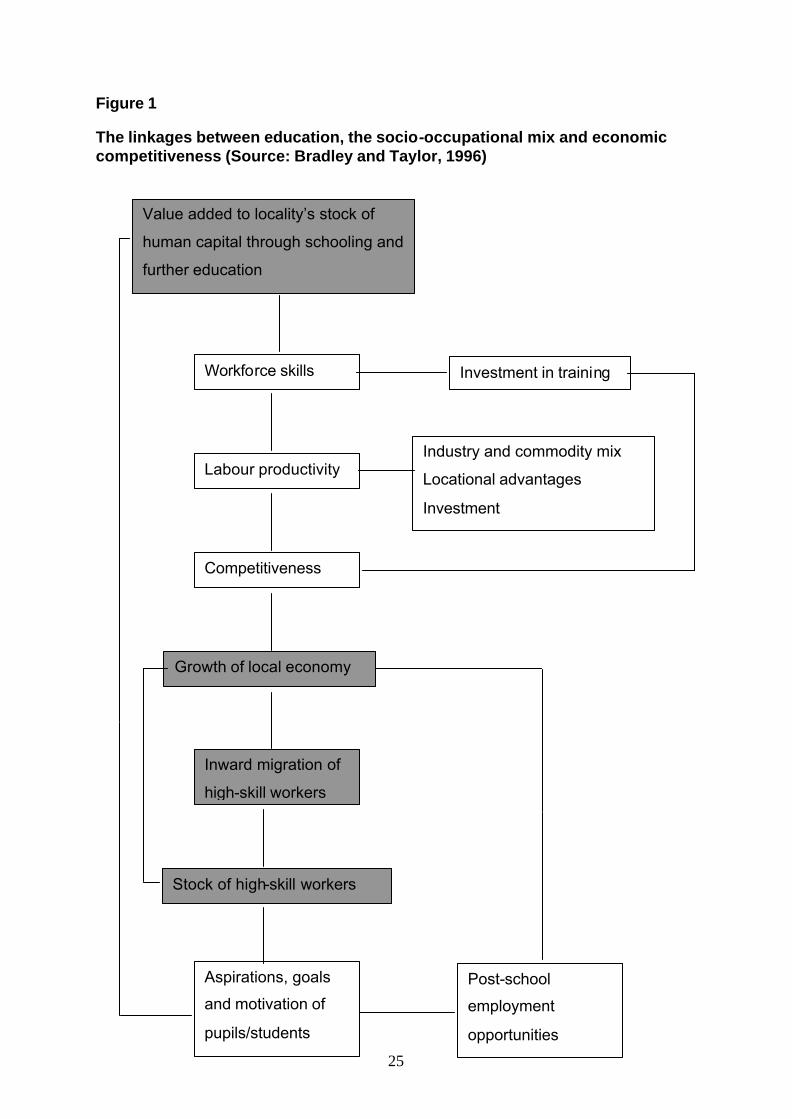
The hypotheses of Bradley and Taylor (1996) illustrate some of the potential dynamic
linkages between economic performance and education/training. Their model is shown in
Figure 1. Here the skills of the workforce in a locality have a major influence on labour
productivity and competitiveness and hence on the capacity for growth of the local economy.
The greater competitiveness of high-skill areas may occur because more educated workers
are better able to perform tasks, but also because areas which are knowledge-rich will tend to
specialise in activities such as R&D and in technically complex sectors where new ideas and
new products will be generated. (Armstrong and Taylor, 2000, p 87). Fast-growing local
economies are hypothesised to draw in high-skilled migrants and also to have a positive
influence on the aspirations of the young. The skills base of the economy is enhanced with
further beneficial effects for the competitiveness of the area. It is important to note that areas
which have a poor stock of skilled workers could then experience slow growth leading to
outflows of skilled workers and a lowering of the aspirations of students. The key
implication emerging from this framework, then, is that there could be virtuous or vicious
circles at local level, with the consequence of divergence of local or regional economies.
(Armstrong and Taylor, 2000; OECD, 2001). It is the risk of this scenario, with substantial
and widening disparities between different areas of the country, which is of most concern to
policy-makers. However, to date it has not been clearly established whether such vicious or
3
virtuous circles do operate within the British economy. Also it is not known how far
variations tend to occur at the regional or the local level. The purposes of this paper are to
consider the existing information on spatial variations in education/training and economic
performance and to fill in some of the gaps in our knowledge.
In the next section we review existing literature and the widely-used data sources from which
conclusions about spatial variations in skill levels, work-related training and adult learning
have been drawn. We show that evidence for substantial regional variations in adult learning
and workforce training is not robust, mainly because of small sample sizes. In later sections
of the paper we therefore assemble some new evidence on these subjects. The data we utilise
are taken from the National Child Development Study (NCDS) and the Workplace Employee
Relations Survey (WERS 98). NCDS is a large-scale longitudinal survey of a single cohort
of people who were all born in a single week in 1958. It contains lots of detail on the
educational and social background of respondents, as well as enabling us to track regional
movements of individuals over time. WERS 98 is a large cross-sectional survey which
contains information on workforce training. Section 3 of this paper contains qualification
profiles by region using the NCDS cohort data. We compare the levels of qualifications of
the cohort in 1991 and 2000, consider whether some regions had greater concentrations of
qualified individuals than others, and examine which regions were drawing in, and which
regions were losing, their stocks of highly qualified workers. Section 4 also uses the NCDS
to consider lifelong learning, using a variety of different definitions of what constitutes
learning. In section 5 we turn to the WERS survey in order to look at workforce training.
The main advantage of the WERS data is that it includes information on a wide range of
employer and employee characteristics. Finally, in section 6 we draw together our main
findings.
2 Review of Literature and Existing Evidence
Evidence for regional and local effects: education choices by young people
We know a considerable amount about the apparent effect on young people’s choices of
where they live and go to school. Much of the relevant analysis has been carried out using
successive sweeps of the Youth Cohort Study, first (in England) by Gray et al (1994) and (in
Scotland) by Paterson and Raffe (1995), and more recently by Joan Payne. The results were
4
summarised recently by Payne in a report to the DfES Advisory Panel on Research Issues for
the 14-19 Age Group, as follows:
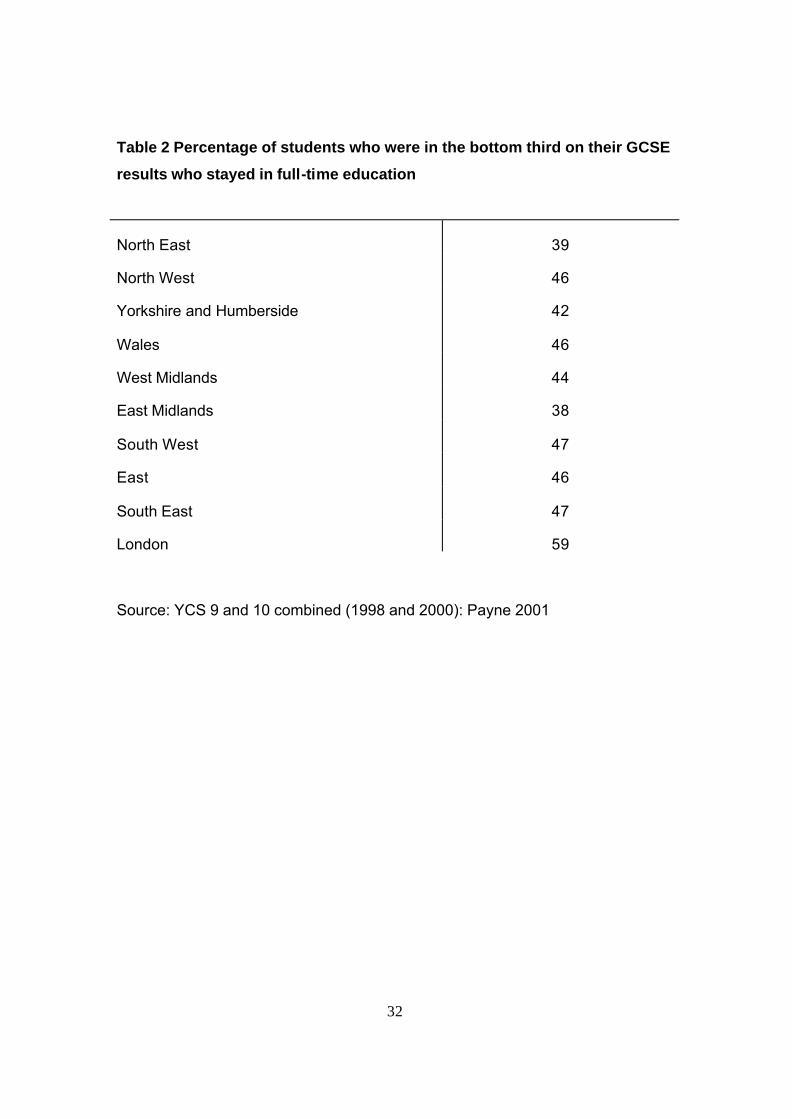
...differences in post-16 participation rates between regions, travel-to-work areas and
smaller local areas remain after differences in GCSE results, personal characteristics and
family background have been taken into account....These differences are very large. YCS
data show that in the middle third of the national distribution of GCSE results there was a
gap of about 17 percentage points between the region with the highest participation rate
and the region with the lowest participation rate, while in the bottom third of the GCSE
results the corresponding gap was around 21 percentage points. (Payne 2002: 17)
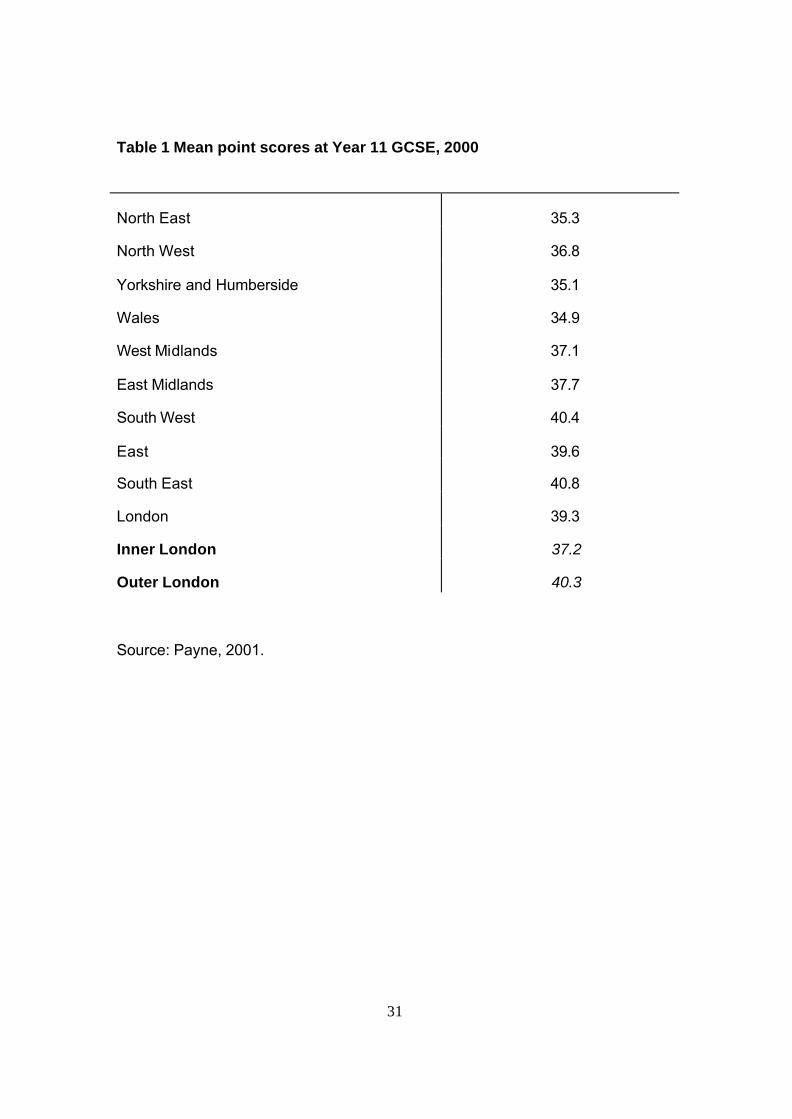
Tables 1 and 2 illustrate these quite dramatic contrasts between regions: in achievement at
age 16 and in how students at a given attainment level then behave. The decision to
continue in education post-16 and the type of courses taken at that point are, of course,
heavily dependent on exam achievement at age 16, but the factors underlying the
participation decision appear to be quite complex and operate in rather different ways at
different points in the ability distribution. Among the higher achieving teenagers, regions
with high levels of employment in ‘high skill’ sectors (with large proportions of professional,
managerial, technical and white collar staff) have particularly high staying on rates, and these
are not sensitive to short term fluctuations in unemployment rates. Among lower achieving
students, there is a regional or local effect which may plausibly be related to the general
structure of the economy- but choices are also affected by short-term factors. The choice
between taking a vocational/vocationally-related course in FE or entering the labour market,
or between going into Youth Training and going to work, is directly affected by the local
unemployment rate. This suggests that, for lower-achieving students as a whole, available
post-16 courses are seen as having rather little long-term labour market value as compared to
those taken by higher-achievers. There nonetheless remain important local/regional variables
which influence the perceived value of these lower-status qualifications and courses, and
create the regional patterns just described (Payne, 2002; Clark 2002).
These results for young people have been established quite recently and, later in the paper,
we investigate whether the patterns are stable over time. But the bulk of our work will be
concerned with discovering whether or not there are similar patterns in the training and
learning of adults. Such patterns would clearly exacerbate differences between regions
and/or local areas. We will also look at mobility between regions by education level since
differential mobility could, depending on the direction of the flows, worsen or counteract
5
variations in the supply of skilled workers in particular regions. What does the existing
literature tell us about these matters?
2.1 Supply of skills and qualifications
To what extent does the supply of skills vary across different regions? The available
evidence (mainly from Labour Force Survey data) generally uses the attainment of
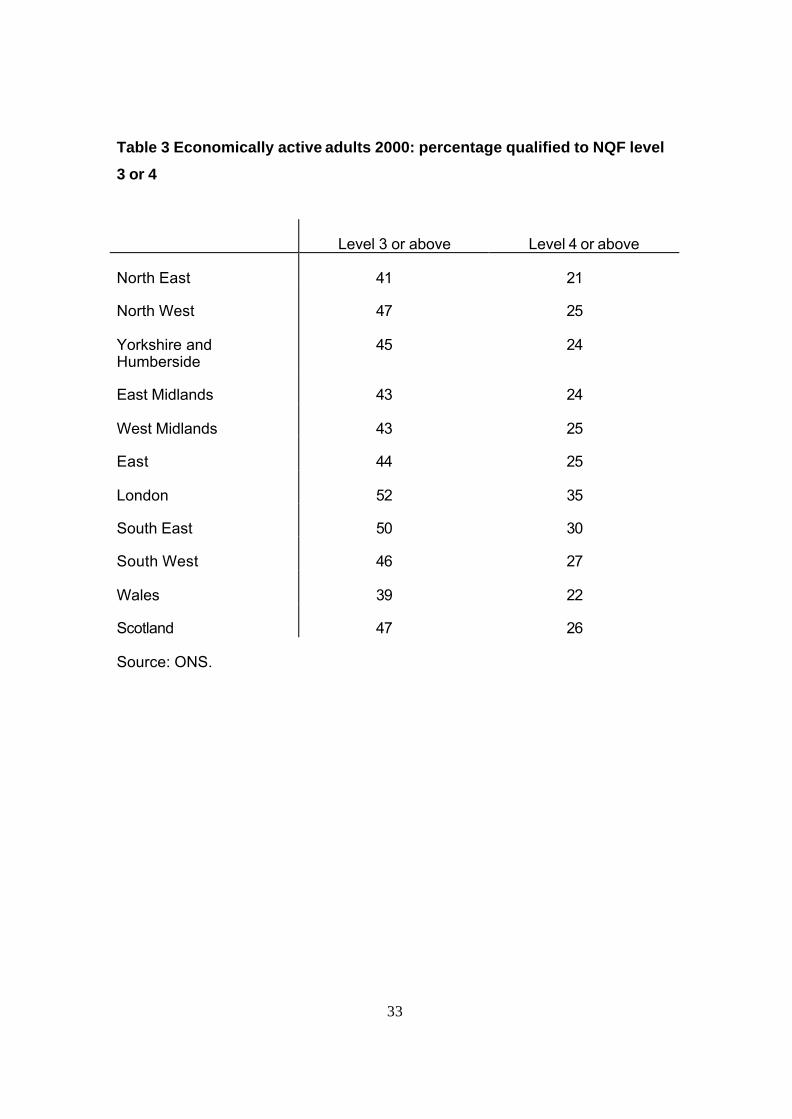
qualifications to proxy skill levels. Some figures are shown in Table 3. The proportions
qualified to NVQ equivalent level 3 were as high as 52 per cent in London and 50 per cent in
the South East, but only 39 per cent in Wales and 43 per cent in the Midlands. There were
similar variations in the proportions qualified to level 4 or above.
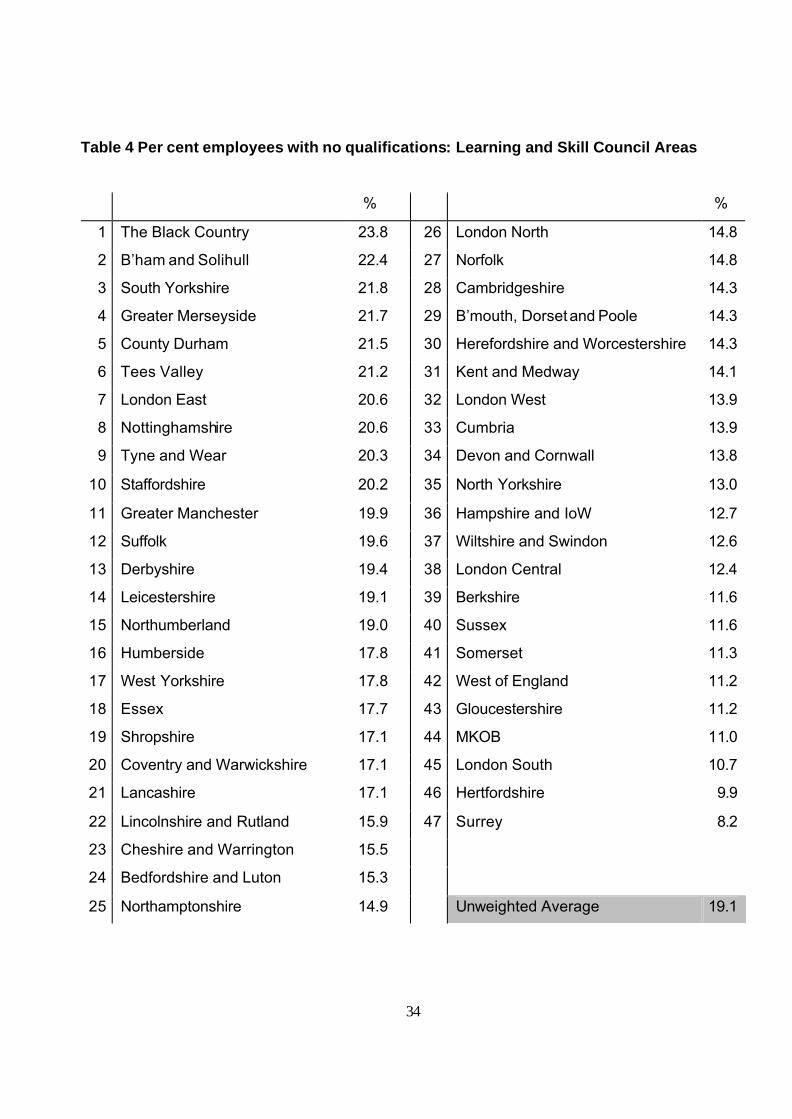
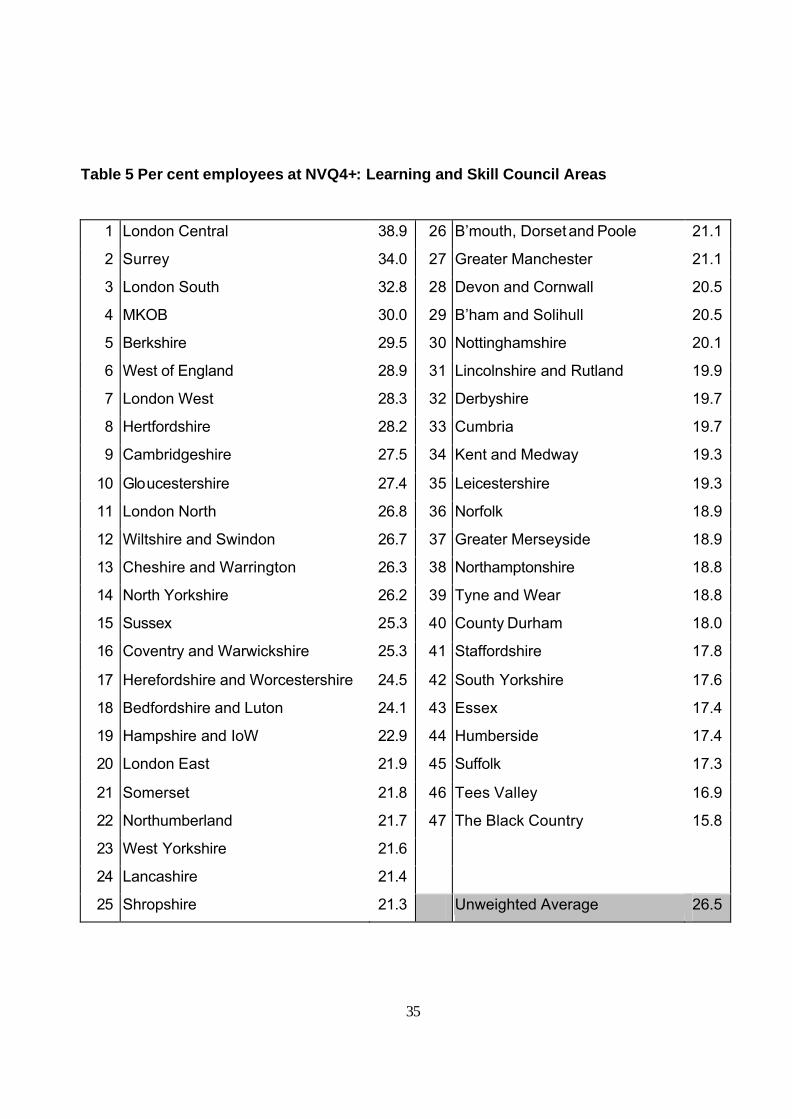
The variations are even more marked at sub-regional level, as data on local Learning and
Skills Council areas make clear (LSC, 2003). Table 4 reveals that nearly a quarter of
employees in the Black Country and Birmingham/Solihull areas were without qualifications,
compared to ten per cent or less in places such as Herts and Surrey. Conversely, 30 per cent
or more of employees in parts of the South East were qualified to at least level 4, while this
fell to some 16 or 17 per cent in areas such as Tees Valley and the Black Country (Table 5).
A key question is whether the sub-regional differences align with the regional ones, or
whether variation within regions is actually much greater than that between regions. A recent,
very brief, discussion of the evidence in LSC (2003) suggested that
the differences in the distribution of qualifications at the 47 local LSC level is greater
than at the regional level. However, they mainly reflect the underlying regional pattern,
with local LSCs located in London and the South East tending to have a workforce
which is rather more qualified than local LSCs in the North.
However, a more thorough and systematic analysis of this question would undoubtedly be
useful.
There is some evidence of geographical variations in the proportions of adults with basic
skills problems. Campbell et al (1999), drawing on Basic Skills Agency data for 1998 report
that there substantial variations across localities in the proportion of the working age
population with low, or very low levels of numeracy. This varied from a high of 48 per cent
in Knowsley, to a low of 24 per cent in Richmond on Thames. There were some 34 local
6
authorities where 40 per cent or more of the population of working age had either low or
very low levels of numeracy.
An important finding by Campbell et al (1999) was that different measures of the local
supply of skills were closely correlated with each other. They gathered together data for
about 100 local education authority areas (LEAs) for which comparable data were available
for 1997/98 on four skill indicators – the proportions attaining level 4 (the Government’s
target level) at Key Stage 2 (i.e. ages 10-11), the proportions of 16 year olds obtaining five or
more GCSEs, the percentage of the workforce with no qualifications, and the percentage of
the working population with low levels of numeracy. 1 These were found to be quite highly
correlated (correlation coefficients varied from about 0.6 to almost 0.8), leading the authors
to conclude that areas which were “skill rich” tended to be so at all levels, and similarly for
“skill poor” areas, implying that “spatial skill variations are deeply structural and are thus
likely to require sustained action if they are to be reduced” (Campbell et al, 1999, pp 10-14).
2.2 Adult learning
As well as the stock of qualified people, we can also look at flows, as adults engage in
learning to improve their skills and knowledge over time. Are there systematic variations at
regional level in the proportions of adults undertaking learning? If the arguments set out
earlier are correct we might expect that individuals in prosperous/fast-growing regions would
have stronger incentives to engage in learning, and that there would therefore be substantial
variations in participation rates. The two major surveys of adult learning in Britain are the
DfES-sponsored National Adult Learning Survey (NALS) and the surveys run by the
National Institute of Adult and Continuing Education (NIACE). The definitions of learning
used in these two surveys differ so that different things are being measured. However, within
a survey, over time, the questions are normally held constant so that within each survey, one
is comparing like with like over time.
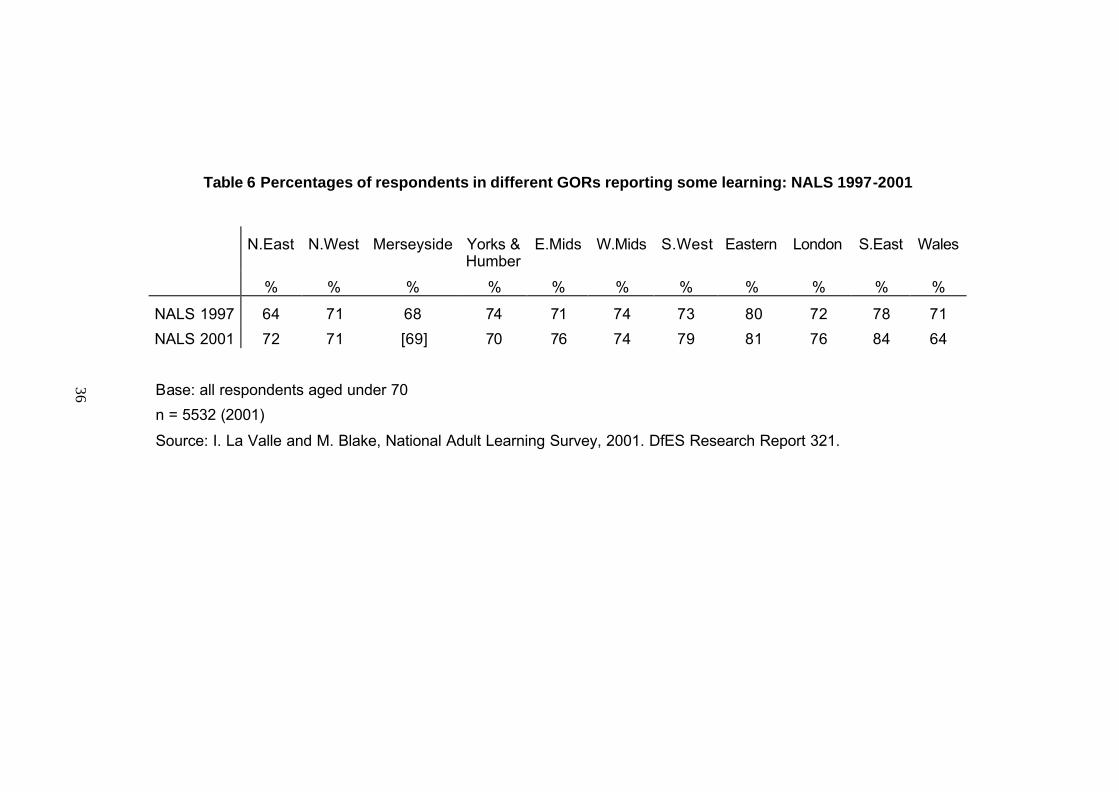
Table 6 reports the National Adult Learning Survey results and shows major differences
among regions but also great fluctuation over time. We find that, in the four years between
1997 and 2001, the proportion of the adults in the North East who were involved in some sort
of learning apparently rose from 64 to 72 per cent, while in Wales, in that same four years, it
1 The authors do not state which subjects the Key Stage 2 figures relate to; the numeracy data were obtained from Basic Skills Agency (1998), Adults’ Basic Skills: Benchmark Information on Scale of Need in Different
7
fell from 71 to 64 per cent. In 1997, learning activity in London and Wales apparently ran at
much the same level: four years later, the two regions were strikingly different. We do not
know of any events which would explain such a difference.
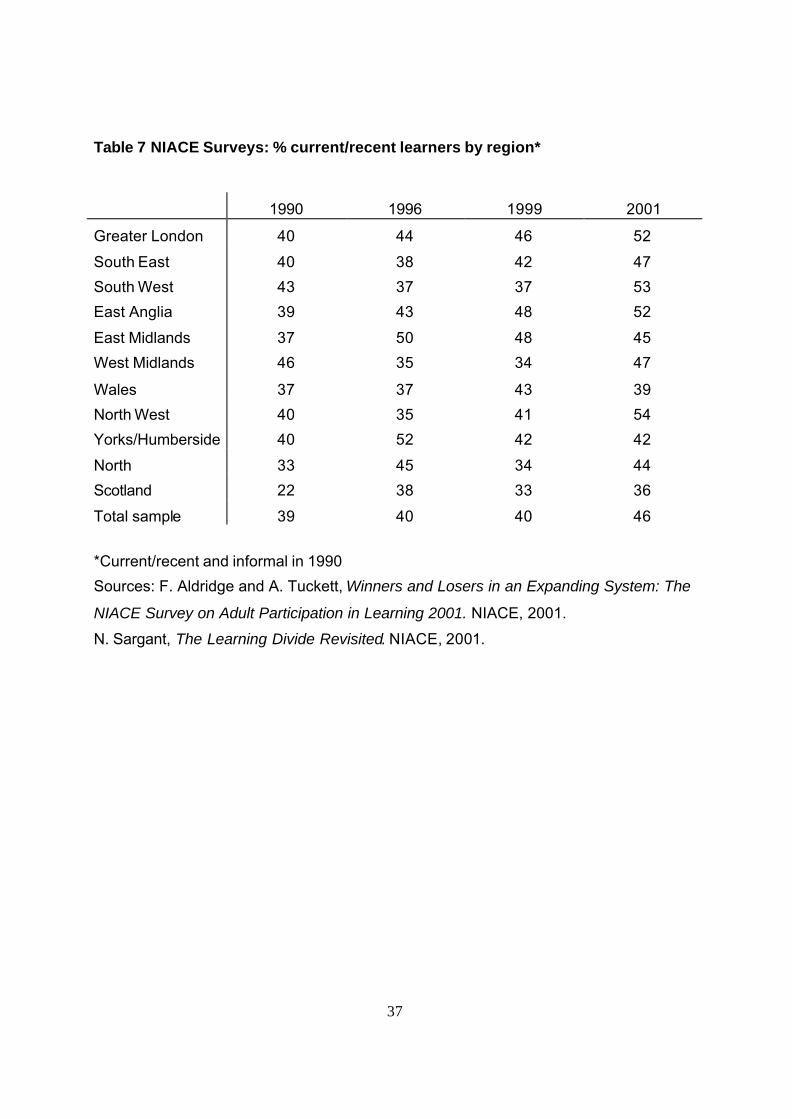
NIACE has run a survey of adult participation in learning for a number of years and the
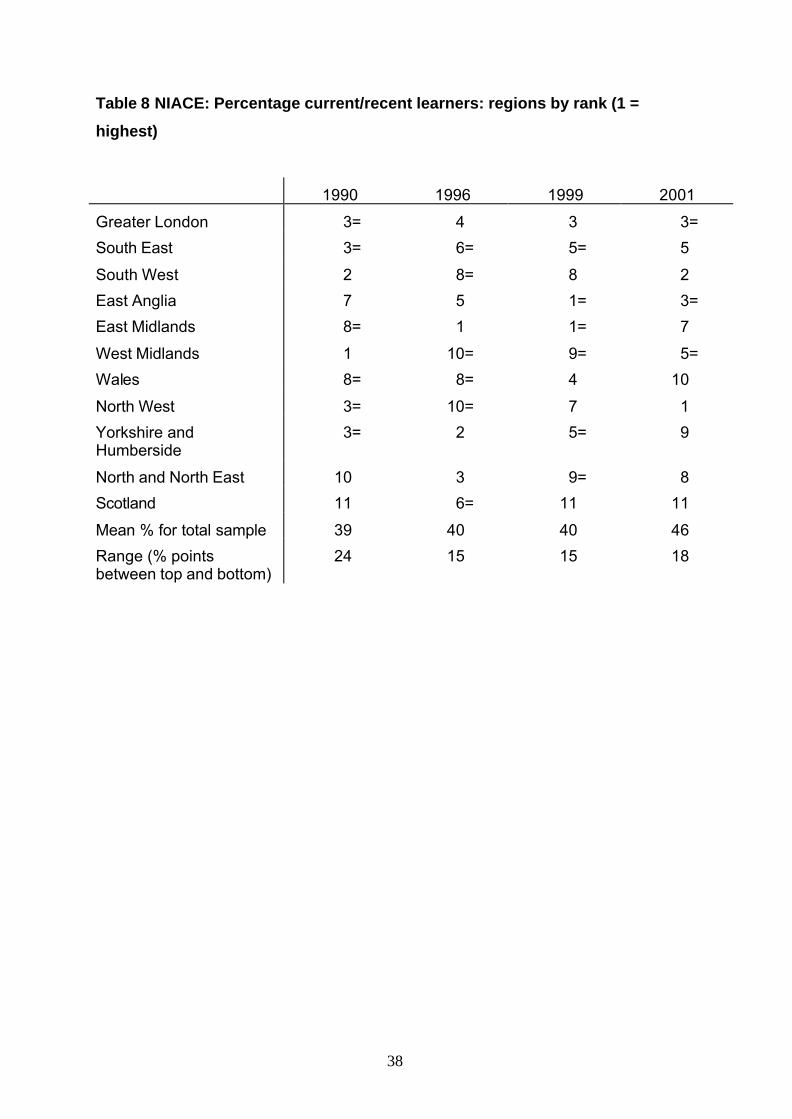
results are summarised in tables 7 and 8. Again, what is really striking is the instability of the
numbers – and of the rankings. In table 7, we see that, for example, between 1990 and 1996,
the proportion of learners in Scotland almost doubled; while in the North West, after a decade
of apparent stability, the two years from 1999 to 2001 saw an increase from 41 to 54 per cent
of the population being recorded as learners. Table 8 shows regions’ ranks in terms of these
NIACE data, and underlines how enormously variable these have been.
In both the NALS and NIACE surveys, then, we find dramatic fluctuations, within very short
time periods, in the absolute and the relative level of learning reported for a given region.
The simplest explanation for these patterns is also almost certainly the correct one: namely
that the sample sizes were not large enough to allow for reliable estimates of activity at a
disaggregated, regional level. This means, however, that relatively little data is available from
which to examine how far adults in more or less economically successful, or highly qualified,
regions behave differently in terms of undertaking continued skill development. Later in this
paper we present some estimates of lifelong learning activities, broken down by region,
drawing on data from the National Child Development Study (NCDS), where the sample size
is roughly double that of the NALS and NIACE surveys.
2.3 Training
Adult learning is a very broad category which may be undertaken for all sorts of non-
economic, as well as economic, reasons. It is therefore also interesting to look more
specifically at vocational training to see if discernible regional patterns are observable. On
training a major source of information is the Learning and Training at Work survey which
has been carried out annually in recent years. Tables 9 and 10 summarise data on
employer-provided training, first off and then on the job, from the Learning and Training at
Work surveys.
On the basis of evidence from the 2000 survey Campbell et al (2001) have argued that
‘training levels appear, overall, to be lower in higher qualification and higher employment
regions’ (Campbell et al, 2001, p 134). However, looking at the results over time suggests
Areas in England (CD Rom).
8
that, once again, there is a lot of volatility. For example, in the South East apparently the
proportion of employers reported as providing off-the-job training was 54 per cent in 1999,
63 per cent a year later, and back down to 53 per cent just one year after that. The sample
size in the survey was some 3,400 employers nationally, so that the numbers in some regions
will have been quite small. As with the data on adult learning discussed earlier, the estimates
at regional level are not very reliable, and therefore we cannot be confident that we know, at
present, which regions have high proportions of employers providing training. Some
evidence on this topic is also presented in Section 5 of this paper.
2.4 Demand for skills
How far does employers’ demand for skills vary by region and does it reflect, or correlate
with, differences in the supply of skills, as measured by qualification rates? Do adults in the
regions with the lowest qualification levels and/or the lowest staying on rates also face
relatively low demand for skills from employers?
Table 11 replicates analyses by Felstead (2002) indicating which regions have high vacancy
rates and which have vacancies which reflect a shortage of skills among applicants or a
response to skill gaps among employees. Note that skill shortages occur when there is a
genuine lack of adequately skilled individuals available in the accessible labour market, while
skill gaps arise when employers report that their existing workforce has lower skill levels
than those necessary to meet their business objectives. The data in Table 11 came from the
Employer Skills Survey, which has run for a number of years. The data suggest that skill
shortages and skill gaps were highest in the North West, London and the South East, and
lowest in the North East. Further information on the nature of skill demands in the local
economy come from the recently completed 2001 Skills Survey (see especially Felstead,
Gallie & Green 2002). The Skill Survey interviews working individuals in Britain (aged 20-
60) rather than employers; and actually collects measures of skills used in people’s working
lives. Table 12 displays two regional indices constructed from respondents’ responses. One
summarises the average level of formal qualification demanded by employers (for the jobs
respondents held, and in the respondents’ view), the other shows the average length of
training required for those jobs (again, for the jobs the respondents held, and in the
respondents’ view). These figures show that, on average, the most skilled jobs, measured in
terms of the qualifications required to do the job were to be found in London and the South
East, but were also quite high in the North East, while the figures were lowest in the East
9
Midlands, followed by Eastern region and Wales. The training time index was highest in the
South West, but Yorkshire/Humberside was slightly ahead of London, and substantially
higher than the South East. As Yorkshire/Humberside is certainly not a region where
average earnings are relatively high, these figures in particular suggest that an assumption
that it is the most prosperous regions where the most training occurs may not be valid.
However, as Felstead acknowledges, there is (once again) a need to be cautious in
interpreting the results because of small sample sizes.
2.5 The evidence on links between economic performance and skills
In this section we review existing evidence on regional and local variations in economic
performance and the role of human capital in explaining those differences. The economic
figures certainly indicate the presence of regional differences. For example, if we look at
household disposable income per head in 1999 then we find that, within the UK, this ranged
from £8353 in the North East to £12036 in London. As proportions of the UK average, these
are 83 and 119 per cent respectively – moreover, in 1989, while the same regions held top
and bottom place, the proportional figures were 88 and 117 per cent, a substantially smaller
spread. (Source: National Statistics, drawing on the Labour Force Survey and New Earnings
Survey).2
As for change through time, there is some evidence at the regional level that GDP per head
showed a tendency to converge over the period 1950 to 1990 as a whole although this
convergence process was an extremely slow one (Sala- i-Martin, 1996a,b) and dispersion
between regions may actually have increased in the late 1970s and the 1980s (McGuiness and
Sheehan, 1998). Data at the sub-regional level are only available for shorter periods of time.
Gripaios et al (2000) tested for convergence among GB counties during 1977 to 1995, and
found evidence of increasing disparities between the counties over this period.
Studies of the impact of education/training on economic outcomes have usually been
conducted at the local area level in order to generate sufficient data points for analysis. It
can of course also be argued that local areas are more appropriate units of analysis than
whole regions which are usually large and contain much variation both in economic
performance and in concentrations of skilled workers within their boundaries. Bradley and
2 These figures are not adjusted for differences in the cost of living in different parts of the country.
10
Taylor (1996) investigated the relationships between educational attainment, the stock of
high-skill workers in a locality, and local economic performance. In multiple regression
analysis, using data on 107 LEAs they demonstrated, firstly, that educational attainment (the
proportion of school leavers attaining 5 or more GCSEs in 1992) was strongly related to low
unemployment in the local labour market. This suggests that local employment opportunities
had an incentive effect on how hard children work at school and how motivated they were to
achieve good exam results. Other favourable socio-economic factors which influenced
educational attainment were high home ownership rates, high proportions of
skilled/professional workers in a locality and a low truancy rate. Secondly, economic
performance, as measured by employment growth 1981-1991, was strongly influenced by a
locality’s initial (1981) mix of industries and by the proportion of school leavers proceeding
to further education (also in 1981). Bradley and Taylor’s results provide some evidence that
human capital variations affect economic performance. However employment growth is a
somewhat unusual measure of economic performance, with variables such as GDP per head
or average earnings more often utilised. Moreover, the data used in the study refer to the
1980s and are now quite old, while the human capital variables relate only to school- leavers
rather than the employed population more generally.
In a more recent study, Campbell (2000) gathered together cross-sectional data on skills
profiles and economic performance for 46 counties in England in the mid-1990s. The
conclusion reached was that:
“There are strong links between local workforce qualification levels and local economic
performance. Those areas with better qualified labour forces tend to out-perform those with
less well qualified workforces in terms of earnings, job generation and competitiveness.
Skills are strongly associated with economic performance. Localities who (sic) seek a high
skill route to economic deve lopment are the more likely to be successful” (Campbell, 2000, p
39).
This is surely an overconfident assertion for Campbell’s evidence was, in fact, rather weak.
All his results were based on simple regressions of some measure of economic performance,
such as GDP per head at county level, on measures of skills, such as the proportion in a
county qualified to NVQ level 3 or higher. Because education/training and economic
performance influence each other, there are questions of simultaneity bias (Campbell’s

11
economic outcomes are for 1996 and his human capital stock measures are for 1997).
Moreover, no other explanatory variables were included in any of the regression models, and
it is not clear that the education/skills variables would remain significant if other relevant
variables were included. Research in the United States suggests that human capital remains
an important determinant of local and state- level outcomes, such as GDP per head and
economic growth, in the presence of other explanatory variables (Bhatta and Lobo, 2000;
Rupasingha et al, 2002) but this has not yet been demonstrated in the British case. Gripaios
et al (2000) found that county level variations in GDP per head could be explained by
variables reflecting industrial structure and population structure but did not include human
capital specifically in their regression analyses.3 The existing evidence on links between
economic performance and education/training in the UK is, then, very thin, partly no doubt
because of the limited amount of sub-regional data which has been available until recently.
3 Education and Qualifications in NCDS
Having reviewed the literature, in the remainder of the paper we analyse cohort data and the
WERS data on training in order to contribute to the evidence base, particularly on the supply
of skills and on lifelong learning.
We looked at data from the National Child Development Study (NCDS), a cohort of people
all born in the same week in 1958. The cohort were surveyed at various points childhood
and early adulthood, at the ages of seven, eleven, 16 and 23, with the two most recent
surveys occurring in 1991 when cohort members were aged 33, and in 2000, when they were
42. The data available in the NCDS surveys include employment histories, detailing
whether cohort members were in education, in work or out of the labour force month by
month from the age of 16 onwards. This information can be used to consider whether there
were regional variations in staying-on rates among the NCDS cohort. As highlighted in the
literature review above, in the 1990s there were substantial regional variations in staying-on
rates, and it is important to consider whether these have only begun to occur recently or
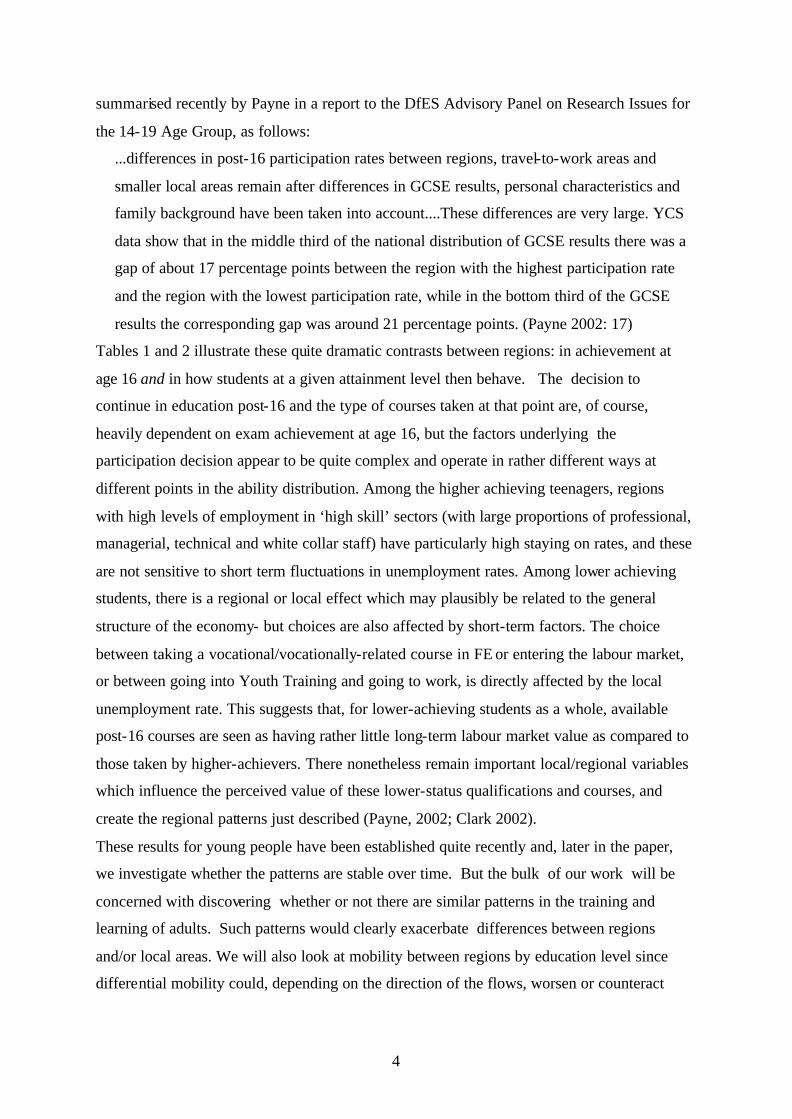
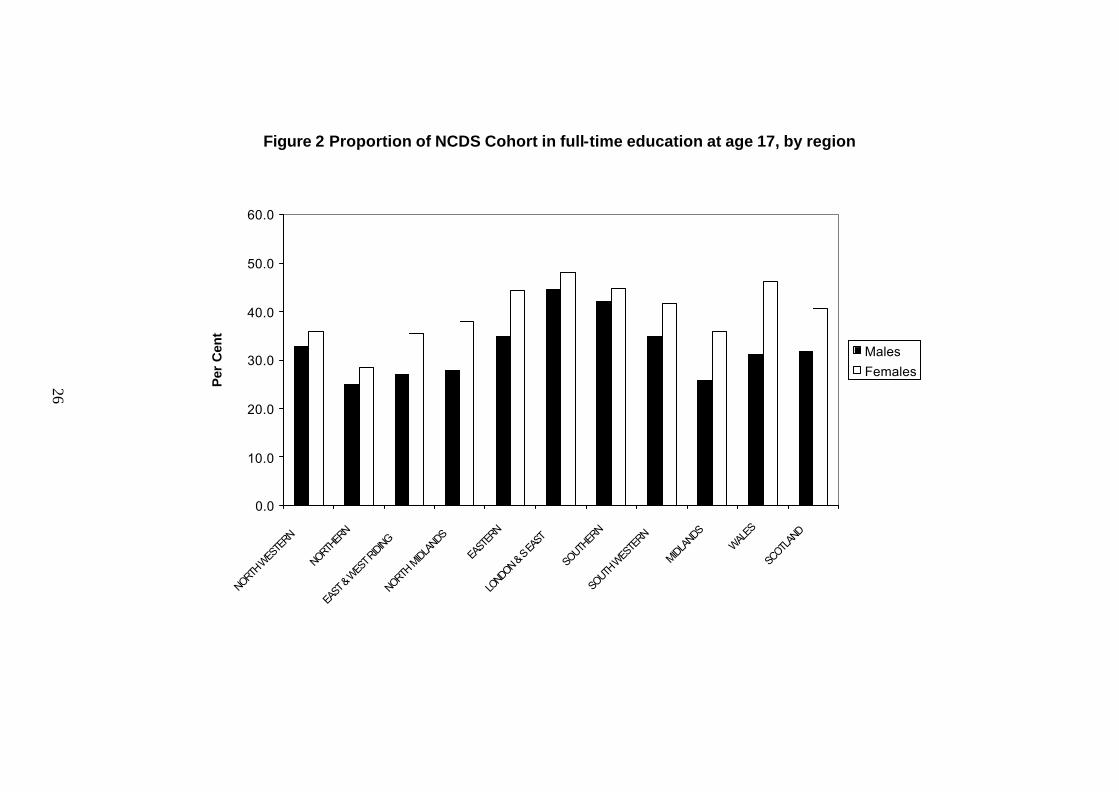
whether they have in fact persisted over many years. Figure 2 shows the percentage of
3 It is possible that variables such as the proportion in employment in high technology industries, and the proportion in employment in financial/business services could be acting, in part, as crude proxies for human capital.
12
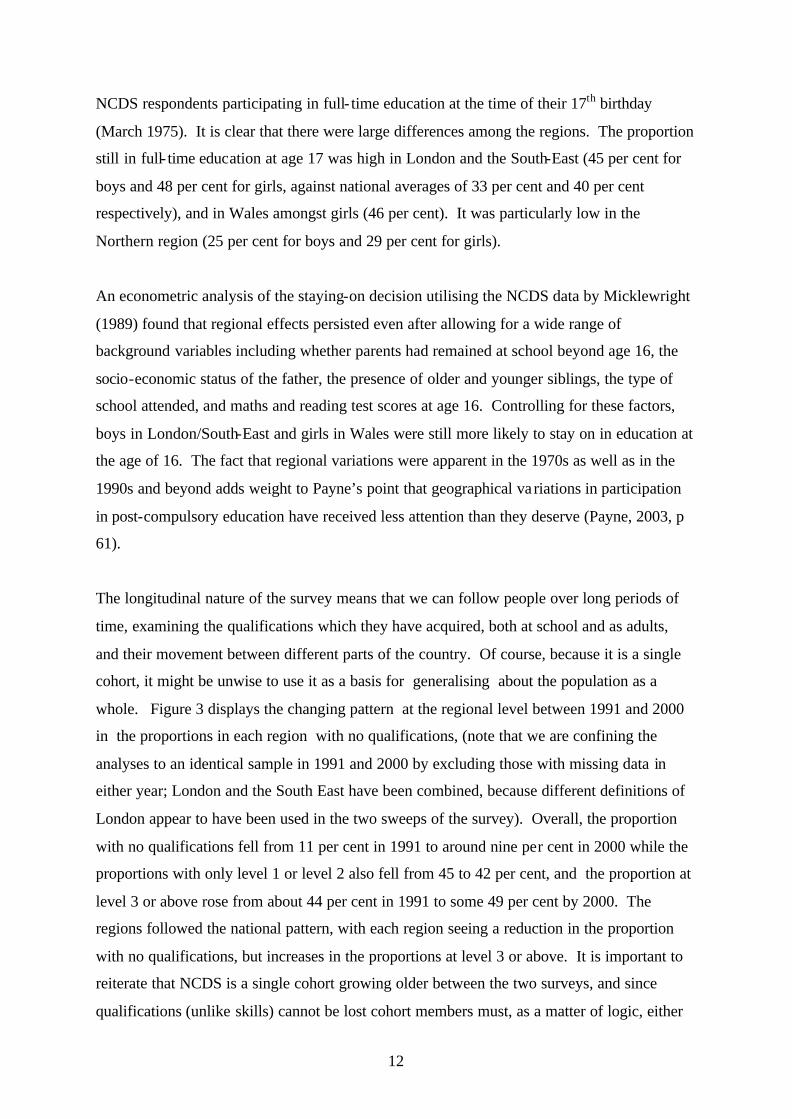
NCDS respondents participating in full- time education at the time of their 17th birthday
(March 1975). It is clear that there were large differences among the regions. The proportion
still in full- time education at age 17 was high in London and the South-East (45 per cent for
boys and 48 per cent for girls, against national averages of 33 per cent and 40 per cent
respectively), and in Wales amongst girls (46 per cent). It was particularly low in the
Northern region (25 per cent for boys and 29 per cent for girls).
An econometric analysis of the staying-on decision utilising the NCDS data by Micklewright
(1989) found that regional effects persisted even after allowing for a wide range of
background variables including whether parents had remained at school beyond age 16, the
socio-economic status of the father, the presence of older and younger siblings, the type of
school attended, and maths and reading test scores at age 16. Controlling for these factors,
boys in London/South-East and girls in Wales were still more likely to stay on in education at
the age of 16. The fact that regional variations were apparent in the 1970s as well as in the
1990s and beyond adds weight to Payne’s point that geographical va riations in participation
in post-compulsory education have received less attention than they deserve (Payne, 2003, p
61).
The longitudinal nature of the survey means that we can follow people over long periods of
time, examining the qualifications which they have acquired, both at school and as adults,
and their movement between different parts of the country. Of course, because it is a single
cohort, it might be unwise to use it as a basis for generalising about the population as a
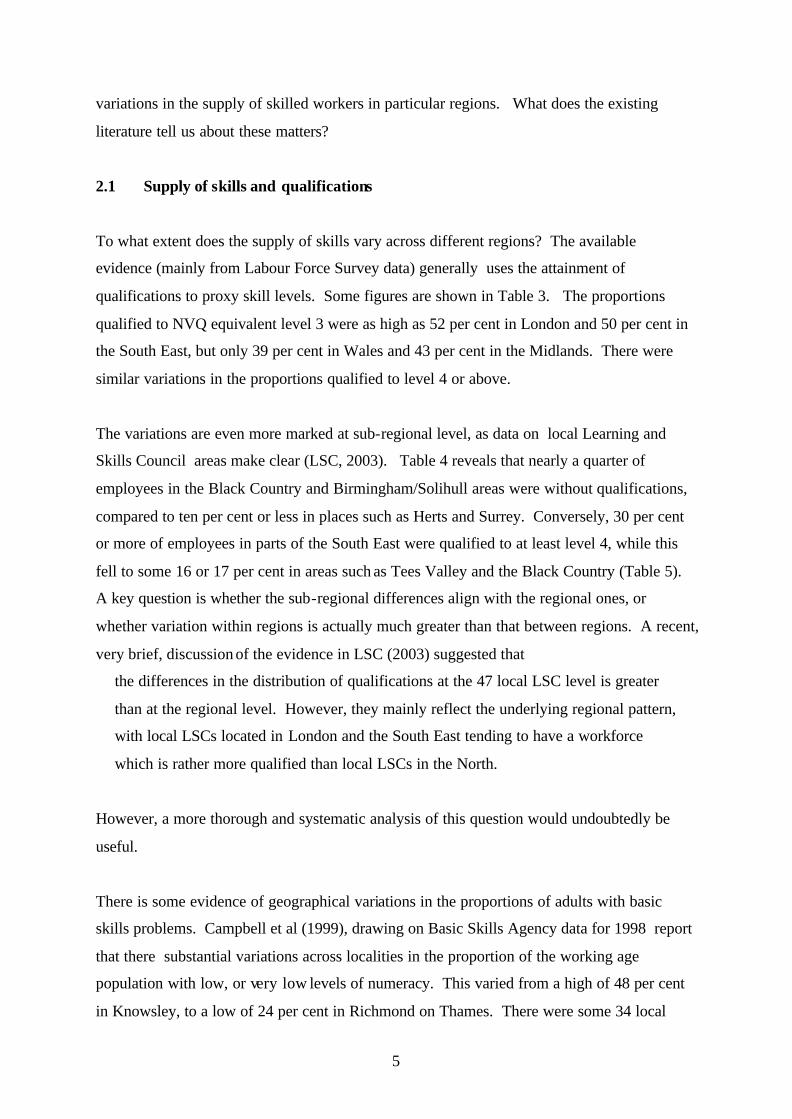
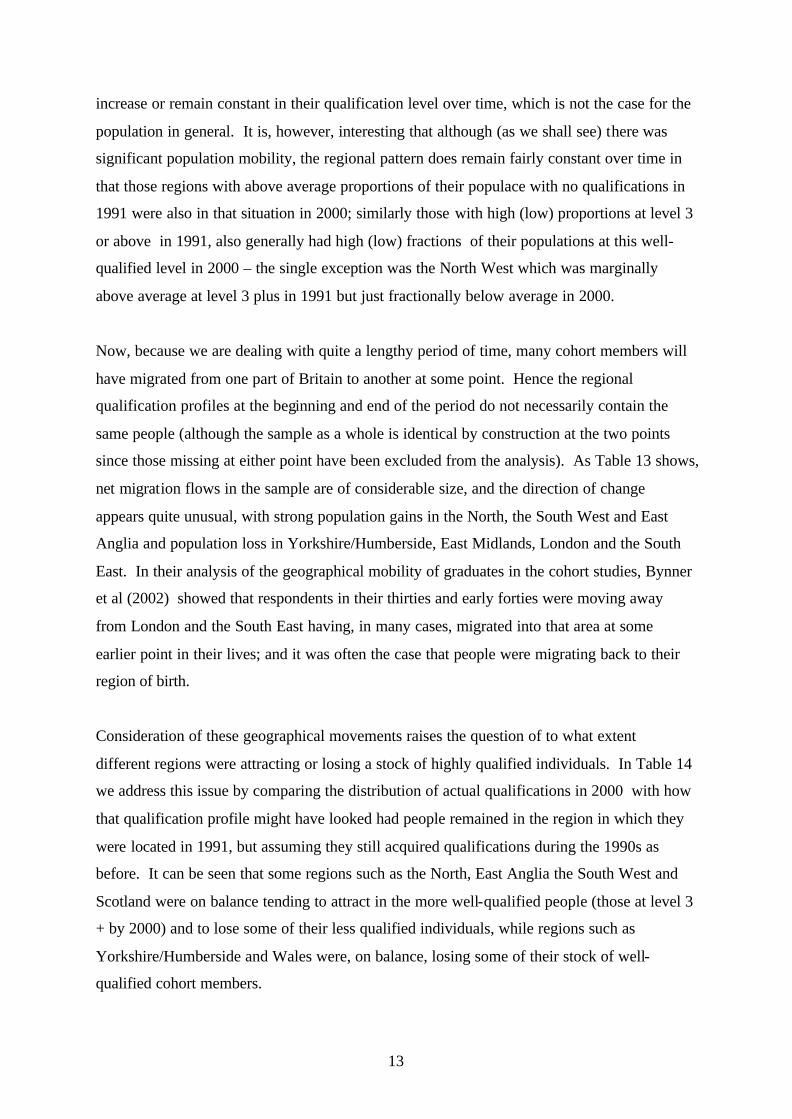
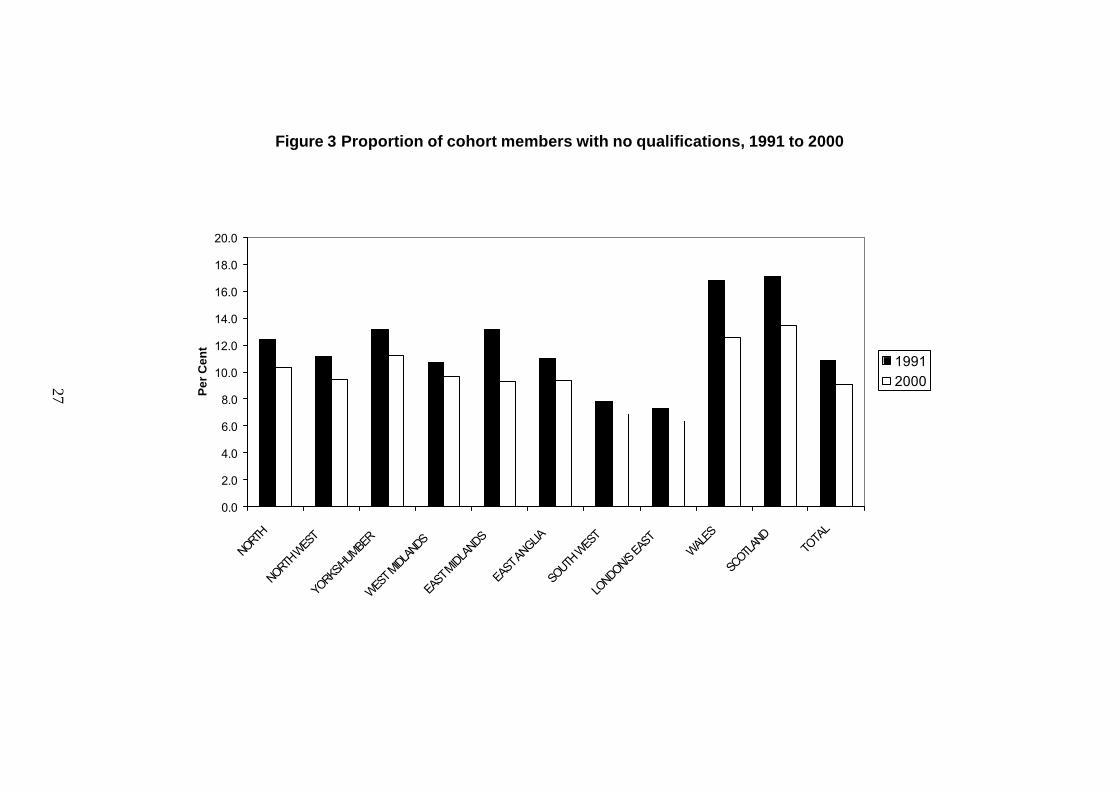
whole. Figure 3 displays the changing pattern at the regional level between 1991 and 2000
in the proportions in each region with no qualifications, (note that we are confining the
analyses to an identical sample in 1991 and 2000 by excluding those with missing data in
either year; London and the South East have been combined, because different definitions of
London appear to have been used in the two sweeps of the survey). Overall, the proportion
with no qualifications fell from 11 per cent in 1991 to around nine per cent in 2000 while the
proportions with only level 1 or level 2 also fell from 45 to 42 per cent, and the proportion at
level 3 or above rose from about 44 per cent in 1991 to some 49 per cent by 2000. The
regions followed the national pattern, with each region seeing a reduction in the proportion
with no qualifications, but increases in the proportions at level 3 or above. It is important to
reiterate that NCDS is a single cohort growing older between the two surveys, and since
qualifications (unlike skills) cannot be lost cohort members must, as a matter of logic, either
13
increase or remain constant in their qualification level over time, which is not the case for the
population in general. It is, however, interesting that although (as we shall see) there was
significant population mobility, the regional pattern does remain fairly constant over time in
that those regions with above average proportions of their populace with no qualifications in
1991 were also in that situation in 2000; similarly those with high (low) proportions at level 3
or above in 1991, also generally had high (low) fractions of their populations at this well-
qualified level in 2000 – the single exception was the North West which was marginally
above average at level 3 plus in 1991 but just fractionally below average in 2000.
Now, because we are dealing with quite a lengthy period of time, many cohort members will
have migrated from one part of Britain to another at some point. Hence the regional
qualification profiles at the beginning and end of the period do not necessarily contain the
same people (although the sample as a whole is identical by construction at the two points
since those missing at either point have been excluded from the analysis). As Table 13 shows,
net migration flows in the sample are of considerable size, and the direction of change
appears quite unusual, with strong population gains in the North, the South West and East
Anglia and population loss in Yorkshire/Humberside, East Midlands, London and the South
East. In their analysis of the geographical mobility of graduates in the cohort studies, Bynner
et al (2002) showed that respondents in their thirties and early forties were moving away
from London and the South East having, in many cases, migrated into that area at some
earlier point in their lives; and it was often the case that people were migrating back to their
region of birth.
Consideration of these geographical movements raises the question of to what extent
different regions were attracting or losing a stock of highly qualified individuals. In Table 14
we address this issue by comparing the distribution of actual qualifications in 2000 with how
that qualification profile might have looked had people remained in the region in which they
were located in 1991, but assuming they still acquired qualifications during the 1990s as
before. It can be seen that some regions such as the North, East Anglia the South West and
Scotland were on balance tending to attract in the more well-qualified people (those at level 3
+ by 2000) and to lose some of their less qualified individuals, while regions such as
Yorkshire/Humberside and Wales were, on balance, losing some of their stock of well-
qualified cohort members.
14
4 Lifelong Learning in NCDS
There has been a great deal of debate in recent years about adult participation in learning:
why some people participate in learning and others do not; how participation might be
increased; and various policy initiatives aimed at improving access to learning opportunities
for adults. As pointed out in the literature review, it is uncertain whether there are
geographical variations in lifelong learning because of the small sample sizes at regional or
local level in the major surveys concerned with this topic.
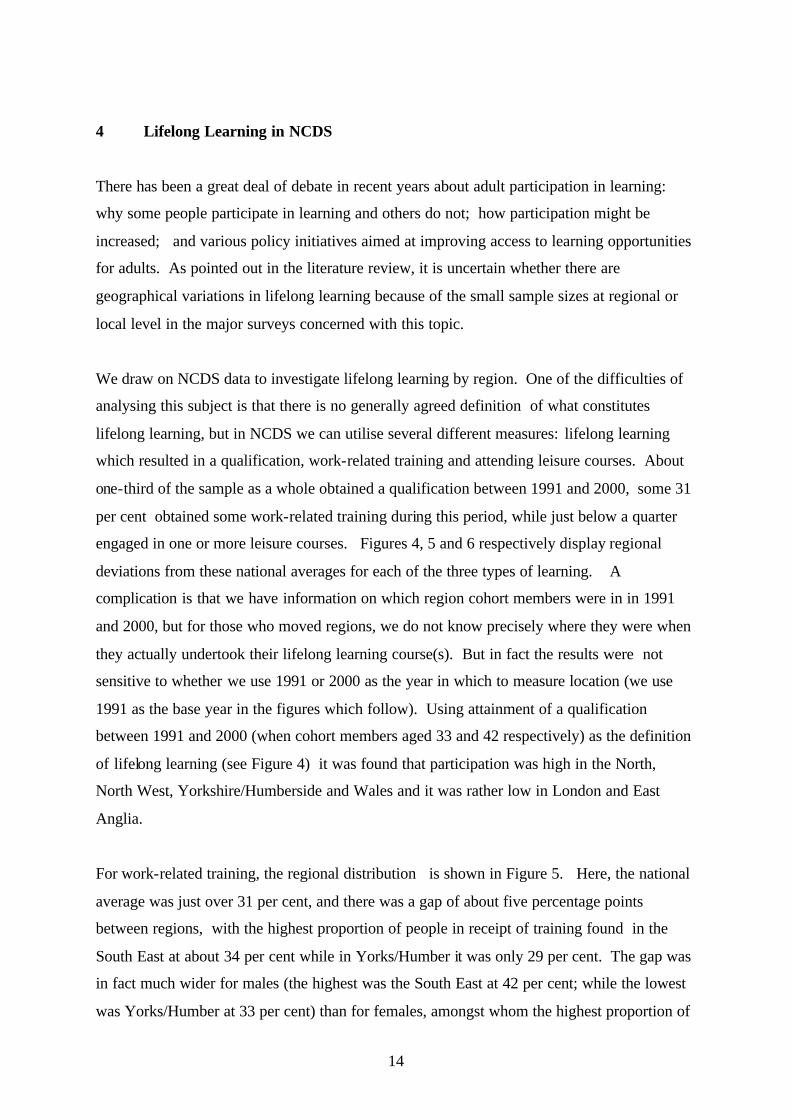
We draw on NCDS data to investigate lifelong learning by region. One of the difficulties of
analysing this subject is that there is no generally agreed definition of what constitutes
lifelong learning, but in NCDS we can utilise several different measures: lifelong learning
which resulted in a qualification, work-related training and attending leisure courses. About
one-third of the sample as a whole obtained a qualification between 1991 and 2000, some 31
per cent obtained some work-related training during this period, while just below a quarter
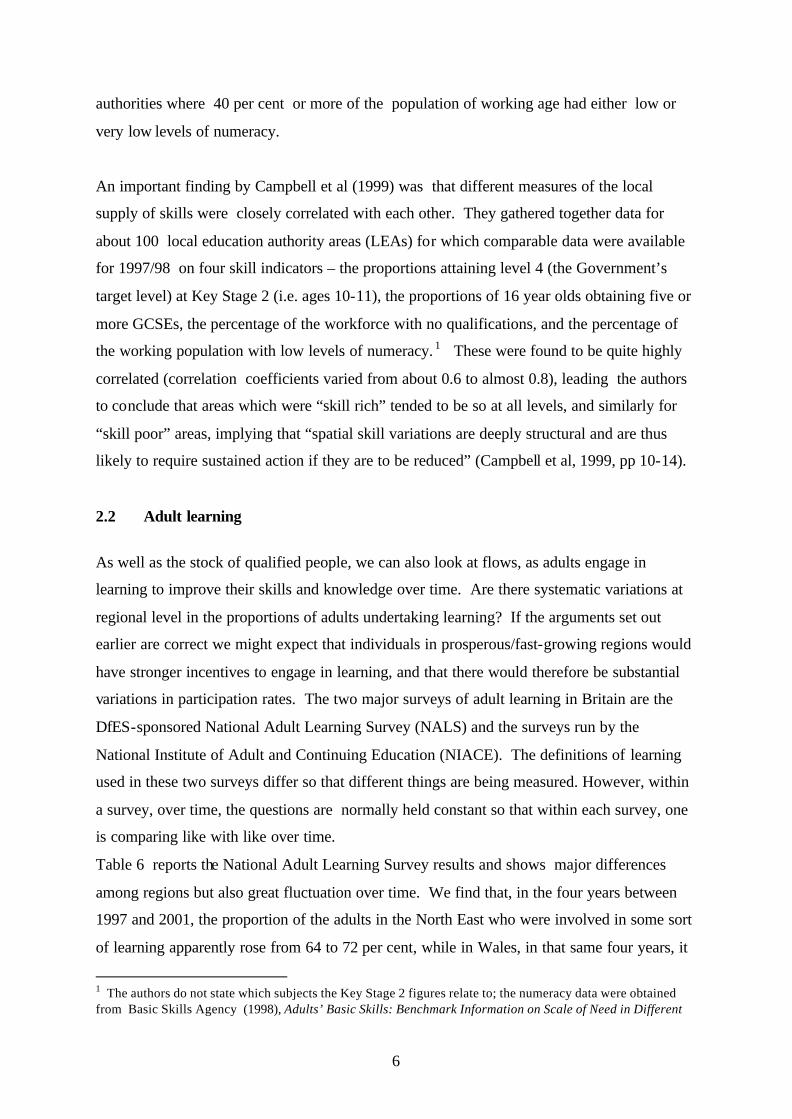
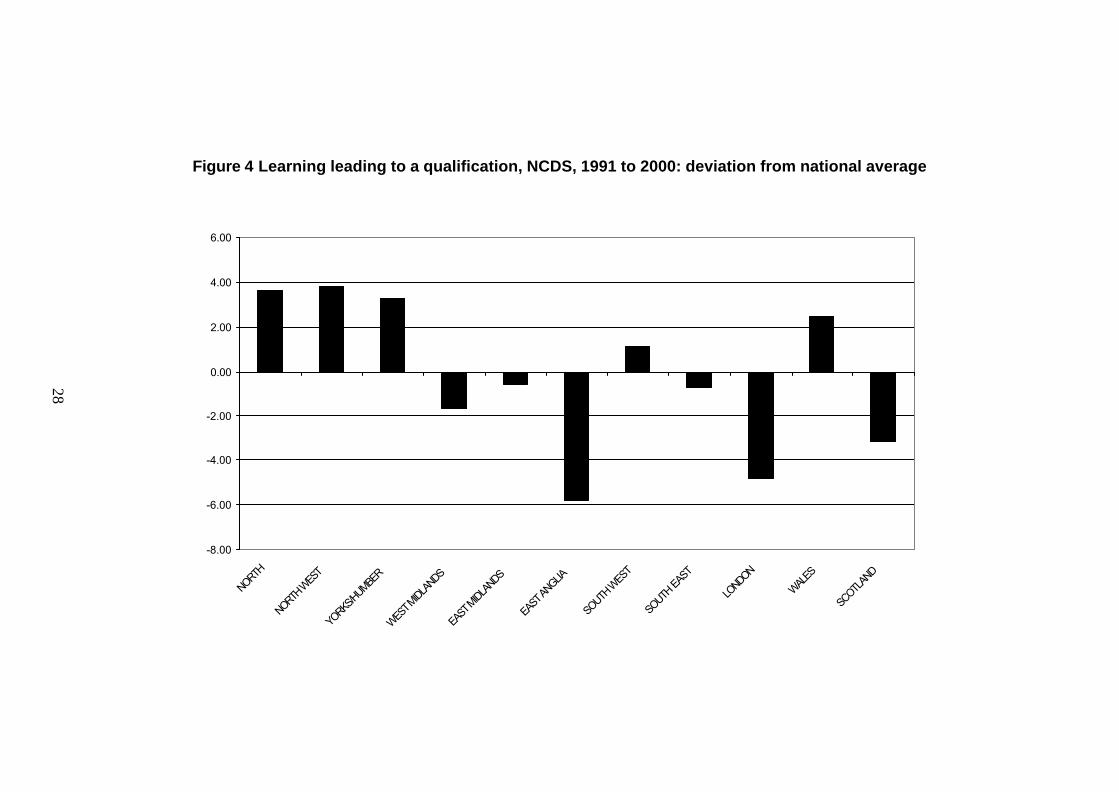
engaged in one or more leisure courses. Figures 4, 5 and 6 respectively display regional
deviations from these national averages for each of the three types of learning. A
complication is that we have information on which region cohort members were in in 1991
and 2000, but for those who moved regions, we do not know precisely where they were when
they actually undertook their lifelong learning course(s). But in fact the results were not
sensitive to whether we use 1991 or 2000 as the year in which to measure location (we use
1991 as the base year in the figures which follow). Using attainment of a qualification
between 1991 and 2000 (when cohort members aged 33 and 42 respectively) as the definition
of lifelong learning (see Figure 4) it was found that participation was high in the North,
North West, Yorkshire/Humberside and Wales and it was rather low in London and East
Anglia.
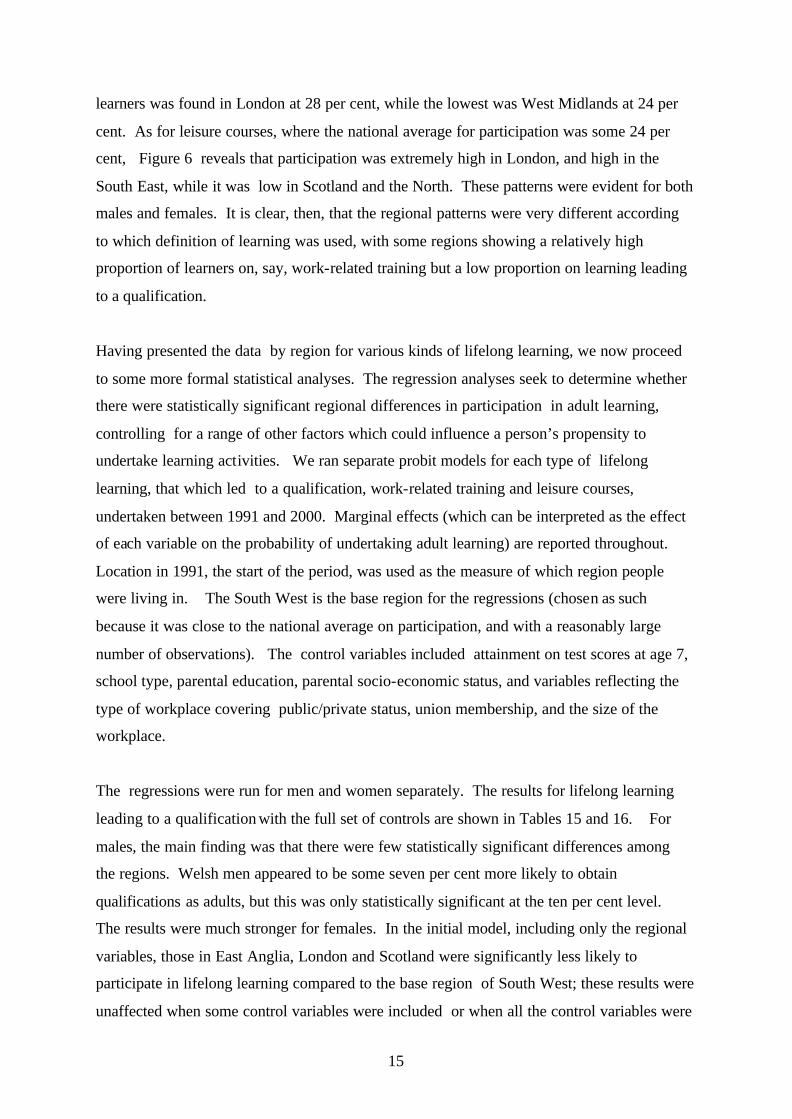
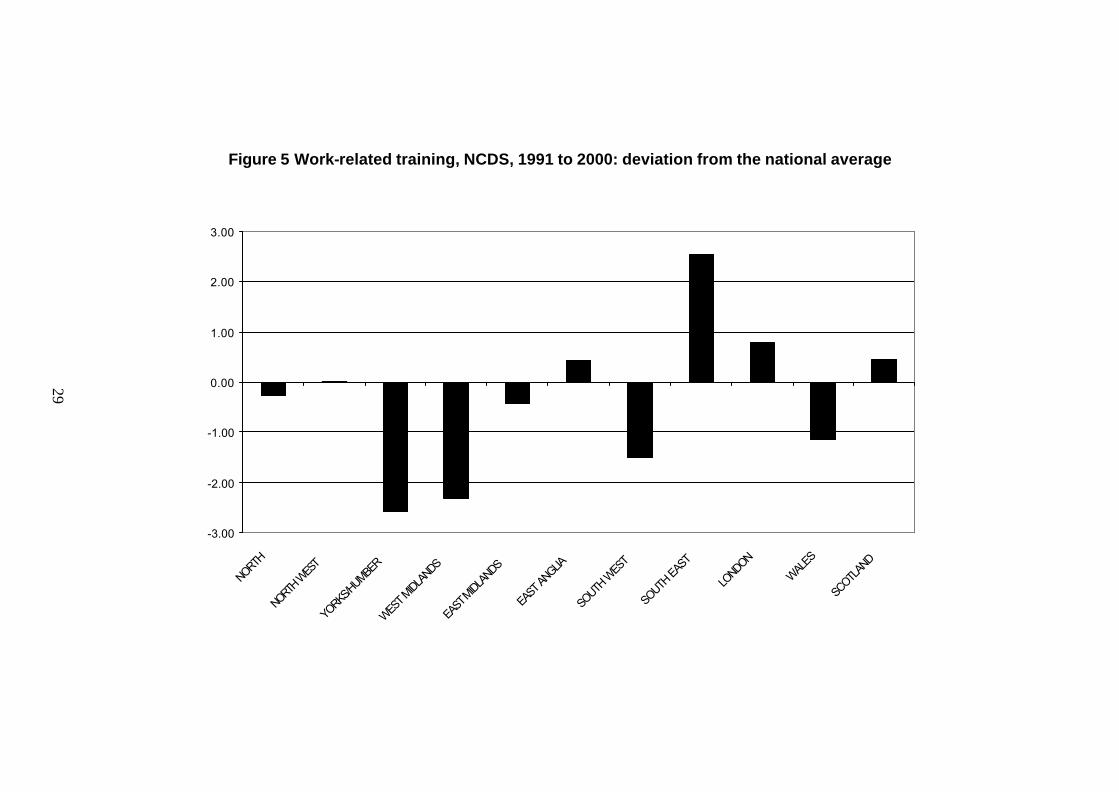
For work-related training, the regional distribution is shown in Figure 5. Here, the national
average was just over 31 per cent, and there was a gap of about five percentage points
between regions, with the highest proportion of people in receipt of training found in the
South East at about 34 per cent while in Yorks/Humber it was only 29 per cent. The gap was
in fact much wider for males (the highest was the South East at 42 per cent; while the lowest
was Yorks/Humber at 33 per cent) than for females, amongst whom the highest proportion of
15
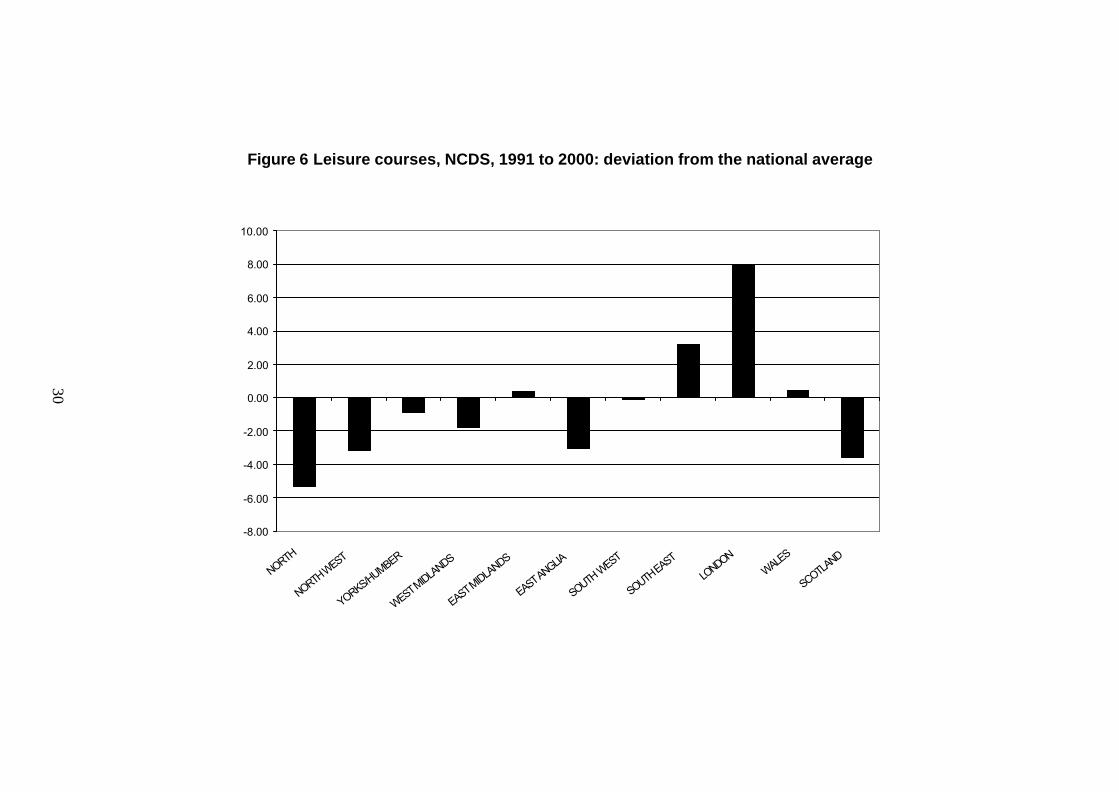
learners was found in London at 28 per cent, while the lowest was West Midlands at 24 per
cent. As for leisure courses, where the national average for participation was some 24 per
cent, Figure 6 reveals that participation was extremely high in London, and high in the
South East, while it was low in Scotland and the North. These patterns were evident for both
males and females. It is clear, then, that the regional patterns were very different according
to which definition of learning was used, with some regions showing a relatively high
proportion of learners on, say, work-related training but a low proportion on learning leading
to a qualification.
Having presented the data by region for various kinds of lifelong learning, we now proceed
to some more formal statistical analyses. The regression analyses seek to determine whether
there were statistically significant regional differences in participation in adult learning,
controlling for a range of other factors which could influence a person’s propensity to
undertake learning activities. We ran separate probit models for each type of lifelong
learning, that which led to a qualification, work-related training and leisure courses,
undertaken between 1991 and 2000. Marginal effects (which can be interpreted as the effect
of each variable on the probability of undertaking adult learning) are reported throughout.
Location in 1991, the start of the period, was used as the measure of which region people
were living in. The South West is the base region for the regressions (chosen as such
because it was close to the national average on participation, and with a reasonably large
number of observations). The control variables included attainment on test scores at age 7,
school type, parental education, parental socio-economic status, and variables reflecting the
type of workplace covering public/private status, union membership, and the size of the
workplace.
The regressions were run for men and women separately. The results for lifelong learning
leading to a qualification with the full set of controls are shown in Tables 15 and 16. For
males, the main finding was that there were few statistically significant differences among
the regions. Welsh men appeared to be some seven per cent more likely to obtain
qualifications as adults, but this was only statistically significant at the ten per cent level.
The results were much stronger for females. In the initial model, including only the regional
variables, those in East Anglia, London and Scotland were significantly less likely to
participate in lifelong learning compared to the base region of South West; these results were
unaffected when some control variables were included or when all the control variables were
16
included. In the full model those in the West Midlands also showed a lower propensity for
adult learning, being some seven per cent less likely to obtain a qualification, while the
figures were 12 per cent less likely for East Anglia, ten per cent in London and eight per
cent in Scotland. These findings, then, suggest that the regional variation in participation for
males are not robust, but that there are significant regional variations among women for this
type of lifelong learning, which are little affected by the inclusion of other factors which
might explain lifelong learning.
The regressions for participation in training showed that, for men, participation was
significantly higher in the South East compared to the base region, South West. This applied
consistently, whether there were no controls through to the full range of controls. In the latter
case the size of the regional effect was such that those in the South East were some eight
percentage points more likely to have received some training. Other regions did not differ
significantly from the base for men. Among women, on the other hand, there did not appear
to be any statistically significant differences for region in participation in work-related
training (see Tables 17 and 18).
For leisure courses, there were not statistically significant differences among the regions in
the equations for men, but for women London region was positive and strongly significant,
suggesting that women were about nine percentage points more likely to participate in these
courses, after controlling for other factors. The South East region was also statistically
significant relative to the base, South West, but only weakly so. These results are presented
in Tables 19 and 20.
5 Regional Variations in Vocational Training: Evidence from WERS 98.
In investigating whether there were regional patterns in the provision of vocational training
by employers, we also utilised information from the 1998 Workplace Employee Relations
Survey (WERS 98), a large government-sponsored survey of public and private sector
workplaces in Great Britain. In contrast to many surveys which concentrate only on large
firms the WERS survey, when appropriately weighted, is nationally representative of
workplaces with ten or more employees within Standard Industrial Classification (SIC) major
17
groups D to O.4 It includes information obtained from interviews with the manager most
responsible for personnel matters at each workplace, a worker representative, and a
questionnaire survey of employees (Cully et al, 2000). In the employee dataset, respondents
were asked: “During the last 12 months, how much training have you had, either paid for or
organised by your employer?” The total response was approximately 28,000. This sample
size is large enough to provide ample regional sub-samples. Table 21 reports the proportion
of workers who had received some training, broken down by the Government Office Region
of the workplace. The estimates are weighted to take account of the complex sampling
design of WERS 98 which involved both stratification of the sample of workplaces, and
clustering of the employee sample within workplaces (see Forth and Kirby, 2000, for details
of sample design and weighting procedures).
It can be seen that the proportion of employees who has received some training was highest
in the North East at some 65 per cent, followed by London and the Eastern region at
approximately 62 per cent each. Most of the other regions were clustered in a narrow band
between 58 and 60 per cent, while the West Midlands and Yorkshire/Humberside regions
each had less than 57 per cent of workers in training. In Table 22 a more detailed picture of
the amount of training received is presented. Regional variations can be observed here, too.
For instance, if we consider five days or more as a large amount of training, it is apparent
that the proportion of workers who were in this position varied from below 16 per cent in
some regions, such as South West and Scotland to 20 per cent or more in Wales, the East and
the North East. In fact the North East was the most highly ranked region both for the
proportion of workers receiving any training, and the proportion obtaining five or more days
of training. It is worth noting that this result contrasts with those which we observed in
earlier sections on qualifications and staying-on rates.
Now, it is well-known that the demand for training will vary with the type of worker and with
the type of workplace. For example, professional workers tend to receive much more
training than unskilled workers, younger workers obtain more training than older workers,
while the characteristics of a workplace, such as the industrial sector in which it is located
and its size will also influence the amount of training provided. To what extent can factors
such as these explain the observed regional variations in the proportions of workers receiving
4 Agriculture, forestry and fishing, mining and quarrying were excluded from the survey.

18
training? WERS 98 contains a good deal of information both on worker characteristics and
on workplace characteristics which we can use in regression models of training.
We ran probit regressions with the dependent variable as whether or not the worker received
some training. Subsequently, we also present some analyses of the amount of training. Table
23 reports probit estimates of training with regional dummies as the sole explanatory
variables. The base region was the South East, the sample size was about 28,000 employees,
and as before the estimates are weighted to allow for complex sample design. Compared to
the South East, a number of regions attracted positive coefficients in the probit regression but
almost all of these were not statistically significant. However, the proportion of workers in
receipt of training in the North East was significantly larger than the base region at the five
per cent level.
In Tables 24, 25, and 26 a range of worker characteristics and workplace characteristics were
introduced into the model as explanatory variables. Table 24 contains only worker
characteristics, Table 25 just the workplace characteristics, while information on both the
worker and the workplace is contained in Table 26. As shown in Table 24, the probability of
receiving training increased with the worker’s level of education; it was higher too for those
with a vocational qualification, and it was also higher for certain occupational categories,
notably managers, professional, personal/protective service workers and sales staff compared
to the base category – operatives. Those on permanent contracts had a greater likelihood of
receiving some training than those on temporary or fixed-term contracts; part-time workers
were markedly less likely to get training; union membership raised the probability of the
worker receiving some training. These effects seem plausible and are generally in line with
findings in the literature (e.g. OECD, 1999; Booth, 1991) so that we now focus on the
regional estimates which are our main interest in this paper. In Table 24 the regional dummy
variables actually showed a tendency to increase in strength when the additiona l controls for
worker characteristics were introduced. Both the East and North East regions were now
positive and statistically significant compared to the base region, the South East. Some
worker characteristics in these regions were unfavourable to training. Only 14 per cent of
workers in the North East and 17.5 per cent in the East were educated to degree or
postgraduate level, compared to 21 per cent across all regions, while the proportion of
employees in managerial and professional occupations was only some 16 per cent in the East
and a mere 11 per cent in the North East, compared to the national average in WERS of
19
almost 20 per cent. Some characteristics of workers associated with increased chances of
receiving training were also found in these regions: union/staff association membership was
very high in the North East, for example, but on balance the inclusion of worker
characteristics in the model served to strengthen the degree of statistical association between
the probability of receiving some training and the regional variables.
Table 25 shows a probit regression for training with workplace characteristics as explanatory
variables. The size of the workplace had quite weak effects on the probability that an
employee would receive some training, but workers in establishments which were part of a
larger organisation had increased chances of participating in some training. The probability
of receipt of training was higher in some industrial sectors than in others, particularly in
public administration, the utilities and the health sector. The presence of a personnel
specialist at the workplace, and investor- in-people status raised the probability that training
was provided, as would be expected. It is noticeable that none of the regional variables was
statistically significant in the probit regression equation reported in Table 25. This can be
explained by the fact that in regions where training probabilities were high, such as the North
East and the East, a large proportion of employment was in sectors such as public
administration and health, where training levels were high. In the weighted WERS estimates,
over 13 per cent of employees in the North East were in the public administration sector and
20 per cent were in the health sector compared to the average for all regions of nine per cent
and 13.5 per cent respectively in these two sectors. Also some 84 per cent of workers in the
North East in the survey were employed at workplaces which were part of a larger
organisation, compared to the national average of 78 per cent (the highest proportion was in
Scotland at nearly 87 per cent). Hence, once these workplace characteristics had been
allowed for, there were not significant regional effects in Table 25.
So, how did the regional variables fare when we included both worker and workplace
characteristics in the model. In Table 26 estimates are reported controlling for both the
worker and workplace characteristics. Even with all these control variables included some
statistically significant regional effects were apparent. These were for East and North East.
It is also worth noting that the London regional dummy variable had a negative coefficient,
suggesting that less training tends to take place in the London region, perhaps because the
metropolis was able to draw in highly-skilled migrants, although this effect was not
statistically significant.

20
We were also interested in exploring the amount of training, as well as just whether some
training had occurred. Ordered probit regressions were used here because the dependent
variable had only a small number of discrete categories. Again we began with just the
regional variables in the model, introduced worker and workplace characteristics separately,
and then combined all the explanatory variables in the final specification. The results were
quite similar to the probit models. Table 27 shows no statistically significant regional effects
in the absence of any other explanatory variables; including worker characteristics in the
model tended to strengthen regional effects, the inclusion of workplace characteristics tended
to dampen them; when all the explanatory variables were combined as in Table 28,
statistically significant and positive effects were still present for the East and the North East.
This time the London regional variable was negative and statistically significant at the five
per cent level.
In summary, regional variations in whether workers get training and in the amount of
training, are quite substantial. In terms of the proportion of workers who participated in some
training this varied from 65 per cent in the North East to about 57 per cent in the West
Midlands. Some of these variations were statistically significant in regression analysis, and
remained so even in the presence of a very wide range of control variables which can be
drawn on in the WERS dataset. Models which control only for worker characteristics tend to
strengthen regional effects, while workplace characteristics such as its industrial sector tend
to dampen them. The regions where training was greater than expected were the East and the
North East, while the amount of training was less than might have been expected on the
basis of the characteristics of the workforce and the establishments in London. It is possible
that there is some tendency in London to attract skilled workers rather than providing training;
as for the positive effects in the North East and the East it is possible that this could be
attributable to supply factors, or to regional development policies, but this must be
conjectural in the absence of further information. A simple catching-up model in which
regions with a low-skilled workforce conduct more training may be a partial explanation for
the observed patterns, but is clearly incomplete. For example, it does not account for patterns
in the West Midlands or Yorkshire/Humberside, where the skills base of the workforce, as
measured by formal qualifications was low but where the level of training provision was also
low.
21
6 Conclusion
Regional variations in skill levels and economic performance continue to be of concern to
policy-makers. In this paper we have looked at some widely-used data sources on lifelong
learning and work-related training and demonstrated that regional differences identified in the
surveys may not be robust. There was much unexplained variation from year to year in the
pattern of learning and training by region. It seems that sample sizes in several of these
surveys may not be large enough to deliver consistent results across regions. These surveys
of course remain valuable for identifying trends at national level but we suggest that they
must be used with great caution when comparing sub-groups such as regions within the
sample.
Our own estimates of the extent of participation in adult learning, drawing on data from the
National Child Development Study, varied by region but which regions had the highest
participation rates depended on the definition of adult learning adopted. For learning leading
to qualifications participation was highest in the North, North West and Wales; for work-
related training the South East had the highest proportion of learners, while for leisure
courses participation rates were highest in London. However, these results need to be
interpreted with some caution as they apply only to a single cohort and may not be
representative of the population of working age more generally.
The 1998 Workplace Employee Relations Survey (WERS) does contain information on
workers of all ages, and the sample size is sufficiently large to deliver robust estimates at the
regional level. Analyses were therefore conducted on the regional distribution of work-
related training using data from WERS. Here the proportion of workers in receipt of some
training was highest in the North East, London and Eastern region, and lowest in the West
Midlands and Yorkshire/Humberside. In regression analyses of the likelihood of receiving
training, and controlling for both worker characteristics such as level of education and
occupation and workplace characteristics such as establishment size some regional effects
remained statistically significant with those in the East and North East more likely to obtain
some training.
Some key gaps in the evidence remain. Our review of the literature showed that the available
information was surprisingly thin on the inter-relationships between regional economic
performance and the skills base in the regions and would certainly benefit from further

22
analysis. The extent to which sub-regional variations in economic prosperity and in the
presence of a well-qualified workforce align with the regional differences in these variables
is also not well-established in the research literature. It is to be hoped that the evidence base
on these topics will become stronger as new data sources, such as small area statistics from
the Labour Force Survey as well as 2001 Census data are utilised in research studies. But at
present there is some uncertainty as to whether the appropriate unit for policy action is the
region or the local area or some combination of the two.
23
References Aldridge, F. and Tuckett, A. (2001) Winners and Losers in an Expanding System: The NIACE Survey on Adult Participation in Learning 2001 (NIACE). Armstrong, H, and Taylor, J, (2000), Regional Economics and Policy. Oxford: Blackwell. Bhatta, S, and Lobo, J, (2000), ‘Human Capital and Per Capita Product: A Comparison of US States’, Papers in Regional Science, 79, 393-411. Booth, A, (1991), ‘Job-related Formal Training: Who Receives it and What is it Worth?’ Oxford Bulletin of Economics and Statistics 53, 281-294. Bradley, S, and Taylor, J, (1996), ‘Human Capital Formation and Local Economic Performance’, Regional Studies, 30, 1-14. Bynner, J, Dolton, P, Feinstein, L, Makepeace, G, Malmberg L and Woods L (2002) Revisiting the Benefits of Higher Education (Centre for Research on the Wider Benefits of Learning). Campbell, M, (2000), Learning Pays and Learning Works: A Review of the Economic Benefits of Learning. NACETT. Campbell, M, Baldwin, S, Johnson, S, Chapman, R, Upton, A, and Walton, F, (2001) Skills in England 2001: The Research Report, Policy Research Institute, Leeds Metropolitan University. Campbell, M, Chapman, R, and Hutchison, J, (1999), Spatial Skill Variations: Their Extent and Implications. Skills Task Force Research Paper 14. Clark, D. (2002) Participating in Post-Compulsory Education in England: What explains the boom and bust? (CEE Discussion Paper No. 24).
Cully, M., Woodward, S., O’Reilly, A. and Dix, G. (2000), Britain at Work, as Depicted by the 1998 Workplace Employee Relations Survey, Routledge: London.
Felstead, A. (2002) Putting skills in their place: the regional pattern of work skills in Britain. Chapter 10 in K. Evans, P. Hodkinson and L. Unwin (eds) Working to Learn: Transforming learning in the workplace (London: Kogan Page). Felstead, A., Gallie, D. & Green, F. (2002) Work Skills in Britain 1986-2002 (SKOPE & DfES). Forth, J. and Kirby, S. (2000), Guide to the Analysis of the Workplace Employee Relations Survey, 1998, WERS 98 Data Dissemination Service. Gray, J, Jesson, D, and Tranmer, M, (1994), Local Labour Market Variations in Post-16 Participation: Evidence from the End of the Eighties. Employment Dept Research Series Youth Cohort Report 26.
24
Green, F, Mayhew, K, and Molloy, E, (2003), Employer Perspectives Survey. SKOPE, Oxford. Gripaios, P, Bishop, P, and Keast, S, (2000), ‘Differences in GDP per Head in GB Counties: Some Suggested Explanations, Applied Economics, 32, 1161-1167. La Valle, I. and Blake, M. (2001) National Adult Learning Survey, 2001. (DfES Research Report 321). Learning and Skills Council, (2003), Skills in England, 2002. McGuiness, S, and Sheehan, M, (1998), ‘Regional Convergence in the UK, 1970-1995’, Applied Economics Letters, 5, 653-658. Micklewright, J, (1989), ‘Choice at Sixteen’, Economica, 56, 25-39. OECD, (1999) ‘Training of Adult Workers in OECD Countries: Measurement and Analysis’ in OECD Employment Outlook, Paris: OECD. OECD, (2001), Cities and Regions in the New Learning Economy. Paris: OECD. Paterson, L, and Raffe, D, (1995), ‘Staying-on in Full-Time Education in Scotland, 1985-91’, Oxford Review of Education, 21/1, 3-23. Payne, J. (2001) Patterns of Participation in Full time Education after 16: an analysis of the England and Wales Youth Cohort Study (Policy Studies Institute). Payne, J. (2002) Attitudes to Education and Choices at age 16: A brief research review (Report to the DfES Advisory Panel on Research Issues for the 14-19 Age Group). Payne, J, (2003), Choice at the End of Compulsory Schooling: A Research Review, DfES Research Report 414. Performance and Innovation Unit, (2001), In Demand: Adult Skills in the 21st Century. Cabinet Office. Rupasingha, A, Goetz, S, and Freshwater, D, (2002), ‘Social and Institutional Factors as Determinants of Economic Growth: Evidence from the United States Counties’, Papers in Regional Science, 81, 139-155. Sala-i-Martin, X, (1996a), ‘Regional Cohesion: Evidence and Theories of Regional Growth and Convergence’, European Economic Review, 40, 1325-1352. Sala-i-Martin, X, (1996b), ‘The Classical Approach to Convergence Analysis’, Economic Journal, 106, 1019-1036. Sargant, N. (2001) The Learning Divide Revisited (NIACE). Spilsbury, D. (2002). Learning and Training at Work 2001 (DfES Research Report 334).
25
Figure 1
The linkages between education, the socio-occupational mix and economic competitiveness (Source: Bradley and Taylor, 1996)
Value added to locality’s stock of
human capital through schooling and
further education
Workforce skills
Labour productivity
Competitiveness
Growth of local economy
Inward migration of
high-skill workers
Stock of high-skill workers
Aspirations, goals
and motivation of
pupils/students
Post-school
employment
opportunities
Investment in training
Industry and commodity mix
Locational advantages
Investment
26
Figure 2 Proportion of NCDS Cohort in full-time education at age 17, by region
0.0
10.0
20.0
30.0
40.0
50.0
60.0
NORTH W
ESTE
RN
NORTHER
N
EAST
& WES
T RIDING
NORTH M
IDLANDS
EAST
ERN
LOND
ON & S
EAST
SOUTH
ERN
SOUTH
WES
TERN
MIDLANDS
WALES
SCOTL
AND
Per
Cen
t
MalesFemales
27
Figure 3 Proportion of cohort members with no qualifications, 1991 to 2000
0.0
2.0
4.0
6.0
8.0
10.0
12.0
14.0
16.0
18.0
20.0
NORTH
NORTH W
EST
YORKS
/HUMBER
WEST M
IDLANDS
EAST
MIDLANDS
EAST
ANGLIA
SOUTH
WES
T
LONDON/S
EAST
WALES
SCOTLA
NDTO
TAL
Per
Cen
t
19912000
28
Figure 4 Learning leading to a qualification, NCDS, 1991 to 2000: deviation from national average
-8.00
-6.00
-4.00
-2.00
0.00
2.00
4.00
6.00
NORTH
NORTH W
EST
YORKS
/HUMBER
WEST M
IDLANDS
EAST
MIDLANDS
EAST
ANGLIA
SOUTH
WES
T
SOUTH
EAST
LONDON
WALES
SCOTL
AND
29
Figure 5 Work-related training, NCDS, 1991 to 2000: deviation from the national average
-3.00
-2.00
-1.00
0.00
1.00
2.00
3.00
NORTH
NORT
H WES
T
YORKS
/HUMBER
WEST M
IDLANDS
EAST
MIDLANDS
EAST
ANGLIA
SOUTH
WES
T
SOUTH
EAST
LONDON
WALES
SCOTL
AND
30
Figure 6 Leisure courses, NCDS, 1991 to 2000: deviation from the national average
-8.00
-6.00
-4.00
-2.00
0.00
2.00
4.00
6.00
8.00
10.00
NORTH
NORTH WEST
YORKS/HUMBER
WEST MIDLANDS
EAST MIDLANDS
EAST ANGLIA
SOUTH W
EST
SOUTH EAST
LONDON
WALES
SCOTLAND
31
Table 1 Mean point scores at Year 11 GCSE, 2000
North East 35.3
North West 36.8
Yorkshire and Humberside 35.1
Wales 34.9
West Midlands 37.1
East Midlands 37.7
South West 40.4
East 39.6
South East 40.8
London 39.3
Inner London 37.2
Outer London 40.3
Source: Payne, 2001.
32
Table 2 Percentage of students who were in the bottom third on their GCSE
results who stayed in full-time education
North East 39
North West 46
Yorkshire and Humberside 42
Wales 46
West Midlands 44
East Midlands 38
South West 47
East 46
South East 47
London 59
Source: YCS 9 and 10 combined (1998 and 2000): Payne 2001
33
Table 3 Economically active adults 2000: percentage qualified to NQF level
3 or 4
Level 3 or above Level 4 or above
North East 41 21
North West 47 25
Yorkshire and Humberside
45 24
East Midlands 43 24
West Midlands 43 25
East 44 25
London 52 35
South East 50 30
South West 46 27
Wales 39 22
Scotland 47 26
Source: ONS.
34
Table 4 Per cent employees with no qualifications: Learning and Skill Council Areas
% %
1 The Black Country 23.8 26 London North 14.8
2 B’ham and Solihull 22.4 27 Norfolk 14.8
3 South Yorkshire 21.8 28 Cambridgeshire 14.3
4 Greater Merseyside 21.7 29 B’mouth, Dorset and Poole 14.3
5 County Durham 21.5 30 Herefordshire and Worcestershire 14.3
6 Tees Valley 21.2 31 Kent and Medway 14.1
7 London East 20.6 32 London West 13.9
8 Nottinghamshire 20.6 33 Cumbria 13.9
9 Tyne and Wear 20.3 34 Devon and Cornwall 13.8
10 Staffordshire 20.2 35 North Yorkshire 13.0
11 Greater Manchester 19.9 36 Hampshire and IoW 12.7
12 Suffolk 19.6 37 Wiltshire and Swindon 12.6
13 Derbyshire 19.4 38 London Central 12.4
14 Leicestershire 19.1 39 Berkshire 11.6
15 Northumberland 19.0 40 Sussex 11.6
16 Humberside 17.8 41 Somerset 11.3
17 West Yorkshire 17.8 42 West of England 11.2
18 Essex 17.7 43 Gloucestershire 11.2
19 Shropshire 17.1 44 MKOB 11.0
20 Coventry and Warwickshire 17.1 45 London South 10.7
21 Lancashire 17.1 46 Hertfordshire 9.9
22 Lincolnshire and Rutland 15.9 47 Surrey 8.2
23 Cheshire and Warrington 15.5
24 Bedfordshire and Luton 15.3
25 Northamptonshire 14.9 Unweighted Average 19.1
35
Table 5 Per cent employees at NVQ4+: Learning and Skill Council Areas
1 London Central 38.9 26 B’mouth, Dorset and Poole 21.1
2 Surrey 34.0 27 Greater Manchester 21.1
3 London South 32.8 28 Devon and Cornwall 20.5
4 MKOB 30.0 29 B’ham and Solihull 20.5
5 Berkshire 29.5 30 Nottinghamshire 20.1
6 West of England 28.9 31 Lincolnshire and Rutland 19.9
7 London West 28.3 32 Derbyshire 19.7
8 Hertfordshire 28.2 33 Cumbria 19.7
9 Cambridgeshire 27.5 34 Kent and Medway 19.3
10 Gloucestershire 27.4 35 Leicestershire 19.3
11 London North 26.8 36 Norfolk 18.9
12 Wiltshire and Swindon 26.7 37 Greater Merseyside 18.9
13 Cheshire and Warrington 26.3 38 Northamptonshire 18.8
14 North Yorkshire 26.2 39 Tyne and Wear 18.8
15 Sussex 25.3 40 County Durham 18.0
16 Coventry and Warwickshire 25.3 41 Staffordshire 17.8
17 Herefordshire and Worcestershire 24.5 42 South Yorkshire 17.6
18 Bedfordshire and Luton 24.1 43 Essex 17.4
19 Hampshire and IoW 22.9 44 Humberside 17.4
20 London East 21.9 45 Suffolk 17.3
21 Somerset 21.8 46 Tees Valley 16.9
22 Northumberland 21.7 47 The Black Country 15.8
23 West Yorkshire 21.6
24 Lancashire 21.4
25 Shropshire 21.3 Unweighted Average 26.5
36
Table 6 Percentages of respondents in different GORs reporting some learning: NALS 1997-2001
N.East N.West Merseyside Yorks & Humber
E.Mids W.Mids S.West Eastern London S.East Wales
% % % % % % % % % % %
NALS 1997 64 71 68 74 71 74 73 80 72 78 71 NALS 2001 72 71 [69] 70 76 74 79 81 76 84 64
Base: all respondents aged under 70 n = 5532 (2001)
Source: I. La Valle and M. Blake, National Adult Learning Survey, 2001. DfES Research Report 321.
37
Table 7 NIACE Surveys: % current/recent learners by region*
1990 1996 1999 2001
Greater London 40 44 46 52
South East 40 38 42 47 South West 43 37 37 53 East Anglia 39 43 48 52
East Midlands 37 50 48 45 West Midlands 46 35 34 47
Wales 37 37 43 39 North West 40 35 41 54 Yorks/Humberside 40 52 42 42
North 33 45 34 44 Scotland 22 38 33 36
Total sample 39 40 40 46
*Current/recent and informal in 1990 Sources: F. Aldridge and A. Tuckett, Winners and Losers in an Expanding System: The
NIACE Survey on Adult Participation in Learning 2001. NIACE, 2001.
N. Sargant, The Learning Divide Revisited. NIACE, 2001.
38
Table 8 NIACE: Percentage current/recent learners: regions by rank (1 =
highest)
1990 1996 1999 2001
Greater London 3= 4 3 3= South East 3= 6= 5= 5
South West 2 8= 8 2 East Anglia 7 5 1= 3= East Midlands 8= 1 1= 7
West Midlands 1 10= 9= 5= Wales 8= 8= 4 10
North West 3= 10= 7 1 Yorkshire and Humberside
3= 2 5= 9
North and North East 10 3 9= 8 Scotland 11 6= 11 11
Mean % for total sample 39 40 40 46 Range (% points between top and bottom)
24 15 15 18

39
Table 9 Provision of off-the-job training by Government Office Region of
employer
1999 %
2000 %
2001 %
North East 54 55 59 North West 52 63 51 Yorkshire and the Humber
53 63 60
East Midlands 56 55 51 West Midlands 57 56 59
Eastern 43 54 58 London 46 56 57 South East 54 63 53
South West 63 64 54 Total 52 59 55
Base/Coverage: all employers with 5 or more employees: n = 3431
Source: D. Spilsbury, Learning and Training at Work 2001. DfES Research Report
334 (2002).
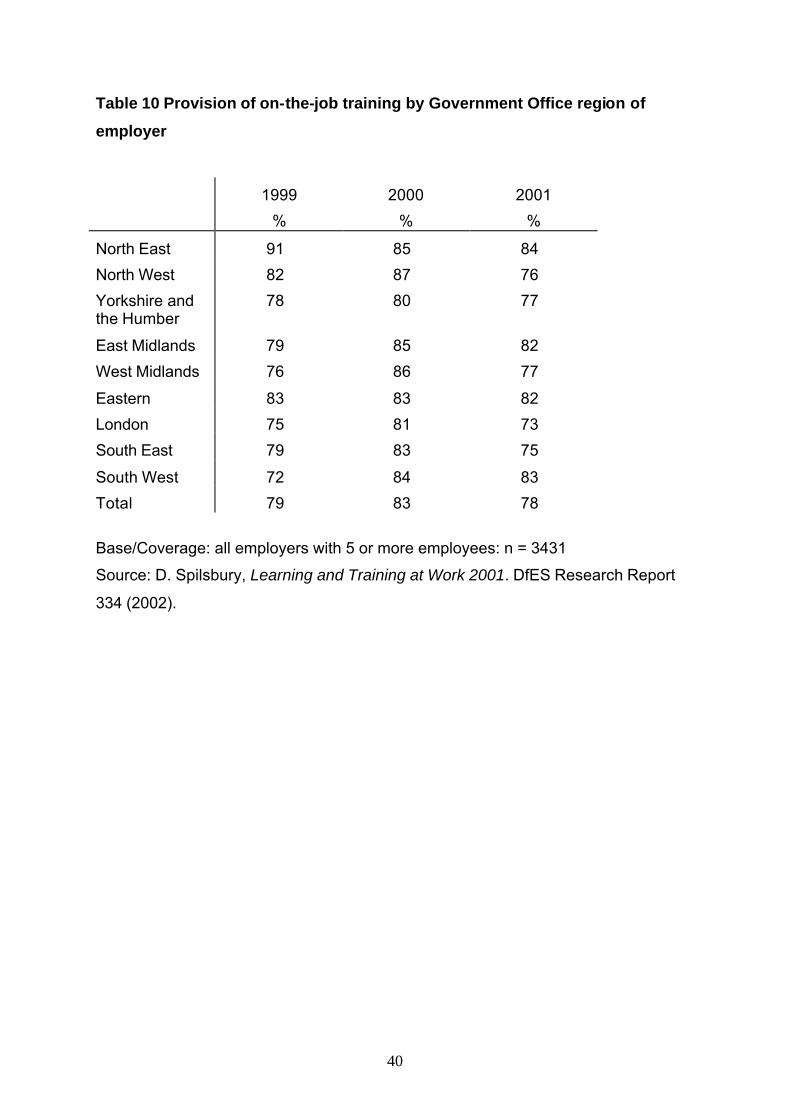
40
Table 10 Provision of on-the-job training by Government Office region of
employer
1999 %
2000 %
2001 %
North East 91 85 84 North West 82 87 76 Yorkshire and the Humber
78 80 77
East Midlands 79 85 82 West Midlands 76 86 77
Eastern 83 83 82 London 75 81 73 South East 79 83 75
South West 72 84 83 Total 79 83 78
Base/Coverage: all employers with 5 or more employees: n = 3431
Source: D. Spilsbury, Learning and Training at Work 2001. DfES Research Report
334 (2002).
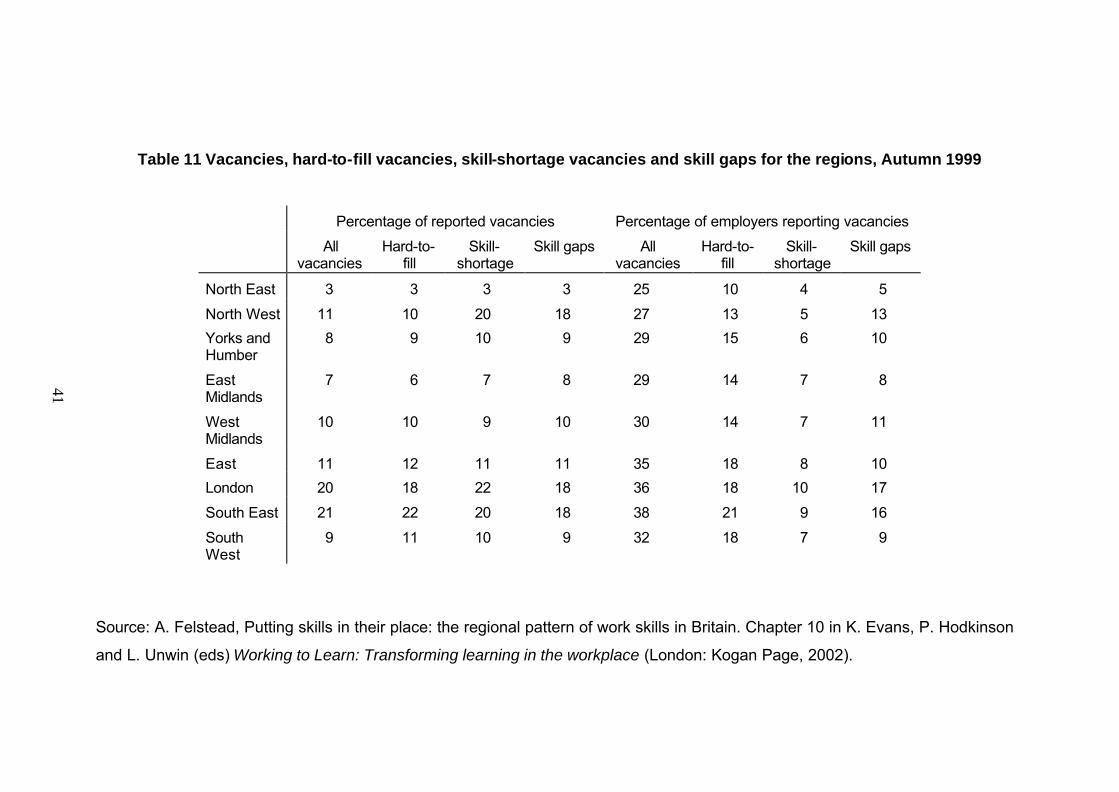
41
Table 11 Vacancies, hard-to-fill vacancies, skill-shortage vacancies and skill gaps for the regions, Autumn 1999
Percentage of reported vacancies Percentage of employers reporting vacancies
All vacancies
Hard-to-fill
Skill-shortage
Skill gaps All vacancies
Hard-to-fill
Skill-shortage
Skill gaps
North East 3 3 3 3 25 10 4 5
North West 11 10 20 18 27 13 5 13 Yorks and Humber
8 9 10 9 29 15 6 10
East Midlands
7 6 7 8 29 14 7 8
West Midlands
10 10 9 10 30 14 7 11
East 11 12 11 11 35 18 8 10 London 20 18 22 18 36 18 10 17
South East 21 22 20 18 38 21 9 16
South West
9 11 10 9 32 18 7 9
Source: A. Felstead, Putting skills in their place: the regional pattern of work skills in Britain. Chapter 10 in K. Evans, P. Hodkinson
and L. Unwin (eds) Working to Learn: Transforming learning in the workplace (London: Kogan Page, 2002).
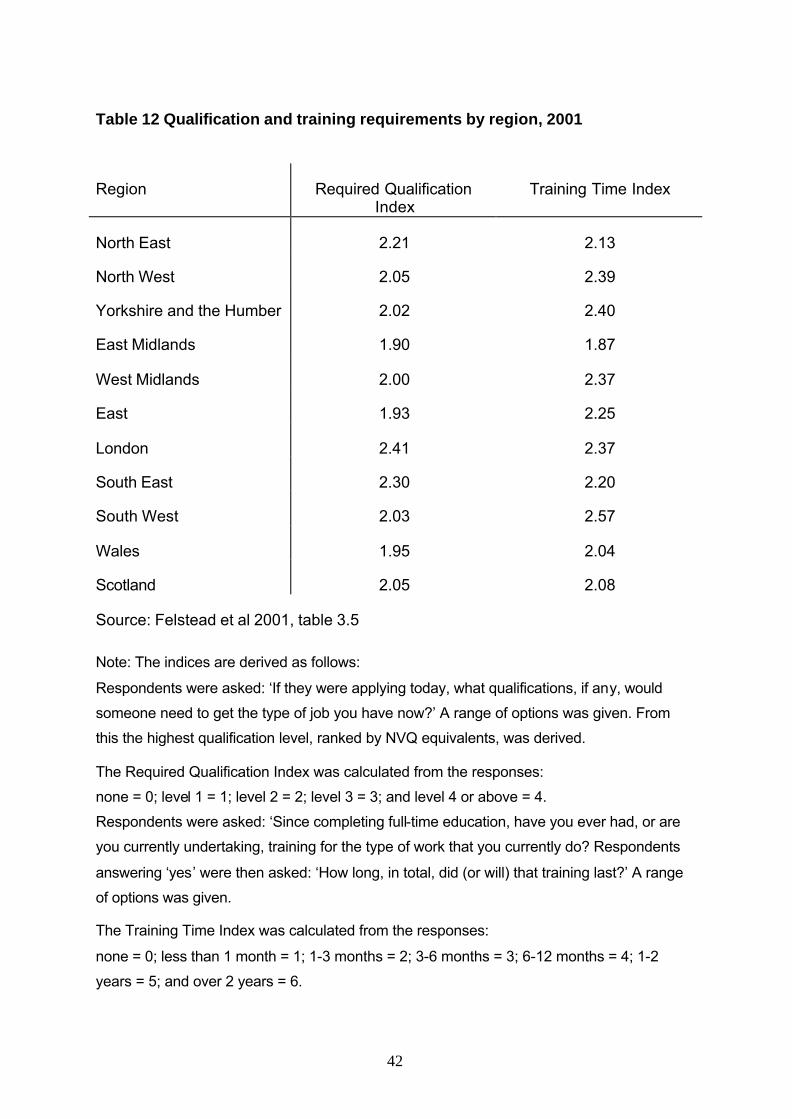
42
Table 12 Qualification and training requirements by region, 2001
Region Required Qualification Index
Training Time Index
North East 2.21 2.13
North West 2.05 2.39
Yorkshire and the Humber 2.02 2.40
East Midlands 1.90 1.87
West Midlands 2.00 2.37
East 1.93 2.25
London 2.41 2.37
South East 2.30 2.20
South West 2.03 2.57
Wales 1.95 2.04
Scotland 2.05 2.08
Source: Felstead et al 2001, table 3.5
Note: The indices are derived as follows:
Respondents were asked: ‘If they were applying today, what qualifications, if any, would
someone need to get the type of job you have now?’ A range of options was given. From
this the highest qualification level, ranked by NVQ equivalents, was derived.
The Required Qualification Index was calculated from the responses:
none = 0; level 1 = 1; level 2 = 2; level 3 = 3; and level 4 or above = 4.
Respondents were asked: ‘Since completing full-time education, have you ever had, or are
you currently undertaking, training for the type of work that you currently do? Respondents
answering ‘yes’ were then asked: ‘How long, in total, did (or will) that training last?’ A range
of options was given.
The Training Time Index was calculated from the responses:
none = 0; less than 1 month = 1; 1-3 months = 2; 3-6 months = 3; 6-12 months = 4; 1-2
years = 5; and over 2 years = 6.
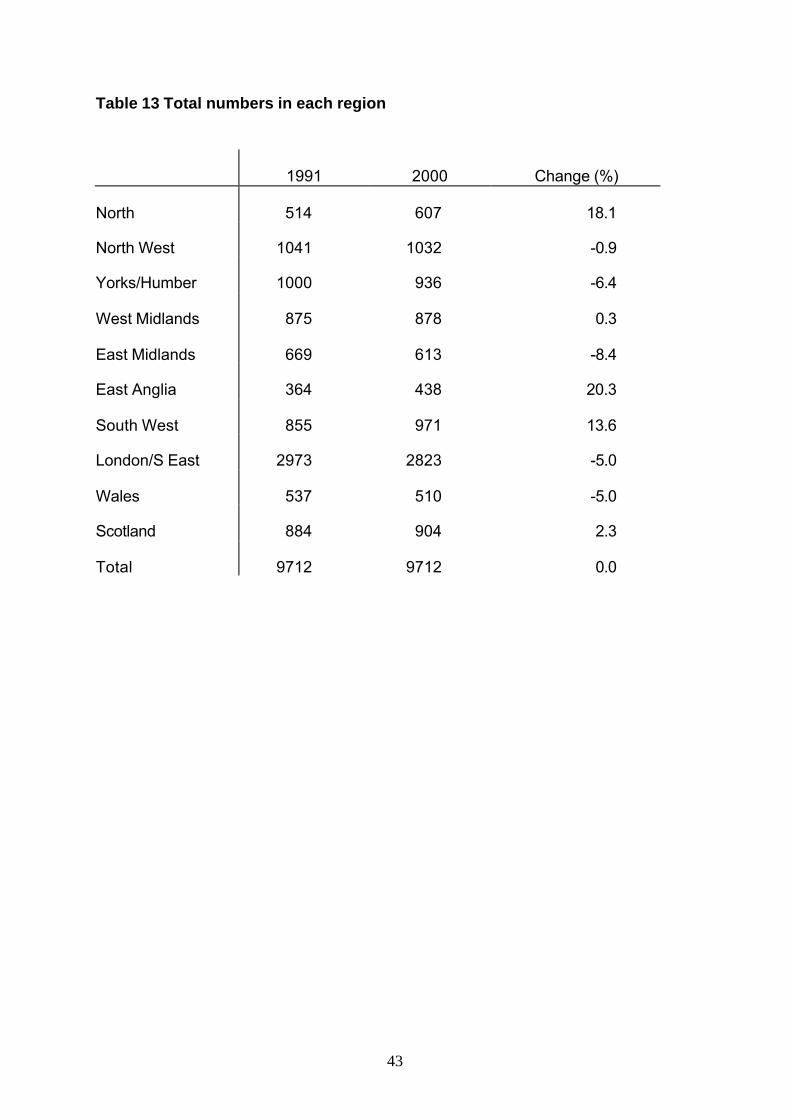
43
Table 13 Total numbers in each region
1991 2000 Change (%)
North 514 607 18.1
North West 1041 1032 -0.9
Yorks/Humber 1000 936 -6.4
West Midlands 875 878 0.3
East Midlands 669 613 -8.4
East Anglia 364 438 20.3
South West 855 971 13.6
London/S East 2973 2823 -5.0
Wales 537 510 -5.0
Scotland 884 904 2.3
Total 9712 9712 0.0
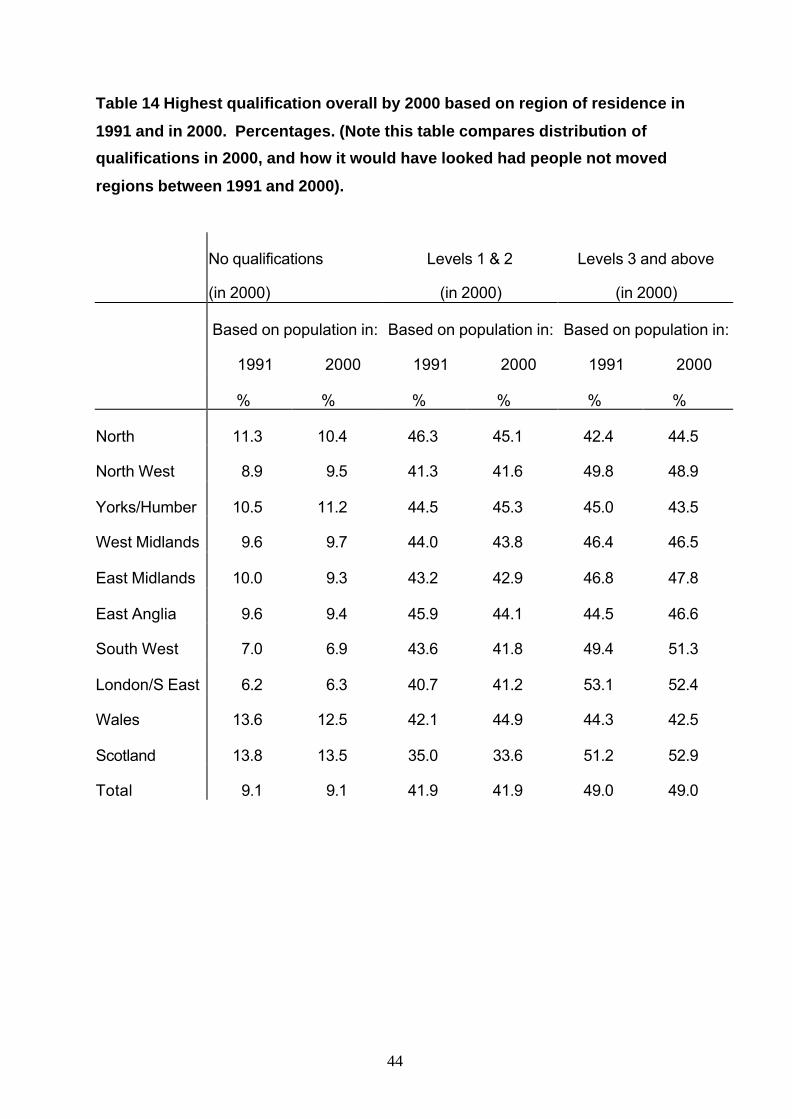
44
Table 14 Highest qualification overall by 2000 based on region of residence in
1991 and in 2000. Percentages. (Note this table compares distribution of
qualifications in 2000, and how it would have looked had people not moved
regions between 1991 and 2000).
No qualifications
(in 2000)
Levels 1 & 2
(in 2000)
Levels 3 and above
(in 2000)
Based on population in: Based on population in: Based on population in:
1991 2000 1991 2000 1991 2000
% % % % % %
North 11.3 10.4 46.3 45.1 42.4 44.5
North West 8.9 9.5 41.3 41.6 49.8 48.9
Yorks/Humber 10.5 11.2 44.5 45.3 45.0 43.5
West Midlands 9.6 9.7 44.0 43.8 46.4 46.5
East Midlands 10.0 9.3 43.2 42.9 46.8 47.8
East Anglia 9.6 9.4 45.9 44.1 44.5 46.6
South West 7.0 6.9 43.6 41.8 49.4 51.3
London/S East 6.2 6.3 40.7 41.2 53.1 52.4
Wales 13.6 12.5 42.1 44.9 44.3 42.5
Scotland 13.8 13.5 35.0 33.6 51.2 52.9
Total 9.1 9.1 41.9 41.9 49.0 49.0
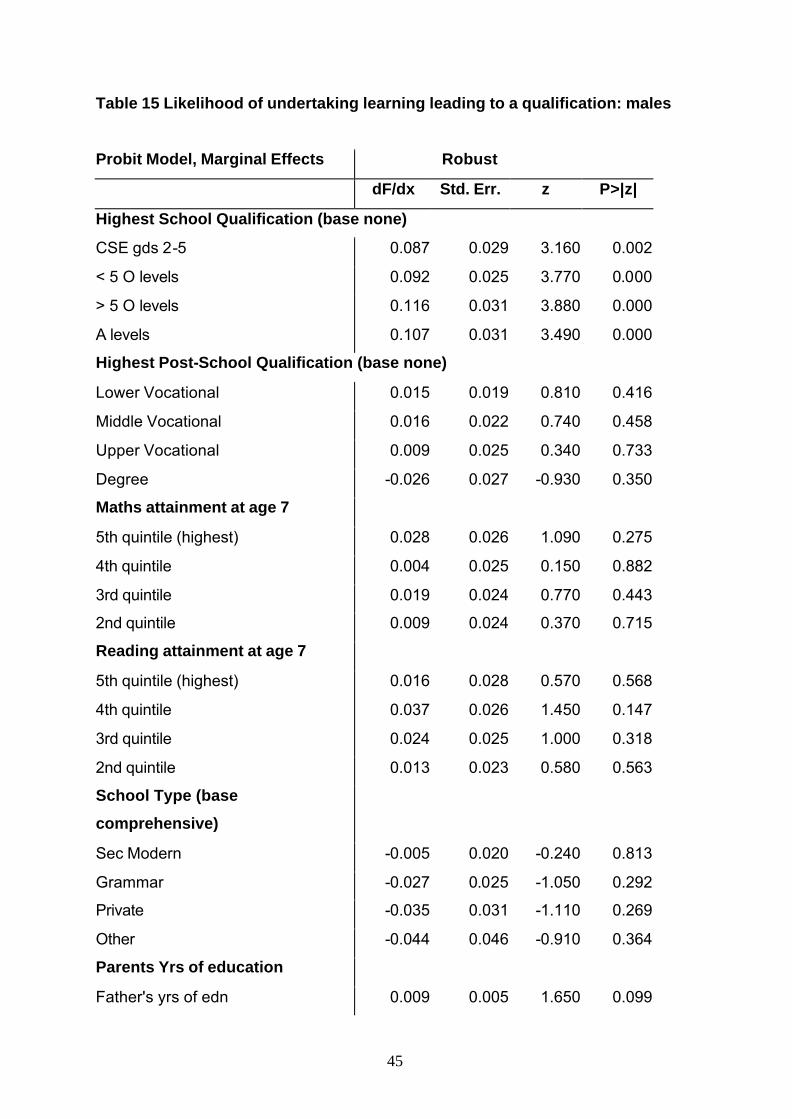
45
Table 15 Likelihood of undertaking learning leading to a qualification: males
Probit Model, Marginal Effects Robust
dF/dx Std. Err. z P>|z|
Highest School Qualification (base none)
CSE gds 2-5 0.087 0.029 3.160 0.002
< 5 O levels 0.092 0.025 3.770 0.000
> 5 O levels 0.116 0.031 3.880 0.000
A levels 0.107 0.031 3.490 0.000
Highest Post-School Qualification (base none)
Lower Vocational 0.015 0.019 0.810 0.416
Middle Vocational 0.016 0.022 0.740 0.458
Upper Vocational 0.009 0.025 0.340 0.733
Degree -0.026 0.027 -0.930 0.350
Maths attainment at age 7
5th quintile (highest) 0.028 0.026 1.090 0.275
4th quintile 0.004 0.025 0.150 0.882
3rd quintile 0.019 0.024 0.770 0.443
2nd quintile 0.009 0.024 0.370 0.715
Reading attainment at age 7
5th quintile (highest) 0.016 0.028 0.570 0.568
4th quintile 0.037 0.026 1.450 0.147
3rd quintile 0.024 0.025 1.000 0.318
2nd quintile 0.013 0.023 0.580 0.563
School Type (base
comprehensive)
Sec Modern -0.005 0.020 -0.240 0.813
Grammar -0.027 0.025 -1.050 0.292
Private -0.035 0.031 -1.110 0.269
Other -0.044 0.046 -0.910 0.364
Parents Yrs of education
Father's yrs of edn 0.009 0.005 1.650 0.099
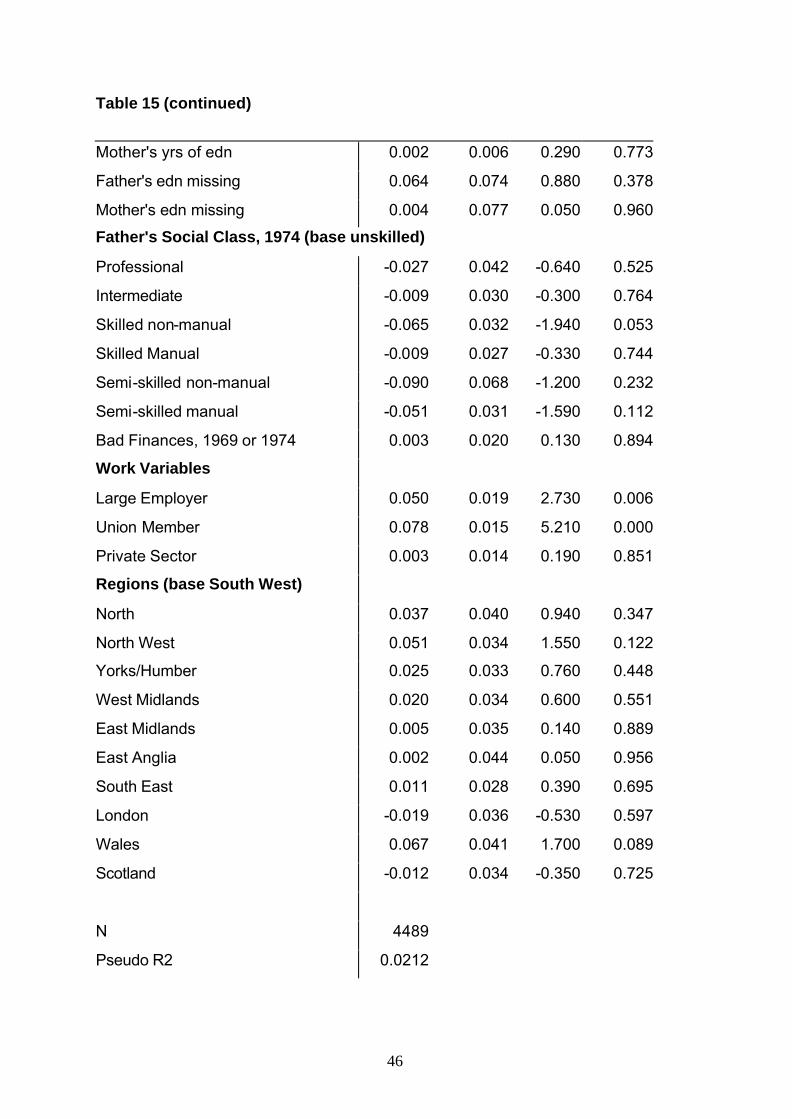
46
Table 15 (continued)
Mother's yrs of edn 0.002 0.006 0.290 0.773
Father's edn missing 0.064 0.074 0.880 0.378
Mother's edn missing 0.004 0.077 0.050 0.960
Father's Social Class, 1974 (base unskilled)
Professional -0.027 0.042 -0.640 0.525
Intermediate -0.009 0.030 -0.300 0.764
Skilled non-manual -0.065 0.032 -1.940 0.053
Skilled Manual -0.009 0.027 -0.330 0.744
Semi-skilled non-manual -0.090 0.068 -1.200 0.232
Semi-skilled manual -0.051 0.031 -1.590 0.112
Bad Finances, 1969 or 1974 0.003 0.020 0.130 0.894
Work Variables
Large Employer 0.050 0.019 2.730 0.006
Union Member 0.078 0.015 5.210 0.000
Private Sector 0.003 0.014 0.190 0.851
Regions (base South West)
North 0.037 0.040 0.940 0.347
North West 0.051 0.034 1.550 0.122
Yorks/Humber 0.025 0.033 0.760 0.448
West Midlands 0.020 0.034 0.600 0.551
East Midlands 0.005 0.035 0.140 0.889
East Anglia 0.002 0.044 0.050 0.956
South East 0.011 0.028 0.390 0.695
London -0.019 0.036 -0.530 0.597
Wales 0.067 0.041 1.700 0.089
Scotland -0.012 0.034 -0.350 0.725
N 4489
Pseudo R2 0.0212
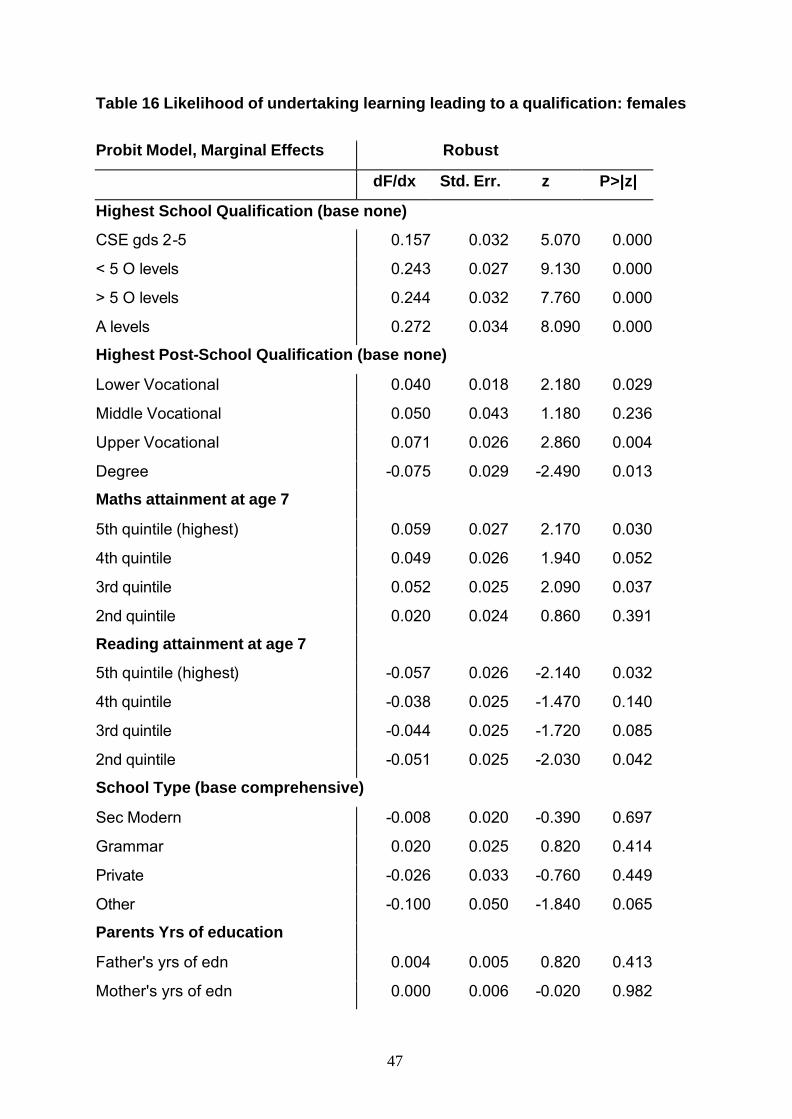
47
Table 16 Likelihood of undertaking learning leading to a qualification: females
Probit Model, Marginal Effects Robust
dF/dx Std. Err. z P>|z|
Highest School Qualification (base none)
CSE gds 2-5 0.157 0.032 5.070 0.000
< 5 O levels 0.243 0.027 9.130 0.000
> 5 O levels 0.244 0.032 7.760 0.000
A levels 0.272 0.034 8.090 0.000
Highest Post-School Qualification (base none)
Lower Vocational 0.040 0.018 2.180 0.029
Middle Vocational 0.050 0.043 1.180 0.236
Upper Vocational 0.071 0.026 2.860 0.004
Degree -0.075 0.029 -2.490 0.013
Maths attainment at age 7
5th quintile (highest) 0.059 0.027 2.170 0.030
4th quintile 0.049 0.026 1.940 0.052
3rd quintile 0.052 0.025 2.090 0.037
2nd quintile 0.020 0.024 0.860 0.391
Reading attainment at age 7
5th quintile (highest) -0.057 0.026 -2.140 0.032
4th quintile -0.038 0.025 -1.470 0.140
3rd quintile -0.044 0.025 -1.720 0.085
2nd quintile -0.051 0.025 -2.030 0.042
School Type (base comprehensive)
Sec Modern -0.008 0.020 -0.390 0.697
Grammar 0.020 0.025 0.820 0.414
Private -0.026 0.033 -0.760 0.449
Other -0.100 0.050 -1.840 0.065
Parents Yrs of education
Father's yrs of edn 0.004 0.005 0.820 0.413
Mother's yrs of edn 0.000 0.006 -0.020 0.982
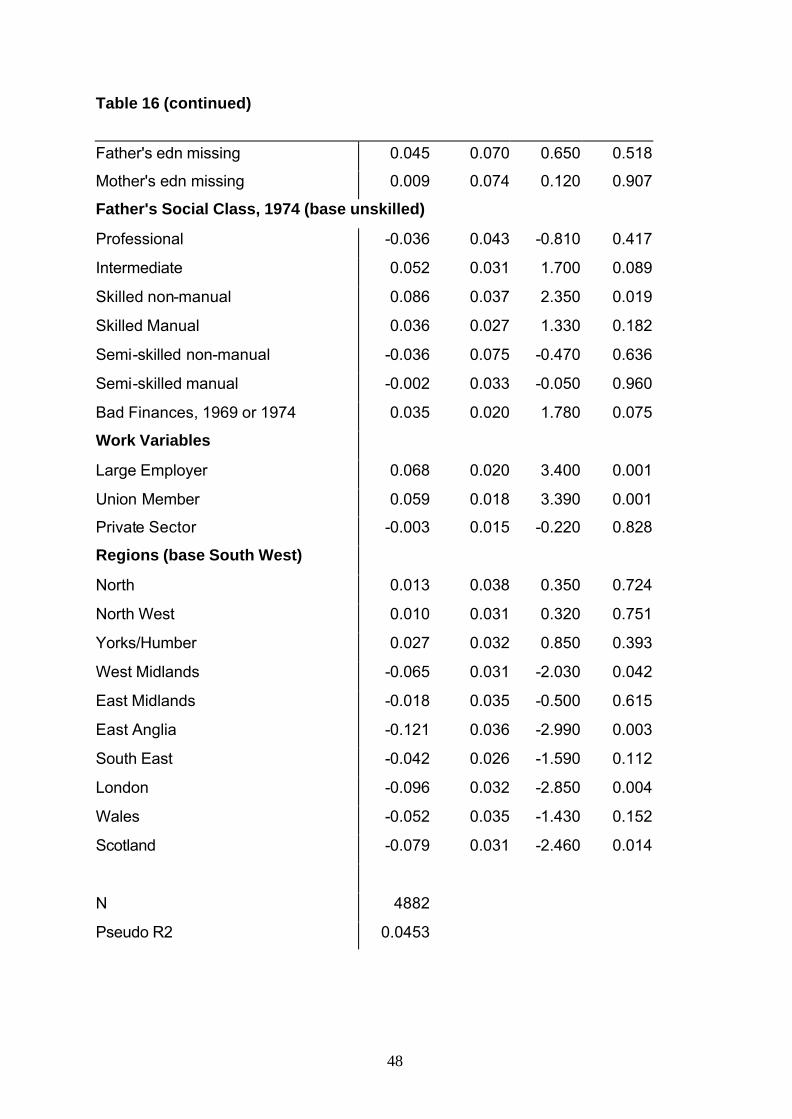
48
Table 16 (continued)
Father's edn missing 0.045 0.070 0.650 0.518
Mother's edn missing 0.009 0.074 0.120 0.907
Father's Social Class, 1974 (base unskilled)
Professional -0.036 0.043 -0.810 0.417
Intermediate 0.052 0.031 1.700 0.089
Skilled non-manual 0.086 0.037 2.350 0.019
Skilled Manual 0.036 0.027 1.330 0.182
Semi-skilled non-manual -0.036 0.075 -0.470 0.636
Semi-skilled manual -0.002 0.033 -0.050 0.960
Bad Finances, 1969 or 1974 0.035 0.020 1.780 0.075
Work Variables
Large Employer 0.068 0.020 3.400 0.001
Union Member 0.059 0.018 3.390 0.001
Private Sector -0.003 0.015 -0.220 0.828
Regions (base South West)
North 0.013 0.038 0.350 0.724
North West 0.010 0.031 0.320 0.751
Yorks/Humber 0.027 0.032 0.850 0.393
West Midlands -0.065 0.031 -2.030 0.042
East Midlands -0.018 0.035 -0.500 0.615
East Anglia -0.121 0.036 -2.990 0.003
South East -0.042 0.026 -1.590 0.112
London -0.096 0.032 -2.850 0.004
Wales -0.052 0.035 -1.430 0.152
Scotland -0.079 0.031 -2.460 0.014
N 4882
Pseudo R2 0.0453
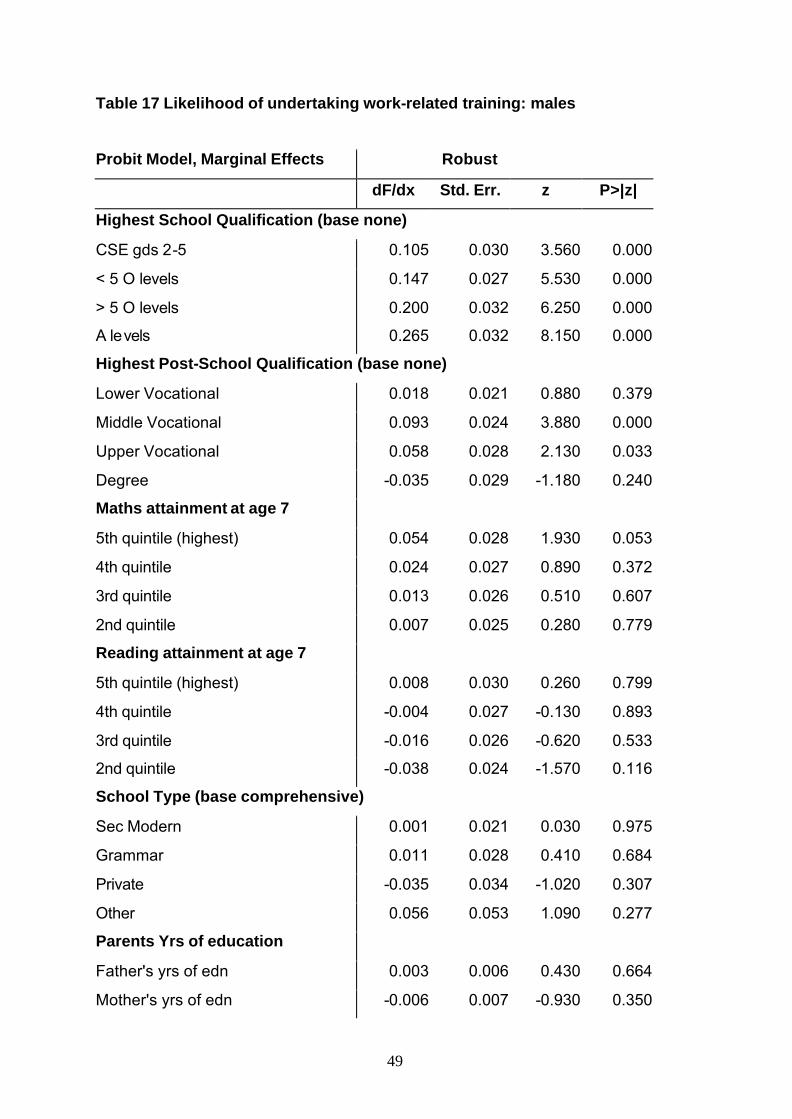
49
Table 17 Likelihood of undertaking work-related training: males
Probit Model, Marginal Effects Robust
dF/dx Std. Err. z P>|z|
Highest School Qualification (base none)
CSE gds 2-5 0.105 0.030 3.560 0.000
< 5 O levels 0.147 0.027 5.530 0.000
> 5 O levels 0.200 0.032 6.250 0.000
A levels 0.265 0.032 8.150 0.000
Highest Post-School Qualification (base none)
Lower Vocational 0.018 0.021 0.880 0.379
Middle Vocational 0.093 0.024 3.880 0.000
Upper Vocational 0.058 0.028 2.130 0.033
Degree -0.035 0.029 -1.180 0.240
Maths attainment at age 7
5th quintile (highest) 0.054 0.028 1.930 0.053
4th quintile 0.024 0.027 0.890 0.372
3rd quintile 0.013 0.026 0.510 0.607
2nd quintile 0.007 0.025 0.280 0.779
Reading attainment at age 7
5th quintile (highest) 0.008 0.030 0.260 0.799
4th quintile -0.004 0.027 -0.130 0.893
3rd quintile -0.016 0.026 -0.620 0.533
2nd quintile -0.038 0.024 -1.570 0.116
School Type (base comprehensive)
Sec Modern 0.001 0.021 0.030 0.975
Grammar 0.011 0.028 0.410 0.684
Private -0.035 0.034 -1.020 0.307
Other 0.056 0.053 1.090 0.277
Parents Yrs of education
Father's yrs of edn 0.003 0.006 0.430 0.664
Mother's yrs of edn -0.006 0.007 -0.930 0.350
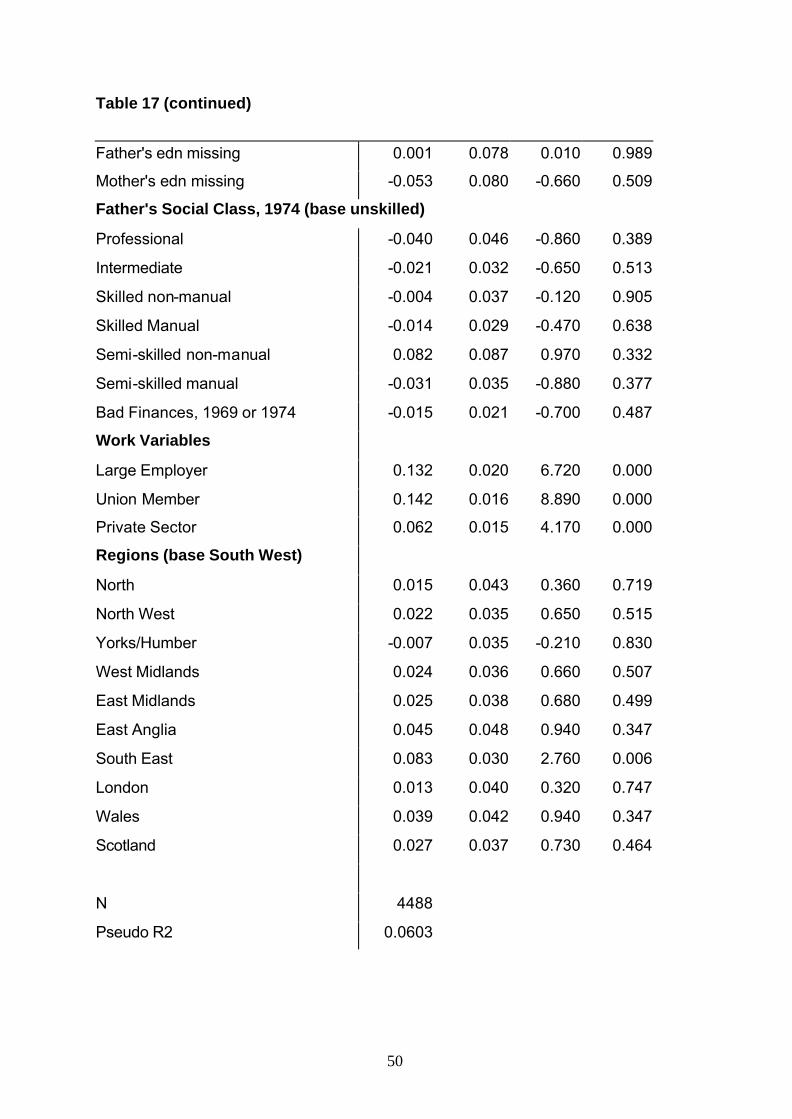
50
Table 17 (continued)
Father's edn missing 0.001 0.078 0.010 0.989
Mother's edn missing -0.053 0.080 -0.660 0.509
Father's Social Class, 1974 (base unskilled)
Professional -0.040 0.046 -0.860 0.389
Intermediate -0.021 0.032 -0.650 0.513
Skilled non-manual -0.004 0.037 -0.120 0.905
Skilled Manual -0.014 0.029 -0.470 0.638
Semi-skilled non-manual 0.082 0.087 0.970 0.332
Semi-skilled manual -0.031 0.035 -0.880 0.377
Bad Finances, 1969 or 1974 -0.015 0.021 -0.700 0.487
Work Variables
Large Employer 0.132 0.020 6.720 0.000
Union Member 0.142 0.016 8.890 0.000
Private Sector 0.062 0.015 4.170 0.000
Regions (base South West)
North 0.015 0.043 0.360 0.719
North West 0.022 0.035 0.650 0.515
Yorks/Humber -0.007 0.035 -0.210 0.830
West Midlands 0.024 0.036 0.660 0.507
East Midlands 0.025 0.038 0.680 0.499
East Anglia 0.045 0.048 0.940 0.347
South East 0.083 0.030 2.760 0.006
London 0.013 0.040 0.320 0.747
Wales 0.039 0.042 0.940 0.347
Scotland 0.027 0.037 0.730 0.464
N 4488
Pseudo R2 0.0603
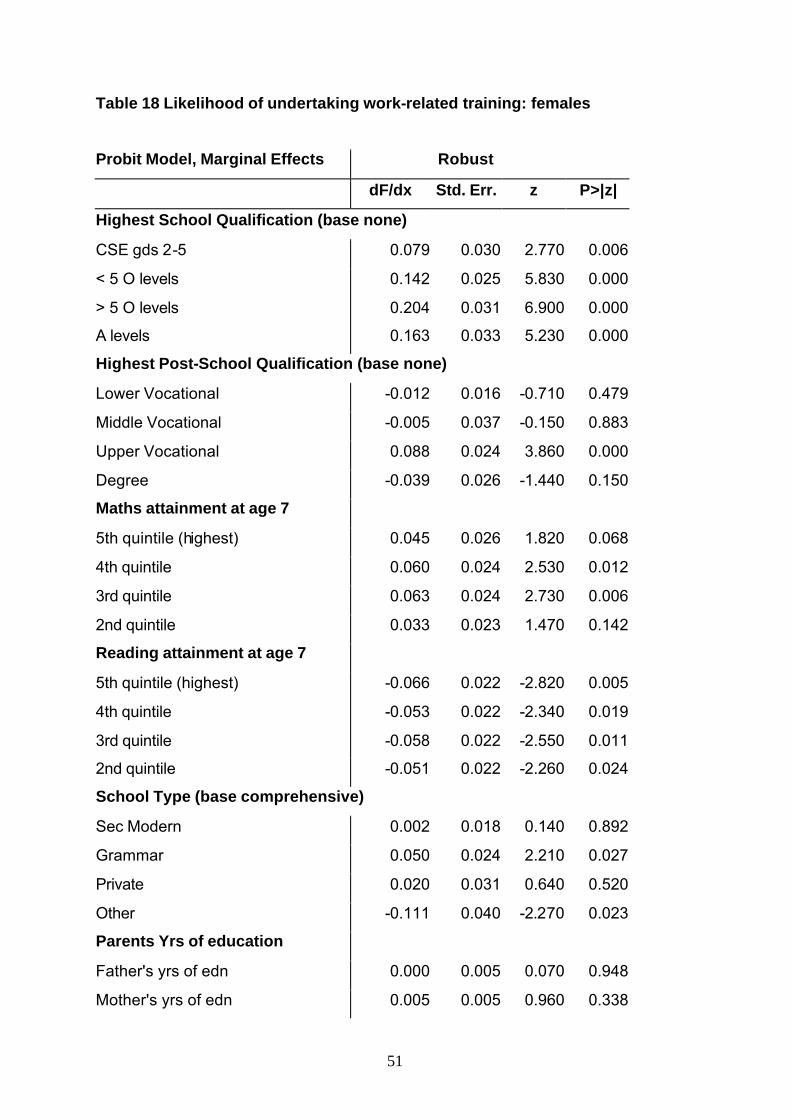
51
Table 18 Likelihood of undertaking work-related training: females
Probit Model, Marginal Effects Robust
dF/dx Std. Err. z P>|z|
Highest School Qualification (base none)
CSE gds 2-5 0.079 0.030 2.770 0.006
< 5 O levels 0.142 0.025 5.830 0.000
> 5 O levels 0.204 0.031 6.900 0.000
A levels 0.163 0.033 5.230 0.000
Highest Post-School Qualification (base none)
Lower Vocational -0.012 0.016 -0.710 0.479
Middle Vocational -0.005 0.037 -0.150 0.883
Upper Vocational 0.088 0.024 3.860 0.000
Degree -0.039 0.026 -1.440 0.150
Maths attainment at age 7
5th quintile (highest) 0.045 0.026 1.820 0.068
4th quintile 0.060 0.024 2.530 0.012
3rd quintile 0.063 0.024 2.730 0.006
2nd quintile 0.033 0.023 1.470 0.142
Reading attainment at age 7
5th quintile (highest) -0.066 0.022 -2.820 0.005
4th quintile -0.053 0.022 -2.340 0.019
3rd quintile -0.058 0.022 -2.550 0.011
2nd quintile -0.051 0.022 -2.260 0.024
School Type (base comprehensive)
Sec Modern 0.002 0.018 0.140 0.892
Grammar 0.050 0.024 2.210 0.027
Private 0.020 0.031 0.640 0.520
Other -0.111 0.040 -2.270 0.023
Parents Yrs of education
Father's yrs of edn 0.000 0.005 0.070 0.948
Mother's yrs of edn 0.005 0.005 0.960 0.338
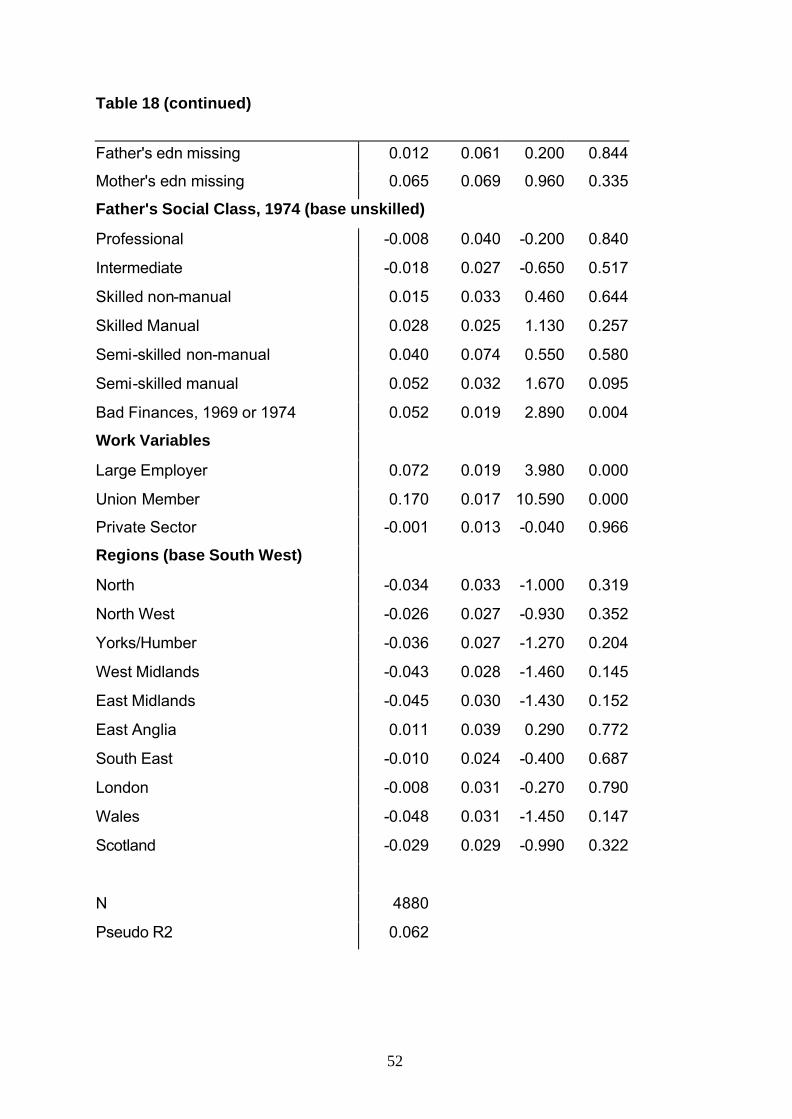
52
Table 18 (continued)
Father's edn missing 0.012 0.061 0.200 0.844
Mother's edn missing 0.065 0.069 0.960 0.335
Father's Social Class, 1974 (base unskilled)
Professional -0.008 0.040 -0.200 0.840
Intermediate -0.018 0.027 -0.650 0.517
Skilled non-manual 0.015 0.033 0.460 0.644
Skilled Manual 0.028 0.025 1.130 0.257
Semi-skilled non-manual 0.040 0.074 0.550 0.580
Semi-skilled manual 0.052 0.032 1.670 0.095
Bad Finances, 1969 or 1974 0.052 0.019 2.890 0.004
Work Variables
Large Employer 0.072 0.019 3.980 0.000
Union Member 0.170 0.017 10.590 0.000
Private Sector -0.001 0.013 -0.040 0.966
Regions (base South West)
North -0.034 0.033 -1.000 0.319
North West -0.026 0.027 -0.930 0.352
Yorks/Humber -0.036 0.027 -1.270 0.204
West Midlands -0.043 0.028 -1.460 0.145
East Midlands -0.045 0.030 -1.430 0.152
East Anglia 0.011 0.039 0.290 0.772
South East -0.010 0.024 -0.400 0.687
London -0.008 0.031 -0.270 0.790
Wales -0.048 0.031 -1.450 0.147
Scotland -0.029 0.029 -0.990 0.322
N 4880
Pseudo R2 0.062
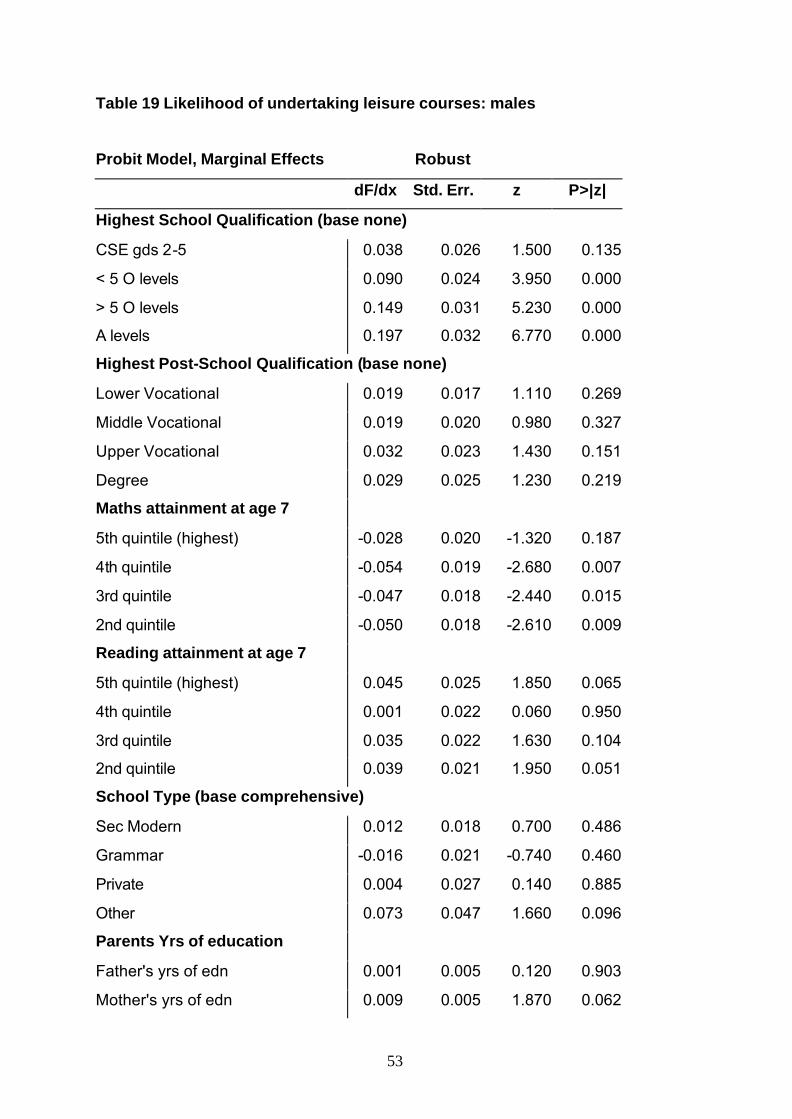
53
Table 19 Likelihood of undertaking leisure courses: males
Probit Model, Marginal Effects Robust
dF/dx Std. Err. z P>|z|
Highest School Qualification (base none)
CSE gds 2-5 0.038 0.026 1.500 0.135
< 5 O levels 0.090 0.024 3.950 0.000
> 5 O levels 0.149 0.031 5.230 0.000
A levels 0.197 0.032 6.770 0.000
Highest Post-School Qualification (base none)
Lower Vocational 0.019 0.017 1.110 0.269
Middle Vocational 0.019 0.020 0.980 0.327
Upper Vocational 0.032 0.023 1.430 0.151
Degree 0.029 0.025 1.230 0.219
Maths attainment at age 7
5th quintile (highest) -0.028 0.020 -1.320 0.187
4th quintile -0.054 0.019 -2.680 0.007
3rd quintile -0.047 0.018 -2.440 0.015
2nd quintile -0.050 0.018 -2.610 0.009
Reading attainment at age 7
5th quintile (highest) 0.045 0.025 1.850 0.065
4th quintile 0.001 0.022 0.060 0.950
3rd quintile 0.035 0.022 1.630 0.104
2nd quintile 0.039 0.021 1.950 0.051
School Type (base comprehensive)
Sec Modern 0.012 0.018 0.700 0.486
Grammar -0.016 0.021 -0.740 0.460
Private 0.004 0.027 0.140 0.885
Other 0.073 0.047 1.660 0.096
Parents Yrs of education
Father's yrs of edn 0.001 0.005 0.120 0.903
Mother's yrs of edn 0.009 0.005 1.870 0.062

54
Table 19 (continued)
Father's edn missing 0.010 0.062 0.170 0.868
Mother's edn missing 0.143 0.074 2.080 0.038
Father's Social Class, 1974 (base unskilled)
Professional 0.027 0.042 0.690 0.493
Intermediate 0.036 0.029 1.310 0.190
Skilled non-manual 0.054 0.034 1.680 0.094
Skilled Manual 0.037 0.025 1.480 0.140
Semi-skilled non-manual 0.110 0.085 1.450 0.147
Semi-skilled manual 0.020 0.032 0.660 0.512
Bad Finances, 1969 or 1974 0.013 0.018 0.740 0.462
Work Variables
Large Employer -0.009 0.015 -0.590 0.554
Union Member 0.022 0.013 1.720 0.086
Private Sector -0.015 0.012 -1.260 0.207
Regions (base South West)
North -0.023 0.031 -0.710 0.475
North West -0.008 0.027 -0.300 0.768
Yorks/Humber 0.003 0.028 0.120 0.903
West Midlands -0.003 0.028 -0.100 0.918
East Midlands 0.040 0.032 1.320 0.188
East Anglia -0.037 0.035 -0.980 0.326
South East 0.016 0.024 0.670 0.502
London 0.027 0.033 0.850 0.394
Wales 0.017 0.034 0.520 0.606
Scotland -0.041 0.026 -1.450 0.148
N 4487
Pseudo R2 0.0385

55
Table 20 Likelihood of undertaking leisure courses: females
Probit Model, Marginal Effects Robust
dF/dx Std. Err. z P>|z|
Highest School Qualification (base none)
CSE gds 2-5 0.132 0.032 4.300 0.000
< 5 O levels 0.150 0.027 5.680 0.000
> 5 O levels 0.224 0.033 7.140 0.000
A levels 0.296 0.035 8.830 0.000
Highest Post-School Qualification (base none)
Lower Vocational 0.063 0.018 3.650 0.000
Middle Vocational 0.129 0.043 3.180 0.001
Upper Vocational 0.049 0.024 2.120 0.034
Degree 0.055 0.030 1.880 0.059
Maths attainment at age 7
5th quintile (highest) -0.019 0.024 -0.810 0.420
4th quintile -0.028 0.022 -1.240 0.214
3rd quintile 0.002 0.022 0.100 0.921
2nd quintile -0.021 0.022 -0.970 0.333
Reading attainment at age 7
5th quintile (highest) 0.004 0.025 0.150 0.880
4th quintile 0.043 0.025 1.780 0.075
3rd quintile 0.003 0.024 0.130 0.898
2nd quintile 0.016 0.025 0.670 0.500
School Type (base comprehensive)
Sec Modern 0.017 0.019 0.920 0.358
Grammar 0.037 0.023 1.620 0.104
Private 0.079 0.033 2.490 0.013
Other -0.077 0.049 -1.430 0.152
Parents Yrs of education
Father's yrs of edn 0.010 0.005 2.060 0.039
Mother's yrs of edn 0.002 0.005 0.350 0.726
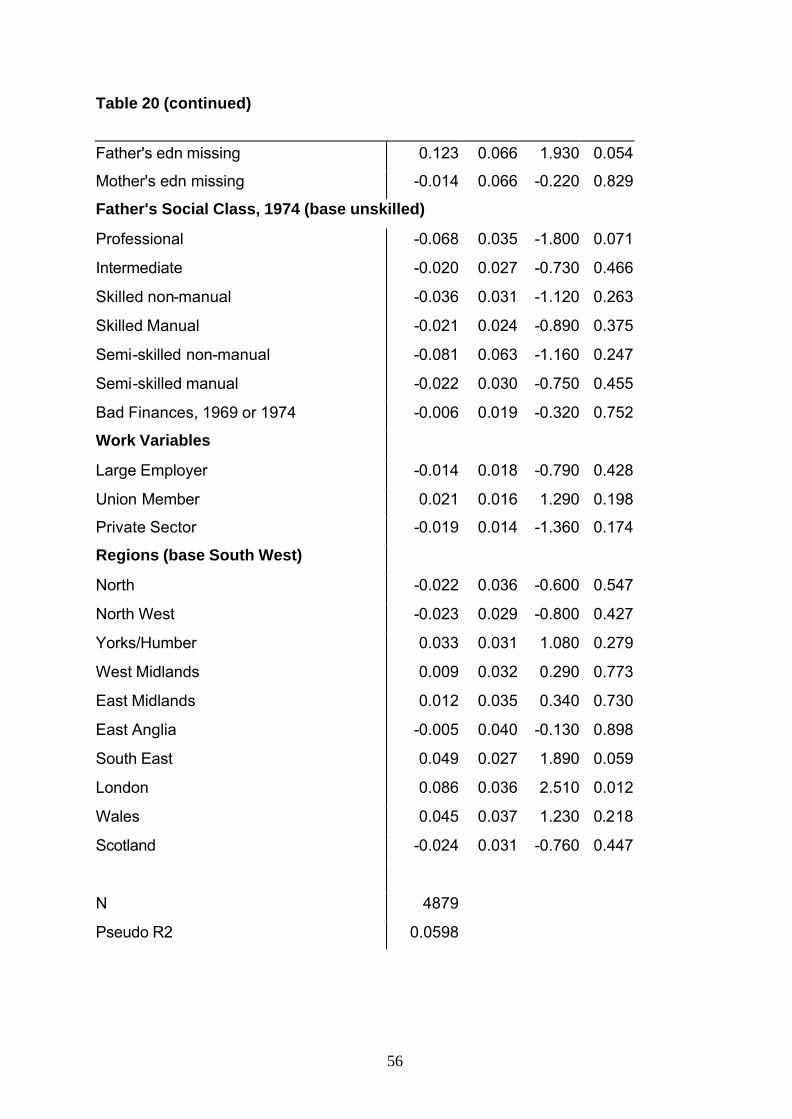
56
Table 20 (continued)
Father's edn missing 0.123 0.066 1.930 0.054
Mother's edn missing -0.014 0.066 -0.220 0.829
Father's Social Class, 1974 (base unskilled)
Professional -0.068 0.035 -1.800 0.071
Intermediate -0.020 0.027 -0.730 0.466
Skilled non-manual -0.036 0.031 -1.120 0.263
Skilled Manual -0.021 0.024 -0.890 0.375
Semi-skilled non-manual -0.081 0.063 -1.160 0.247
Semi-skilled manual -0.022 0.030 -0.750 0.455
Bad Finances, 1969 or 1974 -0.006 0.019 -0.320 0.752
Work Variables
Large Employer -0.014 0.018 -0.790 0.428
Union Member 0.021 0.016 1.290 0.198
Private Sector -0.019 0.014 -1.360 0.174
Regions (base South West)
North -0.022 0.036 -0.600 0.547
North West -0.023 0.029 -0.800 0.427
Yorks/Humber 0.033 0.031 1.080 0.279
West Midlands 0.009 0.032 0.290 0.773
East Midlands 0.012 0.035 0.340 0.730
East Anglia -0.005 0.040 -0.130 0.898
South East 0.049 0.027 1.890 0.059
London 0.086 0.036 2.510 0.012
Wales 0.045 0.037 1.230 0.218
Scotland -0.024 0.031 -0.760 0.447
N 4879
Pseudo R2 0.0598
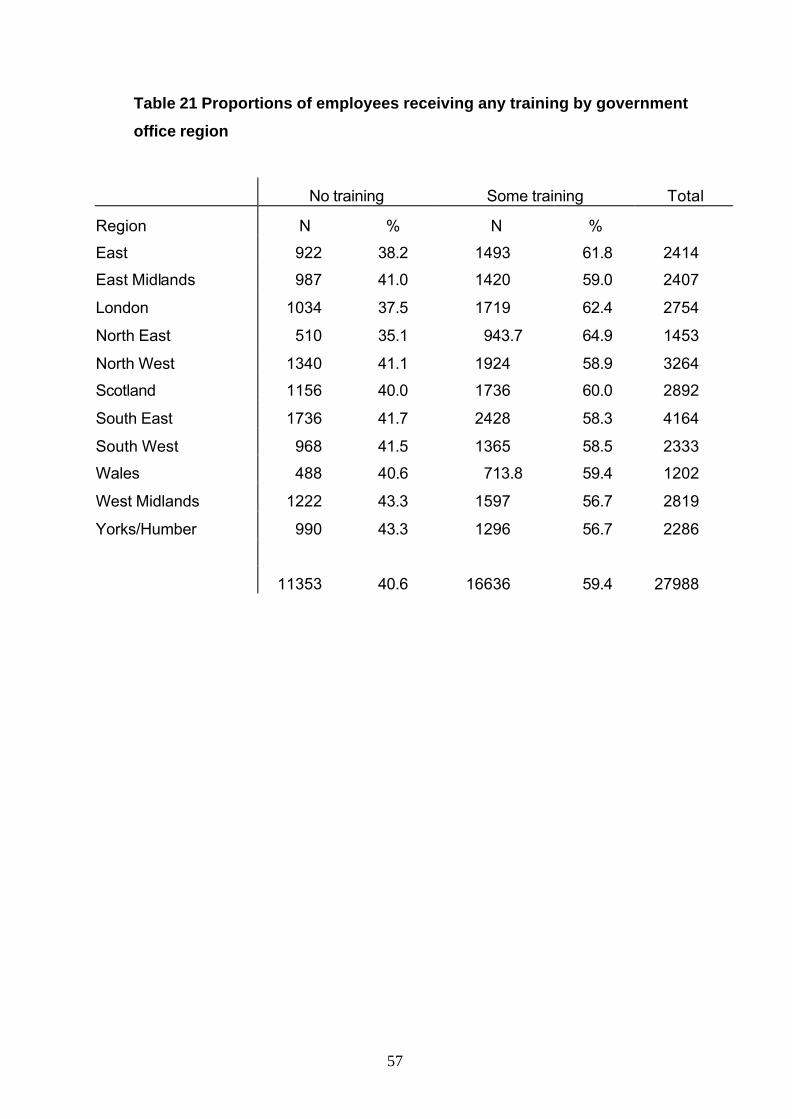
57
Table 21 Proportions of employees receiving any training by government
office region
No training Some training Total
Region N % N %
East 922 38.2 1493 61.8 2414
East Midlands 987 41.0 1420 59.0 2407
London 1034 37.5 1719 62.4 2754
North East 510 35.1 943.7 64.9 1453
North West 1340 41.1 1924 58.9 3264
Scotland 1156 40.0 1736 60.0 2892
South East 1736 41.7 2428 58.3 4164
South West 968 41.5 1365 58.5 2333
Wales 488 40.6 713.8 59.4 1202
West Midlands 1222 43.3 1597 56.7 2819
Yorks/Humber 990 43.3 1296 56.7 2286
11353 40.6 16636 59.4 27988
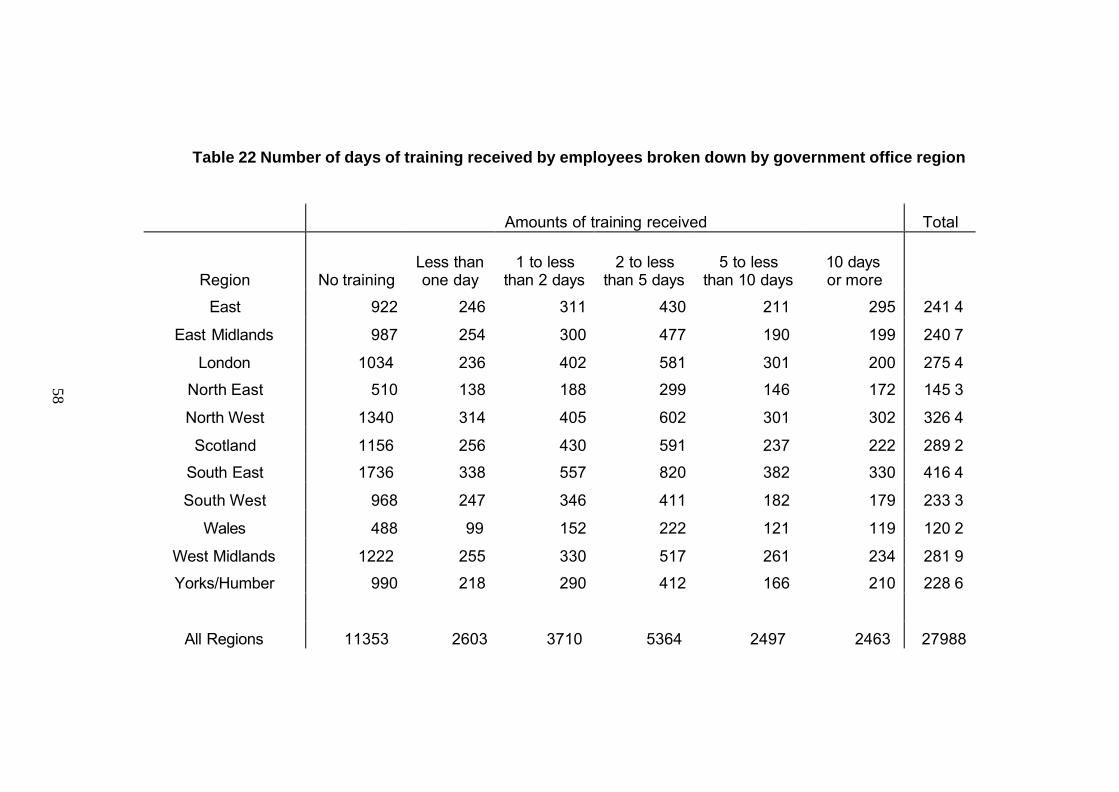
58
Table 22 Number of days of training received by employees broken down by government office region
Amounts of training received Total
Region No training Less than one day
1 to less than 2 days
2 to less than 5 days
5 to less than 10 days
10 days or more
East 922 246 311 430 211 295 241 4
East Midlands 987 254 300 477 190 199 240 7
London 1034 236 402 581 301 200 275 4
North East 510 138 188 299 146 172 145 3
North West 1340 314 405 602 301 302 326 4
Scotland 1156 256 430 591 237 222 289 2
South East 1736 338 557 820 382 330 416 4
South West 968 247 346 411 182 179 233 3
Wales 488 99 152 222 121 119 120 2
West Midlands 1222 255 330 517 261 234 281 9
Yorks/Humber 990 218 290 412 166 210 228 6
All Regions 11353 2603 3710 5364 2497 2463 27988
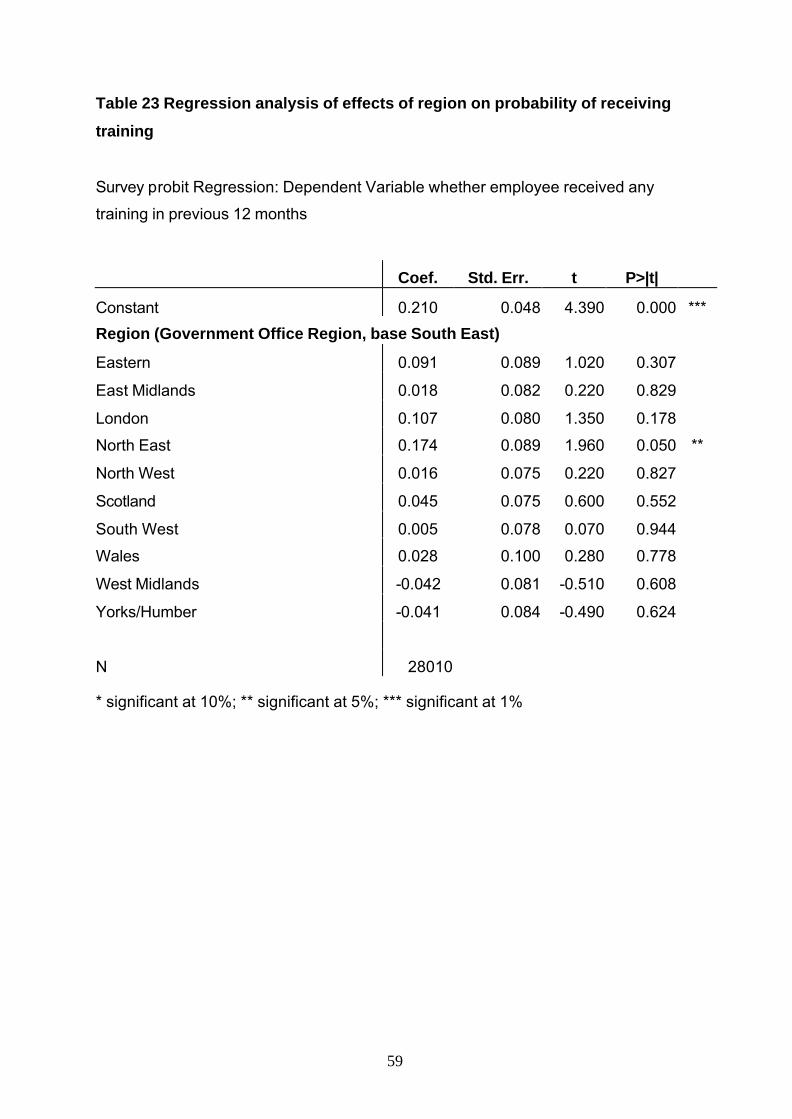
59
Table 23 Regression analysis of effects of region on probability of receiving
training
Survey probit Regression: Dependent Variable whether employee received any
training in previous 12 months
Coef. Std. Err. t P>|t|
Constant 0.210 0.048 4.390 0.000 *** Region (Government Office Region, base South East)
Eastern 0.091 0.089 1.020 0.307
East Midlands 0.018 0.082 0.220 0.829
London 0.107 0.080 1.350 0.178
North East 0.174 0.089 1.960 0.050 **
North West 0.016 0.075 0.220 0.827
Scotland 0.045 0.075 0.600 0.552
South West 0.005 0.078 0.070 0.944
Wales 0.028 0.100 0.280 0.778
West Midlands -0.042 0.081 -0.510 0.608
Yorks/Humber -0.041 0.084 -0.490 0.624
N 28010
* significant at 10%; ** significant at 5%; *** significant at 1%
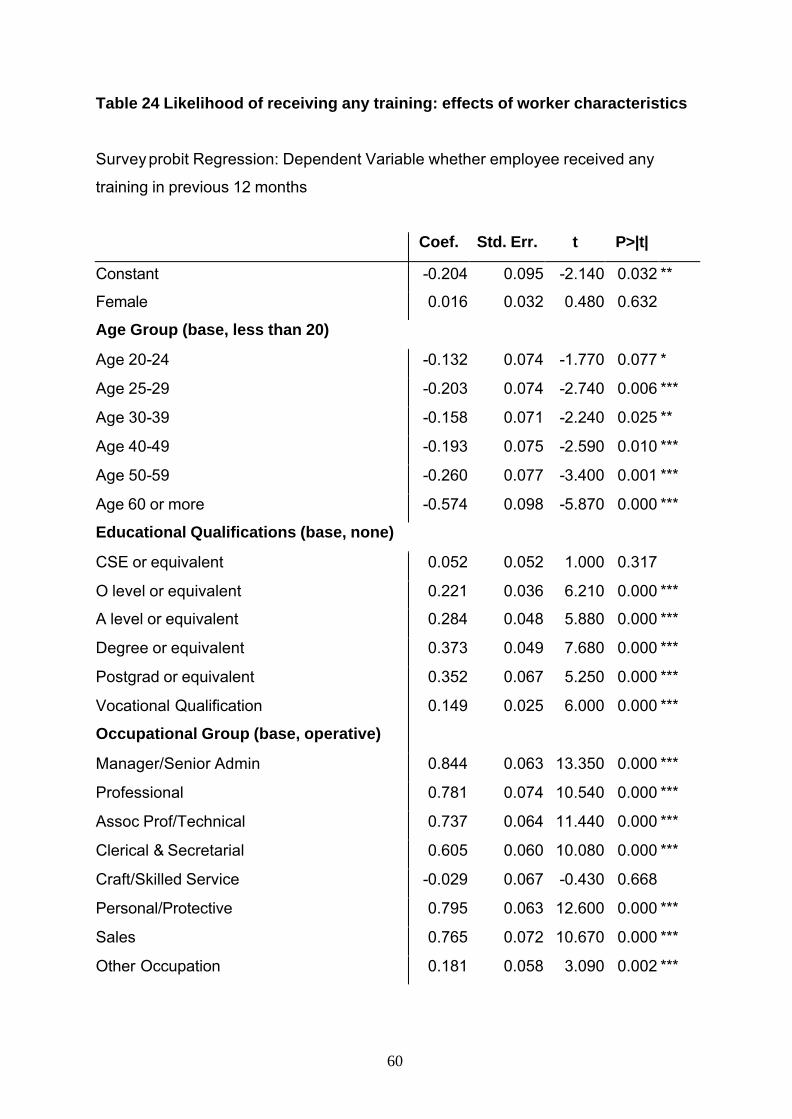
60
Table 24 Likelihood of receiving any training: effects of worker characteristics
Survey probit Regression: Dependent Variable whether employee received any
training in previous 12 months
Coef. Std. Err. t P>|t|
Constant -0.204 0.095 -2.140 0.032 **
Female 0.016 0.032 0.480 0.632
Age Group (base, less than 20)
Age 20-24 -0.132 0.074 -1.770 0.077 *
Age 25-29 -0.203 0.074 -2.740 0.006 ***
Age 30-39 -0.158 0.071 -2.240 0.025 **
Age 40-49 -0.193 0.075 -2.590 0.010 ***
Age 50-59 -0.260 0.077 -3.400 0.001 ***
Age 60 or more -0.574 0.098 -5.870 0.000 ***
Educational Qualifications (base, none)
CSE or equivalent 0.052 0.052 1.000 0.317
O level or equivalent 0.221 0.036 6.210 0.000 ***
A level or equivalent 0.284 0.048 5.880 0.000 ***
Degree or equivalent 0.373 0.049 7.680 0.000 ***
Postgrad or equivalent 0.352 0.067 5.250 0.000 ***
Vocational Qualification 0.149 0.025 6.000 0.000 ***
Occupational Group (base, operative)
Manager/Senior Admin 0.844 0.063 13.350 0.000 ***
Professional 0.781 0.074 10.540 0.000 ***
Assoc Prof/Technical 0.737 0.064 11.440 0.000 ***
Clerical & Secretarial 0.605 0.060 10.080 0.000 ***
Craft/Skilled Service -0.029 0.067 -0.430 0.668
Personal/Protective 0.795 0.063 12.600 0.000 ***
Sales 0.765 0.072 10.670 0.000 ***
Other Occupation 0.181 0.058 3.090 0.002 ***
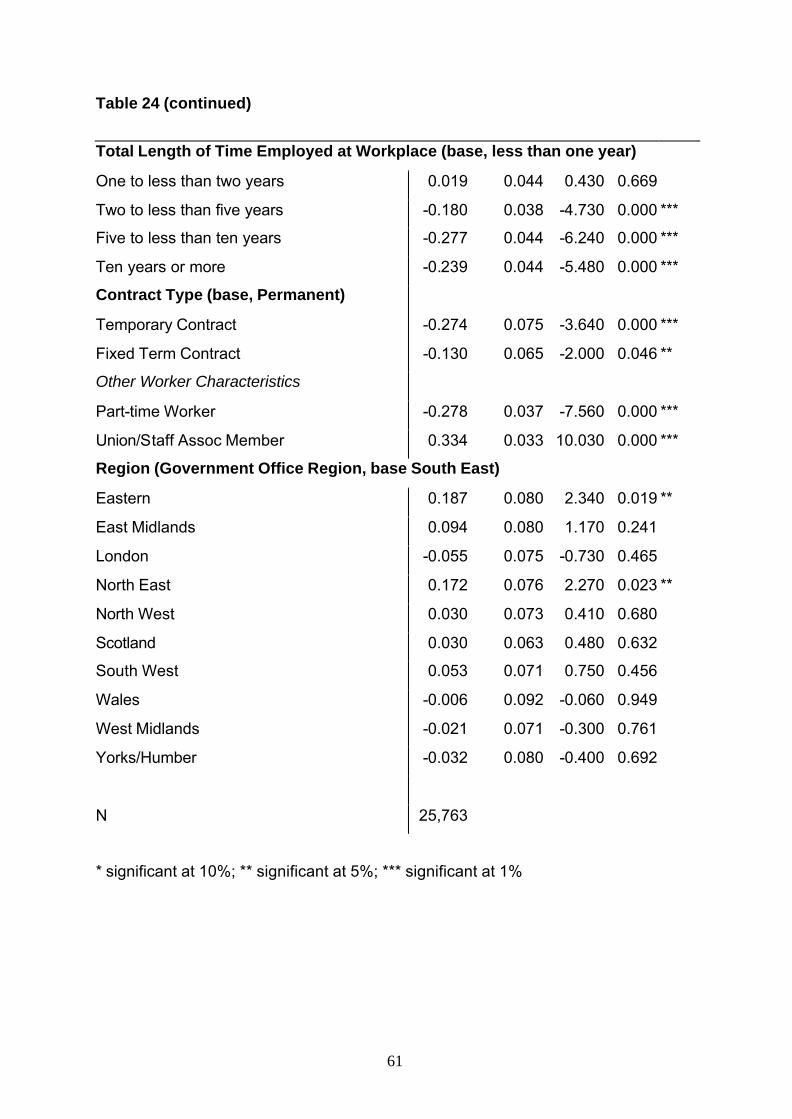
61
Table 24 (continued)
Total Length of Time Employed at Workplace (base, less than one year)
One to less than two years 0.019 0.044 0.430 0.669
Two to less than five years -0.180 0.038 -4.730 0.000 ***
Five to less than ten years -0.277 0.044 -6.240 0.000 ***
Ten years or more -0.239 0.044 -5.480 0.000 ***
Contract Type (base, Permanent)
Temporary Contract -0.274 0.075 -3.640 0.000 ***
Fixed Term Contract -0.130 0.065 -2.000 0.046 **
Other Worker Characteristics
Part-time Worker -0.278 0.037 -7.560 0.000 ***
Union/Staff Assoc Member 0.334 0.033 10.030 0.000 ***
Region (Government Office Region, base South East)
Eastern 0.187 0.080 2.340 0.019 **
East Midlands 0.094 0.080 1.170 0.241
London -0.055 0.075 -0.730 0.465
North East 0.172 0.076 2.270 0.023 **
North West 0.030 0.073 0.410 0.680
Scotland 0.030 0.063 0.480 0.632
South West 0.053 0.071 0.750 0.456
Wales -0.006 0.092 -0.060 0.949
West Midlands -0.021 0.071 -0.300 0.761
Yorks/Humber -0.032 0.080 -0.400 0.692
N 25,763
* significant at 10%; ** significant at 5%; *** significant at 1%

62
Table 25 Likelihood of receiving any training: effects of workplace
characteristics
Survey probit Regression: Dependent Variable whether employee received any
training in previous 12 months
Coef. Std. Err. t P>|t|
Constant -0.645 0.084 -7.690 0.000 ***
Establishment Size (base 10 to 24 Employees)
25 to 49 Employees -0.071 0.067 -1.070 0.284
50 to 99 Employees 0.102 0.067 1.530 0.127
100 to 199 Employees 0.025 0.065 0.380 0.702
200 to 499 Employees 0.062 0.067 0.920 0.358
500 + Employees 0.160 0.069 2.330 0.020 **
Part of Larger Organisation 0.343 0.050 6.850 0.000 ***
Industrial Sector (base, manufacturing)
Electricity, Gas, Water 0.925 0.090 10.230 0.000 ***
Construction 0.335 0.095 3.530 0.000 ***
Wholesale/Retail 0.298 0.059 5.040 0.000 ***
Hotels/Restaurants 0.470 0.082 5.760 0.000 ***
Transport/Communication 0.091 0.080 1.130 0.259
Financial Services 0.666 0.086 7.780 0.000 ***
Other Business Services 0.434 0.082 5.310 0.000 ***
Public Administration 0.849 0.071 11.910 0.000 ***
Education 0.442 0.067 6.610 0.000 ***
Health 0.609 0.062 9.880 0.000 ***
Other Community Services 0.245 0.096 2.550 0.011 **
Some Other Workplace Characteristics
Presence of Personnel Specialist 0.226 0.051 4.440 0.000 ***
Investor in People 0.094 0.038 2.480 0.013 **
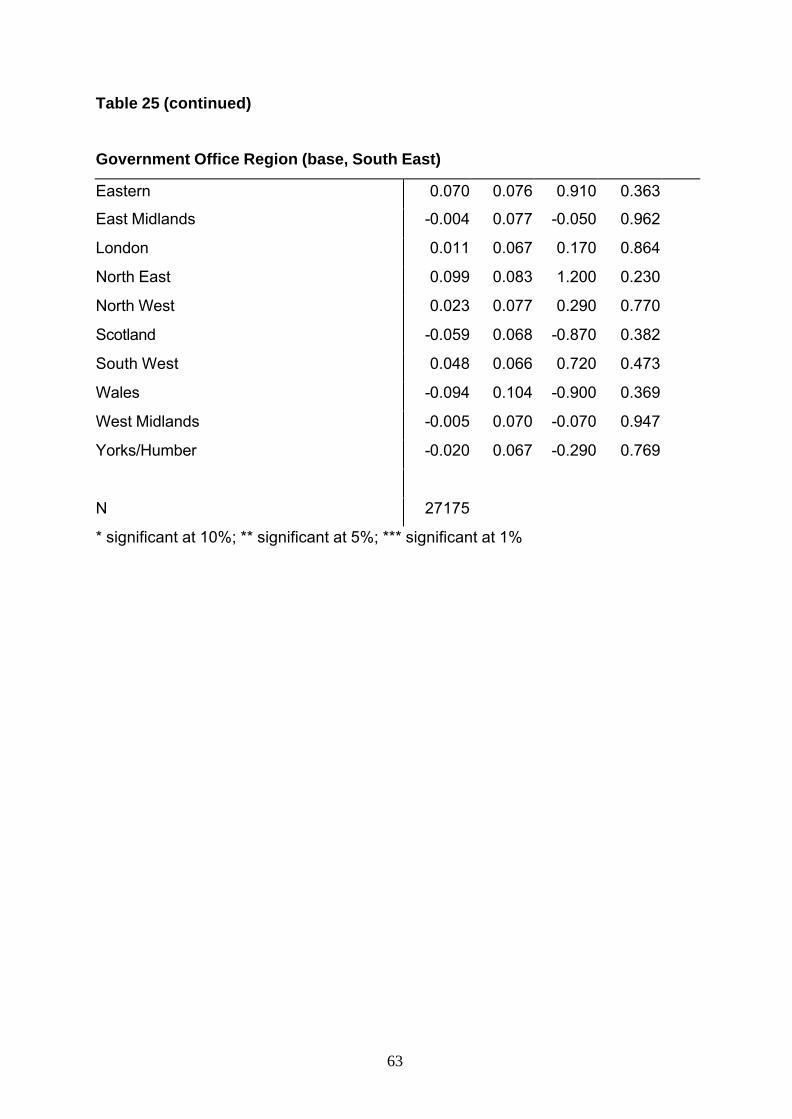
63
Table 25 (continued)
Government Office Region (base, South East)
Eastern 0.070 0.076 0.910 0.363
East Midlands -0.004 0.077 -0.050 0.962
London 0.011 0.067 0.170 0.864
North East 0.099 0.083 1.200 0.230
North West 0.023 0.077 0.290 0.770
Scotland -0.059 0.068 -0.870 0.382
South West 0.048 0.066 0.720 0.473
Wales -0.094 0.104 -0.900 0.369
West Midlands -0.005 0.070 -0.070 0.947
Yorks/Humber -0.020 0.067 -0.290 0.769
N 27175
* significant at 10%; ** significant at 5%; *** significant at 1%
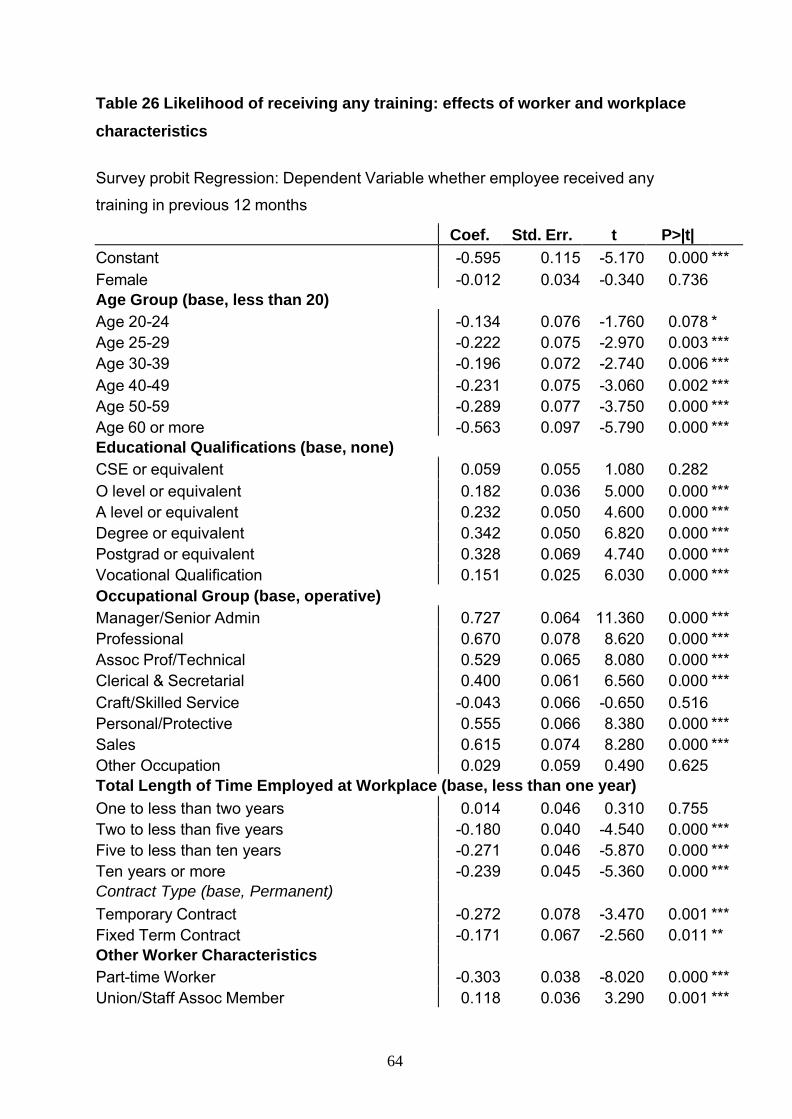
64
Table 26 Likelihood of receiving any training: effects of worker and workplace
characteristics
Survey probit Regression: Dependent Variable whether employee received any
training in previous 12 months
Coef. Std. Err. t P>|t| Constant -0.595 0.115 -5.170 0.000 *** Female -0.012 0.034 -0.340 0.736 Age Group (base, less than 20) Age 20-24 -0.134 0.076 -1.760 0.078 * Age 25-29 -0.222 0.075 -2.970 0.003 *** Age 30-39 -0.196 0.072 -2.740 0.006 *** Age 40-49 -0.231 0.075 -3.060 0.002 *** Age 50-59 -0.289 0.077 -3.750 0.000 *** Age 60 or more -0.563 0.097 -5.790 0.000 *** Educational Qualifications (base, none) CSE or equivalent 0.059 0.055 1.080 0.282 O level or equivalent 0.182 0.036 5.000 0.000 *** A level or equivalent 0.232 0.050 4.600 0.000 *** Degree or equivalent 0.342 0.050 6.820 0.000 *** Postgrad or equivalent 0.328 0.069 4.740 0.000 *** Vocational Qualification 0.151 0.025 6.030 0.000 *** Occupational Group (base, operative) Manager/Senior Admin 0.727 0.064 11.360 0.000 *** Professional 0.670 0.078 8.620 0.000 *** Assoc Prof/Technical 0.529 0.065 8.080 0.000 *** Clerical & Secretarial 0.400 0.061 6.560 0.000 *** Craft/Skilled Service -0.043 0.066 -0.650 0.516 Personal/Protective 0.555 0.066 8.380 0.000 *** Sales 0.615 0.074 8.280 0.000 *** Other Occupation 0.029 0.059 0.490 0.625 Total Length of Time Employed at Workplace (base, less than one year) One to less than two years 0.014 0.046 0.310 0.755 Two to less than five years -0.180 0.040 -4.540 0.000 *** Five to less than ten years -0.271 0.046 -5.870 0.000 *** Ten years or more -0.239 0.045 -5.360 0.000 *** Contract Type (base, Permanent) Temporary Contract -0.272 0.078 -3.470 0.001 *** Fixed Term Contract -0.171 0.067 -2.560 0.011 ** Other Worker Characteristics Part-time Worker -0.303 0.038 -8.020 0.000 *** Union/Staff Assoc Member 0.118 0.036 3.290 0.001 ***
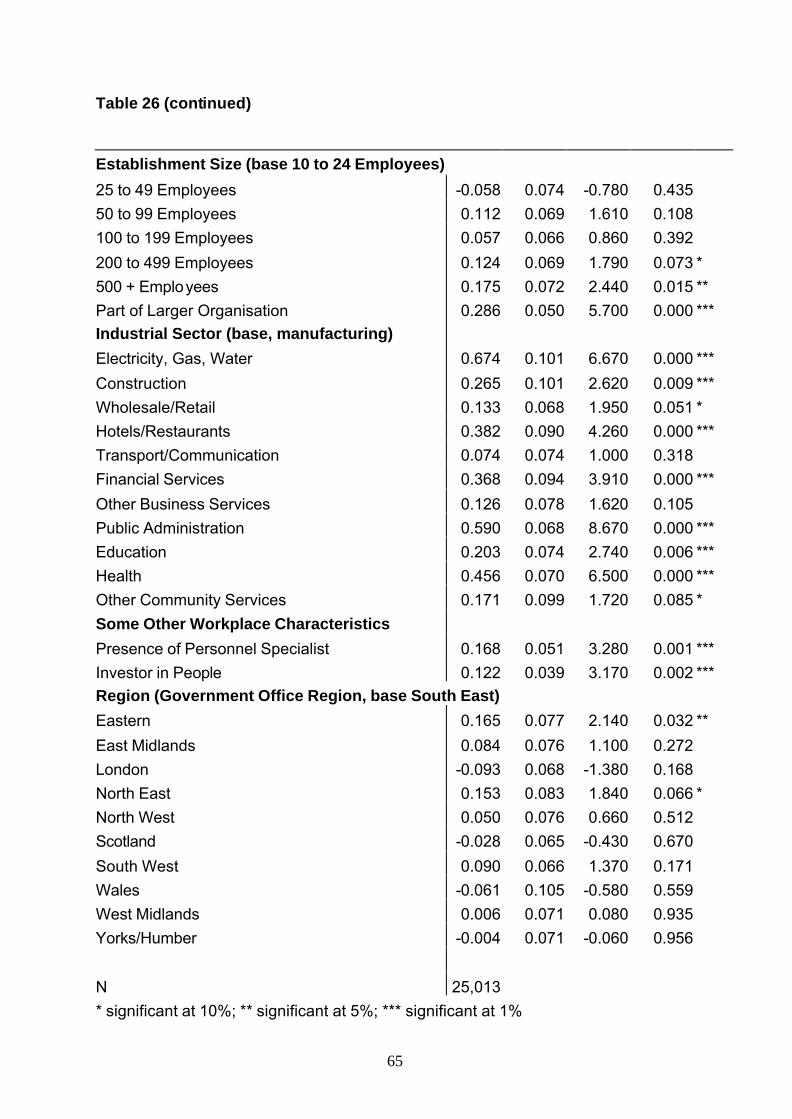
65
Table 26 (continued)
Establishment Size (base 10 to 24 Employees) 25 to 49 Employees -0.058 0.074 -0.780 0.435 50 to 99 Employees 0.112 0.069 1.610 0.108 100 to 199 Employees 0.057 0.066 0.860 0.392 200 to 499 Employees 0.124 0.069 1.790 0.073 * 500 + Employees 0.175 0.072 2.440 0.015 ** Part of Larger Organisation 0.286 0.050 5.700 0.000 *** Industrial Sector (base, manufacturing) Electricity, Gas, Water 0.674 0.101 6.670 0.000 *** Construction 0.265 0.101 2.620 0.009 *** Wholesale/Retail 0.133 0.068 1.950 0.051 * Hotels/Restaurants 0.382 0.090 4.260 0.000 *** Transport/Communication 0.074 0.074 1.000 0.318 Financial Services 0.368 0.094 3.910 0.000 *** Other Business Services 0.126 0.078 1.620 0.105 Public Administration 0.590 0.068 8.670 0.000 *** Education 0.203 0.074 2.740 0.006 *** Health 0.456 0.070 6.500 0.000 *** Other Community Services 0.171 0.099 1.720 0.085 * Some Other Workplace Characteristics Presence of Personnel Specialist 0.168 0.051 3.280 0.001 *** Investor in People 0.122 0.039 3.170 0.002 *** Region (Government Office Region, base South East) Eastern 0.165 0.077 2.140 0.032 ** East Midlands 0.084 0.076 1.100 0.272 London -0.093 0.068 -1.380 0.168 North East 0.153 0.083 1.840 0.066 * North West 0.050 0.076 0.660 0.512 Scotland -0.028 0.065 -0.430 0.670 South West 0.090 0.066 1.370 0.171 Wales -0.061 0.105 -0.580 0.559 West Midlands 0.006 0.071 0.080 0.935 Yorks/Humber -0.004 0.071 -0.060 0.956 N 25,013 * significant at 10%; ** significant at 5%; *** significant at 1%
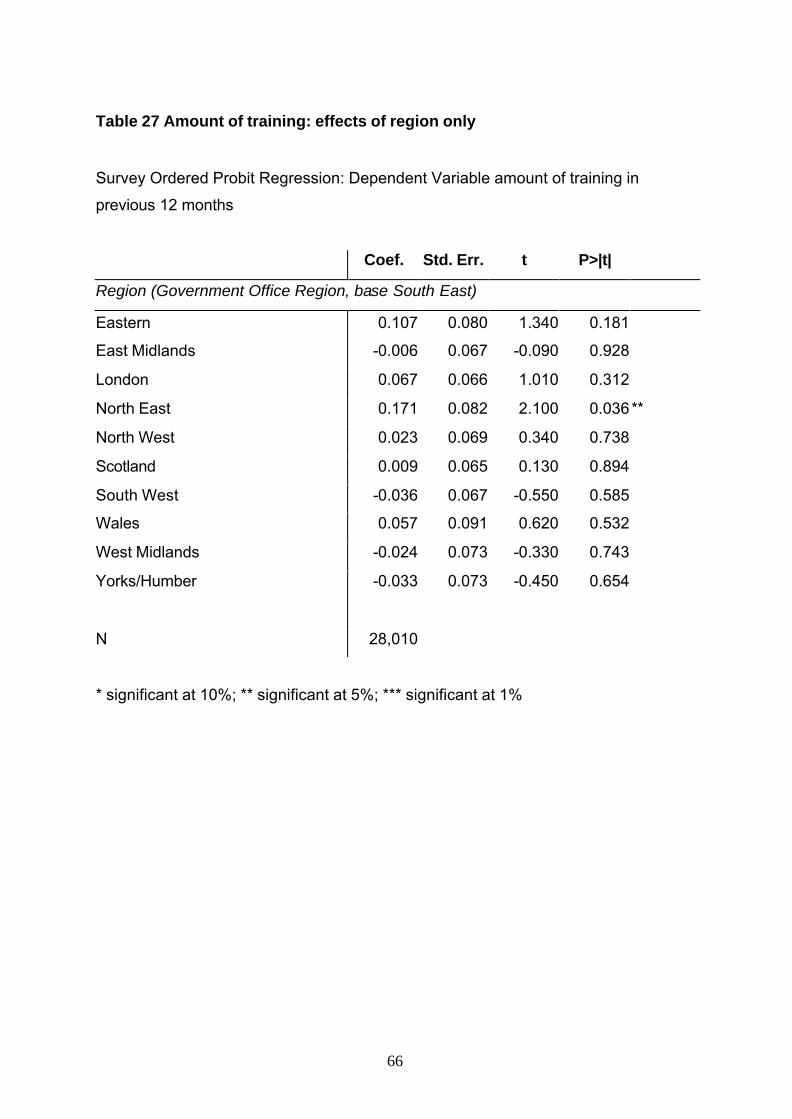
66
Table 27 Amount of training: effects of region only
Survey Ordered Probit Regression: Dependent Variable amount of training in
previous 12 months
Coef. Std. Err. t P>|t|
Region (Government Office Region, base South East)
Eastern 0.107 0.080 1.340 0.181
East Midlands -0.006 0.067 -0.090 0.928
London 0.067 0.066 1.010 0.312
North East 0.171 0.082 2.100 0.036 **
North West 0.023 0.069 0.340 0.738
Scotland 0.009 0.065 0.130 0.894
South West -0.036 0.067 -0.550 0.585
Wales 0.057 0.091 0.620 0.532
West Midlands -0.024 0.073 -0.330 0.743
Yorks/Humber -0.033 0.073 -0.450 0.654
N 28,010
* significant at 10%; ** significant at 5%; *** significant at 1%
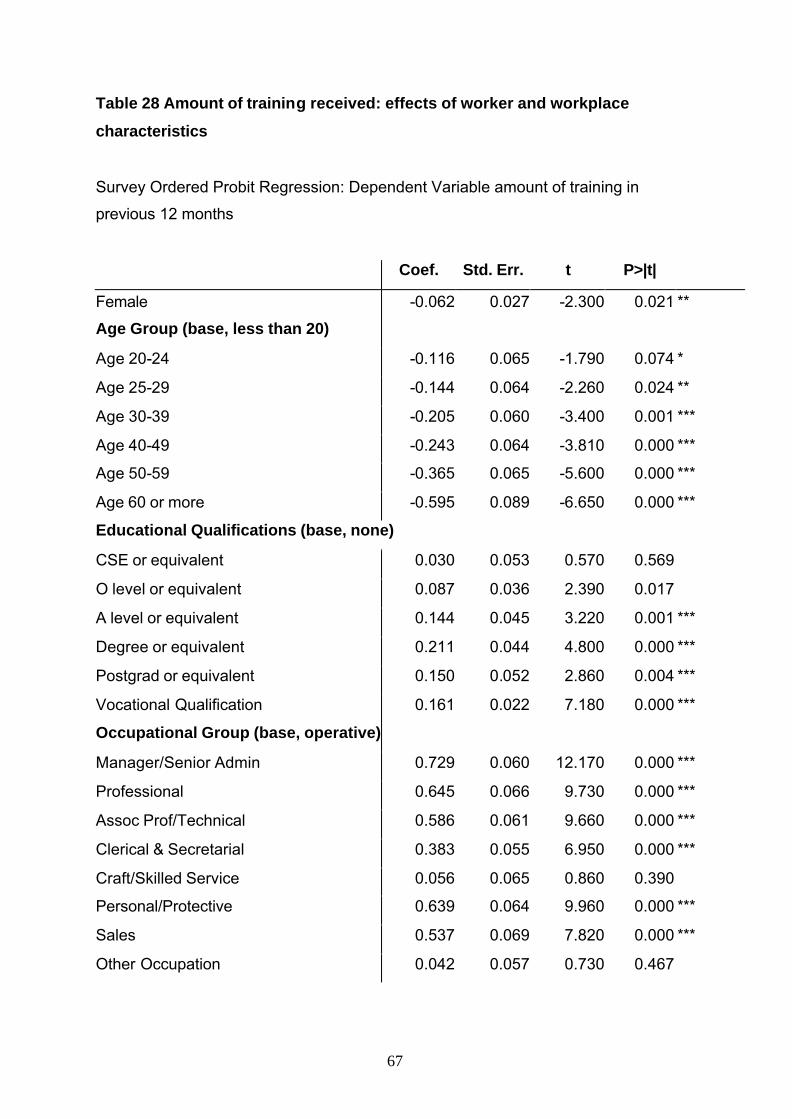
67
Table 28 Amount of training received: effects of worker and workplace
characteristics
Survey Ordered Probit Regression: Dependent Variable amount of training in
previous 12 months
Coef. Std. Err. t P>|t|
Female -0.062 0.027 -2.300 0.021 **
Age Group (base, less than 20)
Age 20-24 -0.116 0.065 -1.790 0.074 *
Age 25-29 -0.144 0.064 -2.260 0.024 **
Age 30-39 -0.205 0.060 -3.400 0.001 ***
Age 40-49 -0.243 0.064 -3.810 0.000 ***
Age 50-59 -0.365 0.065 -5.600 0.000 ***
Age 60 or more -0.595 0.089 -6.650 0.000 ***
Educational Qualifications (base, none)
CSE or equivalent 0.030 0.053 0.570 0.569
O level or equivalent 0.087 0.036 2.390 0.017
A level or equivalent 0.144 0.045 3.220 0.001 ***
Degree or equivalent 0.211 0.044 4.800 0.000 ***
Postgrad or equivalent 0.150 0.052 2.860 0.004 ***
Vocational Qualification 0.161 0.022 7.180 0.000 ***
Occupational Group (base, operative)
Manager/Senior Admin 0.729 0.060 12.170 0.000 ***
Professional 0.645 0.066 9.730 0.000 ***
Assoc Prof/Technical 0.586 0.061 9.660 0.000 ***
Clerical & Secretarial 0.383 0.055 6.950 0.000 ***
Craft/Skilled Service 0.056 0.065 0.860 0.390
Personal/Protective 0.639 0.064 9.960 0.000 ***
Sales 0.537 0.069 7.820 0.000 ***
Other Occupation 0.042 0.057 0.730 0.467
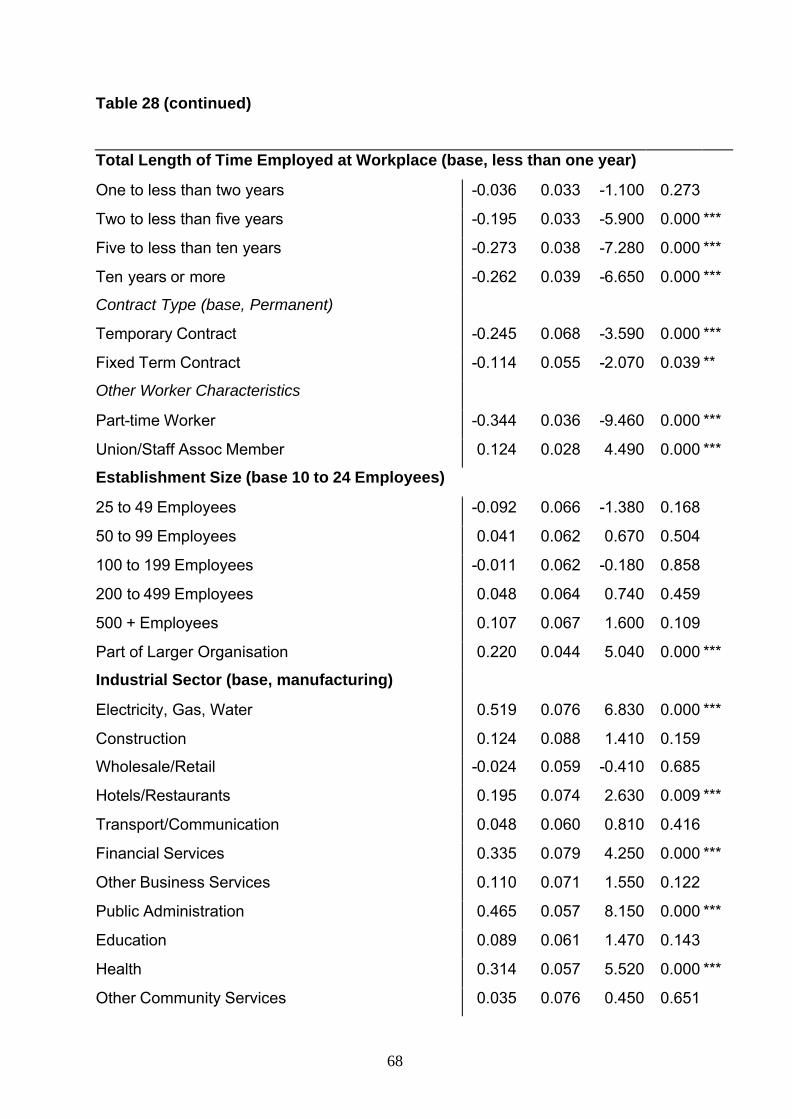
68
Table 28 (continued)
Total Length of Time Employed at Workplace (base, less than one year)
One to less than two years -0.036 0.033 -1.100 0.273
Two to less than five years -0.195 0.033 -5.900 0.000 ***
Five to less than ten years -0.273 0.038 -7.280 0.000 ***
Ten years or more -0.262 0.039 -6.650 0.000 ***
Contract Type (base, Permanent)
Temporary Contract -0.245 0.068 -3.590 0.000 ***
Fixed Term Contract -0.114 0.055 -2.070 0.039 **
Other Worker Characteristics
Part-time Worker -0.344 0.036 -9.460 0.000 ***
Union/Staff Assoc Member 0.124 0.028 4.490 0.000 ***
Establishment Size (base 10 to 24 Employees)
25 to 49 Employees -0.092 0.066 -1.380 0.168
50 to 99 Employees 0.041 0.062 0.670 0.504
100 to 199 Employees -0.011 0.062 -0.180 0.858
200 to 499 Employees 0.048 0.064 0.740 0.459
500 + Employees 0.107 0.067 1.600 0.109
Part of Larger Organisation 0.220 0.044 5.040 0.000 ***
Industrial Sector (base, manufacturing)
Electricity, Gas, Water 0.519 0.076 6.830 0.000 ***
Construction 0.124 0.088 1.410 0.159
Wholesale/Retail -0.024 0.059 -0.410 0.685
Hotels/Restaurants 0.195 0.074 2.630 0.009 ***
Transport/Communication 0.048 0.060 0.810 0.416
Financial Services 0.335 0.079 4.250 0.000 ***
Other Business Services 0.110 0.071 1.550 0.122
Public Administration 0.465 0.057 8.150 0.000 ***
Education 0.089 0.061 1.470 0.143
Health 0.314 0.057 5.520 0.000 ***
Other Community Services 0.035 0.076 0.450 0.651
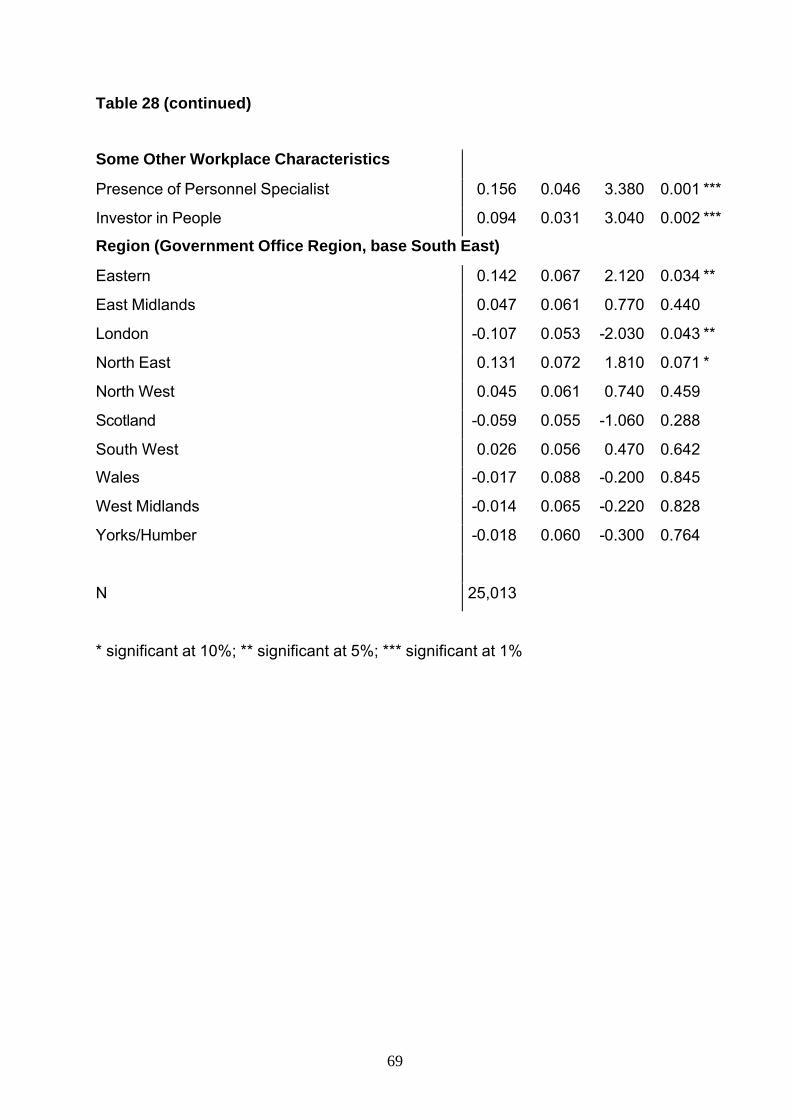
69
Table 28 (continued)
Some Other Workplace Characteristics
Presence of Personnel Specialist 0.156 0.046 3.380 0.001 ***
Investor in People 0.094 0.031 3.040 0.002 ***
Region (Government Office Region, base South East)
Eastern 0.142 0.067 2.120 0.034 **
East Midlands 0.047 0.061 0.770 0.440
London -0.107 0.053 -2.030 0.043 **
North East 0.131 0.072 1.810 0.071 *
North West 0.045 0.061 0.740 0.459
Scotland -0.059 0.055 -1.060 0.288
South West 0.026 0.056 0.470 0.642
Wales -0.017 0.088 -0.200 0.845
West Midlands -0.014 0.065 -0.220 0.828
Yorks/Humber -0.018 0.060 -0.300 0.764
N 25,013
* significant at 10%; ** significant at 5%; *** significant at 1%


![CEE DP 133 - [cee.lse.ac.uk]cee.lse.ac.uk/ceedps/ceedp133.pdf · CEE DP 133 Students’ Perceptions of Teacher Biases: ... pupils hold different beliefs about male or female teachers,](https://img.pdfslide.us/doc/110x75/5a9d3ce37f8b9a032a8d07eb/cee-dp-133-ceelseacukceelseacukceedps-dp-133-students-perceptions.jpg)


![CEE DP 126 - [cee.lse.ac.uk]cee.lse.ac.uk/ceedps/ceedp126.pdf · CEE DP 126. The Impact of ... 2. HE Finance in the UK, ... the UKs coalition government increased the cap on tuition](https://img.pdfslide.us/doc/110x75/5c05379509d3f28b388d2991/cee-dp-126-ceelseacukceelseacukceedps-cee-dp-126-the-impact-of.jpg)


![ASSESSING SCHOOL QUALITY - [cee.lse.ac.uk]cee.lse.ac.uk/ceedps/ceedp132.pdf · Olmo Silva is a Lecturer at the Department of ... and go to great lengths to secure places for their](https://img.pdfslide.us/doc/110x75/5abb57a77f8b9a76038c984c/assessing-school-quality-ceelseacukceelseacukceedps-silva-is-a-lecturer.jpg)