Embed Size (px)
Citation preview

DECEMBER 2011
California Community Colleges Chancellor’s OfficeJack Sco, Chancellor
Student Financial Aid Report
Dakota Spillman waits in line to apply for financial aid before the start of the spring 2011 semester on the Santa Rosa Junior College campus.(BETH SCHLANKER/©The Press Democrat, Santa Rosa, CA)

STATE OF CALIFORNIA
JACK SCOTT, CHANCELLOR
CALIFORNIA COMMUNITY COLLEGES CHANCELLOR’S OFFICE 1102 Q STREET SACRAMENTO, CA 95811-6549 (916) 445-8752 http://www.cccco.edu
December 15, 2011
The Honorable Jerry Brown
Governor of California
State Capitol
Sacramento, California 95814
Dear Governor Brown:
I am pleased to present to you the California Community Colleges Chancellor’s Office report on
Student Financial Aid Programs in 2009/2010. As you may be aware, the number of community
college students who apply for financial aid has steadily increased during the past decade. Our
financial aid officers throughout the state are doing a heroic job as they strive to meet record-
breaking demands for services on their campuses.
This report documents the expenditures of the Board Financial Assistance Program-Student
Financial Aid Administration funds provided to increase student financial aid participation in all
of our colleges. It also includes extensive data on the numbers and characteristics of new
financial aid recipients and a comparison of years 2008/09 and 2009/10 with the baseline year
2002/03 performance measures. We have included as a supplement to this report highlights of
the state’s ongoing public awareness campaign on the availability of financial aid opportunities
for California community college students.
If you or your staff have questions regarding this report, please contact Erik Skinner, executive
vice chancellor for programs, at (916) 323-7007 or [email protected].
Thank you for your interest in these programs and the students they serve.
Sincerely,
Jack Scott, Ph.D.
Chancellor

Student Financial Aid Programs 2009/10 | 1
Student Financial Aid
Executive Summary
The California Community Colleges is the nation’s largest system of public higher education and serves more than 2.6 million students. The 112 community colleges offer certificates and degrees for tomorrow’s careers, provide basic skills education and prepare students for transfer to four-year universities.
After four consecutive years of growth, community college enrollments for 2009/10 dropped to a level below that of 2002/03, the base year with which this report’s figures are compared. Despite this drop, financial aid applications and awards have grown dramatically during this seven-year period. Financial aid recipients increased 71 percent and financial aid dollars increased 149 percent. The $2.3 billion financial aid figure for 2009/10 is nearly two-and-a-half times that awarded in the 2002/03 base year.
Over the past seven years, community colleges have identified and served more than 2.3 million new financial aid recipients through their out-reach efforts and more than 615,000 students through their in-reach efforts. In-reach and outreach efforts have resulted in substantial increases in the percentage of new financial aid recipients. In total, the number has increased from 353,099 students in 2002/03 to 559,627 students in 2009/10. That is an increase of more than 206,000 students or 59 percent since the enactment of the BFAP-SFAA capacity funding.
Table of Contents
Executive Summary Page 1
Introduction Page 3
Methodology Page 5
Background Page 6
Allocation Formula for BFAP- SFAA Page 13
How Colleges have Invested Funds to Increase Participation Page 14
College Performance Indicators Page 21
In-Reach and Outreach Services Page 28
Key Findings Page 44
Conclusions Page 45
SUPPLEMENTAL REPORT “I Can Afford College” Page 47
Acknowledgments Page 57
2 | California Community Colleges Chancellor’s Office
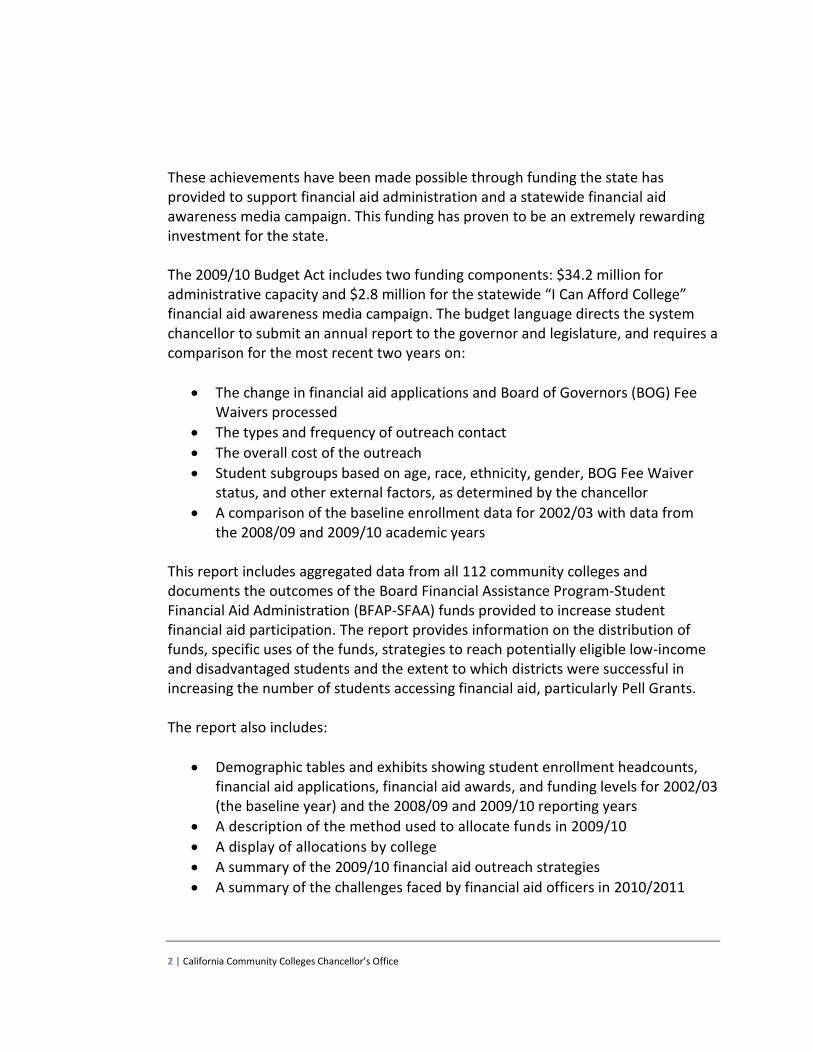
These achievements have been made possible through funding the state has provided to support financial aid administration and a statewide financial aid awareness media campaign. This funding has proven to be an extremely rewarding investment for the state. The 2009/10 Budget Act includes two funding components: $34.2 million for administrative capacity and $2.8 million for the statewide “I Can Afford College” financial aid awareness media campaign. The budget language directs the system chancellor to submit an annual report to the governor and legislature, and requires a comparison for the most recent two years on:
The change in financial aid applications and Board of Governors (BOG) Fee Waivers processed
The types and frequency of outreach contact
The overall cost of the outreach
Student subgroups based on age, race, ethnicity, gender, BOG Fee Waiver status, and other external factors, as determined by the chancellor
A comparison of the baseline enrollment data for 2002/03 with data from the 2008/09 and 2009/10 academic years
This report includes aggregated data from all 112 community colleges and documents the outcomes of the Board Financial Assistance Program-Student Financial Aid Administration (BFAP-SFAA) funds provided to increase student financial aid participation. The report provides information on the distribution of funds, specific uses of the funds, strategies to reach potentially eligible low-income and disadvantaged students and the extent to which districts were successful in increasing the number of students accessing financial aid, particularly Pell Grants. The report also includes:
Demographic tables and exhibits showing student enrollment headcounts, financial aid applications, financial aid awards, and funding levels for 2002/03 (the baseline year) and the 2008/09 and 2009/10 reporting years
A description of the method used to allocate funds in 2009/10
A display of allocations by college
A summary of the 2009/10 financial aid outreach strategies
A summary of the challenges faced by financial aid officers in 2010/2011
Student Financial Aid Programs 2009/10 | 3
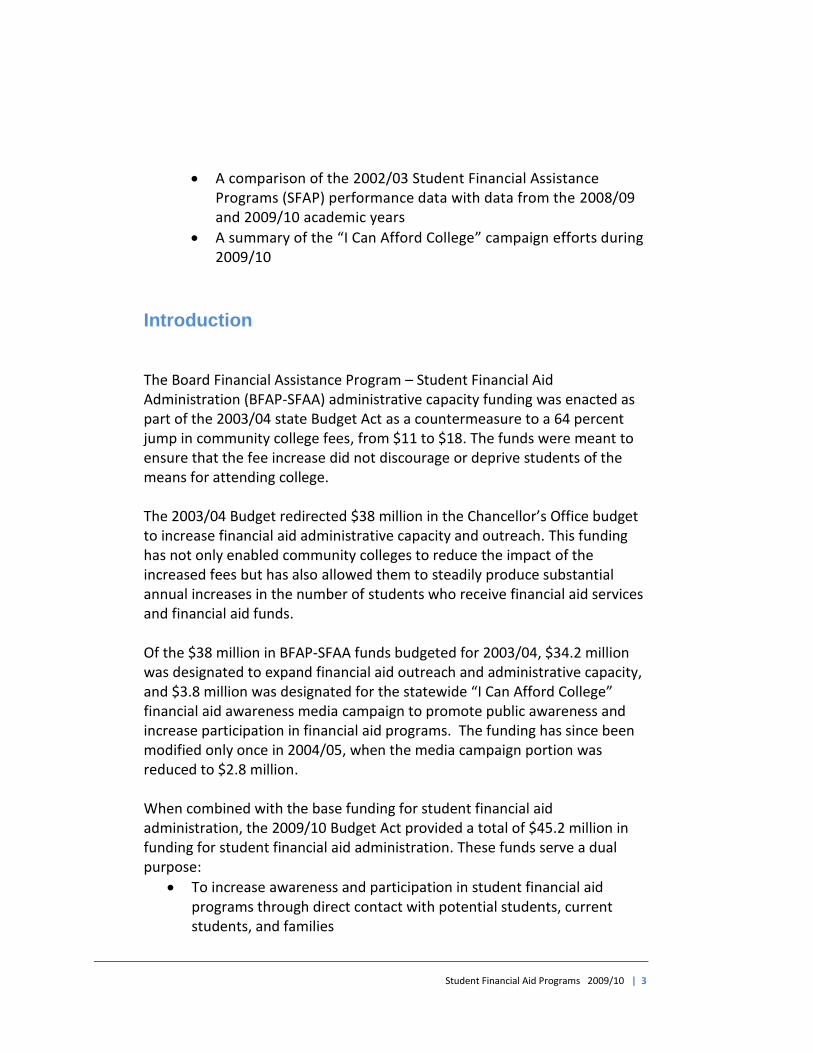
A comparison of the 2002/03 Student Financial Assistance Programs (SFAP) performance data with data from the 2008/09 and 2009/10 academic years
A summary of the “I Can Afford College” campaign efforts during 2009/10
Introduction The Board Financial Assistance Program – Student Financial Aid Administration (BFAP-SFAA) administrative capacity funding was enacted as part of the 2003/04 state Budget Act as a countermeasure to a 64 percent jump in community college fees, from $11 to $18. The funds were meant to ensure that the fee increase did not discourage or deprive students of the means for attending college. The 2003/04 Budget redirected $38 million in the Chancellor’s Office budget to increase financial aid administrative capacity and outreach. This funding has not only enabled community colleges to reduce the impact of the increased fees but has also allowed them to steadily produce substantial annual increases in the number of students who receive financial aid services and financial aid funds. Of the $38 million in BFAP-SFAA funds budgeted for 2003/04, $34.2 million was designated to expand financial aid outreach and administrative capacity, and $3.8 million was designated for the statewide “I Can Afford College” financial aid awareness media campaign to promote public awareness and increase participation in financial aid programs. The funding has since been modified only once in 2004/05, when the media campaign portion was reduced to $2.8 million. When combined with the base funding for student financial aid administration, the 2009/10 Budget Act provided a total of $45.2 million in funding for student financial aid administration. These funds serve a dual purpose:
To increase awareness and participation in student financial aid programs through direct contact with potential students, current students, and families
4 | California Community Colleges Chancellor’s Office
To increase low-income and disadvantaged student participation in postsecondary education, by providing access to information, application assistance, and expanding the number of funded financial aid awards
California’s community colleges conducted more than 13,000 in-reach and outreach events in 2009/10, including nearly 2,200 multilingual events. As a result of these efforts, more than 559,000 new students were awarded financial aid in 2009/10. This represents a 59 percent increase in the number of new recipients from the 2002/03 base year funding. In total, the colleges served nearly 1.3 million financial aid applicants in 2009/10. A total of nearly 3 million student financial aid applicants have been served since the enactment of the administrative capacity funding.
In the seven years since the administrative capacity funding began, community colleges have made impressive gains:
Unduplicated financial aid recipients have increased 71 percent
BOG Fee Waiver awards have increased 71 percent
Pell Grant awards have increased 75 percent
Funding to all students in financial aid programs has increased 149 percent
The findings in this report illustrate the high return on the state’s $37 million administrative capacity funding in financial aid administration and the statewide “I Can Afford College” financial aid awareness media campaign. Of particular note is the 75 percent increase in the number of community college Pell Grant recipients, which results in a direct federal stimulus of nearly $1.3 billion pumped into the California economy in 2009/10 alone.

Student Financial Aid Programs 2009/10 | 5
Methodology The primary source of data for this report is the Chancellor’s Office Management Information System, which provides information on:
Student enrollments
Student demographics
Student services
Program awards
Financial aid
Matriculation
Administrative costs
BFAP-SFAA funding allocations Another significant source of information is the data provided on the BFAP-SFAA campus report forms that are required from each college. These forms, which are aggregated and analyzed by the Chancellor’s Office, provide information on the use of funds, outreach activities, program applications and staffing. Additionally, information and data has been provided by the “I Can Afford College” campaign regarding the use of funds for statewide financial aid awareness advertising, marketing, media relations and outreach activities. Two other sources of data include recent studies by the Institute of Educational Sciences’ National Center for Education Statistics and the Institute for College Access and Success.

6 | California Community Colleges Chancellor’s Office
Background Financial Aid Programs in California Community Colleges Community college financial aid offices administer as many as 30 state, federal, and campus student aid programs. In 2002/03, colleges provided 610,000 students with more than $895 million from various student financial assistance programs to cover educational expenses. Since the introduction of the BFAP-SFAA administrative capacity funding, in 2003/04, the financial aid program participants and financial aid dollars have increased considerably. As Tables A and B illustrate, the number of unduplicated financial aid recipients has increased by 71 percent, from just 610,000 in 2003/04 to more than 1,045,000 in 2009/10; and the financial aid funding level has increased by an extraordinary 149 percent, from $895 million to more than $2.23 billion dollars.
TABLE A - Eight-Year Comparison of Unduplicated Financial Aid Recipients

Student Financial Aid Programs 2009/10 | 7
TABLE B – Distribution of Financial Aid Dollars by Program for 2009/10
With the exception of a slight drop in 2006/07, the colleges have experienced annual increases in both the dollars distributed and the students served since the 2002/03 baseline year. The 2006/07 drop resulted from the combined effects of a change in the federal needs analysis formula and a 23 percent drop in enrollment fees, from $26 to $20 per unit, in January 2007. These factors reduced both the number and amount of awards for that year.

8 | California Community Colleges Chancellor’s Office
The BOG Fee Waiver and Pell Grant programs account for more than 77 percent of all award dollars. Table C, below, illustrates the growth of these two award sources.
TABLE C – Eight-Year Comparison of BOG Fee Waivers and Pell Grants
The BOG Fee Waiver program, which continues to serve the largest number of students, has grown substantially over the past seven years. In 2002/03, 597,000 students received $102.7 million in BOG Fee Waivers. In 2009/10, those figures grew more than 71 percent, with over 1,023,000 students receiving more than $369 million in BOG Fee Waivers. The Pell Grant program continues to be the largest single source of financial aid award dollars. In 2002/03, 240,000 students received $534 million in Pell Grants. In 2009/10, nearly 419,000 students received over $1.3 billion in Pell Grants, representing a 75 percent increase in Pell Grant recipients and a 154 percent increase in Pell Grant dollars.

Student Financial Aid Programs 2009/10 | 9
Rapid Growth in Educational Loan Programs Federal Stafford loans have nearly doubled in the past two years. These loans represent the third largest source of financial aid funds for community college students and provide over 89,000 student loans (including multiple loans) totaling more than $313 million.
TABLE D – Seven Year Comparison of Federal Educational Loans
Until recently, the federal government administered two loan programs for higher education students: the Federal Family Education Loan Program (FFELP), funded through private lenders, and the Direct Loan Program, funded through the U.S. Department of Education. The funds awarded for both programs are shown above. As of July 2010, for the 2010/11 academic year, all federal student loans must be processed through the Direct Loan Program only. Consequently, the U.S. Department of Education now provides all funds for federal student loans for higher education students. This change will produce dramatic shifts in loan funding reports. While community college students take out relatively few educational loans compared to students from other segments of postsecondary education, the amount they borrow has grown 221 percent since 2002/03, demonstrating that these loans are becoming an increasingly important resource for students who choose or need to borrow.

10 | California Community Colleges Chancellor’s Office
Cal Grants Over the first three years of capacity funding, Cal Grants for community colleges students rose 28 percent from 52,523 awards in 2002/03 to 67,328 awards in 2005/06. However, over the past four years, the number of recipients and the amount of funding for community college students has remained relatively flat. Despite enormous growth in the overall applicant pool, the Cal Grant program, which is the state’s largest financial aid grant program continues to be limited to only a fraction of eligible applicants. As a result, the program represents an increasingly smaller portion of financial aid for community college students. The larger growth in the Pell, BOG Fee Waiver, and Stafford Loan programs has reduced the relative proportion of Cal Grant funds for community college students from 7 percent of all financial aid funds in 2002/03 to only 3 percent of all financial aid funds in 2009/10. See Table A for a comprehensive summary of systemwide student financial aid program data for 2002/03 through 2009/10.

Student Financial Aid Programs 2009/10 | 11
Financial Aid Administrative Funding Sources The primary funding sources for financial aid administration are the local discretionary funding and the BFAP-SFAA allowance. The BFAP-SFAA allowance provides categorical funding for the administration of the BOG Fee Waiver program to increase program participation and provide financial aid information and outreach services to current and potential California Community Colleges.
Between 2003/04 and 2009/10 total expenditures for administering community college financial aid programs and services have grown from $97.6 million to $111.5 (14.24 percent). In 2003/04, the year the financial aid capacity funds were first enacted, community college financial aid offices expended $42.4 million in BFAP-SFAA funds and $55.3 million in local discretionary funds. As of 2009/10 BFAP-SFAA funding expenditures have grown to $45.2 million, a net increase of $2.8; and local expenditures have grown to $66.3 million, a net increase of $10.9 million.
Because the growth of funds from local districts and colleges exceeds that provided through the BFAP-SFAA allowance, local districts and colleges continue to assume an increasingly larger share of financial aid administrative costs.
Due to the growth in Pell awards, the Pell Grant administrative allowance has grown from $1.2 million in 2003/04 to $2.1 million in 2009/10. This program provides an administrative allowance of $5 per grant recipient. However, the allowance covers only 1.9 percent of total student financial aid administration expenditures.
The Federal Campus-Based Programs (Supplemental Educational Opportunity Grant, Federal Work Study, and Perkins Loans) provide a 3 percent administrative allowance on the relatively small pool of program funds. This allowance provided approximately $1.6 million in 2009/10, which covers 1.4 percent of total student financial aid administration expenditures. The combined federal allowance funds amount to only $3.7 million or 3.3 percent of total financial aid administrative funds in 2009/10.
The Cal Grant programs provide no program administrative funds to colleges.

12 | California Community Colleges Chancellor’s Office
Accurately Comparing Financial Aid Participation Rates Because financial aid participation is such a critical factor in evaluating the effectiveness of the BFAP-SFAA funding, it is important that colleges accurately measure and compare program participation rates. However, it is difficult to compare California Community College performance data with performance data from other systems. Unlike other segments of higher education, the community colleges serve as open enrollment institutions, rendering comparisons to other segments and our defined service populations incongruous. In developing initial performance measures, the Chancellor’s Office designated credit enrollment head count as the measure (denominator) of potentially eligible populations attending a community college that might be eligible to apply for and receive any type of financial aid because:
Enrollment fees are only assessed on credit coursework. Students are eligible to have their fees waived through the BOG Fee Waiver program.
For Pell and other federal programs and the Cal Grant program, a student must be in an eligible credit-enrollment program.
The structure and reporting cycle of the Chancellor’s Office data system do not lend themselves well to direct comparisons. The internal measures for both enrollment and financial aid program participation include aggregated annual data for all terms in an academic year, which may include a combination of:
Summer as an academic year “leading” term (schools have the option of using the summer term as a leading term or trailing term)
Fall term (all semester and quarter schools)
Winter term (for quarters and semester inter-sessions)
Spring term (all semester and quarter schools)
Summer as a “trailing” term in an academic year (schools have the option of using the summer term as a leading term or trailing term)

Student Financial Aid Programs 2009/10 | 13
Allocation Formula for BFAP-SFAA The 2010/11 Budget Act maintains the same BFAP-SFAA funding established in 2003/04 to expand local community college financial aid participation, outreach, and administrative capacity.
The Chancellor’s Office distributes the $34.2 million BFAP-SFAA funds in accordance with the budget guidelines by providing each college with a minimum allocation of $50,000. This ensures that small or newly established colleges are fairly funded. The minimum allocations total $5.7 million for the 112 colleges and one district. The remaining $28.5 million is distributed on the basis of a "fair share" formula using two equally-weighted factors:
Each college’s full-time equivalent student (FTES) as a percentage of total system FTES.
Each college’s BOG Fee Waiver recipients as a percentage of total system BOG Fee Waiver recipients.
All of these funds are intended for local expenditure at the designated local colleges and are subject to the categorical restrictions identified in the Budget Act provisional language. The Budget Act distributes the remaining $2.8 million to the “I Can Afford College” campaign.
Local Maintenance of Effort Requirements
The 2010/11 Budget Act states: “Funds allocated to a community college district for financial aid personnel, outreach, determination of financial need, and delivery of student financial aid services shall supplement, and shall not supplant, the level of funds allocated for the administration of student financial aid programs during the 2001-02 or 2006/07 fiscal year, whichever is greater.” In implementing this provision, the Chancellor’s Office has established an MOE requirement for each college, based on 2001/02 expenditures. Any college reporting non-compliance with the MOE requirements is subject to a fiscal penalty. Colleges wishing to appeal these penalties and must provide a detailed explanation of the circumstances and corrective action plan to rectify the local funding shortfall.

14 | California Community Colleges Chancellor’s Office
How Colleges Have Invested Funds to Increase Participation
Identifying Target Populations and Designing Strategies
State law requires community colleges to develop strategies designed to improve program participation and ensure that lower income and underserved students take advantage of financial aid programs available to them. Further, the Chancellor’s Office encourages financial aid officers to identify ways to use the BFAP-SFAA capacity funds to target and assist local populations who are not served or who are underserved. Strategies focus on identifying needy students, assisting in the application process, increasing financial aid office capacity to administer complex student aid programs, and awarding and disbursing student aid funds.
Each year, community colleges submit BFAP-SFAA spending reports to the Chancellor’s Office detailing strategies and expenditures for locally focused student services. The reports show that almost all of these expenditures are related to staffing costs, including direct costs such as salaries and benefits, and indirect costs such as recruiting, training, and equipment purchases.
Annual categorical funding reports submitted by colleges show:
More than 96 percent of the BFAP-SFAA funds are used for expenses associated with staffing. This figure has increased significantly since 2003/04, when 83 percent of the funds were used for staffing expenses.
Without a COLA growth, the BFAP-SFAA funding has not kept pace with the increases in staff salary and benefit costs. As a result, colleges are now paying 24 percent more for 15 percent fewer staff compared to 2003/04. These figures, combined with the massive growth in the number of financial aid applicants and recipients, indicate that a decreasing number of financial aid staff members are serving an increasing number of students.
The remaining 4 percent of BFAP-SFAA funds are used for expenses related to outreach and in-reach activities, such as on-campus and off-campus community events, translation services, publications, and printing.
During the initial years of the BFAP-SFAA capacity funding, many colleges were able to utilize a larger portion of these funds to initiate and expand

Student Financial Aid Programs 2009/10 | 15
financial aid recruitment efforts. However, as staffing positions have become more costly to maintain, a greater portion of the funds have been dedicated to keeping pace with processing and operational demands of the growing pool of applicants and recipients.
Table E, below, provides a comparison of the college BFAP-SFAA base and capacity expenditure reports for 2009/10.
TABLE E – Comparison of BFAP-SFAA Expenditures through 2009/10
Staffing To establish a baseline for monitoring future staffing trends, the Chancellor’s Office began asking colleges to annually report the number of staff by employment classification in 2005/06. This number, particularly temporary and student workers, who provide a large portion of outreach services and administrative support, has dropped to a point where it has become increasingly difficult for campuses to provide needed student support services to match the growth in student financial aid applicants. During the past four years, BFAP-SFAA spending reports show staffing levels dropping from a high of 2,010 in 2005/06 to a low of 1,714 staff in 2009/10. This means that while the numbers of financial aid applicants and recipients have been rising by record numbers, the number of staff working to support these students has dropped nearly 15 percent.
Table F, below, identifies financial aid staffing by employment classification:

16 | California Community Colleges Chancellor’s Office
TABLE F – Four Year Comparison of BFAP-SFAA Financial Aid Staffing
Multi-Language Materials and Events Reach Hard to Serve Populations Multi-language information and services are a critical part of reaching targeted, hard-to-serve populations. The number of multi-lingual events offered for bilingual students and parents continues to represent a large portion of each year’s outreach events. In 2009/10, college staff presented nearly 2,200 multi-lingual events which served more than 115,000 students and parents. Translators and translation services are deployed to create multi-language materials and publications and deliver presentations to limited English-speaking students. Bilingual staff and student workers organize one-on-one, group activities, and events targeted at limited-English-speaking populations including Arabic, Armenian, Assyrian, Cambodian, Chinese, Farsi, Hmong, Korean, Mandarin, Punjabi, Russian, Spanish, Tagalog, Ukrainian, and Vietnamese. The “I Can Afford College” campaign develops and maintains translated materials for reference and subsequent access by community colleges.
Targeted Outreach Aimed at Low-income and Disadvantaged Students
Colleges have used the BFAP-SFAA capacity funding to employ a number of strategies to identify and better serve low-income and disadvantaged student populations in their local communities. To supplement local efforts to identify and serve students, the “I Can Afford College” campaign specifically engages these populations through strategic advertising, marketing, media relations and outreach efforts.
Mentoring Relationships with High Schools to Increase Awareness of Financial Aid
Employee Type 2005/06 Number
2006/07 Number
2007/08 Number
2008/09 Number
2009/10 Number
Net Change Percent
Permanent Employees (Full Time Equivalent)
1,101 1,093 1,061 1,034 1,025 -76 -6.9%
Temporary Employees 304 285 271 225 213 -91 -29.9%
Students 605 510 492 489 476 -129 -21.3%
TOTAL 2,010 1,888 1,824 1,748 1,714 -296 -14.7%
Student Financial Aid Programs 2009/10 | 17
College financial aid offices maintain regular contact with local high school teachers, counselors, and advisers to ensure they are informed about college student financial aid programs, services, and processes. Most offices provide in-service training and workshops for high school staff to promote their understanding of campus programs. Expanded Outreach Targets Underserved High School Students and Parents Financial aid and outreach staff regularly participate in college and high school financial aid outreach training events throughout the state. The “I Can Afford College” campaign partners with the California Student Aid Commission “California Cash for College” program to increase awareness of the March 2 Cal Grant Entitlement deadline, and to identify “priority high schools” for outreach to low-income and disadvantaged students. In addition, workshops target alternative/continuation high school students and parents. As a result of the highly publicized Cal Grant deadline, many students incorrectly believe they cannot apply for student financial aid beyond March 2. Financial Aid Awareness Month takes place each spring to inform students that it is not too late to apply for financial aid for the upcoming academic year.
In 2009/10, colleges provided in-reach and outreach services to nearly 1.4 million students, prospective students, and parents through more than 13,000 on- and off-campus events. Expanded Community Outreach Connects to Young Adult and Adult Populations
To reach hard-to-serve populations, community colleges partner with community and faith-based organizations and offer FAFSA workshops to an array of local and regional community organizations. College staff also hosts information stations at shopping centers and community events, while offering pre-developed presentations and collateral materials to local groups and faith-based organizations for distribution to their constituents.
Through the “I Can Afford College” marketing and outreach efforts, both young and adult populations are encouraged to attend a college and apply for financial

18 | California Community Colleges Chancellor’s Office
aid year-round. Financial aid offices provide materials and one-on-one application assistance in multiple languages to reach limited English speaking populations, including guidance and assistance in 16 different languages.
In support of foster youth outreach efforts, each college has identified a Foster Youth Success Initiative liaison to serve as a point of contact for issues of unique concern and to help them access financial aid and other comprehensive college support services.
Legislation specifically directs colleges to use their capacity funds to target low-income and disadvantaged students to provide additional staff resources to increase both financial aid participation and access to postsecondary education. Included in colleges’ outreach plans are special outreach efforts to target other populations, such as veterans, transfer students, and other students who may encounter unique educational access needs.
Integration of Students Organizations in Outreach and In-Reach Efforts
Student associations and student government continue to play an important role in outreach and in-reach initiatives, including co-hosting events, actively assisting in creating campus/student awareness, and encouraging participation in student financial aid programs.
Student workers play an even greater role in outreach and in-reach activities and offer many benefits to both the colleges and the students. Student workers provide the colleges with:
Greater staffing flexibility to better serve the needs of prospective financial aid applicants and recipients
Additional bilingual resources to assist limited-English-speaking students and families with completion of the FAFSA
Financial aid staff who attend classes and help create awareness and encouragement to other students
Student peer advisers, who offer prospective students a valuable student-based perspective on campus life and campus support systems

Student Financial Aid Programs 2009/10 | 19
College In-Reach and Service Improvements
College in-reach is an important aspect of efforts to make continuing students aware of the financial aid program and application processes. Many students are eligible for financial aid but are either unaware of its availability or are intimidated by the application and verification processes.
With the help of BFAP-SFAA capacity funds, colleges have been able to distribute posters, announcements, and flyers; set up screens, banners, and kiosks; place ads in college and community newspapers, handbooks, class schedules and catalogs; offer open-house events dedicated to financial aid information and application materials; and go directly into classrooms to inform students of financial programs and services.
Strategies to reach low-income and disadvantaged students include:
Assign free campus e-mail addresses for all students. This allows them to send and receive information regarding programs and services
Set up dedicated computer labs with trained staff to allow students to check e-mail, enroll in classes, access program information and apply for financial aid
Post flyers at on- and off-campus locations to inform students of upcoming FAFSA workshops and financial aid opportunities and deadlines
Conduct specially scheduled financial aid workshops and financial literacy workshop series
Publish brochures and materials, some in multiple languages, to help students and parents better understand program benefits and requirements
Maintain telephone banks or other electronic communications systems to quickly communicate with students regarding various financial aid matters
Provide campus-based websites that allow students to learn about campus financial aid programs and financial aid training opportunities

20 | California Community Colleges Chancellor’s Office
Provide portals that allow students access to their financial aid files and determine their financial aid application status
In-Reach to Other On-Campus Programs Another effective way to improve financial aid participation for low-income and disadvantaged students is for financial aid staff to work with other on-campus student services programs, such as EOPS, DSPS, CARE, CalWORKs, and transfer centers. These collaborative relationships allow direct access to targeted low-income and disadvantaged students. Some financial aid administrators work with faculty and arrange presentations in their classes to provide information and materials. This is especially beneficial for students who are uncomfortable with asking for assistance, but when given an opportunity to hear directly from staff, will often take the next step and visit the financial aid office.

Student Financial Aid Programs 2009/10 | 21
Performance Indicators Established Benchmark Performance Indicators Under the provisions of the State Budget Act, the Chancellor’s Office must report the extent to which districts and colleges are successful in increasing the number of students accessing financial aid, particularly Pell Grant awards. The Chancellor’s Office has identified several primary performance indicators to monitor and measure performance resulting from the BFAP-SFAA capacity and participation funding. These include both Pell Grants and BOG Fee Waivers. The Pell Grant program is a federally funded program that provides financial aid funds directly to community college students. To qualify for Pell Grant assistance, students must be enrolled in an eligible program leading to a degree, certificate, or transfer. Performance indicators include:
The number of annual unduplicated headcount credit enrollment receiving Pell Grants
The percent of annual unduplicated headcount credit enrollment receiving Pell Grants
The dollar value of annual award payments for Pell Grants
The BOG Fee Waiver program is a state-funded program that waives the enrollment fee for students who have financial need. Performance indicators include:
The number of unduplicated headcount credit enrollment receiving a BOG Fee Waiver
The percent of unduplicated headcount credit enrollment receiving a BOG Fee Waiver
The dollar value of annual award payments for BOG Fee Waivers
The Chancellor’s Office encourages colleges to establish local performance goals and objectives in support of these statewide performance measures.

22 | California Community Colleges Chancellor’s Office
California Community Colleges Performance Relative to Benchmarks Based on established indicators, Tables G and H show systemwide performance. Table G displays credit enrollment headcounts; the number and dollar value of BOG Fee Waivers and Pell Grants; and the combined dollar value of these awards for 2002/03 through 2009/10.
TABLE G – Comparison of BOG Fee Waivers and Pell Grants
In comparing 2009/10 data to the 2002/03 base year data, this table indicates:
Credit enrollments have declined slightly
BOG Fee Waivers have increased by 71.4%
Pell Grants have increased by 74.5%
Pell award dollars have increased by 154.1%
Overall financial aid dollars for all programs have increased by 148.9%

Student Financial Aid Programs 2009/10 | 23
Table H displays credit enrollment headcounts and the number and percentage of students served by BOG Fee Waivers and Pell Grants from 2002/3 through 2009/10.
TABLE H – Eight-Year Comparison of BOG Fee Waivers and Pell Grants as a Percent of Credit Enrollment

24 | California Community Colleges Chancellor’s Office
Pell Grant and BOG Fee Waivers as a Percent of Full-Time Credit-Enrolled Students Studies have shown that full-time enrollment and financial aid support greatly assist students with both persistence and transfer. With this outcome in mind, the Chancellor’s Office, with support from the “I Can Afford College” campaign, has initiated a full-time enrollment initiative to encourage students to enroll full-time and take advantage of the added financial aid this brings. Table I reflects full-time enrollment and financial aid participation for full-time students for the BOG Fee Waiver and Pell Grant programs.
Table I – Eight-Year Comparison of BOG Fee Waivers and Pell Grants as a Percent of Full-Time Credit Enrollment by Year
From 2003/04, the first year of the increased capacity funding, the percentage of full time students from the general population has increased from 12.8 percent to 15.9 percent. However, the percentage of full time BOG Fee Waiver recipients has increased from 46.5 percent to 57 percent. Full time Pell recipients have increased from 31.6 percent to 39.8 percent, which is higher than the most recently published national average of 32.6 percent. Our conclusion is that the receipt of state financial aid in the form of BOG Fee Waivers and federal Pell Grants encourages and supports full-time attendance goals.

Student Financial Aid Programs 2009/10 | 25
Unduplicated Student Financial Aid Program Participation While the primary performance measures for the BFAP-SFAA increased capacity and participation funding are the specific Pell Grant and BOG Fee Waiver metrics described in the previous section, the unduplicated statewide count of all student financial aid program recipients serves as another significant measure. The sustained rise in the number of financial aid recipients over the past several years demonstrates the effectiveness of the funding and the state’s return on its investment. Table J.1 shows the number of unduplicated students served by all financial aid programs from the years 2002/03 through 2009/10. TABLE J.1 – Eight-Year Comparison of Unduplicated Financial Aid Recipients
Year
Unduplicated Financial Aid Recipients
Yearly Change in Number of Recipients Percent Change
2002/03 610,112 n/a n/a
2003/04 652,641 42,529 7.0%
2004/05 714,004 61,363 9.4%
2005/06 732,362 18,358 2.6%
2006/07 732,321 -41 0.0%
2007/08 781,819 49,498 6.8%
2008/09 891,984 110,165 14.1%
2009/10 1,045,112 153,128 14.7%
Cumulative Change 435,000 71.3%
In 2003/04 the state legislature approved new funding for financial aid administration in the amount of $34.2 million, plus an additional amount for the state-wide media campaign to support the efforts of campus financial aid administration. In comparing 2009/10 data to the 2002/03 base year data, this table shows:
Unduplicated financial aid recipients have increased by over 71 percent since the addition of the capacity funding in 2003/04
The growth in unduplicated financial aid recipients has been particularly dramatic over the past three years

26 | California Community Colleges Chancellor’s Office
Table J.2 compares the number of unduplicated students by selected age groups served by all financial aid programs during 2002/03, 2008/09 and 2009/10.
TABLE J.2 – Comparison of Unduplicated Financial Aid Recipients by Age 2008/09 and 2009/10 to the Base Year
Table J.3 reflects the ethnic distribution of unduplicated financial aid recipients for 2002/03, 2008/09, and 2009/10.
TABLE J.3 – Comparison of Unduplicated Financial Aid Recipients by Ethnicity for 2008/09 and 2009/10 to the Base Year
In comparing 2009/10 data to the 2002/03 base year data, this table shows:
Hispanics and African Americans have shown the greatest percentage of growth since 2003/04.
The greater growth among Hispanic and African American student financial aid recipients demonstrates the success of the BFAP-SFAA in-reach and outreach efforts in targeting low-income and disadvantaged students.

Student Financial Aid Programs 2009/10 | 27
2009/10 College Performance Relative to 2002/03 Benchmarks This report summarizes college level performance using both credit enrollment and financial aid participation rates for 2002/03 through 2009/10. Participation Rates:
109 colleges, or 97 percent, reported growth in the number of BOG Fee Waiver recipients from 2002/03 through 2009/10. One college showed a slight decline and two other colleges are new and have not yet reported BOG figures.*
109 colleges, or 97 percent, reported growth in the number of Pell Grants from 2002/03 through 2009/10. One college showed a slight decline and two other colleges are new and have not yet reported BOG figures.*
Participation as a Percent of Credit Enrollment:
107 colleges, or 96 percent, reported growth in the percentage of credit enrollment served with Pell Grant awards from 2002/03 through 2009/10. Three colleges showed a slight decline in the percentage of credit enrollment served with Pell grants and two new colleges show first-time Pell figures.*
107 colleges, or 96 percent, reported growth in the percentage of credit enrollment served with BOG Fee Waivers from 2002/03 through 2009/10. Three colleges showed a slight decline in the percentage of credit enrollment served with Pell grants and two new colleges show first-time Pell figures.*
* For newer colleges that began reporting first-time figures after the 2002/03 base year, growth is measured by comparing the 2009/10 enrollment and financial aid figures with the colleges’ first-year figures

28 | California Community Colleges Chancellor’s Office
In-Reach and Outreach Services To assess the number of students reached annually through the community colleges’ activities directed towards current and prospective students, the Chancellor’s Office has defined in-reach and outreach activities and the populations served as follows: In-reach: “In-reach” measures the performance of the community colleges in targeting financial aid information to on-campus students who are not being served by the financial aid programs. All current-year financial aid recipients who were enrolled in a community college during a prior enrollment period but did not receive financial aid for that period are defined as new “in-reach” recipients. Outreach: “Outreach” measures the performance of the community colleges in targeting financial aid information to potential and prospective students in the high schools and their communities. All new students who were not enrolled in the immediate prior year but enrolled and received aid as new recipients in the current year are defined as “outreach” recipients.

Student Financial Aid Programs 2009/10 | 29
Table K shows the number of new financial aid recipients who met the definitions of in-reach and outreach for each of the past eight years.
TABLE K – Eight-Year Comparison of New Student Financial Aid Recipients Resulting from In-Reach and Outreach by Year
Demographic Indicators of New Recipients from In-Reach and Outreach Activities
The resources provided through the increased SFAA program capacity and participation funding and the “I Can Afford College” campaign are focused on alleviating impacts of enrollment fees on both current and prospective students, especially those from low-income and disadvantaged populations.
In-Reach and Outreach Activities
The following tables display the gender, age, and ethnic distribution of new financial aid recipients reached through college in-reach and outreach efforts. These data points provide evidence that the state’s investment in funding financial aid administration has enabled the colleges to make gains across all populations.

30 | California Community Colleges Chancellor’s Office
IN-REACH ACTIVITIES Gender, Age and Ethnicity Tables L through N show the distribution of new financial aid recipients served through in-reach activities by gender, age and ethnicity. Table M, below, shows the distribution of new male and female financial aid recipients for each of the past two years and the overall change since the 2002/03 base year.
Historically, community colleges have served a ratio of roughly 60 percent female and 40 percent male financial aid recipients. This ratio differs from the general enrollment, where female students have remained at approximately 55 percent. The reason for this difference is that female students account for the majority of higher need, single-parent families and thereby qualify for more financial aid.
TABLE L – Comparison of Gender Distribution for New Financial Aid Recipients In-Reach for 2008/09 and 2009/10 to the base year
1Reflects the gender distribution for students who were enrolled in a California Community College during a prior
period and had not received financial aid during a prior period but received financial aid as a new recipient for the applicable year.
Table M shows the most recent age distribution of new financial aid recipients resulting from the colleges’ in-reach efforts and the overall distribution change since 2002/03. The greatest number of new recipients due to in-reach activities fall within the 20-24 age group. However, the greatest percentage change since the 2002/03 base year occurred within the 25-29 age group. They increased by roughly 85 percent since 2002/03. These percentages are consistent with efforts to target both re-entering students and recent high school graduates.

Student Financial Aid Programs 2009/10 | 31
TABLE M – Comparison of Age Distribution for New Financial Aid Recipients
In-Reach for 2008/09 and 2009/10 to the base year
1Reflects the age distribution for students who were enrolled in a California Community College during
a prior period and had not received financial aid during a prior period but received financial aid as a new recipient for the applicable year.
Table N shows the ethnic distribution of new financial aid recipients served through in-reach efforts for each of the past two years and the overall change in distribution since the 2002/03 base year. With the exception of African American students, who represent 7 percent of all students but 9.7 percent of new financial aid recipients, the overall distribution of new financial aid recipients through in-reach efforts is fairly consistent with the ethnic distribution of all students attending community colleges. The four largest ethnic populations served through in-reach efforts during the past seven years are:
African American Asian Hispanic
White

32 | California Community Colleges Chancellor’s Office
TABLE N – Comparison of Ethnicity Distribution for New Financial Aid Recipients In-Reach for 2008/09 and 2009/10 to the base year
1Reflects the ethnic distribution for students who were enrolled in a CCC during a prior period and had not
received financial aid during a prior period but received financial aid as a new recipient for the applicable year. 2 Deleted Category 3 Newly Added Category
OUTREACH ACTIVITIES Gender, Age and Ethnicity Tables O through Q show new financial aid recipients served through outreach activities by gender, age, and ethnicity. The figures that follow demonstrate the successful expansion of outreach efforts to target potential and prospective students in the high schools and their communities. Table O shows the gender distribution of new financial aid recipients resulting from outreach efforts for each of the past two years and the overall change in distribution since the 2002/03 base year. These figures show that the gender distribution resulting from financial aid outreach has shifted somewhat and is becoming more consistent with the general student population. This suggests the emergence of a higher-need male population.

Student Financial Aid Programs 2009/10 | 33
TABLE O – Comparison of Gender Distribution for New Financial Aid Recipients Outreach for 2008/09 and 2009/10 to the base year
1Reflects the gender distribution for students who were not enrolled in a California community college
in the immediate prior year but enrolled and received financial aid as a new recipient for the applicable year.
Table P shows the age distribution of new financial aid recipients in recent years and the overall change in distribution since the 2002/03 base year. The two age groups with the largest percentage of change for 2009/10 are the 18-19 and 25-29 age groups. These percentages are consistent with colleges’ efforts to expand their outreach activities to target not only high schools but also the communities that surround these high schools. TABLE P – Comparison of Age Distribution for New Financial Aid Recipients Outreach for 2008/09 and 2009/10 to the base year
Age Number % of Total Number % of Total Number % of Total Number % Change
17 & Under 5,141 1.9% 5,871 1.5% 5,572 1.2% 431 8.4%
18-19 74,593 28.0% 119,529 29.7% 134,884 30.2% 60,291 80.8%
20-24 77,364 29.0% 111,889 27.8% 123,478 27.7% 46,114 59.6%
25-29 39,593 14.8% 66,733 16.6% 73,658 16.5% 34,065 86.0%
30-34 22,994 8.6% 33,795 8.4% 37,742 8.5% 14,748 64.1%
35-39 16,084 6.0% 22,103 5.5% 23,585 5.3% 7,501 46.6%
40-49 21,062 7.9% 28,210 7.0% 30,979 6.9% 9,917 47.1%
50 & Over 9,282 3.5% 14,282 3.5% 16,221 3.6% 6,939 74.8%
Unknown 557 0.2% 78 0.02% 63 0.0% -494 -88.7%
Total 266,670 100.0% 402,490 100.0% 446,182 100.0% 179,512 67.3%
Change from Base Year2002-031
2008-091
2009-101
1Reflects the age distribution for students who were not enrolled in a CCC in the immediate prior year
but enrolled and received financial aid as a new recipient for the applicable year.

34 | California Community Colleges Chancellor’s Office
Table Q shows the ethnic distribution of new financial aid recipients resulting from outreach efforts for each of the past two years and the overall change in distribution since the 2002/03 base year.
TABLE Q – Comparison of Ethnicity Distribution for New Financial Aid Recipients
Outreach for 2008/09 and 2009/10 to the base year
1 Reflects the gender distribution for students who were not enrolled in a college in the immediate year, but enrolled and received financial aid as a new recipient for the applicable year. 2 Deleted category. 3 Newly added category.

Student Financial Aid Programs 2009/10 | 35
From 2002/03 to 2009/10, the four largest ethnic categories of new financial aid recipients served through outreach efforts have been:
African American Asian Hispanic White, Non-Hispanic
The largest percentage growth increases in new financial aid recipients resulting from outreach efforts have occurred among Hispanic, Filipino, and Pacific Islander students. Asian and White/Non-Hispanic students showed the smallest percentage of growth. While there have been increases in numbers for all ethnic categories, Hispanic students have shown the largest growth in numbers, from 89,141 new financial aid recipients in 2002/03 to 157,318 in 2008/09. That represents an additional 68,177 Hispanic recipients or a 76.5 percent increase in financial aid resulting from outreach.
Change in Application Volume
The annual Budget Act states that BFAP-SFAA funding is to be used to maintain and increase student participation in financial aid programs. One of the primary performance indicators adopted by the Chancellor’s Office to gauge the effectiveness of colleges’ outreach and in-reach efforts is the volume of unduplicated Free Application for Federal Student Aid records, known as Institutional Student Information Reports. The Chancellor’s Office added unduplicated FAFSA applicant counts to its statewide benchmark performance indicators in 2005/06.

36 | California Community Colleges Chancellor’s Office
TABLE R – Eight-Year Comparison of Unduplicated FAFSA Applicants with Pell Recipients
2002-03 706,594 239,925 34.0%
2003-04 760,319 53,725 7.6% 246,093 6,168 2.6% 32.4%
2004-05 819,894 59,575 7.8% 259,958 13,865 5.6% 31.7%
2005-06* 859,496 39,602 4.8% 254,603 -5,355 -2.1% 29.6%
2006-07* 851,901 -7,595 -0.9% 247,143 -7,460 -2.9% 29.0%
2007-08 881,555 29,654 3.5% 270,098 22,955 9.3% 30.6%
2008-09 1,031,157 149,602 17.0% 321,066 50,968 18.9% 31.1%
2009-10 1,298,732 267,575 25.9% 418,775 97,709 30.4% 32.2%
592,138 83.8% 178,850 178,850 74.5%
Percent of Pell
Recipient
ISIRs
6-year change
Percent
Change in
Pell
Recipients Year
Unduplicated
FAFSA
Applicants
ISIR Change
in Number
Percent
Change in
ISIR Records
Pell Grant
Recipients
Recipient
Change
*Pell recipient decreases in 2005/06 and 2006/07 resulted from a federal Tax Table Formula Change in 2005/06 and a federally imposed “tuition sensitivity” measure that was triggered by the California Community College fee increases of 2003/04 and 2004/05.
The FAFSA application growth, which has accelerated over the past two years, can be attributed to a number of factors:
The increased financial pressures and demands for retraining created by the weakened economy.
The sustained, successful implementation of financial aid administrative outreach and capacity funding by the colleges, which provides increased outreach, in-reach, and support to applicants.
The statewide “I Can Afford College” campaign, which, through various advertising, marketing, media relations and outreach activities, has

Student Financial Aid Programs 2009/10 | 37
effectively communicated the message that financial aid is available year round and one-on-one assistance is available for those who need help with the application process.
The successful collaboration with the California Student Aid Commission’s Cal Grant Campaign and “California Cash for College” and other statewide and local outreach efforts, which create awareness of financial aid programs and provide application support for low income and disadvantaged students.
The result of all these factors is a remarkable increase in the number of financial aid applicants. This is great news for students seeking an education at community colleges, but it comes at a cost: increased workloads for financial aid offices. Despite the perception that students do not appear to be applying for or receiving federal aid at the same rate as students in other segments or other states, recent data shows that this is not the case. More than 1,031,000 students applied for federal aid in 2009/10, and more than 418,000 of these students received Pell Grants. Table T shows that first-time Pell recipients increased by 32.6 percent in 2009/10.
As stated earlier, new aid recipients impose significant administrative workload compared to renewal recipients. As a result of the growth in applicants and financial aid recipients, financial aid offices have had to take on an increased processing workload. This has necessitated a larger share of staffing resources for processing that has left financial aid offices with increased processing backlogs and less and less staffing resources for their outreach efforts.

38 | California Community Colleges Chancellor’s Office
TABLE S – Eight-Year Comparison of “New” Community College Pell Grant Recipients
It is important to note that new Pell Grant recipients represent well over half of the community college Pell Grant recipient population. Enrollment Status – Term and Annual Unit Load Approach The following analysis attempts to identify students most likely to be enrolled in eligible certificate and degree programs and therefore more likely to be eligible for student financial aid program participation. For the Pell Grant data, the Chancellor’s Office compares its data with the most recent data provided by the Institute of Educational Sciences National Center for Education Statistics in a report titled, “2007/08 National Postsecondary Student Aid Study.” Table T displays the number of students and their relative participation rates by term and annual unit load levels. The analysis compares participation rates in:
BOG Fee Waivers and Pell Grants for all students in all terms of the award year.
BOG Fee Waivers and Pell Grants for students attending at least half time (12 or more units) within an award year and those attending less than full time (less than 12 units) within an award year.

Student Financial Aid Programs 2009/10 | 39
BOG Fee Waivers and Pell Grants for students attending at least half time (6 or more units) in any term(s) within an award year and those attending less than half-time (less than 6 units in each term) in any term within an award year.
Table T attempts to determine participation rates by identifying and excluding enrollment status for students whose course patterns would indicate non-vocational or recreational studies based on the following findings:
Since 2002/03, the percentage of students with “six or more” attempted units who received a Pell Grant has increased from 18.4 percent to 27.0 percent and the percentage of students with “12 or more” attempted units who received a Pell Grant has increased from 23.8 percent to 32.8 percent. This 32.8 percent figure for full-time community college students receiving Pell Grants exceeds the most recently published national average of 32.6 percent. Students in the above two categories are those who are most likely to be enrolled in Pell eligible programs such as certificate, degree, or transfer programs, which is required for Pell participation.
Since 2002/03, the percentage of students with “less than 6” attempted units who received a Pell Grant has increased slightly from 1.6% to 2.5%. The percentage of students with “less than 12” attempted units who received a Pell Grant has increased slightly from 3.8% to 5.8%. Students in these two categories are those who are least likely to be enrolled Pell eligible programs. These students are more likely to be in non-degree/certificate programs or recreational programs and are therefore ineligible for Pell Grants.
The percentage of students with “six or more” attempted units who received a BOG Fee Waiver has increased from 36.6% to 50.2%. The percentage of students with “12 or more” attempted units who received a BOG Fee Waiver has increased from 41.5% to 54.2%. The students in these two categories are those who are most likely to be enrolled in certificate, degree, or transfer programs.

40 | California Community Colleges Chancellor’s Office
The percentage of students with “less than six” attempted units who received a BOG Fee Waiver has increased appreciably (from 12.0% to 21.7%) and the percentage of students with “less than 12” attempted units who have received a BOG Fee Waiver also has increased appreciably (from 15.9% to 27.4%). The students in these two categories are those who are least likely to be enrolled in certificate, degree, or transfer programs. They are more likely to be in non-degree/certificate programs or recreational programs.
With 32.8 percent of California Community Colleges full-time attendees receiving Pell Grants, it would appear that this figure is comparable to the 32.6 percent national figure for full-time undergraduates published in the National Center for Education Statistics most recent “2007/08 National Postsecondary Student Aid Study. This tells us that in the case of full-time students, California’s community colleges are performing as well as other colleges throughout the nation in serving Pell Grant candidates and recipients.

Student Financial Aid Programs 2009/10 | 41
TABLE T –Comparison of Enrollments for 2008/09 and 2009/10 to the base year
2009-10 1,000,535 542,294 54.2% 327,766 32.8%
2008-09 970,048 470,441 48.5% 256,753 26.5%
2002-03 831,144 345,180 41.5% 197,568 23.8%
2009-10 1,419,577 713,174 50.2% 383,817 27.0%
2008-09 1,397,744 617,240 44.2% 296,575 21.2%
2002-03 1,224,732 448,505 36.6% 224,921 18.4%
2009-10 1,400,744 384,325 27.4% 80,544 5.8%
2008-09 1,466,351 332,295 22.7% 56,252 3.8%
2002-03 1,430,338 227,494 15.9% 37,512 2.6%
2009-10 981,702 213,445 21.7% 24,493 2.5%
2008-09 1,038,655 185,496 17.9% 16,430 1.6%
2002-03 1,036,750 124,169 12.0% 10,159 1.0%
2009-10 2,388,186 1,023,645 42.9% 414,199 17.3%
2008-09 2,426,655 870,329 35.9% 319,041 13.1%
2002-03 2,262,170 596,714 26.4% 234,473 10.4%
Received
BOG FW %
Received
Pell
Attempted 12+ units during award year
Total
Students
Academic
Year
Received
BOG FW
Received
Pell %%
%
Attempted any units in one or more terms during award year
%
Academic
Year
Total
Students
Received
BOG FW %
Received
Pell
Academic
Year
Total
Students
Received
BOG FW %
Received
Pell
Students Most Likely to be in an Eligible Program
Students Least Likely to be in Eligible Programs
All Students Attempting Any Number of Units
Attempted < 6 units in each term during award year
%
Attempted 6+ units in one or more terms during award year
%
Attempted < 12 units during award year
Academic
Year
Total
Students
Received
BOG FW %
Received
Pell
Academic
Year
Total
Students

42 | California Community Colleges Chancellor’s Office
Challenges Facing CCC Financial Aid Offices in 2010/2011
As they seek to keep pace with the increasing number of financial aid applicants and recipients, financial aid administrators face significant challenges. At the root of these challenges is the fact that the state invests considerably less money in financial aid administration and outreach programs to help students who begin their academic career at a community college than in those who begin at a public four-year college. For example, in 2007/08 the state invested $40 per community college student compared to $77 per CSU student and $165 per UC student. In addition, the BFAP-SFAA capacity funding has received no COLA or growth adjustment, and funding has increased only 6.8 percent since 2003/04. While the funding initially resulted in a historic high of 2,010 financial aid staff in 2005/06, the number has since fallen by nearly 15 percent to 1,714 in 2009/10. The loss of trained staff impacts the capacity of financial aid offices to meet the needs of the many displaced workers now seeking a college degree or job retraining. First-time applicants require greater assistance and intervention, and many applicants must be considered for “special circumstances” when determining eligibility, which is more labor-intensive to process. This override is critical to individuals who may have indicated strong wage earnings for the prior year but have now been left cash strapped, underemployed, or without work due to the recession. High workload demands result in significant delays for students who complete the application process later in the cycle. In addition to the above, there are many new challenges posed by both the downturned economy and a number of federal and state policy changes that need to be considered in assessing the workload challenges imposed on financial aid offices:
Federal Considerations
Mandated Federal Direct Loan Conversion: Effective July 1 2010, Financial Aid Offices have been mandated to convert their student loans processing from the Federal Family Loan Program to Direct Lending. This will require coordination amongst the campus Financial Aid Office, IT department and Business Office staff to develop and support the transition as well as implement the new loan disbursement processes and procedures.

Student Financial Aid Programs 2009/10 | 43
“Year Round Pell” or "2 Pell in a Year": Beginning in 2009/10, colleges were required to make two scheduled Pell Grant awards rather than one within the same award year. This new policy requires a complicated analysis that limits the time staff can devote to other responsibilities.
Mandated 3-Year Cohorts for Default Rates: The US Education Department (USED) has revised its policy for determining each college’s student loan default rates. The new policy requires colleges to shift from a 2-year cohort default calculation to a 3-year cohort default calculation. Preliminary analyses show that the 3-year cohort is likely to raise default rates for most colleges. In an effort to keep the rates as low as possible, financial aid staff must enhance their delinquency intervention activities.
Return to Title IV Funds (R2T4): Significant changes to the R2T4 policy now require greater coordination by financial aid offices and other campus offices to identify students meeting the criteria and determine the amounts and types of funds that have to be returned.
Special Circumstances and Professional Judgment: As a result of the recession, many students who were previously ineligible for financial aid are now eligible due to loss of employment or reduction in students’ or parents’ earnings. To ensure that students are given the opportunity to correctly reflect their current financial status, financial aid staff must assist these students by way of “professional judgment,” which allows staff to analyze and recalculate aid based upon current income circumstances as opposed to base year income. This time-consuming process has had a significant impact on the workload of financial aid staff.
State and Local Considerations
Explosive Growth in Student Financial Aid Demands: Over the past three years, our community college financial aid offices have seen a 52% rise in the number of financial aid applicants and a 43% rise in the number of financial aid recipients. This explosive growth

44 | California Community Colleges Chancellor’s Office
has placed an enormous burden on financial aid staff and has greatly diminished their capacity to provide financial aid services.
Unfilled SFA Staffing Vacancies: One of the most significant impacts on the workload of financial aid offices is their inability to receive campus administration approval to fill vacancies as turnover occurs. Financial aid directors are requesting permission to fill vacancies only to be informed that, due to budget cuts, a freeze has been implemented.
No COLA or Growth Triggers for SFA Administrative Funding: Despite a 71 percent growth in BOG Fee Waivers and a 75 percent growth in Pell since the capacity funding increased by 34.2 million in 2003/04, the SFA program administrative dollars have remained flat. This is particularly challenging, because 96 percent of this funding is spent on staffing and staffing related costs which have escalated as a result of step increases and benefit cost inflation. These automatic salary increases have encroached on program budgets and limited funding available to hire additional staff. As a result, the system has continued to incrementally lose staffing capacity since 2006/07.
Key Findings The BFAP-SFAA capacity and participation funding allowance has enabled colleges to significantly increase student awareness and participation in the financial aid programs. While the weakened economy has increased the number of financial aid applicants, the BFAP-SFAA budget funding has allowed the “I Can Afford College” campaign to continue to generate awareness of the availability of financial aid and allowed community colleges to continue their outreach efforts and meet the increased processing demands created by the rise in applicants and recipients. During the period from 2002/03 to 2009/10 enrollments actually dropped slightly, yet during this same period:
The number of financial aid applications has increased by 84%
The number of financial aid awards has increased by 71%
The number of Pell Grants has increased 75%
The number of BOG Fee Waivers has increased by 71%
The total amount of financial aid funds disbursed has increased by 149%
Student Financial Aid Programs 2009/10 | 45
These figures demonstrate the positive return on investment of the BFAP-SFAA funds. Since the funding of the BFAP-SFAA funds in 2003/04, students have enjoyed enormous benefits and now receive more than 400,000 additional financial aid awards and more than $1.3 billion in additional funds. Of this $1.3 billion, over $1 billion comes from increased federal funds. These federal funds not only benefit California’s students but also benefit California’s economy by providing outside resources that go directly into the local economies when students pay for books, rent, gas, food and other education-related expenses.
Conclusions The California Community Colleges and the “I Can Afford College” campaign have made remarkable strides in increasing financial aid awareness, applicants and recipients over the past two years. The Institute for College Access and Success (TICAS) reported that, in 2007/08, only one-third of CCC students apply for federal or institutional grant aid compared to 46 percent of community college students in other states. TICAS also reported that in 2007/08, an estimated 500,000 students who were likely eligible for a federal or institutional grant did not apply for it and stated that if all the likely Pell-eligible candidates had applied for federal aid, up to one-half billion more dollars could have flowed into. However, recent data show very different outcomes for 2009/10. The 2009/10 data show that the percentage of community college financial aid applicants actually grew from 33 percent to 48.3 percent, thereby surpassing even the national figure of 46 percent. The data also shows that Pell Grants grew by $688 million, thereby surpassing the additional half-billion-dollar potential reported by TICAS. Even with a decline in enrollments, nearly 1.3 million CCC students applied for aid in 2009/10. Pell Grant recipients increased by from 270,098 to 418,775 and Pell Grant dollars increased from $668 million to $1.36 billion. Whether community colleges can sustain the level of financial aid services provided will depend on the support provided to improve capacity and meet future demands. As the number of financial aid applicants increase, related servicing demands also increase. In the face of such growth, it will be

46 | California Community Colleges Chancellor’s Office
challenging for colleges to continue their outreach efforts and meet these demands without workload protection and additional funds.
One of the primary objectives of the BFAP-SFAA capacity funding is to increase staff to promote outreach and financial aid participation and provide the services needed to meet those increases. However, the “buying power” of the BFAP-SFAA funds is being eroded and staffing levels are dropping due to automatic increases in staff salaries.

Student Financial Aid Programs 2009/10 | 47
How the “I Can Afford College” Campaign Has Increased Awareness Overview
In the 2009/10 fiscal budget, $2.8 million was appropriated by the legislature for the “I Can Afford College” campaign to promote the following messages:
California community colleges are affordable
Financial aid and tax credits are available to cover fees and other college-related costs such as books, supplies and sometimes even living expenses
Financial aid information and application assistance is available on the icanaffordcollege.com website and through local community college financial aid offices
Target Audiences
The campaign has been charged with reaching low-income and disadvantaged students who must overcome barriers in accessing postsecondary education. The target audiences for the “I Can Afford College” campaign are as follows:
Teens and young adults age 16-24 with an annual combined household income at or below $40,000.
Adults age 25-54 with an annual combined household income at or below $40,000, with an emphasis on the unemployed and underemployed.
Influencers of primary and secondary audiences, including parents, teachers, counselors and community leaders.
Strategy
As in prior years, the campaign worked closely with the Chancellor’s Office and the California Community Colleges Student Financial Aid Advisors Association (CCCSFAAA) to develop the strategy and tactics for reaching the target audiences. Funding for the campaign was leveraged by partnering in paid advertising with other state campaigns, such as WhoDoUWant2B and

48 | California Community Colleges Chancellor’s Office
California Student Aid Commission’s Cash for College. Various advertising, marketing, media relations and outreach tactics drove traffic.
Summary of Results
Since the inception of the campaign in 2003/04, the number of students receiving some type of financial aid has increased from 652,641 to 1,045,122, or by 60 percent. Following is a summary of results achieved by the campaign during 2009/10 fiscal year:
icanaffordcollege.com received nearly 250,000 unique visitors viewing more than one million pages.
101.9 million listeners were reached through radio advertising and added value elements.
59 million viewers were reached through outdoor advertising.
Transit interior bus ads reached 61 million riders.
Nearly 3 million current students and potential students and their influencers were reached through statewide media relations efforts.
Roughly 18,000 current and potential students were directly connected with their local community college financial aid office for assistance through icanaffordcollege.com and 1-800-987-ICAN(4226).
Community college campuses promoted 806 financial aid workshops on icanaffordcollege.com. Students attending the events received one-on-one assistance completing financial aid applications.
More than 266,000 pieces of collateral and promotional material were provided statewide to community colleges, high schools, state agencies and campaigns and community and faith- based organizations free of charge.
Website
At the heart of the campaign is the bilingual English and Spanish website, icanaffordcollege.com. During 2009/10, icanaffordcollege.com received nearly 250,000 unique visitors viewing over one million pages. The website provides students with valuable information about financial aid, online access to the financial aid applications and connects them with financial aid professionals at their local college to receive free one-on-one assistance.

Student Financial Aid Programs 2009/10 | 49
The key features of the website include:
Online access to all of the necessary financial aid forms and answers to the most frequently asked financial aid questions
Zip code locator that offers students direct contact information for their nearest community college campuses, including physical and website addresses and financial aid office phone numbers and e-mail addresses
A financial aid event and workshop locator that helps students find a nearby event where they can receive FREE individual professional assistance to identify the types of aid that are right for them and to complete appropriate financial aid forms.
Students who do not have Internet access can call the toll-free phone line to get connected with a local financial aid office in their area. Advertising
The “I Can Afford College” campaign used advertising, mainly radio, billboards, bus ads and online properties, to reach our target audiences throughout the state and drive them to icanaffordcollege.com and the toll-free phone line. Funds were maximized by leveraging relationships with media partners and other state agencies to broaden the reach and frequency of paid advertising.
The following advertising campaigns ran during the 2009/10 fiscal year:
Radio
Historically, radio has proven to be very successful in reaching our target audiences. Through its longstanding relationship with Clear Channel, the campaign’s radio partner, target audiences were reached through traditional radio, web banners and streaming radio, billboards, and Pandora Radio, an online radio platform.
These advertising efforts resulted in:
An estimated 105,900 visitors to icanaffordcollege.com
101.9 million listeners were reached through paid radio and added-value elements
50 | California Community Colleges Chancellor’s Office
59 million viewers were reached through outdoor advertising
More than 4,900 radio spots streamed on the Internet
12.9 million impressions delivered by Pandora Radio
Nearly 5.71 million impressions were delivered by Internet promotions and website banners.
The following radio advertising flights took place during 2009/10: Run Dates: October 26 – December 5, 2009 Messaging: The messaging for this flight centered on the three steps necessary to get financial aid for the upcoming spring semester. Radio ads drove listeners to the home page of icanaffordcollege.com where they could complete the three steps: 1) Enroll at a community college, 2) Complete the FAFSA, and 3) Fill out the BOG Fee Waiver. Promotion: To provide additional incentive to visit icanaffordcollege.com, this radio flight included a “Community College Rocks” sweepstakes for the chance to win a trip for two to see “Any Band, Anywhere!” or the cash value of $4,000. The grand prize was provided by Clear Channel. The sweepstakes was promoted through on-air announcements on 18 radio stations and online streaming announcements on 19 of California’s largest radio stations. Clear Channel also included Pandora Radio in the promotion, delivering targeted impressions to 17-23 year old Californians. A total of 1,037 entries were received in the sweepstakes. Markets: Twenty-three media markets received advertising support during this radio campaign: Los Angeles, Fresno, Bakersfield, Modesto, Monterey/Salinas, Riverside/San Bernardino, Sacramento, San Francisco, San Jose, San Diego, San Luis Obispo, Santa Barbara Stockton, and Visalia. Oxnard/Ventura, Imperial County, Eureka-Humboldt, Santa Maria, Quincy, Santa Rosa, Merced, Chico and Redding were geo-targeted via Pandora Radio. Results: Clear Channel estimated that this paid radio campaign reached more than 27 million gross impressions for our target audiences. During this flight, the website had more than 43,000 visitors viewing nearly 110,000 pages.

Student Financial Aid Programs 2009/10 | 51
Run Dates: January 1 – March 2 Messaging: The campaign partnered with the California Student Aid Commission to deliver a joint I Can Afford College and Cash for College workshop message leading up to the March 2 Cal Grant deadline. Markets: Twenty-one media markets received advertising support during the campaign: Bakersfield, Fresno, Los Angeles, Merced, Modesto, Monterey/Salinas, Riverside/San Bernardino, Sacramento, San Francisco, San Diego, San Jose, Santa Barbara, Santa Maria/Lompoc, Stockton, and Visalia. Other small markets included Crescent City, Humboldt County, Imperial County, and San Luis Obispo. The Oxnard/Ventura and Victor Valley markets were geo-targeted via Pandora Radio. Results: Clear Channel estimated that this paid radio campaign delivered more than 18.4 gross impressions for our target audiences. During this flight, the website had more than 18,400 visitors viewing nearly 115,200 pages. Run Dates: March 29 – May 9, 2010 Messaging: The messaging for the spring campaign reminded students that it is not too late to apply for financial aid if they missed the March 2 Cal Grant deadline. The campaign also partnered with the WhoDoUWant2B campaign to deliver a Career Technical Education (CTE) message during this flight. The CTE message informed listeners about how they can turn their passion into a dream job through an education at the California Community Colleges. The primary target was widened to include adults, as unemployment in California has led many to return to school and find new careers. Promotion: To provide greater incentive for listeners to visit the website, this media flight included a “Free Ride to Community College” Sweepstakes for the chance to win a two-year community college scholarship and a 2010 Kia Soul. The scholarship, vehicle and other prizes were provided by Clear Channel. The sweepstakes was promoted through on-air promotional announcements on 31 radio stations, online streaming announcements on 21 radio stations’ websites and online interactive scratcher banners on 15 of California’s largest radio stations reaching the campaign’s target audiences. Scratcher banners are highly engaging, providing an element of excitement to the traditional web banner.

52 | California Community Colleges Chancellor’s Office
A total of 62 instant winners received $25 gas gift cards, $50 bookstore gift cards or one of two iPads for playing the “Free Ride to Community College” sweepstakes scratcher game. When participants “scratched” on the interactive banner, win or lose, they were automatically launched to the I Can Afford College campaign website to enter for the chance to win the community college scholarship and Kia Soul. A total of 12,533 entries were received in the “Free Ride to Community College” sweepstakes. Markets: Twenty-three media markets received advertising support during this radio campaign: Bakersfield, Crescent City, Fresno, Humboldt County, Imperial County, Los Angeles, Merced, Modesto, Monterey/Salinas, Riverside/San Bernardino, Sacramento, San Diego, San Francisco, San Jose, Santa Barbara, Santa Maria/Lompoc, Stockton, and Visalia. Other small markets included Chico, Oxnard/Ventura, San Luis Obispo, Santa Rosa and Victor Valley. Results: Clear Channel estimated that this paid radio campaign delivered more than 24.2 million gross impressions for our target audience. During this flight, the website had more than 44,500 visitors viewing nearly 314,000 pages.
Donated Radio and Outdoor Billboards In October of 2009, Clear Channel Sacramento radio stations KGBY-FM and KHYL-FM ran 84 added value announcements in support of “Take Control” a financial literacy and financial aid event held at Cosumnes River College. The stations also provided promotional staff, on-air station talent as well as live call-ins to drive listeners to the event. In April of 2010, Clear Channel coordinated a 30-minute block program in support of Financial Aid Awareness Month. The interview ran on Sacramento radio stations KQJK-FM, KGBY-FM, and KHLX-FM on April 25. Also in April, Clear Channel placed 40 outdoor billboards in San Diego and 56 outdoor billboards in Los Angeles for four week flights. The outdoor campaign featured the message “Go to Community College. We’ll Help Pay for It.” The campaign was able to substantially increase the value of the advertising budget as a result of cooperative efforts with Clear Channel. During the 2009/10 fiscal year, Clear Channel increased the campaign’s exposure by providing the following added value to media buys with an estimated value of $1.68 million:

Student Financial Aid Programs 2009/10 | 53
Free talent and production for all radio spots
Production of web banners and promotional artwork
1,865 additional on-air promotional announcements
2,400 additional five-second on-air adlets
More than 4,900 streamed spots online
Nearly 5.71 million impressions delivered by Web banners
More than 12.9 million impressions delivered online by Pandora Radio
Billboard space including printing and installation costs
Live radio remotes in support of Financial Aid Workshops and the fall 2009 Take Control Event at Cosumnes River College
Appearances at community colleges and high schools across the state in the branded 2010 Kia Soul to let students know about financial aid as well as register them for the chance to win the car and a community college scholarship
Promotional prizes, including a trip for the winner and a guest to see Any Band, Anywhere in the Community College Rocks Sweepstakes, and a Two-Year Community College Scholarship and a 2010 Kia Soul in the Free Ride to Community College Sweepstakes, along with instant win prizes including gas cards, bookstore gift cards, and two Apple iPads
Prime visibility at the Wango Tango concert, including premium booth space, printing and dissemination of icanaffordcollege.com t-shirts and campaign materials along with jumbotron announcements.
Recorded 30-minute block program that aired three times in support of Financial Aid Awareness Month in April 2010.
Transit Bus Ads The “I Can Afford College” campaign partnered with the Academic Senate for the California Community Colleges’ WhoDoUWant2B campaign to deliver a joint message that students can attend a community college to turn their passion into a career and that financial aid is available year-round to help them pay for it. The internal bus ads ran in 3,500 buses in seven markets throughout California, reaching more than 48 million riders from February 2010 through April 2010.
Starting in June 2010, “I Can Afford College” began a three-month bus interior ad campaign targeting the unemployed. These internal bus ads ran in

54 | California Community Colleges Chancellor’s Office
4,700 buses in 10 markets throughout California, reaching nearly 13 million riders in June 2010. The messaging informed those who are unemployed that the California Community Colleges provides career training to get them back out into the workforce quickly and financial aid is available to help pay for it. On average, 25 percent of all riders were ages 18-24 and 40 percent were ages 25-54, all with an average annual household income below $40,000. Of the riders, 28 percent were Hispanic, 26 percent were caucasian, 12 percent were African American and 8 percent were Asian. The bus ad space was donated by Blu Line Media. The “I Can Afford College” campaign only paid for the cost of printing. Online Advertising In May 2010, “I Can Afford College” launched its first online advertising campaign to broaden our reach to target audiences. The online ads were placed to provide maximum reach and exposure to low income audiences ages 16-24 and ages 25-54. Ads for ages 25-54 were targeted to reach the unemployed. Between May and June 2010, icanaffordcollege.com received 34,113 unique visitors as a result of online search engine and display campaigns. Media Relations
In addition to paid advertising, the campaign sought additional exposure through media relations. From more rural areas in the Central Valley to big metro areas like Los Angeles, the campaign received media coverage through TV, radio, Internet and print. The campaign was featured on various formats of both English and Spanish-language media including public affairs shows, community affairs shows, evening and morning television news and news talk radio. Interviews about the availability of financial aid aired on radio and TV stations throughout the state, including KXTV, Fox40, KNX, Univision, KNCI, KFBK, KGBY, KOGO, and KHLX. Stories appeared in newspapers such as the Modesto Bee, Santa Clarita Valley Signal, La Opinion and in New American Media ethnic publications throughout the state. During this time period, stories and interviews reached nearly 3 million viewers, readers, and/or listeners. These numbers are based on circulation numbers for newspapers and Nielsen numbers for broadcast outlets (many broadcast outlets were not counted in this figure as Nielsen viewer/listener numbers are not published for these outlets).

Student Financial Aid Programs 2009/10 | 55
Outreach
Grassroots outreach has helped launch the “I Can Afford College” campaign directly into the heart of underserved communities and established the campaign as a valuable resource on financial aid. Efforts to build partnerships with community and faith-based organizations continued in 2009/10. Since the campaign’s inception, relationships have been built with more than 175 community and faith-based organizations across the state including the East Bay Consortium, College Track, KHMER Girls in Action, California Coalition for Youth, Junior Achievement, Project Grad L.A., Cal SOAP, and Puente Project. Through these relationships, target audiences are hearing our messages from community members and organizations they trust. In addition to distributing “I Can Afford College” collateral materials, the campaign has engaged community organizations to offer their members (parents and students) free financial aid workshops. More importantly, the coordination of the workshops is really helping the community colleges develop and foster relationships with their local organizations. Additionally, the campaign participated in community events, from youth-targeted events to conferences for educational advocates. Examples include the Annual Cash for College Convention, Asian Youth Pacific Leadership Conference, Festival de la Familia, Pacific Rim Festival, Foster Care Month Kickoff at the Capitol, and California Association of School Counselors Conference. Community events have been a successful tool to raise awareness in parents, students, and education advocates to know that cost should never be a barrier to higher education and that financial aid is available year-round at the California Community Colleges.
Financial Aid Awareness – Spring 2010 The sixth annual California Community College Financial Aid Awareness Month (FAAM) took place in May 2010, marking another collaborative effort between the campaign and local campus financial aid offices. During FAAM, 101 colleges promoted more than 375 free financial aid workshops on icanaffordcollege.com to help students identify and apply for the financial aid programs that are available year-round. These events were supported by a
56 | California Community Colleges Chancellor’s Office
paid radio advertising campaign and media relations efforts that drove interested parties to icanaffordcollege.com where they received up-to-date information on financial aid workshops taking place in their community. To provide greater incentive for listeners to visit the website and attend financial aid workshops, the FAAM radio campaign included a “Free Ride to Community College” Sweepstakes for the chance to win a two-year community college scholarship and a 2010 Kia Soul. During FAAM, the 2010 Kia Soul, wrapped in I Can Afford College artwork, toured 13 high school and college campus financial aid events throughout California. On behalf of the campaign, the Clear Channel street team attended all of the events with a branded tent and campaign materials. The scholarship, vehicle and other prizes were provided by the campaigns radio partner, Clear Channel.

Student Financial Aid Programs 2009/10 | 57
Acknowledgments Chancellor Jack Scott would like to acknowledge and thank those individuals who have made significant contributions to this report.
CHANCELLOR’S OFFICE CALIFORNIA COMMUNITY COLLEGES
Erik Skinner, Executive Vice Chancellor
Student Services Division
Linda Michalowski, Vice Chancellor Jeff Spano, Dean
Tim Bonnel, Student Financial Assistance Coordinator Steve Arena, Retired Annuitant
Rhonda Mohr, Program Assistant II
Management Information Systems Division Patrick Perry, Vice Chancellor
Myrna Huffman, Administrator Debbie Gutierrez, Specialist
Economic and Workforce Development Division
Jeannine Clemons, Digital Composition Specialist II
Office of Communications Paul Feist, Vice Chancellor
Arie Cross, Project Manager
"I Can Afford College" Financial Aid Awareness Campaign

58 | California Community Colleges Chancellor’s Office

California Community Colleges Chancellor’s Office1102 Q Street | Sacramento, CA 95811
www.cccco.edu CORML #30 and #31