Embed Size (px)
Citation preview
CD Equisearch Pvt Ltd Feb 18, 2019
Equities Derivatives Commodities Distribution of Mutual Funds Distribution of Life Insurance
L.G.Balakrishnan & Brothers Ltd.
No. of shares (m) 31.4
Mkt cap (Rs crs/$m) 1213/170.2
Current price (Rs/$) 386/5.4
Price target (Rs/$) 544/7.6
52 W H/L (Rs.) 682/360
Book Value (Rs/$) 199/2.8
Beta 0.9
Daily volume (avg. monthly) 7070
P/BV (FY19e/20e) 1.9/1.7
EV/EBITDA (FY19e/20e) 5.8/4.9
P/E (FY19e/20e) 19.7/12.2/9.9
EPS growth (FY18/19e/20e) 21.9/16.4/22.9
OPM (FY18/19e/20e) 13.8/13.2/13.4
ROE (FY18/19e/20e) 16.3/16.7/17.9
ROCE(FY18/19e/20e) 14.5/15.2/16.7
D/E ratio (FY18/19e/20e) 0.2/0.2/0.1
BSE Code 500250
NSE Code LGBBROSLTD
Bloomberg LGBB IN
Reuters LGB.NS
Shareholding pattern %
Promoters 48.0
MFs / Banks / FIs 16.7
FPIs 0.6
Govt. Holding 0.0
Public & others 34.8
Total 100.0
As on Dec 31, 2018
Recommendation
BUY
Analyst
KISHAN GUPTA, CFA, FRM
Phone: + 91 (33) 4488 0043
E- mail: [email protected]
Consolidated (Rs crs)
FY16 FY17
FY18 FY19e FY20e
Income from operations 1205.30 1258.58 1418.00 1717.65 1985.86
Other Income 3.92 9.97 5.31 11.82 5.71
EBITDA (other income included) 141.60 171.90 200.86 238.32 271.40
Profit after MI & associate profit
63.37 69.94 85.28 99.31 122.03
EPS(Rs) 20.19 22.28 27.17 31.63 38.87
EPS growth (%) -3.9 10.4 21.9 16.4 22.9
Company Brief L G Balakrishnan (LGB) manufactures roller chains and undertakes metal
forming, including warm & cold forging, fine blanking and machined
parts.
Quarterly Highlights � Fortified by no smallish rise in revenues of metal forming business
(up 37.5%), overall revenues rose by a barely depressing 21.5% last
quarter. Belying historical trends, revenues of its flagship
transmission business has grown in high double digits for three
quarters in a row , galvanized by overall volume growth in excess of
20% in 9MFY19, thus reflecting gains in OEM market share.
Buoyancy in both fine products and machining business drove
recovery in metal forming business, whose revenues surge by a
gravity defying 32.4% in the first nine months of the current fiscal
compared to that in the same period a year ago.
� Margin stress in LGBs most distinguished transmission business
barely escaped attention in last two quarters (slid to 8.3% in Q3 from
9.9% in Q2), which unambiguously got reflected in its margins in
9MFY19 - 9.5% to 10.3% - thus eroding much of the volume gains
reported in dispatches to 2W OEMs. Yet metal forming business
margins hold up well , rising to all time high of 16% in Q2, before
normalizing in Q3 - still discernibly by over 300 bps in 9M to 12.3%.
� Near spectacular rise in post tax earnings in Q1 (nearly doubled then)
helped adjusted PAT - adjusted for exceptional gain of Rs 7.97 crs
arising from sale of land including to compulsory acquisition of land
of by Department of Highways - rose by 28% to Rs 73.15 crs compared
to Rs 57.17 crs in the nine months of the previous fiscal.
� The stock currently trades at 12.2x FY19e EPS of Rs 31.63 and 9.9x
FY20e EPS of Rs 38.87. Apart from higher capacities, the
commissioning of Chennai plant sometime early next fiscal would
strengthen its OEM engagement. Ample scope exists for capacity
ramp up at this plant as and when required. Amplified by modest
volume growth (in excess of 10% for both the bossiness) earnings are
projected to rise 16.4% on mid-teen growth in revenues. On balance
we maintain our buy rating on the stock with target of Rs 544
(previous target: Rs 662) based on 14x FY20e earnings.
2
2
CD Equisearch Pvt Ltd
Equities Derivatives Commodities Distribution of Mutual Funds Distribution of Life Insurance
[
Outlook & Recommendation
Two wheeler industry
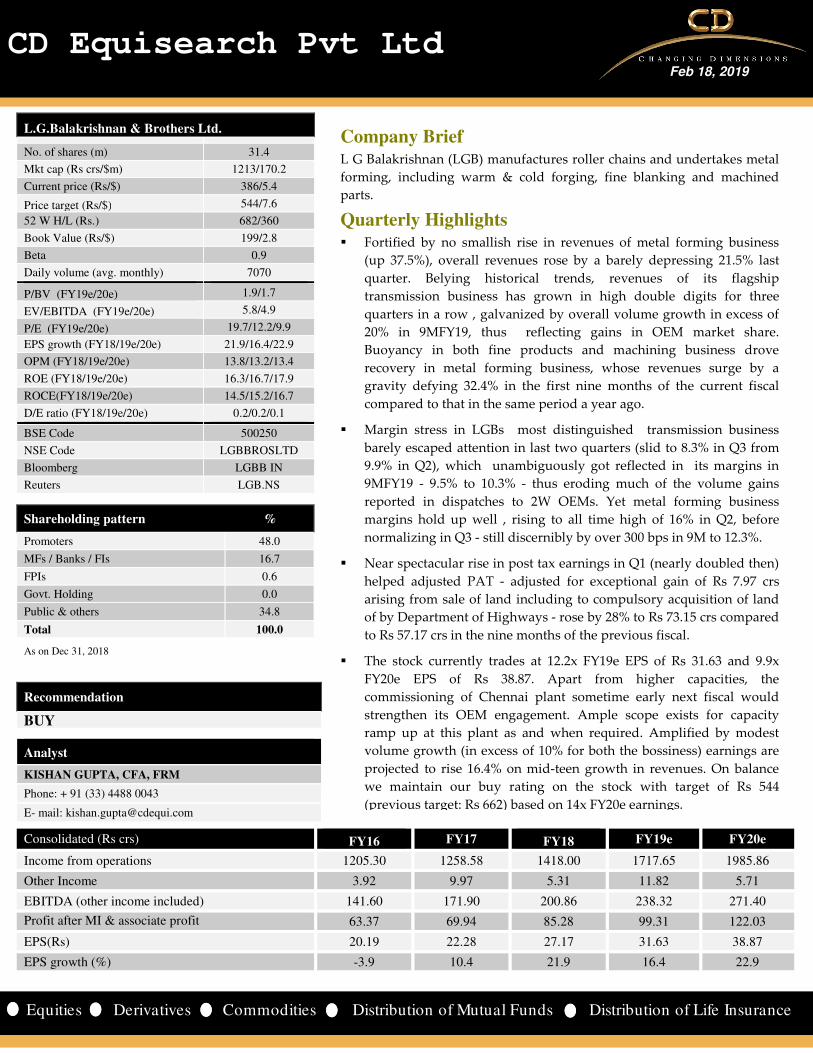
Motley of demand buttressing factors including higher minimum support price, farm loan waivers in select states and
improved sentiment post near - normal monsoon in last few years would support Indian two-wheeler industry projected
growth of 8-10% during FY19, reckons ICRA. It also contends that motorcycle demand would b supported by higher rural
income, while scooters demand would rise thanks to rapid urbanization, increased affordability and greater penetration.
Yet concerns of demand headwinds loom. Increasing prices of two wheelers - perpetuated by rising raw material prices,
increase in insurance premiums and rise in interest rates pose demand suppressing risks. But GOI's renewed thrust on rural
development and farmers welfare came to fore in recently concluded Union Budget, a welcome development for
manufacturers of two-wheelers, tractors, farm equipments and LCVs.
Honda Motorcycle and Scooter India, Senior Vice-President - Sales and Marketing, Yadvinder Singh Guleria, reckons that
higher disposable income in hands of 3 crore households for whom two-wheeler is a basic transport is most welcome. "We are
cautiously optimistic that the resultant positive customer sentiments can offset the industry slowdown caused by the
insurance premium hike and bring back the industry momentum to earlier estimate of higher single digits".
Higher fuel prices coupled with rising interest rates dented consumer sentiment prodding ICRA to revise downwards its
domestic passenger vehicle sales growth to 7-% from earlier guidance of 8-9%. It feels that despite subdued growth, credit
profile of most PV OEMs remain strong supported by healthy cash accruals and strong parentage. Yet SIAM is more modest in
its outlook for it expects PV sales growth of just 5.5% this year, a sharp climb down from previous estimate of 7-9%.
Financials & Valuation
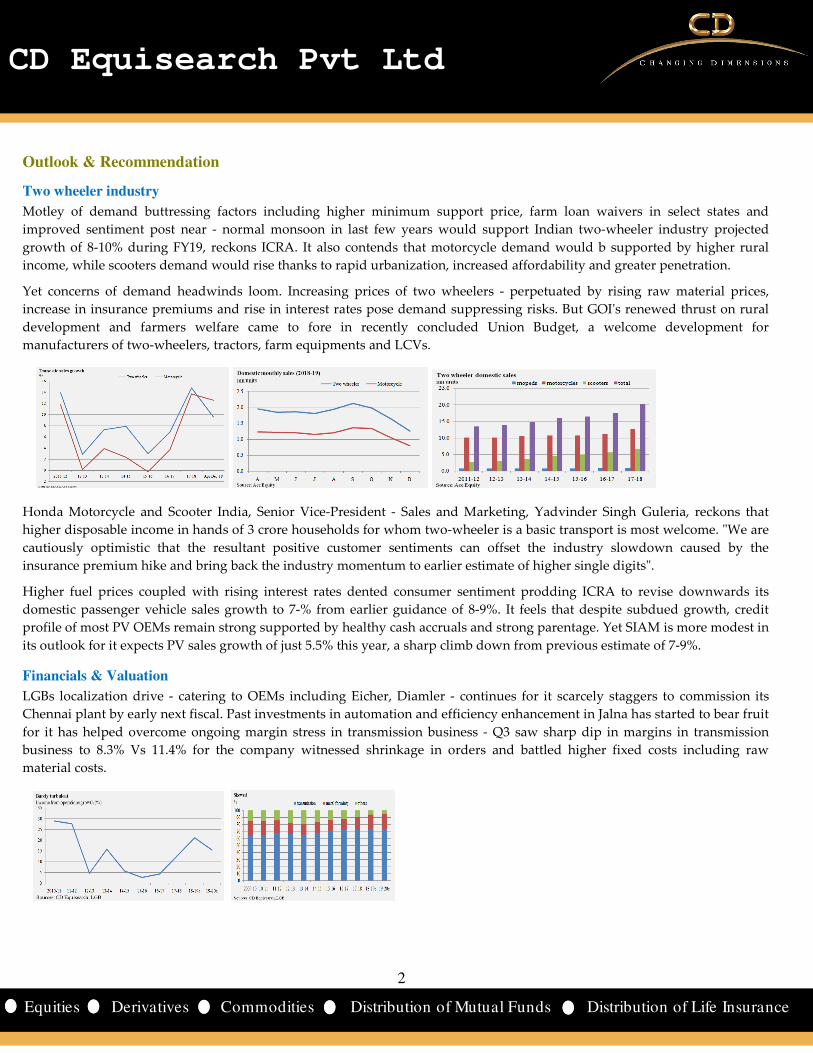
LGBs localization drive - catering to OEMs including Eicher, Diamler - continues for it scarcely staggers to commission its
Chennai plant by early next fiscal. Past investments in automation and efficiency enhancement in Jalna has started to bear fruit
for it has helped overcome ongoing margin stress in transmission business - Q3 saw sharp dip in margins in transmission
business to 8.3% Vs 11.4% for the company witnessed shrinkage in orders and battled higher fixed costs including raw
material costs.
3
3
CD Equisearch Pvt Ltd
Equities Derivatives Commodities Distribution of Mutual Funds Distribution of Life Insurance
Yet rising on high base effect of current fiscal and no dismal volume growth (Indian two wheeler industry estimated to grow in
high single digit), LGB's transmission business would stabilize next fiscal. Pass through of seemingly rigid fixed costs like
power & fuel, employee costs etc to cost conscious OEMs has proved to be a no small challenge for auto component suppliers.
Given intense competition and strong purchasing power of OEMs, auto component suppliers including LGB have oftentimes
failed to demonstrate strong pricing power.
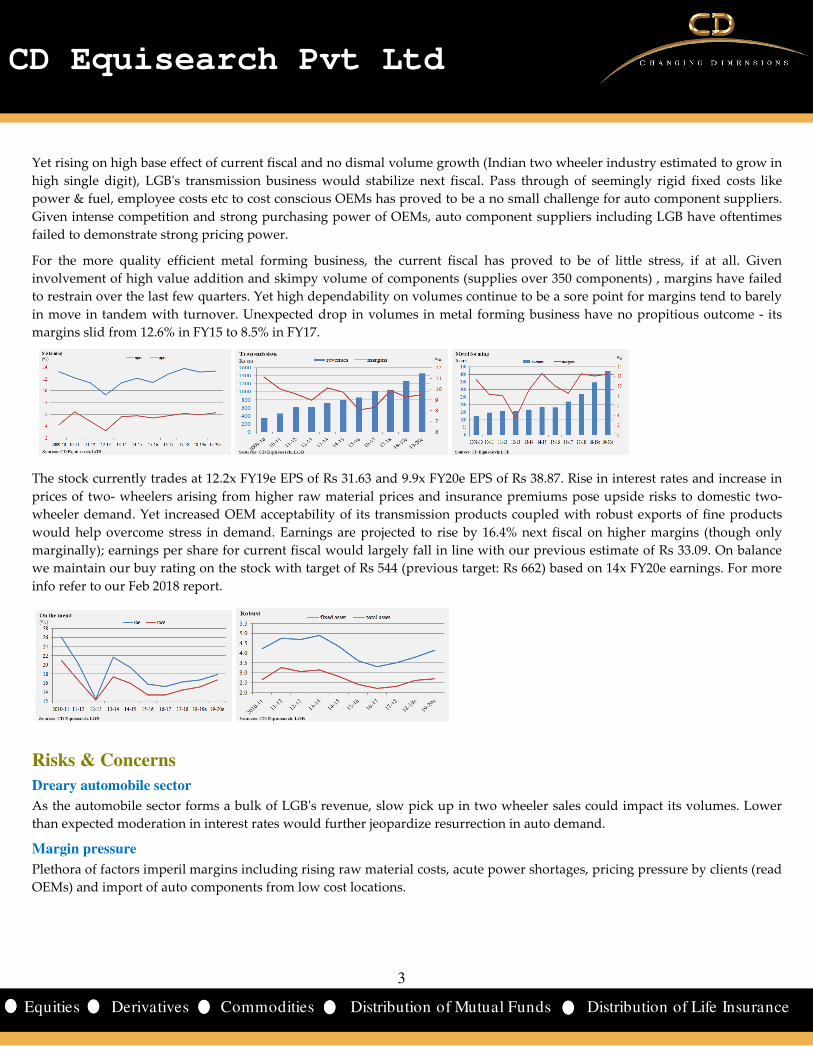
For the more quality efficient metal forming business, the current fiscal has proved to be of little stress, if at all. Given
involvement of high value addition and skimpy volume of components (supplies over 350 components) , margins have failed
to restrain over the last few quarters. Yet high dependability on volumes continue to be a sore point for margins tend to barely
in move in tandem with turnover. Unexpected drop in volumes in metal forming business have no propitious outcome - its
margins slid from 12.6% in FY15 to 8.5% in FY17.
The stock currently trades at 12.2x FY19e EPS of Rs 31.63 and 9.9x FY20e EPS of Rs 38.87. Rise in interest rates and increase in
prices of two- wheelers arising from higher raw material prices and insurance premiums pose upside risks to domestic two-
wheeler demand. Yet increased OEM acceptability of its transmission products coupled with robust exports of fine products
would help overcome stress in demand. Earnings are projected to rise by 16.4% next fiscal on higher margins (though only
marginally); earnings per share for current fiscal would largely fall in line with our previous estimate of Rs 33.09. On balance
we maintain our buy rating on the stock with target of Rs 544 (previous target: Rs 662) based on 14x FY20e earnings. For more
info refer to our Feb 2018 report.
Risks & Concerns
Dreary automobile sector
As the automobile sector forms a bulk of LGB's revenue, slow pick up in two wheeler sales could impact its volumes. Lower
than expected moderation in interest rates would further jeopardize resurrection in auto demand.
Margin pressure
Plethora of factors imperil margins including rising raw material costs, acute power shortages, pricing pressure by clients (read
OEMs) and import of auto components from low cost locations.
4
4
CD Equisearch Pvt Ltd
Equities Derivatives Commodities Distribution of Mutual Funds Distribution of Life Insurance
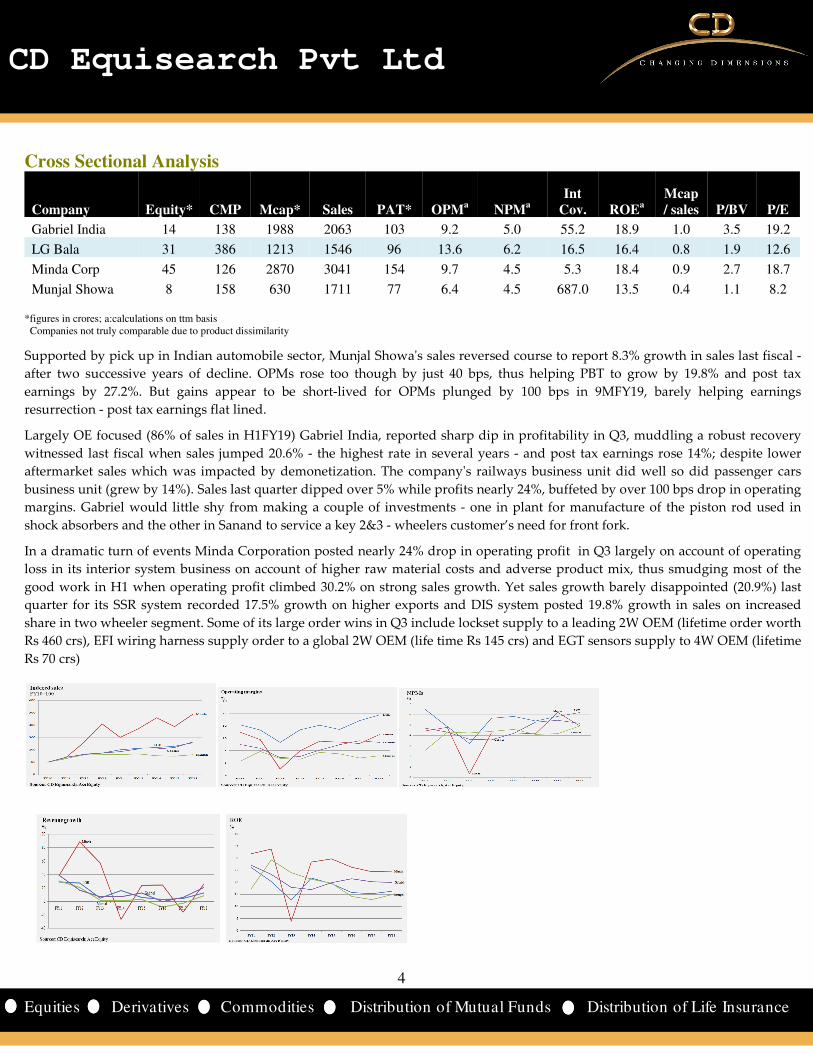
Cross Sectional Analysis
Company Equity* CMP Mcap* Sales PAT* OPMa NPMa Int
Cov. ROEa Mcap / sales P/BV P/E
Gabriel India 14 138 1988 2063 103 9.2 5.0 55.2 18.9 1.0 3.5 19.2
LG Bala 31 386 1213 1546 96 13.6 6.2 16.5 16.4 0.8 1.9 12.6
Minda Corp 45 126 2870 3041 154 9.7 4.5 5.3 18.4 0.9 2.7 18.7
Munjal Showa 8 158 630 1711 77 6.4 4.5 687.0 13.5 0.4 1.1 8.2 *figures in crores; a:calculations on ttm basis Companies not truly comparable due to product dissimilarity
Supported by pick up in Indian automobile sector, Munjal Showa's sales reversed course to report 8.3% growth in sales last fiscal -
after two successive years of decline. OPMs rose too though by just 40 bps, thus helping PBT to grow by 19.8% and post tax
earnings by 27.2%. But gains appear to be short-lived for OPMs plunged by 100 bps in 9MFY19, barely helping earnings
resurrection - post tax earnings flat lined.
Largely OE focused (86% of sales in H1FY19) Gabriel India, reported sharp dip in profitability in Q3, muddling a robust recovery
witnessed last fiscal when sales jumped 20.6% - the highest rate in several years - and post tax earnings rose 14%; despite lower
aftermarket sales which was impacted by demonetization. The company's railways business unit did well so did passenger cars
business unit (grew by 14%). Sales last quarter dipped over 5% while profits nearly 24%, buffeted by over 100 bps drop in operating
margins. Gabriel would little shy from making a couple of investments - one in plant for manufacture of the piston rod used in
shock absorbers and the other in Sanand to service a key 2&3 - wheelers customer’s need for front fork.
In a dramatic turn of events Minda Corporation posted nearly 24% drop in operating profit in Q3 largely on account of operating
loss in its interior system business on account of higher raw material costs and adverse product mix, thus smudging most of the
good work in H1 when operating profit climbed 30.2% on strong sales growth. Yet sales growth barely disappointed (20.9%) last
quarter for its SSR system recorded 17.5% growth on higher exports and DIS system posted 19.8% growth in sales on increased
share in two wheeler segment. Some of its large order wins in Q3 include lockset supply to a leading 2W OEM (lifetime order worth
Rs 460 crs), EFI wiring harness supply order to a global 2W OEM (life time Rs 145 crs) and EGT sensors supply to 4W OEM (lifetime
Rs 70 crs)
5
5
CD Equisearch Pvt Ltd
Equities Derivatives Commodities Distribution of Mutual Funds Distribution of Life Insurance
Financials
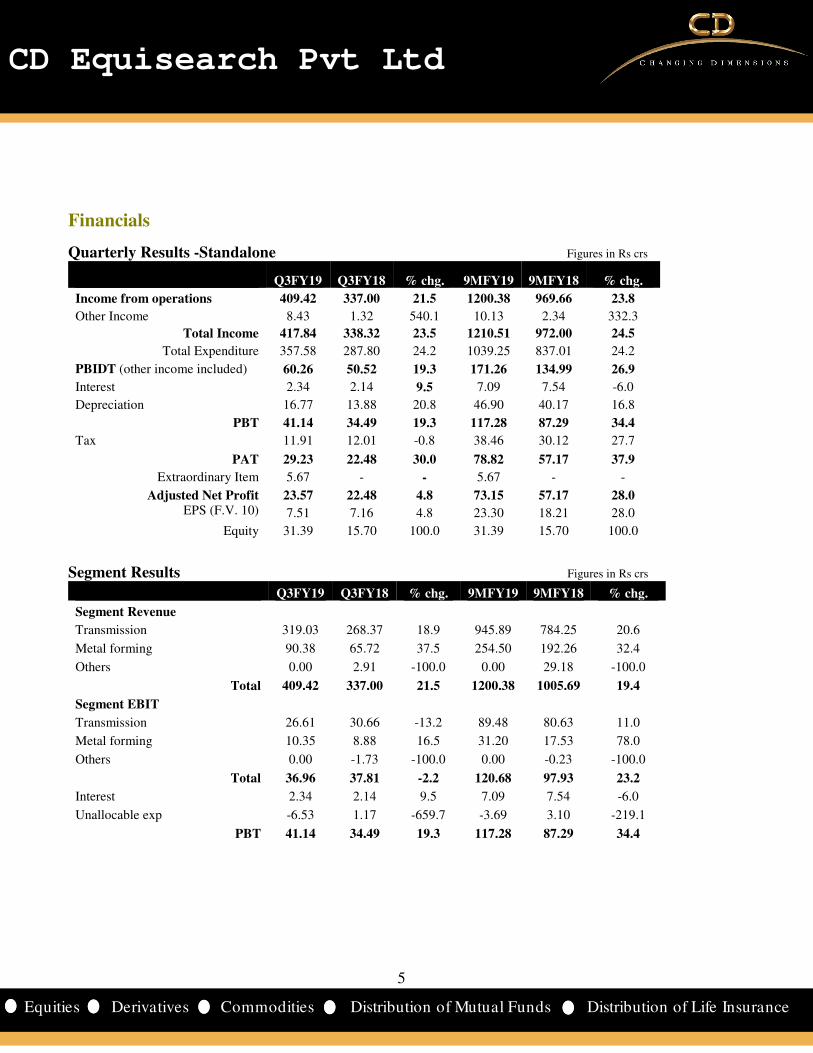
Quarterly Results -Standalone Figures in Rs crs
Q3FY19 Q3FY18 % chg. 9MFY19 9MFY18 % chg.
Income from operations 409.42 337.00 21.5 1200.38 969.66 23.8
Other Income 8.43 1.32 540.1 10.13 2.34 332.3
Total Income 417.84 338.32 23.5 1210.51 972.00 24.5
Total Expenditure 357.58 287.80 24.2 1039.25 837.01 24.2
PBIDT (other income included) 60.26 50.52 19.3 171.26 134.99 26.9
Interest 2.34 2.14 9.5 7.09 7.54 -6.0
Depreciation 16.77 13.88 20.8 46.90 40.17 16.8
PBT 41.14 34.49 19.3 117.28 87.29 34.4
Tax 11.91 12.01 -0.8 38.46 30.12 27.7
PAT 29.23 22.48 30.0 78.82 57.17 37.9
Extraordinary Item 5.67 - - 5.67 - -
Adjusted Net Profit 23.57 22.48 4.8 73.15 57.17 28.0 EPS (F.V. 10) 7.51 7.16 4.8 23.30 18.21 28.0
Equity 31.39 15.70 100.0 31.39 15.70 100.0
Segment Results Figures in Rs crs
Q3FY19 Q3FY18 % chg. 9MFY19 9MFY18 % chg.
Segment Revenue
Transmission 319.03 268.37 18.9 945.89 784.25 20.6
Metal forming 90.38 65.72 37.5 254.50 192.26 32.4
Others 0.00 2.91 -100.0 0.00 29.18 -100.0
Total 409.42 337.00 21.5 1200.38 1005.69 19.4
Segment EBIT
Transmission 26.61 30.66 -13.2 89.48 80.63 11.0
Metal forming 10.35 8.88 16.5 31.20 17.53 78.0
Others 0.00 -1.73 -100.0 0.00 -0.23 -100.0
Total 36.96 37.81 -2.2 120.68 97.93 23.2
Interest 2.34 2.14 9.5 7.09 7.54 -6.0
Unallocable exp -6.53 1.17 -659.7 -3.69 3.10 -219.1
PBT 41.14 34.49 19.3 117.28 87.29 34.4
6
6
CD Equisearch Pvt Ltd
Equities Derivatives Commodities Distribution of Mutual Funds Distribution of Life Insurance
Financials
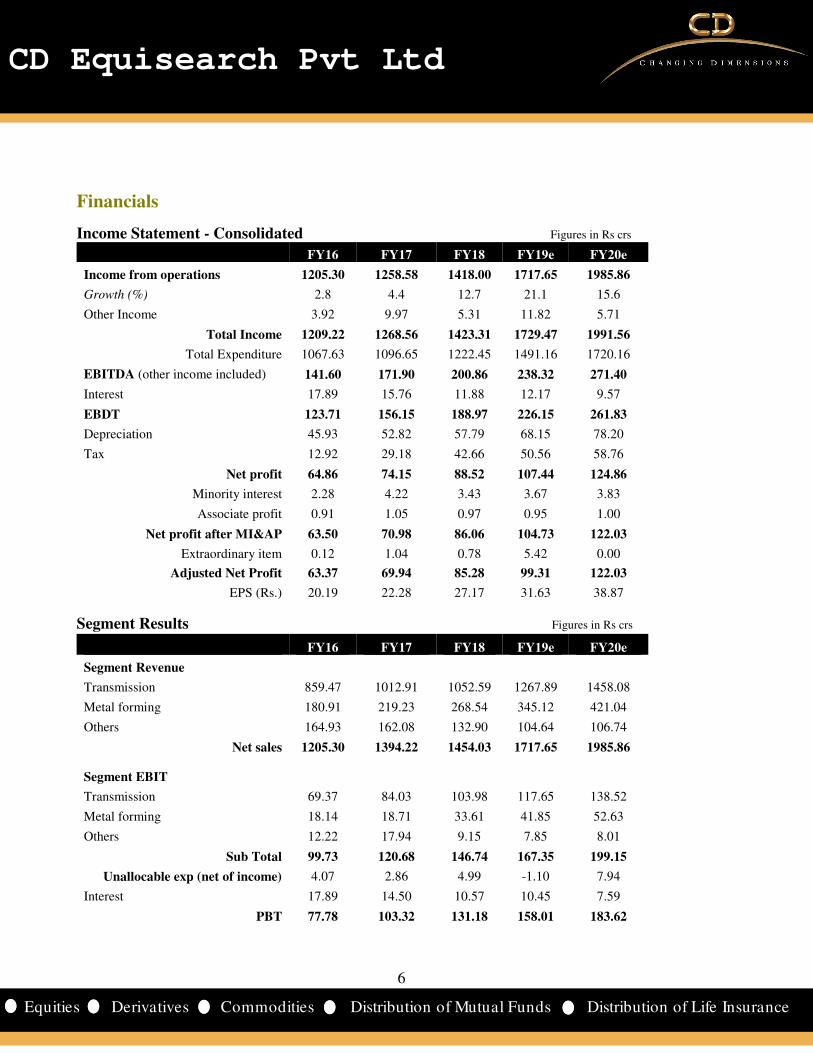
Income Statement - Consolidated Figures in Rs crs
FY16 FY17 FY18 FY19e FY20e
Income from operations 1205.30 1258.58 1418.00 1717.65 1985.86
Growth (%) 2.8 4.4 12.7 21.1 15.6
Other Income 3.92 9.97 5.31 11.82 5.71
Total Income 1209.22 1268.56 1423.31 1729.47 1991.56
Total Expenditure 1067.63 1096.65 1222.45 1491.16 1720.16
EBITDA (other income included) 141.60 171.90 200.86 238.32 271.40
Interest 17.89 15.76 11.88 12.17 9.57
EBDT 123.71 156.15 188.97 226.15 261.83
Depreciation 45.93 52.82 57.79 68.15 78.20
Tax 12.92 29.18 42.66 50.56 58.76
Net profit 64.86 74.15 88.52 107.44 124.86
Minority interest 2.28 4.22 3.43 3.67 3.83
Associate profit 0.91 1.05 0.97 0.95 1.00
Net profit after MI&AP 63.50 70.98 86.06 104.73 122.03
Extraordinary item 0.12 1.04 0.78 5.42 0.00
Adjusted Net Profit 63.37 69.94 85.28 99.31 122.03
EPS (Rs.) 20.19 22.28 27.17 31.63 38.87
Segment Results Figures in Rs crs
FY16 FY17 FY18 FY19e FY20e
Segment Revenue
Transmission 859.47 1012.91 1052.59 1267.89 1458.08
Metal forming 180.91 219.23 268.54 345.12 421.04
Others 164.93 162.08 132.90 104.64 106.74
Net sales 1205.30 1394.22 1454.03 1717.65 1985.86 Segment EBIT
Transmission 69.37 84.03 103.98 117.65 138.52
Metal forming 18.14 18.71 33.61 41.85 52.63
Others 12.22 17.94 9.15 7.85 8.01
Sub Total 99.73 120.68 146.74 167.35 199.15
Unallocable exp (net of income) 4.07 2.86 4.99 -1.10 7.94
Interest 17.89 14.50 10.57 10.45 7.59
PBT 77.78 103.32 131.18 158.01 183.62
7
7
CD Equisearch Pvt Ltd
Equities Derivatives Commodities Distribution of Mutual Funds Distribution of Life Insurance
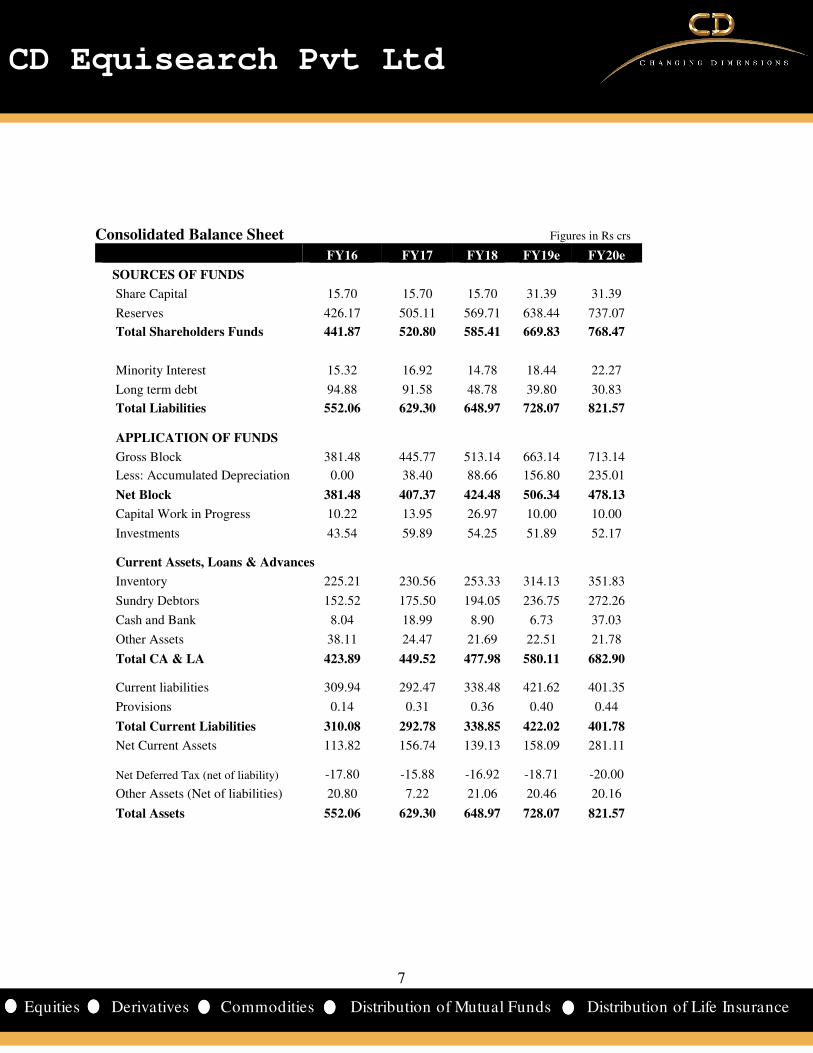
Consolidated Balance Sheet Figures in Rs crs
FY16 FY17 FY18 FY19e FY20e
SOURCES OF FUNDS
Share Capital 15.70 15.70 15.70 31.39 31.39
Reserves 426.17 505.11 569.71 638.44 737.07
Total Shareholders Funds 441.87 520.80 585.41 669.83 768.47
Minority Interest 15.32 16.92 14.78 18.44 22.27
Long term debt 94.88 91.58 48.78 39.80 30.83
Total Liabilities 552.06 629.30 648.97 728.07 821.57
APPLICATION OF FUNDS
Gross Block 381.48 445.77 513.14 663.14 713.14
Less: Accumulated Depreciation 0.00 38.40 88.66 156.80 235.01
Net Block 381.48 407.37 424.48 506.34 478.13
Capital Work in Progress 10.22 13.95 26.97 10.00 10.00
Investments 43.54 59.89 54.25 51.89 52.17
Current Assets, Loans & Advances
Inventory 225.21 230.56 253.33 314.13 351.83 Sundry Debtors 152.52 175.50 194.05 236.75 272.26 Cash and Bank 8.04 18.99 8.90 6.73 37.03 Other Assets 38.11 24.47 21.69 22.51 21.78 Total CA & LA 423.89 449.52 477.98 580.11 682.90
Current liabilities 309.94 292.47 338.48 421.62 401.35 Provisions 0.14 0.31 0.36 0.40 0.44 Total Current Liabilities 310.08 292.78 338.85 422.02 401.78 Net Current Assets 113.82 156.74 139.13 158.09 281.11
Net Deferred Tax (net of liability) -17.80 -15.88 -16.92 -18.71 -20.00 Other Assets (Net of liabilities) 20.80 7.22 21.06 20.46 20.16 Total Assets 552.06 629.30 648.97 728.07 821.57
8
8
CD Equisearch Pvt Ltd
Equities Derivatives Commodities Distribution of Mutual Funds Distribution of Life Insurance
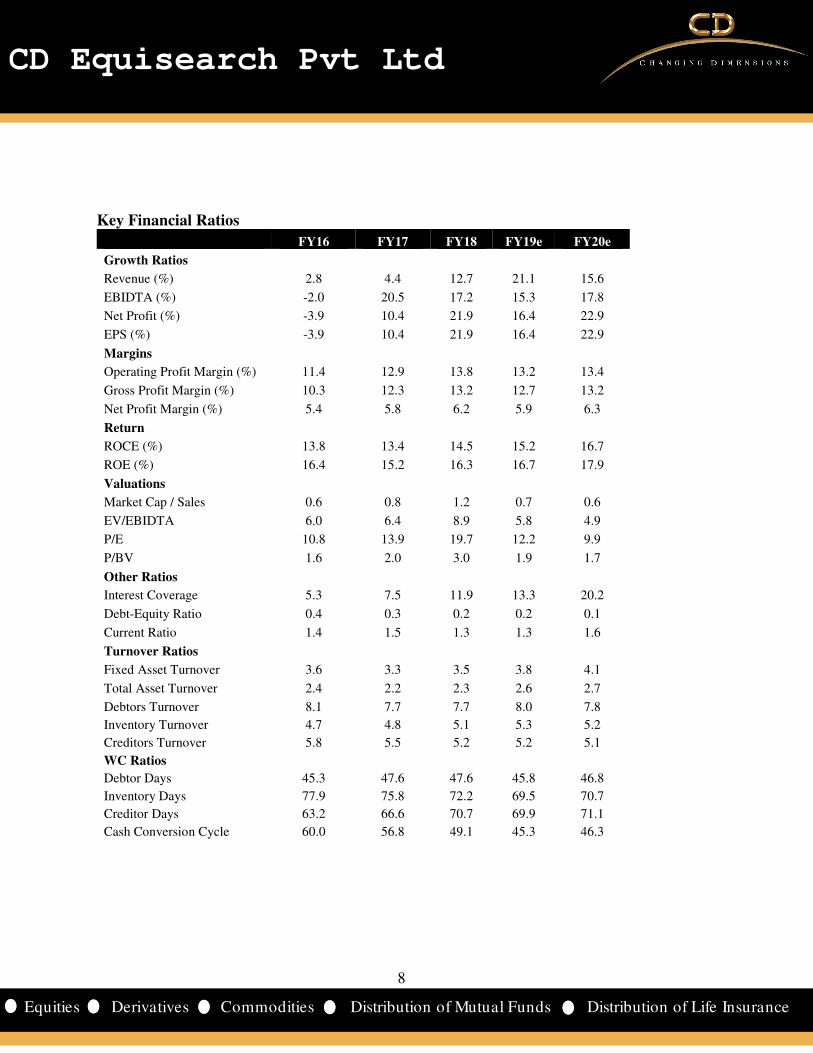
Key Financial Ratios
FY16 FY17 FY18 FY19e FY20e
Growth Ratios
Revenue (%) 2.8 4.4 12.7 21.1 15.6
EBIDTA (%) -2.0 20.5 17.2 15.3 17.8
Net Profit (%) -3.9 10.4 21.9 16.4 22.9
EPS (%) -3.9 10.4 21.9 16.4 22.9
Margins
Operating Profit Margin (%) 11.4 12.9 13.8 13.2 13.4
Gross Profit Margin (%) 10.3 12.3 13.2 12.7 13.2
Net Profit Margin (%) 5.4 5.8 6.2 5.9 6.3
Return
ROCE (%) 13.8 13.4 14.5 15.2 16.7
ROE (%) 16.4 15.2 16.3 16.7 17.9
Valuations
Market Cap / Sales 0.6 0.8 1.2 0.7 0.6
EV/EBIDTA 6.0 6.4 8.9 5.8 4.9
P/E 10.8 13.9 19.7 12.2 9.9
P/BV 1.6 2.0 3.0 1.9 1.7
Other Ratios
Interest Coverage 5.3 7.5 11.9 13.3 20.2
Debt-Equity Ratio 0.4 0.3 0.2 0.2 0.1
Current Ratio 1.4 1.5 1.3 1.3 1.6
Turnover Ratios
Fixed Asset Turnover 3.6 3.3 3.5 3.8 4.1
Total Asset Turnover 2.4 2.2 2.3 2.6 2.7
Debtors Turnover 8.1 7.7 7.7 8.0 7.8
Inventory Turnover 4.7 4.8 5.1 5.3 5.2
Creditors Turnover 5.8 5.5 5.2 5.2 5.1
WC Ratios
Debtor Days 45.3 47.6 47.6 45.8 46.8
Inventory Days 77.9 75.8 72.2 69.5 70.7
Creditor Days 63.2 66.6 70.7 69.9 71.1
Cash Conversion Cycle 60.0 56.8 49.1 45.3 46.3
9
9
CD Equisearch Pvt Ltd
Equities Derivatives Commodities Distribution of Mutual Funds Distribution of Life Insurance
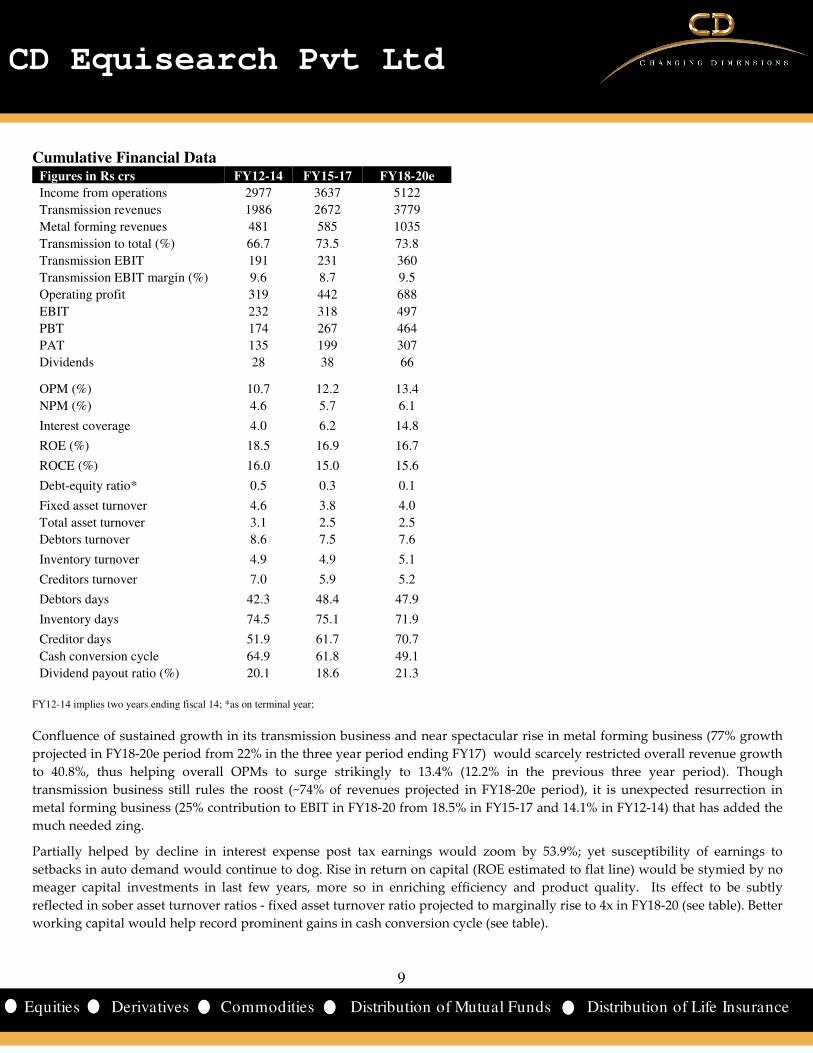
Cumulative Financial Data Figures in Rs crs FY12-14 FY15-17 FY18-20e
Income from operations 2977 3637 5122
Transmission revenues 1986 2672 3779
Metal forming revenues 481 585 1035
Transmission to total (%) 66.7 73.5 73.8
Transmission EBIT 191 231 360
Transmission EBIT margin (%) 9.6 8.7 9.5
Operating profit 319 442 688
EBIT 232 318 497
PBT 174 267 464
PAT 135 199 307
Dividends 28 38 66 OPM (%) 10.7 12.2 13.4
NPM (%) 4.6 5.7 6.1
Interest coverage 4.0 6.2 14.8
ROE (%) 18.5 16.9 16.7
ROCE (%) 16.0 15.0 15.6
Debt-equity ratio* 0.5 0.3 0.1
Fixed asset turnover 4.6 3.8 4.0
Total asset turnover 3.1 2.5 2.5
Debtors turnover 8.6 7.5 7.6
Inventory turnover 4.9 4.9 5.1
Creditors turnover 7.0 5.9 5.2
Debtors days 42.3 48.4 47.9
Inventory days 74.5 75.1 71.9
Creditor days 51.9 61.7 70.7
Cash conversion cycle 64.9 61.8 49.1
Dividend payout ratio (%) 20.1 18.6 21.3
FY12-14 implies two years ending fiscal 14; *as on terminal year;
Confluence of sustained growth in its transmission business and near spectacular rise in metal forming business (77% growth
projected in FY18-20e period from 22% in the three year period ending FY17) would scarcely restricted overall revenue growth
to 40.8%, thus helping overall OPMs to surge strikingly to 13.4% (12.2% in the previous three year period). Though
transmission business still rules the roost (~74% of revenues projected in FY18-20e period), it is unexpected resurrection in
metal forming business (25% contribution to EBIT in FY18-20 from 18.5% in FY15-17 and 14.1% in FY12-14) that has added the
much needed zing.
Partially helped by decline in interest expense post tax earnings would zoom by 53.9%; yet susceptibility of earnings to
setbacks in auto demand would continue to dog. Rise in return on capital (ROE estimated to flat line) would be stymied by no
meager capital investments in last few years, more so in enriching efficiency and product quality. Its effect to be subtly
reflected in sober asset turnover ratios - fixed asset turnover ratio projected to marginally rise to 4x in FY18-20 (see table). Better
working capital would help record prominent gains in cash conversion cycle (see table).
10
10
CD Equisearch Pvt Ltd
Equities Derivatives Commodities Distribution of Mutual Funds Distribution of Life Insurance
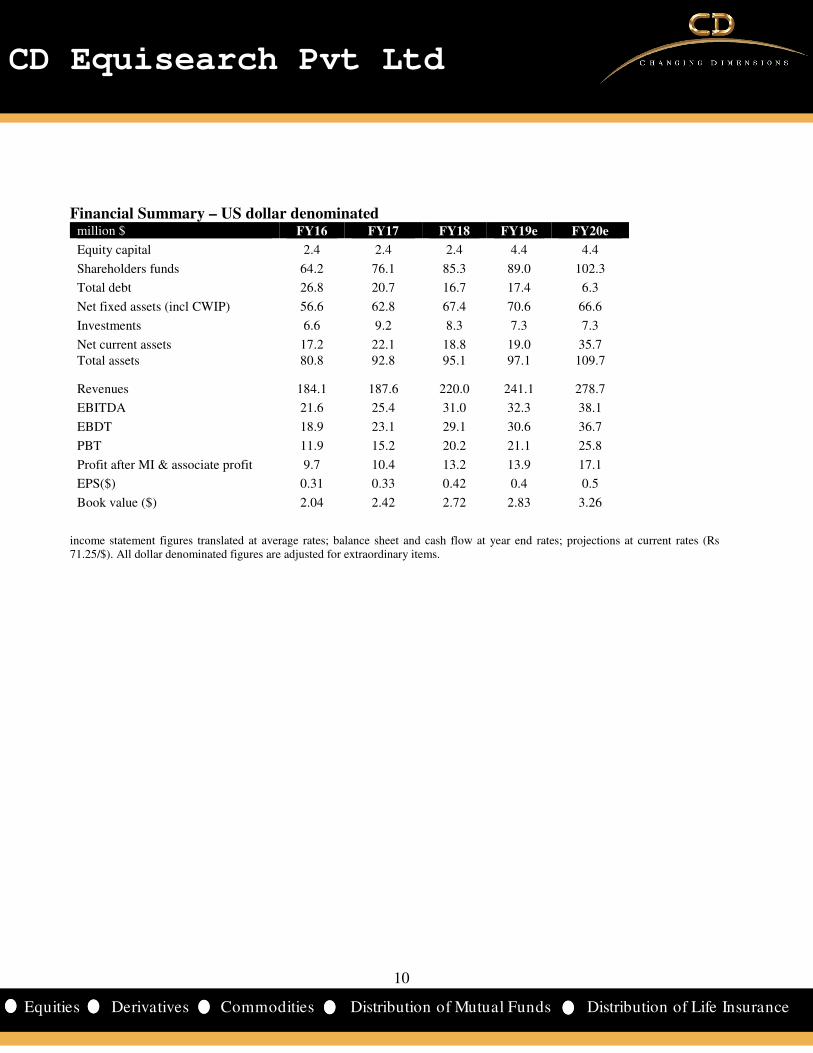
Financial Summary – US dollar denominated million $ FY16 FY17 FY18 FY19e FY20e
Equity capital 2.4 2.4 2.4 4.4 4.4
Shareholders funds 64.2 76.1 85.3 89.0 102.3
Total debt 26.8 20.7 16.7 17.4 6.3
Net fixed assets (incl CWIP) 56.6 62.8 67.4 70.6 66.6
Investments 6.6 9.2 8.3 7.3 7.3
Net current assets 17.2 22.1 18.8 19.0 35.7
Total assets 80.8 92.8 95.1 97.1 109.7
Revenues 184.1 187.6 220.0 241.1 278.7
EBITDA 21.6 25.4 31.0 32.3 38.1
EBDT 18.9 23.1 29.1 30.6 36.7
PBT 11.9 15.2 20.2 21.1 25.8
Profit after MI & associate profit 9.7 10.4 13.2 13.9 17.1
EPS($) 0.31 0.33 0.42 0.4 0.5
Book value ($) 2.04 2.42 2.72 2.83 3.26
income statement figures translated at average rates; balance sheet and cash flow at year end rates; projections at current rates (Rs 71.25/$). All dollar denominated figures are adjusted for extraordinary items.
11
11
CD Equisearch Pvt Ltd
Equities Derivatives Commodities Distribution of Mutual Funds Distribution of Life Insurance
Disclosure& Disclaimer CD Equisearch Private Limited (hereinafter referred to as ‘CD Equi’) is a Member registered with National Stock Exchange of India Limited,
Bombay Stock Exchange Limited and Metropolitan Stock Exchange of India Limited (Formerly known as MCX Stock Exchange Limited). CD
Equi is also registered as Depository Participant with CDSL and AMFI registered Mutual Fund Advisor. The associates of CD Equi are
engaged in activities relating to NBFC-ND - Financing and Investment, Commodity Broking, Real Estate, etc.
CD Equi is registered under SEBI (Research Analysts) Regulations, 2014 with SEBI Registration no INH300002274. Further, CD Equi hereby
declares that –
• No disciplinary action has been taken against CD Equi by any of the regulatory authorities.
• CD Equi/its associates/research analysts do not have any financial interest/beneficial interest of more than one percent/material
conflict of interest in the subject company(s) (kindly disclose if otherwise).
• CD Equi/its associates/research analysts have not received any compensation from the subject company(s) during the past twelve
months.
• CD Equi/its research analysts has not served as an officer, director or employee of company covered by analysts and has not been
engaged in market making activity of the company covered by analysts.
This document is solely for the personal information of the recipient and must not be singularly used as the basis of any investment decision.
Nothing in this document should be construed as investment or financial advice. Each recipient of this document should make such
investigations as they deem necessary to arrive at an independent evaluation of an investment in the securities of the companies referred to in
this document (including the merits and risks involved) and should consult their own advisors to determine the merits and risks of such an
investment.
Reports based on technical and derivative analysis center on studying charts of a stock's price movement, outstanding positions and trading
volume, as opposed to focusing on a company's fundamentals and as such, may not match with a report on a company's fundamentals.
The information in this document has been printed on the basis of publicly available information, internal data and other reliable sources
believed to be true but we do not represent that it is accurate or complete and it should not be relied on as such, as this document is for general
guidance only. CD Equi or any of its affiliates/group companies shall not be in any way responsible for any loss or damage that may arise to
any person from any inadvertent error in the information contained in this report. CD Equi has not independently verified all the information
contained within this document. Accordingly, we cannot testify nor make any representation or warranty, express or implied, to the accuracy,
contents or data contained within this document.
While, CD Equi endeavors to update on a reasonable basis the information discussed in this material, there may be regulatory compliance or
other reasons that prevent us from doing so.
This document is being supplied to you solely for your information and its contents, information or data may not be reproduced, redistributed
or passed on, directly or indirectly. Neither, CD Equi nor its directors, employees or affiliates shall be liable for any loss or damage that may
arise from or in connection with the use of this information.
CD Equisearch Private Limited (CIN: U67120WB1995PTC071521)
Registered Office: 37, Shakespeare Sarani, 3rd Floor, Kolkata – 700 017; Phone: +91(33) 4488 0000; Fax: +91(33) 2289 2557 Corporate Office: 10,
Vasawani Mansion, 5th Floor, Dinshaw Wachha Road, Churchgate, Mumbai – 400 020. Phone: +91(22) 2283 0652/0653; Fax: +91(22) 2283, 2276
Website: www.cdequi.com; Email: [email protected]
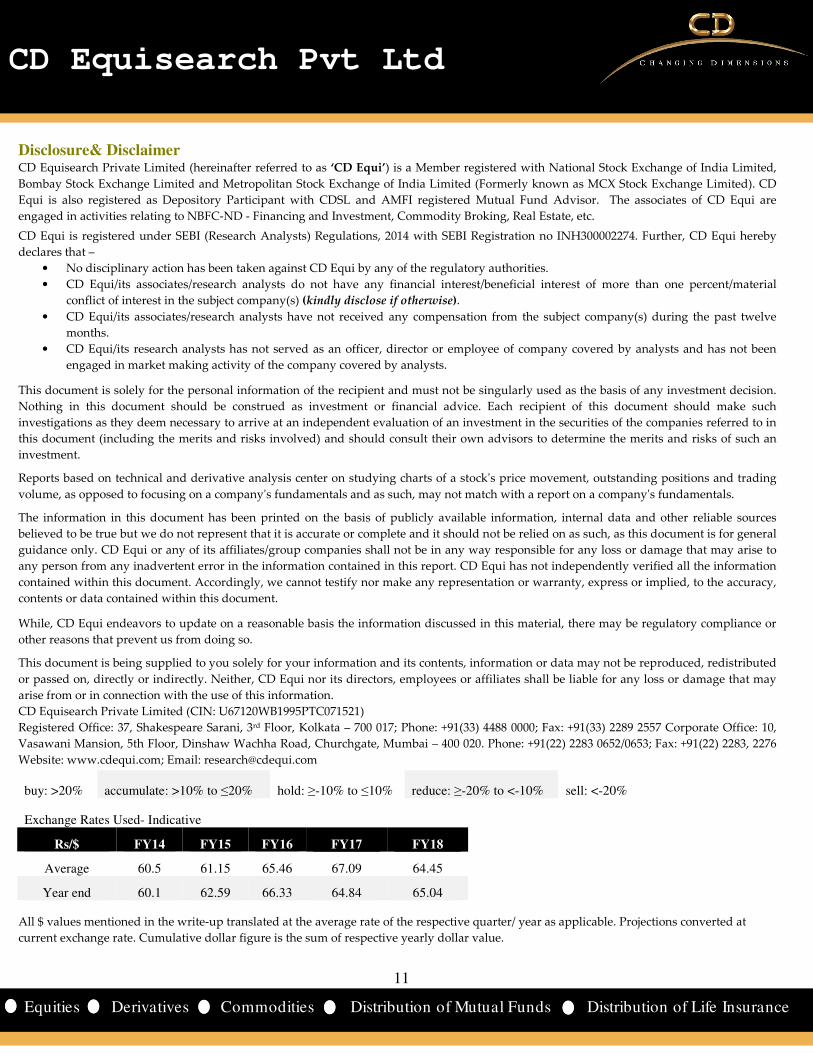
buy: >20% accumulate: >10% to ≤20% hold: ≥-10% to ≤10% reduce: ≥-20% to <-10% sell: <-20%
Exchange Rates Used- Indicative
Rs/$ FY14 FY15 FY16 FY17 FY18
Average 60.5 61.15 65.46 67.09 64.45
Year end 60.1 62.59 66.33 64.84 65.04
All $ values mentioned in the write-up translated at the average rate of the respective quarter/ year as applicable. Projections converted at
current exchange rate. Cumulative dollar figure is the sum of respective yearly dollar value.