Embed Size (px)
Citation preview
CD Equisearch Pvt Ltd Feb 13, 2017
Equities Derivatives Commodities Distribution of Mutual Funds Distribution of Life Insurance
Orient Refractories Ltd. (ORL)
No. of shares (m) 120.1
Mkt cap (Rs crs/$m) 1621/242.0
Current price (Rs/$) 135/2.0
Price target (Rs/$) 161/2.4
52 W H/L (Rs.) 136/71
Book Value (Rs/$) 21/0.3
Beta 0.7
Daily volume (avg. monthly) 102460
P/BV (FY17e/18e) 6.5/5.3
EV/EBITDA (FY17e/18e) 13.6/11.8
P/E (FY17e/18e) 23.3/20.1
EPS growth (FY16/F17e/18e) 6.1/25.2/15.5
OPM (FY16/17e/18e) 18.7/19.6/19.8
ROE (FY16/17e/18e) 29.7/30.6/28.9
ROCE(FY16/17e/18e) 29.3/30.6/28.9
D/E ratio (FY16/17e/18e) -/-/-
BSE Code 534076
NSE Code ORIENTREF
Bloomberg ORIENT IN
Reuters ORRE.BO
Shareholding pattern %
Promoters 69.6
MFs / Banks / FIs 6.3
Foreign Portfolio Investors 5.2
Govt. Holding -
Public & Others 18.9
Total 100
As on Dec 31, 2016
Recommendation
ACCUMULATE
Phone: + 91 (33) 4488 0055
E- mail: [email protected]
Figures in Rs crs
FY14
FY15
FY16
FY17e
FY18e
Income from Operations 403.50 451.36 458.88 526.61 595.07
Other Income 4.10 4.64 5.38 9.41 11.67
EBITDA (other income included) 83.29 85.16 90.56 112.44 129.20
Adjusted Net Profit 53.00 52.48 55.68 69.70 80.47
EPS (Rs) 4.41 4.37 4.63 5.80 6.70
EPS growth (%) 24.1 -1.0 6.1 25.2 15.5
Company Brief Orient Refractories Ltd is a manufacture of wide range of refractories and
monolithics for iron and steel industry serving both domestic and international
clientele.
Highlights � Growing at an expeditious pace in the current fiscal, the Indian steel
production has seen one of the best growth rates in atleast last five years
(10.5% in 9mFY17) on account of production cut by China and import
reduction. This has proved propitious for the refractory market in India
which is highly correlated with the steel production and demand.
� The dubiety in the market brought by the phasing out of high value
currency impacted the revenues of ORL in the last quarter (though lower
than expected) +11.3% (y-o-y) in Q3FY17 vs 19.2% (y-o-y) in H1FY17.
Assisted by favorable industry dynamics and deep market penetration,
ORL managed to post a robust 16.5% revenue growth in 9mFY17 to Rs
391.54 crs ($58.3m) vs Rs 336.10 crs ($51.9m) reported in same period last
year.
� Benefits of operating costs in the current fiscal (operating leverage 1.9x in
9mFY17) resulted in sturdy expansion in operating margins (181 bps) from
17.8% in 9mFY16 to 19.6% in 9mFY17. Also, increase of 54.1% in other
income galvanized the EBITDA- 29.9% growth in the nine months to Rs
82.77 crs ($12.3m) compared to Rs 63.71 crs ($9.8m) in the same period last
fiscal. Also, the gross profit margins also moved up by 2.19% to 21.1% in
9mFY17 (19% in 9mFY16). This helped ORL to advance its profit after tax
by a hefty 28.9% in 9mFY17 to Rs 50.92 crs/$7.6m (Rs 39.50 crs/$6.1m in
9mFY16).
� The stock currently trades at 23.3x FY17 EPS of Rs 5.80 (6.5x FY17 BV) and
20.1x FY18 EPS of Rs 6.70 (5.3x FY18 BV). Backward linkages with realty
sector, higher allocation to the housing sector (also awarded infrastructure
status) in the Budget may boost prospects of Indian steel industry.
Government’s decision to increase trade barriers (MIP imposition) on steel
led to a noticeable increase in domestic production in the current fiscal
which support ORL’s volumes. However, inventory buildup of finished
steel in the current fiscal on higher production and consumption growth
remaining anaemic may slowdown steel production in the next fiscal-
moderating the sales volumes for ORL. At net profit margins of 13.2-13.5%,
profits are expected to grow at a CAGR of 20.2% over the next two years.
Weighing the considerable factors affecting the operations of ORL, we
assign ‘accumulate’ rating on the stock at a target of Rs 161 based on 24x
FY18e EPS (peg ratio: 1.2) over a period of 6-9 months.
2
2
CD Equisearch Pvt Ltd
Equities Derivatives Commodities Distribution of Mutual Funds Distribution of Life Insurance
[
Company Profile
Orient Refractories Ltd (ORL) was incorporated in November, 2010 when Orient Abrasives Ltd (OAL) decided to demerge its
refractory undertaking with a view to de-risk and segregate the refractory business from the other two businesses viz. abrasive
grains and power generation. The refractory undertaking was transferred with effect from April 1, 2011. Refractory products
are substances that can withstand high ranges of temperatures of over 500ºC. They are mainly used in production plants of
metals, glass and lime where very high temperatures are required in the furnaces to melt metals and other elements or
compounds. ORL manufactures, distributes, and sells refractories, monolithics, and ceramic paper for integrated steel
producers and mini steel plants in India. It is a global partner for over 500 customers in India and across the world. The wide
range of products include ISO, slide gate plates, castables, tundish nozzles, slag arresting darts, etc, which are custom made to
suit the casting conditions and grade of steel being cast.
As a technology leader, ORL focuses on the development of solutions that are tailored to customers’ trends. In 2013, after
acquisition of 69.62% shares by RHI, AG, Austria, ORL is setting new standards through continuous and innovative processes.
RHI AG is one of the largest global suppliers of refractories and provides complete refractory solutions. ORL is also working
on optimizing the plant structure resulting in efficiency and effectiveness in manufacturing processes, improving quality,
control over inventory and serving customers effectively and efficiently at low cost.
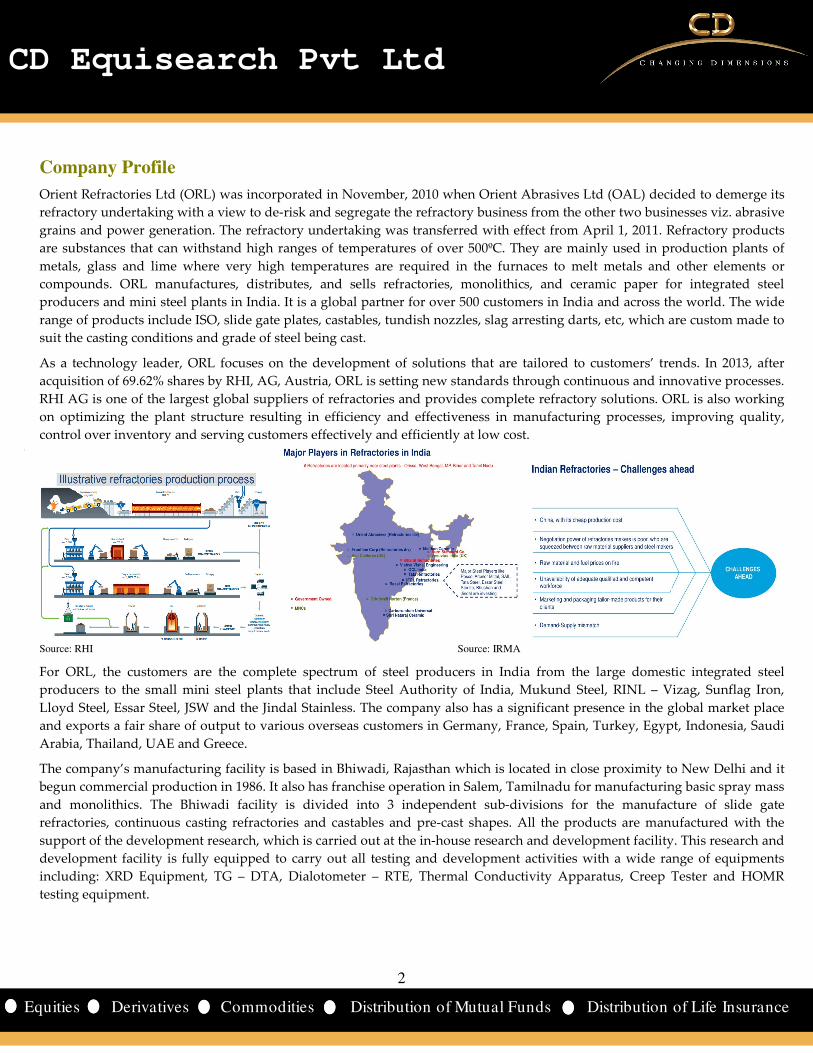
Source: RHI Source: IRMA
For ORL, the customers are the complete spectrum of steel producers in India from the large domestic integrated steel
producers to the small mini steel plants that include Steel Authority of India, Mukund Steel, RINL – Vizag, Sunflag Iron,
Lloyd Steel, Essar Steel, JSW and the Jindal Stainless. The company also has a significant presence in the global market place
and exports a fair share of output to various overseas customers in Germany, France, Spain, Turkey, Egypt, Indonesia, Saudi
Arabia, Thailand, UAE and Greece.
The company’s manufacturing facility is based in Bhiwadi, Rajasthan which is located in close proximity to New Delhi and it
begun commercial production in 1986. It also has franchise operation in Salem, Tamilnadu for manufacturing basic spray mass
and monolithics. The Bhiwadi facility is divided into 3 independent sub-divisions for the manufacture of slide gate
refractories, continuous casting refractories and castables and pre-cast shapes. All the products are manufactured with the
support of the development research, which is carried out at the in-house research and development facility. This research and
development facility is fully equipped to carry out all testing and development activities with a wide range of equipments
including: XRD Equipment, TG – DTA, Dialotometer – RTE, Thermal Conductivity Apparatus, Creep Tester and HOMR
testing equipment.
3
3
CD Equisearch Pvt Ltd
Equities Derivatives Commodities Distribution of Mutual Funds Distribution of Life Insurance
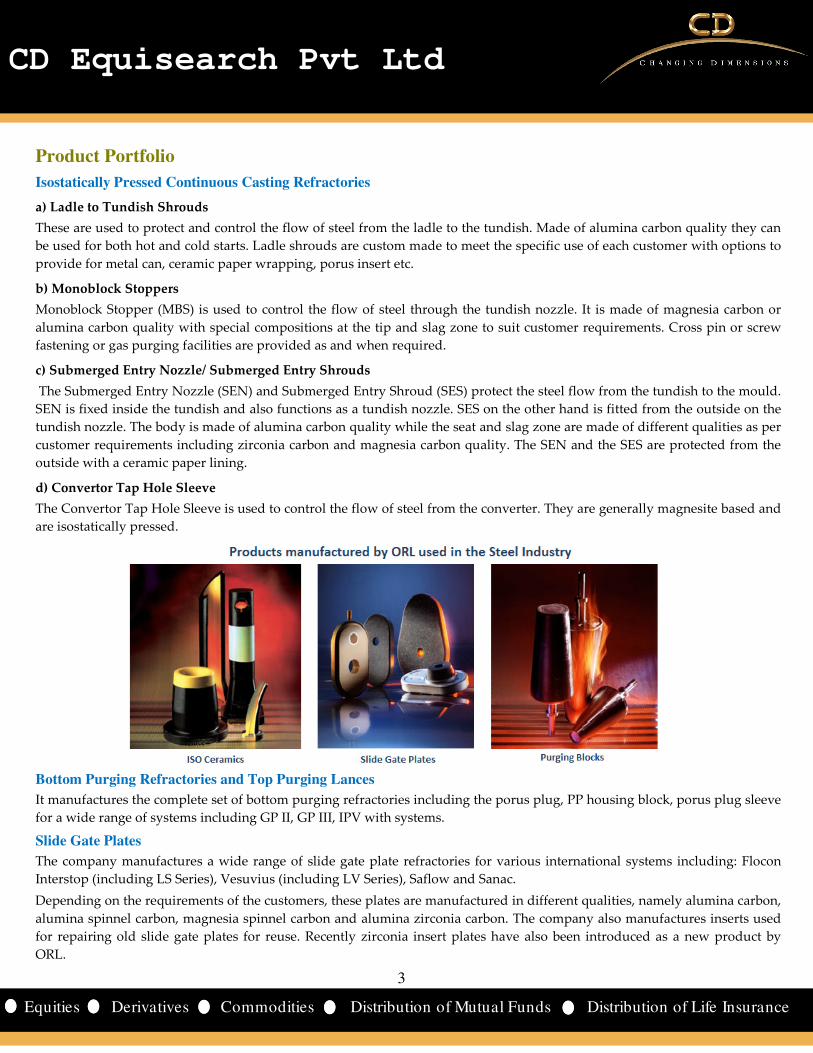
Product Portfolio
Isostatically Pressed Continuous Casting Refractories
a) Ladle to Tundish Shrouds
These are used to protect and control the flow of steel from the ladle to the tundish. Made of alumina carbon quality they can
be used for both hot and cold starts. Ladle shrouds are custom made to meet the specific use of each customer with options to
provide for metal can, ceramic paper wrapping, porus insert etc.
b) Monoblock Stoppers
Monoblock Stopper (MBS) is used to control the flow of steel through the tundish nozzle. It is made of magnesia carbon or
alumina carbon quality with special compositions at the tip and slag zone to suit customer requirements. Cross pin or screw
fastening or gas purging facilities are provided as and when required.
c) Submerged Entry Nozzle/ Submerged Entry Shrouds
The Submerged Entry Nozzle (SEN) and Submerged Entry Shroud (SES) protect the steel flow from the tundish to the mould.
SEN is fixed inside the tundish and also functions as a tundish nozzle. SES on the other hand is fitted from the outside on the
tundish nozzle. The body is made of alumina carbon quality while the seat and slag zone are made of different qualities as per
customer requirements including zirconia carbon and magnesia carbon quality. The SEN and the SES are protected from the
outside with a ceramic paper lining.
d) Convertor Tap Hole Sleeve
The Convertor Tap Hole Sleeve is used to control the flow of steel from the converter. They are generally magnesite based and
are isostatically pressed.
Bottom Purging Refractories and Top Purging Lances
It manufactures the complete set of bottom purging refractories including the porus plug, PP housing block, porus plug sleeve
for a wide range of systems including GP II, GP III, IPV with systems.
Slide Gate Plates
The company manufactures a wide range of slide gate plate refractories for various international systems including: Flocon
Interstop (including LS Series), Vesuvius (including LV Series), Saflow and Sanac.
Depending on the requirements of the customers, these plates are manufactured in different qualities, namely alumina carbon,
alumina spinnel carbon, magnesia spinnel carbon and alumina zirconia carbon. The company also manufactures inserts used
for repairing old slide gate plates for reuse. Recently zirconia insert plates have also been introduced as a new product by
ORL.
4
4
CD Equisearch Pvt Ltd
Equities Derivatives Commodities Distribution of Mutual Funds Distribution of Life Insurance
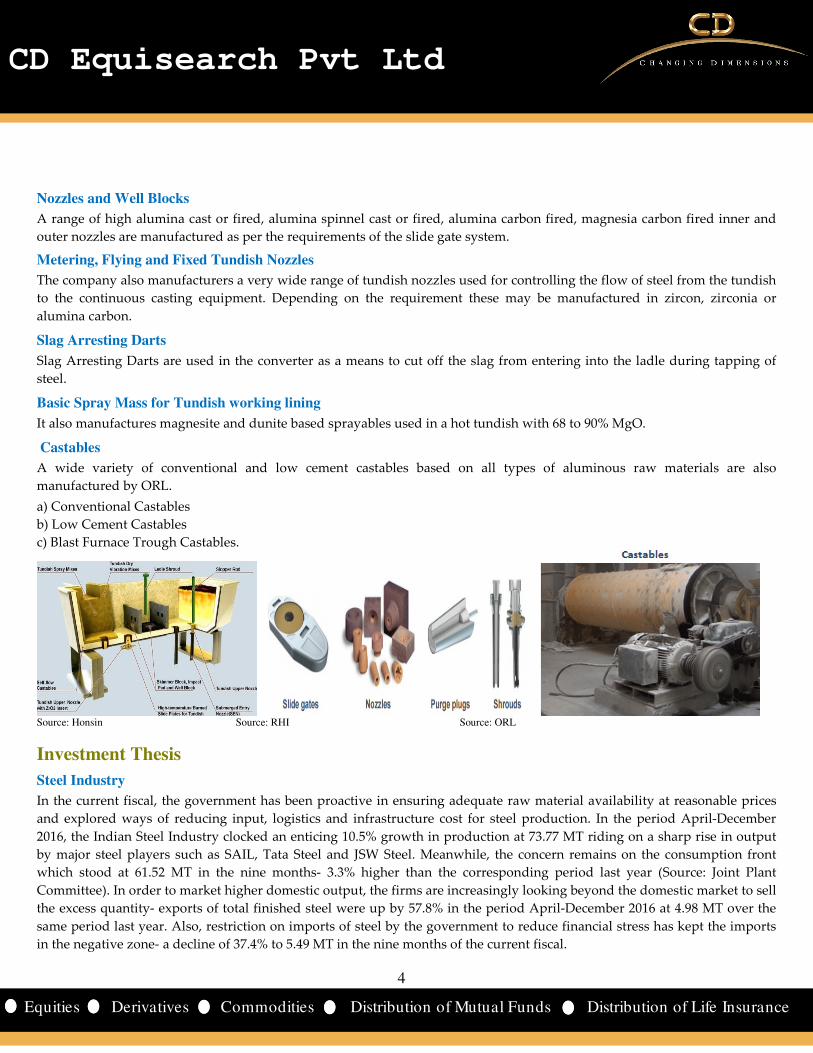
Nozzles and Well Blocks
A range of high alumina cast or fired, alumina spinnel cast or fired, alumina carbon fired, magnesia carbon fired inner and
outer nozzles are manufactured as per the requirements of the slide gate system.
Metering, Flying and Fixed Tundish Nozzles
The company also manufacturers a very wide range of tundish nozzles used for controlling the flow of steel from the tundish
to the continuous casting equipment. Depending on the requirement these may be manufactured in zircon, zirconia or
alumina carbon.
Slag Arresting Darts
Slag Arresting Darts are used in the converter as a means to cut off the slag from entering into the ladle during tapping of
steel.
Basic Spray Mass for Tundish working lining
It also manufactures magnesite and dunite based sprayables used in a hot tundish with 68 to 90% MgO.
Castables
A wide variety of conventional and low cement castables based on all types of aluminous raw materials are also
manufactured by ORL.
a) Conventional Castables
b) Low Cement Castables
c) Blast Furnace Trough Castables.
Source: Honsin Source: RHI Source: ORL
Investment Thesis
Steel Industry
In the current fiscal, the government has been proactive in ensuring adequate raw material availability at reasonable prices
and explored ways of reducing input, logistics and infrastructure cost for steel production. In the period April-December
2016, the Indian Steel Industry clocked an enticing 10.5% growth in production at 73.77 MT riding on a sharp rise in output
by major steel players such as SAIL, Tata Steel and JSW Steel. Meanwhile, the concern remains on the consumption front
which stood at 61.52 MT in the nine months- 3.3% higher than the corresponding period last year (Source: Joint Plant
Committee). In order to market higher domestic output, the firms are increasingly looking beyond the domestic market to sell
the excess quantity- exports of total finished steel were up by 57.8% in the period April-December 2016 at 4.98 MT over the
same period last year. Also, restriction on imports of steel by the government to reduce financial stress has kept the imports
in the negative zone- a decline of 37.4% to 5.49 MT in the nine months of the current fiscal.
5
5
CD Equisearch Pvt Ltd
Equities Derivatives Commodities Distribution of Mutual Funds Distribution of Life Insurance
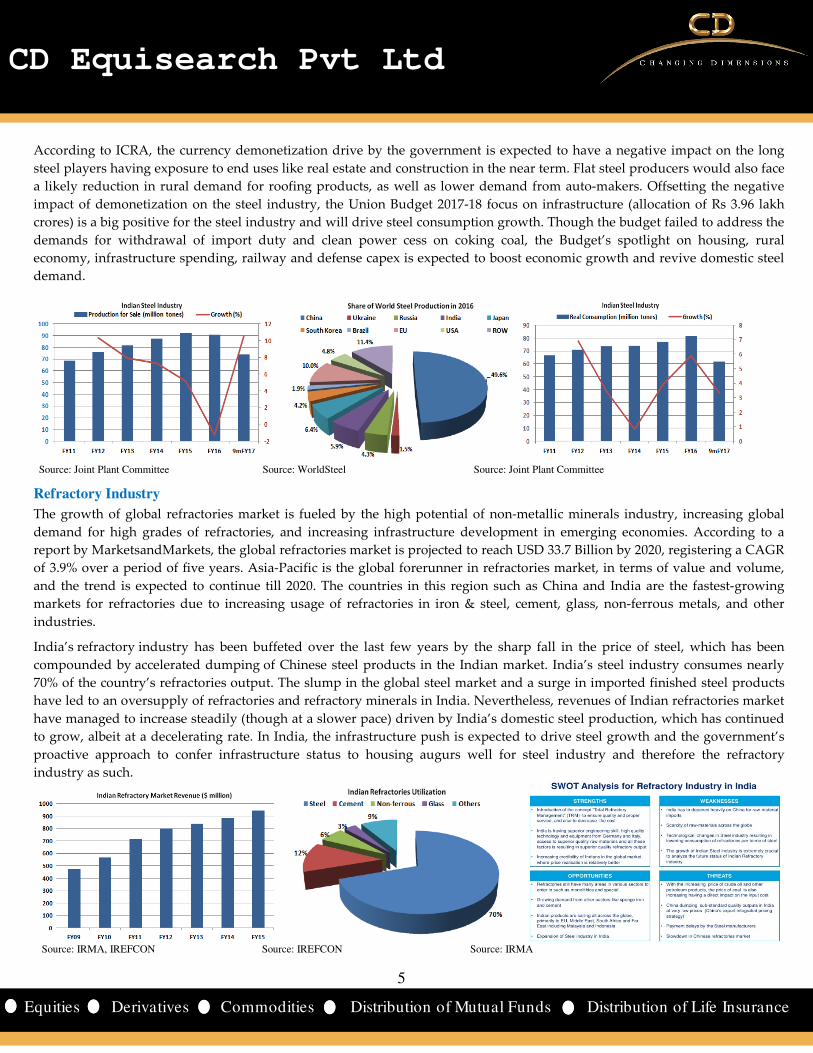
According to ICRA, the currency demonetization drive by the government is expected to have a negative impact on the long
steel players having exposure to end uses like real estate and construction in the near term. Flat steel producers would also face
a likely reduction in rural demand for roofing products, as well as lower demand from auto-makers. Offsetting the negative
impact of demonetization on the steel industry, the Union Budget 2017-18 focus on infrastructure (allocation of Rs 3.96 lakh
crores) is a big positive for the steel industry and will drive steel consumption growth. Though the budget failed to address the
demands for withdrawal of import duty and clean power cess on coking coal, the Budget’s spotlight on housing, rural
economy, infrastructure spending, railway and defense capex is expected to boost economic growth and revive domestic steel
demand.
Source: Joint Plant Committee Source: WorldSteel Source: Joint Plant Committee
Refractory Industry
The growth of global refractories market is fueled by the high potential of non-metallic minerals industry, increasing global
demand for high grades of refractories, and increasing infrastructure development in emerging economies. According to a
report by MarketsandMarkets, the global refractories market is projected to reach USD 33.7 Billion by 2020, registering a CAGR
of 3.9% over a period of five years. Asia-Pacific is the global forerunner in refractories market, in terms of value and volume,
and the trend is expected to continue till 2020. The countries in this region such as China and India are the fastest-growing
markets for refractories due to increasing usage of refractories in iron & steel, cement, glass, non-ferrous metals, and other
industries.
India’s refractory industry has been buffeted over the last few years by the sharp fall in the price of steel, which has been
compounded by accelerated dumping of Chinese steel products in the Indian market. India’s steel industry consumes nearly
70% of the country’s refractories output. The slump in the global steel market and a surge in imported finished steel products
have led to an oversupply of refractories and refractory minerals in India. Nevertheless, revenues of Indian refractories market
have managed to increase steadily (though at a slower pace) driven by India’s domestic steel production, which has continued
to grow, albeit at a decelerating rate. In India, the infrastructure push is expected to drive steel growth and the government’s
proactive approach to confer infrastructure status to housing augurs well for steel industry and therefore the refractory
industry as such.
Source: IRMA, IREFCON Source: IREFCON Source: IRMA
6
6
CD Equisearch Pvt Ltd
Equities Derivatives Commodities Distribution of Mutual Funds Distribution of Life Insurance
With growing revenue base Indo Count needs to punch above its weight to stay competitive. Slowdown in sales is apparent: revenues in Q3 grew at the lowest rate in atleast four quarters; revneus projected to grow by 16.6% (annual) over the next two years (see chart). So value addition holds the key. It unvieled new categories of home textiles - fashion bedding, utility bedding and institutional bedding - in FY15. Better product mix partly showed up in jaw-dropping gains (+690 bps) in operating margins in 9MFY16; other factors which supported margins include higher capacity utilization, prudent raw material sourcing and benefits of operating leverage. Yet gains would be difficult to sustain not least due to increasing competition (Welspun India has recently ramped up its bed linen capacity by 12 mn meters to 72 mn meters and plans to further increase it to 90 mn meters by FY17) and base effect.
Financials and Valuations
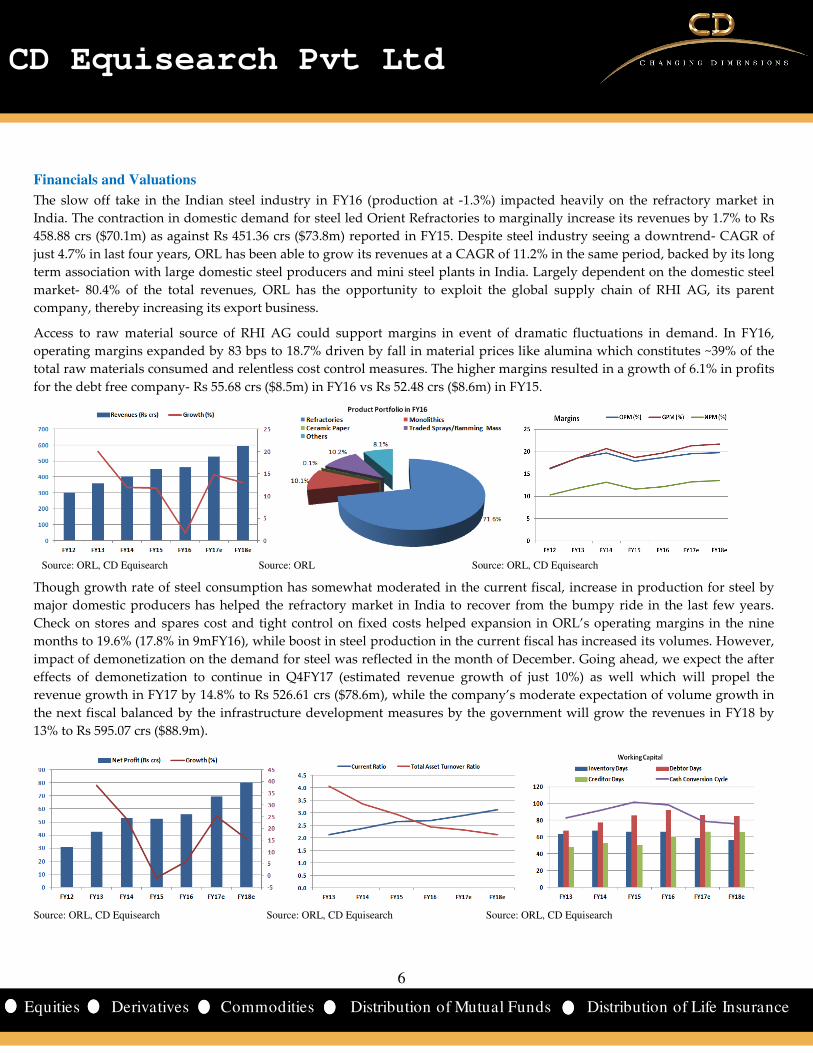
The slow off take in the Indian steel industry in FY16 (production at -1.3%) impacted heavily on the refractory market in
India. The contraction in domestic demand for steel led Orient Refractories to marginally increase its revenues by 1.7% to Rs
458.88 crs ($70.1m) as against Rs 451.36 crs ($73.8m) reported in FY15. Despite steel industry seeing a downtrend- CAGR of
just 4.7% in last four years, ORL has been able to grow its revenues at a CAGR of 11.2% in the same period, backed by its long
term association with large domestic steel producers and mini steel plants in India. Largely dependent on the domestic steel
market- 80.4% of the total revenues, ORL has the opportunity to exploit the global supply chain of RHI AG, its parent
company, thereby increasing its export business.
Access to raw material source of RHI AG could support margins in event of dramatic fluctuations in demand. In FY16,
operating margins expanded by 83 bps to 18.7% driven by fall in material prices like alumina which constitutes ~39% of the
total raw materials consumed and relentless cost control measures. The higher margins resulted in a growth of 6.1% in profits
for the debt free company- Rs 55.68 crs ($8.5m) in FY16 vs Rs 52.48 crs ($8.6m) in FY15.
Source: ORL, CD Equisearch Source: ORL Source: ORL, CD Equisearch
Though growth rate of steel consumption has somewhat moderated in the current fiscal, increase in production for steel by
major domestic producers has helped the refractory market in India to recover from the bumpy ride in the last few years.
Check on stores and spares cost and tight control on fixed costs helped expansion in ORL’s operating margins in the nine
months to 19.6% (17.8% in 9mFY16), while boost in steel production in the current fiscal has increased its volumes. However,
impact of demonetization on the demand for steel was reflected in the month of December. Going ahead, we expect the after
effects of demonetization to continue in Q4FY17 (estimated revenue growth of just 10%) as well which will propel the
revenue growth in FY17 by 14.8% to Rs 526.61 crs ($78.6m), while the company’s moderate expectation of volume growth in
the next fiscal balanced by the infrastructure development measures by the government will grow the revenues in FY18 by
13% to Rs 595.07 crs ($88.9m).
Source: ORL, CD Equisearch Source: ORL, CD Equisearch Source: ORL, CD Equisearch
7
7
CD Equisearch Pvt Ltd
Equities Derivatives Commodities Distribution of Mutual Funds Distribution of Life Insurance
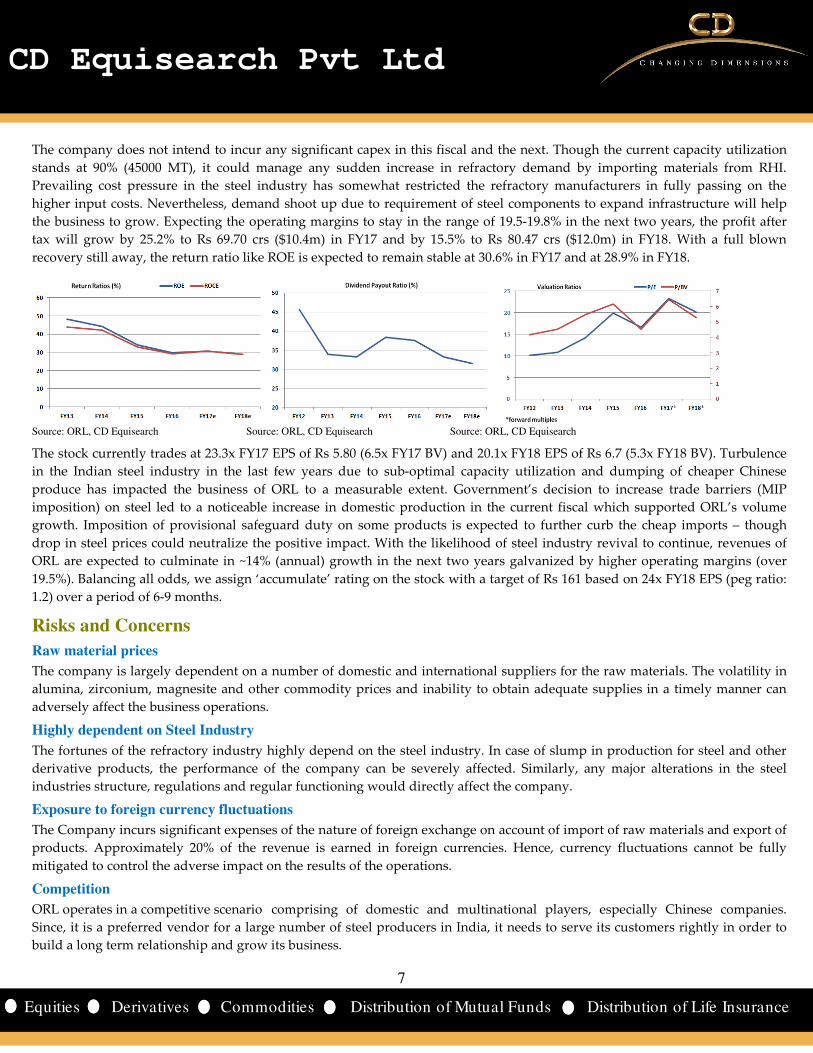
The company does not intend to incur any significant capex in this fiscal and the next. Though the current capacity utilization
stands at 90% (45000 MT), it could manage any sudden increase in refractory demand by importing materials from RHI.
Prevailing cost pressure in the steel industry has somewhat restricted the refractory manufacturers in fully passing on the
higher input costs. Nevertheless, demand shoot up due to requirement of steel components to expand infrastructure will help
the business to grow. Expecting the operating margins to stay in the range of 19.5-19.8% in the next two years, the profit after
tax will grow by 25.2% to Rs 69.70 crs ($10.4m) in FY17 and by 15.5% to Rs 80.47 crs ($12.0m) in FY18. With a full blown
recovery still away, the return ratio like ROE is expected to remain stable at 30.6% in FY17 and at 28.9% in FY18.
Source: ORL, CD Equisearch Source: ORL, CD Equisearch Source: ORL, CD Equisearch
The stock currently trades at 23.3x FY17 EPS of Rs 5.80 (6.5x FY17 BV) and 20.1x FY18 EPS of Rs 6.7 (5.3x FY18 BV). Turbulence
in the Indian steel industry in the last few years due to sub-optimal capacity utilization and dumping of cheaper Chinese
produce has impacted the business of ORL to a measurable extent. Government’s decision to increase trade barriers (MIP
imposition) on steel led to a noticeable increase in domestic production in the current fiscal which supported ORL’s volume
growth. Imposition of provisional safeguard duty on some products is expected to further curb the cheap imports – though
drop in steel prices could neutralize the positive impact. With the likelihood of steel industry revival to continue, revenues of
ORL are expected to culminate in ~14% (annual) growth in the next two years galvanized by higher operating margins (over
19.5%). Balancing all odds, we assign ‘accumulate’ rating on the stock with a target of Rs 161 based on 24x FY18 EPS (peg ratio:
1.2) over a period of 6-9 months.
Risks and Concerns
Raw material prices
The company is largely dependent on a number of domestic and international suppliers for the raw materials. The volatility in
alumina, zirconium, magnesite and other commodity prices and inability to obtain adequate supplies in a timely manner can
adversely affect the business operations.
Highly dependent on Steel Industry
The fortunes of the refractory industry highly depend on the steel industry. In case of slump in production for steel and other
derivative products, the performance of the company can be severely affected. Similarly, any major alterations in the steel
industries structure, regulations and regular functioning would directly affect the company.
Exposure to foreign currency fluctuations
The Company incurs significant expenses of the nature of foreign exchange on account of import of raw materials and export of
products. Approximately 20% of the revenue is earned in foreign currencies. Hence, currency fluctuations cannot be fully
mitigated to control the adverse impact on the results of the operations.
Competition
ORL operates in a competitive scenario comprising of domestic and multinational players, especially Chinese companies.
Since, it is a preferred vendor for a large number of steel producers in India, it needs to serve its customers rightly in order to
build a long term relationship and grow its business.
8
8
CD Equisearch Pvt Ltd
Equities Derivatives Commodities Distribution of Mutual Funds Distribution of Life Insurance
[
Cross Sectional Analysis
Company Equity* CMP Mcap* Sales* Profit* OPM(%) NPM(%) Int cov. ROE(%) Mcap/ sales
P/BV P/E
Orient Refrac. 12.0 135 1621 514 67 19.9 13.0 29438.8 28.9 3.2 6.3 24.2
IFGL Refrac. 34.6 207 716 734 49 10.6 7.6 18.3 17.9 1.0 2.5 14.6
Vesuvius India 20.3 1222 2480 796 86 18.4 10.8 - 16.3 3.1 4.4 28.8
*figures in Rs crs, all data on TTM basis
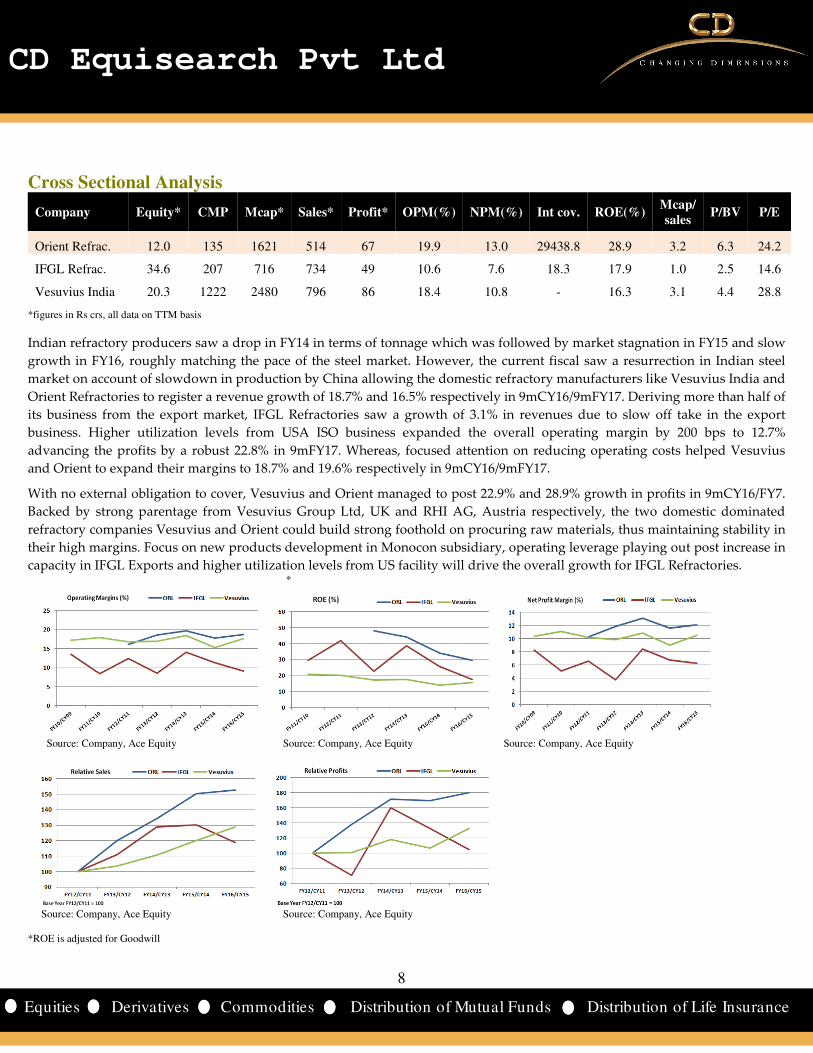
Indian refractory producers saw a drop in FY14 in terms of tonnage which was followed by market stagnation in FY15 and slow
growth in FY16, roughly matching the pace of the steel market. However, the current fiscal saw a resurrection in Indian steel
market on account of slowdown in production by China allowing the domestic refractory manufacturers like Vesuvius India and
Orient Refractories to register a revenue growth of 18.7% and 16.5% respectively in 9mCY16/9mFY17. Deriving more than half of
its business from the export market, IFGL Refractories saw a growth of 3.1% in revenues due to slow off take in the export
business. Higher utilization levels from USA ISO business expanded the overall operating margin by 200 bps to 12.7%
advancing the profits by a robust 22.8% in 9mFY17. Whereas, focused attention on reducing operating costs helped Vesuvius
and Orient to expand their margins to 18.7% and 19.6% respectively in 9mCY16/9mFY17.
With no external obligation to cover, Vesuvius and Orient managed to post 22.9% and 28.9% growth in profits in 9mCY16/FY7.
Backed by strong parentage from Vesuvius Group Ltd, UK and RHI AG, Austria respectively, the two domestic dominated
refractory companies Vesuvius and Orient could build strong foothold on procuring raw materials, thus maintaining stability in
their high margins. Focus on new products development in Monocon subsidiary, operating leverage playing out post increase in
capacity in IFGL Exports and higher utilization levels from US facility will drive the overall growth for IFGL Refractories. *
Source: Company, Ace Equity Source: Company, Ace Equity Source: Company, Ace Equity
Source: Company, Ace Equity Source: Company, Ace Equity *ROE is adjusted for Goodwill
9
9
CD Equisearch Pvt Ltd
Equities Derivatives Commodities Distribution of Mutual Funds Distribution of Life Insurance
Financials
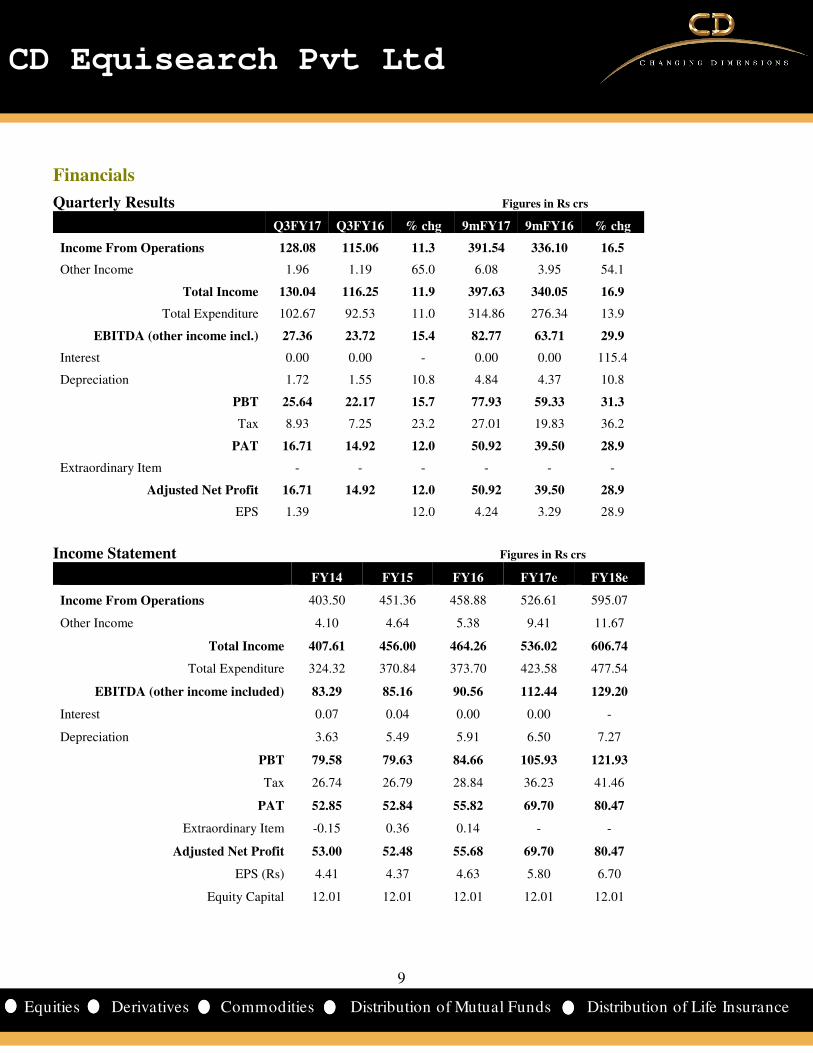
Quarterly Results Figures in Rs crs
Q3FY17 Q3FY16 % chg 9mFY17 9mFY16 % chg
Income From Operations 128.08 115.06 11.3 391.54 336.10 16.5
Other Income 1.96 1.19 65.0 6.08 3.95 54.1
Total Income 130.04 116.25 11.9 397.63 340.05 16.9
Total Expenditure 102.67 92.53 11.0 314.86 276.34 13.9
EBITDA (other income incl.) 27.36 23.72 15.4 82.77 63.71 29.9
Interest 0.00 0.00 - 0.00 0.00 115.4
Depreciation 1.72 1.55 10.8 4.84 4.37 10.8
PBT 25.64 22.17 15.7 77.93 59.33 31.3
Tax 8.93 7.25 23.2 27.01 19.83 36.2
PAT 16.71 14.92 12.0 50.92 39.50 28.9
Extraordinary Item - - - - - -
Adjusted Net Profit 16.71 14.92 12.0 50.92 39.50 28.9
EPS 1.39 12.0 4.24 3.29 28.9
Income Statement Figures in Rs crs
FY14 FY15 FY16 FY17e FY18e
Income From Operations 403.50 451.36 458.88 526.61 595.07
Other Income 4.10 4.64 5.38 9.41 11.67
Total Income 407.61 456.00 464.26 536.02 606.74
Total Expenditure 324.32 370.84 373.70 423.58 477.54
EBITDA (other income included) 83.29 85.16 90.56 112.44 129.20
Interest 0.07 0.04 0.00 0.00 -
Depreciation 3.63 5.49 5.91 6.50 7.27
PBT 79.58 79.63 84.66 105.93 121.93
Tax 26.74 26.79 28.84 36.23 41.46
PAT 52.85 52.84 55.82 69.70 80.47
Extraordinary Item -0.15 0.36 0.14 - -
Adjusted Net Profit 53.00 52.48 55.68 69.70 80.47
EPS (Rs) 4.41 4.37 4.63 5.80 6.70
Equity Capital 12.01 12.01 12.01 12.01 12.01
10
10
CD Equisearch Pvt Ltd
Equities Derivatives Commodities Distribution of Mutual Funds Distribution of Life Insurance
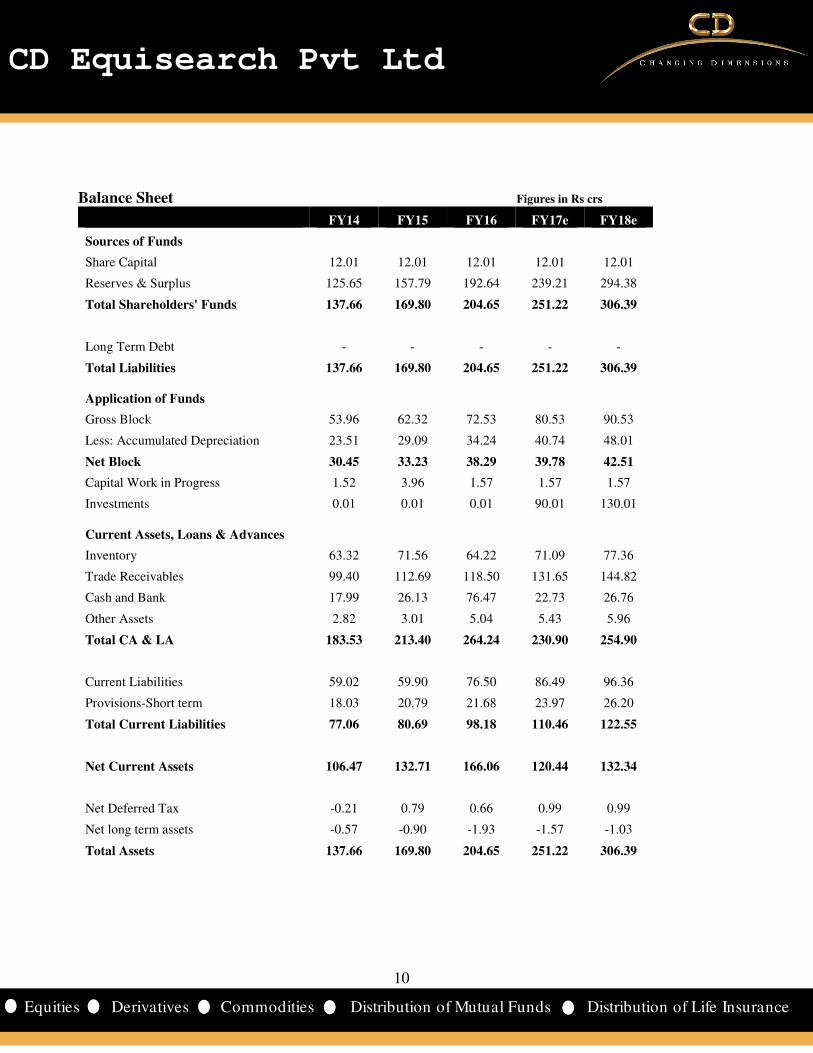
Balance Sheet Figures in Rs crs
FY14 FY15 FY16 FY17e FY18e
Sources of Funds
Share Capital 12.01 12.01 12.01 12.01 12.01
Reserves & Surplus 125.65 157.79 192.64 239.21 294.38
Total Shareholders' Funds 137.66 169.80 204.65 251.22 306.39
Long Term Debt - - - - -
Total Liabilities 137.66 169.80 204.65 251.22 306.39
Application of Funds
Gross Block 53.96 62.32 72.53 80.53 90.53
Less: Accumulated Depreciation 23.51 29.09 34.24 40.74 48.01
Net Block 30.45 33.23 38.29 39.78 42.51
Capital Work in Progress 1.52 3.96 1.57 1.57 1.57
Investments 0.01 0.01 0.01 90.01 130.01 Current Assets, Loans & Advances
Inventory 63.32 71.56 64.22 71.09 77.36
Trade Receivables 99.40 112.69 118.50 131.65 144.82
Cash and Bank 17.99 26.13 76.47 22.73 26.76
Other Assets 2.82 3.01 5.04 5.43 5.96
Total CA & LA 183.53 213.40 264.24 230.90 254.90
Current Liabilities 59.02 59.90 76.50 86.49 96.36
Provisions-Short term 18.03 20.79 21.68 23.97 26.20
Total Current Liabilities 77.06 80.69 98.18 110.46 122.55
Net Current Assets 106.47 132.71 166.06 120.44 132.34
Net Deferred Tax -0.21 0.79 0.66 0.99 0.99
Net long term assets -0.57 -0.90 -1.93 -1.57 -1.03
Total Assets 137.66 169.80 204.65 251.22 306.39
11
11
CD Equisearch Pvt Ltd
Equities Derivatives Commodities Distribution of Mutual Funds Distribution of Life Insurance
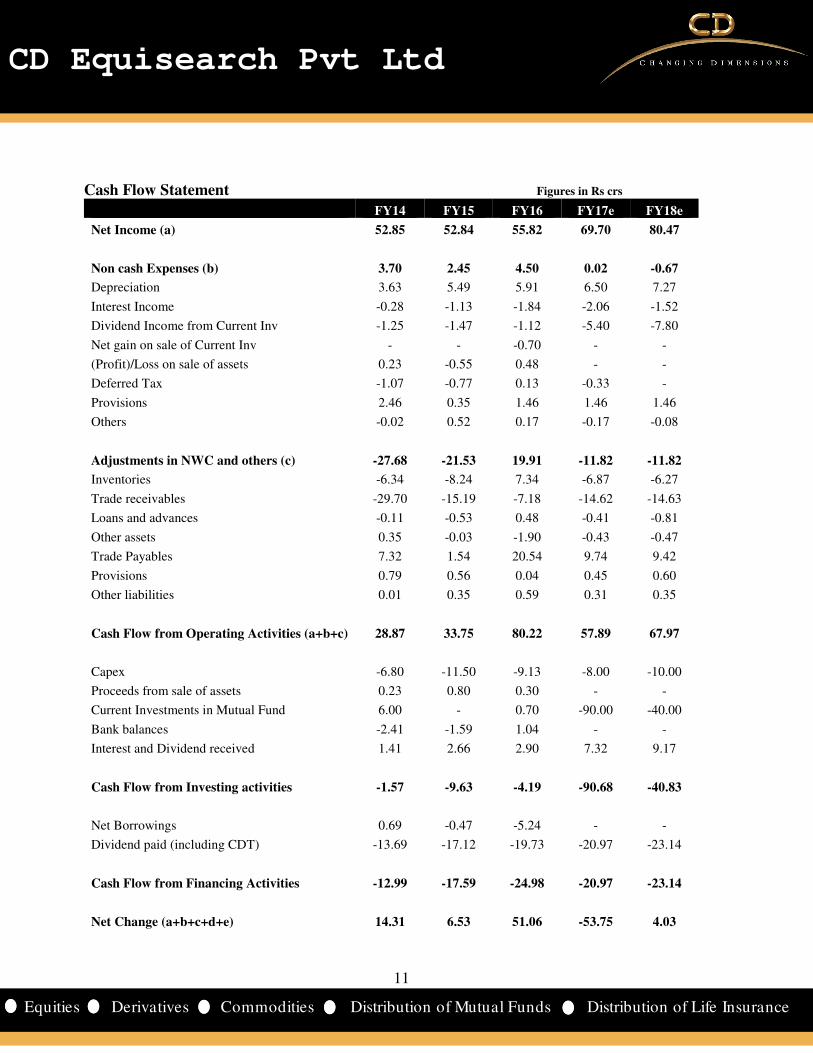
Cash Flow Statement Figures in Rs crs
FY14 FY15 FY16 FY17e FY18e
Net Income (a) 52.85 52.84 55.82 69.70 80.47
Non cash Expenses (b) 3.70 2.45 4.50 0.02 -0.67
Depreciation 3.63 5.49 5.91 6.50 7.27
Interest Income -0.28 -1.13 -1.84 -2.06 -1.52
Dividend Income from Current Inv -1.25 -1.47 -1.12 -5.40 -7.80
Net gain on sale of Current Inv - - -0.70 - -
(Profit)/Loss on sale of assets 0.23 -0.55 0.48 - -
Deferred Tax -1.07 -0.77 0.13 -0.33 -
Provisions 2.46 0.35 1.46 1.46 1.46
Others -0.02 0.52 0.17 -0.17 -0.08
Adjustments in NWC and others (c) -27.68 -21.53 19.91 -11.82 -11.82
Inventories -6.34 -8.24 7.34 -6.87 -6.27
Trade receivables -29.70 -15.19 -7.18 -14.62 -14.63
Loans and advances -0.11 -0.53 0.48 -0.41 -0.81
Other assets 0.35 -0.03 -1.90 -0.43 -0.47
Trade Payables 7.32 1.54 20.54 9.74 9.42
Provisions 0.79 0.56 0.04 0.45 0.60
Other liabilities 0.01 0.35 0.59 0.31 0.35
Cash Flow from Operating Activities (a+b+c) 28.87 33.75 80.22 57.89 67.97
Capex -6.80 -11.50 -9.13 -8.00 -10.00
Proceeds from sale of assets 0.23 0.80 0.30 - -
Current Investments in Mutual Fund 6.00 - 0.70 -90.00 -40.00
Bank balances -2.41 -1.59 1.04 - -
Interest and Dividend received 1.41 2.66 2.90 7.32 9.17
Cash Flow from Investing activities -1.57 -9.63 -4.19 -90.68 -40.83
Net Borrowings 0.69 -0.47 -5.24 - -
Dividend paid (including CDT) -13.69 -17.12 -19.73 -20.97 -23.14
Cash Flow from Financing Activities -12.99 -17.59 -24.98 -20.97 -23.14
Net Change (a+b+c+d+e) 14.31 6.53 51.06 -53.75 4.03
12
12
CD Equisearch Pvt Ltd
Equities Derivatives Commodities Distribution of Mutual Funds Distribution of Life Insurance
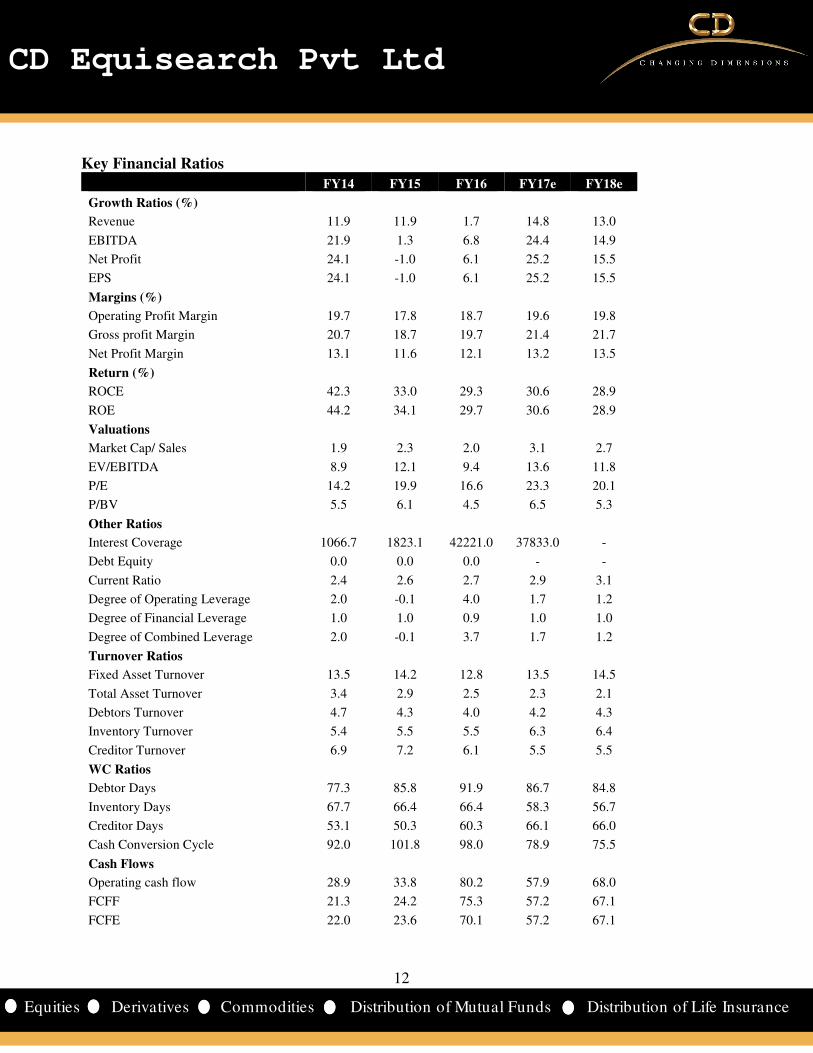
Key Financial Ratios
FY14 FY15 FY16 FY17e FY18e
Growth Ratios (%)
Revenue 11.9 11.9 1.7 14.8 13.0
EBITDA 21.9 1.3 6.8 24.4 14.9
Net Profit 24.1 -1.0 6.1 25.2 15.5
EPS 24.1 -1.0 6.1 25.2 15.5
Margins (%)
Operating Profit Margin 19.7 17.8 18.7 19.6 19.8
Gross profit Margin 20.7 18.7 19.7 21.4 21.7
Net Profit Margin 13.1 11.6 12.1 13.2 13.5
Return (%)
ROCE 42.3 33.0 29.3 30.6 28.9
ROE 44.2 34.1 29.7 30.6 28.9
Valuations
Market Cap/ Sales 1.9 2.3 2.0 3.1 2.7
EV/EBITDA 8.9 12.1 9.4 13.6 11.8
P/E 14.2 19.9 16.6 23.3 20.1
P/BV 5.5 6.1 4.5 6.5 5.3
Other Ratios
Interest Coverage 1066.7 1823.1 42221.0 37833.0 -
Debt Equity 0.0 0.0 0.0 - -
Current Ratio 2.4 2.6 2.7 2.9 3.1
Degree of Operating Leverage 2.0 -0.1 4.0 1.7 1.2
Degree of Financial Leverage 1.0 1.0 0.9 1.0 1.0
Degree of Combined Leverage 2.0 -0.1 3.7 1.7 1.2
Turnover Ratios
Fixed Asset Turnover 13.5 14.2 12.8 13.5 14.5
Total Asset Turnover 3.4 2.9 2.5 2.3 2.1
Debtors Turnover 4.7 4.3 4.0 4.2 4.3
Inventory Turnover 5.4 5.5 5.5 6.3 6.4
Creditor Turnover 6.9 7.2 6.1 5.5 5.5
WC Ratios
Debtor Days 77.3 85.8 91.9 86.7 84.8
Inventory Days 67.7 66.4 66.4 58.3 56.7
Creditor Days 53.1 50.3 60.3 66.1 66.0
Cash Conversion Cycle 92.0 101.8 98.0 78.9 75.5
Cash Flows
Operating cash flow 28.9 33.8 80.2 57.9 68.0
FCFF 21.3 24.2 75.3 57.2 67.1
FCFE 22.0 23.6 70.1 57.2 67.1
13
13
CD Equisearch Pvt Ltd
Equities Derivatives Commodities Distribution of Mutual Funds Distribution of Life Insurance
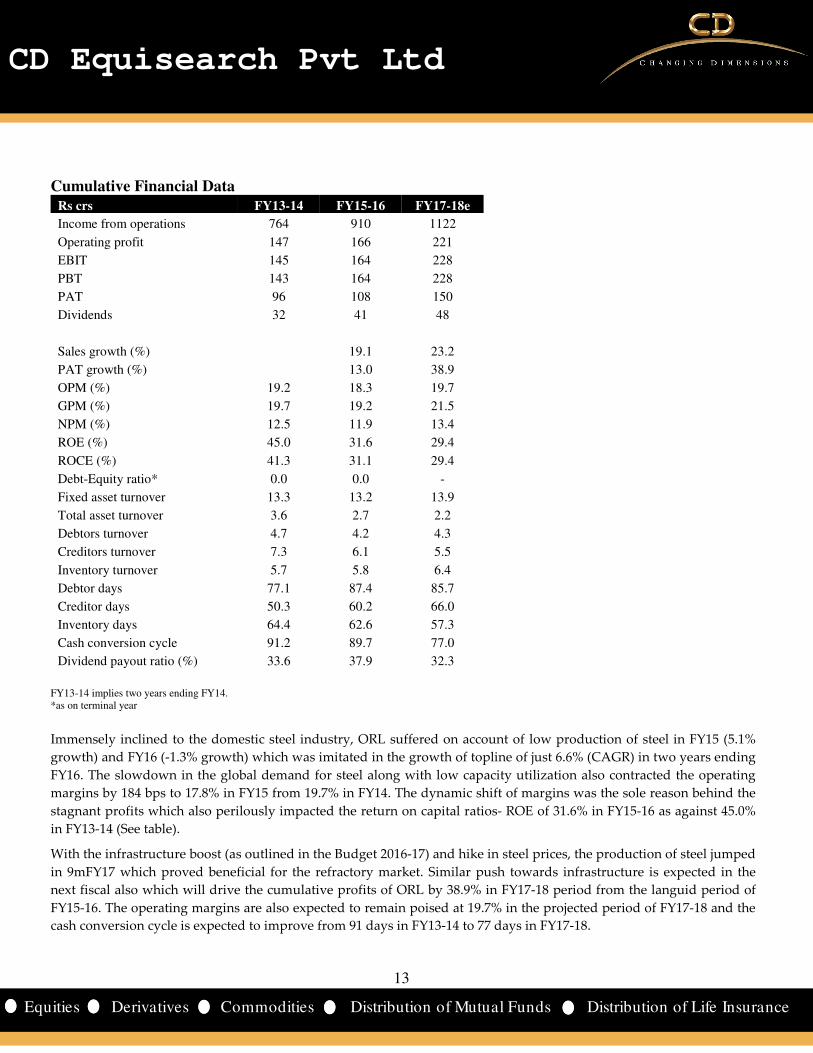
Cumulative Financial Data Rs crs FY13-14 FY15-16 FY17-18e
Income from operations 764 910 1122
Operating profit 147 166 221
EBIT 145 164 228
PBT 143 164 228
PAT 96 108 150
Dividends 32 41 48
Sales growth (%) 19.1 23.2
PAT growth (%) 13.0 38.9
OPM (%) 19.2 18.3 19.7
GPM (%) 19.7 19.2 21.5
NPM (%) 12.5 11.9 13.4
ROE (%) 45.0 31.6 29.4
ROCE (%) 41.3 31.1 29.4
Debt-Equity ratio* 0.0 0.0 -
Fixed asset turnover 13.3 13.2 13.9
Total asset turnover 3.6 2.7 2.2
Debtors turnover 4.7 4.2 4.3
Creditors turnover 7.3 6.1 5.5
Inventory turnover 5.7 5.8 6.4
Debtor days 77.1 87.4 85.7
Creditor days 50.3 60.2 66.0
Inventory days 64.4 62.6 57.3
Cash conversion cycle 91.2 89.7 77.0
Dividend payout ratio (%) 33.6 37.9 32.3
FY13-14 implies two years ending FY14. *as on terminal year
Immensely inclined to the domestic steel industry, ORL suffered on account of low production of steel in FY15 (5.1%
growth) and FY16 (-1.3% growth) which was imitated in the growth of topline of just 6.6% (CAGR) in two years ending
FY16. The slowdown in the global demand for steel along with low capacity utilization also contracted the operating
margins by 184 bps to 17.8% in FY15 from 19.7% in FY14. The dynamic shift of margins was the sole reason behind the
stagnant profits which also perilously impacted the return on capital ratios- ROE of 31.6% in FY15-16 as against 45.0%
in FY13-14 (See table).
With the infrastructure boost (as outlined in the Budget 2016-17) and hike in steel prices, the production of steel jumped
in 9mFY17 which proved beneficial for the refractory market. Similar push towards infrastructure is expected in the
next fiscal also which will drive the cumulative profits of ORL by 38.9% in FY17-18 period from the languid period of
FY15-16. The operating margins are also expected to remain poised at 19.7% in the projected period of FY17-18 and the
cash conversion cycle is expected to improve from 91 days in FY13-14 to 77 days in FY17-18.
14
14
CD Equisearch Pvt Ltd
Equities Derivatives Commodities Distribution of Mutual Funds Distribution of Life Insurance
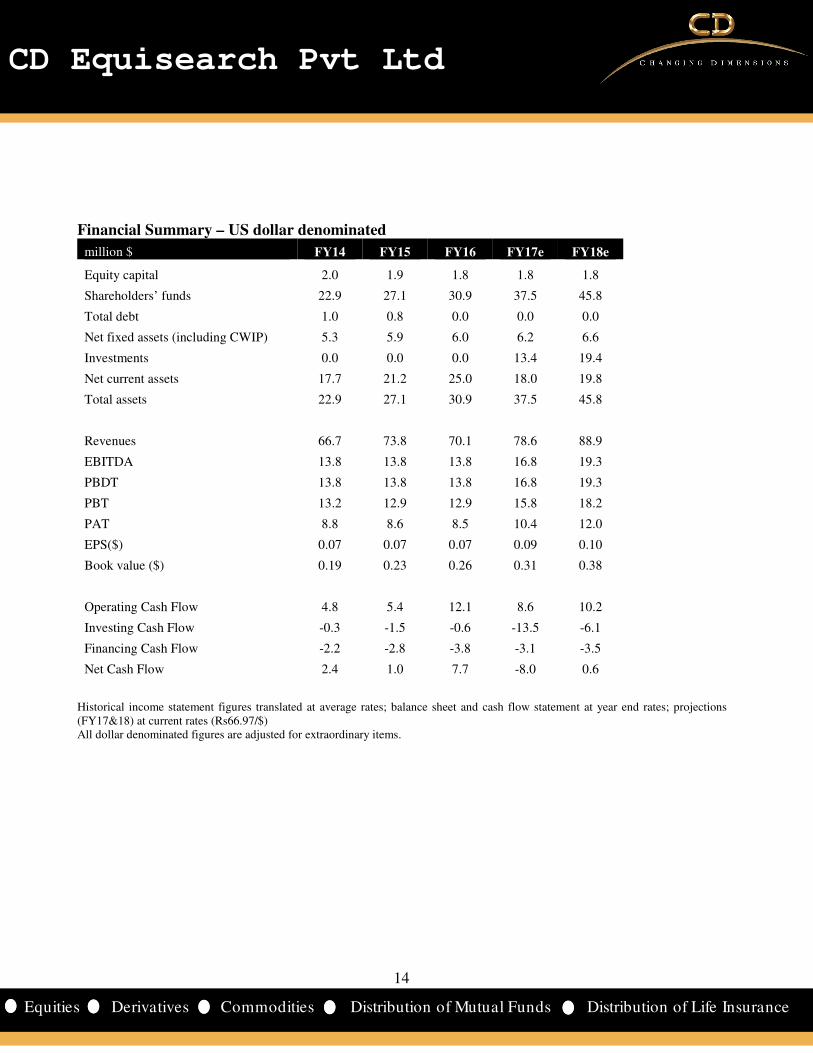
Financial Summary – US dollar denominated
million $ FY14 FY15 FY16 FY17e FY18e
Equity capital 2.0 1.9 1.8 1.8 1.8
Shareholders’ funds 22.9 27.1 30.9 37.5 45.8
Total debt 1.0 0.8 0.0 0.0 0.0
Net fixed assets (including CWIP) 5.3 5.9 6.0 6.2 6.6
Investments 0.0 0.0 0.0 13.4 19.4
Net current assets 17.7 21.2 25.0 18.0 19.8
Total assets 22.9 27.1 30.9 37.5 45.8
Revenues 66.7 73.8 70.1 78.6 88.9
EBITDA 13.8 13.8 13.8 16.8 19.3
PBDT 13.8 13.8 13.8 16.8 19.3
PBT 13.2 12.9 12.9 15.8 18.2
PAT 8.8 8.6 8.5 10.4 12.0
EPS($) 0.07 0.07 0.07 0.09 0.10
Book value ($) 0.19 0.23 0.26 0.31 0.38
Operating Cash Flow 4.8 5.4 12.1 8.6 10.2
Investing Cash Flow -0.3 -1.5 -0.6 -13.5 -6.1
Financing Cash Flow -2.2 -2.8 -3.8 -3.1 -3.5
Net Cash Flow 2.4 1.0 7.7 -8.0 0.6
Historical income statement figures translated at average rates; balance sheet and cash flow statement at year end rates; projections (FY17&18) at current rates (Rs66.97/$) All dollar denominated figures are adjusted for extraordinary items.
15
15
CD Equisearch Pvt Ltd
Equities Derivatives Commodities Distribution of Mutual Funds Distribution of Life Insurance
Recommendation
The changing consumption pattern and need for more sophisticated refractories by the industries, particularly steel
sector have put a very daunting task ahead of the refractories manufacturers. Since the fortune of the refractory
industry is inextricably linked to the steel industry- its principal end-user segment, the downturn in the latter has
affected the production volumes and the bottomline of most refractory majors in two years ending FY16. The cyclical
downturn in the Indian steel production in FY14-16 with a growth of blunt 1.9% severely impacted the refractory
market and hence Orient Refractories’ performance. Nevertheless, expectation of cut down of steel production by major
Chinese producers to the tune of 100-150 million tons in the next five years will rebound global production.
Increasing sophistication in the use of refractories with technology sourced from global leaders, such as the Vesuvius
Group, UK; Flogates, UK; or Harima Ceramic Co, Japan; RHI AG, Austria, has worked to the detriment of the industry
in a certain way. The use of high-quality refractories has improved the lining life of furnaces and brought down the
specific consumption per ton of liquid steel resulting in a lower per ton usage of refractories. Hence, all the standard
refractory manufacturers have found the going tough in this cut throat competitive environment.
Focus on infrastructure, real estate sector in the last one year has increased the demand for finished steel in India. With
70% of the refractory production consumed by the steel industry, the recovery has ultimately shored up the financial
performance of ORL. Notching a robust growth of 19.2% in H1FY17 revenues, ORL was all set to post a record growth
until the demonetization quandary slowed the brisk pace in which it was growing (growth of 11.3% in Q3FY17).
Managing to grow at a satisfactory pace of 16.5% in the nine months of the current fiscal, we expect the revenues to
climb by 14.8% by the end of this fiscal to Rs 526.61 crs ($78.6m), while ambiguity remains on the pickup in demand for
steel in the next fiscal (on low consumption trend) which coerce our estimated growth in FY18 at a conservative 13% to
Rs 595.07 crs ($88.9m).
Fostered by its parent company RHI AG, Austria, ORL will be buffered from ready supply of raw materials which will
ensure stability in the margins. Also, RHI’s strong supply network will give a strong foundation to grow the export
market which at present contributes to ~20% of the total revenues. Higher operating margins at 19.5-19.8% emanating
from economies of scale in the next two years will allow ORL to grow its profits at a CAGR of 20.2% in FY16-18- Rs
69.70 crs ($10.4m) in FY17 and Rs 80.47 crs ($12.0m) in FY18 (Rs 55.68 crs in FY16).
The stock currently trades at 23.3x FY17 EPS of Rs 5.80 (6.5x FY17 BV) and 20.1x FY18 EPS of Rs 6.7 (5.3x FY18 BV).
Turbulence in the Indian steel industry in the last few years due to sub-optimal capacity utilization and dumping of
cheaper Chinese produce has impacted the business of ORL to a measurable extent. Government’s decision to increase
trade barriers (MIP imposition) on steel led to a noticeable increase in domestic production in the current fiscal which
supported ORL’s volume growth. Imposition of provisional safeguard duty on some products is expected to further
curb the cheap imports – though drop in steel prices could neutralize the positive impact. With the likelihood of steel
industry to continue aid refractories demand, revenues of ORL are expected to culminate in ~14% (annual) growth in
the next two years galvanized by higher operating margins (over 19.5%). Balancing all odds, we assign ‘accumulate’
rating on the stock with a target of Rs 161 based on 24x FY18 EPS (peg ratio: 1.2) over a period of 6-9 months.
16
16
CD Equisearch Pvt Ltd
Equities Derivatives Commodities Distribution of Mutual Funds Distribution of Life Insurance
Disclosure& Disclaimer CD Equisearch Private Limited (hereinafter referred to as ‘CD Equi’) is a Member registered with National Stock Exchange of India Limited,
Bombay Stock Exchange Limited and Metropolitan Stock Exchange of India Limited (Formerly known as MCX Stock Exchange Limited). CD
Equi is also registered as Depository Participant with CDSL and AMFI registered Mutual Fund Advisor. The associates of CD Equi are
engaged in activities relating to NBFC-ND - Financing and Investment, Commodity Broking, Real Estate, etc.
CD Equi is registered under SEBI (Research Analysts) Regulations, 2014 with SEBI Registration no INH300002274. Further, CD Equi hereby
declares that –
• No disciplinary action has been taken against CD Equi by any of the regulatory authorities.
• CD Equi/its associates/research analysts do not have any financial interest/beneficial interest of more than one percent/material
conflict of interest in the subject company(s) (kindly disclose if otherwise).
• CD Equi/its associates/research analysts have not received any compensation from the subject company(s) during the past twelve
months.
• CD Equi/its research analysts has not served as an officer, director or employee of company covered by analysts and has not been
engaged in market making activity of the company covered by analysts.
This document is solely for the personal information of the recipient and must not be singularly used as the basis of any investment decision.
Nothing in this document should be construed as investment or financial advice. Each recipient of this document should make such
investigations as they deem necessary to arrive at an independent evaluation of an investment in the securities of the companies referred to in
this document (including the merits and risks involved) and should consult their own advisors to determine the merits and risks of such an
investment.
Reports based on technical and derivative analysis center on studying charts of a stock's price movement, outstanding positions and trading
volume, as opposed to focusing on a company's fundamentals and as such, may not match with a report on a company's fundamentals.
The information in this document has been printed on the basis of publicly available information, internal data and other reliable sources
believed to be true but we do not represent that it is accurate or complete and it should not be relied on as such, as this document is for general
guidance only. CD Equi or any of its affiliates/group companies shall not be in any way responsible for any loss or damage that may arise to
any person from any inadvertent error in the information contained in this report. CD Equi has not independently verified all the information
contained within this document. Accordingly, we cannot testify nor make any representation or warranty, express or implied, to the accuracy,
contents or data contained within this document.
While, CD Equi endeavors to update on a reasonable basis the information discussed in this material, there may be regulatory compliance or
other reasons that prevent us from doing so.
This document is being supplied to you solely for your information and its contents, information or data may not be reproduced, redistributed
or passed on, directly or indirectly. Neither, CD Equi nor its directors, employees or affiliates shall be liable for any loss or damage that may
arise from or in connection with the use of this information.
CD Equisearch Private Limited (CIN: U67120WB1995PTC071521)
Registered Office: 37, Shakespeare Sarani, 3rd Floor, Kolkata – 700 017; Phone: +91(33) 4488 0000; Fax: +91(33) 2289 2557 Corporate Office: 10,
Vasawani Mansion, 5th Floor, Dinshaw Wachha Road, Churchgate, Mumbai – 400 020. Phone: +91(22) 2283 0652/0653; Fax: +91(22) 2283, 2276
Website: www.cdequi.com; Email: [email protected]
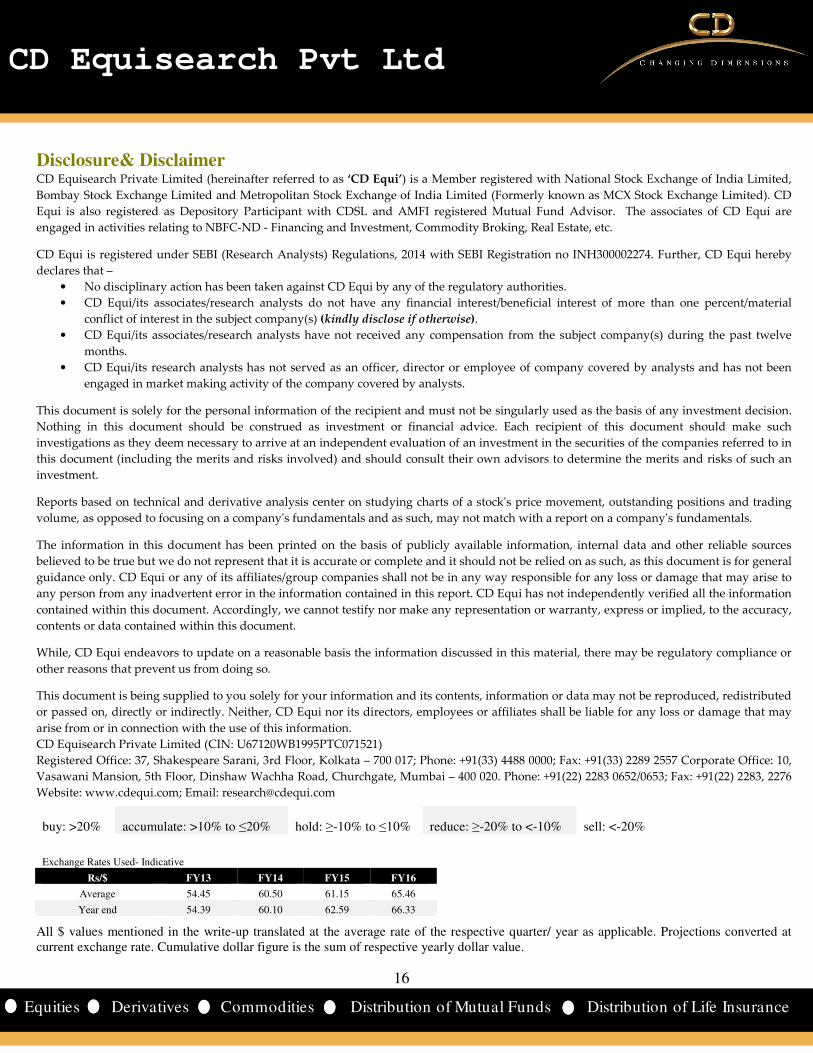
buy: >20% accumulate: >10% to ≤20% hold: ≥-10% to ≤10% reduce: ≥-20% to <-10% sell: <-20%
Exchange Rates Used- Indicative
Rs/$ FY13 FY14 FY15 FY16
Average 54.45 60.50 61.15 65.46
Year end 54.39 60.10 62.59 66.33
All $ values mentioned in the write-up translated at the average rate of the respective quarter/ year as applicable. Projections converted at current exchange rate. Cumulative dollar figure is the sum of respective yearly dollar value.