Embed Size (px)
Citation preview
CD Equisearch Pvt Ltd Nov 30, 2015
Equities Derivatives Commodities Distribution of Mutual Funds Distribution of Life Insurance
J. Kumar Infraprojects Ltd (JKIL)
No. of shares (m) 37.8
Mkt cap (Rs crs/$m) 2808/420.7
Current price (Rs/$) 742/11.1
Price target (Rs/$)
873/13.1
52 W H/L (Rs.) 897/382
Book Value (Rs/$) 330/4.9
P/BV (FY16e/17e)
2.1/1.9
P/E (FY16e/17e) 19.9/15.3
EPS growth (FY15/16e/17e) 1.5/21.8/29.8
ROE (FY15/16e/17e) 13.8/12.3/13.2
Beta 0.6
Daily volume (avg. monthly) 13590
BSE Code 532940
NSE Code JKIL
Bloomberg JKIL IN
Reuters JKIP.BO
Shareholding pattern* % Promoters 51.0
MFs / Banks / FIs 9.7
Foreign 21.4
Govt. Holding 0.0
Non-Promoter Corp. 13.2
Total Public 4.6
Total 100.0
As on Sep 30, 2015; *pre QIP
Recommendation ACCUMULATE
Analyst
KISHAN GUPTA, CFA, FRM
Phone: + 91 (33) 4488 0043
E- mail: [email protected]
Figures (Rs crs)
FY13
FY14
FY15
FY16e
FY17e
Net revenues 1000.68 1186.78 1343.19 1540.20 1931.87
Other Income 8.85 10.81 13.05 33.44 45.35
EBITDA (other income included) 176.22 216.63 263.61 310.67 387.29
Net Profit 75.73 84.05 94.39 129.18 183.57
EPS(weighted average equity) 27.24 30.23 30.70 37.38 48.52
Equity capital 27.80 27.80 32.23 37.83 37.83
Company Brief JKIL is one of the leading civil engineering and construction companies focused
on transport engineering, civil construction and irrigation works. It undertakes
projects in Maharashtra, Rajasthan, Delhi and Gujarat.
Quarterly Highlights
� Beset by listless order execution, JKIL's profit before tax grew by just 3.8% in
the first half of current fiscal; lower tax provision helped boost PAT by
13.8%. Revenue growth pummeled to 9% in H1FY16, replicating yet another
period of dismal enactment (see graph on page 3). Lackluster revenue
booking in last four quarters (average growth: 4.5%) help explain much of
the sclerosis in work activity. Yet JKIL expects revenue growth to stage a
sharp rebound over the next two quarters, partly reflected in estimated
annual growth of 14.7%.
� Buoyed by flurry of JNPT road orders, order book (ex-LI) ballooned to Rs
3676 crs at the end of last quarter from Rs 3024 crs at the end of last fiscal. It
includes construction of NH-348 and Amra Marg of JNPT Phase -III worth
Rs 328 crs, construction of Karalphata interchange and connectivity to
proposed 4th terminal of JNPT (package -I) worth Rs 539 crs (JKIL's share:
387 crs) and construction of Gavanphata interchange, involving NH-4B, NH-
348, Amra Marg, NH-4B, of JNPT Phase II (package II) on EPC basis worth
Rs 595 crs (JKIL's share: 350 crs). Other orders bagged during the current
fiscal include design and construction of flyovers at various Chowks in
Thane valued Rs 77 crs and western suburbs road orders totaling Rs 194 crs.
� Including L1 orders of nearly Rs 5600 crs, order book stood at Rs 9263 crs,
disproportionately large due to jaw-dropping Mumbai metro orders totaling
Rs 5263 crs. As a result, the L1 orders rose to highest ever and the gap with
confirmed order book increased five times in the last six months (see graph
on page 3). Other L1 orders include concretization of various roads in
Majiwada-Manpada, Kalwa & Mumbra ward committee ( Rs 215 crs) and
construction of six lane bridge across Ulhas creek on proposed Motagaon-
Mankoli Road (lump sum basis valued at Rs 136 crs).
� The stock currently trades at 19.9x FY16e EPS of Rs 37.38 and 15.3x FY17e
EPS of Rs 48.52. (previous estimates: Rs 34.80 and Rs 43.81, though on pre-
QIP equity). JKIL needs to push harder its order execution for the current
stock valuation to sustain. With little evidence now of dramatic speeding of
execution, we assign 'accumulate' rating on the stock with target of Rs 873
(previous target: Rs 614; post spilt target: Rs 437) based on 18xFY17e
earnings (peg ratio: 0.7).
2
2
CD Equisearch Pvt Ltd
Equities Derivatives Commodities Distribution of Mutual Funds Distribution of Life Insurance
Outlook & Recommendation
[
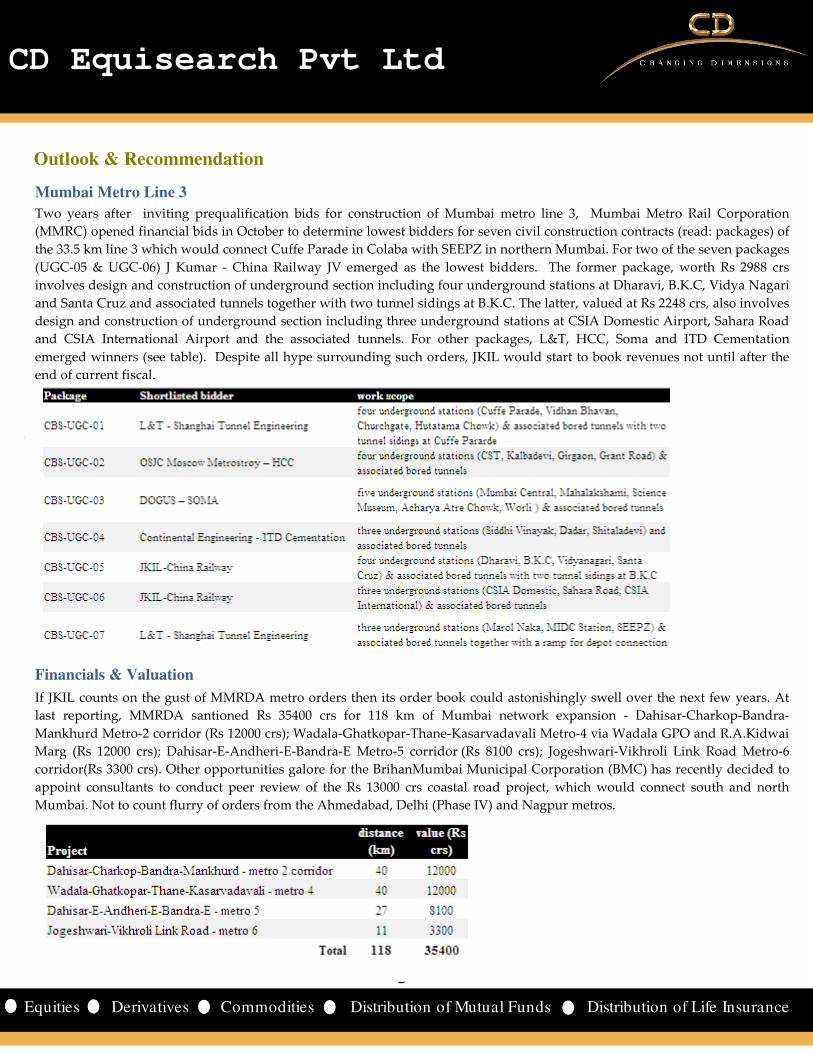
Mumbai Metro Line 3
Two years after inviting prequalification bids for construction of Mumbai metro line 3, Mumbai Metro Rail Corporation
(MMRC) opened financial bids in October to determine lowest bidders for seven civil construction contracts (read: packages) of
the 33.5 km line 3 which would connect Cuffe Parade in Colaba with SEEPZ in northern Mumbai. For two of the seven packages
(UGC-05 & UGC-06) J Kumar - China Railway JV emerged as the lowest bidders. The former package, worth Rs 2988 crs
involves design and construction of underground section including four underground stations at Dharavi, B.K.C, Vidya Nagari
and Santa Cruz and associated tunnels together with two tunnel sidings at B.K.C. The latter, valued at Rs 2248 crs, also involves
design and construction of underground section including three underground stations at CSIA Domestic Airport, Sahara Road
and CSIA International Airport and the associated tunnels. For other packages, L&T, HCC, Soma and ITD Cementation
emerged winners (see table). Despite all hype surrounding such orders, JKIL would start to book revenues not until after the
end of current fiscal.
Financials & Valuation
If JKIL counts on the gust of MMRDA metro orders then its order book could astonishingly swell over the next few years. At
last reporting, MMRDA santioned Rs 35400 crs for 118 km of Mumbai network expansion - Dahisar-Charkop-Bandra-
Mankhurd Metro-2 corridor (Rs 12000 crs); Wadala-Ghatkopar-Thane-Kasarvadavali Metro-4 via Wadala GPO and R.A.Kidwai
Marg (Rs 12000 crs); Dahisar-E-Andheri-E-Bandra-E Metro-5 corridor (Rs 8100 crs); Jogeshwari-Vikhroli Link Road Metro-6
corridor(Rs 3300 crs). Other opportunities galore for the BrihanMumbai Municipal Corporation (BMC) has recently decided to
appoint consultants to conduct peer review of the Rs 13000 crs coastal road project, which would connect south and north
Mumbai. Not to count flurry of orders from the Ahmedabad, Delhi (Phase IV) and Nagpur metros.
3
3
CD Equisearch Pvt Ltd
Equities Derivatives Commodities Distribution of Mutual Funds Distribution of Life Insurance
Mumbai Metro Line III Alignment
Source: JKIL
Sensitivity of operating profit
JKIL would be kept busy for next few years not least due to proliferation of metro orders in Mumbai (line II & IV),
Delhi ( Phase IV), Ahmedabad and Nagpur; tenders for Phase IV of Mumbai and Delhi are expected to be floated in a
year's time from now. No less worth mentioning are gut-wrenching plans of Mumbai Municipal Corporation to build
coastal roads and the Mumbai Trans Harbour Link.
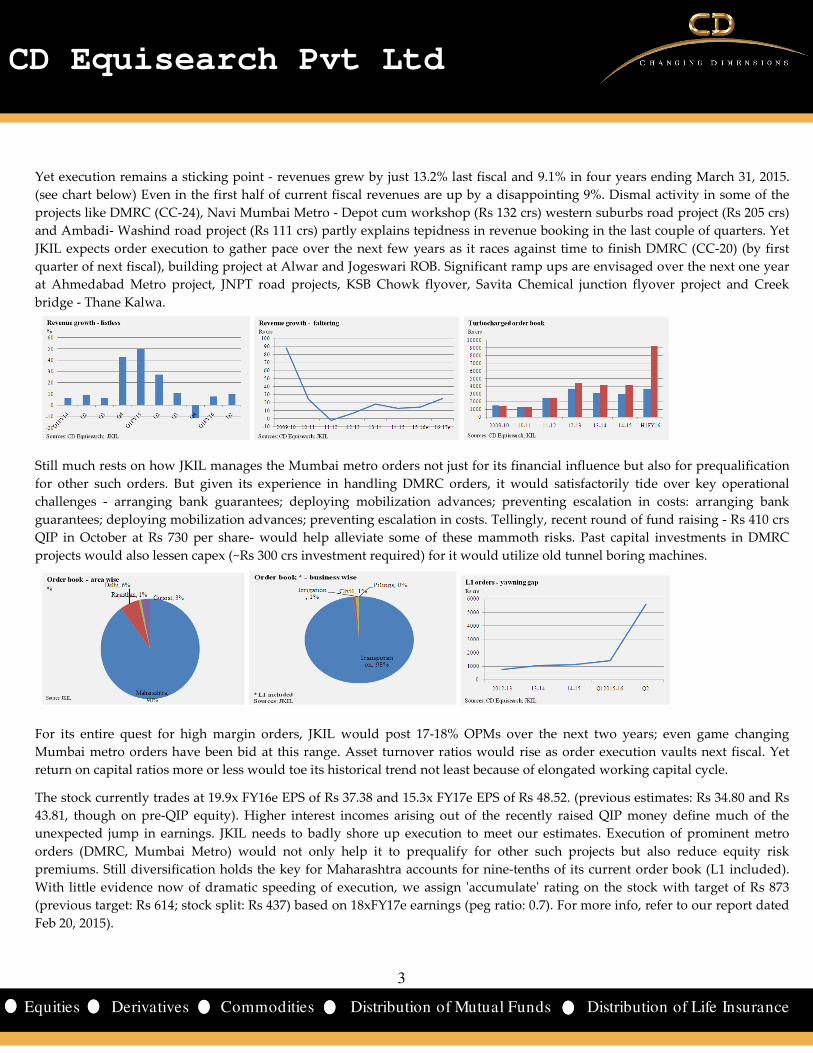
Yet execution remains a sticking point - revenues grew by just 13.2% last fiscal and 9.1% in four years ending March 31, 2015.
(see chart below) Even in the first half of current fiscal revenues are up by a disappointing 9%. Dismal activity in some of the
projects like DMRC (CC-24), Navi Mumbai Metro - Depot cum workshop (Rs 132 crs) western suburbs road project (Rs 205 crs)
and Ambadi- Washind road project (Rs 111 crs) partly explains tepidness in revenue booking in the last couple of quarters. Yet
JKIL expects order execution to gather pace over the next few years as it races against time to finish DMRC (CC-20) (by first
quarter of next fiscal), building project at Alwar and Jogeswari ROB. Significant ramp ups are envisaged over the next one year
at Ahmedabad Metro project, JNPT road projects, KSB Chowk flyover, Savita Chemical junction flyover project and Creek
bridge - Thane Kalwa.
Still much rests on how JKIL manages the Mumbai metro orders not just for its financial influence but also for prequalification
for other such orders. But given its experience in handling DMRC orders, it would satisfactorily tide over key operational
challenges - arranging bank guarantees; deploying mobilization advances; preventing escalation in costs: arranging bank
guarantees; deploying mobilization advances; preventing escalation in costs. Tellingly, recent round of fund raising - Rs 410 crs
QIP in October at Rs 730 per share- would help alleviate some of these mammoth risks. Past capital investments in DMRC
projects would also lessen capex (~Rs 300 crs investment required) for it would utilize old tunnel boring machines.
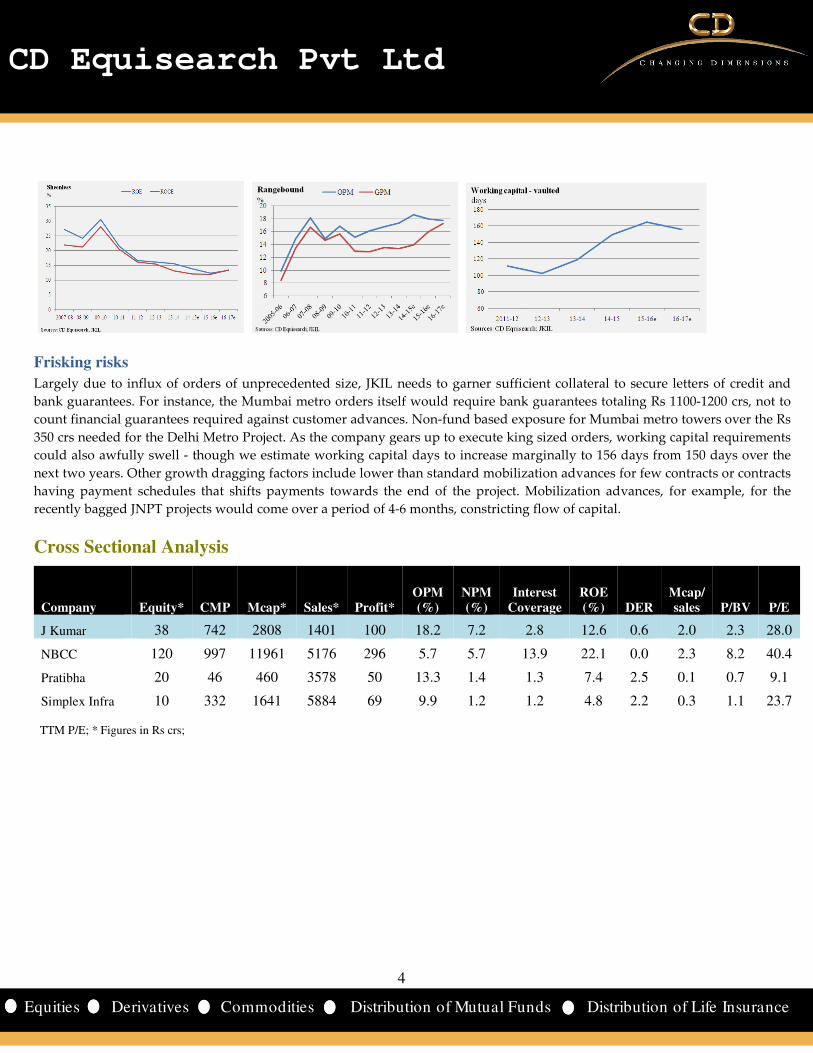
For its entire quest for high margin orders, JKIL would post 17-18% OPMs over the next two years; even game changing
Mumbai metro orders have been bid at this range. Asset turnover ratios would rise as order execution vaults next fiscal. Yet
return on capital ratios more or less would toe its historical trend not least because of elongated working capital cycle.
The stock currently trades at 19.9x FY16e EPS of Rs 37.38 and 15.3x FY17e EPS of Rs 48.52. (previous estimates: Rs 34.80 and Rs
43.81, though on pre-QIP equity). Higher interest incomes arising out of the recently raised QIP money define much of the
unexpected jump in earnings. JKIL needs to badly shore up execution to meet our estimates. Execution of prominent metro
orders (DMRC, Mumbai Metro) would not only help it to prequalify for other such projects but also reduce equity risk
premiums. Still diversification holds the key for Maharashtra accounts for nine-tenths of its current order book (L1 included).
With little evidence now of dramatic speeding of execution, we assign 'accumulate' rating on the stock with target of Rs 873
(previous target: Rs 614; stock split: Rs 437) based on 18xFY17e earnings (peg ratio: 0.7). For more info, refer to our report dated
Feb 20, 2015).
4
4
CD Equisearch Pvt Ltd
Equities Derivatives Commodities Distribution of Mutual Funds Distribution of Life Insurance
Frisking risks
Largely due to influx of orders of unprecedented size, JKIL needs to garner sufficient collateral to secure letters of credit and
bank guarantees. For instance, the Mumbai metro orders itself would require bank guarantees totaling Rs 1100-1200 crs, not to
count financial guarantees required against customer advances. Non-fund based exposure for Mumbai metro towers over the Rs
350 crs needed for the Delhi Metro Project. As the company gears up to execute king sized orders, working capital requirements
could also awfully swell - though we estimate working capital days to increase marginally to 156 days from 150 days over the
next two years. Other growth dragging factors include lower than standard mobilization advances for few contracts or contracts
having payment schedules that shifts payments towards the end of the project. Mobilization advances, for example, for the
recently bagged JNPT projects would come over a period of 4-6 months, constricting flow of capital.
Cross Sectional Analysis
Company Equity* CMP Mcap* Sales* Profit*
OPM
(%)
NPM
(%)
Interest
Coverage
ROE
(%) DER
Mcap/
sales P/BV P/E
J Kumar 38 742 2808 1401 100 18.2 7.2 2.8 12.6 0.6 2.0 2.3 28.0
NBCC 120 997 11961 5176 296 5.7 5.7 13.9 22.1 0.0 2.3 8.2 40.4
Pratibha 20 46 460 3578 50 13.3 1.4 1.3 7.4 2.5 0.1 0.7 9.1
Simplex Infra 10 332 1641 5884 69 9.9 1.2 1.2 4.8 2.2 0.3 1.1 23.7
TTM P/E; * Figures in Rs crs;
5
5
CD Equisearch Pvt Ltd
Equities Derivatives Commodities Distribution of Mutual Funds Distribution of Life Insurance
Financials
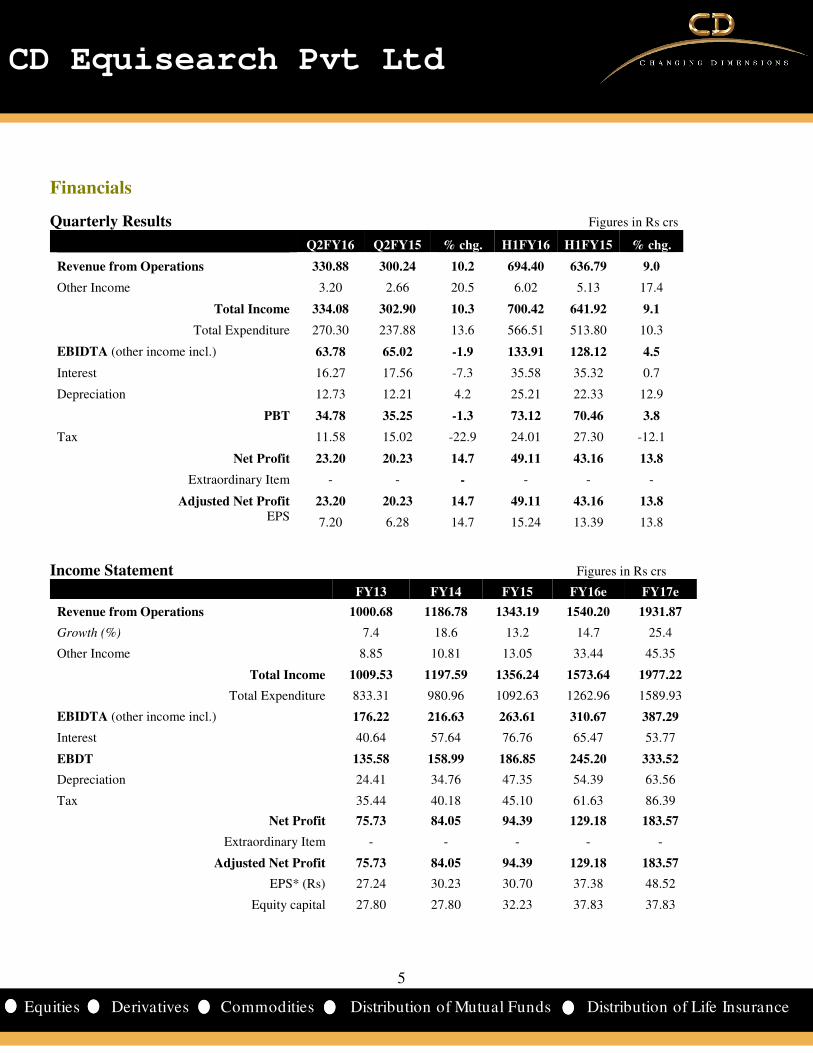
Quarterly Results Figures in Rs crs
Q2FY16 Q2FY15 % chg. H1FY16 H1FY15 % chg.
Revenue from Operations 330.88 300.24 10.2 694.40 636.79 9.0
Other Income 3.20 2.66 20.5 6.02 5.13 17.4
Total Income 334.08 302.90 10.3 700.42 641.92 9.1
Total Expenditure 270.30 237.88 13.6 566.51 513.80 10.3
EBIDTA (other income incl.) 63.78 65.02 -1.9 133.91 128.12 4.5
Interest 16.27 17.56 -7.3 35.58 35.32 0.7
Depreciation 12.73 12.21 4.2 25.21 22.33 12.9
PBT 34.78 35.25 -1.3 73.12 70.46 3.8
Tax 11.58 15.02 -22.9 24.01 27.30 -12.1
Net Profit 23.20 20.23 14.7 49.11 43.16 13.8
Extraordinary Item - - - - - -
Adjusted Net Profit 23.20 20.23 14.7 49.11 43.16 13.8
EPS 7.20 6.28 14.7 15.24 13.39 13.8
Income Statement Figures in Rs crs
FY13 FY14 FY15 FY16e FY17e
Revenue from Operations 1000.68 1186.78 1343.19 1540.20 1931.87
Growth (%) 7.4 18.6 13.2 14.7 25.4
Other Income 8.85 10.81 13.05 33.44 45.35
Total Income 1009.53 1197.59 1356.24 1573.64 1977.22
Total Expenditure 833.31 980.96 1092.63 1262.96 1589.93
EBIDTA (other income incl.) 176.22 216.63 263.61 310.67 387.29
Interest 40.64 57.64 76.76 65.47 53.77
EBDT 135.58 158.99 186.85 245.20 333.52
Depreciation 24.41 34.76 47.35 54.39 63.56
Tax 35.44 40.18 45.10 61.63 86.39
Net Profit 75.73 84.05 94.39 129.18 183.57
Extraordinary Item - - - - -
Adjusted Net Profit 75.73 84.05 94.39 129.18 183.57
EPS* (Rs) 27.24 30.23 30.70 37.38 48.52
Equity capital 27.80 27.80 32.23 37.83 37.83
6
6
CD Equisearch Pvt Ltd
Equities Derivatives Commodities Distribution of Mutual Funds Distribution of Life Insurance
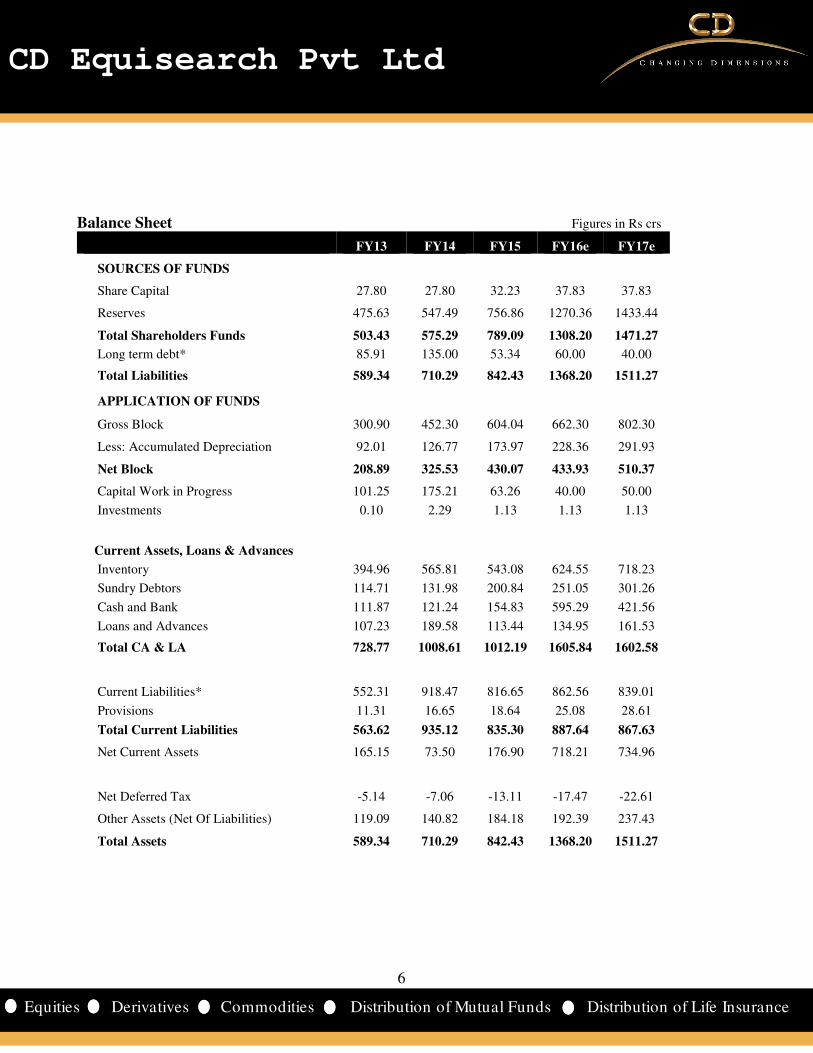
Balance Sheet Figures in Rs crs
FY13 FY14 FY15 FY16e FY17e
SOURCES OF FUNDS
Share Capital 27.80 27.80 32.23 37.83 37.83
Reserves 475.63 547.49 756.86 1270.36 1433.44
Total Shareholders Funds 503.43 575.29 789.09 1308.20 1471.27
Long term debt* 85.91 135.00 53.34 60.00 40.00
Total Liabilities 589.34 710.29 842.43 1368.20 1511.27
APPLICATION OF FUNDS
Gross Block 300.90 452.30 604.04 662.30 802.30
Less: Accumulated Depreciation 92.01 126.77 173.97 228.36 291.93
Net Block 208.89 325.53 430.07 433.93 510.37
Capital Work in Progress 101.25 175.21 63.26 40.00 50.00
Investments 0.10 2.29 1.13 1.13 1.13
Current Assets, Loans & Advances
Inventory 394.96 565.81 543.08 624.55 718.23
Sundry Debtors 114.71 131.98 200.84 251.05 301.26
Cash and Bank 111.87 121.24 154.83 595.29 421.56
Loans and Advances 107.23 189.58 113.44 134.95 161.53
Total CA & LA 728.77 1008.61 1012.19 1605.84 1602.58
Current Liabilities* 552.31 918.47 816.65 862.56 839.01
Provisions 11.31 16.65 18.64 25.08 28.61
Total Current Liabilities 563.62 935.12 835.30 887.64 867.63
Net Current Assets 165.15 73.50 176.90 718.21 734.96
Net Deferred Tax -5.14 -7.06 -13.11 -17.47 -22.61
Other Assets (Net Of Liabilities) 119.09 140.82 184.18 192.39 237.43
Total Assets 589.34 710.29 842.43 1368.20 1511.27
7
7
CD Equisearch Pvt Ltd
Equities Derivatives Commodities Distribution of Mutual Funds Distribution of Life Insurance
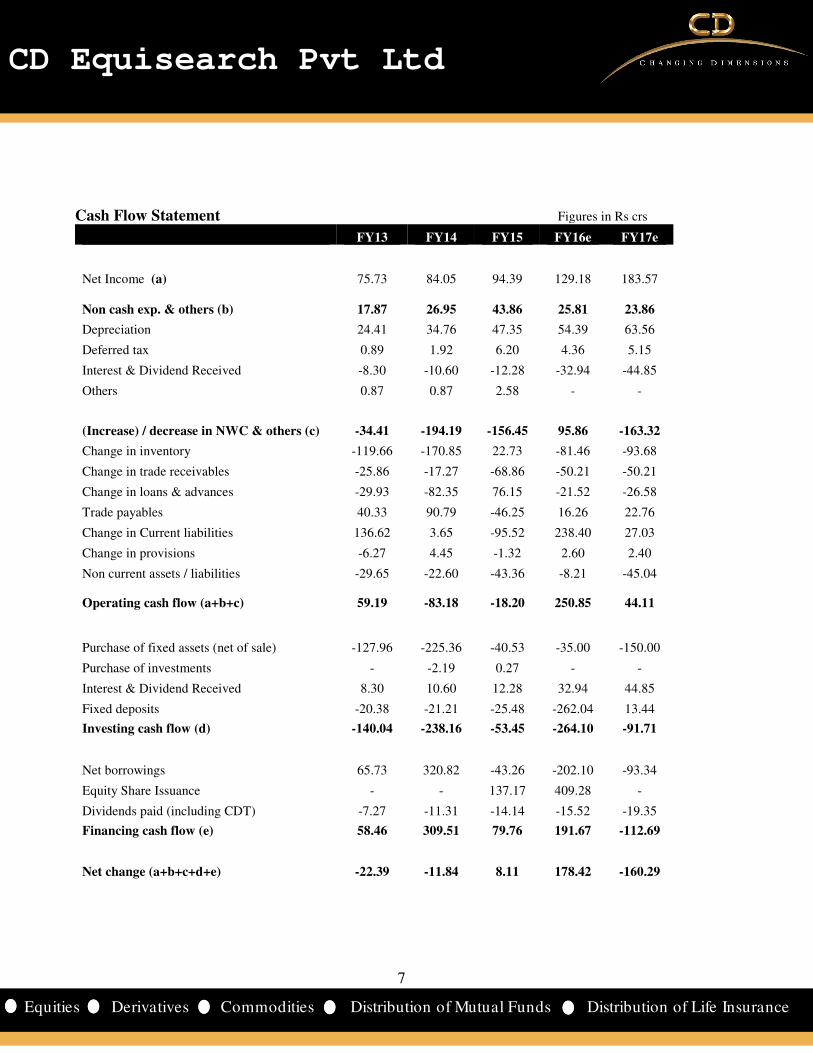
Cash Flow Statement Figures in Rs crs
FY13 FY14 FY15 FY16e FY17e
Net Income (a) 75.73 84.05 94.39 129.18 183.57
Non cash exp. & others (b) 17.87 26.95 43.86 25.81 23.86
Depreciation 24.41 34.76 47.35 54.39 63.56
Deferred tax 0.89 1.92 6.20 4.36 5.15
Interest & Dividend Received -8.30 -10.60 -12.28 -32.94 -44.85
Others 0.87 0.87 2.58 - -
(Increase) / decrease in NWC & others (c) -34.41 -194.19 -156.45 95.86 -163.32
Change in inventory -119.66 -170.85 22.73 -81.46 -93.68
Change in trade receivables -25.86 -17.27 -68.86 -50.21 -50.21
Change in loans & advances -29.93 -82.35 76.15 -21.52 -26.58
Trade payables 40.33 90.79 -46.25 16.26 22.76
Change in Current liabilities 136.62 3.65 -95.52 238.40 27.03
Change in provisions -6.27 4.45 -1.32 2.60 2.40
Non current assets / liabilities -29.65 -22.60 -43.36 -8.21 -45.04
Operating cash flow (a+b+c) 59.19 -83.18 -18.20 250.85 44.11
Purchase of fixed assets (net of sale) -127.96 -225.36 -40.53 -35.00 -150.00
Purchase of investments - -2.19 0.27 - -
Interest & Dividend Received 8.30 10.60 12.28 32.94 44.85
Fixed deposits -20.38 -21.21 -25.48 -262.04 13.44
Investing cash flow (d) -140.04 -238.16 -53.45 -264.10 -91.71
Net borrowings 65.73 320.82 -43.26 -202.10 -93.34
Equity Share Issuance - - 137.17 409.28 -
Dividends paid (including CDT) -7.27 -11.31 -14.14 -15.52 -19.35
Financing cash flow (e) 58.46 309.51 79.76 191.67 -112.69
Net change (a+b+c+d+e) -22.39 -11.84 8.11 178.42 -160.29
8
8
CD Equisearch Pvt Ltd
Equities Derivatives Commodities Distribution of Mutual Funds Distribution of Life Insurance
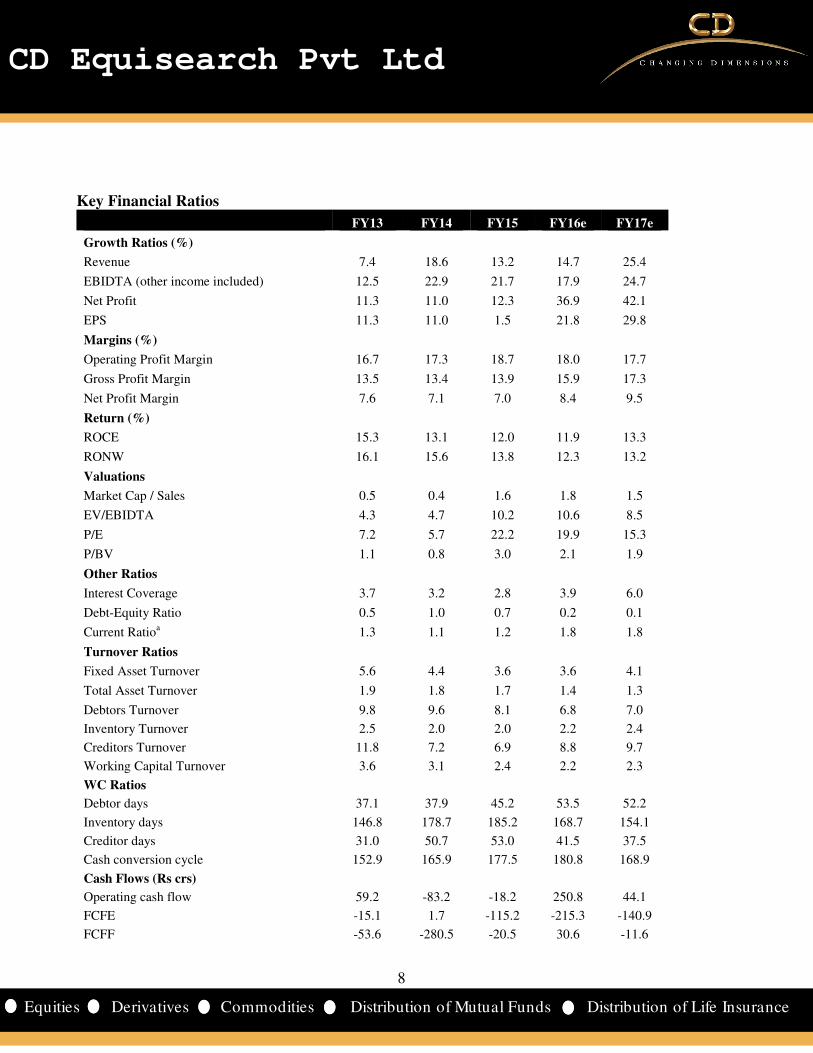
Key Financial Ratios
FY13 FY14 FY15 FY16e FY17e
Growth Ratios (%)
Revenue 7.4 18.6 13.2 14.7 25.4
EBIDTA (other income included) 12.5 22.9 21.7 17.9 24.7
Net Profit 11.3 11.0 12.3 36.9 42.1
EPS 11.3 11.0 1.5 21.8 29.8
Margins (%)
Operating Profit Margin 16.7 17.3 18.7 18.0 17.7
Gross Profit Margin 13.5 13.4 13.9 15.9 17.3
Net Profit Margin 7.6 7.1 7.0 8.4 9.5
Return (%)
ROCE 15.3 13.1 12.0 11.9 13.3
RONW 16.1 15.6 13.8 12.3 13.2
Valuations
Market Cap / Sales 0.5 0.4 1.6 1.8 1.5
EV/EBIDTA 4.3 4.7 10.2 10.6 8.5
P/E 7.2 5.7 22.2 19.9 15.3
P/BV 1.1 0.8 3.0 2.1 1.9
Other Ratios
Interest Coverage 3.7 3.2 2.8 3.9 6.0
Debt-Equity Ratio 0.5 1.0 0.7 0.2 0.1
Current Ratioa 1.3 1.1 1.2 1.8 1.8
Turnover Ratios
Fixed Asset Turnover 5.6 4.4 3.6 3.6 4.1
Total Asset Turnover 1.9 1.8 1.7 1.4 1.3
Debtors Turnover 9.8 9.6 8.1 6.8 7.0
Inventory Turnover 2.5 2.0 2.0 2.2 2.4
Creditors Turnover 11.8 7.2 6.9 8.8 9.7
Working Capital Turnover 3.6 3.1 2.4 2.2 2.3
WC Ratios
Debtor days 37.1 37.9 45.2 53.5 52.2
Inventory days 146.8 178.7 185.2 168.7 154.1
Creditor days 31.0 50.7 53.0 41.5 37.5
Cash conversion cycle 152.9 165.9 177.5 180.8 168.9
Cash Flows (Rs crs)
Operating cash flow 59.2 -83.2 -18.2 250.8 44.1
FCFE -15.1 1.7 -115.2 -215.3 -140.9
FCFF -53.6 -280.5 -20.5 30.6 -11.6
9
9
CD Equisearch Pvt Ltd
Equities Derivatives Commodities Distribution of Mutual Funds Distribution of Life Insurance
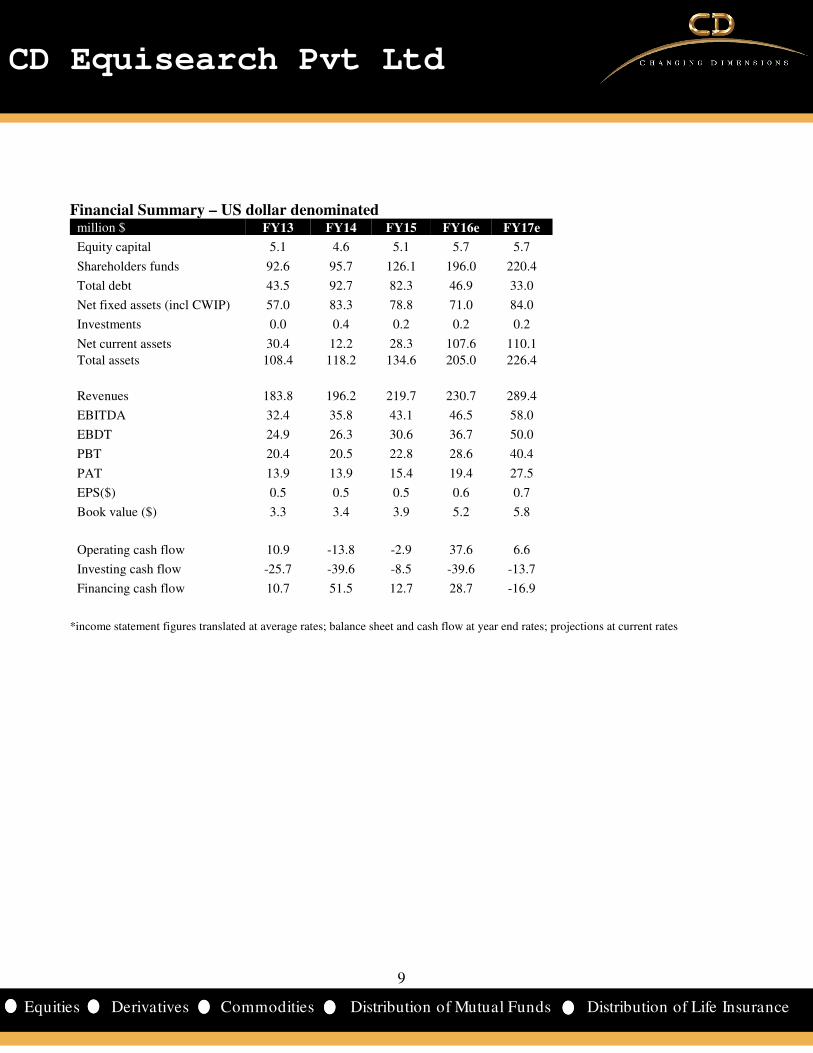
Financial Summary – US dollar denominated million $ FY13 FY14 FY15 FY16e FY17e
Equity capital 5.1 4.6 5.1 5.7 5.7
Shareholders funds 92.6 95.7 126.1 196.0 220.4
Total debt 43.5 92.7 82.3 46.9 33.0
Net fixed assets (incl CWIP) 57.0 83.3 78.8 71.0 84.0
Investments 0.0 0.4 0.2 0.2 0.2
Net current assets 30.4 12.2 28.3 107.6 110.1
Total assets 108.4 118.2 134.6 205.0 226.4
Revenues 183.8 196.2 219.7 230.7 289.4
EBITDA 32.4 35.8 43.1 46.5 58.0
EBDT 24.9 26.3 30.6 36.7 50.0
PBT 20.4 20.5 22.8 28.6 40.4
PAT 13.9 13.9 15.4 19.4 27.5
EPS($) 0.5 0.5 0.5 0.6 0.7
Book value ($) 3.3 3.4 3.9 5.2 5.8
Operating cash flow 10.9 -13.8 -2.9 37.6 6.6
Investing cash flow -25.7 -39.6 -8.5 -39.6 -13.7
Financing cash flow 10.7 51.5 12.7 28.7 -16.9
*income statement figures translated at average rates; balance sheet and cash flow at year end rates; projections at current rates
10
10
CD Equisearch Pvt Ltd
Equities Derivatives Commodities Distribution of Mutual Funds Distribution of Life Insurance
Disclosure& Disclaimer CD Equisearch Private Limited (hereinafter referred to as ‘CD Equi’) is a Member registered with National Stock Exchange of India Limited,
Bombay Stock Exchange Limited and Metropolitan Stock Exchange of India Limited (Formerly known as MCX Stock Exchange Limited). CD
Equi is also registered as Depository Participant with CDSL and AMFI registered Mutual Fund Advisor. The associates of CD Equi are
engaged in activities relating to NBFC-ND - Financing and Investment, Commodity Broking, Real Estate, etc.
CD Equi has applied for registration under SEBI (Research Analysts) Regulations, 2014. Further, CD Equi hereby declares that –
• No disciplinary action has been taken against CD Equi by any of the regulatory authorities.
• CD Equi/its associates/research analysts do not have any financial interest/beneficial interest of more than one percent/material
conflict of interest in the subject company(s).
• CD Equi/its associates/research analysts have not received any compensation from the subject company(s) during the past twelve
months.
• CD Equi/its research analysts has not served as an officer, director or employee of company covered by analysts and has not been
engaged in market making activity of the company covered by analysts.
This document is solely for the personal information of the recipient and must not be singularly used as the basis of any investment decision.
Nothing in this document should be construed as investment or financial advice. Each recipient of this document should make such
investigations as they deem necessary to arrive at an independent evaluation of an investment in the securities of the companies referred to in
this document (including the merits and risks involved) and should consult their own advisors to determine the merits and risks of such an
investment.
Reports based on technical and derivative analysis center on studying charts of a stock's price movement, outstanding positions and trading
volume, as opposed to focusing on a company's fundamentals and as such, may not match with a report on a company's fundamentals.
The information in this document has been printed on the basis of publicly available information, internal data and other reliable sources
believed to be true but we do not represent that it is accurate or complete and it should not be relied on as such, as this document is for general
guidance only. CD Equi or any of its affiliates/group companies shall not be in any way responsible for any loss or damage that may arise to
any person from any inadvertent error in the information contained in this report. CD Equi has not independently verified all the information
contained within this document. Accordingly, we cannot testify nor make any representation or warranty, express or implied, to the accuracy,
contents or data contained within this document.
While, CD Equi endeavors to update on a reasonable basis the information discussed in this material, there may be regulatory compliance or
other reasons that prevent us from doing so.
This document is being supplied to you solely for your information and its contents, information or data may not be reproduced, redistributed
or passed on, directly or indirectly. Neither, CD Equi nor its directors, employees or affiliates shall be liable for any loss or damage that may
arise from or in connection with the use of this information.
CD Equisearch Private Limited (CIN: U67120WB1995PTC071521)
Registered Office: 37, Shakespeare Sarani, 1st Floor, Kolkata – 700 017; Phone: +91(33) 4488 0000; Fax: +91(33) 2289 2557; Corporate Office: 10,
Vasawani Mansion, 2nd Floor, Dinshaw Wachha Road, Churchgate, Mumbai – 400 020; Phone: +91(22) 2283 0652/0653; Fax: +91(22) 2283, 2276
Website: www.cdequi.com; Email: [email protected]
buy: x>20% accumulate: 10%< x ≤20% hold: -10%≤ x ≤10% reduce: -20%≤ x <-10% sell: x <-20%