Embed Size (px)
Citation preview
Hueneme Elementary School DistrictStaff Development Day #3
March 10, 2014
CCSS Mathematic Unit of Study
Grade 6
Introductions
Judy Burnett Valerie Carey Melinda Cheresnowsky Veronica Mojica
Unit of Study: Unit 6 STATISTICS
Title: StatisticsLength: 30 days
Overview: Key Points*Data Collection*Data Representation*Data Distribution
Mathematical Practices1. Make sense of problems and persevere in solving them.
4. Model with mathematics.
5. Use appropriate tools strategically.
6. Attend to precision.
8. Look for and express regularity in repeated reasoning.
ESSENTIAL Standards Guaranteed: Taught and Assessed (Re-taught if necessary)
6.SP.1. Recognize a statistical question as one that anticipates variability in the data related to the question and accounts for it in the answers. For example, “How old am I?” is not a statistical question, but “How old are the students in my school?” is a statistical question because one anticipates variability in students’ ages.
6.SP.2. Understand that a set of data collected to answer a statistical question has a distribution which can be described by its center, spread, and overall shape.
6.SP.3. Recognize that a measure of center for a numerical data set summarizes all of its values with a single number, while a measure of variation describes how its values vary with a single number.
6.SP.4. Display numerical data in plots on a number line, including dot plots, histograms, and box plots.
6.SP.5. Summarize numerical data sets in relation to their context, such as by:
a. Reporting the number of observations.
b. Describing the nature of the attribute under investigation, including how it was measured and its units of measurement.
c. Giving quantitative measures of center (median and/or mean) and variability (interquartile range and/or mean absolute deviation), as well as describing any overall pattern and any striking deviations from the overall pattern with reference to the context in which the data were gathered.
d. Relating the choice of measures of center and variability to the shape of the data distribution and the context in which the data were gathered.
Supporting Standards (Taught in conjunction with the Essential Standards)
6.NS.2. Fluently divide multi-digit numbers using the standard algorithm.
6.NS.3. Fluently add, subtract, multiply, and divide multi-digit decimals using the standard algorithm for each operation.
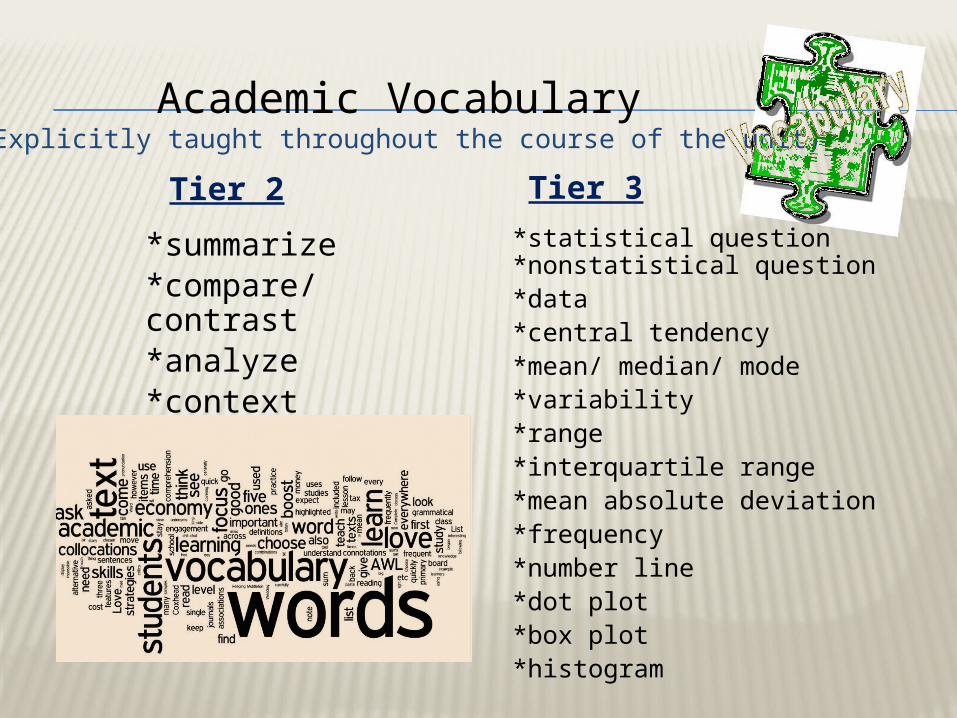
Academic Vocabulary(Explicitly taught throughout the course of the unit)
*statistical question*nonstatistical question *data*central tendency*mean/ median/ mode*variability*range*interquartile range*mean absolute deviation*frequency*number line*dot plot*box plot*histogram
Tier 2 Tier 3
*summarize*compare/contrast*analyze*context
Enduring Understandings and Essential Questions
Essential Questions
Questions based on the Enduring Understanding that teachers can use during instruction and assessment.
A statement about the concept behind the content that we want students to transfer
to different learning experiences and subject areas.
Enduring Understandings AKA The Big Idea
Chapter 1 Days: 5(Chapter = series of lessons/tasks)
Essential Standards6.SP.1 6.SP.5 A & B
Enduring UnderstandingsDATA COLLECTION: Some questions can be answered by collecting and analyzing data, and the question to be answered determines the data that needs to be collected and how best to collect it. -RESPONSES TO STATISTICAL QUESTIONS MAY VARY
-DATA SETS CAN BE ANALYZED IN RELATION TO THEIR CONTEXT
Essential QuestionsWhat is a statistical question? How can a nonstatistical question be rewritten as a statistical question?
How does the data collected relate to the context in which it was collected?
Learning Objectives (Unpacked Standards)Differentiate between statistical and nonstatistical questions
Summarize data sets in relation to their context.
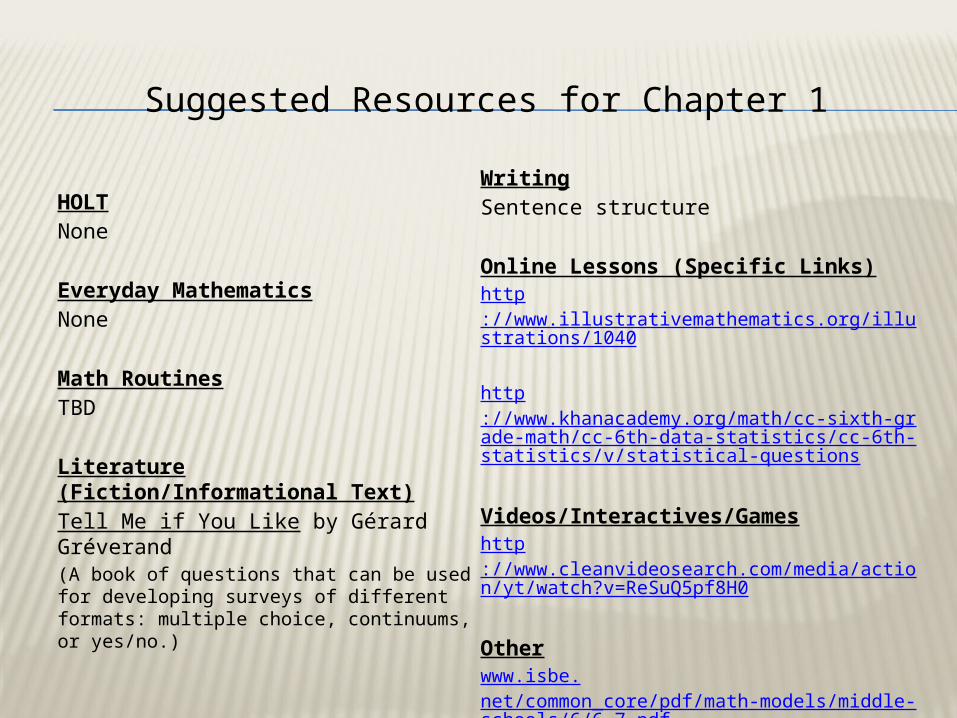
Suggested Resources for Chapter 1
HOLTNone
Everyday MathematicsNone
Math RoutinesTBD
Literature (Fiction/Informational Text)Tell Me if You Like by Gérard Gréverand(A book of questions that can be used for developing surveys of different formats: multiple choice, continuums, or yes/no.)
WritingSentence structure
Online Lessons (Specific Links)http://www.illustrativemathematics.org/illustrations/1040
http://www.khanacademy.org/math/cc-sixth-grade-math/cc-6th-data-statistics/cc-6th-statistics/v/statistical-questions
Videos/Interactives/Gameshttp://www.cleanvideosearch.com/media/action/yt/watch?v=ReSuQ5pf8H0
Otherwww.isbe.net/common_core/pdf/math-models/middle-schools/6/6-7.pdf
Essential QuestionsHow can data be summarized using measures of central tendency?
How can data be summarized using measures of variability?
What is the difference between measures of central tendency and measures of variability? Why are both important in describing data?
Learning Objectives Students will summarize data using measures of central tendency.
Students will summarize data using measures of variability.
Students will describe the difference between measures of central tendency and measures of variability.
Essential Standards6.SP.5 c 6.SP.3
Enduring UnderstandingsDATA DISTRIBUTION: There are special numerical measures that describe the center and spread of numerical data sets.
Chapter 2 Days: 9(Chapter = series of lessons/tasks)
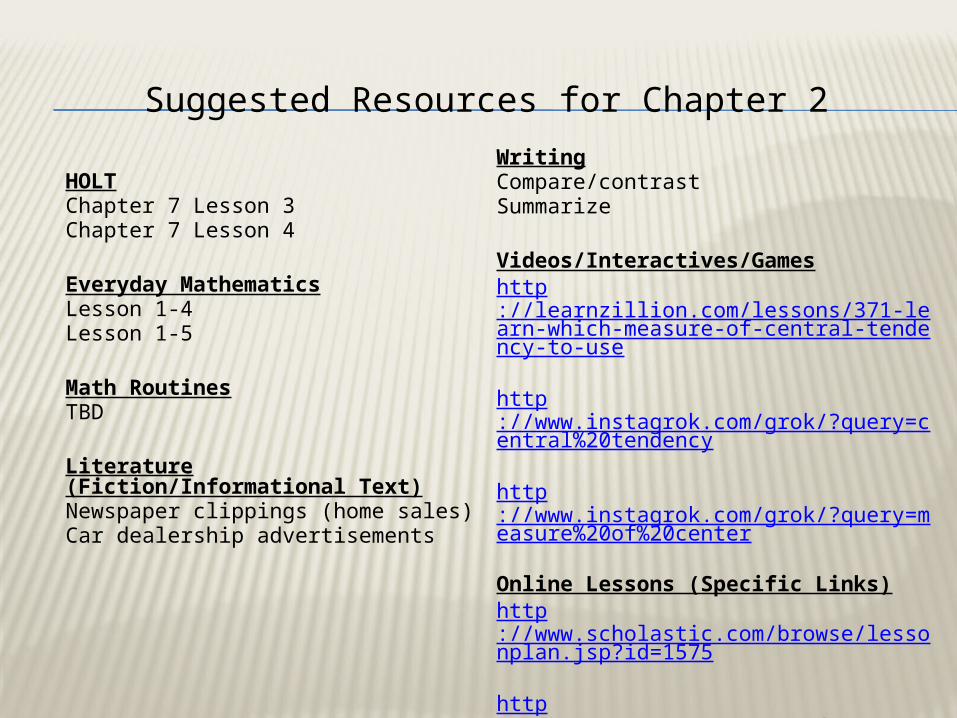
Suggested Resources for Chapter 2
HOLTChapter 7 Lesson 3Chapter 7 Lesson 4
Everyday MathematicsLesson 1-4Lesson 1-5
Math RoutinesTBD
Literature (Fiction/Informational Text)Newspaper clippings (home sales)Car dealership advertisements
WritingCompare/contrastSummarize
Videos/Interactives/Gameshttp://learnzillion.com/lessons/371-learn-which-measure-of-central-tendency-to-use
http://www.instagrok.com/grok/?query=central%20tendency
http://www.instagrok.com/grok/?query=measure%20of%20center
Online Lessons (Specific Links)http://www.scholastic.com/browse/lessonplan.jsp?id=1575
http://www.nsa.gov/academia/_files/collected_learning/middle_school/algebra/measures_central.pdf **this lesson addresses many chapters for this unit**
Chapter 3 Days: 7(Chapter = series of lessons/tasks)
Essential Standards6.SP.4
Enduring Understandings DATA REPRESENTATION: Data can be represented visually using tables, charts, and graphs. The type of data determines the best choice of visual representation.
Essential QuestionsWhen is one type of data display more appropriate than another?
Learning Objectives Students will appropriately display numerical data.
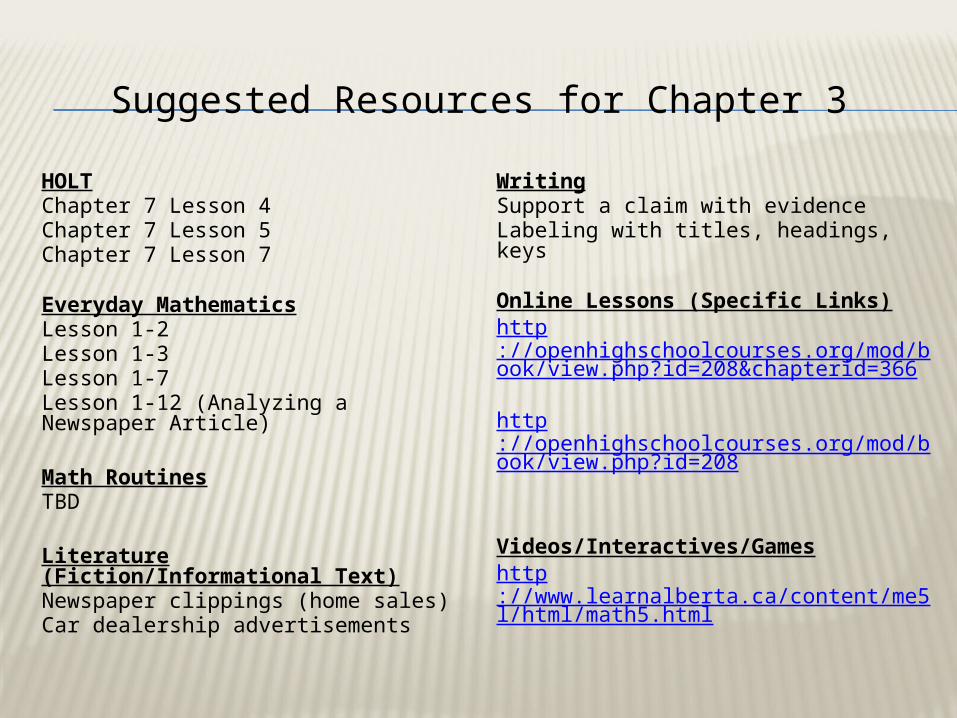
Suggested Resources for Chapter 3
HOLTChapter 7 Lesson 4Chapter 7 Lesson 5Chapter 7 Lesson 7
Everyday MathematicsLesson 1-2Lesson 1-3Lesson 1-7Lesson 1-12 (Analyzing a Newspaper Article)
Math RoutinesTBD
Literature (Fiction/Informational Text)Newspaper clippings (home sales)Car dealership advertisements
WritingSupport a claim with evidenceLabeling with titles, headings, keys
Online Lessons (Specific Links)http://openhighschoolcourses.org/mod/book/view.php?id=208&chapterid=366
http://openhighschoolcourses.org/mod/book/view.php?id=208
Videos/Interactives/Gameshttp://www.learnalberta.ca/content/me5l/html/math5.html
Essential QuestionsHow can data be described using measures of central tendency?
How do you determine which measure of central tendency is most appropriate to use for a given data set?
How are the measures of variability relevant to a given set of data?
Learning Objectives Students will demonstrate understanding of measures of central tendency.
Students will justify which measure of central tendency is most appropriate in a given situation.
Students will understand the use of measures of variability.
Essential Standards6.SP.26.SP.5 d
Enduring UnderstandingsDATA DISTRIBUTION: There are special numerical measures that describe the center and spread of numerical data sets.
Chapter 4 Days: 9(Chapter = series of lessons/tasks)
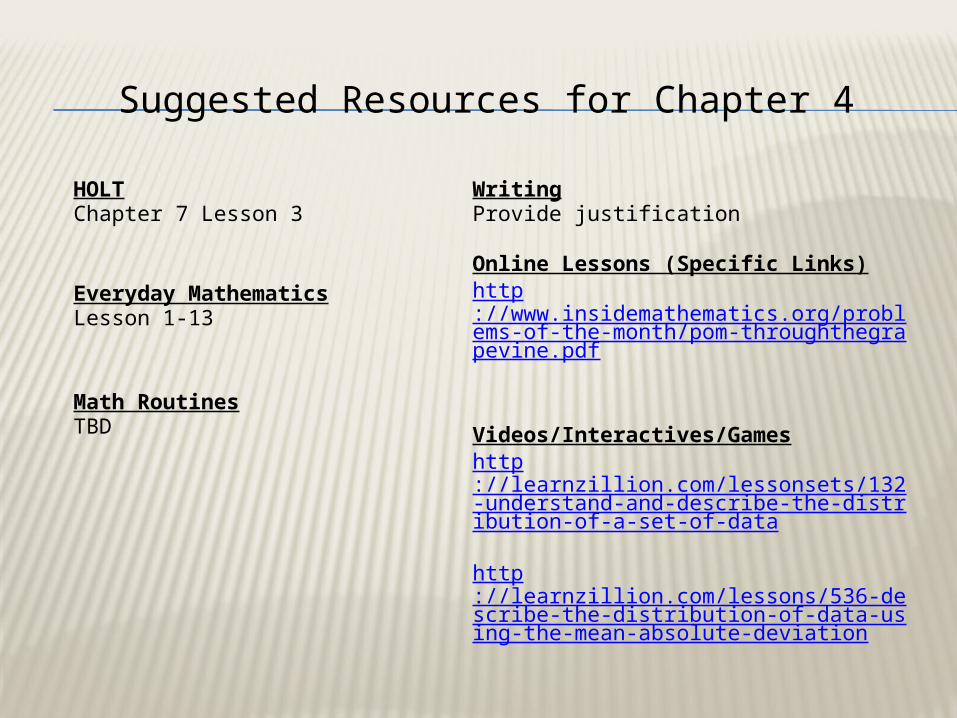
Suggested Resources for Chapter 4
HOLTChapter 7 Lesson 3
Everyday MathematicsLesson 1-13
Math RoutinesTBD
WritingProvide justification
Online Lessons (Specific Links)http://www.insidemathematics.org/problems-of-the-month/pom-throughthegrapevine.pdf
Videos/Interactives/Gameshttp://learnzillion.com/lessonsets/132-understand-and-describe-the-distribution-of-a-set-of-data
http://learnzillion.com/lessons/536-describe-the-distribution-of-data-using-the-mean-absolute-deviation
Assessment
Summative Teacher created/selected
Measured Progress: Benchmarks
Smarter Balanced Assessment (3-8)
Formative Teacher created/selected
Measured Progress: Testlets
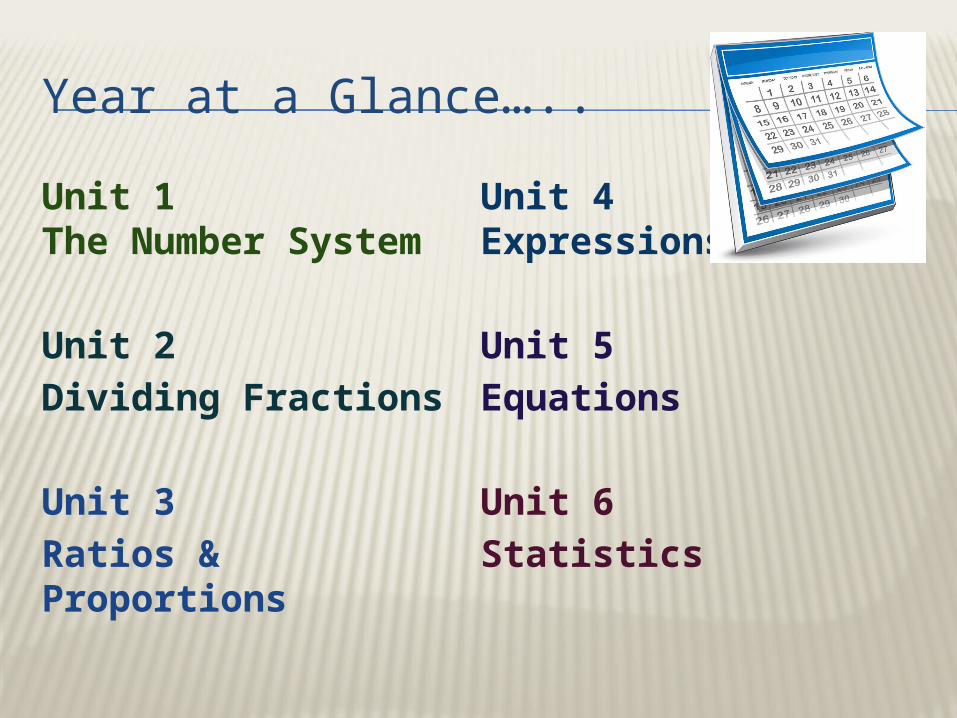
Year at a Glance…..
Unit 1The Number
System
Unit 2
Dividing Fractions
Unit 3
Ratios & Proportions
Unit 4Expressions
Unit 5
Equations
Unit 6
Statistics