Embed Size (px)
Citation preview
CCB & VCS PROJECT DESCRIPTION: CCB Version 3, VCS Version 3
CCB v3.0, VCS v3.3 1
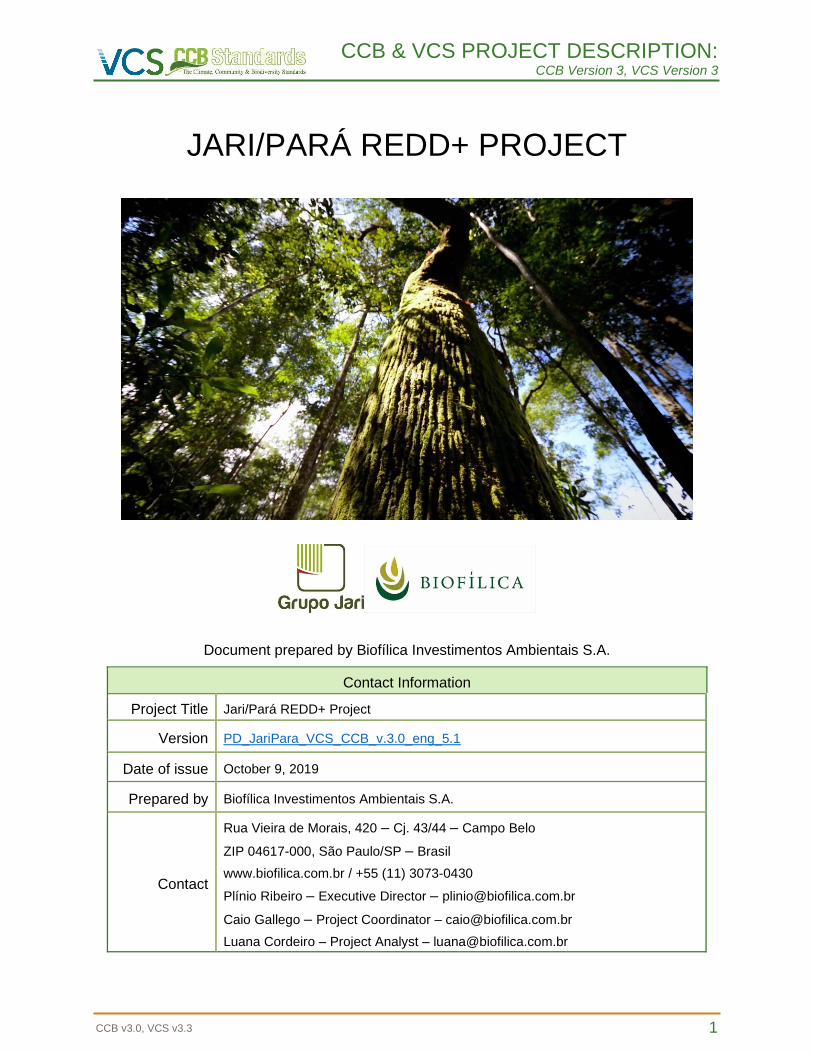
JARI/PARÁ REDD+ PROJECT
Document prepared by Biofílica Investimentos Ambientais S.A.
Contact Information
Project Title Jari/Pará REDD+ Project
Version PD_JariPara_VCS_CCB_v.3.0_eng_5.1
Date of issue October 9, 2019
Prepared by Biofílica Investimentos Ambientais S.A.
Contact
Rua Vieira de Morais, 420 – Cj. 43/44 – Campo Belo
ZIP 04617-000, São Paulo/SP – Brasil
www.biofilica.com.br / +55 (11) 3073-0430
Plínio Ribeiro – Executive Director – [email protected]
Caio Gallego – Project Coordinator – [email protected]
Luana Cordeiro – Project Analyst – [email protected]
CCB & VCS PROJECT DESCRIPTION: CCB Version 3, VCS Version 3
CCB v3.0, VCS v3.3 2
Project Title Jari/Pará REDD+ Project
Version PD_JariPara_VCS_CCB_v.3.0_eng_5.1
Date of issue October 9, 2019
Project Location Brazil, State of Pará, Municipality of Almeirim
Project Proponents
- Biofílica Investimentos Ambientais Plínio Ribeiro,
[email protected], +55 11 3073-0430;
- Jari Celulose: Patrick Nagem Nogueira,
[email protected], +55 11 4689-8753;
- Fundação Jari: Jorge Rafael Almeida,
[email protected], +55 93 3735-1140.
Prepared by Biofílica Investimentos Ambientais S.A.
Validation Body RINA Services S.p.A. (RINA)
Project Lifetime July 8, 2014 through July 7, 2044 - 30 years
GHG Accounting Period July 8, 2014 through July 7, 2044 - 30 years
History of CCB Status First validation attempt
Golden Level Criteria
The Project meets the criterion of the GL3 Gold Level. – Exceptional
Benefits to Biodiversity, according to the vulnerability criterion
described by CCBS for presenting critically endangered or threatened
species (according to the IUCN Red List). The Jari/Pará REDD+
Project Area has an important role in conserving the biodiversity of the
site and the activities proposed in the Project, as monitoring the
biodiversity and incentives to carry out scientific research, have the
purpose of helping to maintain this conservation.
Expected Verification
Schedule
First Verification in CCBS every three years after validation/verification
and thereafter every two years throughout the Project life cycle.
VCS checks are expected every three years.
CCB & VCS PROJECT DESCRIPTION: CCB Version 3, VCS Version 3
CCB v3.0, VCS v3.3 3
TABLE OF CONTENTS
1 SUMMARY OF PROJECT BENEFITS ..............................................................................10
1.1 Unique Project Benefits............................................................................................................... 10
1.2 Standardized Benefits Metrics .................................................................................................... 11
2 GENERAL .........................................................................................................................13
2.1 Project Goals, Design and Long-Term Viability .......................................................................... 13
2.2 Without-project Land Use Scenario and Additionality ................................................................. 61
2.3 Stakeholder Engagement ........................................................................................................... 65
2.4 Management Capacity ................................................................................................................ 79
2.5 Legal Status and Property Rights ............................................................................................... 84
3 CLIMATE ...........................................................................................................................99
3.1 Application of the Methodology ................................................................................................... 99
3.2 Quantification of GHG Emission Reductions and Removals .................................................... 159
3.3 Monitoring ................................................................................................................................. 187
3.4 Optional Criterion: Climate Change Adaptation Benefits .......................................................... 213
4 COMMUNITY ................................................................................................................... 214
4.1 Without-Project Community Scenario ....................................................................................... 214
4.2 Net Positive Community Impacts .............................................................................................. 237
4.3 Other Stakeholder Impacts ....................................................................................................... 242
4.4 Community Impact Monitoring .................................................................................................. 244
4.5 Optional Criterion: Exceptional Community Benefits ................................................................ 245
5 BIODIVERSITY................................................................................................................ 246
5.1 Without-Project Biodiversity Scenario ....................................................................................... 246
5.2 Net Positive Biodiversity Impacts .............................................................................................. 255
5.3 Offsite Biodiversity Impacts ....................................................................................................... 259
5.4 Biodiversity Impact Monitoring .................................................................................................. 260
5.5 Optional Criterion: Exceptional Biodiversity Benefits ................................................................ 263
REFERENCES .......................................................................................................................................... 266
CCB & VCS PROJECT DESCRIPTION: CCB Version 3, VCS Version 3
CCB v3.0, VCS v3.3 4
LIST OF FIGURES
Figure 1. Location of the Jari/Pará REDD+ Project .................................................................................... 17
Figure 2. Monthly average precipitated based on data provided by the Grupo Jari, whose meteorological
station is located in the district of Monte Dourado, municipality of Almeirim/PA ........................................ 20
Figure 3. River basins in the region of the Jari/Pará REDD+ Project zone ................................................ 21
Figure 4. Map of the hydrographic network in the region of the Jari/Pará REDD+ Project zone ............... 21
Figure 5. Types of vegetation registered in the Jari/Pará REDD+ Project Zone ........................................ 22
Figure 6. Map of the Jari/Pará REDD+ Project zone .................................................................................. 27
Figure 7. Initial draft of the financial management model of the Jari/Pará REDD+ Project ........................ 33
Figure 8. Feedback Channel "Contact Us" among the materials available from the Jari/Pará REDD+
Project ......................................................................................................................................................... 73
Figure 9. Stakeholder comment form .......................................................................................................... 74
Figure 10. Location of the Reference Region, Project Area, Leakage Belt, and Leakage Management
Area ........................................................................................................................................................... 101
Figure 11. Land situation in the Reference Region (SIGEF – INCRA, 2019) ........................................... 101
Figure 12. Forest typologies identified in the Reference Region (Source: IBGE) .................................... 103
Figure 13. Elevation Map of the Region of Reference .............................................................................. 104
Figure 14. Declivity Map of the Region of Reference ............................................................................... 105
Figure 15. Coordinates of the physical boundary of the Project Area (WGS 1984, UTM – Zone 22S).... 107
Figure 16. Simplified scheme to generate the Leakage Belt .................................................................... 110
Figure 17. Reference map of the forest cover in 2014 in the Reference Region of the Jari/Pará REDD+
Project ....................................................................................................................................................... 111
Figure 18. Land-use and Land-cover chenge map from 2000 to 2014 .................................................... 112
Figure 19. Land Use and Land Cover Map and Deforestation for the sub-period analyzed .................... 117
Figure 20. Annual deforestation in the Reference Region between 2000 and 2014 ................................ 120
Figure 21. Location of squatters in the Project Reference Region ........................................................... 123
Figure 22. Population variation in the municipalities of the Reference Region (IBGE, 2010) .................. 124
Figure 23. Location of deforested areas between 2000 and 2014 within the properties declared in
SISCAR in the Project Reference Region ................................................................................................. 125
Figure 24. Correlation between the variables "Deforestation" and "cattle herd" ...................................... 132
Figure 25. Correlation between the variables "Deforestation" and "Timber production" .......................... 132
Figure 26. Correlation between the variables "Deforestation" and "Area for planting cassava"............... 132
Figure 27. Historical deforestation rate ..................................................................................................... 133
Figure 28. Cumulative deforestation until 2044 in the Reference Region ................................................ 135
Figure 29. Histogram of the 9 variables used in the deforestation risk model .......................................... 138
Figure 30. Simplified scheme for the generation of deforestation risk models ......................................... 140
Figure 31. Transition potential map for the occurrence of deforestation in the Reference Region .......... 142
CCB & VCS PROJECT DESCRIPTION: CCB Version 3, VCS Version 3
CCB v3.0, VCS v3.3 5
Figure 32. Relevance weight graph of the variables used in the calibration stage of the deforestation risk
model (2000-2007) .................................................................................................................................... 143
Figure 33. Demonstration of the model evaluation method with the FOM tool ......................................... 143
Figure 34. Relative Operating Characteristic curve (ROC) of deforestation model validation ................. 144
Figure 35. Projection of land cover in the Reference Region, Project Area and Leakage Belt of the
Jari/Pará REDD+ Project until the year 2044 ........................................................................................... 146
Figure 36. Deforestation growth trends in the Project region (INPE, 2014) ............................................. 151
Figure 37. Variation in Incomes and Expenses in Scenario II .................................................................. 154
Figure 38. Variation in Incomes and Expenses in Scenario III ................................................................. 154
Figure 39. Map of the reference region with private properties and conservation units analyzed ........... 158
Figure 40. Allocation of sample forest inventory units in the Project Area ............................................... 164
Figure 41. Evolution of population percentage in the municipality of Almeirim ........................................ 216
Figure 42. Percentage of the resident population by gender in the municipality of Almeirim Source: Atlas
of Human Development, 2013 .................................................................................................................. 216
Figure 43. Age pyramid for the municipality of Almeirim in 2010. Source: IBGE – Demographic Census
2010 .......................................................................................................................................................... 217
Figure 44. Illiteracy rate of persons aged 15 years or over. Source: IBGE – Demographic Census 2000
and 2010 ................................................................................................................................................... 218
Figure 45. Number of schools per level and municipality in the Jari Valley region in 2012 Source: IBGE,
2012. ......................................................................................................................................................... 218
Figure 46. Health establishments in the municipalities of Jari Valley in 2009 Source: IBGE, Medical Health
Care 2009. NOTE: Zeros are attributed to the values of municipalities where there is no occurrence of the
variable or where, by rounding, the totals do not reach the unit of measurement. ................................... 219
Figure 47. Gross Domestic Product of Almeirim, Laranjal do Jari and Vitória do Jari in 2012 Source:
IBGE, in partnership with the State Statistical Bodies, State Secretariats of Government and
Superintendence of the Manaus Free Trade Zone SUFRAMA, 2012. ..................................................... 220
Figure 48. Type of government benefit received by producers Source: Family Diagnosis Jari/Pará REDD+
Project ....................................................................................................................................................... 222
Figure 49. Origin of producers assisted by state Source: Family Diagnosis Jari/Pará REDD+ Project ... 223
Figure 50. Main activity of producers assisted by state Source: Family Diagnosis Jari/Pará REDD+
Project ....................................................................................................................................................... 223
Figure 51. Age group of producers assisted by the Project Source: Family Diagnosis of the Jari/Pará
REDD+ Project .......................................................................................................................................... 224
Figure 52. Time of residence in the region of the producers assisted by the Project Source: Family
Diagnosis of the Jari/Pará REDD+ Project ............................................................................................... 224
Figure 53. Gender distribution of producers assisted by the Project Source: Family Diagnosis of the
Jari/Pará REDD+ Project .......................................................................................................................... 225
CCB & VCS PROJECT DESCRIPTION: CCB Version 3, VCS Version 3
CCB v3.0, VCS v3.3 6
Figure 54. Average size in hectares of the properties areas of the assisted producers Source: Family
Diagnosis of the Jari/Pará REDD+ Project ............................................................................................... 225
Figure 55. Source of families’ income Source: Family Diagnosis of the Jari/Pará REDD+ Project.......... 226
Figure 56. Main crops developed by the producers assisted by the Project Source: Family Diagnosis of
the Jari/Pará REDD+ Project. ................................................................................................................... 226
Figure 57. Receipt of visits of health agents to producers advised by the Project Source: Family Diagnosis
of the Jari/Pará REDD+ Project. ............................................................................................................... 227
Figure 58. Sanitary installations in the residences of the producers assisted by the Project Source: Family
Diagnosis of the Jari/Pará REDD+ Project. .............................................................................................. 227
Figure 59. Water sources of the producers advised by the Project Source: Family Diagnosis of the
Jari/Pará REDD+ Project. ......................................................................................................................... 228
Figure 60. Water treatments used by the producers advised by the Project Source: Family Diagnosis of
the Jari/Pará REDD+ Project. ................................................................................................................... 228
Figure 61. Type of energy used by producers assisted by the Project Source: Family Diagnosis of the
Jari/Pará REDD+ Project. ......................................................................................................................... 229
Figure 62. Access to school by producers assisted by the Project Source: Family Diagnosis of the
Jari/Pará REDD+ Project. ......................................................................................................................... 229
Figure 63. Level of school education in the communities of producers assisted by the Project Source:
Family Diagnosis of the Jari/Pará REDD+ Project. ................................................................................... 229
Figure 64. Detail for the location and delimitation of the HCVA Spring of Vila Planalto (Source: Casa da
Floresta, 2016) .......................................................................................................................................... 231
Figure 65. Areas of potential local Brazil nut in the Jari/Pará REDD+ Project Area ................................. 241
Figure 66. Map Castanhal Santa Maria – Community of Cafezal (BNDES, 2018)................................... 242
Figure 67. Image of Brazil nut tree (Bertholletia excelsa) ......................................................................... 249
Figure 68. Birds registered in the Jari/Pará REDD+ Project Area. Identification: a. jacumirim (Penelope
marail); b. macuru-de-testa-branca (Notharchus marcrorhynchos); c. pipira-vermelha (Ramphocelus
carbo); d. tucano-grande-de-papo-branco (Ramphatos tucanus tucanus) ............................................... 250
LIST OF TABLES
Table 1. Summary of expected benefits in the Jari/Pará REDD+ Project .................................................. 10
Table 2. Estimates of the net benefit for different metrics during the lifecycle of the Jari/Pará REDD+
Project ......................................................................................................................................................... 11
Table 3. Project Scale ................................................................................................................................. 14
Table 4. Identification, contact and responsibility of the proponents of the Jari/Pará REDD+ Project ....... 14
Table 5. Identification, contact and responsibility of other entities involved in the Jari/Pará REDD+ Project
.................................................................................................................................................................... 15
CCB & VCS PROJECT DESCRIPTION: CCB Version 3, VCS Version 3
CCB v3.0, VCS v3.3 7
Table 6. Forest typologies registered in the Jari/Pará REDD+ Project Zone, based on Brazilian vegetation
classification (IBGE, 2012) .......................................................................................................................... 23
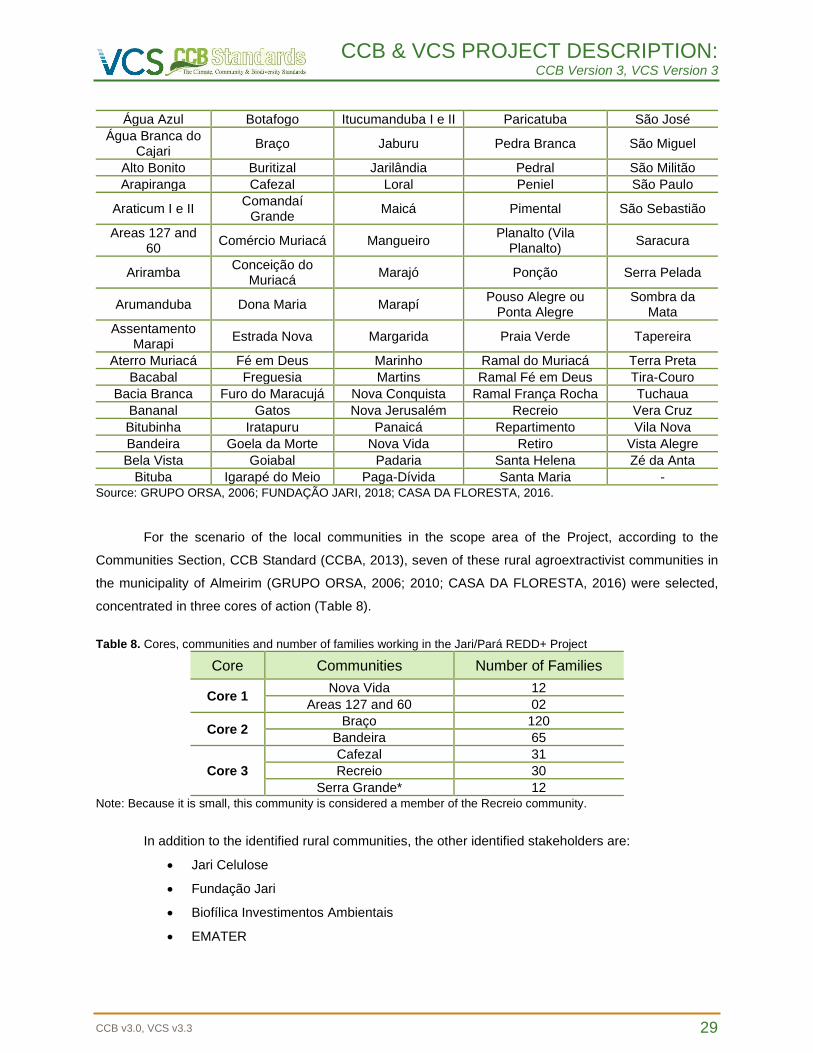
Table 7. Communities located in the Jari/Pará REDD+ Project zone ......................................................... 28
Table 8. Cores, communities and number of families working in the Jari/Pará REDD+ Project ................ 29
Table 9. Description of the stakeholders of the Jari/Pará REDD+ Project ................................................. 30
Table 10. Description of the activities and their respective results and impacts of the Jari/Pará REDD+
Project, which will contribute to achieving the expected benefits for the climate, community and
biodiversity .................................................................................................................................................. 40
Table 11. Contribution to the UN Sustainable Development Goals ............................................................ 54
Table 12. Detailed implementation schedule of the main activities related to the Jari/Pará REDD+ Project
.................................................................................................................................................................... 56
Table 13. Estimated reductions or removals of GHG emissions for the Jari/Pará REDD+ Project ............ 58
Table 14. Final score of non-permanence risk for the Jari/Pará REDD+ Project ....................................... 59
Table 15. Identification of risks to expected benefits for the climate, communities and biodiversity and
their mitigation measures for the Jari/Pará REDD+ Project........................................................................ 59
Table 16. Rural properties approved to carry out the Sustainable Forest Management Plan in the
Jari/Pará REDD+ Project ............................................................................................................................ 85
Table 17. Summary of the mechanisms of land inspection in the Jari/Pará REDD+ Project Area............. 89
Table 18. Criteria for the applicability of Jari/Pará REDD+ Project methodology and assistance ............. 99
Table 19. Main forest typologies identified in the Reference Region of the Jari/Pará REDD+ Project .... 103
Table 20. Main forest typologies identified in the Project Area of the Jari/Pará REDD+ Project ............. 104
Table 21. Elevation (class of 50 meters) in the Reference Region and Project Area of the Jari/Pará
REDD+ Project .......................................................................................................................................... 105
Table 22. Declivity (%) found in the Reference Region and Project Area of the Jari/Pará REDD+ Project
.................................................................................................................................................................. 106
Table 23. Carbon pools included or excluded within the boundary of the proposed AUD Jari/Pará REDD+
Project activity (Table 3 of methodology VM0015, page 26) .................................................................... 113
Table 24. Sources and GHG included or excluded within the boundary of the proposed AUD Jari/Pará
REDD+ Project activity (Table 4 of methodology VM0015, page 28) ....................................................... 113
Table 25. Data used to identify and map historical LU/LC change analysis in the Jari/Pará REDD+ Project
(Table 5 of methodology VM0015, page 30) ............................................................................................. 114
Table 26. List of all land use and land cover classes existing at the Jari/Pará REDD+ Project start date
within the Reference Region (Table 6 of methodology VM0015, page 32) .............................................. 117
Table 27. List of land-use and land-cover change categories (Table 7b of methodology VM0015, page 33)
.................................................................................................................................................................. 118
Table 28. Matrix of confusion of the soil cover map (PRODES, 2014) of the Reference Region generated
from satellite images available in Google Earth ........................................................................................ 119
CCB & VCS PROJECT DESCRIPTION: CCB Version 3, VCS Version 3
CCB v3.0, VCS v3.3 8
Table 29. Potential land-use and land-cover change matrix in the Reference Region between 2000 and
2014 (Table 7a of methodology VM0015, page 32) ................................................................................. 120
Table 30. Characteristics of properties located in the Reference Region ................................................ 125
Table 31. Annual areas of baseline deforestation in the Reference Region until 2044 (Table 9a of
methodology VM0015, page 49) ............................................................................................................... 134
Table 32. Annual areas of baseline deforestation in the Project Area until 2044 (Table 9b of methodology
VM0015, page 49) ..................................................................................................................................... 135
Table 33. Annual areas of baseline deforestation in the Leakage Belt until 2044 (Table 9c of methodology
VM0015, page 50) ..................................................................................................................................... 136
Table 34. List of variables, maps and factor maps (Table 10 of methodology VM0015, page 53) .......... 139
Table 35. Scenarios and their sources of income and expenses ............................................................. 152
Table 36. Comparative result of the cash flow in both scenarios ............................................................. 153
Table 37. Main localities found in the Region of Reference ..................................................................... 156
Table 38. Annual areas deforested per forest class icl within the Project Area in the baseline case (Table
11b of VM0015) ......................................................................................................................................... 159
Table 39. Annual areas deforested per forest class icl within the Leakage Belt in the baseline case (Table
11c of VM0015) ......................................................................................................................................... 160
Table 40. Zones of the Reference Region encompassing different combinations of potential post-
deforestation LU/LC classes (Table 12 of VM0015) ................................................................................. 161
Table 41. Annual areas deforested in each zone within the Project Area in the baseline case (Table 13b
of VM0015) ................................................................................................................................................ 161
Table 42. Annual areas deforested in each zone within the Leakage Belt in the baseline case (Table 13c
of VM0015) ................................................................................................................................................ 162
Table 43. Estimated values of carbon stocks per hectare of initial forest classes icl existing in the Project
Area and Leakage Belt (Table 15a of VM0015)........................................................................................ 166
Table 44. Carbon stock change factors for initial forest classes icl (Method 1) (Table 20a of VM0015) . 168
Table 45. Carbon stock change factors for final classes fcl or zones z (Method 1) (Table 20b of VM0015)
.................................................................................................................................................................. 169
Table 46. Baseline carbon stock changes in the above-groud biomass in the Project Area (Table 21b of
VM0015) .................................................................................................................................................... 171
Table 47. Baseline carbon stock change in the above-ground biomass in the Leakage Belt (Table 21c of
VM0015) .................................................................................................................................................... 172
Table 48. Ex ante estimated actual carbon stock decrease due to planned deforestation in the Project
Area (Table 25a of Methodology VM0015) ............................................................................................... 173
Table 49. Total ex ante carbon stock decrease due to planned activities in the Project Area (Table 25d of
Methodology VM0015) .............................................................................................................................. 175
CCB & VCS PROJECT DESCRIPTION: CCB Version 3, VCS Version 3
CCB v3.0, VCS v3.3 9
Table 50. Ex ante estimated net carbon stock change in the Project Area under the Project scenario
(Table 27 of VM0015) ............................................................................................................................... 177
Table 51. Total ex ante estimated actual net carbon stock changes and emissions of non-CO2 gasses in
the Project Area (Table 29 of VM0015) .................................................................................................... 179
Table 52. Ex ante estimated leakage due to activity displacement (Table 34 of VM0015) ...................... 181
Table 53. Ex ante estimated total leakage (Table 35 of VM0015) ............................................................ 183
Table 54. Ex ante estimated net anthropogenic GHG emissions reductions (∆REDDt) and Verified Carbon
Units (VCUt) (Table 36 of VM0015) .......................................................................................................... 186
Table 55. Data to be collected to monitoring carbon stock changes and GHG emissions for periodic
verification in the Jari/Pará REDD+ Project .............................................................................................. 199
Table 56. Data to be collected for leakage monitoring for Jari/Pará REDD+ Project ............................... 204
Table 57. Data to be collected to monitor the net ex-post GHG gases reductions for the Jari/Pará REDD+
Project ....................................................................................................................................................... 207
Table 58. Data to be collected to monitor activities .................................................................................. 209
Table 59. Human Development Indexes for the municipality of Almeirim in relation to income, longevity
and education ............................................................................................................................................ 217
Table 60. Health professionals According to selected categories in the municipality of Almeirim, 2010 . 219
Table 61. Means of obtaining income by community ................................................................................ 221
Table 62. Identification of the area of high conservation value in the Jari/Pará REDD+ Project Area ..... 231
Table 63. Relationship between agents, drivers and underlying causes of deforestation and scenarios
with and without the Jari/Pará REDD+ Project ......................................................................................... 235
Table 64. List of species with major commercial interest in the Jari/Pará REDD+ Project Area .............. 246
Table 65. Flora species threatened according to the IUCN Red List of Threatened Species .................. 249
Table 66. Species of wildlife endangered according to the IUCN Red List of Threatened Species ......... 252
Table 67. Identification of the area of high conservation value in the Jari/Pará REDD+ Project Area ..... 253
Table 68. Description of expected changes to biodiversity for the Jari/Pará REDD+ Project .................. 255
Table 69. Description of the main fertilizer used in the Jari/Pará REDD+ Project .................................... 258
Table 70. Biodiversity Monitoring Plan for the Jari/Pará REDD+ Project ................................................. 261
Table 71. Identification and description of the trigger species and the tendency of the populations for the
scenarios without and with Jari/Pará REDD+ Project ............................................................................... 263
CCB & VCS PROJECT DESCRIPTION: CCB Version 3, VCS Version 3
CCB v3.0, VCS v3.3 10
1 SUMMARY OF PROJECT BENEFITS
1.1 Unique Project Benefits
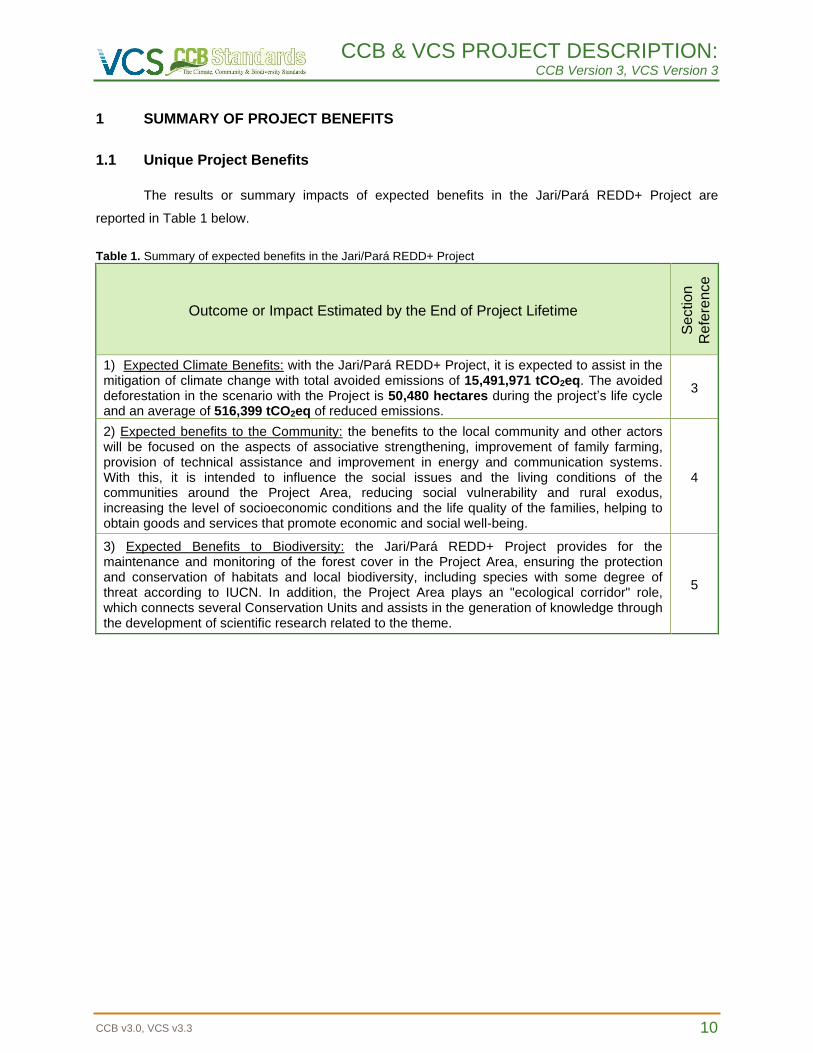
The results or summary impacts of expected benefits in the Jari/Pará REDD+ Project are
reported in Table 1 below.
Table 1. Summary of expected benefits in the Jari/Pará REDD+ Project
Outcome or Impact Estimated by the End of Project Lifetime
Se
ction
Re
fere
nce
1) Expected Climate Benefits: with the Jari/Pará REDD+ Project, it is expected to assist in the mitigation of climate change with total avoided emissions of 15,491,971 tCO2eq. The avoided deforestation in the scenario with the Project is 50,480 hectares during the project’s life cycle and an average of 516,399 tCO2eq of reduced emissions.
3
2) Expected benefits to the Community: the benefits to the local community and other actors will be focused on the aspects of associative strengthening, improvement of family farming, provision of technical assistance and improvement in energy and communication systems. With this, it is intended to influence the social issues and the living conditions of the communities around the Project Area, reducing social vulnerability and rural exodus, increasing the level of socioeconomic conditions and the life quality of the families, helping to obtain goods and services that promote economic and social well-being.
4
3) Expected Benefits to Biodiversity: the Jari/Pará REDD+ Project provides for the maintenance and monitoring of the forest cover in the Project Area, ensuring the protection and conservation of habitats and local biodiversity, including species with some degree of threat according to IUCN. In addition, the Project Area plays an "ecological corridor" role, which connects several Conservation Units and assists in the generation of knowledge through the development of scientific research related to the theme.
5
CCB & VCS PROJECT DESCRIPTION: CCB Version 3, VCS Version 3
CCB v3.0, VCS v3.3 11
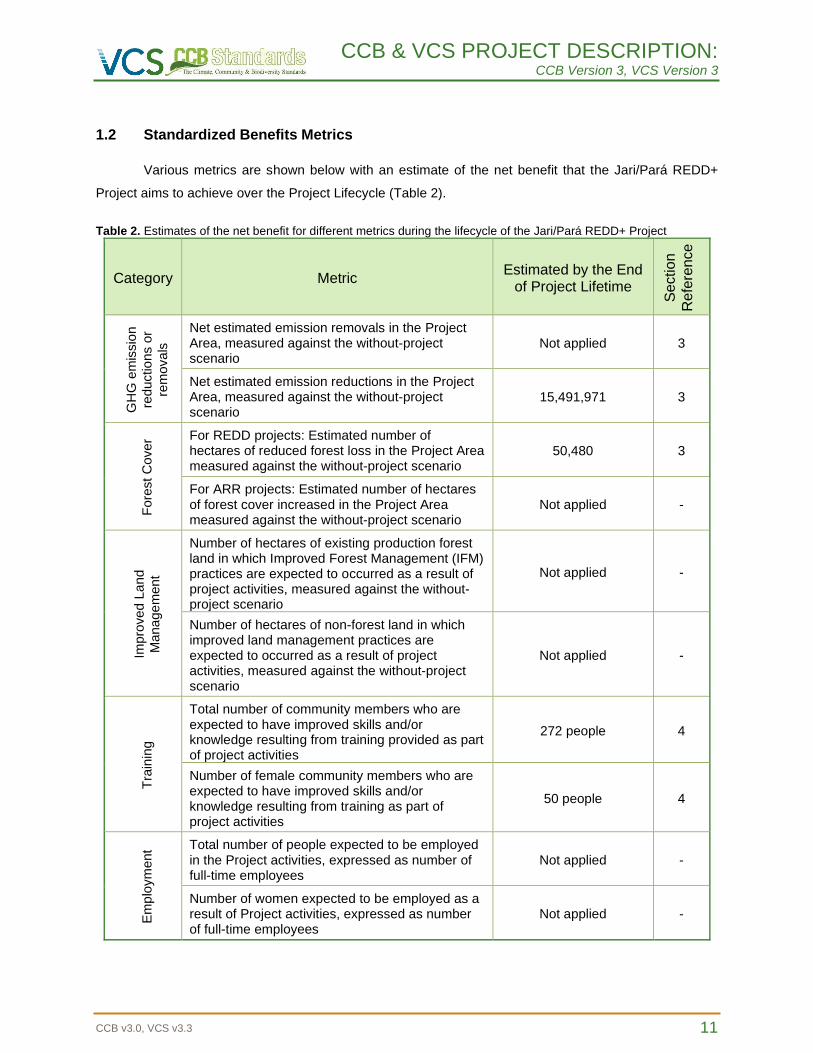
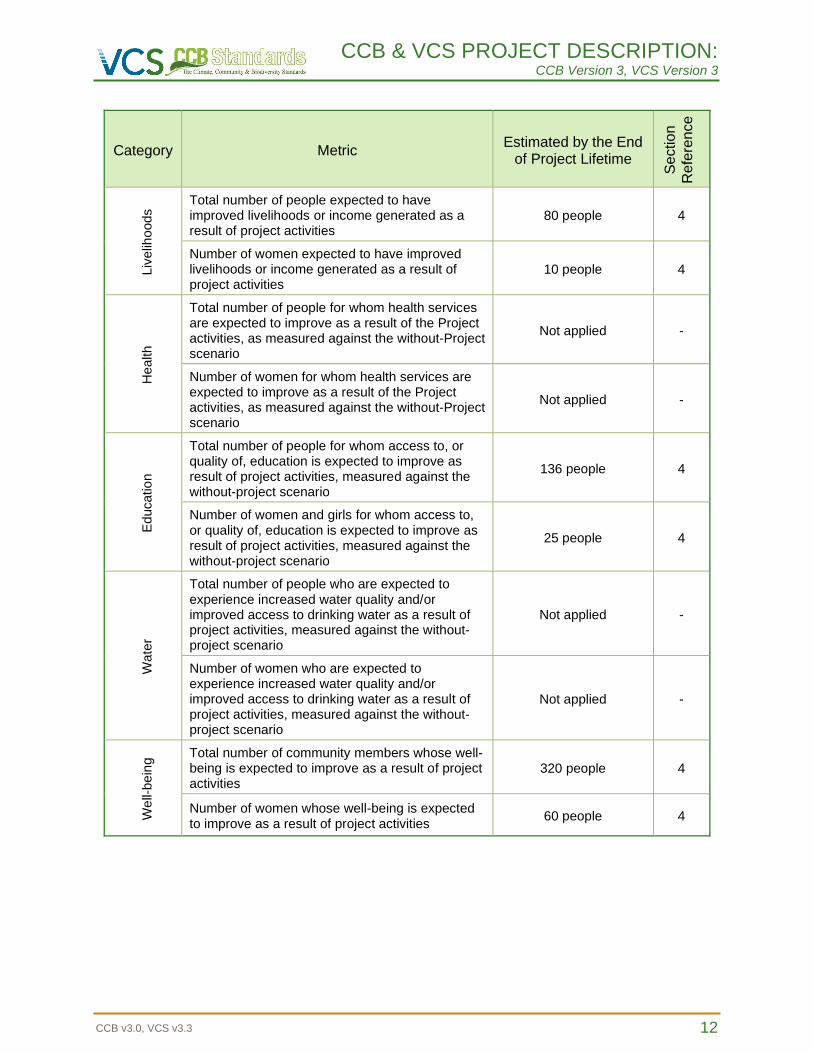
1.2 Standardized Benefits Metrics
Various metrics are shown below with an estimate of the net benefit that the Jari/Pará REDD+
Project aims to achieve over the Project Lifecycle (Table 2).
Table 2. Estimates of the net benefit for different metrics during the lifecycle of the Jari/Pará REDD+ Project
Category Metric Estimated by the End
of Project Lifetime
Se
ction
Re
fere
nce
GH
G e
mis
sio
n
reductio
ns o
r
rem
ovals
Net estimated emission removals in the Project Area, measured against the without-project scenario
Not applied 3
Net estimated emission reductions in the Project Area, measured against the without-project scenario
15,491,971 3
Fore
st C
over For REDD projects: Estimated number of
hectares of reduced forest loss in the Project Area measured against the without-project scenario
50,480 3
For ARR projects: Estimated number of hectares of forest cover increased in the Project Area measured against the without-project scenario
Not applied -
Impro
ve
d L
and
Mana
ge
ment
Number of hectares of existing production forest land in which Improved Forest Management (IFM) practices are expected to occurred as a result of project activities, measured against the without-project scenario
Not applied -
Number of hectares of non-forest land in which improved land management practices are expected to occurred as a result of project activities, measured against the without-project scenario
Not applied -
Tra
inin
g
Total number of community members who are expected to have improved skills and/or knowledge resulting from training provided as part of project activities
272 people 4
Number of female community members who are expected to have improved skills and/or knowledge resulting from training as part of project activities
50 people 4
Em
plo
ym
ent Total number of people expected to be employed
in the Project activities, expressed as number of full-time employees
Not applied -
Number of women expected to be employed as a result of Project activities, expressed as number of full-time employees
Not applied -
CCB & VCS PROJECT DESCRIPTION: CCB Version 3, VCS Version 3
CCB v3.0, VCS v3.3 12
Category Metric Estimated by the End
of Project Lifetime
Se
ction
Re
fere
nce
Liv
elih
oods Total number of people expected to have
improved livelihoods or income generated as a result of project activities
80 people 4
Number of women expected to have improved livelihoods or income generated as a result of project activities
10 people 4
Health
Total number of people for whom health services are expected to improve as a result of the Project activities, as measured against the without-Project scenario
Not applied -
Number of women for whom health services are expected to improve as a result of the Project activities, as measured against the without-Project scenario
Not applied -
Educatio
n
Total number of people for whom access to, or quality of, education is expected to improve as result of project activities, measured against the without-project scenario
136 people 4
Number of women and girls for whom access to, or quality of, education is expected to improve as result of project activities, measured against the without-project scenario
25 people 4
Wate
r
Total number of people who are expected to experience increased water quality and/or improved access to drinking water as a result of project activities, measured against the without-project scenario
Not applied -
Number of women who are expected to experience increased water quality and/or improved access to drinking water as a result of project activities, measured against the without-project scenario
Not applied -
We
ll-be
ing
Total number of community members whose well-being is expected to improve as a result of project activities
320 people 4
Number of women whose well-being is expected to improve as a result of project activities
60 people 4
CCB & VCS PROJECT DESCRIPTION: CCB Version 3, VCS Version 3
CCB v3.0, VCS v3.3 13
Bio
div
ers
ity C
onserv
ation
Expected change in the number of hectares managed significantly better by the project for biodiversity conservation, measured against the without-project scenario
496,988 5
Expected number of globally Critically Endangered or Endangered species (according to IUCN list of endangered species) benefiting from reduced threats as a result of project activities measured against the without-project scenario
6 species 5
2 GENERAL
2.1 Project Goals, Design and Long-Term Viability
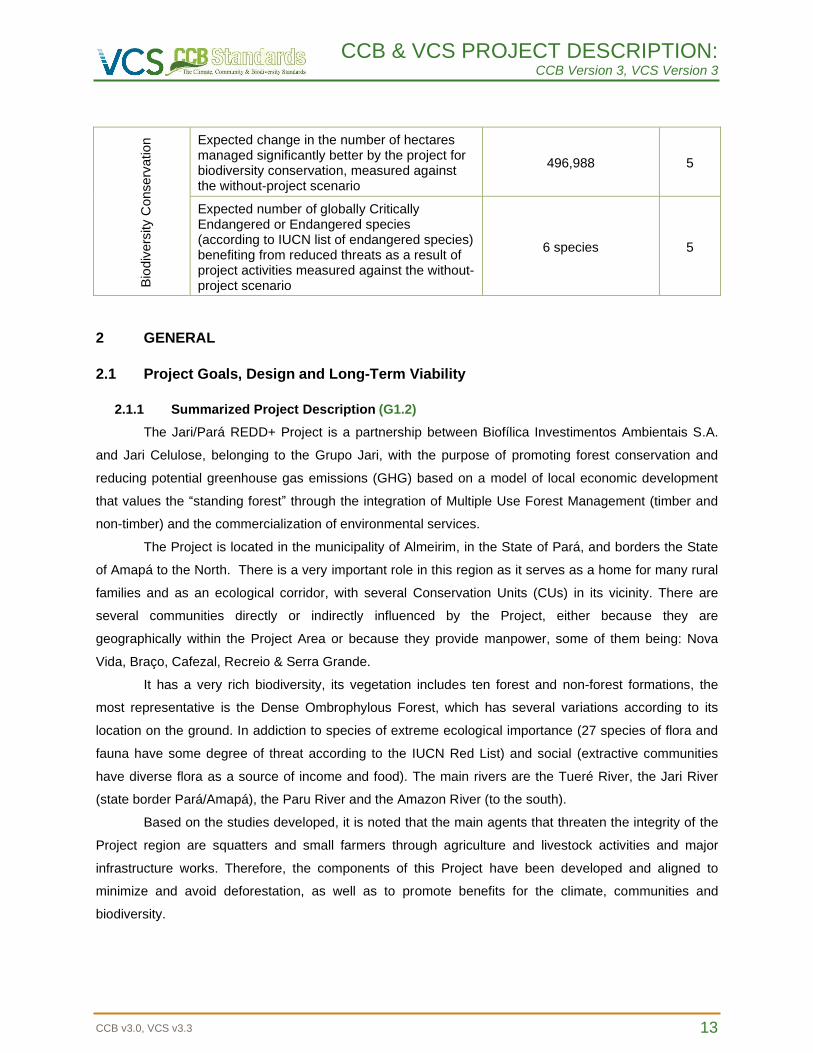
2.1.1 Summarized Project Description (G1.2)
The Jari/Pará REDD+ Project is a partnership between Biofílica Investimentos Ambientais S.A.
and Jari Celulose, belonging to the Grupo Jari, with the purpose of promoting forest conservation and
reducing potential greenhouse gas emissions (GHG) based on a model of local economic development
that values the “standing forest” through the integration of Multiple Use Forest Management (timber and
non-timber) and the commercialization of environmental services.
The Project is located in the municipality of Almeirim, in the State of Pará, and borders the State
of Amapá to the North. There is a very important role in this region as it serves as a home for many rural
families and as an ecological corridor, with several Conservation Units (CUs) in its vicinity. There are
several communities directly or indirectly influenced by the Project, either because they are
geographically within the Project Area or because they provide manpower, some of them being: Nova
Vida, Braço, Cafezal, Recreio & Serra Grande.
It has a very rich biodiversity, its vegetation includes ten forest and non-forest formations, the
most representative is the Dense Ombrophylous Forest, which has several variations according to its
location on the ground. In addiction to species of extreme ecological importance (27 species of flora and
fauna have some degree of threat according to the IUCN Red List) and social (extractive communities
have diverse flora as a source of income and food). The main rivers are the Tueré River, the Jari River
(state border Pará/Amapá), the Paru River and the Amazon River (to the south).
Based on the studies developed, it is noted that the main agents that threaten the integrity of the
Project region are squatters and small farmers through agriculture and livestock activities and major
infrastructure works. Therefore, the components of this Project have been developed and aligned to
minimize and avoid deforestation, as well as to promote benefits for the climate, communities and
biodiversity.
CCB & VCS PROJECT DESCRIPTION: CCB Version 3, VCS Version 3
CCB v3.0, VCS v3.3 14
The main components of the Project relate to forest protection and monitoring; activities aimed at
reducing the risks of deforestation and conserving biodiversity; the promotion of applied scientific
research focused on biodiversity and the efficient use of natural resources; and the inclusion of
communities in the Project, seeking greater integrity among the parties involved as well as focusing on
sustainable business chains and generating income and well-being for local communities. All of these
activities will become economically viable by combining the activities of Multiple Use Forest Management
with the commercialization of carbon credits through REDD+ mechanisms.
2.1.2 Project Scale
Table 3. Project Scale
Project Scale
Project
Large project X
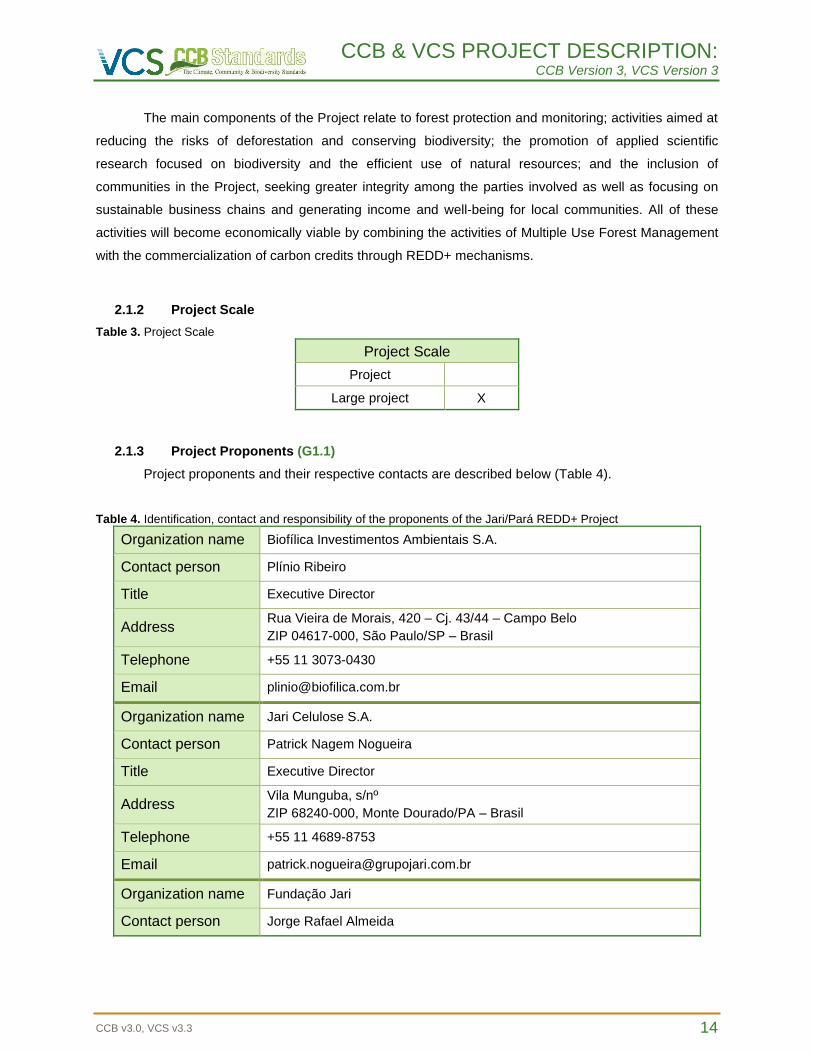
2.1.3 Project Proponents (G1.1)
Project proponents and their respective contacts are described below (Table 4).
Table 4. Identification, contact and responsibility of the proponents of the Jari/Pará REDD+ Project
Organization name Biofílica Investimentos Ambientais S.A.
Contact person Plínio Ribeiro
Title Executive Director
Address Rua Vieira de Morais, 420 – Cj. 43/44 – Campo Belo
ZIP 04617-000, São Paulo/SP – Brasil
Telephone +55 11 3073-0430
Email [email protected]
Organization name Jari Celulose S.A.
Contact person Patrick Nagem Nogueira
Title Executive Director
Address Vila Munguba, s/nº
ZIP 68240-000, Monte Dourado/PA – Brasil
Telephone +55 11 4689-8753
Email [email protected]
Organization name Fundação Jari
Contact person Jorge Rafael Almeida
CCB & VCS PROJECT DESCRIPTION: CCB Version 3, VCS Version 3
CCB v3.0, VCS v3.3 15
Title General Coordinator
Address Alameda Mamoré, 989 – 25th floor – Alphaville
ZIP 06454-040, Barueri/SP – Brasil
Telephone +55 93 3735-1140
Email [email protected]
2.1.4 Other Entities Involved in the Project
Other entities involved in the Jari/Pará REDD+ Project and their respective contacts are
described in Table 5 below.
Table 5. Identification, contact and responsibility of other entities involved in the Jari/Pará REDD+ Project
Organization name BRGEO
Contact person Amintas Brandao Jr.
Title Part-Owner
Address -
Telephone +55 91 98320-3333
Email [email protected]
Organization name Casa da Floresta Assessoria Ambiental
Contact person Klaus D. Barreto & Mônica Cabello de Brito
Title Directors
Address Avenida Joaninha Morganti, 289 – Monte Alegre
ZIP 13415 030, Piracicaba/SP – Brasil
Telephone +55 19 3433-7422
Email [email protected]
Organization name Harmonia Socioambiental
Contact person Nicia Coutinho
Title Senior Consultant
Address Alameda Augusto Fernandes Queiros, 07 – Caranazal
ZIP 68040-650, Santarém/PA – Brasil
Telephone +55 93 99159-8911
Email [email protected]
CCB & VCS PROJECT DESCRIPTION: CCB Version 3, VCS Version 3
CCB v3.0, VCS v3.3 16
Organization name Florestal Recursos Manejo Brasil Consultoria e Assessoria Ltda. (FRM
BRASIL)
Contact person Arlei Fontoura
Title Executive Director
Address Travessa São Pedro, 566, SL1 – Batista Campos
ZIP 66023-705, Belém/PA – Brasil
Telephone +55 91-3241-3111
Email [email protected]
2.1.5 Physical Parameters (G1.3)
Location of the Project Zone
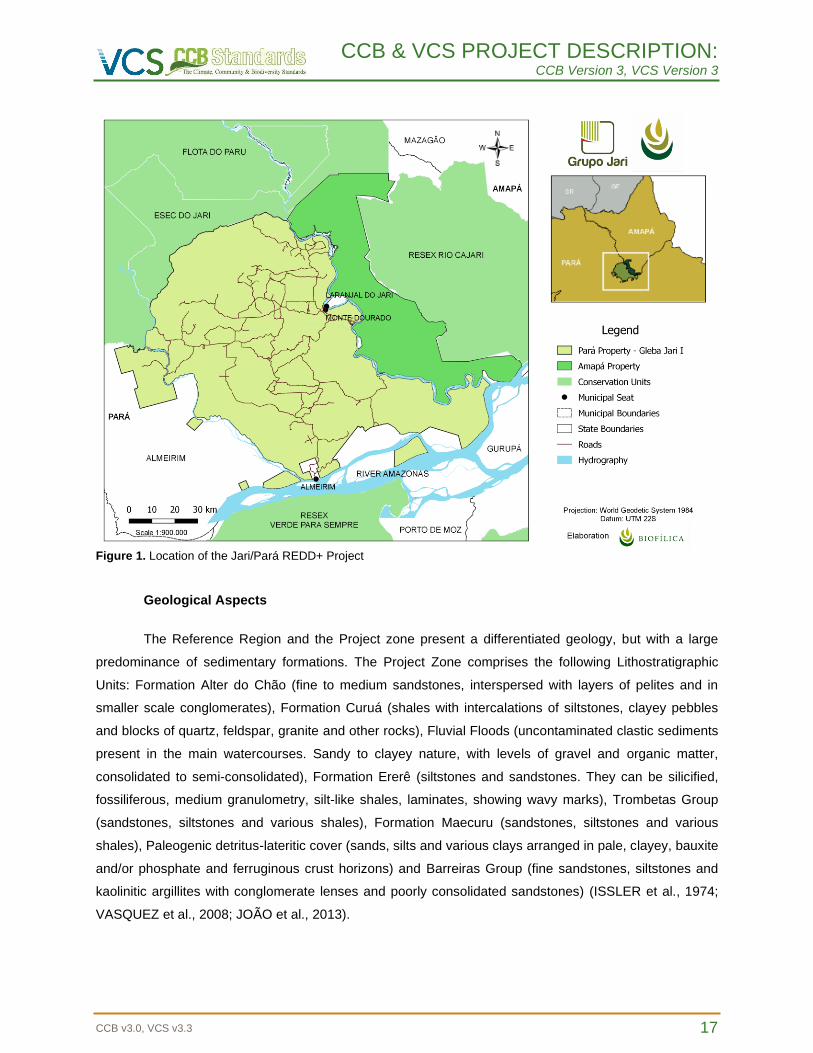
The Jari/Pará REDD+ Project is located in the northern region of the state of Pará, and to the
north is the Conservation Station "Jari Ecological Station" and is on the right bank of the lower Jari river,
limiting with the state of Amapá in the municipality of Almeirim (Figure 1), between the parallels 0º 20‟
00‟‟ S & 1º 40‟ 00‟‟ S, meridians 51º 50‟ 00‟ W & 53º 20‟ 00‟ W. The surrounding area is characterized
by the presence of several Conservation Units (Comprehensive Protection and Sustainable Use), as well
as Agrarian Reform Settlements of the National Institute of Colonization and Agrarian Reform (INCRA).
The Project Area comprises the entire area of Pará property, Gleba Jari I, totaling an area of 909,461
hectares (Receipt of registration of rural property in the CAR – “Recibo de inscrição do imóvel rural no
CAR” in portuguese, 2016). Accesses to the Project Area take the following forms:
- By land: through BR-156, from Macapá (AP), in the southwest direction, heading towards
Laranjal do Jari (AP). Upon arrival at the headquarters in Almeirim (PA), it follows by PA-473, already
inside the property of Jari Celulose S/A, with a duration of approximately 8 hours;
- By waterway: from Belém (PA) by the Amazonas rivers or Jari, trip lasting approximately 36
hours, considering the boats that make this route;
- By air: scheduled flights departing from Belém (PA) with a duration of approximately 40 minutes
or departing from Macapá (AP) with a duration of approximately 30 minutes.
CCB & VCS PROJECT DESCRIPTION: CCB Version 3, VCS Version 3
CCB v3.0, VCS v3.3 17
Figure 1. Location of the Jari/Pará REDD+ Project
Geological Aspects
The Reference Region and the Project zone present a differentiated geology, but with a large
predominance of sedimentary formations. The Project Zone comprises the following Lithostratigraphic
Units: Formation Alter do Chão (fine to medium sandstones, interspersed with layers of pelites and in
smaller scale conglomerates), Formation Curuá (shales with intercalations of siltstones, clayey pebbles
and blocks of quartz, feldspar, granite and other rocks), Fluvial Floods (uncontaminated clastic sediments
present in the main watercourses. Sandy to clayey nature, with levels of gravel and organic matter,
consolidated to semi-consolidated), Formation Ererê (siltstones and sandstones. They can be silicified,
fossiliferous, medium granulometry, silt-like shales, laminates, showing wavy marks), Trombetas Group
(sandstones, siltstones and various shales), Formation Maecuru (sandstones, siltstones and various
shales), Paleogenic detritus-lateritic cover (sands, silts and various clays arranged in pale, clayey, bauxite
and/or phosphate and ferruginous crust horizons) and Barreiras Group (fine sandstones, siltstones and
kaolinitic argillites with conglomerate lenses and poorly consolidated sandstones) (ISSLER et al., 1974;
VASQUEZ et al., 2008; JOÃO et al., 2013).
CCB & VCS PROJECT DESCRIPTION: CCB Version 3, VCS Version 3
CCB v3.0, VCS v3.3 18
Geomorphological Aspects
In the Project Zone the following geomorphological units were identified: Depression of the
Middle-Low Amazon River, Marginal Plateaus to the Amazon River, Marine Plains, Fluvial-marine and/or
Fluvial-lacustrine.
The altitudes observed in the South and Southeastern regions of the Marine Plains and Fluvial-
marine and/or Fluvial-lacustrine show little variation, with altitudes close to sea level, between 0 and 100
meters of altitude and correspond to 3.44% of the Project Zone. Altitude values close to 200 meters are
found in the central portion corresponding to the Mid-Low Amazon River Depression, making up most of
the Project Zone (60.4%). Finally, the highest altitudes (200 to 600 meters) are found on the marginal
plateaus of the Amazon River, north of the Project Zone (corresponding to 35.83% of the area), being
more susceptible to erosion.
Pedological Aspects
The pedological survey consists of the spatial distribution of the soil types of a given area, this
spatialization being denominated in mapping units (sets of soil areas with positions and relationships
defined in the landscape). For the Project Zone, eight mapping units and fifteen units were evaluated in
the Reference Region. Among all of these units, the most present in the Project Zone is the LA10 whose
main component is the Yellow Dystrophic Latosol (41.12%). It is still verified the presence in more than
22% of the PVA31 unit, composed mainly of the soil Red-Yellow Dystrophic Argisol. The other units found
within the Project Zone and their main components were: RL1 - Dystrophic Litholic Neosol (14.02%),
LVA14 - Dystrophic Red-Yellow Latosol (12.94%), GX23 - Eutrophic Ta Haplic Gleysol (4.13%), NV14 -
Eutrophic Red Nitosol (3,31%) and GX22 – Eutrophic Ta Haplic Gleysol (1.44%).
In general, there is a great variety of soils, mainly due to the diversity of materials of sedimentary
origin (for the most part), as well as to the region presenting fluvial and fluvial-lacustrine plains. Following
the characteristics of regions where the climate is hot and humid, most soils are acidic and dystrophic,
with the exception of some eutrophic soils, in the unit NV14 and Fluvial Gleisols and Neosols, associated
with fluvial sedimentation. These soils often present, besides eutrophication, high activity clay (clay
minerals 2:1), characterized by the denomination "Ta". This eutrophism combined with the presence of
this type of clay, unusual in the tropical region, is restricted to the vicinity of major rivers such as the
Amazon River and the Jari River. Considered poorly drained, these soils occur mainly to the south of the
Project Zone and the Reference Region, associated to the lower parts. In the higher areas, located in the
central and northern portions, soils with greater drainage capacity predominate.
CCB & VCS PROJECT DESCRIPTION: CCB Version 3, VCS Version 3
CCB v3.0, VCS v3.3 19
Climate Aspects
The state of Pará is defined as a humid equatorial climate, guided by the displacement of the
Intertropical Convergence Zone (ITCZ) and by the Continental Equatorial Mass (cEm), both with summer
and autumn of marked characteristics. Therefore, there is a short dry period during the winter and part of
the spring, which vary from two to four months.
The ITCZ is formed in low latitude areas, where is located the region of convergence of the trade
winds originated in the Southeast region with those originated in the Northeast region of the country,
creating ascending masses of normally humid air. Dynamically, the ITCZ is associated with a low-
pressure range and flow convergence in the low levels of the atmosphere, favoring the upward movement
and consequent presence of cloudiness and precipitation. It is also known as Meteorological Equator
(ME), Tropical Discontinuity (TD), Intertropical Convergence Zone (ITCZ), Intertropical Front (ITF), among
others (EIA) (DANTAS, TEIXEIRA, 2013).
In the state of Pará, the mean annual rainfall distribution presents the northeasterly region as the
rainiest region, reaching 3,000 mm annually, which is higher than the average for the state, which is
2,214 mm (MORAES, et al., 2005). On the other hand, the Project Zone presents a tendency of increase
of the precipitation in the west-east direction, with precipitation reaching 1,600 mm in the western portion,
in the municipality of Monte Alegre and 2,500 mm in the eastern portion, in the municipalities of Laranjal
do Jari and Vitória do Jari. In order to verify the precipitated average annual total in the Project Zone, the
Grupo Jari provided historical data for the years 1968 to 2014, collected by a meteorological base
installed in the district of Monte Dourado, in the municipality of Almeirim – PA. With these data it was
possible to verify that the annual average, for the observed period, corresponds to approximately 2,270
mm.
A more detailed analysis based on data from the BHBRASIL project shows that for the
municipalities of Monte Alegre and Porto de Moz, the period of lower precipitation is between August and
November, with precipitations below 50 mm in Monte Alegre and 100 mm in Porto de Moz. On the other
hand, between March and May, the monthly precipitation exceeds 300 mm in Porto de Moz and, in the
case of Monte Alegre, values above 250 mm.
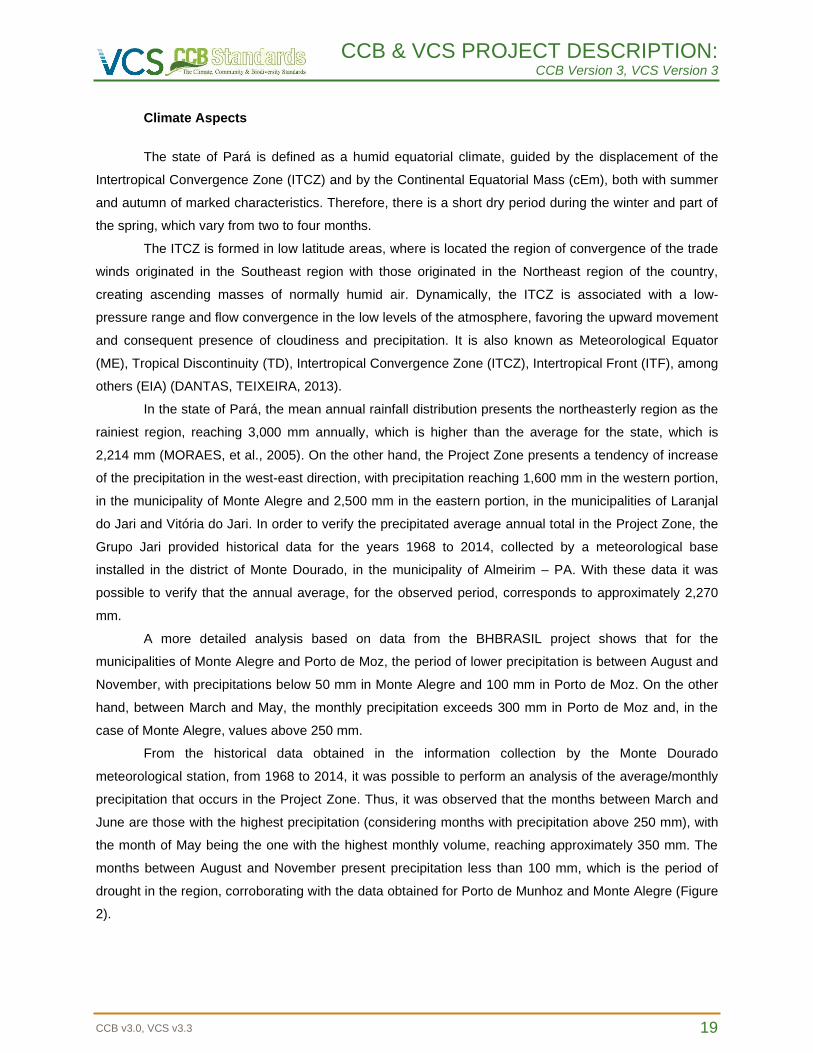
From the historical data obtained in the information collection by the Monte Dourado
meteorological station, from 1968 to 2014, it was possible to perform an analysis of the average/monthly
precipitation that occurs in the Project Zone. Thus, it was observed that the months between March and
June are those with the highest precipitation (considering months with precipitation above 250 mm), with
the month of May being the one with the highest monthly volume, reaching approximately 350 mm. The
months between August and November present precipitation less than 100 mm, which is the period of
drought in the region, corroborating with the data obtained for Porto de Munhoz and Monte Alegre (Figure
2).
CCB & VCS PROJECT DESCRIPTION: CCB Version 3, VCS Version 3
CCB v3.0, VCS v3.3 20
Figure 2. Monthly average precipitated based on data provided by the Grupo Jari, whose meteorological station is located in the district of Monte Dourado, municipality of Almeirim/PA
According to the classification of Köppen adapted by Álvares et al. (2013), the region has a type
Am climate, consistent with rainy tropical climate, where in the coldest month the temperature is above
18°C (megathermal), high annual precipitation exceeding 1,500 mm/year, being greater than
evapotranspiration; and superhumid, where in the driest month precipitation exceeds 60 mm (SILVEIRA,
2014).
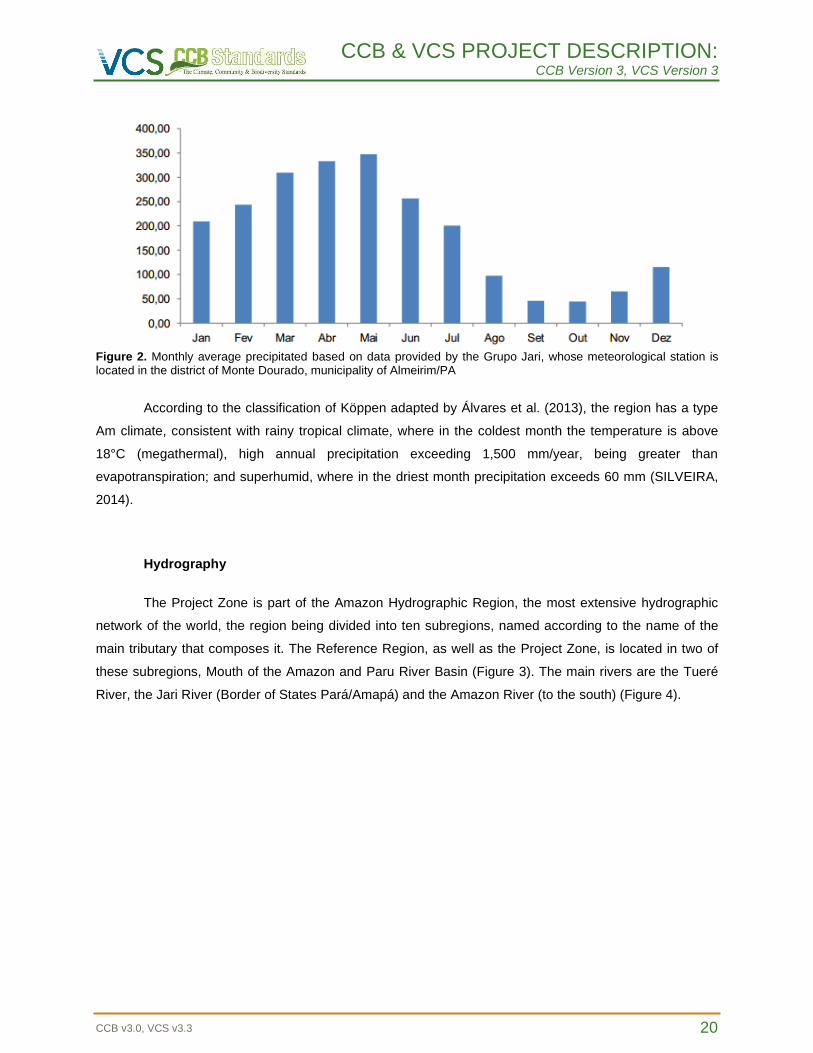
Hydrography
The Project Zone is part of the Amazon Hydrographic Region, the most extensive hydrographic
network of the world, the region being divided into ten subregions, named according to the name of the
main tributary that composes it. The Reference Region, as well as the Project Zone, is located in two of
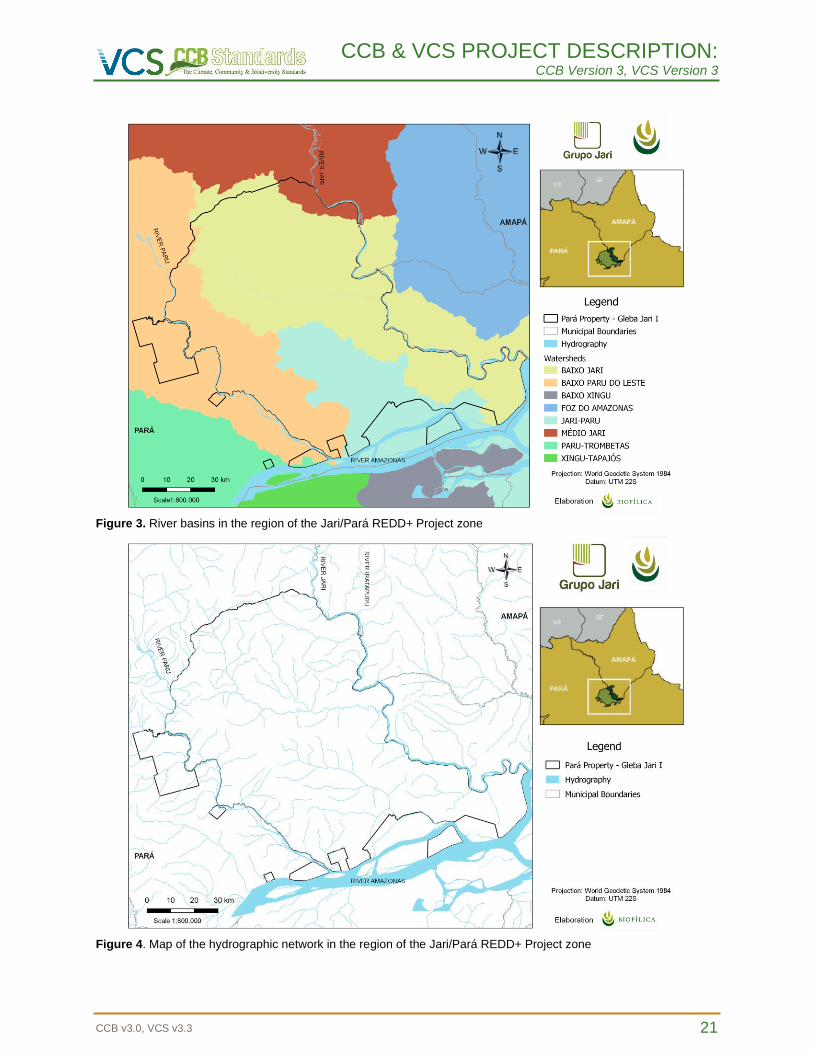
these subregions, Mouth of the Amazon and Paru River Basin (Figure 3). The main rivers are the Tueré
River, the Jari River (Border of States Pará/Amapá) and the Amazon River (to the south) (Figure 4).
CCB & VCS PROJECT DESCRIPTION: CCB Version 3, VCS Version 3
CCB v3.0, VCS v3.3 21
Figure 3. River basins in the region of the Jari/Pará REDD+ Project zone
Figure 4. Map of the hydrographic network in the region of the Jari/Pará REDD+ Project zone
CCB & VCS PROJECT DESCRIPTION: CCB Version 3, VCS Version 3
CCB v3.0, VCS v3.3 22
Among the rivers that occur in the region, the Jari River, besides being an important contributor to
the Amazon River, is also the natural divisor of the states of Pará and Amapá. With an extension of about
780 km, it develops from the northwest to the southeast and flows into the left bank of the Amazon River,
with a basin of about 57,000 km², which occupy areas of the municipalities of Almeirim in the state of
Pará and Laranjal do Jari, Vitória do Jari and Mazagão, in the State of Amapá. Its hydrographic network
is relatively dense, presenting several waterfalls, which concentrate in the upper course of the river,
aspect responsible for limiting the navigation to the south of the basin. Among them, we highlight the
Santo Antônio Waterfall, with a drop of 28 meters, which also constitutes a biogeographic barrier for
some species of the local ichthyofauna (EPE, 2010).
Vegetation and flora
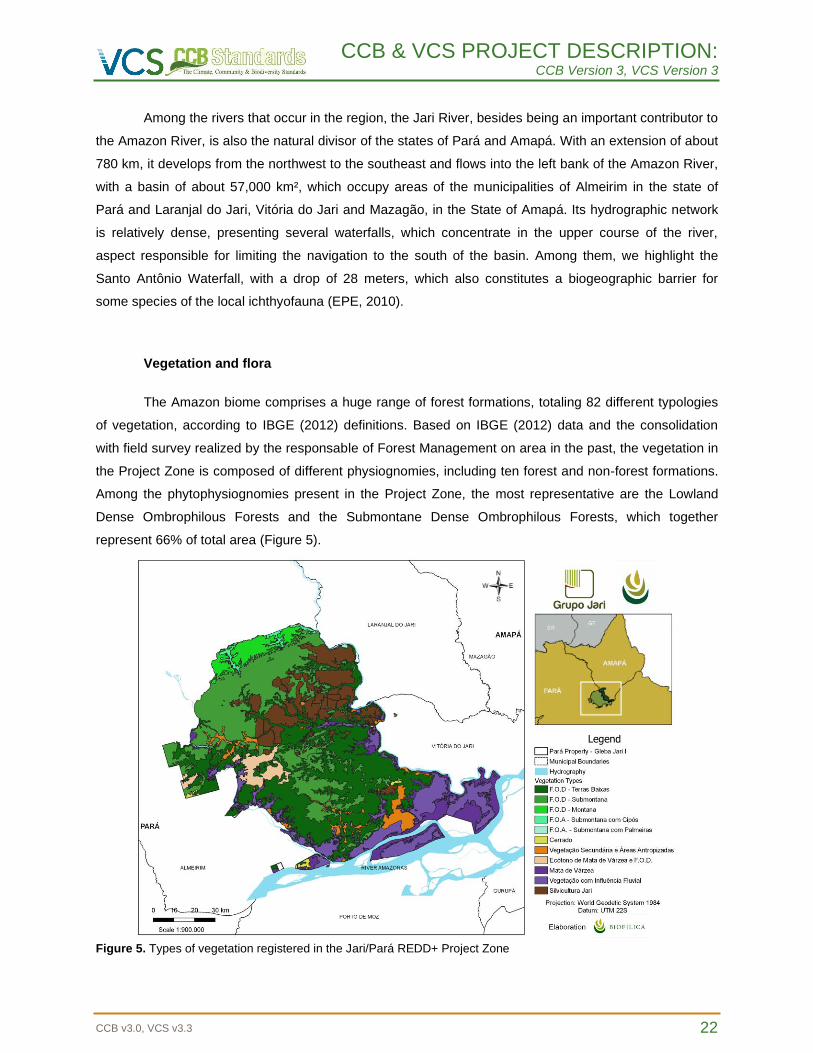
The Amazon biome comprises a huge range of forest formations, totaling 82 different typologies
of vegetation, according to IBGE (2012) definitions. Based on IBGE (2012) data and the consolidation
with field survey realized by the responsable of Forest Management on area in the past, the vegetation in
the Project Zone is composed of different physiognomies, including ten forest and non-forest formations.
Among the phytophysiognomies present in the Project Zone, the most representative are the Lowland
Dense Ombrophilous Forests and the Submontane Dense Ombrophilous Forests, which together
represent 66% of total area (Figure 5).
Figure 5. Types of vegetation registered in the Jari/Pará REDD+ Project Zone
CCB & VCS PROJECT DESCRIPTION: CCB Version 3, VCS Version 3
CCB v3.0, VCS v3.3 23
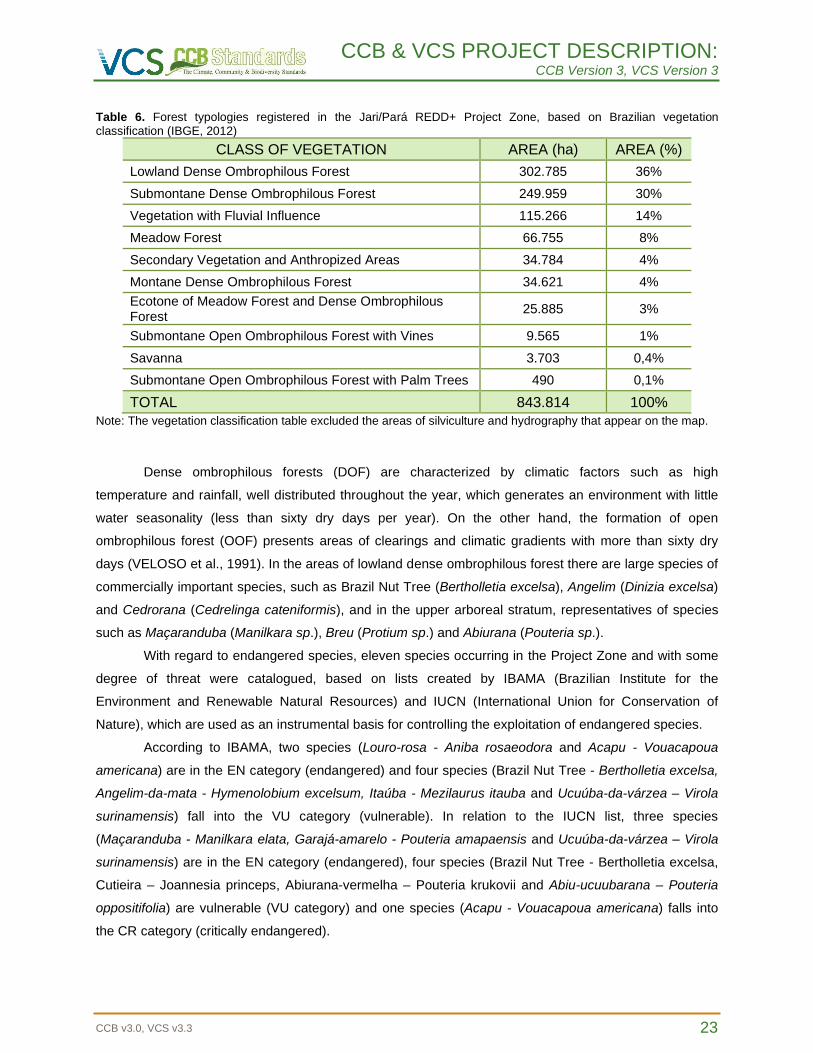
Table 6. Forest typologies registered in the Jari/Pará REDD+ Project Zone, based on Brazilian vegetation classification (IBGE, 2012)
CLASS OF VEGETATION AREA (ha) AREA (%)
Lowland Dense Ombrophilous Forest 302.785 36%
Submontane Dense Ombrophilous Forest 249.959 30%
Vegetation with Fluvial Influence 115.266 14%
Meadow Forest 66.755 8%
Secondary Vegetation and Anthropized Areas 34.784 4%
Montane Dense Ombrophilous Forest 34.621 4%
Ecotone of Meadow Forest and Dense Ombrophilous Forest
25.885 3%
Submontane Open Ombrophilous Forest with Vines 9.565 1%
Savanna 3.703 0,4%
Submontane Open Ombrophilous Forest with Palm Trees 490 0,1%
TOTAL 843.814 100%
Note: The vegetation classification table excluded the areas of silviculture and hydrography that appear on the map.
Dense ombrophilous forests (DOF) are characterized by climatic factors such as high
temperature and rainfall, well distributed throughout the year, which generates an environment with little
water seasonality (less than sixty dry days per year). On the other hand, the formation of open
ombrophilous forest (OOF) presents areas of clearings and climatic gradients with more than sixty dry
days (VELOSO et al., 1991). In the areas of lowland dense ombrophilous forest there are large species of
commercially important species, such as Brazil Nut Tree (Bertholletia excelsa), Angelim (Dinizia excelsa)
and Cedrorana (Cedrelinga cateniformis), and in the upper arboreal stratum, representatives of species
such as Maçaranduba (Manilkara sp.), Breu (Protium sp.) and Abiurana (Pouteria sp.).
With regard to endangered species, eleven species occurring in the Project Zone and with some
degree of threat were catalogued, based on lists created by IBAMA (Brazilian Institute for the
Environment and Renewable Natural Resources) and IUCN (International Union for Conservation of
Nature), which are used as an instrumental basis for controlling the exploitation of endangered species.
According to IBAMA, two species (Louro-rosa - Aniba rosaeodora and Acapu - Vouacapoua
americana) are in the EN category (endangered) and four species (Brazil Nut Tree - Bertholletia excelsa,
Angelim-da-mata - Hymenolobium excelsum, Itaúba - Mezilaurus itauba and Ucuúba-da-várzea – Virola
surinamensis) fall into the VU category (vulnerable). In relation to the IUCN list, three species
(Maçaranduba - Manilkara elata, Garajá-amarelo - Pouteria amapaensis and Ucuúba-da-várzea – Virola
surinamensis) are in the EN category (endangered), four species (Brazil Nut Tree - Bertholletia excelsa,
Cutieira – Joannesia princeps, Abiurana-vermelha – Pouteria krukovii and Abiu-ucuubarana – Pouteria
oppositifolia) are vulnerable (VU category) and one species (Acapu - Vouacapoua americana) falls into
the CR category (critically endangered).
CCB & VCS PROJECT DESCRIPTION: CCB Version 3, VCS Version 3
CCB v3.0, VCS v3.3 24
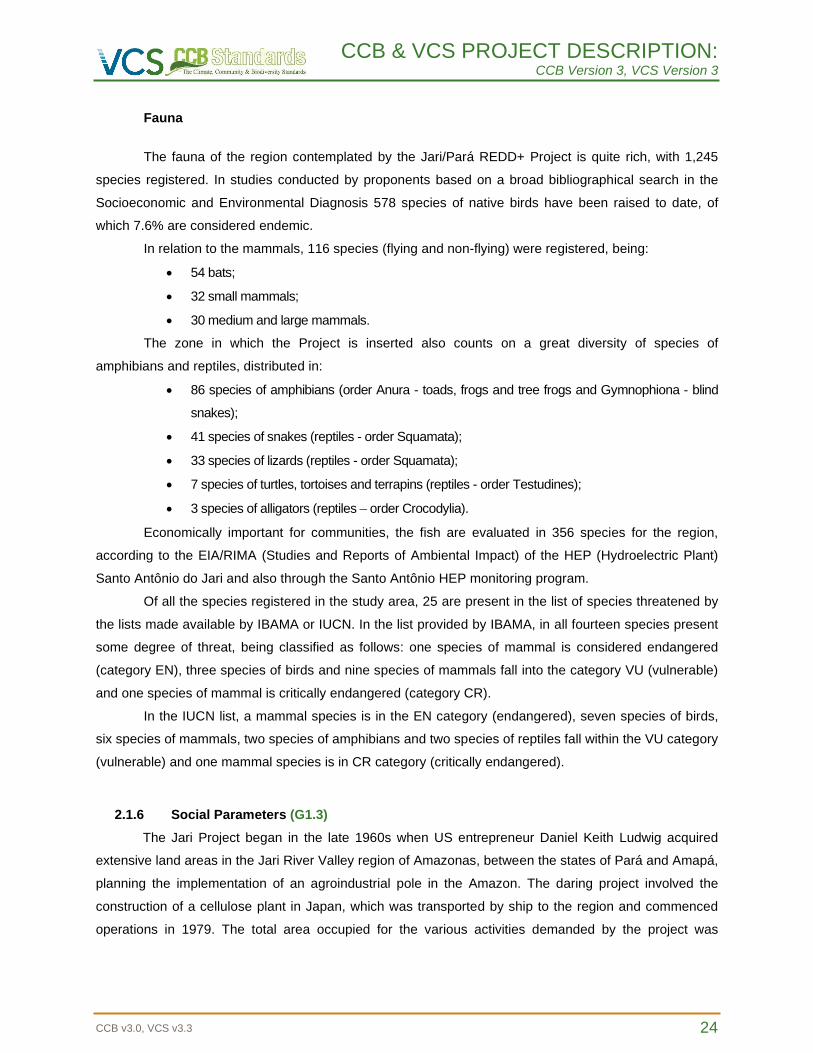
Fauna
The fauna of the region contemplated by the Jari/Pará REDD+ Project is quite rich, with 1,245
species registered. In studies conducted by proponents based on a broad bibliographical search in the
Socioeconomic and Environmental Diagnosis 578 species of native birds have been raised to date, of
which 7.6% are considered endemic.
In relation to the mammals, 116 species (flying and non-flying) were registered, being:
• 54 bats;
• 32 small mammals;
• 30 medium and large mammals.
The zone in which the Project is inserted also counts on a great diversity of species of
amphibians and reptiles, distributed in:
• 86 species of amphibians (order Anura - toads, frogs and tree frogs and Gymnophiona - blind
snakes);
• 41 species of snakes (reptiles - order Squamata);
• 33 species of lizards (reptiles - order Squamata);
• 7 species of turtles, tortoises and terrapins (reptiles - order Testudines);
• 3 species of alligators (reptiles – order Crocodylia).
Economically important for communities, the fish are evaluated in 356 species for the region,
according to the EIA/RIMA (Studies and Reports of Ambiental Impact) of the HEP (Hydroelectric Plant)
Santo Antônio do Jari and also through the Santo Antônio HEP monitoring program.
Of all the species registered in the study area, 25 are present in the list of species threatened by
the lists made available by IBAMA or IUCN. In the list provided by IBAMA, in all fourteen species present
some degree of threat, being classified as follows: one species of mammal is considered endangered
(category EN), three species of birds and nine species of mammals fall into the category VU (vulnerable)
and one species of mammal is critically endangered (category CR).
In the IUCN list, a mammal species is in the EN category (endangered), seven species of birds,
six species of mammals, two species of amphibians and two species of reptiles fall within the VU category
(vulnerable) and one mammal species is in CR category (critically endangered).
2.1.6 Social Parameters (G1.3)
The Jari Project began in the late 1960s when US entrepreneur Daniel Keith Ludwig acquired
extensive land areas in the Jari River Valley region of Amazonas, between the states of Pará and Amapá,
planning the implementation of an agroindustrial pole in the Amazon. The daring project involved the
construction of a cellulose plant in Japan, which was transported by ship to the region and commenced
operations in 1979. The total area occupied for the various activities demanded by the project was
CCB & VCS PROJECT DESCRIPTION: CCB Version 3, VCS Version 3
CCB v3.0, VCS v3.3 25
1,632,121 hectares, distributed mainly for forest production, livestock, agriculture, mineral exploration and
environmental reserve. In addition to economic activities, investments in infrastructure such as highways,
ports, airports and even entire urban centers were created to house the company's employees, such as
the Monte Dourado District (LINS, 1994).
In view of the structural complexity and the inherent difficulties in leveraging the enterprise,
including the lack of timber for factory supply, energy constraints, legal issues regarding land legality and
the decline in international cellulose prices, Ludwig cumulative massive losses and began the process of
nationalization of the Jari Project in the early 1980s (LINS, 1994). In 2000, the project was managed by
the Orsa Group, and after processes of modernization of the production chain, acquisition of new
technologies and planning of native forest management, became economically viable and in 2004
received the Forest Stewardship Concil certification – FSC.
In the year 2014, the Jari/Pará REDD+ Project begins, which continues an existing project in
areas of Amapá (called Jari/Amapá REDD+ Project). The two projects are promoted by the same
proponents, based on a partnership between the Grupo Jari and Biofílica Investimentos Ambientais. The
Jari/Pará REDD+ Project is an opportunity to improve and intensify the activities of Multiple Use Forest
Management in area, contributing to the reduction of emissions from deforestation and forest
degradation, combining biodiversity conservation objectives with socially, economically and
environmentally responsible development, as proposed by the Social and Environmental Standards
REDD+ (REDD+ PSA) and the Climate, Community and Biodiversity (CCBS) Standards (CCBA, 2013;
SILLS et al., 2014). The main municipalities under direct influence of the Jari Project are: Almeirim, mainly
the district of Monte Dourado, in the State of Pará, Laranjal do Jari and Vitória do Jari, in the State of
Amapá.
The historical origin of the municipality of Almeirim presents two different versions. The first
indicates as a historical landmark the construction of a fort by the Dutch in a village called Paru and the
second attributes the origin of the municipality to the Capuchin friars of Santo Antônio who built the village
of Paru as a catechesis area for the indians of the region (IBGE, 2005; SEPOF, 2008). In 1758, the
village acquired category of Town, being called Almeirim. However, in the period of Independence, it
became extinct (IBGE, 2005). According to the territorial division of the State of Pará, in 1936, Almeirim
was subdivided into four districts: Almeirim, Boca do Braço, Santana do Cajari and Santo Antônio do
Caracuru. However, in a territorial division dated 1988, the municipality was constituted of the districts of
Almeirim, Arumanduba and Monte Dourado, remaining in this way from that date (IBGE, 2005; SEPOF,
2008). About 90% of the municipal territory is covered by forests, and 1800 km² (2.47% of the territory)
were deforested from 2000 to 2014, according to data available from the PRODES Project – Monitoring of
the Amazon Forest by Satellite (INPE, 2014).
Within the Grupo Jari area, there are 98 communities located in riverside and dry land areas in
the region’s forests (GRUPO ORSA, 2006) and the community Planalto (Vila Planalto) identified on the
study conducted by CASA DA FLORESTA (2016). The Jari/Pará REDD+ Project focuses mainly on the
CCB & VCS PROJECT DESCRIPTION: CCB Version 3, VCS Version 3
CCB v3.0, VCS v3.3 26
rural area of the Municipality of Almeirim, encompassing communities considered traditional by the Grupo
Jari, for having established themselves before the enterprises in the region. These communities number
approximately 15,000 people, whose socioeconomic bases are marked by agro-extractivist activities, with
emphasis on the cultivation of cassava and its processing in flour and the collection of castanha-do-brasil
(brazil nuts). In addition, the presence of two Indigenous Lands (TI) was identified, being: TI Rio Paru
d’Este, which is home to the Apalaí and Wayana ethnicities, north of the municipality of Almeirim and the
Tumucumaque Indigenous Park, Apalaí and Wayana ethnicities, located in the municipalities of Almeirim
and Laranjal do Jari (FUNAI, 2015; ISA, 2015). As for the rural settlements of agrarian reform there are
no projects inserted in the municipal limit of Almeirim (INCRA, 2015). However, none of the indigenous
and quilombo communities are in the Reference Region of the Jari/Pará REDD+ Project and, therefore,
were not selected for the subsequent diagnosis.
The main economic activities of the region are linked to agriculture, cattle raising, extractivism
and forestry, especially when dealing with rural communities. According to the municipal agricultural
production data (IBGE, 2013), orange, banana, papaya and passion fruit production are predominant in
permanent crops for the municipality of Almeirim (PA) and sugarcane, pineapple, watermelon and
cassava are more common in temporary crops. In relation to livestock production, buffalo and cattle
predominate in the municipality, being the only region where honey bee production was recorded.
Plant extraction and silviculture play an important role in the region’s economy and mainly as a
source of livelihood for families. Brazil nut production is one of the main sources of income for families in
the region, and is also a source of cultural reproduction for communities. There are some public policies
and access to credits for the exploration and sale of Brazil nut, usually carried out for state industries
(AMORIM et al., 2010). The plant extraction of the municipalities counts mainly with açai berry, Brazil nut,
charcoal, firewood and log wood.
Regarding the characterization of the study region (Almeirim municipality) and socio-cultural
information, it can be said that the municipality of Almeirim occupies an area corresponding to 5.85% of
the total state of Pará and is 453 km from the capital (Belém/PA). There was a slight population growth
between 1991 and 2014, maintaining between 30,000 and 34,000 inhabitants, with the rural population
still very significant (40.6% in 2010). The age pyramid of the municipality indicates an expanding
population in the pre-reproductive phase, i.e., birth rates are higher than mortality rates. The most
populous age group is 10 to 14 years and the majority of the male and female population is less than 30
years old. The number of men and women by age group is similar in all cases.
The city of Almeirim was already populated before the project was completed, with 90.4% of the
total population coming from the North. Among the migrants from other regions, the Northeastern stand
out, representing 7.2% of the total population. Regarding the health of the municipality, there is a private
facility, 23 municipal facilities and no state facility. There are 42 doctors attending for the Unified Health
System (“Sistema Único de Saúde” in Portuguese – SUS), but there is not any speech therapist or social
worker. The greatest cause of death is related to diseases of the respiratory system.
CCB & VCS PROJECT DESCRIPTION: CCB Version 3, VCS Version 3
CCB v3.0, VCS v3.3 27
Regarding education, there was a fall in the illiteracy rate between 2000 and 2010 of 7.2%. There
was a significant increase in the percentage of schooling in all age groups and per level as well. In 2010,
more than half of the population between 18 to 24 years of age had elementary education, and the lowest
increase in schooling was in relation to full tertiary education. Almeirim registers a total of 114 schools,
divided into 4 high schools, 72 elementary schools and 38 preschools (IBGE, 2012).
Almeirim had 45% of adequate basic sanitation in 2000, reducing to 33.6% in 2010, with semi-
adequate increase, categories defined by IBGE. Most of the water (52%) is not treated and 86% of the
homes have electricity. However, there are rural communities still without access to the energy from the
municipal network.
Regarding to the per capita income of the population of Almeirim, there is a rise from 1991 to
2010 of R$ 187.17 (63%), with income in 2010 of R$ 484.16. Compared to Brazil, in 2010, Almeirim's per
capita income is 39% lower, and it is important to note that Almeirim presents a large inequality index for
income distribution.
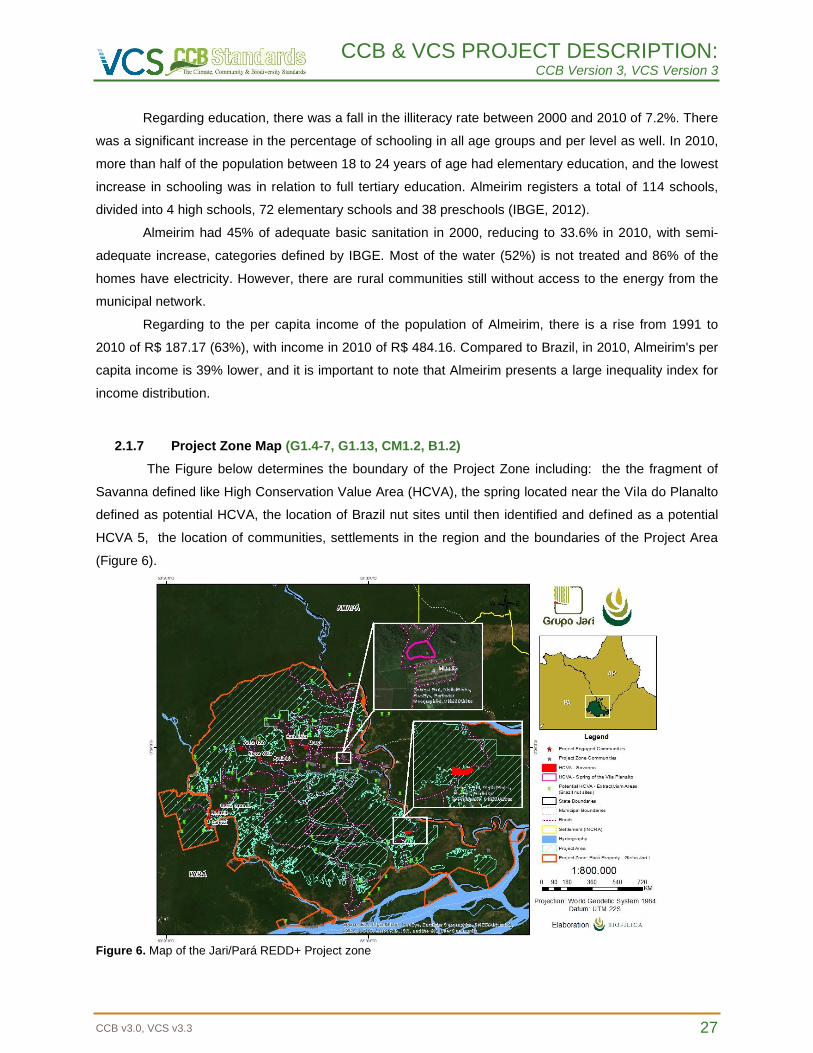
2.1.7 Project Zone Map (G1.4-7, G1.13, CM1.2, B1.2)
The Figure below determines the boundary of the Project Zone including: the the fragment of
Savanna defined like High Conservation Value Area (HCVA), the spring located near the Vila do Planalto
defined as potential HCVA, the location of Brazil nut sites until then identified and defined as a potential
HCVA 5, the location of communities, settlements in the region and the boundaries of the Project Area
(Figure 6).
Figure 6. Map of the Jari/Pará REDD+ Project zone
CCB & VCS PROJECT DESCRIPTION: CCB Version 3, VCS Version 3
CCB v3.0, VCS v3.3 28
2.1.8 Stakeholder Identification (G1.5)
The identification and analysis process used in the selection of communities for the Jari/Pará
REDD+ Project was based on the following criteria:
I. Productive Potential: communities that develop economic activities related to the
sustainable use of land focused on the extraction of Brazil nuts and açai berry,
agriculture, cassava cultivation and other genres and horticulture, or that have interest
and potential in developing them.
II. Geographic location: communities that are within the Project Area or in the immediate
surroundings and with easy access by waterway and land and have good logistic
conditions for work;
III. Relationship with natural resources and with the Project Area: communities that develop
subsistence agriculture or small-scale commercial agriculture and extractivism and
maintain a continuous and integral presence in the area, being dependent on the Project
Area for these purposes. Medium and large producers living in urban centers and with
agropastoral production of commercial scale are excluded from this category in the
vicinity of the Project Area. Special attention was paid to the extractivists who live on the
Brazil nut trees and who have a strong concern with the conservation of the forests;
IV. Predisposition for social organization: communities with initiative or interest in
establishing community organizations, associations, cooperatives and other social
groups.
These communities were consulted and introduced to the Project, in one of the first activities
carried out, DRP (Fast Participatory Diagnostic) workshops, in which the qualified information about the
Jari/Pará REDD+ Project was passed on and raised the demands for improving the social and economic
well-being of families.
2.1.9 Stakeholder Descriptions (G1.6, G1.13)
The communities are located in riverside and dry land areas in the region's forests, of which 98
communities that were listed on the study held by GRUPO ORSA (2006) live in the Grupo Jari property.
On the property is also the community Planalto (Vila Planalto) indicated on the study conducted by CASA
DA FLORESTA (2016) near the spring considered an HCVA (Figure 6). All of these communities located
in the Project Zone are listed in Table 7.
Table 7. Communities located in the Jari/Pará REDD+ Project zone
Communities Communities Communities Communities Communities
Açaizal Boa Fé Itaboca Panama Santa Maria do
Base
Açaizal-Resex Boca do Braço Itanduba Papudo Santarém
Acapumun I e II Bom Jardim Itaninga Paraguai Santo Antônio
CCB & VCS PROJECT DESCRIPTION: CCB Version 3, VCS Version 3
CCB v3.0, VCS v3.3 29
Água Azul Botafogo Itucumanduba I e II Paricatuba São José
Água Branca do Cajari
Braço Jaburu Pedra Branca São Miguel
Alto Bonito Buritizal Jarilândia Pedral São Militão
Arapiranga Cafezal Loral Peniel São Paulo
Araticum I e II Comandaí
Grande Maicá Pimental São Sebastião
Areas 127 and 60
Comércio Muriacá Mangueiro Planalto (Vila
Planalto) Saracura
Ariramba Conceição do
Muriacá Marajó Ponção Serra Pelada
Arumanduba Dona Maria Marapí Pouso Alegre ou
Ponta Alegre Sombra da
Mata
Assentamento Marapi
Estrada Nova Margarida Praia Verde Tapereira
Aterro Muriacá Fé em Deus Marinho Ramal do Muriacá Terra Preta
Bacabal Freguesia Martins Ramal Fé em Deus Tira-Couro
Bacia Branca Furo do Maracujá Nova Conquista Ramal França Rocha Tuchaua
Bananal Gatos Nova Jerusalém Recreio Vera Cruz
Bitubinha Iratapuru Panaicá Repartimento Vila Nova
Bandeira Goela da Morte Nova Vida Retiro Vista Alegre
Bela Vista Goiabal Padaria Santa Helena Zé da Anta
Bituba Igarapé do Meio Paga-Dívida Santa Maria - Source: GRUPO ORSA, 2006; FUNDAÇÃO JARI, 2018; CASA DA FLORESTA, 2016.
For the scenario of the local communities in the scope area of the Project, according to the
Communities Section, CCB Standard (CCBA, 2013), seven of these rural agroextractivist communities in
the municipality of Almeirim (GRUPO ORSA, 2006; 2010; CASA DA FLORESTA, 2016) were selected,
concentrated in three cores of action (Table 8).
Table 8. Cores, communities and number of families working in the Jari/Pará REDD+ Project
Core Communities Number of Families
Core 1 Nova Vida 12
Areas 127 and 60 02
Core 2 Braço 120
Bandeira 65
Core 3
Cafezal 31
Recreio 30
Serra Grande* 12 Note: Because it is small, this community is considered a member of the Recreio community.
In addition to the identified rural communities, the other identified stakeholders are:
• Jari Celulose
• Fundação Jari
• Biofílica Investimentos Ambientais
• EMATER
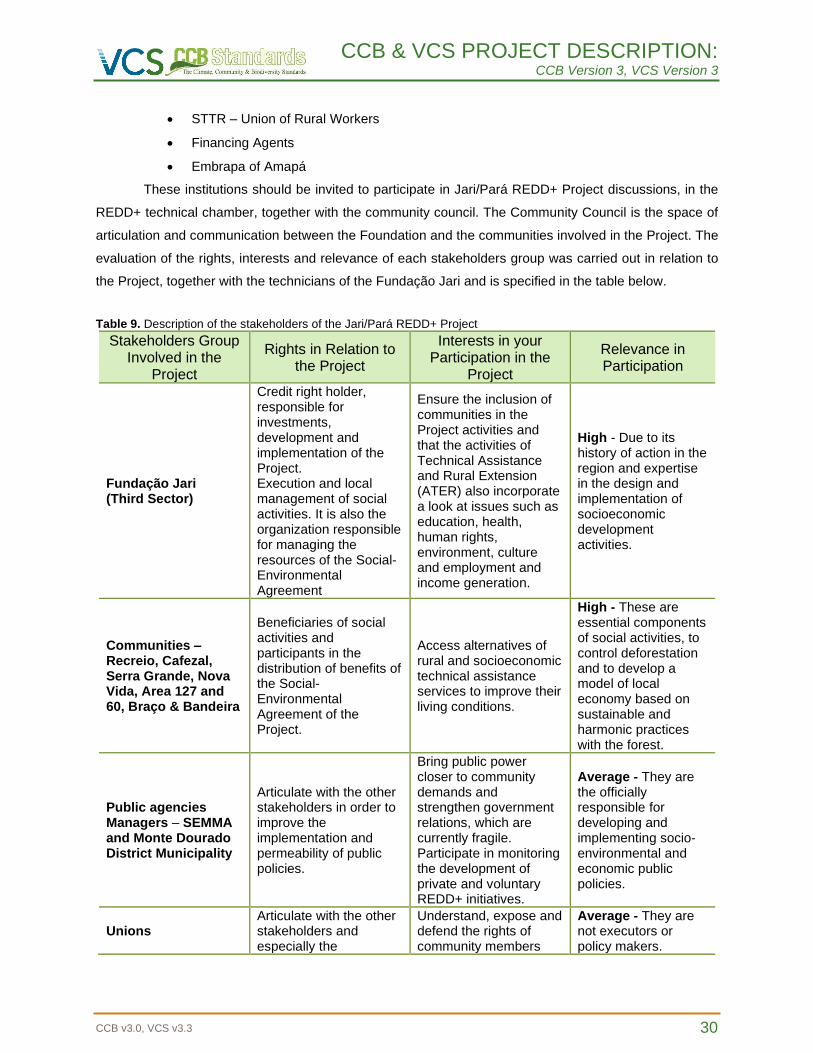
CCB & VCS PROJECT DESCRIPTION: CCB Version 3, VCS Version 3
CCB v3.0, VCS v3.3 30
• STTR – Union of Rural Workers
• Financing Agents
• Embrapa of Amapá
These institutions should be invited to participate in Jari/Pará REDD+ Project discussions, in the
REDD+ technical chamber, together with the community council. The Community Council is the space of
articulation and communication between the Foundation and the communities involved in the Project. The
evaluation of the rights, interests and relevance of each stakeholders group was carried out in relation to
the Project, together with the technicians of the Fundação Jari and is specified in the table below.
Table 9. Description of the stakeholders of the Jari/Pará REDD+ Project
Stakeholders Group Involved in the
Project
Rights in Relation to the Project
Interests in your Participation in the
Project
Relevance in Participation
Fundação Jari (Third Sector)
Credit right holder, responsible for investments, development and implementation of the Project. Execution and local management of social activities. It is also the organization responsible for managing the resources of the Social-Environmental Agreement
Ensure the inclusion of communities in the Project activities and that the activities of Technical Assistance and Rural Extension (ATER) also incorporate a look at issues such as education, health, human rights, environment, culture and employment and income generation.
High - Due to its history of action in the region and expertise in the design and implementation of socioeconomic development activities.
Communities – Recreio, Cafezal, Serra Grande, Nova Vida, Area 127 and 60, Braço & Bandeira
Beneficiaries of social activities and participants in the distribution of benefits of the Social-Environmental Agreement of the Project.
Access alternatives of rural and socioeconomic technical assistance services to improve their living conditions.
High - These are essential components of social activities, to control deforestation and to develop a model of local economy based on sustainable and harmonic practices with the forest.
Public agencies Managers – SEMMA and Monte Dourado District Municipality
Articulate with the other stakeholders in order to improve the implementation and permeability of public policies.
Bring public power closer to community demands and strengthen government relations, which are currently fragile. Participate in monitoring the development of private and voluntary REDD+ initiatives.
Average - They are the officially responsible for developing and implementing socio-environmental and economic public policies.
Unions Articulate with the other stakeholders and especially the
Understand, expose and defend the rights of community members
Average - They are not executors or policy makers.
CCB & VCS PROJECT DESCRIPTION: CCB Version 3, VCS Version 3
CCB v3.0, VCS v3.3 31
community members to expose and defend their rights.
and rural workers and an equal dialogue between the parties.
Considering an extreme scenario in which they did not participate, with the Technical Chamber, it would still be possible to develop mechanisms that would guarantee an egalitarian dialogue between the parties.
Technical Assistance Agency - EMATER
Support in the complementary actions for the Project implementation, such as DCH and ATER emission.
Strengthen the capacity to carry out rural technical assistance, cooperate with the development of public policy.
Average - It is not an executor of the Project, but is a partner of the Fundação Jari, in the implementation of Rural Technical Assistance.
Public Institutions of Research – Embrapa of Amapá
Carry out studies and research regarding the interventions of the Project and other management activities, and their impacts. Provided that these studies are processed and their results are returned to the local/regional society and the stakeholders involved.
Produce and disseminate knowledge. Develop and publish scientific papers. Possess a rich socio-economic and environmental context to produce long-term studies and bring students to classes and practical experiences.
Average - it is important, in view of the technological knowledge, to have a term of cooperation with the municipality, being able to support with the sending of researchers related to the control of clearings.
2.1.10 Sector Scope and Project Type
• Sector Scope: 14 – Agriculture, Forestry and Other Uses of the Land (AFOLU);
• Reducing Emissions from Deforestation and Forest Degradation (REDD);
• Methodology for Avoided Unplanned Deforestation (AUD);
• This is not a clustered project.
2.1.11 Project Activities and Theory of Change (G1.8)
The Jari/Pará REDD+ Project aims to promote joint actions aimed at reducing greenhouse gas
emissions (REDD+) resulting from unplanned deforestation and forest degradation, acting through
activities such as intensification of land security and patrimonial surveillance, remote monitoring of
changes in land use and cover, the multiple use forest management and monitoring of biodiversity in
conjunction with social activities, aiming to promote the incentive to local socioeconomic development on
a sustainable basis.
CCB & VCS PROJECT DESCRIPTION: CCB Version 3, VCS Version 3
CCB v3.0, VCS v3.3 32
Through the responsible and sustainable use of resources provided by the environment, the
Project aims to generate net benefits for the climate, communities and biodiversity. Therefore, through
these objectives, the activities of the Project were outlined and some of them already implemented. The
actions proposed by the Project guarantee the conservation and protection of biodiversity and natural
resources, reduction of deforestation and emission of greenhouse gases, local socioeconomic
development, social inclusion and the incentive to applied science.
This set of interlinked actions allows the generation of financial resources, mainly through the
sale of REDD+ credits registered in the VCS (Verified Carbon Standard), associated with social
development and the conservation of natural resources and, finally, seeking to ensure adequate financing
for the accomplishment of the objectives mentioned above, as well as to allow their maintenance
throughout the life cycle of the Jari/Pará REDD+ Project.
Table 10 provides a description of the activities and the principal outcomes and impacts which will
contribute to achieving the anticipated benefits of the Project to the Climate, Community and Biodiversity.
The activities are divided in themes for better understanding, these are: Initial Studies, Forest Monitoring
Intelligence, Technical Assistance and Rural Extension (TARE), Social Organization, Strengthening of
Fundação Jari, Community Infrastructure (Energy and Communication), Efficient management and
transparency and Environmental Monitoring and Scientific Research. A brief summary of development of
these activities and themes are described below:
Initial Articulation and Studies:
Activities related to the initial articulation of the Project extend since the signing of the contract,
which defined the initial terms of a long-term partnership aimed at environmental conservation and socio-
economic development in the region, to meetings with technical partners to present results of the project
initial studies. This process involved the elaboration of bids for hiring specialists and meetings between
the proponents and the specialists involved to define the scope of the project.
It is understood that the activities related to the initial articulation process are a broad planning
agenda for the elaboration of management strategies of this long-term project and, therefore, represent a
causal relation of impacts for Climate, Communities and Biodiversity. Among the results identified after
the initial articulation there are the reduction of emissions generated by the beginning of the
implementation of the project management plan initially designed, the delineation of actions aiming to
better deliver the community needs and improve the assistance carried out by Fundação Jari, and the
viability of new environmental studies that provided a better understanding of environmental issues in the
region and the generation of long term positive environmental impacts.
The initial studies consist of those related to the production of the technical subsidies necessary
for the conception of the project management plan. Among the studies carried out are: the survey of the
forest Carbon Stock Estimation and the elaboration of the deforestation Baseline, which result in direct
climate impacts; Socioeconomic Diagnosis and Consultation with communities, which deepened studies
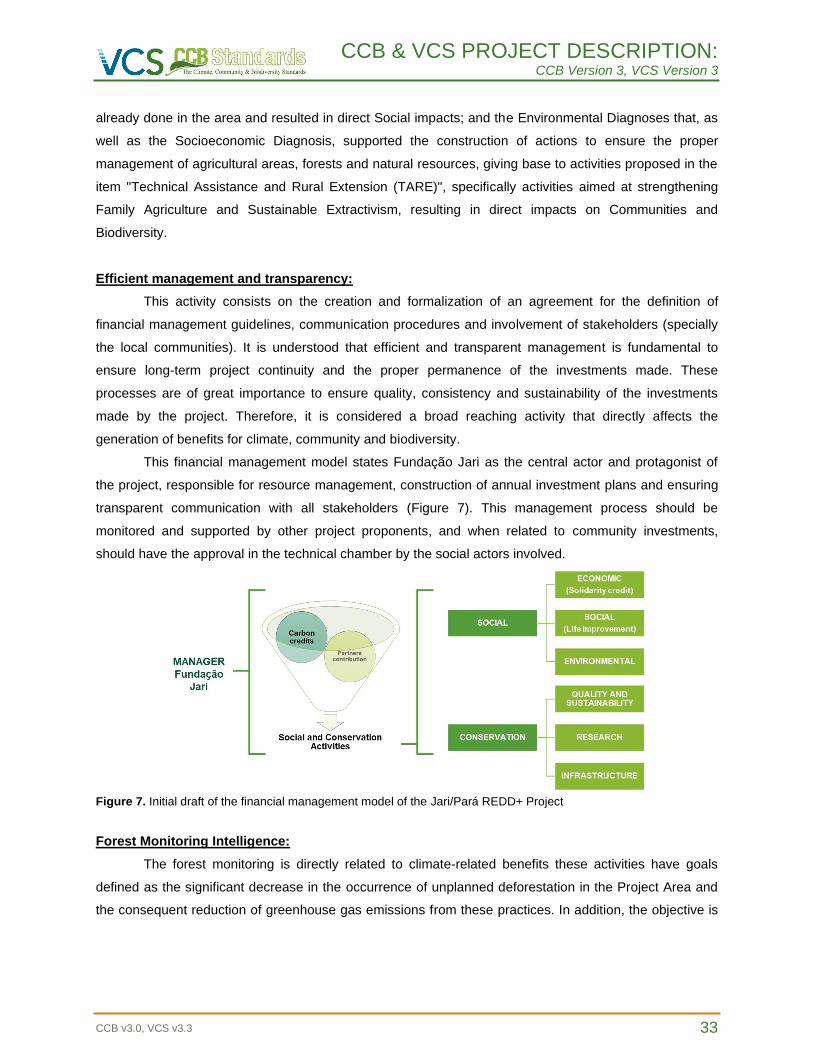
CCB & VCS PROJECT DESCRIPTION: CCB Version 3, VCS Version 3
CCB v3.0, VCS v3.3 33
already done in the area and resulted in direct Social impacts; and the Environmental Diagnoses that, as
well as the Socioeconomic Diagnosis, supported the construction of actions to ensure the proper
management of agricultural areas, forests and natural resources, giving base to activities proposed in the
item "Technical Assistance and Rural Extension (TARE)", specifically activities aimed at strengthening
Family Agriculture and Sustainable Extractivism, resulting in direct impacts on Communities and
Biodiversity.
Efficient management and transparency:
This activity consists on the creation and formalization of an agreement for the definition of
financial management guidelines, communication procedures and involvement of stakeholders (specially
the local communities). It is understood that efficient and transparent management is fundamental to
ensure long-term project continuity and the proper permanence of the investments made. These
processes are of great importance to ensure quality, consistency and sustainability of the investments
made by the project. Therefore, it is considered a broad reaching activity that directly affects the
generation of benefits for climate, community and biodiversity.
This financial management model states Fundação Jari as the central actor and protagonist of
the project, responsible for resource management, construction of annual investment plans and ensuring
transparent communication with all stakeholders (Figure 7). This management process should be
monitored and supported by other project proponents, and when related to community investments,
should have the approval in the technical chamber by the social actors involved.
Figure 7. Initial draft of the financial management model of the Jari/Pará REDD+ Project
Forest Monitoring Intelligence:
The forest monitoring is directly related to climate-related benefits these activities have goals
defined as the significant decrease in the occurrence of unplanned deforestation in the Project Area and
the consequent reduction of greenhouse gas emissions from these practices. In addition, the objective is
CCB & VCS PROJECT DESCRIPTION: CCB Version 3, VCS Version 3
CCB v3.0, VCS v3.3 34
the monitoring of forest cover and changes in land use, and support to enable the improvement of land
management with respect to land security, patrimonial surveillance and multiple use forest management.
According to the description of the Project, the objective of the Project for the climate component
is to avoid the emission of 15,491,971 tons of CO2, corresponding to the deforestation of 50,480
hectares, which will be avoided through the following activities:
- Surveillance of the area: the surveillance and patrol activities of the area will be managed by the
Grupo Jari team. The Project aims to intensify and improve the efficiency of patrolling through the
provision of resources for logistics of the patrimonial surveillance team, acquisition of equipment to
support the planning of actions, as well as to combine the patrolling activity with the remote monitoring via
satellite imagery in order to elaborate unified strategies that provide greater efficiency in surveillance,
reduction of costs in the field and the strengthening of security in the area’s borders;
- Monitoring of deforestation and forest degradation by satellite images: The project aims to
finance the acquisition of high-resolution satellite imagery to increase the efficiency of remote monitoring
already conducted annually. Additional monitoring tools will include monthly land use assessments and
changes in land use in the Project Area, improving the efficiency of the environmental monitoring and
surveillance of the area, which is already performed by the Grupo Jari, as mentioned above. The
outcomes will be reports containing the points of deforestation identified in the analyzed period and
indication of risk areas, which will be sent to the proponents and other stakeholders. Besides the
surveillance actions, this investment aims to support some activities like technical assistance and forest
management, potentially becoming a powerful tool for the environmental management. With the
continuous access to high resolution imagery the team will be able to better design the field planning and
strategies, providing effectiveness and saving resources. For the activities related to environmental
management there will be different potential outputs like technical reports, field planning, technical and
scientific studies, among others. This investment can potentially strengthen the environmental monitoring
and management and serve as a support to guarantee the Project Zone environmental conservation. This
activity is directly related to the control of deforestation and invasions, maintenance of forest cover and
biodiversity and, consequently, maintenance of the benefits for the Climate provided by the scenario with
the Project.
Socioenvironmental Activities:
The communities present in the Project Zone are also responsible for the sustainable use of the
soil and the forest resources, since they live from subsistence agriculture and the exploitation of products
originating from extractivism. However, these communities have great difficulties in maintaining
productivity at levels capable of guaranteeing adequate socioeconomic conditions for families, as well as
guaranteeing a responsible exploitation of natural resources.
These conditions were evidenced during the elaboration of the socioeconomic diagnosis and
consultation process, where in the final phase, interviews and meetings were held with the participating
CCB & VCS PROJECT DESCRIPTION: CCB Version 3, VCS Version 3
CCB v3.0, VCS v3.3 35
communities, which had, among their objectives, to know the local reality and the expectations of the
target public demands. In addition, from the participatory workshops, was carried out a survey of the
communities’ needs and weaknesses, which aligned and related to their potentialities and opportunities,
resulted in the proposal of actions for each evaluated core. The combination of two main tools, interviews
and participatory workshops, resulted in the definition of the central axes of action that are included in the
actions of the Project (Table 10) and whose purpose is to provide the strengthening of communities in
different aspects, besides acting directly and indirectly in the containment and mitigation of the negative
impacts generated by the agents and drivers of deforestation present in the region.
Thus, the four main axes of action in the social scope identified from the interactions with the
communities are described below:
Social Organization:
It is necessary to create and strengthen local organizations, so that they have better capacities to
seek access to public policies and programs that have been presented as a latent demand of the
communities, especially for actions focused on basic structural issues, such as health, education and
improvements in access to communities.
The strengthening of organizations is related, in some main lines of action such as training in
associativism and cooperativism, to the training of community leaders and the elaboration and
implementation of action plan for organizations. In this regard, activities were developed jointly with the
Fundação Jari in order to attend to this theme.
The action in strengthening associativism and cooperativism will aim to contribute directly to
mitigation of the main drivers of deforestation as it enhances the organized performance of the
communities through the quest to improve the quality of life.
The Social Organization theme resulted in three different activities listed in Table 10 that were,
Strengthening of Associativism and Cooperativism in Communities, Structuring of Community
Cooperative Nucleis and Access to credit and market.
Technical Assistance and Rural Extension – TARE:
In this aspect, increasing productivity, insertion of new techniques and production technologies,
such as implementation of agroforestry systems, and the search for a greater efficiency of current
productive systems is very important for a transition from a conventional productive system that is been
applied, with cutting and burning, to a low carbon agriculture, with more efficient and profitable production
systems and with lower GHG emissions rates. A key factor for this change to occur is the access to a
qualified TARE and directed to the needs and vocation of each community.
Ensuring this access will allow an advance in the development of the local productive chains, with
gains in scale and quality, resulting in an increase in family income and consequently better living
conditions.
CCB & VCS PROJECT DESCRIPTION: CCB Version 3, VCS Version 3
CCB v3.0, VCS v3.3 36
It was also observed that most communities recognize that the importance of ATER goes beyond
productivity issues. Other demands are also attributed by the communities as the ATER service, such as,
institutional and political articulations to gain access to infrastructure and basic rights, the effort to discuss
land regularization and environmental education actions.In this context, in order to reach the goals set,
some axes were related to TARE’s activities, such as diversification of production through implementation
of SAFs and/or insertion of new production techniques according to the vocation of communities, support
to marketing and access to new markets, land regularization, support to institutional articulations forming
partnerships to support the implementation of the activities and attract investments, and environmental
education.
Among the activities of the TARE context there is, as well, the axis of Multiple Use Forest
Management, these actions are based on the inducement of good extraction practices that allows the
exploitation of timber and non-timber forest resources in order to keep the forest conserved, avoiding the
emission of GHG. As low impact production practices are established, which are inherent to traditional
extractive culture and, when properly associated with the appropriate techniques of responsible forest
management, it can potentially allow the establishment of sustainable relations of production and use of
biodiversity, providing the reduction of the production losses, increasing productivity, and adding product
value.
The project intends to foster activities that allow the generation of additional income for the
communities (communitary management), as well as improving the management of the territory and the
protection of the forest in the long term. Among the proposed actions, the main axis of action is the
encouragement of community forest management, which should include the exploitation of timber and
non-timber products, depending on the interest and needs raised by the communities. These activities are
aimed at the exploitation of low impact of forest resources, associating with the maintenance of the
ecological balance, socio-environmental responsibility and economic-financial efficiency.
Grupo Jari has a Sustainable Forest Management Plan renewed in 2016 that foresee the
exploitation of multiple forest resources, seeking, among other objectives, developing scientific
knowledge based on the traditional uses of the forest, identifing markets for these products and sharing
with communities the benefits generated, establishing actions economically viable, environmentally
correct and socially fair. For the REDD+ Project, the plan aims to encourage the exploitation of non-
timber products through community associations. Along with the process of social organization, the
project should support community groups to structure different production chains and access qualified
markets, providing diversifying and increasing community income.
Through Sustainable Extractism actions aimed at families and agro-extractive communities in the
Project Zone, the Project seeks to generate employment, income and ensure the well conservation of the
forest. This work intends to form intersectoral articulations with network activities (public agencies, private
sector and social organizations), to provide training in organizational development and environmental
conservation, with technical assistance drived to the elaboration of agro-extractive production projects,
CCB & VCS PROJECT DESCRIPTION: CCB Version 3, VCS Version 3
CCB v3.0, VCS v3.3 37
access to credit and the market, besides to ensure advisory and monitoring of production, participatory
management. This initiative is one of the actions that would depends of the strengthen the Fundação Jari
work, therefore, the activities that are already in course should be boost through the additional
investments and Fundação organizational restructuring.
The dissemination of traditional knowledge obtained through these actions will follow the legal
guidelines described by the legislation listed in item 2.5.7 of this document, specifically Law No. 13,123
(2015). Therefore, no decision involving community members or community associations will be taken
without due process of free, prior and informed consent from all stakeholders.
Fundação Jari Strengthening:
In the Jari valley, the Fundação Jari is certified as the main agent of TARE, for this, in order to
ensure continuity and improvement of family assistance, as required, it is imperative that efforts are
invested in the organization.
There is a need for some changes aimed at strengthening and maintaining the Fundação Jari,
like to implement new ideas, procedures and technologies aiming to recycle the team knowledges on
TARE and environmental monitoring, as well as improving institutional skills to perform activities focused
on business development with social impact. Besides that, it will be important to increase staff, aiming to
assist more communities, forming a well qualified and multi-disciplinar team. In this way the project
foresees activities to address and work on the Fundação Jari weakness.
This action aims to ensure the successful implementation of the Project and the enhancement of
impacts already generated bu Fundação Jari, helping rural families and communities to improve its
production using sustainable and responsible pratices, giving oportinity to then to access capital, markets
and partnerships that can potentially inprove the local life quality, improving the capacity to conduct the
environmental monitoring together with Grupo Jari security team, among other potential positive actions
that direct impacts on socioeconomic development and environmental conservation sphere
The efforts to Strengthening of the Fundação Jari, aims to guarantee the long-term permanence
of the whole proposed project actions. For this reason, it’d considered that the actions for Strengthening
of Fundação Jari are one of the most fundamental investments of the project. Only this way will be
possible to ensure the permanence of the whole climate, community and biodiversity potential benefits.
Therefore, this work represents an activity of wide benefits that will potentially generate direct and indirect
positive impacts to Climate, Community and Biodiversity.
Community Infrastructure (Energy and Communication):
Communication and energy are central axes for generating socioeconomic well-being in the lives
of families in rural communities.
Communication from a social point of view helps to remove communities from the isolation and
lack of information from the outside world and favors other issues, such as health and education, which
CCB & VCS PROJECT DESCRIPTION: CCB Version 3, VCS Version 3
CCB v3.0, VCS v3.3 38
can facilitate the lives of rural people, from the economic point of view, communicating with the external
market is fundamental to guarantee access to better marketing conditions.
In the communities involved in the Project only one has better access to the communication
networks, and yet they are incipient, in this sense, it is imperative that improvements in community
communication systems be implemented, either through actions that articulate with the public power the
deployment of public telephony systems or through independent systems from the installation of rural
and/or Internet telephony antennas in the communities.
As for electric energy, only one core of the communities involved in the project has the supply of
electric energy through the public system, the other two nuclei have electric power from diesel engines,
which in addition to limited and high cost contributes to the emission of gases into the atmosphere.
Therefore, efforts will be made to resolve this issue with a view to improving production
processes and increasing production capacity in a wide range of areas: improving food, storing food in a
refrigerated environment, and facilitating access to information through the use of cellular devices and
televisions, which may make it easier to access information and events in the world.
Environmental Monitoring and Scientific Research:
The incentive to reduce deforestation is mainly related to the mitigation of global climate change.
However, to provide the generation of consistent positive impacts, conservation initiatives should act
comprehensively. Acting not only in relation to the reduction of greenhouse gas emissions and the
generation of positive social impacts, but also in the monitoring and mitigation of impacts related to
biodiversity, maintenance of gene flow, regulation of water flows and water quality, nutrient cycling,
protection of the soil, shelter to the fauna, food supply, fibers and other products to local communities,
scenic beauty, maintenance of ecological corridors, among others.
In conjunction with multiple use forest management practices, the Jari/Pará REDD+ Project aims
to monitor and provide for the maintenance of forest cover in the Project Area, ensuring the conservation
and protection of habitats and species present on the site and thus generating positive net benefits
foreseen to biodiversity for the scenario with the Project.
The detailed and detailed diagnosis in section 5.1 – Without-Project Biodiversity Scenario
demonstrated that the Project Area covers a diverse and rich biodiversity, in addition to having species of
flora and fauna present in national and international lists of threatened species, which demand great
attention. In addition, the area plays an important role as an ecological corridor connecting several
Conservation Units in the region.
The biodiversity-related activities projected for this Project relate to biodiversity monitoring,
including the monitoring of sensitive species, i.e. with some degree of threat according to the list of IUCN
threatened species found in the region (details section 5.4.1 – Biodiversity Monitoring Plan) and the
achievement and encouragement of scientific research in the Project Area. In addition, constant
monitoring is planned in areas of high conservation value.
CCB & VCS PROJECT DESCRIPTION: CCB Version 3, VCS Version 3
CCB v3.0, VCS v3.3 39
These activities include the elaboration of a long-term monitoring plan for the impacts of the
Project and forest management on regional biodiversity. It is intended that the monitoring be anchored,
preferably, through agreements with local teaching and research institutions, in order to encourage the
research and dissemination of scientific and environmental knowledge to the local society.
In general, the Jari/Pará REDD+ Project is intended to generate a number of positive impacts on
biodiversity, such as conservation of species already diagnosed and conservation of local habitats,
conservation of HCVA’s, generation and dissemination of scientific knowledge on biodiversity,
dissemination of scientific studies in the area and results and indicators related to this theme,
maintenance of ecosystem services, mapping of new areas of great relevance for conservation and
maintenance of connectivity in the landscape.
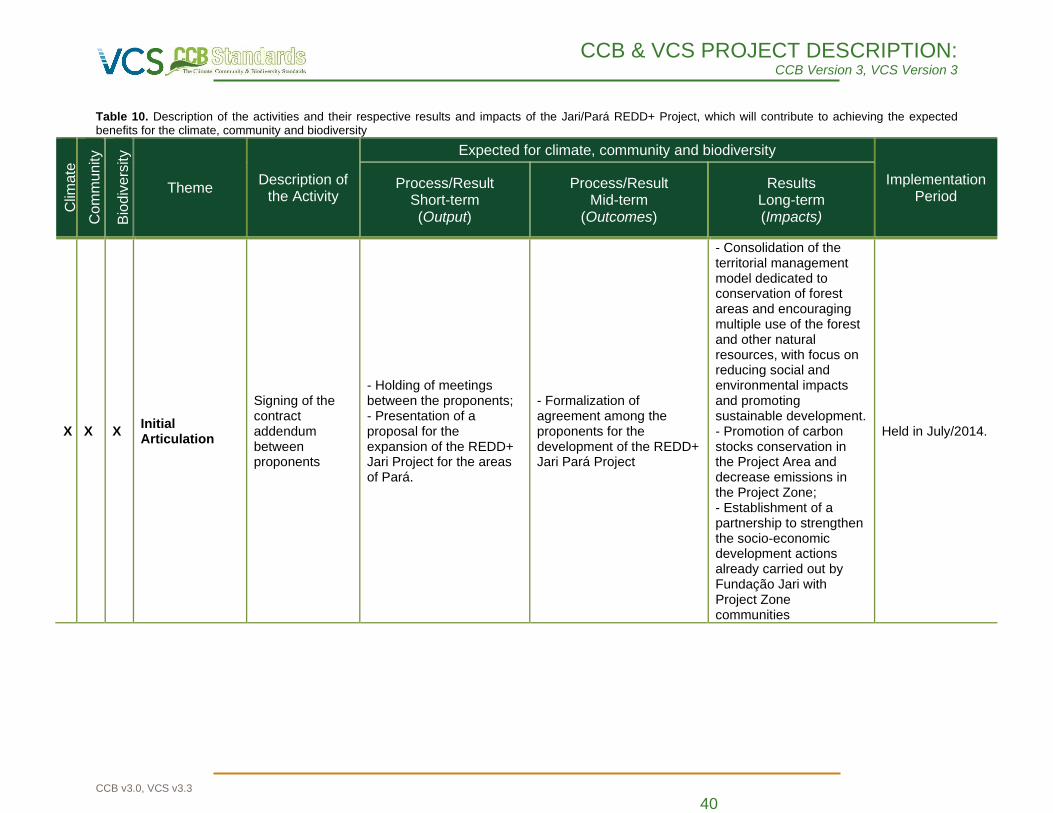
CCB & VCS PROJECT DESCRIPTION: CCB Version 3, VCS Version 3
CCB v3.0, VCS v3.3 40
Table 10. Description of the activities and their respective results and impacts of the Jari/Pará REDD+ Project, which will contribute to achieving the expected benefits for the climate, community and biodiversity
Clim
ate
Co
mm
unity
Bio
div
ers
ity
Theme Description of
the Activity
Expected for climate, community and biodiversity
Implementation Period
Process/Result Short-term (Output)
Process/Result Mid-term
(Outcomes)
Results Long-term (Impacts)
X X X Initial Articulation
Signing of the contract addendum between proponents
- Holding of meetings between the proponents; - Presentation of a proposal for the expansion of the REDD+ Jari Project for the areas of Pará.
- Formalization of agreement among the proponents for the development of the REDD+ Jari Pará Project
- Consolidation of the territorial management model dedicated to conservation of forest areas and encouraging multiple use of the forest and other natural resources, with focus on reducing social and environmental impacts and promoting sustainable development. - Promotion of carbon stocks conservation in the Project Area and decrease emissions in the Project Zone; - Establishment of a partnership to strengthen the socio-economic development actions already carried out by Fundação Jari with Project Zone communities
Held in July/2014.
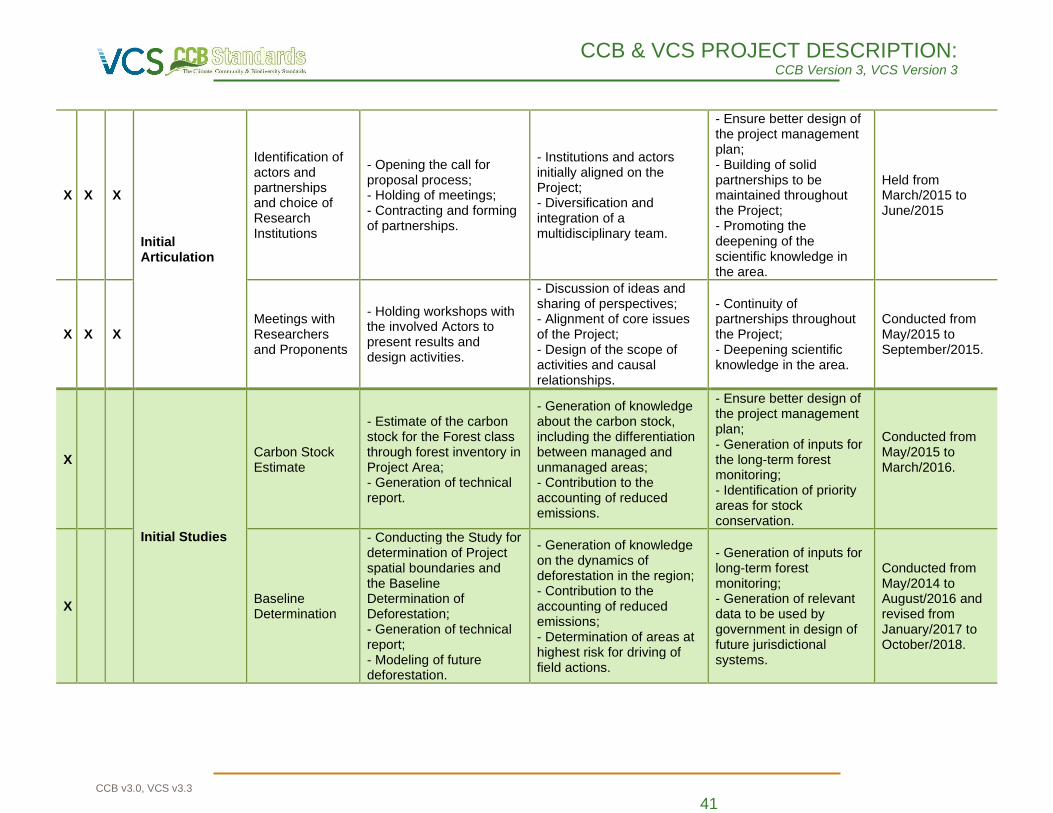
CCB & VCS PROJECT DESCRIPTION: CCB Version 3, VCS Version 3
CCB v3.0, VCS v3.3 41
X X X
Initial Articulation
Identification of actors and partnerships and choice of Research Institutions
- Opening the call for proposal process; - Holding of meetings; - Contracting and forming of partnerships.
- Institutions and actors initially aligned on the Project; - Diversification and integration of a multidisciplinary team.
- Ensure better design of the project management plan; - Building of solid partnerships to be maintained throughout the Project; - Promoting the deepening of the scientific knowledge in the area.
Held from March/2015 to June/2015
X X X Meetings with Researchers and Proponents
- Holding workshops with the involved Actors to present results and design activities.
- Discussion of ideas and sharing of perspectives; - Alignment of core issues of the Project; - Design of the scope of activities and causal relationships.
- Continuity of partnerships throughout the Project; - Deepening scientific knowledge in the area.
Conducted from May/2015 to September/2015.
X
Initial Studies
Carbon Stock Estimate
- Estimate of the carbon stock for the Forest class through forest inventory in Project Area; - Generation of technical report.
- Generation of knowledge about the carbon stock, including the differentiation between managed and unmanaged areas; - Contribution to the accounting of reduced emissions.
- Ensure better design of the project management plan; - Generation of inputs for the long-term forest monitoring; - Identification of priority areas for stock conservation.
Conducted from May/2015 to March/2016.
X Baseline Determination
- Conducting the Study for determination of Project spatial boundaries and the Baseline Determination of Deforestation; - Generation of technical report; - Modeling of future deforestation.
- Generation of knowledge on the dynamics of deforestation in the region; - Contribution to the accounting of reduced emissions; - Determination of areas at highest risk for driving of field actions.
- Generation of inputs for long-term forest monitoring; - Generation of relevant data to be used by government in design of future jurisdictional systems.
Conducted from May/2014 to August/2016 and revised from January/2017 to October/2018.
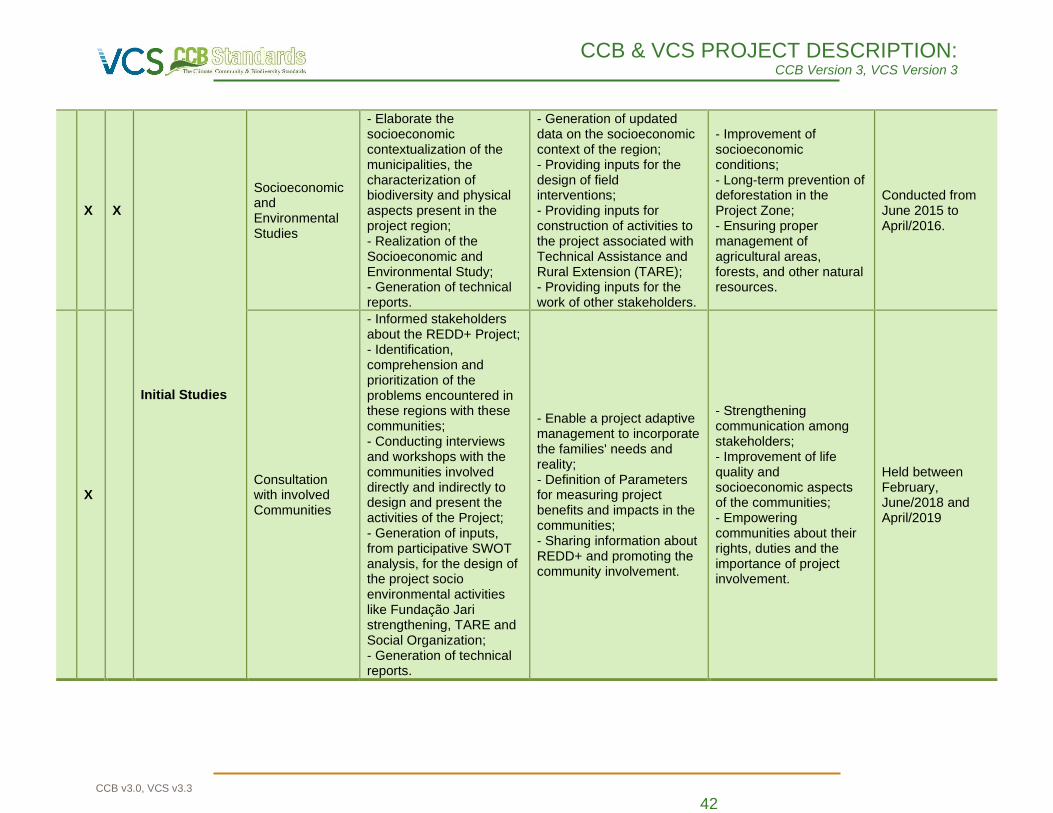
CCB & VCS PROJECT DESCRIPTION: CCB Version 3, VCS Version 3
CCB v3.0, VCS v3.3 42
X X
Initial Studies
Socioeconomic and Environmental Studies
- Elaborate the socioeconomic contextualization of the municipalities, the characterization of biodiversity and physical aspects present in the project region; - Realization of the Socioeconomic and Environmental Study; - Generation of technical reports.
- Generation of updated data on the socioeconomic context of the region; - Providing inputs for the design of field interventions; - Providing inputs for construction of activities to the project associated with Technical Assistance and Rural Extension (TARE); - Providing inputs for the work of other stakeholders.
- Improvement of socioeconomic conditions; - Long-term prevention of deforestation in the Project Zone; - Ensuring proper management of agricultural areas, forests, and other natural resources.
Conducted from June 2015 to April/2016.
X Consultation with involved Communities
- Informed stakeholders about the REDD+ Project; - Identification, comprehension and prioritization of the problems encountered in these regions with these communities; - Conducting interviews and workshops with the communities involved directly and indirectly to design and present the activities of the Project; - Generation of inputs, from participative SWOT analysis, for the design of the project socio environmental activities like Fundação Jari strengthening, TARE and Social Organization; - Generation of technical reports.
- Enable a project adaptive management to incorporate the families' needs and reality; - Definition of Parameters for measuring project benefits and impacts in the communities; - Sharing information about REDD+ and promoting the community involvement.
- Strengthening communication among stakeholders; - Improvement of life quality and socioeconomic aspects of the communities; - Empowering communities about their rights, duties and the importance of project involvement.
Held between February, June/2018 and April/2019
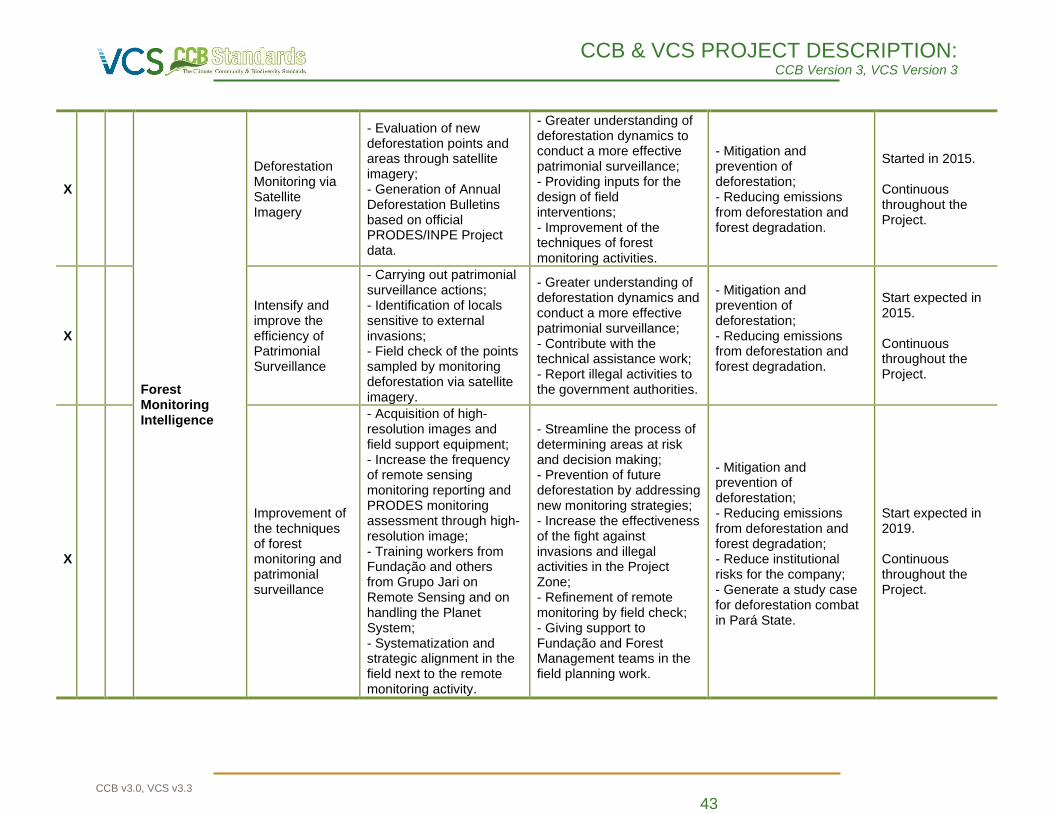
CCB & VCS PROJECT DESCRIPTION: CCB Version 3, VCS Version 3
CCB v3.0, VCS v3.3 43
X
Forest Monitoring Intelligence
Deforestation Monitoring via Satellite Imagery
- Evaluation of new deforestation points and areas through satellite imagery; - Generation of Annual Deforestation Bulletins based on official PRODES/INPE Project data.
- Greater understanding of deforestation dynamics to conduct a more effective patrimonial surveillance; - Providing inputs for the design of field interventions; - Improvement of the techniques of forest monitoring activities.
- Mitigation and prevention of deforestation; - Reducing emissions from deforestation and forest degradation.
Started in 2015. Continuous throughout the Project.
X
Intensify and improve the efficiency of Patrimonial Surveillance
- Carrying out patrimonial surveillance actions; - Identification of locals sensitive to external invasions; - Field check of the points sampled by monitoring deforestation via satellite imagery.
- Greater understanding of deforestation dynamics and conduct a more effective patrimonial surveillance; - Contribute with the technical assistance work; - Report illegal activities to the government authorities.
- Mitigation and prevention of deforestation; - Reducing emissions from deforestation and forest degradation.
Start expected in 2015. Continuous throughout the Project.
X
Improvement of the techniques of forest monitoring and patrimonial surveillance
- Acquisition of high-resolution images and field support equipment; - Increase the frequency of remote sensing monitoring reporting and PRODES monitoring assessment through high-resolution image; - Training workers from Fundação and others from Grupo Jari on Remote Sensing and on handling the Planet System; - Systematization and strategic alignment in the field next to the remote monitoring activity.
- Streamline the process of determining areas at risk and decision making; - Prevention of future deforestation by addressing new monitoring strategies; - Increase the effectiveness of the fight against invasions and illegal activities in the Project Zone; - Refinement of remote monitoring by field check; - Giving support to Fundação and Forest Management teams in the field planning work.
- Mitigation and prevention of deforestation; - Reducing emissions from deforestation and forest degradation; - Reduce institutional risks for the company; - Generate a study case for deforestation combat in Pará State.
Start expected in 2019. Continuous throughout the Project.
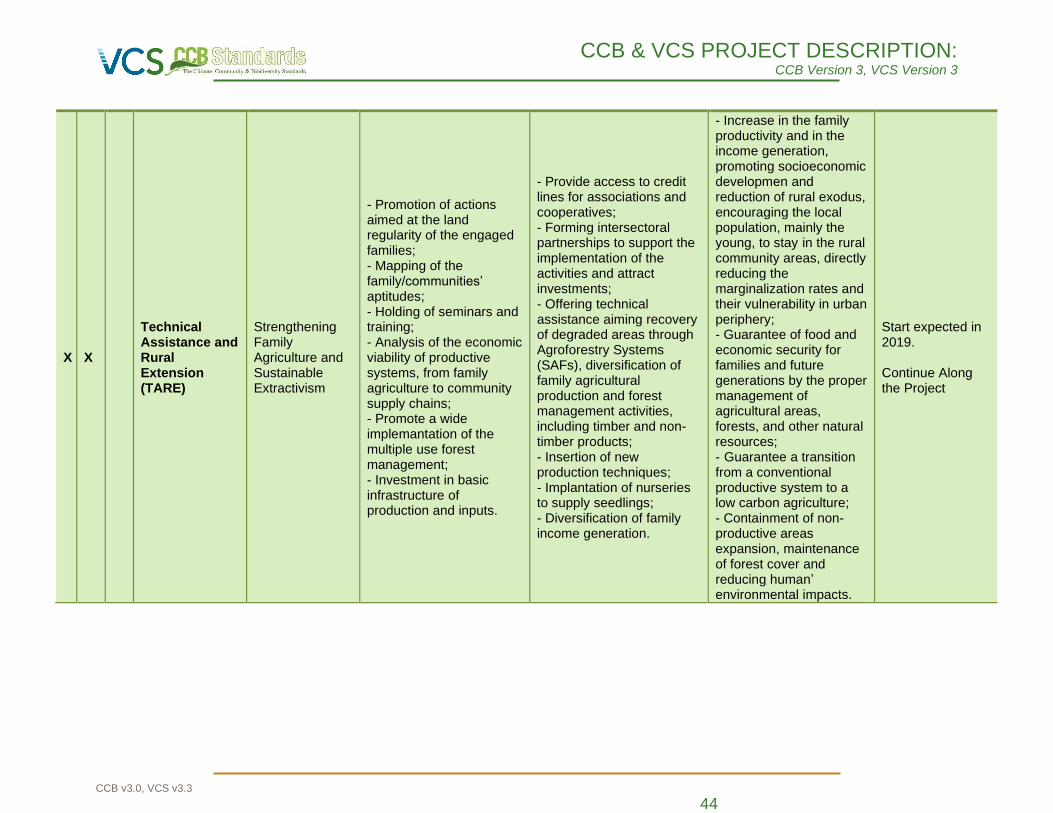
CCB & VCS PROJECT DESCRIPTION: CCB Version 3, VCS Version 3
CCB v3.0, VCS v3.3 44
X X
Technical Assistance and Rural Extension (TARE)
Strengthening Family Agriculture and Sustainable Extractivism
- Promotion of actions aimed at the land regularity of the engaged families; - Mapping of the family/communities’ aptitudes; - Holding of seminars and training; - Analysis of the economic viability of productive systems, from family agriculture to community supply chains; - Promote a wide implemantation of the multiple use forest management; - Investment in basic infrastructure of production and inputs.
- Provide access to credit lines for associations and cooperatives; - Forming intersectoral partnerships to support the implementation of the activities and attract investments; - Offering technical assistance aiming recovery of degraded areas through Agroforestry Systems (SAFs), diversification of family agricultural production and forest management activities, including timber and non-timber products; - Insertion of new production techniques; - Implantation of nurseries to supply seedlings; - Diversification of family income generation.
- Increase in the family productivity and in the income generation, promoting socioeconomic developmen and reduction of rural exodus, encouraging the local population, mainly the young, to stay in the rural community areas, directly reducing the marginalization rates and their vulnerability in urban periphery; - Guarantee of food and economic security for families and future generations by the proper management of agricultural areas, forests, and other natural resources; - Guarantee a transition from a conventional productive system to a low carbon agriculture; - Containment of non-productive areas expansion, maintenance of forest cover and reducing human’ environmental impacts.
Start expected in 2019. Continue Along the Project
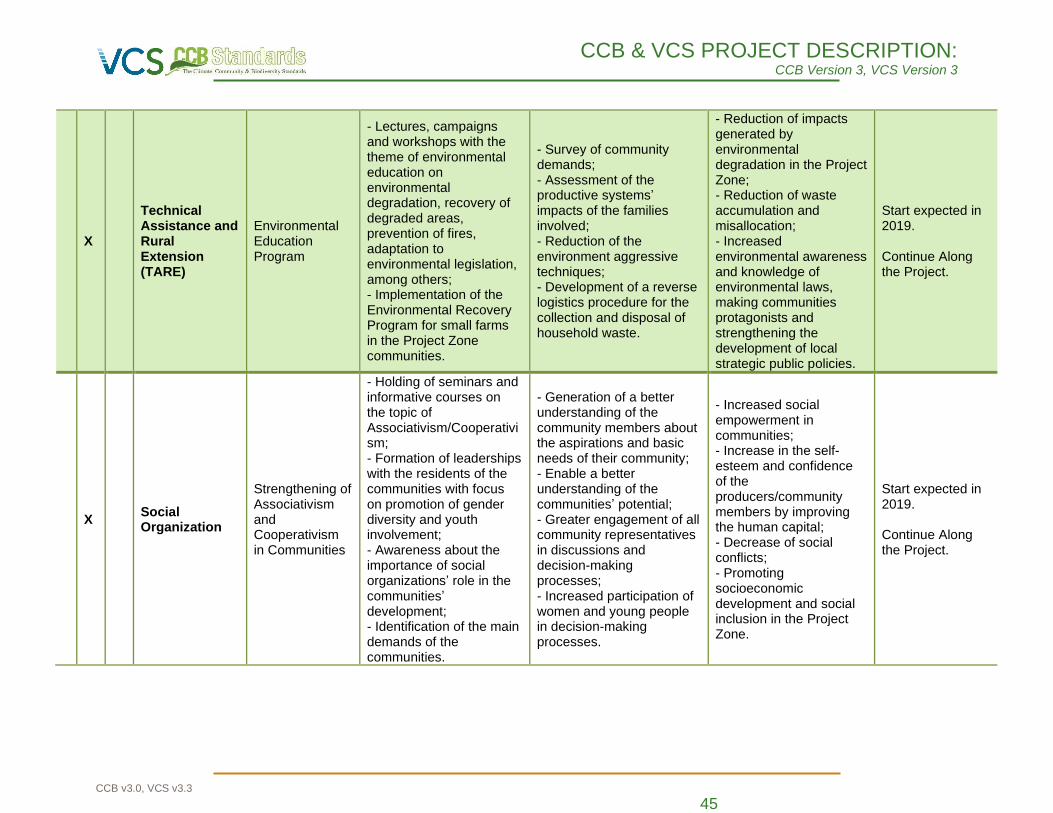
CCB & VCS PROJECT DESCRIPTION: CCB Version 3, VCS Version 3
CCB v3.0, VCS v3.3 45
X
Technical Assistance and Rural Extension (TARE)
Environmental Education Program
- Lectures, campaigns and workshops with the theme of environmental education on environmental degradation, recovery of degraded areas, prevention of fires, adaptation to environmental legislation, among others; - Implementation of the Environmental Recovery Program for small farms in the Project Zone communities.
- Survey of community demands; - Assessment of the productive systems’ impacts of the families involved; - Reduction of the environment aggressive techniques; - Development of a reverse logistics procedure for the collection and disposal of household waste.
- Reduction of impacts generated by environmental degradation in the Project Zone; - Reduction of waste accumulation and misallocation; - Increased environmental awareness and knowledge of environmental laws, making communities protagonists and strengthening the development of local strategic public policies.
Start expected in 2019. Continue Along the Project.
X Social Organization
Strengthening of Associativism and Cooperativism in Communities
- Holding of seminars and informative courses on the topic of Associativism/Cooperativism; - Formation of leaderships with the residents of the communities with focus on promotion of gender diversity and youth involvement; - Awareness about the importance of social organizations’ role in the communities’ development; - Identification of the main demands of the communities.
- Generation of a better understanding of the community members about the aspirations and basic needs of their community; - Enable a better understanding of the communities’ potential; - Greater engagement of all community representatives in discussions and decision-making processes; - Increased participation of women and young people in decision-making processes.
- Increased social empowerment in communities; - Increase in the self-esteem and confidence of the producers/community members by improving the human capital; - Decrease of social conflicts; - Promoting socioeconomic development and social inclusion in the Project Zone.
Start expected in 2019. Continue Along the Project.
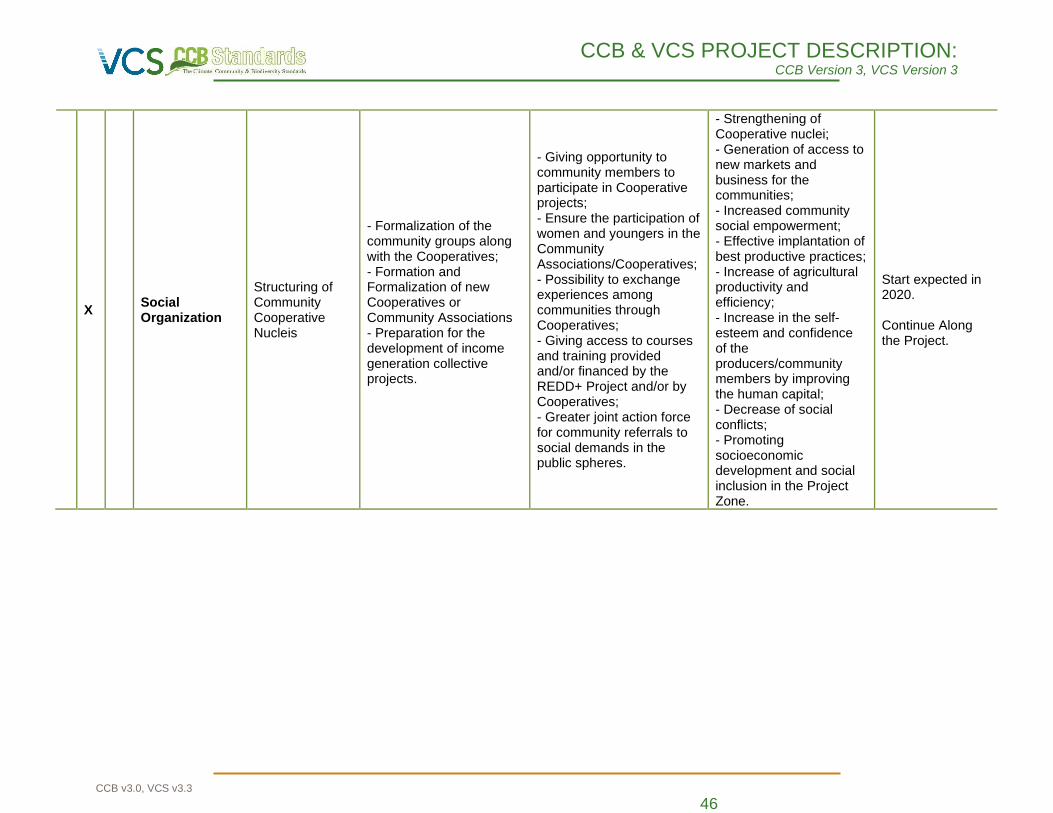
CCB & VCS PROJECT DESCRIPTION: CCB Version 3, VCS Version 3
CCB v3.0, VCS v3.3 46
X Social Organization
Structuring of Community Cooperative Nucleis
- Formalization of the community groups along with the Cooperatives; - Formation and Formalization of new Cooperatives or Community Associations - Preparation for the development of income generation collective projects.
- Giving opportunity to community members to participate in Cooperative projects; - Ensure the participation of women and youngers in the Community Associations/Cooperatives; - Possibility to exchange experiences among communities through Cooperatives; - Giving access to courses and training provided and/or financed by the REDD+ Project and/or by Cooperatives; - Greater joint action force for community referrals to social demands in the public spheres.
- Strengthening of Cooperative nuclei; - Generation of access to new markets and business for the communities; - Increased community social empowerment; - Effective implantation of best productive practices; - Increase of agricultural productivity and efficiency; - Increase in the self-esteem and confidence of the producers/community members by improving the human capital; - Decrease of social conflicts; - Promoting socioeconomic development and social inclusion in the Project Zone.
Start expected in 2020. Continue Along the Project.
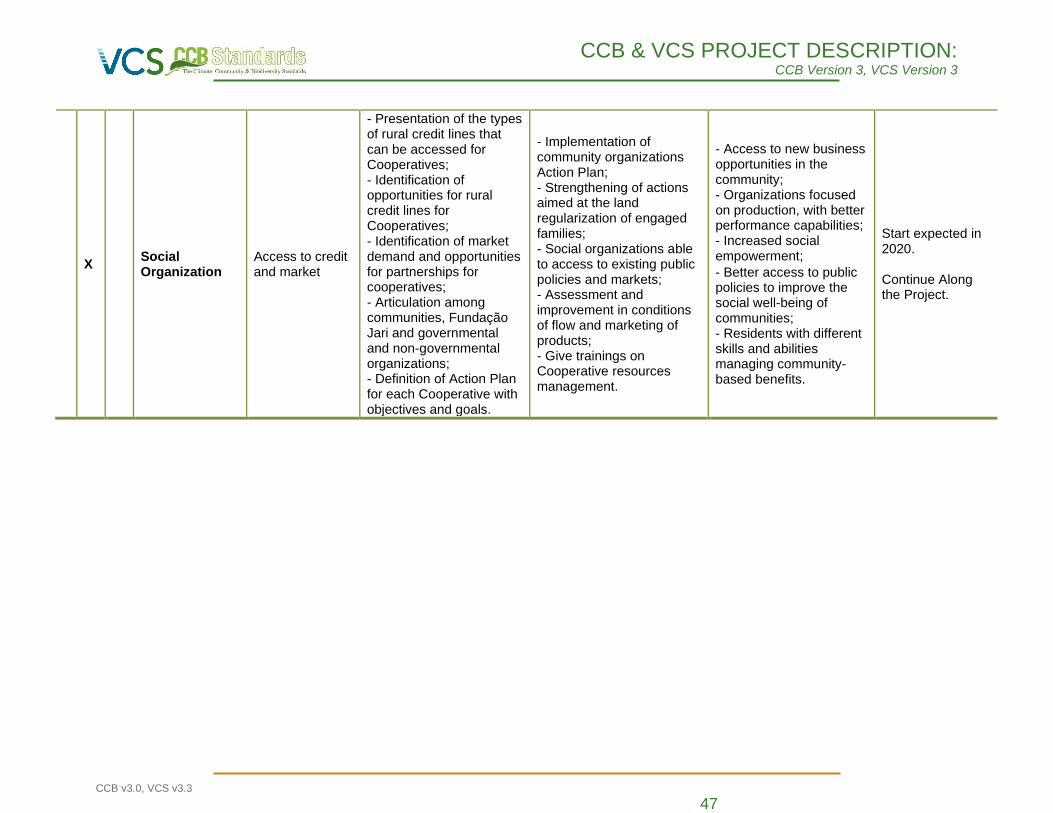
CCB & VCS PROJECT DESCRIPTION: CCB Version 3, VCS Version 3
CCB v3.0, VCS v3.3 47
X Social Organization
Access to credit and market
- Presentation of the types of rural credit lines that can be accessed for Cooperatives; - Identification of opportunities for rural credit lines for Cooperatives; - Identification of market demand and opportunities for partnerships for cooperatives; - Articulation among communities, Fundação Jari and governmental and non-governmental organizations; - Definition of Action Plan for each Cooperative with objectives and goals.
- Implementation of community organizations Action Plan; - Strengthening of actions aimed at the land regularization of engaged families; - Social organizations able to access to existing public policies and markets; - Assessment and improvement in conditions of flow and marketing of products; - Give trainings on Cooperative resources management.
- Access to new business opportunities in the community; - Organizations focused on production, with better performance capabilities; - Increased social empowerment;
• - Better access to public policies to improve the social well-being of communities; - Residents with different skills and abilities managing community-based benefits.
Start expected in 2020. Continue Along the Project.
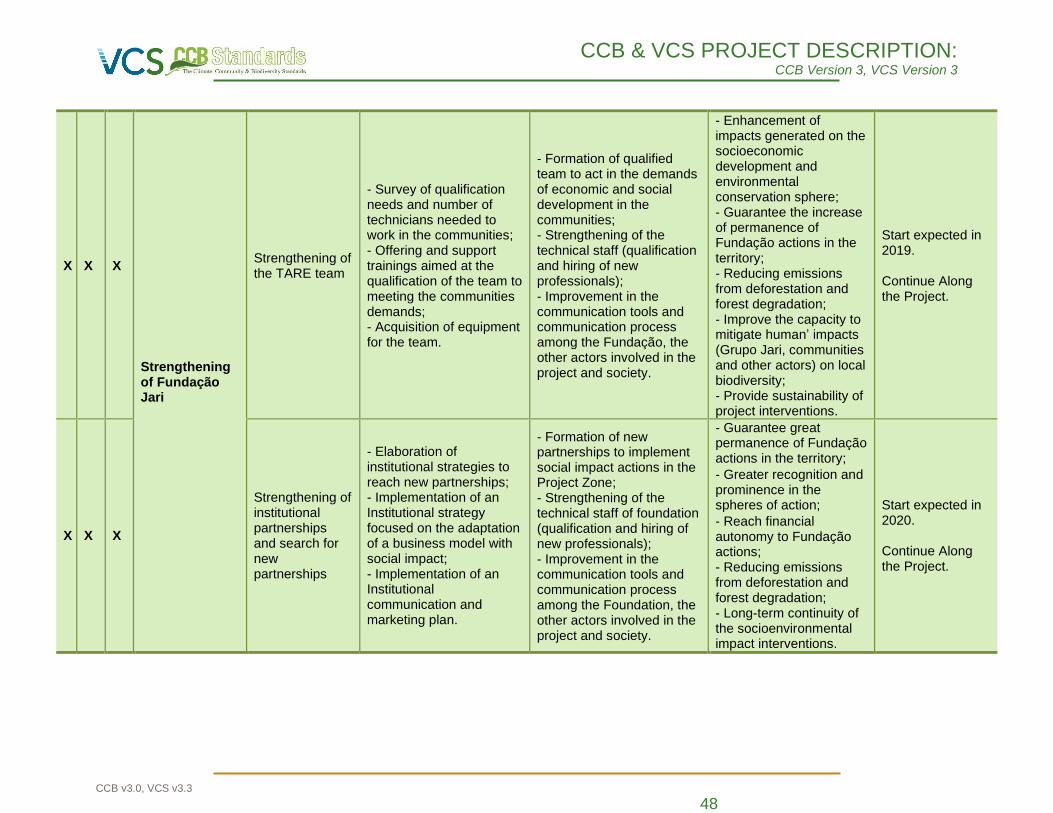
CCB & VCS PROJECT DESCRIPTION: CCB Version 3, VCS Version 3
CCB v3.0, VCS v3.3 48
X X X
Strengthening of Fundação Jari
Strengthening of the TARE team
- Survey of qualification needs and number of technicians needed to work in the communities; - Offering and support trainings aimed at the qualification of the team to meeting the communities demands; - Acquisition of equipment for the team.
- Formation of qualified team to act in the demands of economic and social development in the communities; - Strengthening of the technical staff (qualification and hiring of new professionals); - Improvement in the communication tools and communication process among the Fundação, the other actors involved in the project and society.
- Enhancement of impacts generated on the socioeconomic development and environmental conservation sphere; - Guarantee the increase of permanence of Fundação actions in the territory; - Reducing emissions from deforestation and forest degradation; - Improve the capacity to mitigate human’ impacts (Grupo Jari, communities and other actors) on local biodiversity; - Provide sustainability of project interventions.
Start expected in 2019. Continue Along the Project.
X X X
Strengthening of institutional partnerships and search for new partnerships
- Elaboration of institutional strategies to reach new partnerships; - Implementation of an Institutional strategy focused on the adaptation of a business model with social impact; - Implementation of an Institutional communication and marketing plan.
• - Formation of new partnerships to implement social impact actions in the Project Zone; - Strengthening of the technical staff of foundation (qualification and hiring of new professionals); - Improvement in the communication tools and communication process among the Foundation, the other actors involved in the project and society.
- Guarantee great permanence of Fundação actions in the territory;
• - Greater recognition and prominence in the spheres of action;
• - Reach financial autonomy to Fundação actions; - Reducing emissions from deforestation and forest degradation; - Long-term continuity of the socioenvironmental impact interventions.
Start expected in 2020. Continue Along the Project.
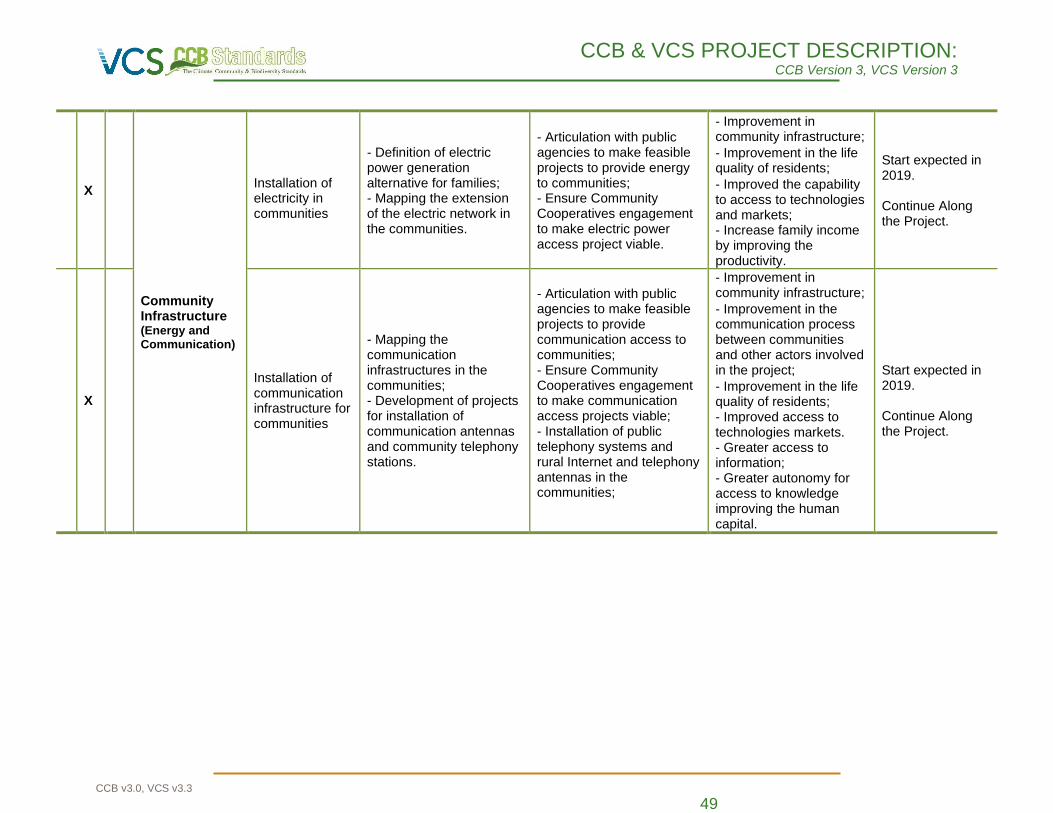
CCB & VCS PROJECT DESCRIPTION: CCB Version 3, VCS Version 3
CCB v3.0, VCS v3.3 49
X
Community Infrastructure (Energy and Communication)
Installation of electricity in communities
- Definition of electric power generation alternative for families; - Mapping the extension of the electric network in the communities.
- Articulation with public agencies to make feasible projects to provide energy to communities; - Ensure Community Cooperatives engagement to make electric power access project viable.
• - Improvement in community infrastructure;
• - Improvement in the life quality of residents;
• - Improved the capability to access to technologies and markets; - Increase family income by improving the productivity.
Start expected in 2019. Continue Along the Project.
X
Installation of communication infrastructure for communities
- Mapping the communication infrastructures in the communities; - Development of projects for installation of communication antennas and community telephony stations.
- Articulation with public agencies to make feasible projects to provide communication access to communities; - Ensure Community Cooperatives engagement to make communication access projects viable; - Installation of public telephony systems and rural Internet and telephony antennas in the communities;
- Improvement in community infrastructure;
• - Improvement in the communication process between communities and other actors involved in the project;
• - Improvement in the life quality of residents; - Improved access to technologies markets. - Greater access to information; - Greater autonomy for access to knowledge improving the human capital.
Start expected in 2019. Continue Along the Project.
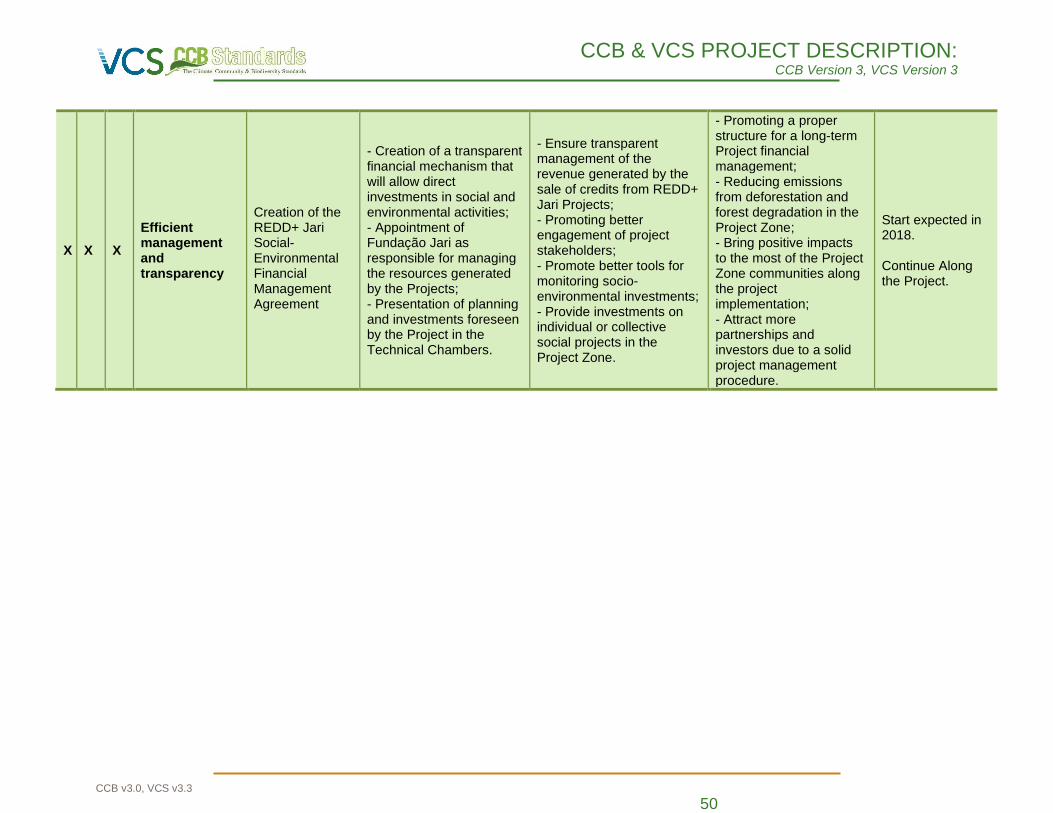
CCB & VCS PROJECT DESCRIPTION: CCB Version 3, VCS Version 3
CCB v3.0, VCS v3.3 50
X X X
Efficient management and transparency
Creation of the REDD+ Jari Social-Environmental Financial Management Agreement
- Creation of a transparent financial mechanism that will allow direct investments in social and environmental activities; - Appointment of Fundação Jari as responsible for managing the resources generated by the Projects; - Presentation of planning and investments foreseen by the Project in the Technical Chambers.
- Ensure transparent management of the revenue generated by the sale of credits from REDD+ Jari Projects; - Promoting better engagement of project stakeholders; - Promote better tools for monitoring socio-environmental investments; - Provide investments on individual or collective social projects in the Project Zone.
- Promoting a proper structure for a long-term Project financial management; - Reducing emissions from deforestation and forest degradation in the Project Zone; - Bring positive impacts to the most of the Project Zone communities along the project implementation; - Attract more partnerships and investors due to a solid project management procedure.
Start expected in 2018. Continue Along the Project.
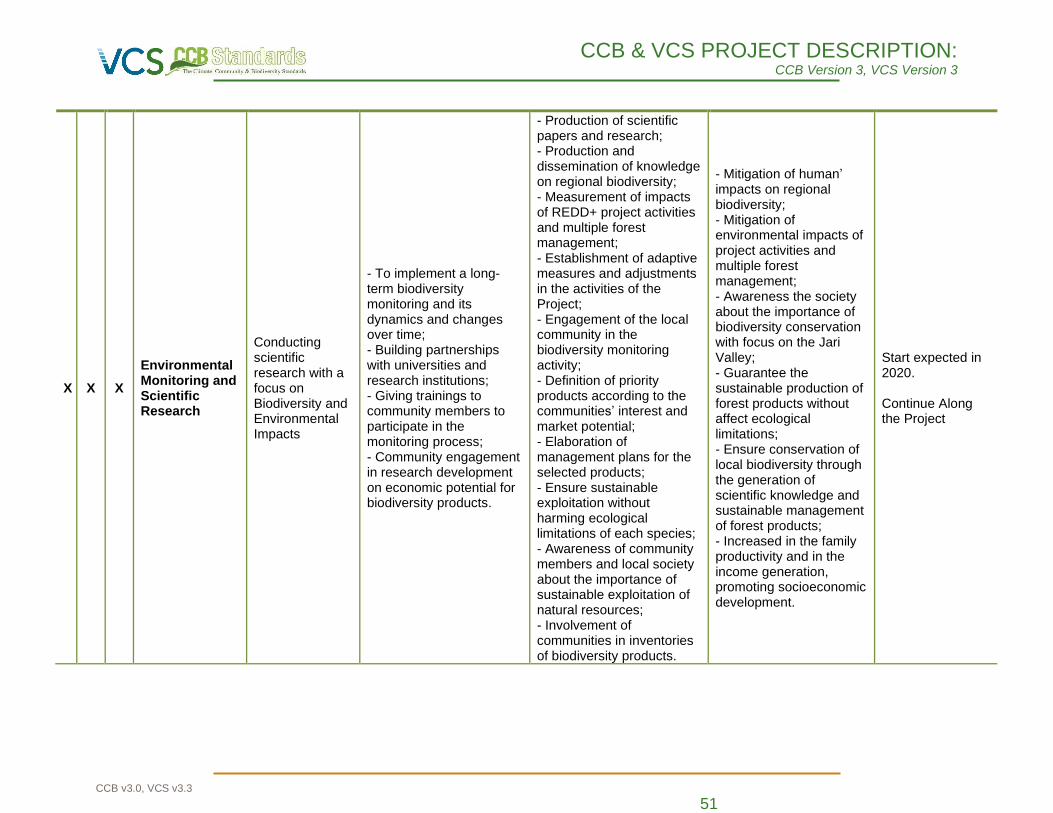
CCB & VCS PROJECT DESCRIPTION: CCB Version 3, VCS Version 3
CCB v3.0, VCS v3.3 51
X X X
Environmental Monitoring and Scientific Research
Conducting scientific research with a focus on Biodiversity and Environmental Impacts
- To implement a long-term biodiversity monitoring and its dynamics and changes over time; - Building partnerships with universities and research institutions; - Giving trainings to community members to participate in the monitoring process; - Community engagement in research development on economic potential for biodiversity products.
- Production of scientific papers and research; - Production and dissemination of knowledge on regional biodiversity; - Measurement of impacts of REDD+ project activities and multiple forest management; - Establishment of adaptive measures and adjustments in the activities of the Project; - Engagement of the local community in the biodiversity monitoring activity; - Definition of priority products according to the communities’ interest and market potential; - Elaboration of management plans for the selected products; - Ensure sustainable exploitation without harming ecological limitations of each species; - Awareness of community members and local society about the importance of sustainable exploitation of natural resources; - Involvement of communities in inventories of biodiversity products.
- Mitigation of human’ impacts on regional biodiversity; - Mitigation of environmental impacts of project activities and multiple forest management; - Awareness the society about the importance of biodiversity conservation with focus on the Jari Valley; - Guarantee the sustainable production of forest products without affect ecological limitations; - Ensure conservation of local biodiversity through the generation of scientific knowledge and sustainable management of forest products; - Increased in the family productivity and in the income generation, promoting socioeconomic development.
Start expected in 2020. Continue Along the Project
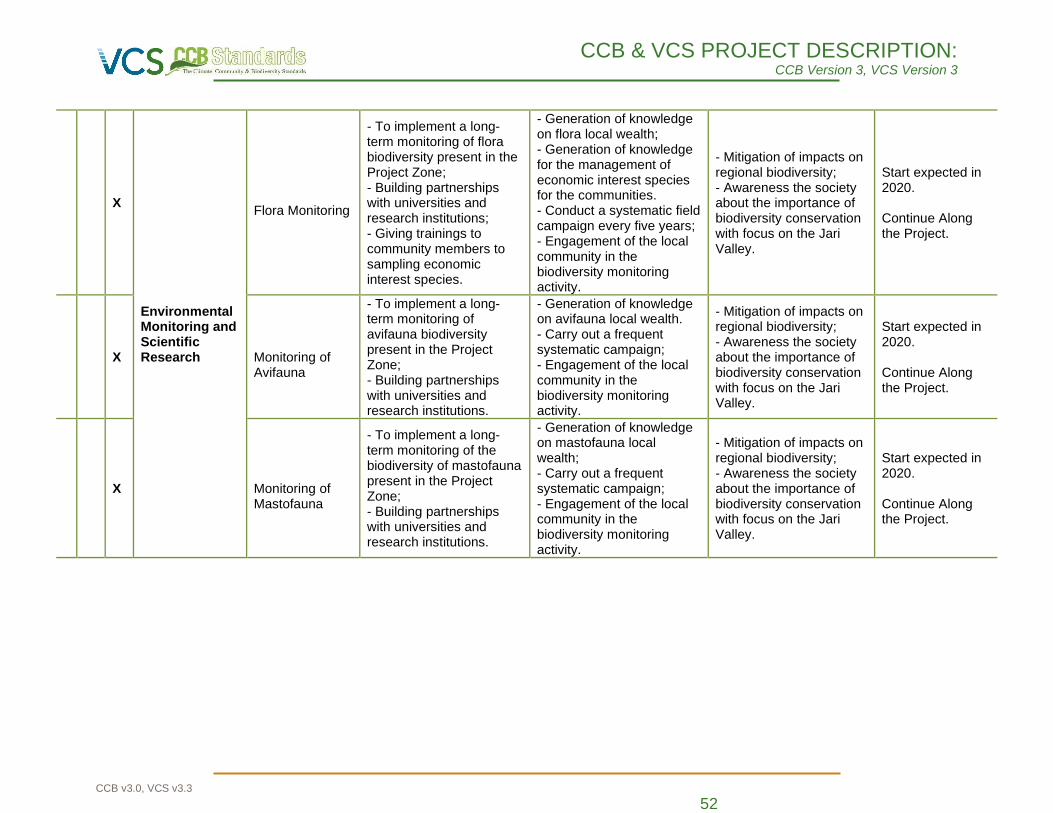
CCB & VCS PROJECT DESCRIPTION: CCB Version 3, VCS Version 3
CCB v3.0, VCS v3.3 52
X
Environmental Monitoring and Scientific Research
Flora Monitoring
- To implement a long-term monitoring of flora biodiversity present in the Project Zone; - Building partnerships with universities and research institutions; - Giving trainings to community members to sampling economic interest species.
- Generation of knowledge on flora local wealth; - Generation of knowledge for the management of economic interest species for the communities. - Conduct a systematic field campaign every five years; - Engagement of the local community in the biodiversity monitoring activity.
- Mitigation of impacts on regional biodiversity; - Awareness the society about the importance of biodiversity conservation with focus on the Jari Valley.
Start expected in 2020. Continue Along the Project.
X Monitoring of Avifauna
- To implement a long-term monitoring of avifauna biodiversity present in the Project Zone; - Building partnerships with universities and research institutions.
- Generation of knowledge on avifauna local wealth. - Carry out a frequent systematic campaign; - Engagement of the local community in the biodiversity monitoring activity.
- Mitigation of impacts on regional biodiversity; - Awareness the society about the importance of biodiversity conservation with focus on the Jari Valley.
Start expected in 2020. Continue Along the Project.
X Monitoring of Mastofauna
- To implement a long-term monitoring of the biodiversity of mastofauna present in the Project Zone; - Building partnerships with universities and research institutions.
- Generation of knowledge on mastofauna local wealth; - Carry out a frequent systematic campaign; - Engagement of the local community in the biodiversity monitoring activity.
- Mitigation of impacts on regional biodiversity; - Awareness the society about the importance of biodiversity conservation with focus on the Jari Valley.
Start expected in 2020. Continue Along the Project.
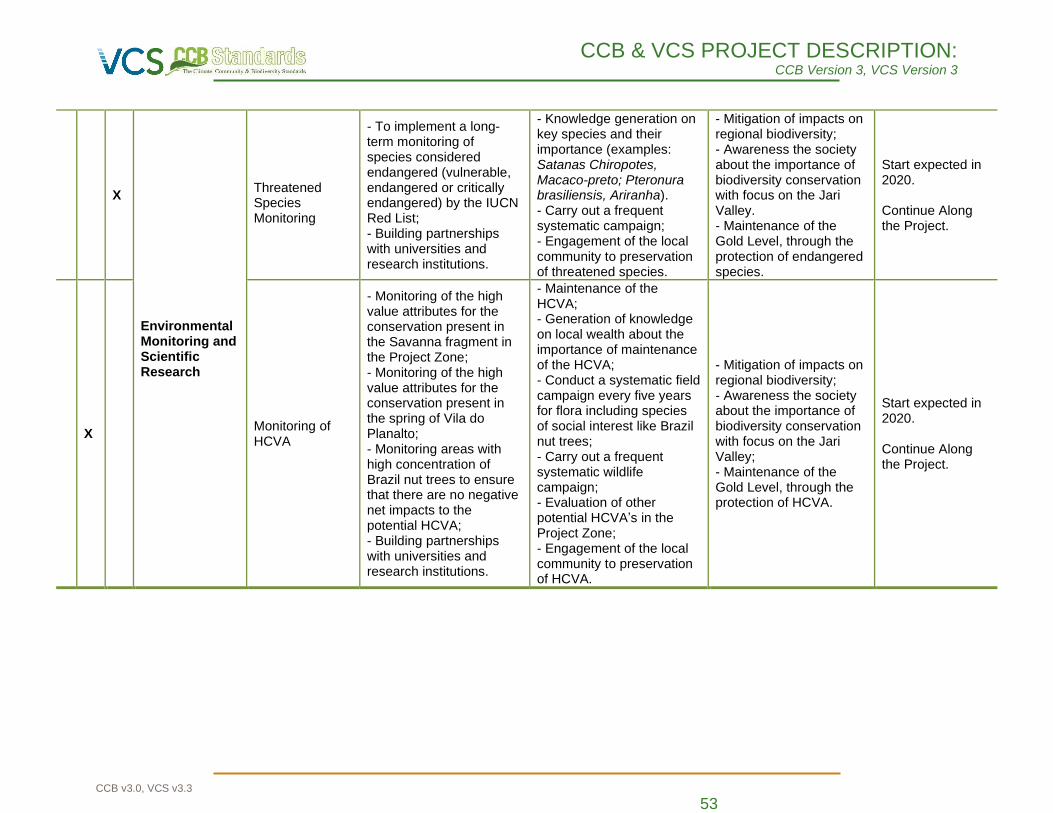
CCB & VCS PROJECT DESCRIPTION: CCB Version 3, VCS Version 3
CCB v3.0, VCS v3.3 53
X
Environmental Monitoring and Scientific Research
Threatened Species Monitoring
- To implement a long-term monitoring of species considered endangered (vulnerable, endangered or critically endangered) by the IUCN Red List; - Building partnerships with universities and research institutions.
- Knowledge generation on key species and their importance (examples: Satanas Chiropotes, Macaco-preto; Pteronura brasiliensis, Ariranha). - Carry out a frequent systematic campaign; - Engagement of the local community to preservation of threatened species.
- Mitigation of impacts on regional biodiversity; - Awareness the society about the importance of biodiversity conservation with focus on the Jari Valley. - Maintenance of the Gold Level, through the protection of endangered species.
Start expected in 2020. Continue Along the Project.
X Monitoring of HCVA
- Monitoring of the high value attributes for the conservation present in the Savanna fragment in the Project Zone; - Monitoring of the high value attributes for the conservation present in the spring of Vila do Planalto; - Monitoring areas with high concentration of Brazil nut trees to ensure that there are no negative net impacts to the potential HCVA; - Building partnerships with universities and research institutions.
- Maintenance of the HCVA; - Generation of knowledge on local wealth about the importance of maintenance of the HCVA; - Conduct a systematic field campaign every five years for flora including species of social interest like Brazil nut trees; - Carry out a frequent systematic wildlife campaign; - Evaluation of other potential HCVA’s in the Project Zone; - Engagement of the local community to preservation of HCVA.
- Mitigation of impacts on regional biodiversity; - Awareness the society about the importance of biodiversity conservation with focus on the Jari Valley; - Maintenance of the Gold Level, through the protection of HCVA.
Start expected in 2020. Continue Along the Project.
CCB & VCS PROJECT DESCRIPTION: CCB Version 3, VCS Version 3
CCB v3.0, VCS v3.3 54
2.1.12 Sustainable Development
The Jari/Pará REDD+ Project has as one of its objectives to promote sustainable development in
the region, and the Fundação Jari is considered a facilitating and encouraging agent for this sustainable
development. The Fundação works in the Jari region on the integral formation of young people in the
areas of education, health and rights assurance and aims to develop sustainable business and
community-enterprise partnership in order to make feasible and integrate public policies, social
mobilization and sustainable business reflected in the strengthening of local community enterprises.
All this work has already been recognized through several awards throughout its existence and its
model of action is organized into three integrated areas of action: social, business and environmental
management, detailed in the document “Plano de Desenvolvimento Humano e Sustentável do Vale do
Jari” available to validators/verifiers. Based on this support and in accordance with expected impacts, the
project will contribute to the following UN sustainable development goals:
Table 11. Contribution to the UN Sustainable Development Goals
Sustainable Development Goals
Application in Project
The project helps in the fight hunger through the implementation of sustainable
food production systems and resilient agricultural practices through
strengthening family agriculture low carbon in the area, increasing productivity in
family production units, recovering areas degraded previously by implantation of
Agroforestry Systems, diversifying the agricultural production with the
implantation of nurseries to supply seedlings of varied species and generating
guarantee of food security for the families, as described in Table 10.
The project provides access and encourages education through technical and
professional courses enabling better employment conditions and income,
especially for women and youth. In addition, activities related to education and
incentives to sustainable management practices of forest resources, reduce the
spread of illegal activities, promote the appreciation of cultural diversity and
contribute to the sustainable development culture. In order to achieve these
objectives, the project is focused on intensifying technical assistance and rural
extension services, as well as offering training aimed at production bias, social
organization, cooperativism, leadership and financial management, developing
technical and professional skills. The effectiveness of these actions can be
confirmed in the items 2.1.11 (Table 10), 2.1.19, 2.3.14, 2.3.15 and 4.2.
CCB & VCS PROJECT DESCRIPTION: CCB Version 3, VCS Version 3
CCB v3.0, VCS v3.3 55
All project activities are open and stimulated for the participation of all the
residents of the acting communities, especially women, youth and marginalized
people. The Fundação Jari technicians are mainly oriented to include women in
the activities in order to increase their participation in the decision-making
processes.
The project carries out activities aimed at the inclusion of gender and vulnerable
populations with part of its resources from the Socioenvironmental Fund,
respecting and fulfilling international agreements such as the Convention of the
International Labor Organization No. 100 of 1951, which provides for equal pay
for men and women. In addition, the Grupo Jari promotes in the project region
the inclusion of vulnerable groups in training and qualification programs seeking
to offer knowledge and techniques so that these disadvantaged groups can
compete in an egalitarian way in their selective hiring processes. This
information is confirmed in items 2.3.10, 2.3.16 and 2.3.15.
Through actions that encourage the responsible exploitation of natural
resources, low carbon agriculture and the recovery of degraded areas, the
project promotes the conservation of natural resources, coupled with
socioeconomic development for this, some of the main components of the
Project are related to the promotion of scientific research focused on the efficient
use of natural resources, seeking greater integration among the parties involved
in the project and focusing on sustainable business chains, generating income
and well-being for local communities and making the use of natural resources
available more responsible and conscious. These actions are placed in the items
2.1.1, 2.1.11 (Table 10), 2.1.19 and 5.2.1.
All activities undertaken by the project aim to take action to combat climate
change and its impacts through the reduction of deforestation in the project area
and consequently reducing the emission of greenhouse gases, contributing
directly to the Brazilian goal of reducing emissions, the project has the potential
to reduce 15,491,971 tCO2e of GHG emissions in 30 years. As shown in the
items 2.1.17 and 3.2.4.
CCB & VCS PROJECT DESCRIPTION: CCB Version 3, VCS Version 3
CCB v3.0, VCS v3.3 56
The project area has extreme importance to the permanence of natural
environments within and outside its boundaries. In addition to promoting the
conservation of biodiversity, ensuring the maintenance of ecosystem services
such as pest and diseases, pollination, water quality, climate regulation, the area
serves as an ecological corridor for conservation areas in the region, this
connectivity between fragments form a large and resilient conservation system
to mitigate future global changes, make significant improvements in the living
standards of local populations, and serve as a buffer zone for risks and threats
to the mosaic of protected areas in the north of the state of Pará. Also to this, the
project protects High Conservation Value Areas (HCVA) by stimulating and
enhancing knowledge about local biodiversity through scientific studies such as
long-term monitoring of flora and fauna. The detailed description of these actions
can be found in items 2.1.11 (Table 10), 2.1.19, 2.5.5, 5.1.2, 5.1.3 and 5.4.1.
2.1.13 Implementation Schedule (G1.9)
The schedule with the main dates and main milestones for the development of the Jari/Pará
REDD+ Project have already been presented above and can be visualized in Table 10. The summary
schedule of these activities related to the main Jari/Pará REDD+ Project activities are shown in the table
below (Table 12).
Table 12. Detailed implementation schedule of the main activities related to the Jari/Pará REDD+ Project
Date Milestone(s) in the project’s development and implementation
1 TO 1.5 YEARS BEFORE VALIDATION AND FIRST VERIFICATION
Activity planning meeting
Articulation of institutions and identification of partnerships
Consolidation of the activities schedule
Realization of the Socioeconomic and Environmental Diagnosis
Estimate of carbon stock
Determination of the baseline and the potential for generating credits
Project Planning and Design Workshop
Stakeholder consultation meetings
Consolidation of design, management plan and drafting of project description document
Review and translation of project description document
CCB & VCS PROJECT DESCRIPTION: CCB Version 3, VCS Version 3
CCB v3.0, VCS v3.3 57
Production of monitoring reports
IN THE YEAR OF VALIDATION AND FIRST VERIFICATION
Selection and contracting of validating/verifying body and of credit registration platform
Production of validation/verification audit follow-up bulletins
Field audit follow-up
Project and Credits Registration
YEARS 2 TO 30
Development and monitoring of environmental and social management activities
Monitoring of deforestation and emissions
Monitoring of biodiversity (Fauna and Flora) and High Conservation Value Areas
Development of scientific research
Verification of credits (Selection and contracting of verification body; Production of follow-up bulletins for Verification Project; Monitoring of field audit; Registration of credits)
Conducting of credit marketing processes
2.1.14 Project Start Date
The start date of the Jari/Pará REDD+ Project was set on July 8, 2014, as it represents the
moment of signature of the contract to expand conservation initiatives in the region. Since the partnership
between Biofílica and Grupo Jari began in 2010 with the purpose of developing the Jari/Amapá REDD+
Project, as of the signing of the contract to expand the partnership for the state of Pará, the guidelines for
the new project began to be drawn.
Among the main guidelines defined by the expansion of the partnership, we highlight the
development of an Investment Plan for both properties that encompass activities in the social,
environmental and climatic areas, as described in the Project activities section.
2.1.15 Benefits Assessment and Crediting Period (G1.9)
The start date of the Jari/Pará REDD+ Project crediting period is July 8, 2014. The end will be on
July 7, 2044, completing a period of 30 years. There will be continuous monitoring of the benefits to the
climate, communities and biodiversity, and outcomes will be checked by the CCBA preferably every three
years, throughout the duration of the Project.
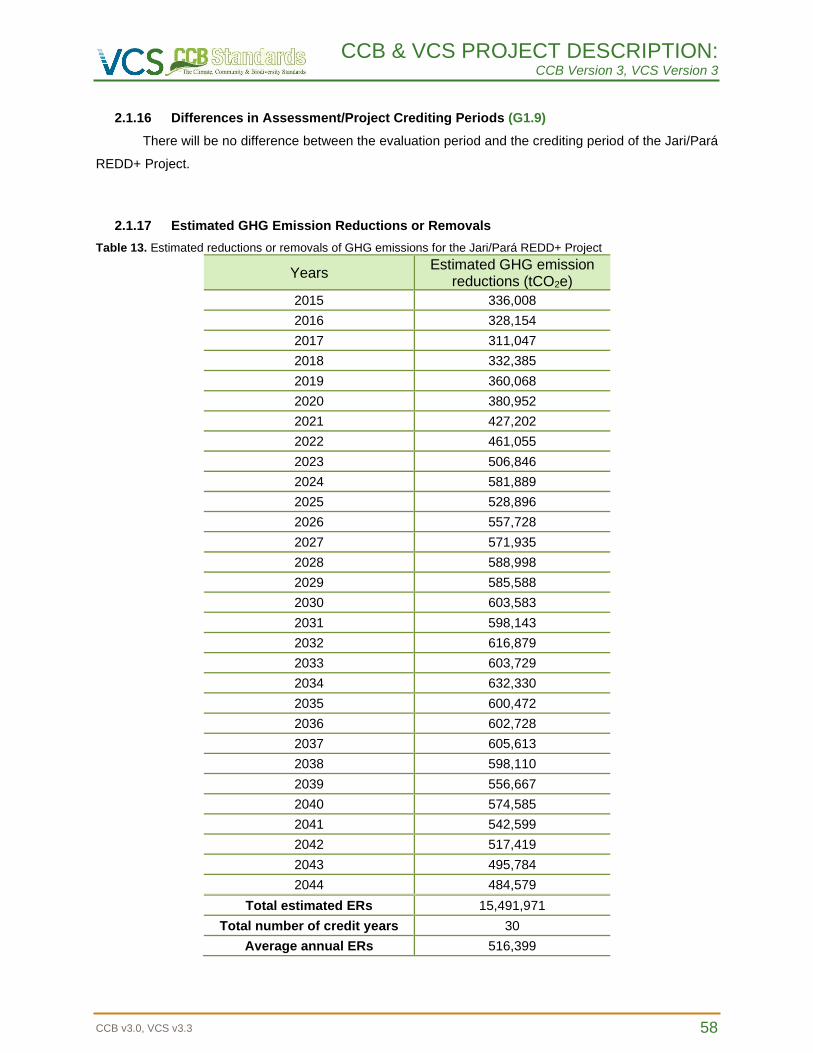
CCB & VCS PROJECT DESCRIPTION: CCB Version 3, VCS Version 3
CCB v3.0, VCS v3.3 58
2.1.16 Differences in Assessment/Project Crediting Periods (G1.9)
There will be no difference between the evaluation period and the crediting period of the Jari/Pará
REDD+ Project.
2.1.17 Estimated GHG Emission Reductions or Removals
Table 13. Estimated reductions or removals of GHG emissions for the Jari/Pará REDD+ Project
Years Estimated GHG emission
reductions (tCO2e)
2015 336,008
2016 328,154
2017 311,047
2018 332,385
2019 360,068
2020 380,952
2021 427,202
2022 461,055
2023 506,846
2024 581,889
2025 528,896
2026 557,728
2027 571,935
2028 588,998
2029 585,588
2030 603,583
2031 598,143
2032 616,879
2033 603,729
2034 632,330
2035 600,472
2036 602,728
2037 605,613
2038 598,110
2039 556,667
2040 574,585
2041 542,599
2042 517,419
2043 495,784
2044 484,579
Total estimated ERs 15,491,971
Total number of credit years 30
Average annual ERs 516,399
CCB & VCS PROJECT DESCRIPTION: CCB Version 3, VCS Version 3
CCB v3.0, VCS v3.3 59
2.1.18 Risks to the Project (G1.10)
Through the “AFOLU Non-Permanence Risk Tool v3.2” tool, it was verified the probable natural
and man-induced risks to the climatic benefits, as reported in the Jari/Pará REDD+ Project Non-
Permanence Risk Report, as summarized in the table below (Table 14).
Table 14. Final score of non-permanence risk for the Jari/Pará REDD+ Project
Category Score
a) Internal Risk 0
b) External Risk
10
c) Natural Risk 1
General Score (a+b+c) 11
The likely risks to the expected benefits to climate, community and biodiversity during the Project
life, as well as their mitigating measures, are described in Table 15.
Table 15. Identification of risks to expected benefits for the climate, communities and biodiversity and their mitigation measures for the Jari/Pará REDD+ Project
RISK MITIGATING MEASURES
Lack of interest from stakeholders, especially communities and public agencies in participating in the Project activities
Strengthening and stimulation for greater involvement of all parties involved in the design and decision-making processes in relation to Project activities through the REDD+ Technical Board and DRP Workshops, in order to foster a sense of belonging. Another extremely important measure is linked to the improvement and dissemination of communication tools already existing among the actors involved, such as the Internal Ombudsman, Information Channels, Feedback System and complaint repair procedures.
Market risk - Difficulty in marketing verified carbon credits
Constant search for new opportunities for financing, business and activities, such as partnerships and donations for direct use in the Project activities (not necessarily linked to the sale of credits). In addition, consolidation and expansion of the commercial contacts network in order to disseminate the Project, for this, Biofílica has a robust commercial sector responsible for developing materials for publicizing the Project, participating in national and international events related to the subject.
2.1.19 Benefit Permanence (G1.11)
In order to maintain and improve the benefits for the climate, community and biodiversity for the
duration of the Project, certain tools have been selected, some of which are already in use and others will
be implemented:
CCB & VCS PROJECT DESCRIPTION: CCB Version 3, VCS Version 3
CCB v3.0, VCS v3.3 60
- Improvement in patrimonial surveillance procedures: through the provision of additional
tools such as remote monitoring of high-resolution satellite images, acquisition of support equipment, and
provision of training to the patrimonial surveillance team, the Project aims to increase efficiency and
reduce costs of patrimonial surveillance operations. In this way the surveillance operations will have a
great increase in the intelligence process related to territorial monitoring and management, which should
directly reflect the maintenance of long-term climatic benefits;
- Sustainable socioeconomic development and social organization: through actions aimed at
strengthening associations and cooperatives, it is expected that organizations will reach a higher level of
organization, enabling the adequate intensification of the marketing of agricultural and extractive
products. In order for these objectives to be achieved, the project must intensify the technical assistance
and rural extension services, as well as offer training aimed at production bias, social organization,
cooperativism, leadership and financial management. In this way, the project must guarantee the long-
term maintenance of the benefits generated, from the generation of autonomy and social empowerment
to seek access to public services and the articulation of partnerships, providing financial and productive
independence of the cooperatives and associations involved.
- Technical assistance and rural extension service (ATER), workshops and training in
agroforestry and agricultural techniques and environmental education actions: through technical
training and qualification in rural production, agricultural and forestry techniques according to family
interest, the rural producer is able to implement adequate agricultural and forestry techniques, enabling
constant production and revenue generation. It is hoped that by the end of the Project communities will be
able to conduct their crops in an effective and self-sufficient manner, to produce food and generate
income without the need to open new areas, perpetuating the benefits to themselves, the climate and
biodiversity. From the optimization of environmental education campaigns for garbage care, cleaning and
maintenance of igarapés/watercourses and fire control. It is expected that more and more communities
adopt the techniques and alternatives passed on to maintain an environmentally healthy space.
- Strengthening of the Fundação Jari: based on the consolidation of Foundation’s activities,
with the implementation of a qualified and sufficient technical team to serve the communities and with the
application of partnerships and lines of action aiming at their financial sustainability. It is hoped that at the
end of the Project the Fundação Jari will consolidate itself as a business-promoting institution based on
sustainable productive chains, moving from the predominantly welfare-oriented characteristic to a bias
towards economic development that results in the generation of consistent and continuous impacts over
the long-term.
- Greater scientific knowledge on Biodiversity and Maintenance of High Conservation
Value Attributes: in addition to providing for the maintenance of native forest cover, supporting the
activities of responsible forest exploitation and providing tools to provide sustainable socioeconomic
development, the Project has as its axis of action the incentive for scientific research. In this way, the
Project will implement a long-term monitoring plan for Biodiversity and HCVAs. These monitoring will aim
CCB & VCS PROJECT DESCRIPTION: CCB Version 3, VCS Version 3
CCB v3.0, VCS v3.3 61
to evaluate impacts, to implement mitigation actions and to increase the scientific understanding of
Biodiversity in the region.
2.1.20 Financial Sustainability (G1.12)
The proponents of the project have a solid partnership signed in 2010 with the objective of
making investments in conservation in the Jari Valley by means of sale of environmental assets. The Jari
Pará REDD+ Project will be the second initiative developed by the partnership between Grupo Jari and
Biofílica, and will make it possible in the medium and long term, the continuous investment of resources
focused solely on conservation and sustainable development in the region.
Considering current carbon market assumptions and the potential for generation of GHG
Emissions Reductions, the financial flow of the Jari Pará REDD+ Project presents quite attractive results.
The Internal Rate of Return (IRR) of the project in its 30-year duration, according to the estimates, should
represent about 50%. The Net Present Value of the project (NPV), when considered a discount rate of
25%, is about 3.6 million reais. In this model, the proponents expect to recover the investment in the fifth
year of the project, when the commercialization of GHG Emissions Reductions will be started.
Other information related to the financial analysis of the Jari Pará REDD+ Project, and financial
health statements of the proponent institutions are considered commercially sensitive information and
were shared with the audit team on a confidentiality basis.
2.1.21 Grouped Projects
Does not apply.
2.2 Without-project Land Use Scenario and Additionality
2.2.1 Land Use Scenarios without the Project (G2.1)
For the determination of the without-project land use scenario (baseline scenario) the approved
methodology VCS VM0015 version 1.1 was used in conjunction with the VCS approved tool "VT0001 -
Tool for the Demonstration and Assesment of Addicionality in VCS Agriculture, Forestry and Other Land
Use (AFOLU) Project Activities, "version 3.0.
The analysis of deforestation, agents, drivers and underlying causes, as well as the probable
without-project land use scenarios were performed based on the baseline scenario, so further details are
found in section 3.1.4 - Baseline Scenario.
CCB & VCS PROJECT DESCRIPTION: CCB Version 3, VCS Version 3
CCB v3.0, VCS v3.3 62
2.2.2 Most-Likely Scenario Justification (G2.1)
The Reference Region, which includes the Project Area, covers an area of 2,522,426 hectares
and has a historical deforestation rate of 6,613 hectares per year between 2000 and 2014 (-0.37% per
year in relation to the area of remaining forest).
Among the realistic and credible alternative land use scenarios that would occur within the
boundaries of the Project in the absence of the AFOLU Project activity recorded in the VCS, were
considered the following:
I) Continuation of land use activities prior to Project (baseline scenario): deforestation is caused by
squatter that settlements in rural areas, as well as being directly linked to expansion projects
for infrastructure and logistics. Between 2000 and 2014 92,575 hectares were deforested in
the Reference Region of Project to install these activities. For the next 30 years, a loss of
182,826 hectares of native forest are projected in the absence of the project, of which 50,480
hectares are expected to be deforested in the Project Area. In this scenario, this process
tends to remain until most of the forest cover is altered, not contributing to the mitigation of
climate change, generating an immeasurable impact on local biodiversity, and further
deepening negative social and economic impacts.
II) Multiple Use Forest Management with REDD+ activities without registration as a VCS AFOLU
Project: in this scenario there is the conduction of sustainable forest management activities
combining logging and other non-timber resources, and, complementary activities to contain
and monitor deforestation caused by deforestation agents, and investments in activities for
community and biodiversity. In order to be effective in implementing a management plan in
this scenario, specific investments are required, such as training of specialized professionals,
investment in technology and intelligence, technical studies specific to REDD, intensification
of patrimonial surveillance, strengthening of local producers associations, improvement of
monitoring of biodiversity, all of these in accordance with the certification standards rules and
procedures, making the forest management practice even more bureaucratic and costly and
not guaranteeing market advantages for the entrepreneur. Therefore, the viability of the forest
management activity is reduced and may become impracticable, without the agregation of the
additional income related from the commercialization of credits registered by VCS.
Detailed information on the land use scenarios proposed by the Project activity can be found in
section 3.1.5 - Additionality.
2.2.3 Community and Biodiversity Additionality (G2.2)
The current scenario, with the absence of the Project, would be limited in generating benefits to
the climate, community and biodiversity. The scenario without the Project tends to progress to increase
illegal exploration activities, conversion of forest areas into unplanned irregular occupations, expansion of
CCB & VCS PROJECT DESCRIPTION: CCB Version 3, VCS Version 3
CCB v3.0, VCS v3.3 63
the area of agriculture and livestock with low productivity and environmental degradation due to the lack
of basic infrastructure to the population, increasing the deforestation pressure in the area covered by the
project and gradually advancing towards the boundaries of the Project Area. This context is better
described in sections 2.3.4 (Community Costs, Risks, and Benefits), Step 3 (Analysis of agents, drivers
and underlying causes of deforestation and their likely future development), 4.1.4 (Without-Project
Scenario: Community) and 5.1.3 (Without-project Scenario: Biodiversity).
The scenario with the development of the Jari/Pará REDD+ Project is positive from a social,
environmental and economic point of view. Sustainable extractivism is an important path for the
conservation of forests and for the economy of local communities and the Project seeks to improve
management techniques, production and control of productive chains. In the area of agriculture and
livestock farming, agroecological production techniques, increased productivity in smaller areas and the
strengthening of production chains can contribute to reductions in environmental impacts, as well as
leveraging socioeconomic improvements for the region's population (CASA DA FLORESTA, 2016).
The role of supporting education in the scenario with the Project is extremely important, once that
access to technical and professionalizing courses should provide better conditions of employment and
income. In addition, incentives to multiple use forest management practices reduce pressures on the
forest (CASA DA FLORESTA, 2016).
The REDD+ Project, through a set of mechanisms, aims to guarantee the permanence of the
forest and consequent conservation of biodiversity, maintenance of ecosystem services, water quality and
climate regulation, once that in the scenario without Project, the forest environment, is heading for the
replace them with more and more anthropogenic areas through deforestation (FEARNSIDE, 2006). In
light of the scenarios presented "with" and "without" REDD+ Project, and through the information
gathered through primary and secondary data, it is evident the importance of the implementation and
development of the Project.
So, considering that the positive impacts of Jari/Pará REDD+ Project are due mainly to avoided
deforestation, improvements in management practices, monitoring of deforestation and biodiversity,
technical assistance and rural extension, patrimonial surveillance and other activities carried out during
the life of the Project, the main community and biodiversity project benefits that would not occur in their
absence are:
For communities:
• Access to technical assistance and rural extension services;
• Creation of new spaces of participation generating opportunities of direct communication with
other interested parties;
• Access to training in agroforestry, finance, agricultural techniques and extractivism;
• Increased knowledge and skills in agroforestry systems, agricultural production and extractivism;
• Generation of an institutional environment favorable to the generation of new businesses;
• Strengthened social organization and communication with new markets;
CCB & VCS PROJECT DESCRIPTION: CCB Version 3, VCS Version 3
CCB v3.0, VCS v3.3 64
• Environmental awareness in waste management, fire control and other low carbon agriculture
techniques.
For Biodiversity:
• Direct action against the loss of habitats and also against the fragmentation by the maintenance
of vegetation cover;
• Promoting fauna and flora biodiversity conservation;
• Mitigation the risks of extinction, guaranteeing genetic diversity;
• Deepening the knowledge of the biota region by the fauna and flora monitoring;
• Mitigation of the potential impacts caused to local biodiversity, key conservation species
(triggers), and high conservation value attributes (HCVs) in the absence of the project.
As described in Section 2.5.7, there are several laws, standards and decrees (federal and state)
that address issues related to conservation of environmental heritage and respect for the rights of
traditional peoples and communities. Among these laws are noted for example the federal laws 13,123
(2015) and 12,651 (2012). However, as described in the common practice scenario, these laws and
regulations are not applied in practice. That is, with regard to the rights of use and access of territories to
traditional peoples and the protection of natural ecosystems and endangered fauna and flora species,
only the existence of such laws has not guaranteed their effective execution.
In addition, the analysis of the scenario without the project demonstrates the existence of
financial, technical and institutional barriers to the implementation of activities that may have positive
impacts such as those mentioned above. For further details on Project additionality for community and
biodiversity can be found in sections 4.1.4 – Without-Project Scenario: Community and 5.1.3 – Without-
Project Scenario: Biodiversity.
2.2.4 Benefits to be used as Offsets (G2.2)
The Jari Pará is not intending to use any other offsets from the community or biodiversity benefits
listed above. The Project aims to produce only offsets related from Emissions Reduced by Avoiding
Deforestation as described in the Section 3 - Climate. For this section it was used the same interpretation
presented by other similar projects already validated by VCS and CCB standards, like “The Southern
Cardamom REDD+ Project”. As stayed above, the additionality for community and biodiversity was fully
demonstrated, however these benefits are not used in another offset program.
CCB & VCS PROJECT DESCRIPTION: CCB Version 3, VCS Version 3
CCB v3.0, VCS v3.3 65
2.3 Stakeholder Engagement
2.3.1 Stakeholder Access to Project Documents (G3.1)
The Jari/Pará REDD+ Project has determined three methods of communication with the parties
involved, aiming to guarantee access to documents and all other information of the Project through oral,
written and virtual form, as described below.
Writing: a printed version of each document related to the Project, such as the Project design
document, monitoring report, validation and verification report and the summary will be available for
consultation at the Fundação Jari office. Information and news about the Project are disclosed in two
Grupo Jari newspapers: Circular Fundação Jari and Circular of the Grupo Jari.
Virtual: documents related to the Project are available through virtual means on the VCS and
Biofílica websites. The circulars of the Foundation and Grupo Jari are also digitally accessible. News and
novelties about the Project will be published in the Biofílica Newsletter through social media.
Oral: information and news about the Project will also be conveyed orally at REDD+ Technical
Board events through meetings between the community council of agricultural communities and
technicians as well as other opportunities for contact between stakeholders and project proponents.
The communities that are not directly involved in the development of the Project, but which are
part of the Project Area, will receive important information about the Project from similar dissemination
tools.
2.3.2 Dissemination of Summary Project Documents (G3.1)
Documents related to the Project are available by virtual means on VCS websites, Biofílica,
Fundação Jari and, Grupo Jari. The circulars of the Foundation and Grupo Jari are also digitally
accessible. News and novelties about the project will be published in the Biofílica Newsletter through
social media Facebook and LinkedIn. In addition, all information and news will be reported orally in the
Technical Boards about REDD+ between stakeholders and Project proponents.
2.3.3 Informational Meetings with Stakeholders (G3.1)
Prior to the implementation of the social activities that directly involve the communities, a
Participatory Rural Appraisal Workshop (DRP in portuguese) was conducted by the proponents of the Jari
Project and Foundation, where information related to the Project was presented in a language appropriate
to the participating public and using mediation techniques. This Workshop was held from 04 to 07 April
2018 with the three community nuclei already described in section 2.1.9 – Stakeholder Description.
In addition, a meeting was held with the technicians of the Fundação Jari on April 9, 2018 to
explain the first results and identify and determine factors relevant to the Project, as well as outlining the
CCB & VCS PROJECT DESCRIPTION: CCB Version 3, VCS Version 3
CCB v3.0, VCS v3.3 66
next steps. The details of the Participatory Rapid Diagnostic Workshop and the meeting with Fundação
Jari technicians are described in the following section (2.3.4 – Community Costs, Risks and Benefits).
And, to complement the public consultation process of the project, during the month of April 2019
extra events were held involving community leaders from Almeirim, Paru River Region and Monte
Dourado to present the project and to open up that the participants could ask questions and make
suggestions, focusing on the expansion and strengthening of communication channels of the REDD+
Project with the stakeholders directly and indirectly impacted by their future actions.
2.3.4 Community Costs, Risks, and Benefits (G3.2)
As mentioned above, a Participatory Rural Appraisal Workshop involving the selected
communities for the Jari/Pará REDD+ Project was carried out (details in section 2.1.9 – Stakeholder
Description) from 04 to 07 April 2018. The activities carried out in the three community nuclei allowed the
analysis of the scenario of these communities through the application of the evaluation of Strengths and
Weaknesses, Opportunities and Threats (called the SWOT matrix), as well as the identification and
prioritization of the problems encountered in these regions.
For the Nova Vida Core and Areas 127 and 60, the analysis showed that the strengths of these
communities are in the production of açai berry, Brazil nut, cassava, among others. Their weaknesses are
concentrated in the absence of organization and community leaders, as well as lack of various services
such as communication and energy. Opportunities include partnerships with municipalities, EMATER and
Fundação Jari, as well as the creation of a local association and the threats are mainly intermediaries,
hunters and fishermen. Thus, the main problems of this community core are identified and prioritized, with
social organization followed by lack of communication and energy, lack of technical assistance and,
finally, difficulties in accessing the market.
The other two cores selected for the Project, the Cafezal, Recreio and Serra Grande core and the
Braço and Bandeira core also presented a scenario analysis. The community of the Cafezal has as an
advantage the union of the community, as well as a strong leadership, but it presents as a disadvantage
the communitarian isolation and schools that only offer until the elementary school. Opportunities are
related to strengthening partnerships and access to new markets, while threats are predatory fishing,
clandestine logging and agricultural pests.
In the case of the Braço & Bandeira nuclei, it was evaluated that the main problems faced by the
communities are related to lack of social organization, lack of technical assistance and lack of
communication and energy. The details of the Participatory Rapid Diagnosis carried out in these nuclei,
as well as the scenario analysis (SWOT analysis) and the identification and prioritization of the problems
for all the selected nuclei for the Jari/Pará REDD+ Project can be consulted in the Final Report of the
Social Consultation Aiming at the Complementation of the Socioeconomic and Environmental Diagnosis
of the Jari/Pará REDD+ Project, available to validators/verifiers.
CCB & VCS PROJECT DESCRIPTION: CCB Version 3, VCS Version 3
CCB v3.0, VCS v3.3 67
The results obtained from the workshops were based on the activity plan presented in the
Jari/Pará REDD+ Project.
In addition, a meeting with the technicians of the Fundação Jari was held on April 9, 2018 at the
Fundação Jari office, and at the time the following points were discussed:
• Presentation of the first results of the workshops held in the communities;
• Identification of the current problems of the Fundação Jari;
• Verification of the agents and drivers of deforestation – validation of the diagnosis of the
Forest House;
• Indication of possible partners for the Project;
• Validation of feedback and conflict management procedures;
• Next Steps and Schedule.
Attending the meeting were the technicians and coordinators of the Fundação Jari who
highlighted their main difficulties in the Project region, among the main points were: i) low number of
technicians; ii) the need for a better qualification of the current technicians; iii) change in the institutional
performance of the Foundation, with a focus on business development for the communities; and iv)
definition of action plans directed to the needs of each community. These demands will serve as the basis
for defining one of the axes of the Project's business plan.
Also, in order to pass on relevant and appropriate information to the communities, Jari/Pará
REDD+ Technical Board should be created with the participation of the stakeholders and community
councils of the communities involved in the Project, in the same way as it was created for the REDD+
Jari/Amapá Project. Appropriate and relevant information on potential costs, risks and benefits to
communities should be provided at the Project and Consultation presentation meetings and during
REDD+ Technical Board meetings. In addition, participation in the Project is voluntary and the decision to
participate, or not, is not definitive nor results in some type of restriction.
2.3.5 Information to Stakeholders on Validation and Verification Process (G3.3)
Participating communities on the Project will be informed about CCB validation and verification to
their community and residence through the REDD+ Technical Chamber. Prior to the event the Fundação
Jari technicians during the field visit period will carry out the mobilization of the communities. For other
communities in the area, the same action will be implemented to promote meeting betwen the parties,
focused on the mobilization of community leaders.
Similarly, for other interested parties, like general public, relevant local institutions, Public
Prosecution and other government agencies other channels will be used as the virtual channels of
Biofílica newsletter for social media such as Facebook and Linkedin, and the sending of informative
submission.
CCB & VCS PROJECT DESCRIPTION: CCB Version 3, VCS Version 3
CCB v3.0, VCS v3.3 68
2.3.6 Site Visit Information and Opportunities to Communicate with Auditor (G3.3)
The visit to the site by the auditor will be informed to the communities and other stakeholders
involved in the Jari/Pará REDD+ Project through the REDD+ Technical Chamber, prior to the event, and
also by Fundação Jari technicians during the field visit period. The communication between communities
and other actors with the auditor, as well as the dissemination of information will be facilitated through
distribution of pamphlets, information in newspapers and virtual channels, at that moment Biofílica
website and newsletter by social media like Facebook and Linkedin, Fundação Jari & Grupo Jari.
2.3.7 Stakeholder Consultations (G3.4)
The articulation between the Jari/Pará REDD+ Project stakeholders began in 2014, after the
signing of the agreement between the proponents (Biofílica and Grupo Jari) that extended the REDD+
Project to the areas of Pará. After the agreement was formalized, the next step was the identification of
actors and partnerships to assist in the development of technical studies for the implementation of the
project, such as research institutions and consultancies. This process was completed in the second half
of 2014 with the definition of the Project proposal, prioritizing a multidisciplinary work model with an
integrated team. With the technical partners defined, workshops were started in May 2015, and were
completed in September 2015, where partial results of the first studies in the area were presented and
initial project activities were designed.
The purpose of this process was to share knowledge between the parties, align the key issues
about the Project, and outline the scope of activities and their causal relationships. During the workshops
the participants were divided into working groups where technical and descriptive points regarding the
certification standards and their requirements regarding Fauna, Flora, Socioeconomic, Physical
Environment, Carbon Inventory and Baseline Determination were discussed. On these working groups
were defined, among the strategic actions for the project, the Field Work Plan and a prior assessment of
communities that would be selected to be directly involved in the first phase of the Project.
After this, between February and April 2018, was conduced the first consultation with the
communities initially selected for the Project, this process gave rise to the document prepared by
Coutinho (2018), where were united the results of socio-economic diagnosis carried out in the field, which
used interviews and meetings "in loco" for collecting information, with the results of participatory
workshops where strengths and weaknesses of stakeholders were listed (communities and technicians of
Fundação Jari), and aligned and related with their potentialities and opportunities, resulted in proposal
actions for each nuclei evaluated. The main results found in this survey that were considered in the
construction of the project are described in section 2.3.4 for each nuclei consulted.
The combination of this information has given origin to the mainly points that are included in the
project activities with regard to direct and indirect impact on communities through the social organization,
technical assistance and rural extension (TARE), strengthening of Fundação Jari and community
CCB & VCS PROJECT DESCRIPTION: CCB Version 3, VCS Version 3
CCB v3.0, VCS v3.3 69
infrastructure, described in section 2.1.11 and Table 10, having with the main purpose stimulating
sustainable economic development through the strengthening associativism and cooperativism, improve
and expand the technical assistance, increase and diversify the productivity, insert new techniques and
production technologies, support to marketing and access to new markets, assist the land regularization,
support to institutional articulations and improve the community infrastructure, the communication process
and the life quality of residents.
With the conclusion of this survey an extra effort was made to expand consultation with the
communities in the region, in addition what was conducted between February and April 2018 with the
selected nuclei. The work was focused on the mobilization as many community leaders as possible to
participate in two events. The first event was held on April 2019 in Almerim, and was attended by
community leaders from the region of Almerim and Parú river. The second event was held at the
headquarters of the Jari Foundation at Monte Dourado and was attended by community leaders from the
region of Monte Dourado. During the meetings was presented to participants the strategies and the
management plan which will be conducted by Fundação Jari and Biofílica along the project. In addition,
was explained the criteria used for choosing the eight communities initially involved in the first phase of
the project, and was clarified that, with the development and expansion of project, new communities can
be included and benefited, leaving open to participants express their interest during the meetings.
The purpose of the meetings was to present the project and opening place to the participants ask
questions and make suggestions to the project design. During the events all the participants had the
opportunity to express their ideas and opinions about the content presented, and from this were made
videos, photos and a report with representatives of the communities (available to VBB team). In this
opportunity the participants have not make requests or suggestions for changes to the proposed Action
Plan, it was only demonstrated the compromise to follow the project progress and willingness of
involvement in the future.
In addition, all of them received the Project folders to distribute in their respective communities.
Another initiative carried out with the purpose of increasing the dissemination of the project to the public
in the region was the publication of an article in the regional newspaper announcing the holding of the
meetings.
Concluding these actions, in 2018, 8 communities had been consulted and with the actions of
2019 this value increased to 53. But, unfortunately, it was not possible to consult all the communities
present in the Project Zone due to limitations of resources and logistics. Anyway, the REDD+ project
maintains the important commitment to increase the actions of the Fundação Jari to reach even more
communities during the Project life time.
In addition to these events, the expansion of the stakeholder consultation was reinforced by
sending of letters and e-mails to the relevant local institutions in the states of Pará and Amapá, among
others with direct and indirect involvement on the forest conservation sector, such as trade unions, Non-
Governmental Organizations (NGOs), private sector, State Public Prosecution and other government
CCB & VCS PROJECT DESCRIPTION: CCB Version 3, VCS Version 3
CCB v3.0, VCS v3.3 70
federal and state agencies, where updated information was presented about the project status and the
communication channels used (e-mails and contact phones). The most part of institutions confirmed the
receipt of the information (available to VVB team), but until the final preparation of the project document
no comments have been recorded.
With the Project Design Document was fully completed, a printed and digital version of the
document and an executive summary in Portuguese were sent to the Fundação Jari, which provided an
agenda for presentation, discussion and submission of the abstract to stakeholders. The presentation
was conducted in the format of a workshop for the communities of the Project Zone with the presence of
main leaders, with the responsibility of discussing and directing the doubts regarding the progress of the
activities.
2.3.8 Continued Consultation and Adaptive Management (G3.4)
A communication plan should be developed from the construction of the Technical Chamber to
continue communication and consultation between Project proponents, communities and other
stakeholders. The same design of the Jari/Amapá REDD+ Project communication plan will be used,
which had the following structure:
• Main communication channel: through a technical board, created at a meeting of the Technical
Council, the board is the Project official dialogue space and articulation between the
communities and other interested parties, which meets at least twice a year. All the results,
demands and considerations about the progress of the Project are taken to this space;
• Members of the Technical Board: the members of the Technical Board are representatives of
the institutions interested in the Project, along the representatives of the communities involved;
• Definition of Frequency of meetings: at least twice a year. The first meeting of the year has as
main objective to discuss the activities implemented in the previous year and to discuss the
work plan for the beginning of the year. The second, usually in the second semester, is mainly
to monitor the implementation of the proposed work plan for the year and the prospects until its
completion;
• Invitation strategy: all interested and proponents are invited by email and direct phone call.
Community representatives are invited through phone calls and direct contact.
Adaptations to this communication plan should be made to the Jari/Pará REDD+ Project, as
already identified in the field trip, to include the community councils of the communities that will participate
in the Technical Chamber.
CCB & VCS PROJECT DESCRIPTION: CCB Version 3, VCS Version 3
CCB v3.0, VCS v3.3 71
2.3.9 Stakeholder Consultation Channels (G3.5)
The activities of the Project are delineated and implemented considering the wishes,
characteristics and limitations of each community as defined and verified during the DRP Workshops, the
events of the REDD+ Technical Chamber and the Technical Assistance and Rural Extension Service
(ATER).
As described in section 2.3.4 – Community Costs, Risks and Benefits, Workshops (DRPs) and
meetings between the communities and the project proponents have already been held. This
communication and accessibility for discussion on the progress of Project activities between stakeholders
and proponents will occur continuously throughout the duration of the Project through various channels:
Technical Chamber on REDD, visits of agricultural technicians through Technical Assistance and Rural
Extension (ATER), Information Channels and Feedback and Procedures for Complaints Repairing and
Internal Ombudsman.
2.3.10 Stakeholder Participation in Decision-Making and Implementation (G3.6)
The processes related to decision-making and implementation, as well as the various activities
related to the Project, is open to community participation. As already mentioned, involvement in the
design, implementation, monitoring and evaluation of the Project takes place through the presentation
and consultation meetings, Technical Assistance and Rural Extension Service (ATER), DRP Workshops,
REDD+ Technical Chambers, Information Channels and Feedback and Complaint Repair Procedures
and Internal Ombudsman, in which all interested communities have the opportunity to participate.
Due to historical and cultural issues, it is noted that in relation to productive decisions of the
family, women and young people have a small participation. Rural technicians are always advised to
include men and women, when this is the family configuration, in all activities in order to increase the
participation of women in these decisions. For the inclusion of young people, the Foundation started a
work called "Young Agroextractivist Agent", aiming to empower young people with technical knowledge
on issues applicable to their day to day. Finally, activities will be carried out to include gender and
vulnerable populations as part of the resources of the Social-Environmental Agreement.
2.3.11 Anti-Discrimination Assurance (G3.7)
The Grupo Jari has a solid culture about policy of human rights and social responsibility, being a
group that respects, protects and supporting human rights. The description of this position is found in its
internal norms such as the “Política Integrada do Grupo Jari” and the “Código de Conduta - Princípios e
Normas de Gerais de Conduta”.
The “Código de Conduta - Princípios e Normas de Gerais de Conduta” is intended to guide and
direct the attitude of all employees of the Grupo Jari in relation to contact with internal, external and
CCB & VCS PROJECT DESCRIPTION: CCB Version 3, VCS Version 3
CCB v3.0, VCS v3.3 72
community audiences. This document is based on principles protected by transparency and ethics, by
local, state and federal laws, by international treaties and conventions, such as the Universal Declaration
of Human Rights, the International Labor Organization and United Nations Conventions. There are a
number of issues addressed in this document, such as ethical values and law, conflicts of interest, human
rights, the environment, practices in the work environment, external audiences, among others, being
addressed, among others, issues such as discrimination of any kind and sexual and moral harassment.
Commitment to the life, health and safety of workers is paramount, and any discrimination of
race, color, nationality, age, religion, sexual orientation, mental or physical disability, moral or sexual
harassment is not permitted. This document also does not allow the exploitation and use of child labor,
consumption or possession of illegal drugs or alcoholic beverages in the working environment and
carrying of weapons of any kind in the premises of the company.
The Grupo Jari provides an internal communication channel, where complaints and
manifestations on issues related to this document and working relationships can be made. In this way, it
is sought to ensure that the norms described as well as the “Política Integrada do Grupo Jari” are
employed and that human rights are respected. Communication with employees is done through
suggestion boxes made available at strategic points in service providers. The Environmental Quality and
Management team collects these boxes monthly, records and analyzes, sending the operation managers
a report containing the demands of the service providers for decision making as needed.
2.3.12 Feedback and Grievance Redress Procedure (G3.8)
The Jari/Pará REDD+ project feedback process and complaint repair is based on the same
guidelines implemented in the Jari/Amapá REDD+ Project, considering that the Grupo Jari conflict
management policy has not undergone significant changes or adaptations, as well as the implemented
tools presented a positive and effective result in the communication and resolution of complaints or
problems arising from the Project.
To this end, the Grupo Jari has a methodology for managing opposition of interests directly
related to the rural communities existing in the limits or surroundings of the Group's areas, described in
the document called “Gestão de Conflitos”. It describes the procedures taken in the case of complaints,
dissatisfaction, disagreement and confrontation of opinions regarding land, environmental or social
issues.
Complaints are forwarded by a committee composed of representatives of the Fundação Jari and
the institutional relations, land tenure and legal management departments of the Grupo Jari, and include
verification of the veracity of the information, conflict classification, verification of recidivism of the
complaint and survey of possible or future impacts for the Grupo or communities operation. The case is
analyzed by the committee, which decides on referrals and definition of strategy for the solution of the
occurrence. The search for a consensus between the parties is always the main objective. In case of non-
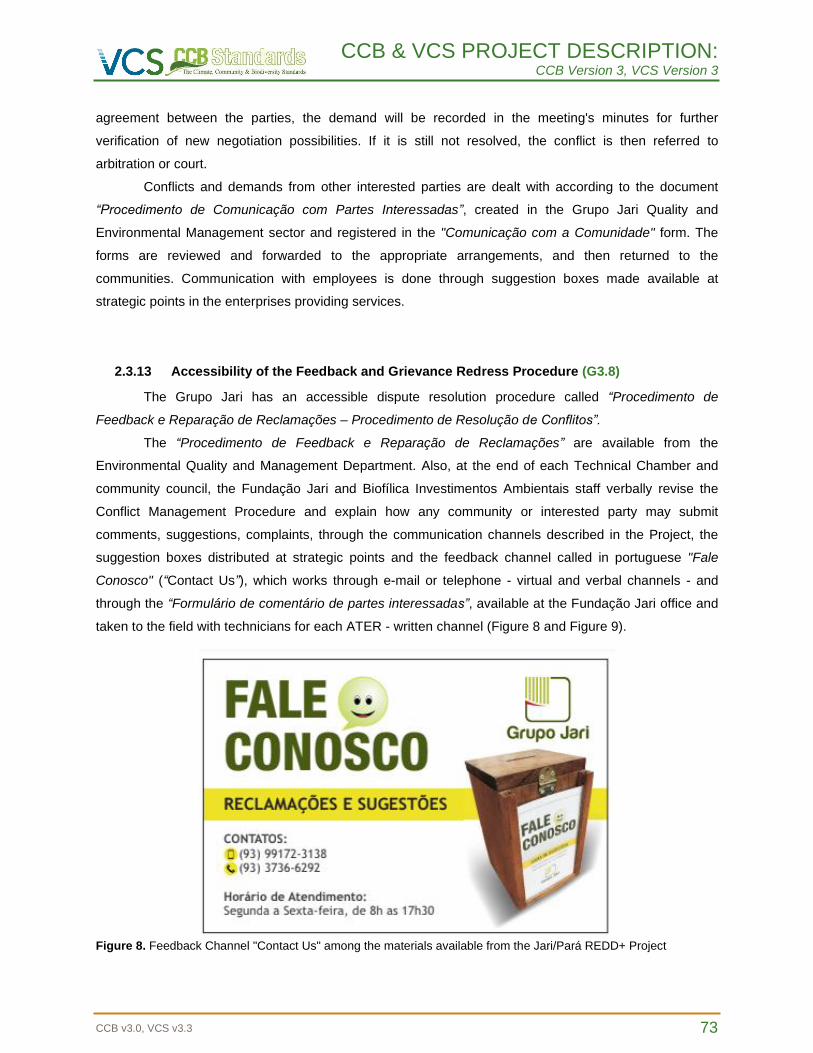
CCB & VCS PROJECT DESCRIPTION: CCB Version 3, VCS Version 3
CCB v3.0, VCS v3.3 73
agreement between the parties, the demand will be recorded in the meeting's minutes for further
verification of new negotiation possibilities. If it is still not resolved, the conflict is then referred to
arbitration or court.
Conflicts and demands from other interested parties are dealt with according to the document
“Procedimento de Comunicação com Partes Interessadas”, created in the Grupo Jari Quality and
Environmental Management sector and registered in the "Comunicação com a Comunidade" form. The
forms are reviewed and forwarded to the appropriate arrangements, and then returned to the
communities. Communication with employees is done through suggestion boxes made available at
strategic points in the enterprises providing services.
2.3.13 Accessibility of the Feedback and Grievance Redress Procedure (G3.8)
The Grupo Jari has an accessible dispute resolution procedure called “Procedimento de
Feedback e Reparação de Reclamações – Procedimento de Resolução de Conflitos”.
The “Procedimento de Feedback e Reparação de Reclamações” are available from the
Environmental Quality and Management Department. Also, at the end of each Technical Chamber and
community council, the Fundação Jari and Biofílica Investimentos Ambientais staff verbally revise the
Conflict Management Procedure and explain how any community or interested party may submit
comments, suggestions, complaints, through the communication channels described in the Project, the
suggestion boxes distributed at strategic points and the feedback channel called in portuguese "Fale
Conosco" (“Contact Us”), which works through e-mail or telephone - virtual and verbal channels - and
through the “Formulário de comentário de partes interessadas”, available at the Fundação Jari office and
taken to the field with technicians for each ATER - written channel (Figure 8 and Figure 9).
Figure 8. Feedback Channel "Contact Us" among the materials available from the Jari/Pará REDD+ Project
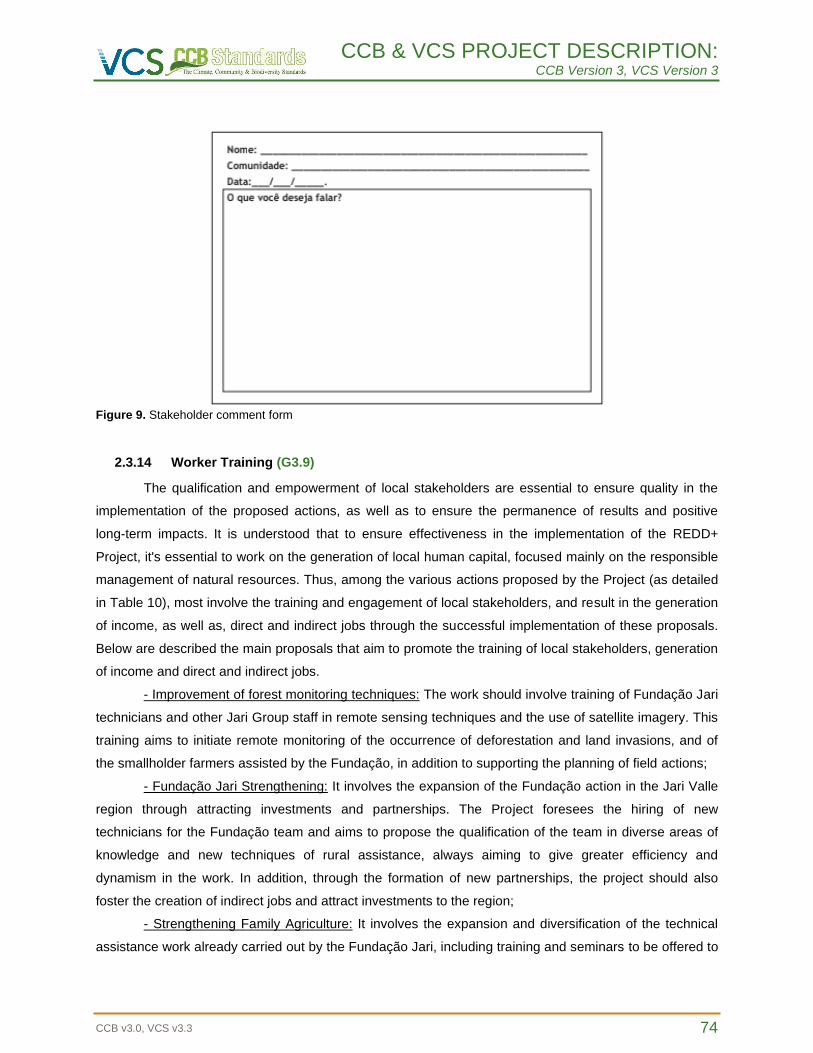
CCB & VCS PROJECT DESCRIPTION: CCB Version 3, VCS Version 3
CCB v3.0, VCS v3.3 74
Figure 9. Stakeholder comment form
2.3.14 Worker Training (G3.9)
The qualification and empowerment of local stakeholders are essential to ensure quality in the
implementation of the proposed actions, as well as to ensure the permanence of results and positive
long-term impacts. It is understood that to ensure effectiveness in the implementation of the REDD+
Project, it's essential to work on the generation of local human capital, focused mainly on the responsible
management of natural resources. Thus, among the various actions proposed by the Project (as detailed
in Table 10), most involve the training and engagement of local stakeholders, and result in the generation
of income, as well as, direct and indirect jobs through the successful implementation of these proposals.
Below are described the main proposals that aim to promote the training of local stakeholders, generation
of income and direct and indirect jobs.
- Improvement of forest monitoring techniques: The work should involve training of Fundação Jari
technicians and other Jari Group staff in remote sensing techniques and the use of satellite imagery. This
training aims to initiate remote monitoring of the occurrence of deforestation and land invasions, and of
the smallholder farmers assisted by the Fundação, in addition to supporting the planning of field actions;
- Fundação Jari Strengthening: It involves the expansion of the Fundação action in the Jari Valle
region through attracting investments and partnerships. The Project foresees the hiring of new
technicians for the Fundação team and aims to propose the qualification of the team in diverse areas of
knowledge and new techniques of rural assistance, always aiming to give greater efficiency and
dynamism in the work. In addition, through the formation of new partnerships, the project should also
foster the creation of indirect jobs and attract investments to the region;
- Strengthening Family Agriculture: It involves the expansion and diversification of the technical
assistance work already carried out by the Fundação Jari, including training and seminars to be offered to
CCB & VCS PROJECT DESCRIPTION: CCB Version 3, VCS Version 3
CCB v3.0, VCS v3.3 75
actors involved in various topics, for example, the themes mentioned in item "Strengthening Family
Agriculture and Sustainable Extractivism" of Table 10, but the application of this actions proposed will
depend mainly on the Work Plan that will be prepared annually;
- Social Organization: It involves the offering of seminars and training focused on the theme, with
the objective of supporting the formation and structuring of community associations and cooperatives.
This work aims to promote income generation and sustained economic development for these actors
through the collective organization of their community centers;
- Training of local stakeholders for biodiversity monitoring: It involves providing training for
community members so that, once expressed interest, they engage in biodiversity monitoring work. It also
provides training for inventory of forest species of socioeconomic interest, such as Brazil Nut, Andiroba,
among others, aiming at assessing economic potential for structuring community productive chains.
These trainings should be essential for these individuals, since that, by a successful engagement
process, it will allow them to be the main actors for maintaining and monitoring the resources that will be
enjoyed by their own communities.
Aiming to guarantee the efficiency and permanence of these actions listed above, the proponents
should implement well-designed hiring process as well as survey of best technics and procedures to drive
the trainings for the technicians’ team. Always looking to ensure a successful qualification to the team to
work with communities and the meeting the project goals. These processes will follow all the relevant
laws and regulations related to worker’s rights, as described in the section 2.3.16, bringing engagement
to the team to meet the project schedule and goals, aiming to optimize the investments and avoid loss of
human capital due to staff turnover. Other measures adopted to avoid loss of acquired capacity will be the
constant registration and report of procedures and monitoring of results acquired, since that, in a case of
staff turnover, the procedures could be easily reproduced, mitigating impacts in the implementation of the
project plan.
All activities are open to the participation of all residents of the Project's working communities,
except for the REDD+ Technical Chamber, where the community has one (or more) member as a
nominated representative. The participation of women, young people and marginalized people are
stimulated by the Fundação technicians, as well as the allocation of part of the resources of the Social-
Environmental Agreement to include these less favored groups (inclusion of gender, youth and vulnerable
populations).
2.3.15 Community Employment Opportunities (G3.10)
The employment opportunities offered by the Project are equal to those of the surrounding
communities, encompassing all the positions, including management positions, if the requirements for the
vacancy are fulfilled. All work positions generated locally by the Project follow the parameters and
guidelines of a procedure called “Recruitment and Selection System” (Sistemática de Recrutamento e
CCB & VCS PROJECT DESCRIPTION: CCB Version 3, VCS Version 3
CCB v3.0, VCS v3.3 76
Seleção in Portuguese), belonging to the Grupo Jari, which has the main objective of establishing criteria
for the recruitment and selection process, allowing transparency and effectiveness for all involved.
Criteria of race, gender, sexual orientation, color, religion, age, ethnic origin, physical or mental
disability or social class are not adopted. All steps of selection processes, as well as the hiring of the
professional, will be based on the criteria established in the description of positions offered and a
minimum qualification is desirable. It should be noted that the Project proponents already have teams
composed mainly of people from the Vale do Jari region, which highlights that the project will only
reinforce the actions already taken in this regard.
Therefore, every selection process that takes place has as its default starting with the internal
recruitment program, which seeks candidates suitable for open positions among employees already
hired. If the vacancy does not fill internally, the recruitment and selection will be returned to the external
process, where selection processes are developed, applying the necessary and appropriate assessment
tools to each vacancy.
Beyond these processes, proponents have a culture that aims to standardize and balance the
selection of employees, including young people, new employees and former employees who will take on
new positions. This program has four distinct procedures such as internship program (youth), admission
and integration procedure (new employees), internal recruitment program (for new positions) and
systematic training.
The selection process is conducted by the human resources area, where candidates are
submitted to specific evaluations of the position in question, and the results obtained from these steps will
be referred to the sectors responsible for request of hiring and the definitive selection of candidates
identified as suitable to fill the vacancy will be realized.
2.3.16 Relevant Laws and Regulations Related to Worker’s Rights (G3.11)
It is ensured that all employees belonging to Grupo Jari, Biofílica, and service providers are
legally hired in compliance with Brazilian labor legislation. In addition, international agreements ratified by
Brazil and issues related to worker well-being are respected.
Annually, it is verified the compliance with the norms and labor laws applied by Biofílica by an
audit, this is due to the fact of being a limited liability company. Its financial statements are published on
the Jus Brasil website, the largest open and legal community in Latin America.
After hiring and before the beginning of the worker's activities, there are training and qualification
on technical procedures and the promotion of empowerment regarding their rights and applicable laws. In
addition, employees are directed to join the institution responsible for their rights, the respective unions to
the area of work.
The pertinent laws and regulations that protect workers' rights in Brazil, as well as the
international agreements ratified by Brazil on labor issues, are listed below.
CCB & VCS PROJECT DESCRIPTION: CCB Version 3, VCS Version 3
CCB v3.0, VCS v3.3 77
Federal Legislation and Regulations
- Decree-Law No. 5,452, of May 1st, 1943: Approves the Consolidation of Labor Laws.
- Law No. 6,514, of December 22nd, 1977: Amendments to Chapter V of Title II of Consolidation
of Labor Laws, on occupational safety and medicine and other measures.
International agreements ratified by Brazil
- Convention of the International Labor Organization No. 29 of 1930, ratified by Brazil on
April, 25, 1957: Provides for the abolition of forced labor.
- International Labor Organization Convention No. 87 of 1940: Provides for freedom of
association.
- Convention of the International Labor Organization No. 97 of 1949, ratified by Brazil on
June 18, 1965: Provides for migrant workers.
- Convention of the International Labor Organization No. 98 of 1949, ratified by Brazil on
November 18, 1952: Provides for the right to organize unions and collective bargaining.
- Convention of the International Labor Organization No. 100 of 1951, ratified by Brazil on
April, 25, 1957: Provides for equal pay for men and women.
- International Labor Organization Convention No. 105, ratified by Brazil on June 18, 1965:
Provides for the abolition of forced labor.
- Convention of the International Labor Organization No. 111 of 1958, ratified by Brazil on
March, 01, 1965: Provides for discrimination in respect of employment and occupation.
- Convention of the International Labor Organization No. 131 of 1970, ratified by Brazil on
May, 04, 1983: Provides for minimum wage setting, especially in developing countries.
- Convention of the International Labor Organization No. 138 of 1973, ratified by Brazil on
June, 28, 2001: Provides for the minimum age for admission.
- Convention of the International Labor Organization No. 142 of 1975, ratified by Brazil on
November, 24, 1981: Provides for the development of human resources.
- International Labor Organization Convention No. 143 of 1975: Provides for illegal
immigration and the promotion of equal opportunities for migrant workers.
- Convention of the International Labor Organization No. 155 of 1981, ratified by Brazil on
May, 18, 1992: Provides for the workers safety and health.
- Convention of the International Labor Organization No. 169 of 1989, ratified by Brazil on
July, 25, 2002: Provides for indigenous and tribal rights.
- International Labor Organization Convention No. 182, ratified by Brazil on February 02,
2000: Provides for the prohibition of the worst forms of child labor and immediate action for its elimination.
CCB & VCS PROJECT DESCRIPTION: CCB Version 3, VCS Version 3
CCB v3.0, VCS v3.3 78
2.3.17 Occupational Safety Assessment (G3.12)
An important component of the Project involves the strict care with the workers safety,
considering the internal regiment and the official norms instituted by the federal and state governments.
The Grupo Jari has a complex quality management system, “Política Integrada do Grupo Jari”, in which
all activities carried out by the company are described through operational procedures, work instructions
and environmental procedures. all procedures are reviewed and updated annually. the activities related to
forest management are those that may pose some risk to the health and safety of the operating
employees.
The monitoring is performed by a specialized work safety team that evaluates the activities in its
occupational, operational and environmental safety aspects. During the period of the activities, the
technicians actively circulate in the areas and intercede alerting any irregularities and/or problems.
As described previously, there is a system of annual trainings and qualification aimed at
preparing own and third-party employees engaged in forest management activities (section 2.3.14). In
addition to the training, all personnel involved receive personal (helmets, boots, leggings, ear protectors,
gloves, among others) and collective (tents, when necessary) protective equipment.
Through internal rules and improvements in occupational health and safety practices, all positions
and situations that could provide some type of occupational hazard were profoundly avoided and
mitigated. Other relevant tools are reported in the following procedures and manuals:
• Task Risk Analysis (ART)
• Areas of Expertise
• Security Dialog
• Risk Management
• Occupational Health and Safety Management
• Safety Inspection – IS
• Planned Observance of Unsafe Acts – OPAI
• Hazards and Risks - Accidents
• Plan for Emergency Care
• Procedure for emergency response
As an addition to the manuals, procedures and standards, there is always the disclosure
organized by the Grupo Jari of safety alerts relevant to the climate and the season, such as insects and
venomous animals.
CCB & VCS PROJECT DESCRIPTION: CCB Version 3, VCS Version 3
CCB v3.0, VCS v3.3 79
2.4 Management Capacity
2.4.1 Project Governance Structures (G4.1)
The project will be managed by Biofílica, Fundação Jari and Jari Celulose, the the obligations of
the parties are described below:
- Biofílica Responsibilities: general coordination of socioeconomic and environmental
diagnostics (DSEA) and baseline and carbon stock studies; development and financing of the
PDD (Project Design Document); remote monitoring of forest cover and
implementation/coordination of additional actions aimed at reducing/mitigating greenhouse
gas emissions (GHG); validation/verification and commercialization of credits; co-management
of the Project throughout its duration.
- Fundação Jari Responsibilities: responsible for the Project co-management, as well as all
related activities such as environmental and social management of the Project to reduce
negative impacts and to generate positive ones, provide support in infrastructure and logistics
for Biofílica and other professionals involved in the project. In addition, to being responsible for
the development of social activities and for the social management of the Project.
- Jari Celulose Responsibilities: responsible for the Project co-management, for the operation
low-impact forest management in Jari's properties, provide support in infrastructure and
logistics for Biofílica and other professionals involved in the project, owner of the land and
responsible for land security and patrimonial surveillance.
During the project development other entities were involved to develop studies on the Project
Area, their responsibilities are described below:
- Casa da Floresta Assessoria Ambiental: development of studies to characterize the physical
environment and evaluation of the region's biodiversity, as well as the development of the
socio-economic data of the Jari/Pará REDD+ Project.
- Harmonial Socioambiental: realization of social consultation for socioeconomic and
environmental diagnosis and socioeconomic module.
- Florestal Recursos Manejo Brasil Consultoria e Assessoria Ltda. (FRM BRASIL): elaboration
of the forestry carbon stock estimate study of the REDD + Project Jari Pará.
- BRGEO: collaborate in the elaboration of the project baseline through the definition of the
spatial and temporal limits, as well as in the elaboration of the baseline model.
With this, it is understood that the Project has satisfactory human and financial resources for the
effective development and implementation of activities.
CCB & VCS PROJECT DESCRIPTION: CCB Version 3, VCS Version 3
CCB v3.0, VCS v3.3 80
2.4.2 Required Technical Skills (G4.2)
The key technical skills required to implement the Jari/Pará REDD+ Project are knowledge about
development and management of forest conservation projects in Amazon biome, experience in
implementing, development and assisted of programs for agroextractivist communities and
implementation of effective land security and patrimonial surveillance. All the proponents involved in the
project have the technical skills required for the successful completion of the Jari/Pará REDD+ Project.
Biofílica Investimentos Ambientais is a Brazilian company that promotes the management of
forest areas in the Amazon biome. The company has a specialized team and is a reference in the
development of forest conservation projects, guaranteeing the quality and effectiveness of developed
REDD+ activities. The company aims to reduce deforestation and carbon emissions into the atmosphere,
conserve biodiversity and water resources, and promote the social inclusion and development of
communities living in the Amazon biome through the sale of credits for environmental services,
development and financing of scientific research activities and the development of sustainable business
chains. Biofílica aims to make environmental conservation an economically interesting activity for forest
owners, communities and investors.
The Fundação Jari is the social enterprise of the Grupo Jari which, together with a vast network
of partners, develops programs and projects in the areas of education, health, human rights, environment,
culture and employment and income generation. Since 1994, reached more than 6.8 million assistance
services in Brazil, counting the units outside the Jari Valley that already existed, and has a history of
acting in the region and expertise in the design and implementation of socioeconomic development
activities. The Fundação Jari has great contribution in the execution and management of social activities,
guaranteeing the inclusion of the communities in the activities of the Project and in the activities of
Technical Assistance and Rural Extension (ATER).
Jari Celulose S.A. is a company of the Grupo Jari that has two divisions: Cellulose Division, which
produces bleached eucalyptus pulp and the second is the Paper and Packaging Division serving almost
all economic segments. In the project, acts as owner of the land and responsible for land security and
patrimonial surveillance.
It is also important to highlight that Jari Celulose has a land surveillance team in the area that
monitors the property, to constrain land speculation and invasion of land and, upon the occurrence of an
invasion, it makes an official complaint to the police informing of the invasion of the private property,
which is sent to the company legal department for applicable measures, and also denounces
environmental crimes to the Brazilian Environment and Renewable Natural Resources Institute (IBAMA).
2.4.3 Management Team Experience (G4.2)
Below is the project Management team members’ experience:
CCB & VCS PROJECT DESCRIPTION: CCB Version 3, VCS Version 3
CCB v3.0, VCS v3.3 81
Biofílica Investmentos Ambientais
Proponent: Plínio Ribeiro – Executive Director
Plínio Ribeiro has a degree in Business Administration from Instituto de Ensino e Pesquisa - INSPER and
a master’s degree in Public Administration and Environment from Columbia University and the Earth
Institute (USA). He participated in several conservation projects on the lower Rio Negro, through the
Instituto de Pesquisas Ecológicas – IPÊ since 2005, and was one of the producers of Jean Michel
Cousteau's documentary "Return to the Amazon". He works for Biofílica since 2008, where he has already
leaded Project, Operations and Business Management. Currently, he is the Executive Director and
shareholder of the company.
Proponent: Cláudio Padua – Scientific Director
Cláudio Pádua has a degree in both Business Administration and Biology, a master’s degree in Latin
American Studies and a PhD in Ecology from the University of Florida in Gainsville (USA). A retired
professor from the University of Brasilia, Pádua is currently the dean of the Escola Superior de
Conservação e Sustentabilidade and the vice-president of the Instituto de Pesquisas Ecológicas (IPÊ). He
is also a Senior Associate Researcher at the Center for Environment and Conservation Studies at
Columbia University (USA) and an International Conservation Director at the Wildlife Trust Alliance, as well
as an advisor to the Brazilian Biodiversity Fund (FUNBIO) and WWF Brazil. Pádua represents Brazil before
the International Advisory Group (IAG) of the G7 Pilot Program. In 2003, together with his wife, Suzana
Pádua, he was appointed by Time Magazine a "Hero of the Planet" for his activities on behalf of
biodiversity conservation. Between 1997 and 2007, he won six conservation awards, and three national
and three international ones. Pádua has published two books and over 30 papers in scientific journals,
both national and international. Since 2008 directs the involvement and scientific production of Biofílica as
Scientific-Director and advisor.
Paula Conde – Financial anda Administrative Analyst
Paula Conde has a degree in Business Administration from São Luís - PUC and post graduate degree in
Accounting and Financial Managment from FAAP. She has large experience, most of it in one of the
largest media and educational group in Latin America – Editora Abril, where she worked with Finance
Control and Reporting, Treasury, Accounting and Financial Reconciliation, Accounts Payable &
Receivable and Royalties. At Biofílica, she is responsible for administrative and financial activities,
logistical support to the team and to projects.
Caio Gallego – Project Coordinator
Caio Gallego is a Forest Engineer graduated from ESALQ-USP. Specialist in geoprocessing and remote
sensing aimed at environmental conservation area, mapping and analysis of changes in land use. Has
knowledge facing the Sustainable Forest Management, environmental modeling and the use of
CCB & VCS PROJECT DESCRIPTION: CCB Version 3, VCS Version 3
CCB v3.0, VCS v3.3 82
alternative GIS for forestry and agribusiness. Has advanced knowledge in the use of GIS softwares and
analysis of change on the land use and land cover as ArcGIS, QuantumGIS and DinâmicaEGO.
Luana Cordeiro – Projects Analyst
Luana Cordeiro is a Forestry Engineer graduated from USP – ESALQ and Technical in the Environment
formed by the State Technical School of São Paulo. During the graduation was coordinator of the
environmental suitability group of Campus Piracicaba in the planning, implementation and monitoring of
restored areas, and coordinator of the social entrepreneurship group Enactus, developing social projects
in Piracicaba (SP). Developed in her project a Model of Solid Waste Management Plan for Sawmills of
Native Species, focusing on the sustainable production of the timber sector in the Amazon.
Fernanda dos Santos Rotta – Legal aspects
Fernanda is bachelor’s in law from Mackenzie University with MBA in Sustainability Management from
FGV-EAESP and specialization in Administrative Law from PUC/COGEAE. Fernanda studied at the
universities of Siena (Italy) and Vermont (USA), in the fields of international environmental law,
conservation and sustainability. At Biofílica, she has a strong presence in projects and cases focused on
the implementation of the New Forest Code, REDD+ mechanisms and climate and forest policies. She
has worked in highly reputed law firms (Mattos Filho Advogados and Nascimento e Mourão Advogados)
in the areas of environmental law and real estate, and was a trainee at Instituto Socioambiental, in the
environmental law area. Also participated in the compilation of projects and legislative analysis by Centro
de Estudos em Sustentabilidade (GVces) on the theme Adaptation to Climate Change and by the
International Finance Corporation - IFC on the subject of biodiversity and benefit sharing (ABS), among
others.
Fundação Jari
Proponent: Jorge Rafael de Almeida – Social management
Rafael holds a full degree in Pedagogy from Universidade Federal do Pará and initiated his post-
graduation in Cooperative Production Management from Universidade Federal Rural de Pernambuco. He
works for Grupo Jari since 2007 as the Coordinator of Social Operations of Fundação Jari, former
Fundação Orsa, at Jari unit, leading the management of corporate social responsibility programs of Grupo
Jari in the Jari region.
Jari Celulose
Augusto Praxedes Neto – Project management and Institutional Relations and Sustainability
Augusto Praxedes has a dregree in Business Administration and graduation in Expertise in Auditing and
Environmental Management. He has 30 years of experience in agroforestry activities in the Amazon,
specifically in the Valley of Jari. He works with Institutional and Governmental Relations for Grupo Jari
CCB & VCS PROJECT DESCRIPTION: CCB Version 3, VCS Version 3
CCB v3.0, VCS v3.3 83
since the Group assumed control of Jari Celulose’s shares, in 2000. He is responsible for the management
of the certifications ISO 9001, ISO 14001 and FSC for forest activities, as well as licensing and
environmental monitoring. For two years he has been a member of the economic chamber of FSC Brasil,
he is president of the Certified Producers Association from Amazon and representative of Grupo Jari in the
Sustainable Amazon Forum (FAS, in Portuguese).
Paulo Roberto da Silva – Patrimonial security and land tenure
Business manager, he is post graduated in Corporate Security Management by Universidade Gama Filho
and has MBA in Environmental Survey, Auditing and Management by Faculdade Oswaldo Cruz. He works
for Jari Celulose, Papel e Embalagens since 1984, where he has been leading the Corporate and Land
Tenure Security area. Currently, he is the Manager of Forest Control, Land Tenure and Security of Grupo
Jari in the Jari region, being responsible for the areas of industrial operations, natural forests and
plantations within a total of 1,300,000 hectares, in Para and Amapá States.
2.4.4 Project Management Partnerships/Team Development (G4.2)
Does not apply.
2.4.5 Financial Health of Implementing Organization(s) (G4.3)
Biofílica Investimentos Ambientais is a Brazilian company with 10 years of experience in the
environmental assets market, has a diversified line of business, and investors who support the company's
business.
The Grupo Jari has expanded its operations since its creation in 1981, demonstrating its excellent
management capacity and financial health. To ensure continued success, the Group completed the
conversion of the cellulose plant to the production of Dissolving Wood Pulp (DWP), a commodity that has
a market price significantly higher than cellulose for paper.
The supporting documents of the financial health of both companies are classified as
Commercially Sensitive Information and were shared with the audit team on a confidential basis.
2.4.6 Avoidance of Corruption and Other Unethical Behavior (G4.3)
Biofílica Investimentos Ambientais supports annual financial auditing processes ensuring that
your resources are allocated responsibly and free of corruption. The financial statements and minutes of
meetings related to the company are published on JusBrasil’s website, the largest open and legal
community in Latin America.
CCB & VCS PROJECT DESCRIPTION: CCB Version 3, VCS Version 3
CCB v3.0, VCS v3.3 84
Like the Biofílica, the Grupo Jari does not tolerate any kind of corruption such as kickbacks,
bribes, nepotism, favors, fraud, favoritism, extortion, money laundering, among others, and has a “Política
de Direitos Humanos e Responsabilidade Social: corrupção passiva e ativa dentro e fora da empresa”. If
such situations occur, all information will be verified and those responsible will be prosecuted and
removed from the company. The Grupo also provides an internal ombudsman communication channel,
mentioned above, which, among other functions, and facilitates complaints of corruption. The complaints
and claims are forwarded and correctly resolved. It should be noted that the channel is stealthy and works
free through a 0800-telephone number.
2.4.7 Commercially Sensitive Information (Rules 3.5.13 – 3.5.14)
Some information required by the VCS and/or CCB standards is consider confidential or
commercially sensitive and cannot be publicly by the Project Proponents. This information has been
completely supplied to the VVB during the validation process attached to this PD document but weren’t
included in the public version. Below follows the list of information that were available only to VVB:
• Project Financial Performance Worksheet and other related documents;
• Sustainable Forest Management Plan – Pará;
• Agreements and contracts between the parties involved;
• Diagnostic Inventory;
• Legal Status and Property Right Documents;
• Financial Statements Grupo Jari (Jari Celulose and Fundação Jari);
• Financial Statements Biofílica;
• Operating and Environmental Procedures of Grupo Jari.
2.5 Legal Status and Property Rights
2.5.1 Statutory and Customary Property Rights (G5.1)
Jari Celulose, Papel e Embalagens S/A, a company controlled by the Grupo Jari, is the legitimate
owner of the Gleba Jari-I property, where the Jari/Pará REDD+ Project is located. The properties of Jari
Celulose located in the State of Pará and Amapá were acquired through Public Deed of Purchase and
Sale as it is possible to verify in the own deeds (1948/1949) as well as in the “Evolução de Alterações
Societárias – Jari Celulose S/A - Titularidade Fundiária de Terras” and Notifications (NOT) attached to
the PDD. These documents aim to attest to the process of buying and selling the properties and the
location of the notarial offices where the deeds of the respective properties were drawn up, proving
legitimate ownership.
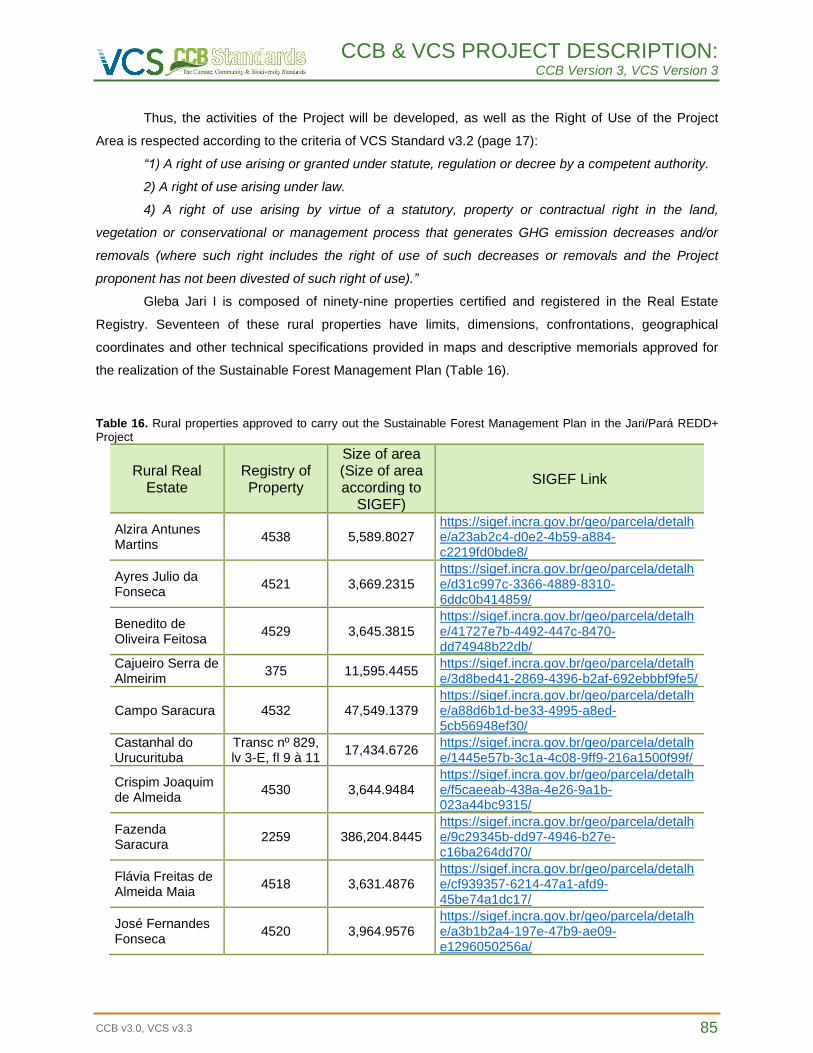
CCB & VCS PROJECT DESCRIPTION: CCB Version 3, VCS Version 3
CCB v3.0, VCS v3.3 85
Thus, the activities of the Project will be developed, as well as the Right of Use of the Project
Area is respected according to the criteria of VCS Standard v3.2 (page 17):
“1) A right of use arising or granted under statute, regulation or decree by a competent authority.
2) A right of use arising under law.
4) A right of use arising by virtue of a statutory, property or contractual right in the land,
vegetation or conservational or management process that generates GHG emission decreases and/or
removals (where such right includes the right of use of such decreases or removals and the Project
proponent has not been divested of such right of use).”
Gleba Jari I is composed of ninety-nine properties certified and registered in the Real Estate
Registry. Seventeen of these rural properties have limits, dimensions, confrontations, geographical
coordinates and other technical specifications provided in maps and descriptive memorials approved for
the realization of the Sustainable Forest Management Plan (Table 16).
Table 16. Rural properties approved to carry out the Sustainable Forest Management Plan in the Jari/Pará REDD+ Project
Rural Real Estate
Registry of Property
Size of area (Size of area according to
SIGEF)
SIGEF Link
Alzira Antunes Martins
4538 5,589.8027 https://sigef.incra.gov.br/geo/parcela/detalhe/a23ab2c4-d0e2-4b59-a884-c2219fd0bde8/
Ayres Julio da Fonseca
4521 3,669.2315 https://sigef.incra.gov.br/geo/parcela/detalhe/d31c997c-3366-4889-8310-6ddc0b414859/
Benedito de Oliveira Feitosa
4529 3,645.3815 https://sigef.incra.gov.br/geo/parcela/detalhe/41727e7b-4492-447c-8470-dd74948b22db/
Cajueiro Serra de Almeirim
375 11,595.4455 https://sigef.incra.gov.br/geo/parcela/detalhe/3d8bed41-2869-4396-b2af-692ebbbf9fe5/
Campo Saracura 4532 47,549.1379 https://sigef.incra.gov.br/geo/parcela/detalhe/a88d6b1d-be33-4995-a8ed-5cb56948ef30/
Castanhal do Urucurituba
Transc nº 829, lv 3-E, fl 9 à 11
17,434.6726 https://sigef.incra.gov.br/geo/parcela/detalhe/1445e57b-3c1a-4c08-9ff9-216a1500f99f/
Crispim Joaquim de Almeida
4530 3,644.9484 https://sigef.incra.gov.br/geo/parcela/detalhe/f5caeeab-438a-4e26-9a1b-023a44bc9315/
Fazenda Saracura
2259 386,204.8445 https://sigef.incra.gov.br/geo/parcela/detalhe/9c29345b-dd97-4946-b27e-c16ba264dd70/
Flávia Freitas de Almeida Maia
4518 3,631.4876 https://sigef.incra.gov.br/geo/parcela/detalhe/cf939357-6214-47a1-afd9-45be74a1dc17/
José Fernandes Fonseca
4520 3,964.9576 https://sigef.incra.gov.br/geo/parcela/detalhe/a3b1b2a4-197e-47b9-ae09-e1296050256a/
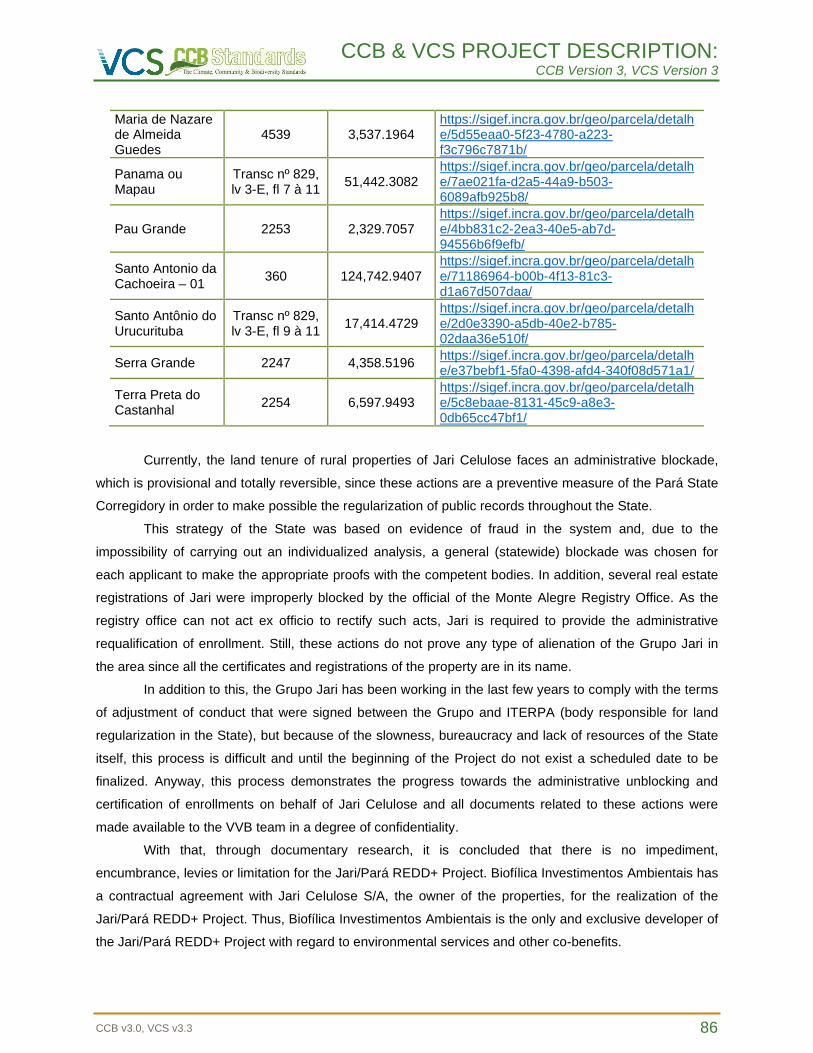
CCB & VCS PROJECT DESCRIPTION: CCB Version 3, VCS Version 3
CCB v3.0, VCS v3.3 86
Maria de Nazare de Almeida Guedes
4539 3,537.1964 https://sigef.incra.gov.br/geo/parcela/detalhe/5d55eaa0-5f23-4780-a223-f3c796c7871b/
Panama ou Mapau
Transc nº 829, lv 3-E, fl 7 à 11
51,442.3082 https://sigef.incra.gov.br/geo/parcela/detalhe/7ae021fa-d2a5-44a9-b503-6089afb925b8/
Pau Grande 2253 2,329.7057 https://sigef.incra.gov.br/geo/parcela/detalhe/4bb831c2-2ea3-40e5-ab7d-94556b6f9efb/
Santo Antonio da Cachoeira – 01
360 124,742.9407 https://sigef.incra.gov.br/geo/parcela/detalhe/71186964-b00b-4f13-81c3-d1a67d507daa/
Santo Antônio do Urucurituba
Transc nº 829, lv 3-E, fl 9 à 11
17,414.4729 https://sigef.incra.gov.br/geo/parcela/detalhe/2d0e3390-a5db-40e2-b785-02daa36e510f/
Serra Grande 2247 4,358.5196 https://sigef.incra.gov.br/geo/parcela/detalhe/e37bebf1-5fa0-4398-afd4-340f08d571a1/
Terra Preta do Castanhal
2254 6,597.9493 https://sigef.incra.gov.br/geo/parcela/detalhe/5c8ebaae-8131-45c9-a8e3-0db65cc47bf1/
Currently, the land tenure of rural properties of Jari Celulose faces an administrative blockade,
which is provisional and totally reversible, since these actions are a preventive measure of the Pará State
Corregidory in order to make possible the regularization of public records throughout the State.
This strategy of the State was based on evidence of fraud in the system and, due to the
impossibility of carrying out an individualized analysis, a general (statewide) blockade was chosen for
each applicant to make the appropriate proofs with the competent bodies. In addition, several real estate
registrations of Jari were improperly blocked by the official of the Monte Alegre Registry Office. As the
registry office can not act ex officio to rectify such acts, Jari is required to provide the administrative
requalification of enrollment. Still, these actions do not prove any type of alienation of the Grupo Jari in
the area since all the certificates and registrations of the property are in its name.
In addition to this, the Grupo Jari has been working in the last few years to comply with the terms
of adjustment of conduct that were signed between the Grupo and ITERPA (body responsible for land
regularization in the State), but because of the slowness, bureaucracy and lack of resources of the State
itself, this process is difficult and until the beginning of the Project do not exist a scheduled date to be
finalized. Anyway, this process demonstrates the progress towards the administrative unblocking and
certification of enrollments on behalf of Jari Celulose and all documents related to these actions were
made available to the VVB team in a degree of confidentiality.
With that, through documentary research, it is concluded that there is no impediment,
encumbrance, levies or limitation for the Jari/Pará REDD+ Project. Biofílica Investimentos Ambientais has
a contractual agreement with Jari Celulose S/A, the owner of the properties, for the realization of the
Jari/Pará REDD+ Project. Thus, Biofílica Investimentos Ambientais is the only and exclusive developer of
the Jari/Pará REDD+ Project with regard to environmental services and other co-benefits.
CCB & VCS PROJECT DESCRIPTION: CCB Version 3, VCS Version 3
CCB v3.0, VCS v3.3 87
2.5.2 Recognition of Property Rights (G5.1)
The Jari/Pará REDD+ Project recognizes and respects all property rights, complying with
significant statutory and regular requirements, as well as having the required approvals of the appropriate
state, local and indigenous authorities. The Project recognizes respects and supports the rights to lands,
territories and resources, including the statutory and traditional rights of Indigenous Peoples and others
within Communities and Other Actors.
Through the work of the Fundação Jari, the proponents of the project act as mediators of the
conflicts between the extractivists themselves, in addition to having a good relationship with the
surrounding communities. In this way, the following aspects are described in detail:
• It owns the rights of use and economic exploitation of the properties, as well as obtains the right
of access to the natural resources in it, the company Jari Celulose SA, under the terms of the
Federal Constitution of Brazil and the Civil Code, by virtue of being the owner of the real estate
where the Jari/Pará REDD+ Project will be carried out;
• There are no records of disputes with third parties for possession of the Jari's property, for access
to natural resources or for the use of real estate in the Jari/Pará REDD+ Project Area, as well
conflicts with traditional squatters claiming the regularization of their possessions inside of these
areas. What is happening currently is the enforcement of the Terms of Cooperation with the
Government, which through the activities carried out by the Fundação Jari show all the effort
made to the recognition and support of the communities of the region;
• Another measure to prevent and inhibit invasions in the Project Area is the monitoring activities of
the property’s perimeter carried out by a land surveillance team. When invasions are identified, a
police record is made, formalizing the private property invasion report, which is then forwarded to
the legal department of the company for adequate measures, and to the Brazilian Institute of
Environment and Natural Renewable Resources (IBAMA) for investigation of environmental
crime.
2.5.3 Free, Prior, and Informed Consent (G5.2)
The Prior Informed Consent (of the communities present on the property where the project is
located and government representatives in all areas) has been applied throughout the implementation
period and will continue to be applied throughout the duration of the Jari/Pará REDD+ Project. The
property where the Project is located has a vastly larger area than the area used for the Project activities
and there is no interference in the surrounding properties. In addition, the Project does not aim to develop
any activity on private property, besides the property belonging to the Jari Group, or belonging to
indigenous and traditional communities or to the government. In relation to social activities and monitoring
of biodiversity, it is guaranteed that no activity will be carried out without the free, prior and informed
consent of the parties involved.
CCB & VCS PROJECT DESCRIPTION: CCB Version 3, VCS Version 3
CCB v3.0, VCS v3.3 88
No activity related to the Project will result in the involuntary removal or relocation of the Property
Rights Owners of their lands or territories, nor will force them to relocate activities important to their
culture or livelihoods. Any proposed removal or relocation takes place only after obtaining the Free Prior
Informed Consent from the appropriate Owners of Property Rights.
In addition, all the actors that could be impacted directly or indirectly in some way by the Jari/Pará
REDD+ Project were consulted. In the communities related to the Project, workshops were carried out in
order to pass information about the Project, as well as consultations regarding the opinions of the
community about the Project. These consultations will continue throughout the life cycle of the Project. In
addition, all information about the Jari/Pará REDD+ Project can be acquired in virtual channels, such as
Biofílica website and newsletter by social media such as Facebook and LinkedIn, through the technicians
of the Fundação Jari and its publications.
2.5.4 Property Rights Protection (G5.3)
The implementation and development of the Jari/Pará REDD+ Project shall not lead to the
involuntary removal or relocation of any party, and the activities important to the culture and livelihoods of
the communities residing within the boundaries of the Project Area shall be respected and supported by
the Project.
As previously stated, the land regularization of the communities acting in the Project is supported
and sustained by the Grupo Jari with the responsible public institutions.
2.5.5 Illegal Activity Identification (G5.4)
Illegal deforestation is the main illegal activity that can negatively impact the development of the
Jari/Pará REDD+ Project, with predatory hunting and exploitation of other fauna and flora species being
possible.
This illegal deforestation is caused by land squatters for subsistence agriculture ("farms") and by
small farmers for small-scale agricultural crops, pasture and demarcation of property boundaries.
Between 2000 and 2014, 92,575 hectares were deforested in the Reference Region of the Project to
install these activities. For the next 30 years, a loss of 182,826 hectares of native forest are projected in
the absence of the project, of which 50,480 hectares are expected to be deforested in the Project Area.
It seeks to control and combat these illegal activities commonly found in the region covered by
the Project through mitigating measures such as strengthening land inspection and patrimonial
surveillance, as well as encouraging the engagement of other actors and stakeholders, social inclusion
and regional socioeconomic development through the generation of economic alternatives to
deforestation.
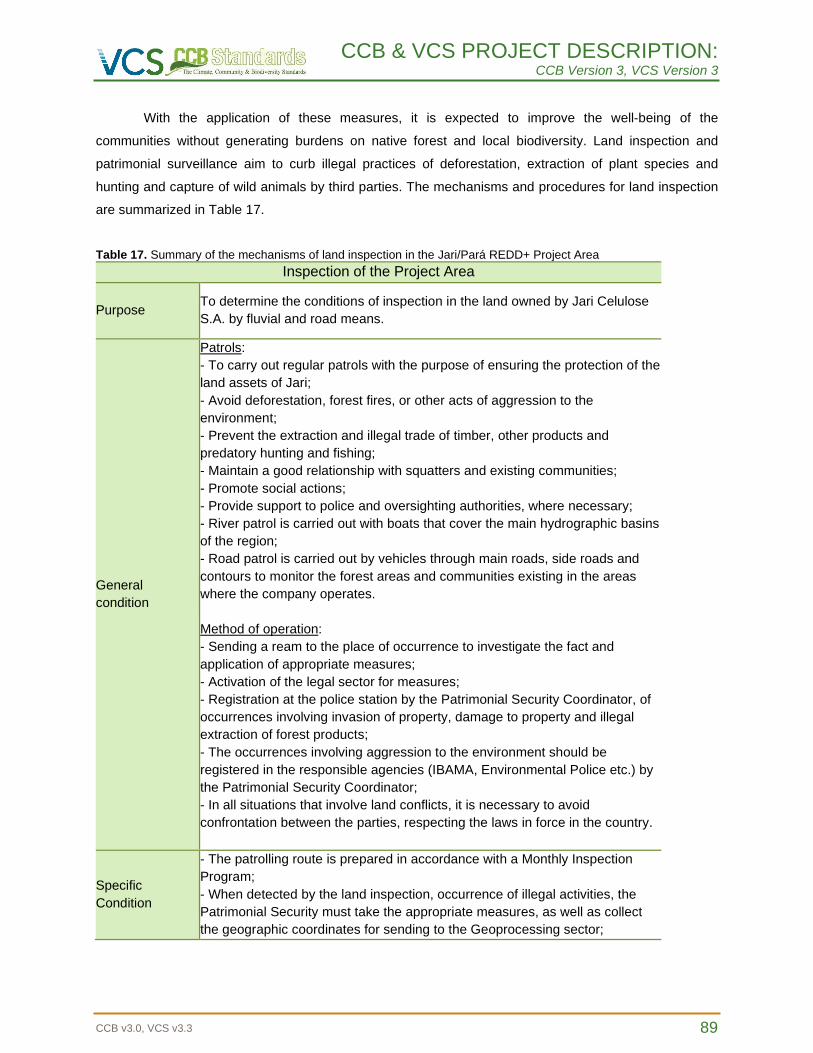
CCB & VCS PROJECT DESCRIPTION: CCB Version 3, VCS Version 3
CCB v3.0, VCS v3.3 89
With the application of these measures, it is expected to improve the well-being of the
communities without generating burdens on native forest and local biodiversity. Land inspection and
patrimonial surveillance aim to curb illegal practices of deforestation, extraction of plant species and
hunting and capture of wild animals by third parties. The mechanisms and procedures for land inspection
are summarized in Table 17.
Table 17. Summary of the mechanisms of land inspection in the Jari/Pará REDD+ Project Area
Inspection of the Project Area
Purpose To determine the conditions of inspection in the land owned by Jari Celulose
S.A. by fluvial and road means.
General
condition
Patrols:
- To carry out regular patrols with the purpose of ensuring the protection of the
land assets of Jari;
- Avoid deforestation, forest fires, or other acts of aggression to the
environment;
- Prevent the extraction and illegal trade of timber, other products and
predatory hunting and fishing;
- Maintain a good relationship with squatters and existing communities;
- Promote social actions;
- Provide support to police and oversighting authorities, where necessary;
- River patrol is carried out with boats that cover the main hydrographic basins
of the region;
- Road patrol is carried out by vehicles through main roads, side roads and
contours to monitor the forest areas and communities existing in the areas
where the company operates.
Method of operation:
- Sending a ream to the place of occurrence to investigate the fact and
application of appropriate measures;
- Activation of the legal sector for measures;
- Registration at the police station by the Patrimonial Security Coordinator, of
occurrences involving invasion of property, damage to property and illegal
extraction of forest products;
- The occurrences involving aggression to the environment should be
registered in the responsible agencies (IBAMA, Environmental Police etc.) by
the Patrimonial Security Coordinator;
- In all situations that involve land conflicts, it is necessary to avoid
confrontation between the parties, respecting the laws in force in the country.
Specific
Condition
- The patrolling route is prepared in accordance with a Monthly Inspection
Program;
- When detected by the land inspection, occurrence of illegal activities, the
Patrimonial Security must take the appropriate measures, as well as collect
the geographic coordinates for sending to the Geoprocessing sector;
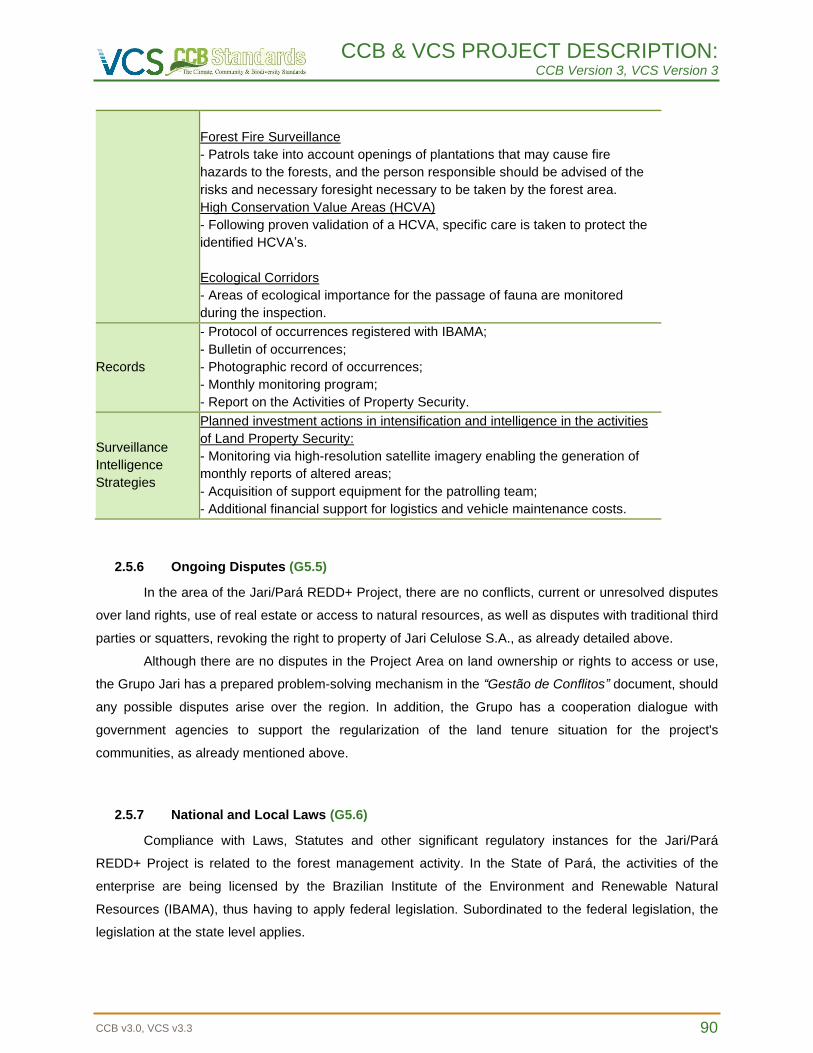
CCB & VCS PROJECT DESCRIPTION: CCB Version 3, VCS Version 3
CCB v3.0, VCS v3.3 90
Forest Fire Surveillance
- Patrols take into account openings of plantations that may cause fire
hazards to the forests, and the person responsible should be advised of the
risks and necessary foresight necessary to be taken by the forest area.
High Conservation Value Areas (HCVA)
- Following proven validation of a HCVA, specific care is taken to protect the
identified HCVA’s.
Ecological Corridors
- Areas of ecological importance for the passage of fauna are monitored
during the inspection.
Records
- Protocol of occurrences registered with IBAMA;
- Bulletin of occurrences;
- Photographic record of occurrences;
- Monthly monitoring program;
- Report on the Activities of Property Security.
Surveillance
Intelligence
Strategies
Planned investment actions in intensification and intelligence in the activities
of Land Property Security:
- Monitoring via high-resolution satellite imagery enabling the generation of
monthly reports of altered areas;
- Acquisition of support equipment for the patrolling team;
- Additional financial support for logistics and vehicle maintenance costs.
2.5.6 Ongoing Disputes (G5.5)
In the area of the Jari/Pará REDD+ Project, there are no conflicts, current or unresolved disputes
over land rights, use of real estate or access to natural resources, as well as disputes with traditional third
parties or squatters, revoking the right to property of Jari Celulose S.A., as already detailed above.
Although there are no disputes in the Project Area on land ownership or rights to access or use,
the Grupo Jari has a prepared problem-solving mechanism in the “Gestão de Conflitos” document, should
any possible disputes arise over the region. In addition, the Grupo has a cooperation dialogue with
government agencies to support the regularization of the land tenure situation for the project's
communities, as already mentioned above.
2.5.7 National and Local Laws (G5.6)
Compliance with Laws, Statutes and other significant regulatory instances for the Jari/Pará
REDD+ Project is related to the forest management activity. In the State of Pará, the activities of the
enterprise are being licensed by the Brazilian Institute of the Environment and Renewable Natural
Resources (IBAMA), thus having to apply federal legislation. Subordinated to the federal legislation, the
legislation at the state level applies.
CCB & VCS PROJECT DESCRIPTION: CCB Version 3, VCS Version 3
CCB v3.0, VCS v3.3 91
Regarding REDD+ activities, there is nothing establishing or regulating officially any legislation
related to this subject up to the present moment. One can note a history of initiatives despite the
construction and negotiation of this concept through agreements and meetings in the United Nations
Framework Convention on Climate Change (UNFCCC).
So far, the most relevant initiative at the national level has been the submission of Bill No.
225/2015 which “Establishes the national system for reducing emissions from deforestation and
degradation, conservation, sustainable forest management, maintenance and increase of forest carbon
stocks (REDD+) e and other measures”, but is still under way.
In addition, in December 2015, the National Strategy for REDD+ of Brazil (ENREDD+) was
instituted by MMA Ordinance No. 370, a document that formalizes to Brazilian society and the UNFCCC
signatory countries how the Brazilian government has structured its efforts and aims to improve them by
2020, contributing to climate change mitigation by controlling deforestation and forest degradation,
promoting forest recovery and promoting sustainable development.
Below are the main relevant laws and regulations at the federal and state levels listed and
detailed. In addition, a brief review of international climate agreements has been conducted that has led
to the creation and development of REDD+ initiatives around the world.
Federal Legislation
- Law no. 13,123, of 05/20/2015: regulates item II of § 1 and § 4 of art. 225 of the Federal
Constitution, Article 1, Article 8 (j), Article 10 (c), Article 15, and Article 16, Paragraphs 3 and 4, of the
Convention on Biological Diversity, promulgated by Decree No. 2,519 of 16 March 1998; provides for
access to genetic heritage, protection and access to associated traditional knowledge and benefit-sharing
for conservation and sustainable use of biodiversity; repeals Provisional Measure No. 2,186-16 of August
23, 2001; and makes other arrangements.
- Law no. 12,651, of 05/25/2012: Provides for the protection of native vegetation; amends Laws
6,938 of August 31, 1981; 9,393 of December 19, 1996; and 11,428 of December 22, 2006; revokes
Laws Nos. 4,771, September 15, 1965; and 7,754, April 14, 1989; and Provisional Measure No. 2,166-67
of August 24, 2001; and other measures.
- Law no. 12,187, of 12/29/2009: It establishes the National Policy on Climate Change – PNMC
and other measures.
- Provisional Measure no. 571, of 05/25/2012: Amends Law No. 12,651, of May 25, 2012;
which provides for the protection of native vegetation; amends Laws 6,938 of August 31, 1981; 9,393 of
December 19, 1996; and 11,428 of December 22, 2006; revokes Laws Nos. 4,771, September 15, 1965;
and 7,754, April 14, 1989; and Provisional Measure No. 2,166-67 of August 24, 2001.
- Decree no. 58,054, of 03/23/1966: It promulgates the Convention for the protection of flora,
fauna and the scenic beauties of the countries of America.
CCB & VCS PROJECT DESCRIPTION: CCB Version 3, VCS Version 3
CCB v3.0, VCS v3.3 92
- Decree no. 96,944, of 10/12/1988: It creates the Program for the Defense of the Complex of
Ecosystems of the Legal Amazon and other measures.
- Decree no. 2,661, of 07/08/1998: It regulates the sole paragraph of art. 27 of Law No. 4.771, of
September 15, 1965 (Forest Code), through the establishment of precautionary standards regarding the
use of fire in agropastoral and forestry practices, and other measures.
- Decree no. 2,959, of 02/10/1999: Provides for measures to be implemented in the Legal
Amazon, for monitoring, prevention, environmental education and forest firefighting.
- Decree no. 5,975, of 11/30/2006: It regulates the art. 12, final part, 15, 16, 19, 20 and 21 of
Law 4,771, dated September 15, 1965; art. 4, item III, of Law 6.938, dated August 31, 1981; art. 2 of Law
10.650 of April 16, 2003; amends and adds provisions to Decrees 6,514/08 and 3,420/00, and other
provisions.
- Decree no. 7,390, of 12/09/2010: It regulates arts. 6, 11 and 12 of Law No. 12,187, of
December 29, 2009, which establishes the National Policy on Climate Change - PNMC and other
measures.
- CONAMA Resolution No. 16, of 12/07/1989: Establishes the Integrated Program for
Environmental Assessment and Control of the Legal Amazon.
- CONAMA Resolution No. 378, of 10/19/2006: Defines those ventures potentially causing
national or regional environmental impact for purposes of the provisions of item III, § 1, art. 19 of Law No.
4.771, of September 15, 1965, and other provisions.
- CONAMA Resolution No. 379, of 10/19/2006: Creates and regulates data and information
system on forest management under the National Environmental System - SISNAMA.
- IBAMA Ordinance No. 218, of 05/04/1989: Provides for the clearing and exploitation of native
forests and forest formations that are native successors of the Atlantic Forest, and other measures.
- IBAMA Ordinance No. 37-N, of 04/03/1992: It recognizes as Official List of Species of the
Brazilian Flora Threatened of Extinction the relation that is presented in the Ordinance.
- MMA Ordinance No. 103, of 04/05/2006: Provides for the implementation of the Document of
Forest Origin - DOF, and other measures.
- MMA Ordinance No. 253, of 08/18/2006: Establishes, as of September 1, 2006, the Forest
Origin Document - DOF in substitution of the ATPF Forest Products Transport Authorization, under the
Brazilian Institute for the Environment and Renewable Natural Resources (IBAMA).
- Ordinance No. 8896, of 12/09/2013: Amendments to Regulatory Norm no. 31.
- Normative Instruction MMA no. 1, of 09/05/1996: Provides for the Mandatory Forest
Replenishment and the Integrated Forest Plan.
- Normative Instruction MMA no. 07, of 04/27/1999: Provides for authorization for deforestation
in the States of the Legal Amazon.
- Normative Instruction MMA no. 02, of 05/10/2001: Provides for the economic exploitation of
forests, in the rural properties located in the Legal Amazon, including the Legal Reserve areas and
CCB & VCS PROJECT DESCRIPTION: CCB Version 3, VCS Version 3
CCB v3.0, VCS v3.3 93
excluding those of permanent preservation established in the current legislation that will be realized
through practices of sustainable forest management of multiple use.
- Normative Instruction IBAMA no. 30, of 12/31/2002: It disciplines the calculation of the
geometric volume of standing trees, through the volume equation that specifies and other measures.
- Normative Instruction IBAMA no. 112, of 08/21/2006: It regulates the Document of Forest
Origin - DOF, established by Ordinance/MMA/ no. 253, of August 18, 2006. (Amended by Normative
Instruction No. 134 IBAMA, of 11/22/2006).
- Normative Instruction MMA no. 06, of 12/15/2006: Provides for forest replenishment and the
consumption of forest raw material, and other measures.
- Normative Instruction IBAMA no. 178, of 06/23/2008: Defines IBAMA guidelines and
procedures for assessment and consent regarding the issuance of permits for the suppression of forests
and other forms of native vegetation in an area of more than 2,000 hectares in rural properties located in
the Legal Amazon and 1,000 hectares in rural properties located in other regions of the country.
- Regulatory Norm no. 31, of 03/03/2005: It approves the Regulatory Norm of Safety and Health
in the Work in Agriculture, Livestock, Forestry, Timber Harvesting and Aquaculture.
State Legislation
- State Law no. 7,389, of 04/01/2012: Defines the activities of local environmental impact in the
State of Pará and other measures.
- State Law no. 7,381, of 3/19/2010: Provides for the restoration of the vegetation cover, of the
riparian forests of the State of Pará.
- State Law no. 6,745, of 6/6/2005: Establishes the Ecological-Economic Macrozoning of the
State of Pará and other measures.
- State Law no. 6,506 of 12/02/2002: It establishes the basic guidelines for the realization of the
Ecological-Economic Zoning (EEZ) in the State of Pará and other measures.
- State Law no. 6,462, of 7/4/2002: Provides for the State Policy on Forests and other forms of
vegetation.
- State Law no. 5,977, of 7/10/1996: Provides for the protection of wildlife in the State of Pará.
- State Law no. 5,887, of 5/9/1995: Provides for the State Environmental Policy and other
measures.
- State Decree no. 518, of 09/05/2012: Establishes the Para-Forum of Climate Change and
other measures.
- State Decree no. 216, of 9/22/2011: Provides for the environmental licensing of
agrosilvopastoral activities carried out in altered and/or underutilized areas outside the legal reserve area
and permanent preservation area in the rural properties of the State of Pará.
CCB & VCS PROJECT DESCRIPTION: CCB Version 3, VCS Version 3
CCB v3.0, VCS v3.3 94
- State Decree no. 2,436, of 8/11/2010: Regulates the actions related, directly or indirectly, to
agrosilvopastoral activities, carried out within the areas of alternative land use, considered to be of low
environmental impact.
- State Decree no. 2,099, of 1/27/2010: It provides for the maintenance, recomposition,
conduction of natural regeneration, compensation and composition of the Legal Reserve area of rural
properties in the State of Pará and other measures.
- State Decree no. 1,697, of 6/5/2009: Establishes the Prevention, Control and Alternatives Plan
for the deforestation of the State of Pará and other measures.
- State Decree no. 1,148, of 7/17/2008: Provides for the Rural Environmental Registry - CAR-
PA, Legal Reserve area and other measures.
- State Decree no. 58, of 11/27/2006: Establishes the Register of Explorers and Consumers of
Forest Products of the State of Pará - CEPROF-PA and the System of Commercialization and
Transportation of Forest Products of the state of Pará SISFLORA-PA and its operational documents and
other measures.
- State Decree no. 56, of 3/31/2006: Regulates provisions of State Law No. 6,462 of July 4,
2002; which provides for the State Policy on Forests and Other Forms of Vegetation and provides other
measures, aiming at encouraging the recovery of altered and/or degraded areas and restoring legal
reserve, for energy, wood, fruit, industrial or other purposes, through reforestation and agroforestry with
native and exotic species and other measures. - State Decree no. 856, of 01/30/2004: Regulates the
Register of Forest Activity.
- Resolution no. 54, of 10/24/2007 (APPENDIX1): Homologates the list of endangered species
of flora and fauna in the State of Pará.
International Agreements
- FCCC/CP/2005/Misc.1: Reducing emissions from deforestationing developing countries:
approaches to stimulate action. Submission from Parties. (In Portuguese: Reduzindo emissões de
desmatamento em países em desenvolvimento: abordagem para estimular ação. Submissão das partes.
COP 11, Montreal, 2005.)
- FCCC/CP/2007/6/add.1: Report of the Conference of the Parties on its thirteenth session, held
in Bali from 3 to 15 December 2007. Addendum. Part two: Action taken by the Conference of the Parties
at its thirteenth session. (In Portuguese: Relatório da Conferência das Partes sobre sua décima terceira
sessão, ocorrida em Bali de 3 a 5 de dezembro de 2007. Addendum. Part Two: Ação tomada pela
Conferência das Partes em sua décima terceira sessão ou “Action Bali Plan”. COP 13, Bali, 2007.)
- FCCC/CP/2009/Add.1: Report of the Conference of the Parties on its fifteenth session, held in
Copenhagem from 7 to 19 December 2009. Addendum. Part Two: Action taken by the Conference of the
Parties at its fifteenth session. (In Portuguese: Relatório da Conferência das Partes sobre sua décima
quinta sessão, ocorrida em Copenhagem de 7 a 19 de dezembro de 2009. Addendum. Part Two: Ação
CCB & VCS PROJECT DESCRIPTION: CCB Version 3, VCS Version 3
CCB v3.0, VCS v3.3 95
tomada pela Conferência das Partes na sua décima quinta sessão ou “Copenhagem Accord”. COP 15,
Copenhagen, 2009.)
- FCCC/CP/2010/7/Add. 1: Report of the Conference of the Parties on its sixteenth session, held
in Cancun from 29 November to 10 December 2010. Addendum. Part Two: Action taken by the
Conference of the Parties at its sixtenth session. (In Portuguese: Relatório da Conferência das Partes
sobre sua décima sexta sessão, ocorrida em Cancun de 19 de novembro a 10 de dezembro de 2010.
Addendum. Parte Dois: Ação tomada pela Conferência das Partes na sua décima sexta sessão ou
“Cancun Agreement”. COP 16, Cancun, 2010.)
- FCCC/CP/2011/9/Add. 1: Report of the Conference of the Parties on its seventeenth session,
held in Durban from 28 November to 11 December 2011. Addendum. Part Two: Action taken by the
Conference of the Parties at its seventeenth session. (In Portuguese: Relatório da Conferência das
Partes sobre sua décima sétima sessão, ocorrida em Durban de 28 de novembro a 11 de dezembro de
2011. Addendum. Parte Dois: Ação tomada pela Conferência das Partes em sua décima sétima sessão.
COP 17, Durban, 2011.)
- FCCC/CP/2012/8/Add.1: Report of the Conference of the Parties on its eighteenth session, held
in Doha from 26 November to 8 December 2012. Addendum. Part two: Action taken by the Conference of
the Parties at its eighteenth session. (In Portuguese: Relatório de Conferência das Partes sobre sua
décima oitava sessão, ocorrida em Doha de 26 de novembro a 8 de dezembro. Addendum. Parte Dois:
Ação tomada pela Conferência das Partes em sua décima oitava sessão.)
- FCCC/CP/2013/Add.1: Warsaw Framework for REDD-plus, held in Warsaw, Poland, from 11 to
22 November 2013 (In Portuguese: Pacote de Varsóvia para REDD+, ocorrida em Varsóvia, Polônia, de
11 a 22 de Novembro de 2013), in particular the following decisions:
- Decision9/CP.19: Work programme on results-based finance to progress the full
implementation of the activities referred to in decision 1/CP. 16, paragraph 70. (In Portuguese: Programa
de trabalho em financiamento baseados em resultados para o progresso da implementação completa
das atividades referidas na decisão 1/CP. 16, parágrafo 70.)
- Decision10/CP.19: Coordination of support for the implementation of activities in relation to
mitigation actions in the forest sector by developing countries, including institutional arrangements. (In
Portuguese: Coordenação do suporte para a implementação de atividades relacionadas a ações de
mitigação no setor florestal por países em desenvolvimento, incluindo arranjos institucionais.)
- Decision12/CP.19: The timing and the frequency of presentations of the summary of
information on how all the safeguards referred to in decision1/CP.16, appendix I, are being addressed
and respected. (In Portuguese: O tempo e a frequência na qual são apresentadas as informações
resumidas de como todas as salvaguardas referidas na dicisão1/CP.16, apêndice I, estão sendo
abordadas e respeitadas.)
- Decision13/CP.19: Guidelines and procedures for the technical assessment of submissions
from Parties on proposed forest reference emission levels and/or forest reference levels. (In Portuguese:
CCB & VCS PROJECT DESCRIPTION: CCB Version 3, VCS Version 3
CCB v3.0, VCS v3.3 96
Guia e procedimentos para avaliação técnica das submissões das Partes em propostas de níveis de
referência em emissões florestais e/ou níveis de referência florestal.)
- Decision14/CP.19: Modalities for measuring, reporting and verifying. (In Portuguese:
Modalidades para medir, reportar e verificar.)
- Decision15/CP.19: Addressing the drivers of deforestation and forest degradation. (Approach
of deforestation and forest degradation drivers.)
- FCCC/CP/2015/Add.1: Report of the Conference of the Parties on its twenty-first session, held
in Paris from 30 November to 13 December 2015. Addendum. Part two: Action taken by the Conference
of the Parties at its twenty-first session. (In Portuguese: Relatório de Conferência das Partes sobre sua
vigésima primeira sessão, ocorrida em Paris de 30 de novembro a 13 de dezembro. Addendum. Parte
Dois: Ação tomada pela Conferência das Partes em sua vigésima primeira sessão).
- Nationally Determined Contribution – Brazilian NDC submitted in September 2015 to the
United Nations Framework Convention on Climate Change for mitigation, adaptation and means of
implementation consistent with the purpose of the contributions to achieve the ultimate objective of the
Convention, in accordance with decision 1/CP.20, paragraph 9.
- CITES, of 03/03/1973: “Convention on International Trade in Endangered Species of Wild
Fauna and Flora”, signed in Washington D.C. on March 3, 1973, amended in Bonn on June 22, 1979.
2.5.8 Approvals (G5.7)
Project proponents have achieved recognition and approval of Jari/Pará REDD+ Project
implementation through meetings between proponents, community consultation, as well as consultation
and submission meetings with the formal and traditional authorities mentioned in the section 2.3 –
Stakeholder Engagement.
There are no official national or jurisdictional REDD+ policies yet, but project proponents are
always on the look out for new information, always present in forums of federal and state government
discussions to contribute to the formulation of these policies and regulations, being promptly available to
adapt the Project to the new officially established rules.
2.5.9 Project Ownership (G5.8)
Jari Celulose S.A. is the legitimate owner of the real estate where the Jari/Pará REDD+ Project is
being implemented and developed, as detailed in section 2.5 – Statutory and Customary Property Rights.
For the establishment of responsibility and rights over the Project, as well as the percentage of carbon
credits allocated to each party, a contract was signed between the proponents of the Project.
CCB & VCS PROJECT DESCRIPTION: CCB Version 3, VCS Version 3
CCB v3.0, VCS v3.3 97
2.5.10 Management of Double Counting Risk (G5.9)
The Jari/Pará REDD+ Project generates benefits to the climate, communities and biodiversity, but
only net reductions and removals of greenhouse gases will be marketed after being properly registered
on a market platform.
2.5.11 Emissions Trading Programs and Other Binding Limits
Does not apply.
2.5.12 Other Forms of Environmental Credit
The Jari/Pará REDD+ Project is not intended to generate any other form of environmental credits
related to the reductions and removals of GHG emissions claimed under the VCS (Verified Carbon
Standard) program.
2.5.13 Participation under Other GHG Programs
The Jari/Pará REDD+ Project did not receive or sought to be registered in any other GHG
program, in addition to submitting the Project to validation and verification in the VCS (Verified Carbon
Standard) and CCBS (Climate, Community and Biodiversity Standard).
2.5.14 Projects Rejected by Other GHG Programs
The Jari/Pará REDD+ Project has not undergone validation/verification of any other GHG
program and is therefore not rejected by any other GHG program.
2.5.15 Double Counting (G5.9)
The Government of the State of Pará brings the issue of REDD+ to debate since the beginning of
the discussions on this issue in the context of international climate conferences. In 2009, the Para-Forum
for Climate Change (FPMC) was created, which, among its objectives, should guide the preparation and
implementation of a State Policy on Climate Change. As a result of the creation of the FPMC, a bill
entitled “Projeto de Lei da Política Estadual de Mudanças Climáticas do Pará”, was published in the same
year. This bill already anticipated the inclusion of REDD+ Programs in the compensation model derived
from reductions in emissions however this process has never been finalized.
In 2014, the FPMC created a Technical Chamber to carry out a revision of the Draft Law in order
to allow a more efficient instrumentalization of the proposal. In relation to REDD, the FPMC proposed at
the time the creation of a State REDD+ Strategy, aiming to organize and prioritize action in the areas of
CCB & VCS PROJECT DESCRIPTION: CCB Version 3, VCS Version 3
CCB v3.0, VCS v3.3 98
deforestation and forest degradation, conservation and forest management. To date, the State of Pará
does not have a defined State REDD+ Strategy.
The proponents of the Jari Pará REDD+ Project contacted representatives of the State
Secretariat of Environment and Sustainability (SEMAS) and the Forestry and Biodiversity Institute of the
State of Pará (Ideflor-Bio), the second defined in the framework of the FPMC as responsible institution for
the State REDD+ Strategy. It was reported that until now there has been no instrumentalization or
evolution of the subject and the FPMC that would be the main thread of the discussions is currently
inactive. In addition, the State Government does not provide formal procedures for registering or
recognizing private voluntary projects.
Thus, it is the understanding of the proponents that there is no risk of double counting, since the
Government of Pará does not have a structured judicial program or any type of state regulation for
Climate Change and REDD, it does not carry out market operations, whether voluntary or non-regulated.
During the Public Consultation process of the project all interested parties related to the state
government were formally communicated and as far as possible will be involved in the implementation of
the same, aiming to provide adequate transparency and credibility.
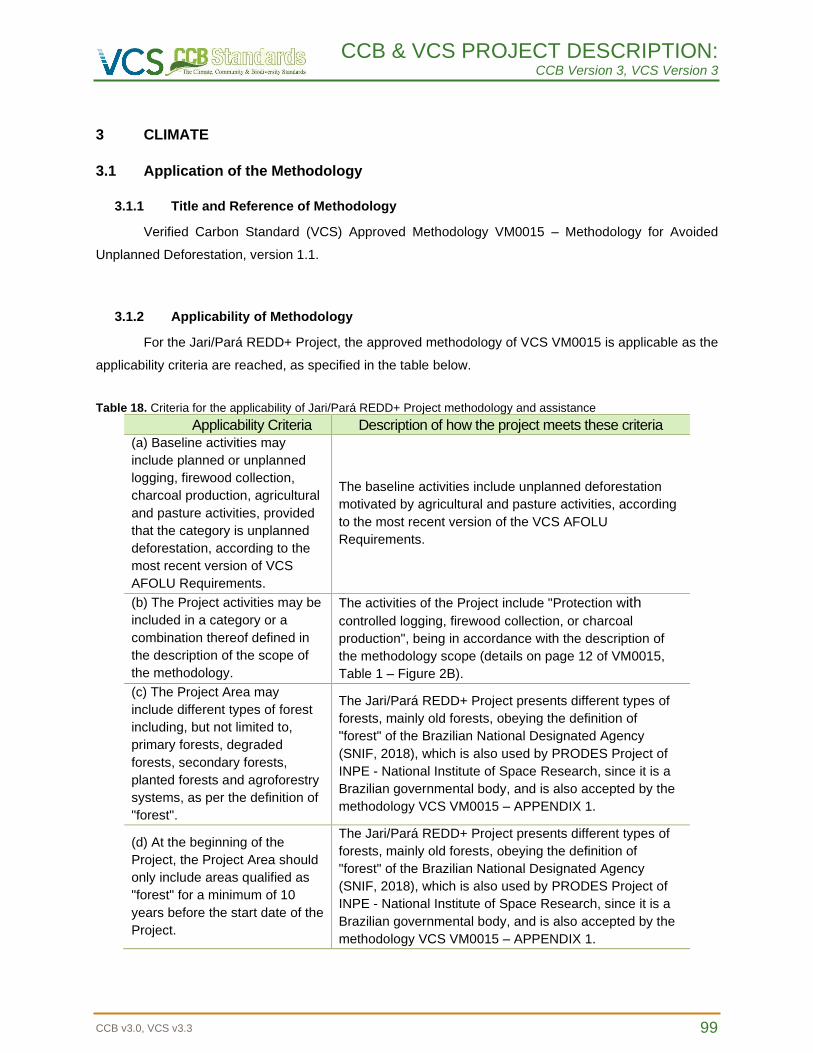
CCB & VCS PROJECT DESCRIPTION: CCB Version 3, VCS Version 3
CCB v3.0, VCS v3.3 99
3 CLIMATE
3.1 Application of the Methodology
3.1.1 Title and Reference of Methodology
Verified Carbon Standard (VCS) Approved Methodology VM0015 – Methodology for Avoided
Unplanned Deforestation, version 1.1.
3.1.2 Applicability of Methodology
For the Jari/Pará REDD+ Project, the approved methodology of VCS VM0015 is applicable as the
applicability criteria are reached, as specified in the table below.
Table 18. Criteria for the applicability of Jari/Pará REDD+ Project methodology and assistance
Applicability Criteria Description of how the project meets these criteria
(a) Baseline activities may
include planned or unplanned
logging, firewood collection,
charcoal production, agricultural
and pasture activities, provided
that the category is unplanned
deforestation, according to the
most recent version of VCS
AFOLU Requirements.
The baseline activities include unplanned deforestation
motivated by agricultural and pasture activities, according
to the most recent version of the VCS AFOLU
Requirements.
(b) The Project activities may be
included in a category or a
combination thereof defined in
the description of the scope of
the methodology.
The activities of the Project include "Protection with
controlled logging, firewood collection, or charcoal
production", being in accordance with the description of
the methodology scope (details on page 12 of VM0015,
Table 1 – Figure 2B).
(c) The Project Area may
include different types of forest
including, but not limited to,
primary forests, degraded
forests, secondary forests,
planted forests and agroforestry
systems, as per the definition of
"forest".
The Jari/Pará REDD+ Project presents different types of
forests, mainly old forests, obeying the definition of
"forest" of the Brazilian National Designated Agency
(SNIF, 2018), which is also used by PRODES Project of
INPE - National Institute of Space Research, since it is a
Brazilian governmental body, and is also accepted by the
methodology VCS VM0015 – APPENDIX 1.
(d) At the beginning of the
Project, the Project Area should
only include areas qualified as
"forest" for a minimum of 10
years before the start date of the
Project.
The Jari/Pará REDD+ Project presents different types of
forests, mainly old forests, obeying the definition of
"forest" of the Brazilian National Designated Agency
(SNIF, 2018), which is also used by PRODES Project of
INPE - National Institute of Space Research, since it is a
Brazilian governmental body, and is also accepted by the
methodology VCS VM0015 – APPENDIX 1.
CCB & VCS PROJECT DESCRIPTION: CCB Version 3, VCS Version 3
CCB v3.0, VCS v3.3 100
(e) The Project Area may
include floodplain areas (such
as lowland forests, floodplain
forests, mangroves) as long as
they do not develop in peat.
Peat should be defined as
organic soils with at least 65%
organic matter and minimum
thickness of 50 cm. If the Project
Area includes floodplain forests
that develop in peat (e.g., peat
forests), this methodology is not
applicable.
As described in section 2.1.5, were identified some
formations characterized as floodplain forests with fluvial
influences. The collection of primary data through forest
inventory for the REDD+ Project (FRM, 2016) and for the
Sustainable Forest Management Plan (FRM, 2016) also
evidenced the presence of these formations. However, no
forest formations were identified in the Project area
classified as forested wetlands or peat swamp forests.
This information is reinforced by the survey of the
pedological aspects of the Project Area in section 2.1.5
(CASA DA FLORESTA, 2016) where, based on the
Brazilian Soil Classification System (EMBRAPA, 2018),
does not record the occurrence of such pedological
formations in the Project Area.
3.1.3 Project Boundary
Step 1 of VM0015 – Definition of Boundaries
Step 1.1 of VM0015 – Spatial Boundaries
Reference Region
The Reference Region is the spatial boundary where rates, agents, drivers, and patterns of Land-
use and Land-cover are: analyzed, projected for the future, and monitored. The Project Area, Leakage
Belt and Leakage Management Area are contained in the Reference Region (Figure 10).
The declaration of Legal Status of the land, which defines the socioeconomic conditions of the
Reference Region is ilustred in Figure 11, with the SIGEF information (INCRA) of the private properties in
the Reference Region beyond Gleba Jari I and the settlement areas, demonstrating that in Reference
Region there are properties in situations similar to Project Area, as required by VM0015 (Page 19).
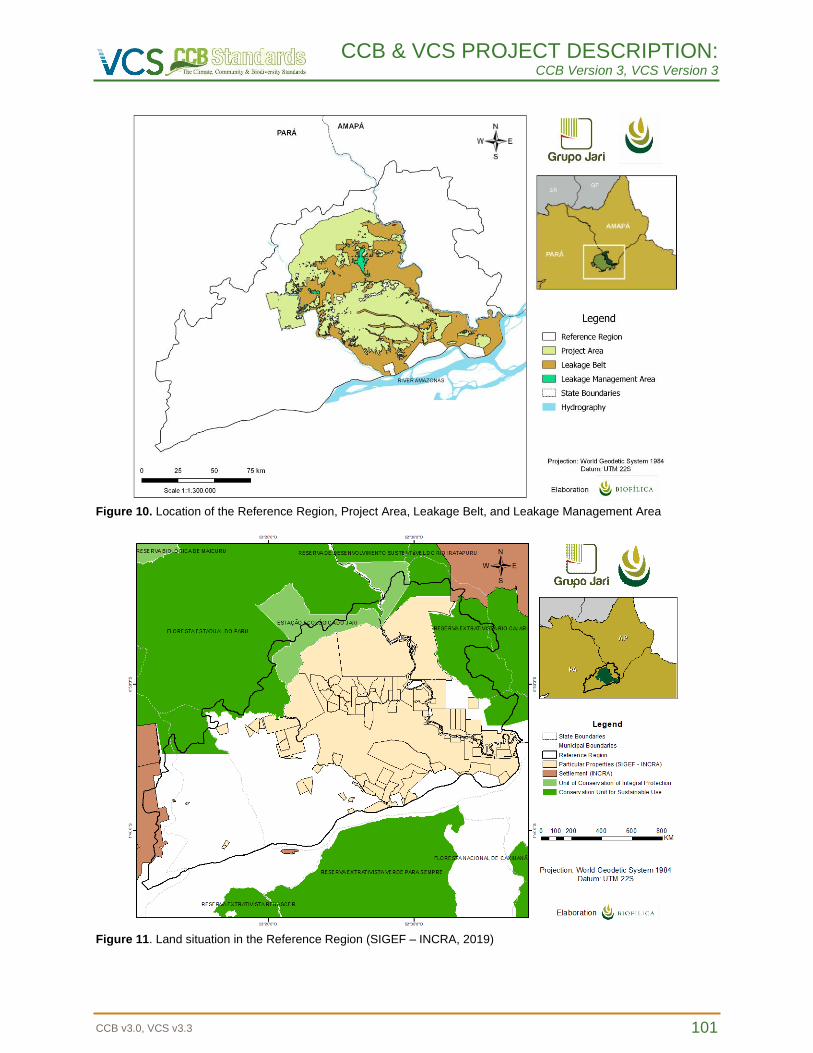
CCB & VCS PROJECT DESCRIPTION: CCB Version 3, VCS Version 3
CCB v3.0, VCS v3.3 101
Figure 10. Location of the Reference Region, Project Area, Leakage Belt, and Leakage Management Area
Figure 11. Land situation in the Reference Region (SIGEF – INCRA, 2019)
CCB & VCS PROJECT DESCRIPTION: CCB Version 3, VCS Version 3
CCB v3.0, VCS v3.3 102
The Reference Region covers 2,522,426 ha (two million, five hundred twenty–two thousand, four
hundred twenty-six hectares), is equivalent to about five times the Project Area. According to PRODES
data from INPE, presents a historical deforestation rate (between 2000 and 2014) of 6,613 ha per year (-
0.37% per year - in relation to the remaining forest area in 2000).
In defining the spatial boundary of the Reference Region, environmental characteristics (river
basin boundaries), deforestation direction driver and land tenure situation were considered. The boundary
of the Reference Region followed the guidelines described on page 19 of the VM0015 methodology, with
the final area within the range suggested by footnote 09 (page 21 of methodology VM0015).
The characteristics of the Reference Region meet the similarity requirements with the Project
Area determined by the methodology VM0015 (presented on pages 18 and 19 of VM0015), presenting
the following characteristics:
1) Deforestation agents and drivers:
- Groups of agents: the agents of deforestation are squatters and small farmers who have a
diffuse pattern of occupation of the Reference Region, with characteristics of low density of
properties, isolated occupations and distributed along the main access roads of the region
(roads, branches and rivers). Agents that cause deforestation with this profile can be found
throughout the Jari Valley, both in the state of Pará and in Amapá;
- Infrastructure Drivers: The main drivers of deforestation in the region are the roads (official
and unofficial), as well as the navigable stretches of the Jari, Paru rivers among other smaller
rivers, the construction of the Santo Antônio Hydroelectric Power Plant, increased flow in BR
156 to the northeast, and in PA 254 southeast of the Reference Region, activities related to
the construction and maintenance of the Jurupari-Oriximiná Transmission Line, among other
spatial drivers presented in Step 3 of this report.
2) Landscape configuration and ecological conditions:
Forest types: The Reference Region presents different forest typologies (Figure 12). Table
19 shows the vegetation typologies in the Reference Region sortied in order from the
Largest to the Smallest area in hectares. While the Table 20 presents the vegetation
typologies found in the Project Area, who ended up presenting the nine most
representative typologies similar to what is presented in Table 19. The classes of
vegetation type found in the project area occupied 100% of the Reference Region.
Based on these results, it is believed that the requirement that at least 90% of the project
area have forest classes found in at least 90% of the reference region is met.
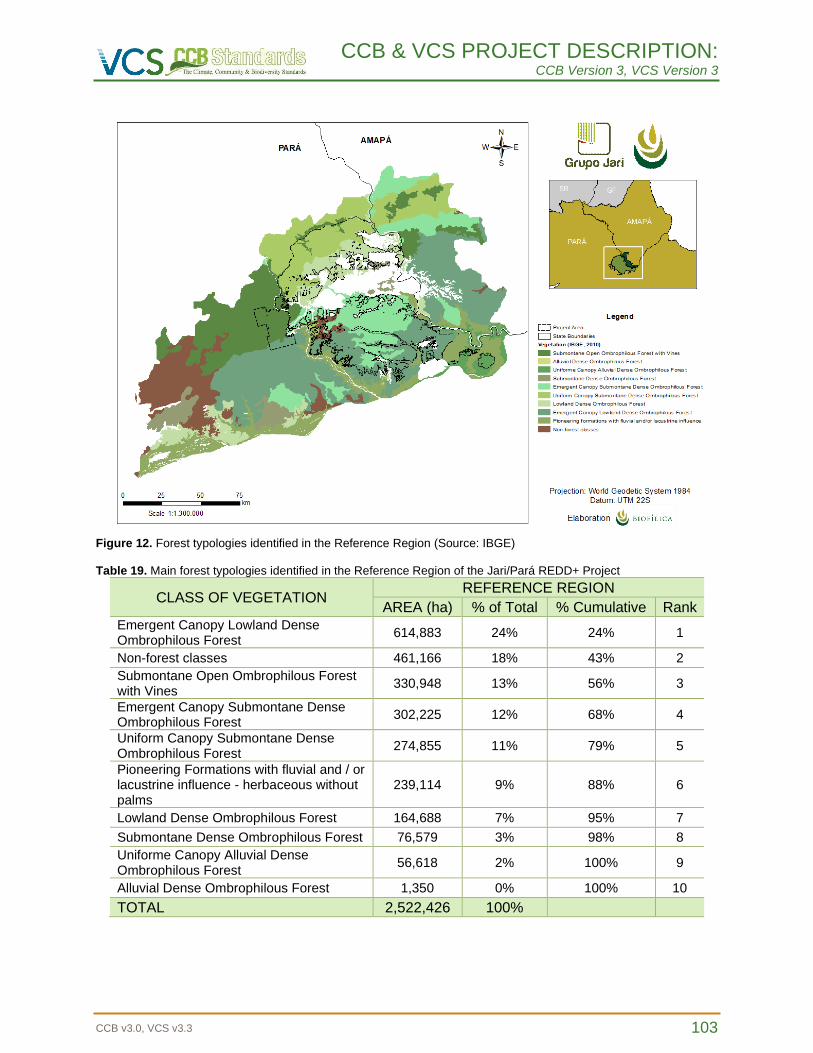
CCB & VCS PROJECT DESCRIPTION: CCB Version 3, VCS Version 3
CCB v3.0, VCS v3.3 103
Figure 12. Forest typologies identified in the Reference Region (Source: IBGE) Table 19. Main forest typologies identified in the Reference Region of the Jari/Pará REDD+ Project
CLASS OF VEGETATION REFERENCE REGION
AREA (ha) % of Total % Cumulative Rank
Emergent Canopy Lowland Dense Ombrophilous Forest
614,883 24% 24% 1
Non-forest classes 461,166 18% 43% 2
Submontane Open Ombrophilous Forest with Vines
330,948 13% 56% 3
Emergent Canopy Submontane Dense Ombrophilous Forest
302,225 12% 68% 4
Uniform Canopy Submontane Dense Ombrophilous Forest
274,855 11% 79% 5
Pioneering Formations with fluvial and / or lacustrine influence - herbaceous without palms
239,114 9% 88% 6
Lowland Dense Ombrophilous Forest 164,688 7% 95% 7
Submontane Dense Ombrophilous Forest 76,579 3% 98% 8
Uniforme Canopy Alluvial Dense Ombrophilous Forest
56,618 2% 100% 9
Alluvial Dense Ombrophilous Forest 1,350 0% 100% 10
TOTAL 2,522,426 100%
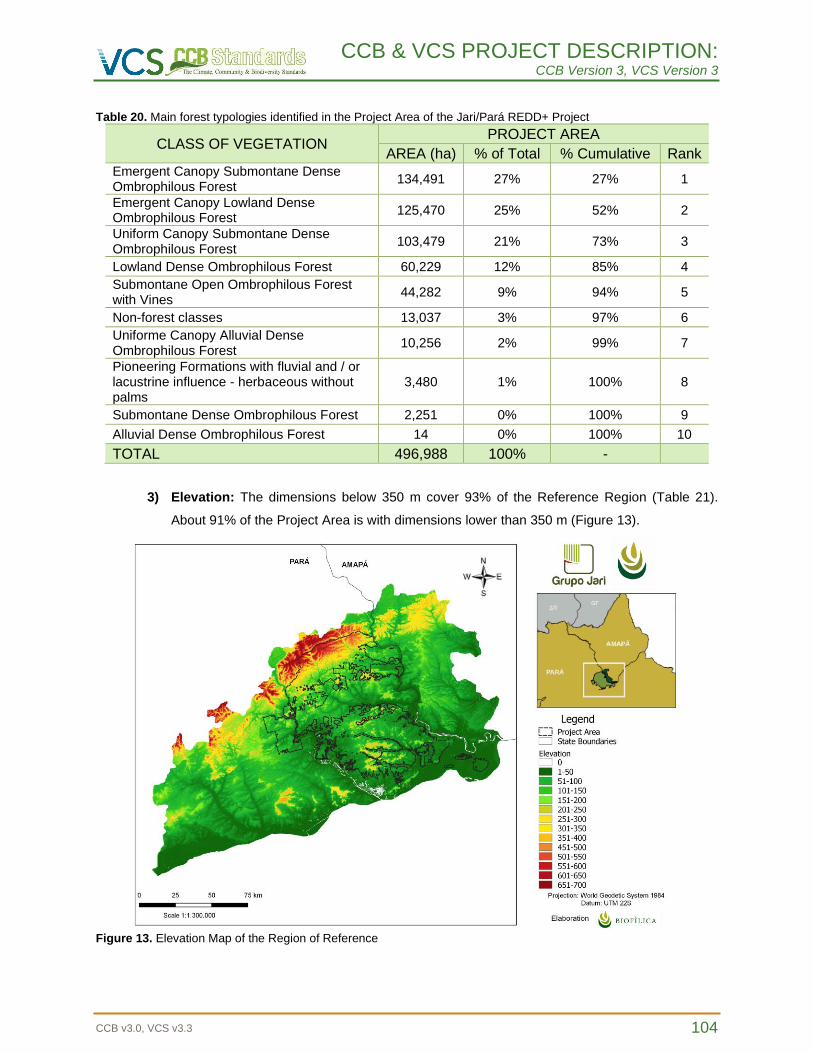
CCB & VCS PROJECT DESCRIPTION: CCB Version 3, VCS Version 3
CCB v3.0, VCS v3.3 104
Table 20. Main forest typologies identified in the Project Area of the Jari/Pará REDD+ Project
CLASS OF VEGETATION PROJECT AREA
AREA (ha) % of Total % Cumulative Rank
Emergent Canopy Submontane Dense Ombrophilous Forest
134,491 27% 27% 1
Emergent Canopy Lowland Dense Ombrophilous Forest
125,470 25% 52% 2
Uniform Canopy Submontane Dense Ombrophilous Forest
103,479 21% 73% 3
Lowland Dense Ombrophilous Forest 60,229 12% 85% 4
Submontane Open Ombrophilous Forest with Vines
44,282 9% 94% 5
Non-forest classes 13,037 3% 97% 6
Uniforme Canopy Alluvial Dense Ombrophilous Forest
10,256 2% 99% 7
Pioneering Formations with fluvial and / or lacustrine influence - herbaceous without palms
3,480 1% 100% 8
Submontane Dense Ombrophilous Forest 2,251 0% 100% 9
Alluvial Dense Ombrophilous Forest 14 0% 100% 10
TOTAL 496,988 100% -
3) Elevation: The dimensions below 350 m cover 93% of the Reference Region (Table 21).
About 91% of the Project Area is with dimensions lower than 350 m (Figure 13).
Figure 13. Elevation Map of the Region of Reference
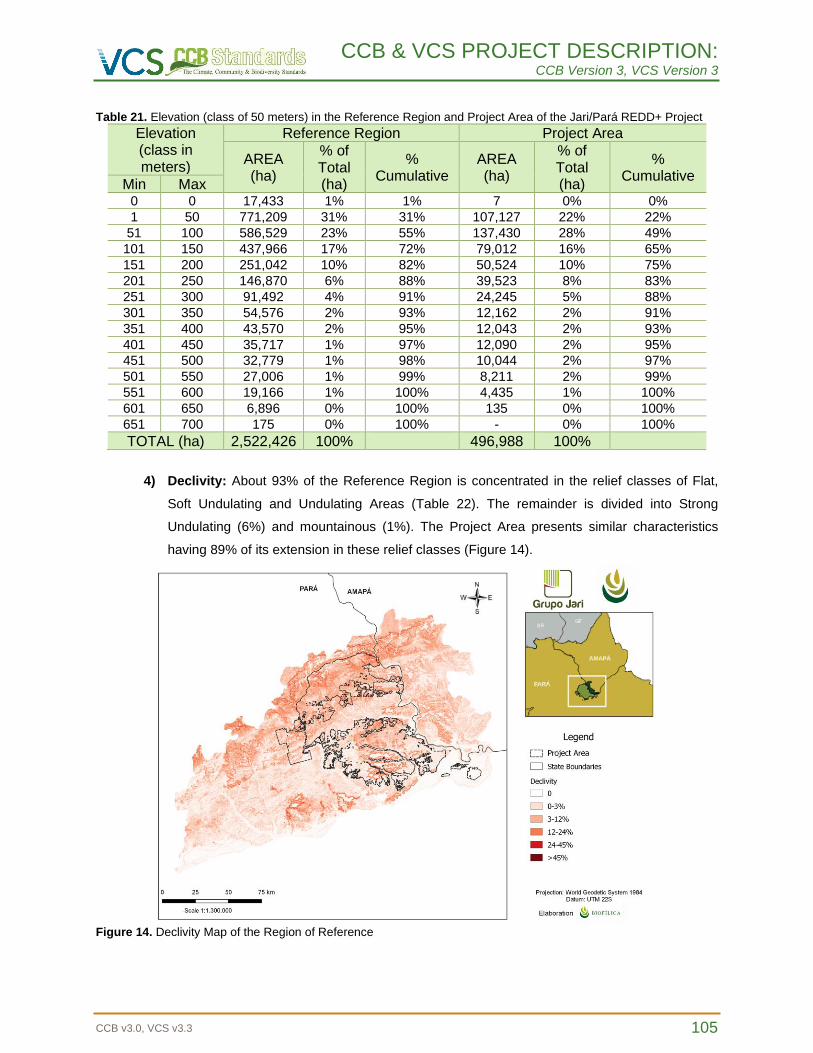
CCB & VCS PROJECT DESCRIPTION: CCB Version 3, VCS Version 3
CCB v3.0, VCS v3.3 105
Table 21. Elevation (class of 50 meters) in the Reference Region and Project Area of the Jari/Pará REDD+ Project
Elevation (class in meters)
Reference Region Project Area
AREA (ha)
% of Total (ha)
% Cumulative
AREA (ha)
% of Total (ha)
% Cumulative
Min Max 0 0 17,433 1% 1% 7 0% 0%
1 50 771,209 31% 31% 107,127 22% 22%
51 100 586,529 23% 55% 137,430 28% 49%
101 150 437,966 17% 72% 79,012 16% 65%
151 200 251,042 10% 82% 50,524 10% 75%
201 250 146,870 6% 88% 39,523 8% 83%
251 300 91,492 4% 91% 24,245 5% 88%
301 350 54,576 2% 93% 12,162 2% 91%
351 400 43,570 2% 95% 12,043 2% 93%
401 450 35,717 1% 97% 12,090 2% 95%
451 500 32,779 1% 98% 10,044 2% 97%
501 550 27,006 1% 99% 8,211 2% 99%
551 600 19,166 1% 100% 4,435 1% 100%
601 650 6,896 0% 100% 135 0% 100%
651 700 175 0% 100% - 0% 100%
TOTAL (ha) 2,522,426 100% 496,988 100%
4) Declivity: About 93% of the Reference Region is concentrated in the relief classes of Flat,
Soft Undulating and Undulating Areas (Table 22). The remainder is divided into Strong
Undulating (6%) and mountainous (1%). The Project Area presents similar characteristics
having 89% of its extension in these relief classes (Figure 14).
Figure 14. Declivity Map of the Region of Reference
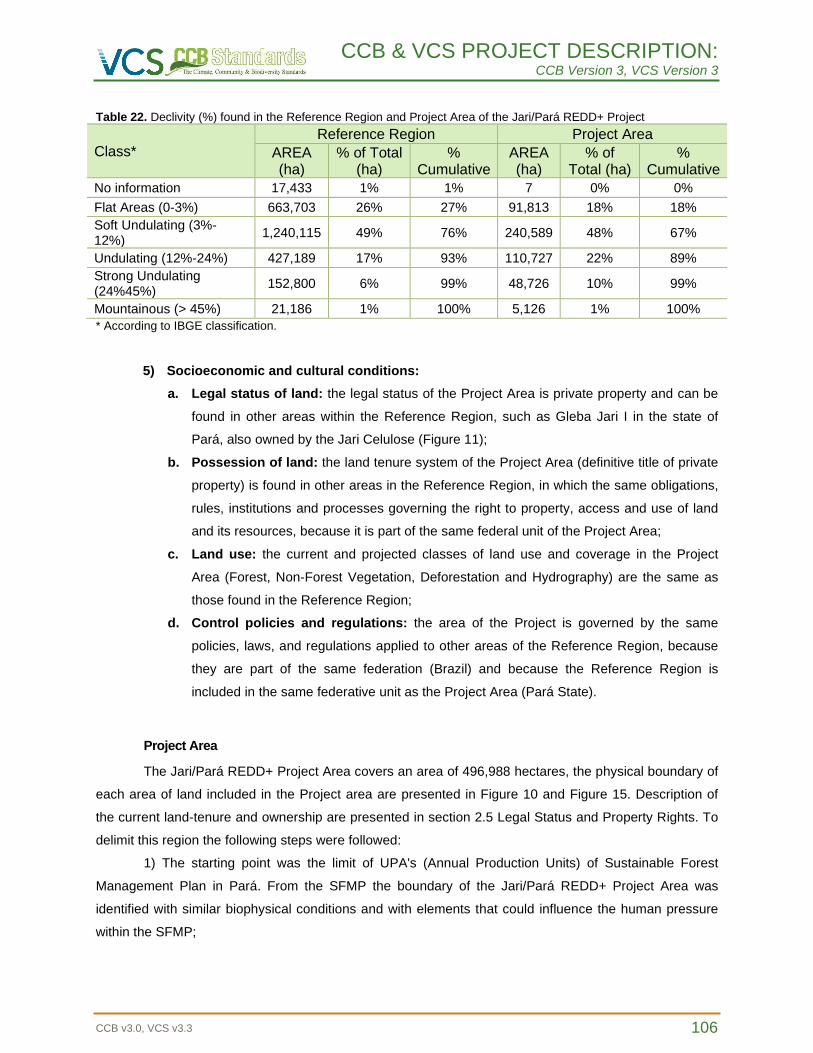
CCB & VCS PROJECT DESCRIPTION: CCB Version 3, VCS Version 3
CCB v3.0, VCS v3.3 106
Table 22. Declivity (%) found in the Reference Region and Project Area of the Jari/Pará REDD+ Project
Class*
Reference Region Project Area
AREA (ha)
% of Total (ha)
% Cumulative
AREA (ha)
% of Total (ha)
% Cumulative
No information 17,433 1% 1% 7 0% 0%
Flat Areas (0-3%) 663,703 26% 27% 91,813 18% 18%
Soft Undulating (3%-12%)
1,240,115 49% 76% 240,589 48% 67%
Undulating (12%-24%) 427,189 17% 93% 110,727 22% 89%
Strong Undulating (24%45%)
152,800 6% 99% 48,726 10% 99%
Mountainous (> 45%) 21,186 1% 100% 5,126 1% 100%
* According to IBGE classification.
5) Socioeconomic and cultural conditions:
a. Legal status of land: the legal status of the Project Area is private property and can be
found in other areas within the Reference Region, such as Gleba Jari I in the state of
Pará, also owned by the Jari Celulose (Figure 11);
b. Possession of land: the land tenure system of the Project Area (definitive title of private
property) is found in other areas in the Reference Region, in which the same obligations,
rules, institutions and processes governing the right to property, access and use of land
and its resources, because it is part of the same federal unit of the Project Area;
c. Land use: the current and projected classes of land use and coverage in the Project
Area (Forest, Non-Forest Vegetation, Deforestation and Hydrography) are the same as
those found in the Reference Region;
d. Control policies and regulations: the area of the Project is governed by the same
policies, laws, and regulations applied to other areas of the Reference Region, because
they are part of the same federation (Brazil) and because the Reference Region is
included in the same federative unit as the Project Area (Pará State).
Project Area
The Jari/Pará REDD+ Project Area covers an area of 496,988 hectares, the physical boundary of
each area of land included in the Project area are presented in Figure 10 and Figure 15. Description of
the current land-tenure and ownership are presented in section 2.5 Legal Status and Property Rights. To
delimit this region the following steps were followed:
1) The starting point was the limit of UPA's (Annual Production Units) of Sustainable Forest
Management Plan in Pará. From the SFMP the boundary of the Jari/Pará REDD+ Project Area was
identified with similar biophysical conditions and with elements that could influence the human pressure
within the SFMP;
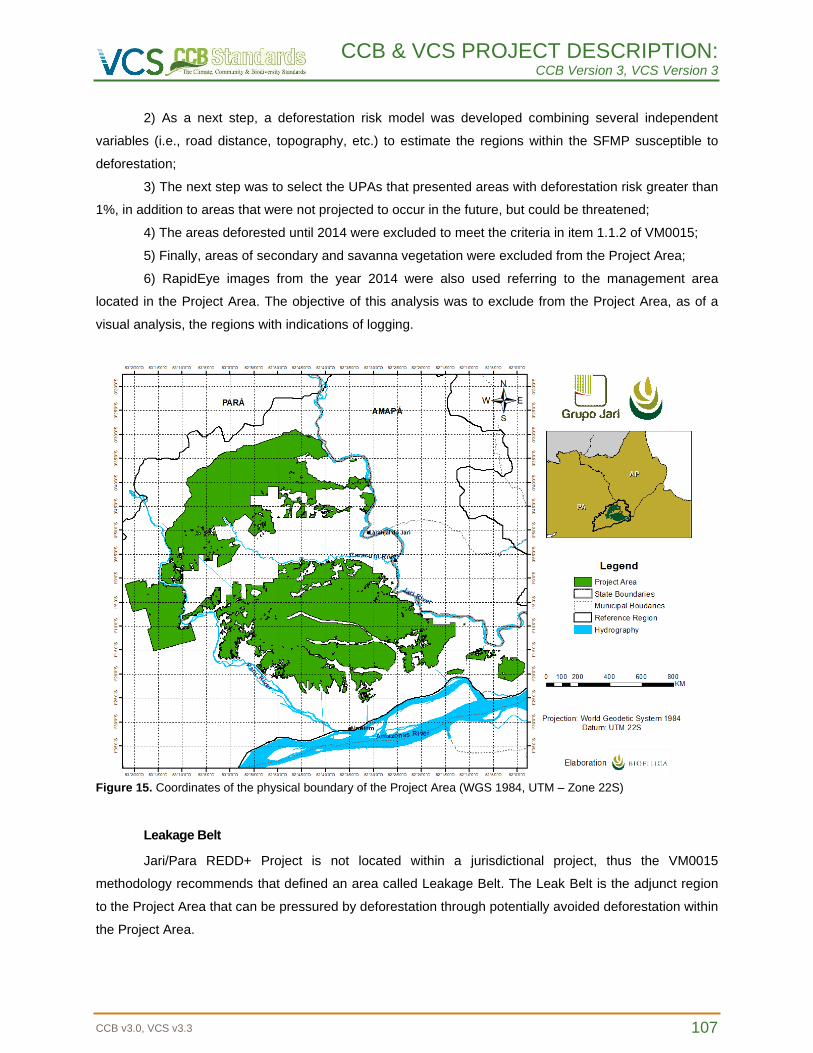
CCB & VCS PROJECT DESCRIPTION: CCB Version 3, VCS Version 3
CCB v3.0, VCS v3.3 107
2) As a next step, a deforestation risk model was developed combining several independent
variables (i.e., road distance, topography, etc.) to estimate the regions within the SFMP susceptible to
deforestation;
3) The next step was to select the UPAs that presented areas with deforestation risk greater than
1%, in addition to areas that were not projected to occur in the future, but could be threatened;
4) The areas deforested until 2014 were excluded to meet the criteria in item 1.1.2 of VM0015;
5) Finally, areas of secondary and savanna vegetation were excluded from the Project Area;
6) RapidEye images from the year 2014 were also used referring to the management area
located in the Project Area. The objective of this analysis was to exclude from the Project Area, as of a
visual analysis, the regions with indications of logging.
Figure 15. Coordinates of the physical boundary of the Project Area (WGS 1984, UTM – Zone 22S)
Leakage Belt
Jari/Para REDD+ Project is not located within a jurisdictional project, thus the VM0015
methodology recommends that defined an area called Leakage Belt. The Leak Belt is the adjunct region
to the Project Area that can be pressured by deforestation through potentially avoided deforestation within
the Project Area.
CCB & VCS PROJECT DESCRIPTION: CCB Version 3, VCS Version 3
CCB v3.0, VCS v3.3 108
To set the Leakage Belt two approaches may be used: (Option 1) cost analysis or opportunity
(option 2) mobility analysis. If Option 1 is selected, the methodology recommends that at least 80% of the
deforested area in the reference region within the historical period should have occurred in areas where
deforestation was profitable.
The socioeconomic diagnoses carried out in the region attest to the predominance of subsistence
agriculture activities characterized by diffuse and predominantly informal activities, since the rural
population of the region has low levels of education, technical training and difficulty access to capital and
technology (POEMA, 2005). It stands out the production of cassava, animal raising and extractive
activities of some products such as brazil nut. In this context, as demonstrated in Step 3 below,
deforestation in the region is mainly motivated by the attempted declaration of tenure and by the need for
expansion of planting as certain areas already consolidated become unproductive due to the lack of
technical knowledge. Besides that, one of the main characteristics of the cattle ranching from the
Brazilian Amazon is its low profitability (ARIMA, BARRETO & BRITO, 2005). In fact, the opening of new
pasturelands occurs mostly as speculative way to demonstrate land ownership. This means that when
deforestation happens, the main purpose is not profitability, but instead, land speculation. The high
degree of informality added to the scarcity of official data, as demonstrated in the survey conducted by
Casa da Floresta (2016), makes it impossible to evaluate direct economic motivations of deforestation,
that is, through Option I. Based on this context, we assumed that the deforestation in the reference region
followed the same pattern found in the whole Brazilian Amazon, which lead us to choose Option II to
design the Leakage Belt.
That way, Option 2 (mobility analysis, VM0015 v1.1 pg. 22) was chosen for the definition of the
Leakage Belt. In order to define the limits of the Leakage Belt we used a multicriteria analysis based in
the factors variables and limiting variables. Factors variable are those that are related to the occurrence
of the goal being modeled. Already the limiting variables constraint the occurrence of this goal. The
following equation was used in the multicriteria analysis (Equation 1) with the main steps represented in
Figure 16.
(1)
Where:
S = score ranging from 0 (zero) to one, where values close to one are more favorable to occur in
Leakage Belt
W = weight of factor variable
X = value of the variable factor i within a scale of 0 to one.
C = value of the limiting variable j
CCB & VCS PROJECT DESCRIPTION: CCB Version 3, VCS Version 3
CCB v3.0, VCS v3.3 109
Factors Variables
- Distance from the project area: Fist, a Euclidean distance map was generated from the boundary of the
project area. The assumption adopted was that the regions closer to the project area would have a greater
chance of leakage than the more distant areas. That way, a Fuzzy function available in the TerrSet software was
applied to reschedule the distance map to the scale of 0 (zero) to one, where values close to one would be close
to the Project Area and at the other end, more distant. The weight of this variable in the analysis is 0.5.
- Deforestation risk: Another assumption used to define the Leakage Belt was avoided deforestation by
REDD project which would occur preferenciamente in areas with high risk of deforestation identified by the model
more accurately. It was not necessary to reschedule the risk model, since the generated scale is already within
the zero range and one. The weight of this variable in the analysis is 0.5.
Limiting Variables
- Jari's property boundary in Para State: A third adopted assumption was that the Leakage Belt would be
located within the private area of Jari in Pará. This was considered because as the Project Area is located within
this same limit, so the Leakage Belt should also be in a region on similar conditions.
- Project Area Limit: As methodology VM0015 v1.1 describes the Leak Belt is located outside but in the
vicinity of the Project Area. Therefore, the Project Area served as a binary mask (Project Area = 0, Out of Project
Area = 1).
Finally, the result the application of the multicriteria approach was converted to a binary mask for the
identification of the Leakage Belt boundary.
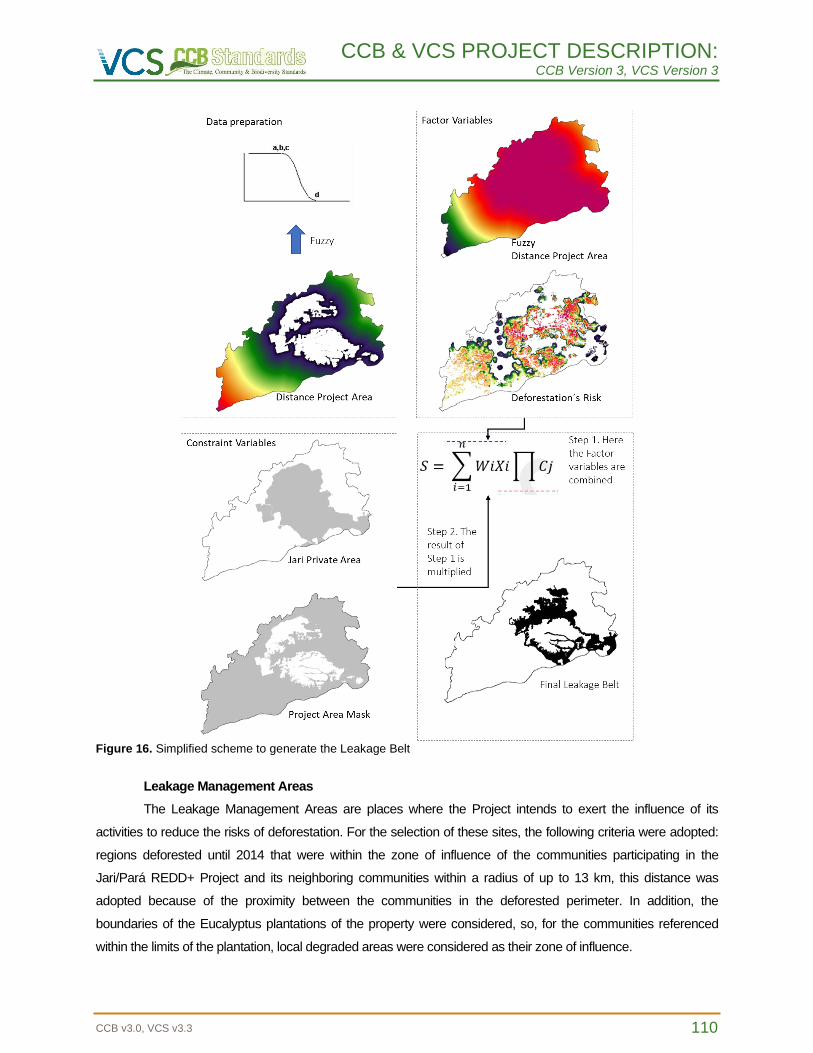
CCB & VCS PROJECT DESCRIPTION: CCB Version 3, VCS Version 3
CCB v3.0, VCS v3.3 110
Figure 16. Simplified scheme to generate the Leakage Belt
Leakage Management Areas
The Leakage Management Areas are places where the Project intends to exert the influence of its
activities to reduce the risks of deforestation. For the selection of these sites, the following criteria were adopted:
regions deforested until 2014 that were within the zone of influence of the communities participating in the
Jari/Pará REDD+ Project and its neighboring communities within a radius of up to 13 km, this distance was
adopted because of the proximity between the communities in the deforested perimeter. In addition, the
boundaries of the Eucalyptus plantations of the property were considered, so, for the communities referenced
within the limits of the plantation, local degraded areas were considered as their zone of influence.
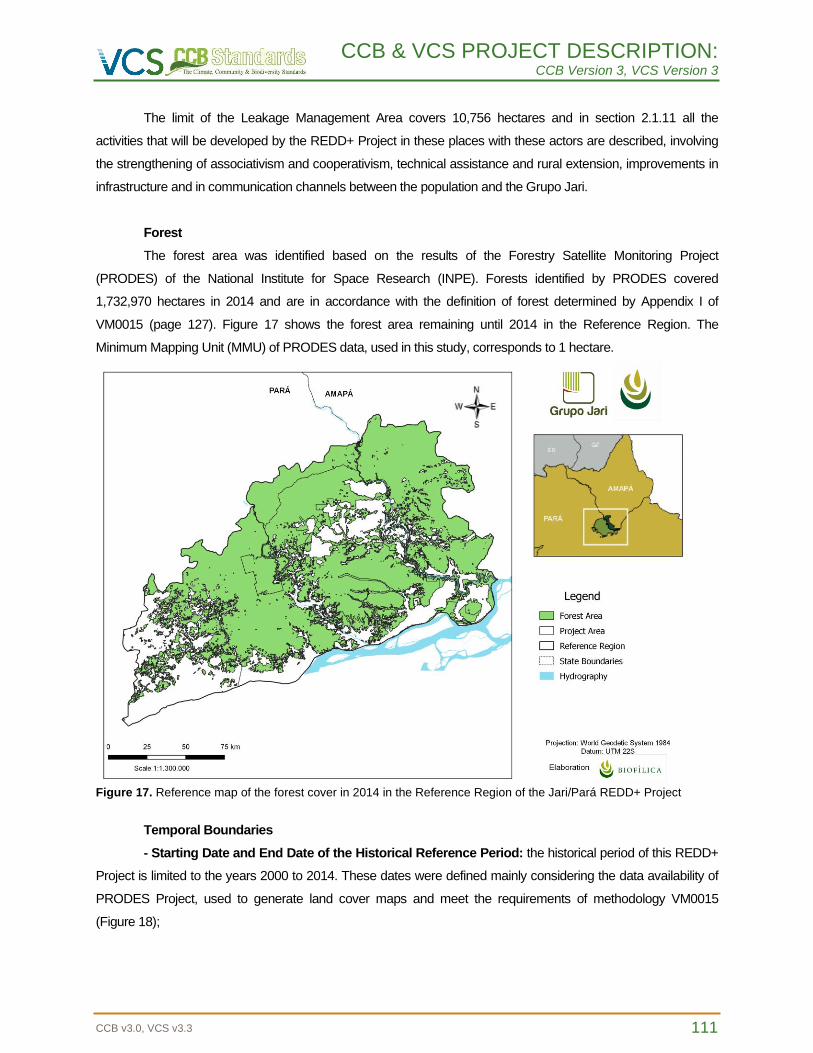
CCB & VCS PROJECT DESCRIPTION: CCB Version 3, VCS Version 3
CCB v3.0, VCS v3.3 111
The limit of the Leakage Management Area covers 10,756 hectares and in section 2.1.11 all the
activities that will be developed by the REDD+ Project in these places with these actors are described, involving
the strengthening of associativism and cooperativism, technical assistance and rural extension, improvements in
infrastructure and in communication channels between the population and the Grupo Jari.
Forest
The forest area was identified based on the results of the Forestry Satellite Monitoring Project
(PRODES) of the National Institute for Space Research (INPE). Forests identified by PRODES covered
1,732,970 hectares in 2014 and are in accordance with the definition of forest determined by Appendix I of
VM0015 (page 127). Figure 17 shows the forest area remaining until 2014 in the Reference Region. The
Minimum Mapping Unit (MMU) of PRODES data, used in this study, corresponds to 1 hectare.
Figure 17. Reference map of the forest cover in 2014 in the Reference Region of the Jari/Pará REDD+ Project
Temporal Boundaries
- Starting Date and End Date of the Historical Reference Period: the historical period of this REDD+
Project is limited to the years 2000 to 2014. These dates were defined mainly considering the data availability of
PRODES Project, used to generate land cover maps and meet the requirements of methodology VM0015
(Figure 18);
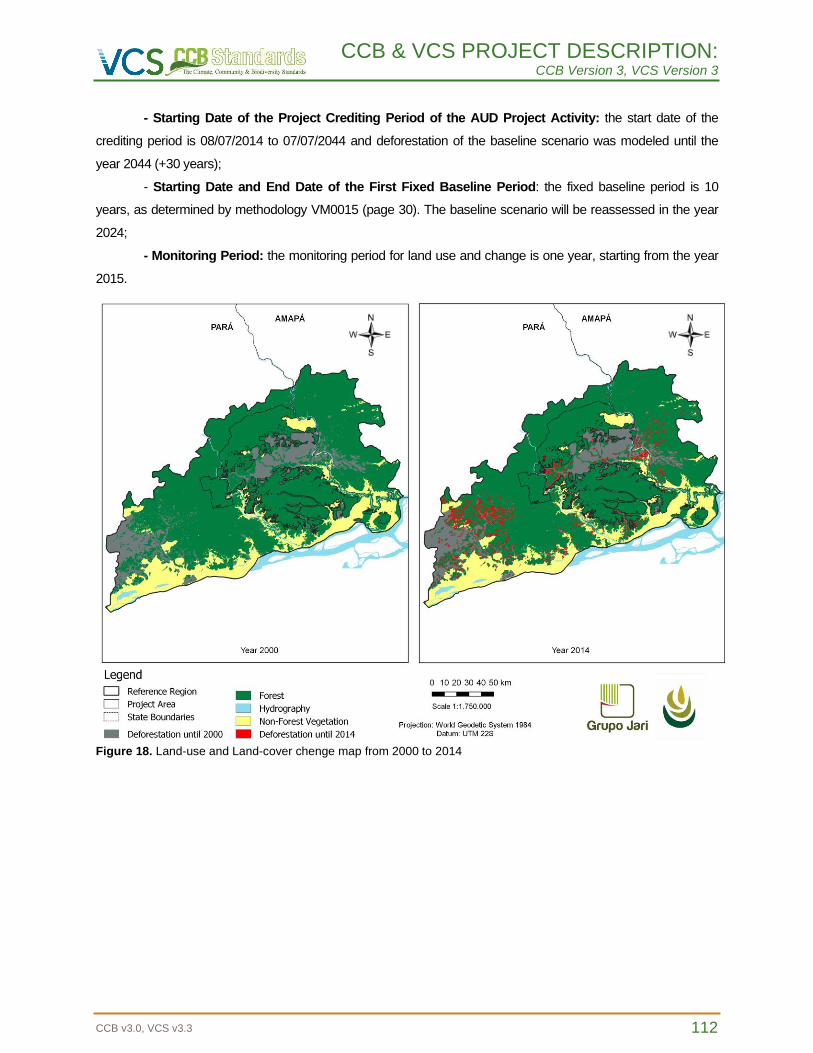
CCB & VCS PROJECT DESCRIPTION: CCB Version 3, VCS Version 3
CCB v3.0, VCS v3.3 112
- Starting Date of the Project Crediting Period of the AUD Project Activity: the start date of the
crediting period is 08/07/2014 to 07/07/2044 and deforestation of the baseline scenario was modeled until the
year 2044 (+30 years);
- Starting Date and End Date of the First Fixed Baseline Period: the fixed baseline period is 10
years, as determined by methodology VM0015 (page 30). The baseline scenario will be reassessed in the year
2024;
- Monitoring Period: the monitoring period for land use and change is one year, starting from the year
2015.
Figure 18. Land-use and Land-cover chenge map from 2000 to 2014
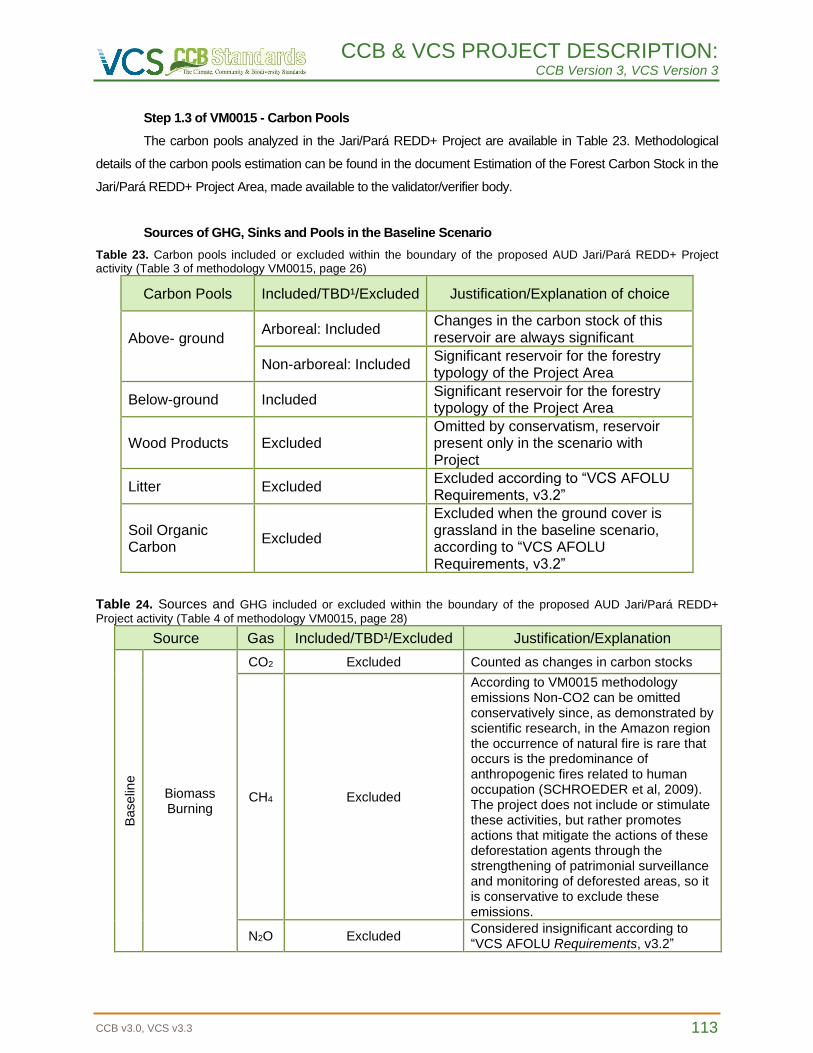
CCB & VCS PROJECT DESCRIPTION: CCB Version 3, VCS Version 3
CCB v3.0, VCS v3.3 113
Step 1.3 of VM0015 - Carbon Pools
The carbon pools analyzed in the Jari/Pará REDD+ Project are available in Table 23. Methodological
details of the carbon pools estimation can be found in the document Estimation of the Forest Carbon Stock in the
Jari/Pará REDD+ Project Area, made available to the validator/verifier body.
Sources of GHG, Sinks and Pools in the Baseline Scenario
Table 23. Carbon pools included or excluded within the boundary of the proposed AUD Jari/Pará REDD+ Project activity (Table 3 of methodology VM0015, page 26)
Carbon Pools Included/TBD¹/Excluded Justification/Explanation of choice
Above- ground
Arboreal: Included Changes in the carbon stock of this reservoir are always significant
Non-arboreal: Included Significant reservoir for the forestry typology of the Project Area
Below-ground Included Significant reservoir for the forestry typology of the Project Area
Wood Products Excluded Omitted by conservatism, reservoir present only in the scenario with Project
Litter Excluded Excluded according to “VCS AFOLU Requirements, v3.2”
Soil Organic Carbon
Excluded
Excluded when the ground cover is grassland in the baseline scenario, according to “VCS AFOLU Requirements, v3.2”
Table 24. Sources and GHG included or excluded within the boundary of the proposed AUD Jari/Pará REDD+
Project activity (Table 4 of methodology VM0015, page 28)
Source Gas Included/TBD¹/Excluded Justification/Explanation
Baselin
e
Biomass Burning
CO2 Excluded Counted as changes in carbon stocks
CH4 Excluded
According to VM0015 methodology emissions Non-CO2 can be omitted conservatively since, as demonstrated by scientific research, in the Amazon region the occurrence of natural fire is rare that occurs is the predominance of anthropogenic fires related to human occupation (SCHROEDER et al, 2009). The project does not include or stimulate these activities, but rather promotes actions that mitigate the actions of these deforestation agents through the strengthening of patrimonial surveillance and monitoring of deforested areas, so it is conservative to exclude these emissions.
N2O Excluded Considered insignificant according to “VCS AFOLU Requirements, v3.2”
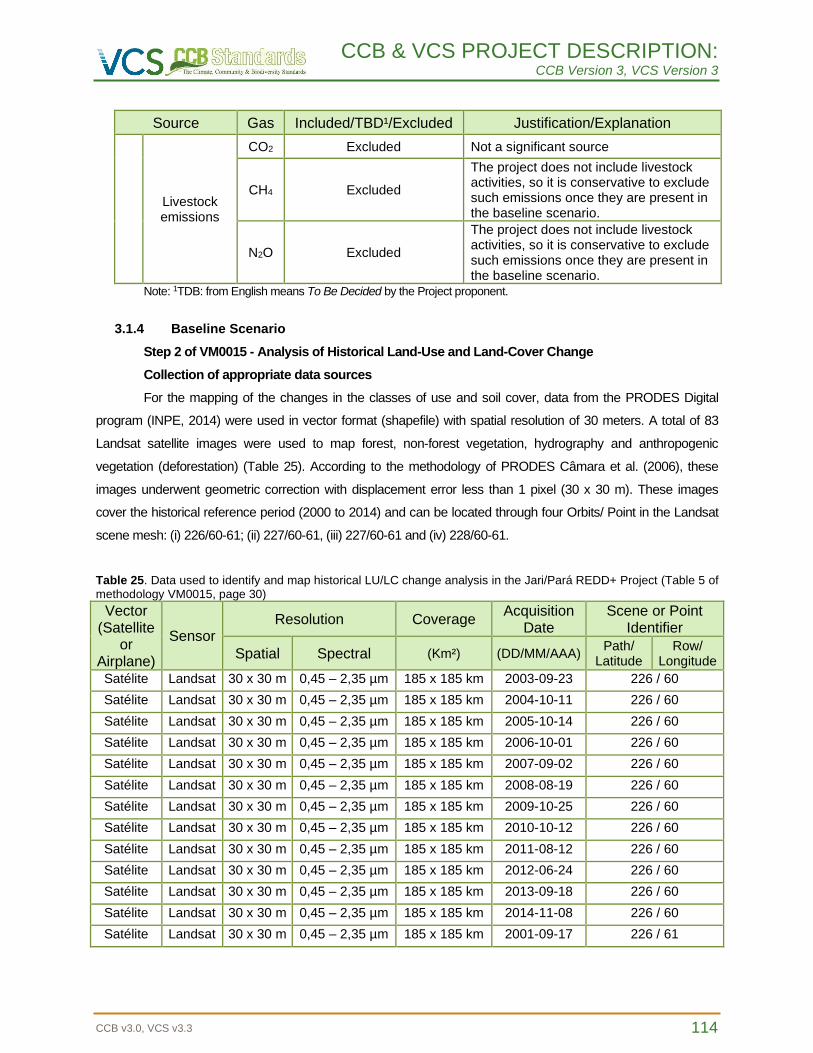
CCB & VCS PROJECT DESCRIPTION: CCB Version 3, VCS Version 3
CCB v3.0, VCS v3.3 114
Source Gas Included/TBD¹/Excluded Justification/Explanation
Livestock emissions
CO2 Excluded Not a significant source
CH4 Excluded
The project does not include livestock activities, so it is conservative to exclude such emissions once they are present in the baseline scenario.
N2O Excluded
The project does not include livestock activities, so it is conservative to exclude such emissions once they are present in the baseline scenario.
Note: 1TDB: from English means To Be Decided by the Project proponent.
3.1.4 Baseline Scenario
Step 2 of VM0015 - Analysis of Historical Land-Use and Land-Cover Change
Collection of appropriate data sources
For the mapping of the changes in the classes of use and soil cover, data from the PRODES Digital
program (INPE, 2014) were used in vector format (shapefile) with spatial resolution of 30 meters. A total of 83
Landsat satellite images were used to map forest, non-forest vegetation, hydrography and anthropogenic
vegetation (deforestation) (Table 25). According to the methodology of PRODES Câmara et al. (2006), these
images underwent geometric correction with displacement error less than 1 pixel (30 x 30 m). These images
cover the historical reference period (2000 to 2014) and can be located through four Orbits/ Point in the Landsat
scene mesh: (i) 226/60-61; (ii) 227/60-61, (iii) 227/60-61 and (iv) 228/60-61.
Table 25. Data used to identify and map historical LU/LC change analysis in the Jari/Pará REDD+ Project (Table 5 of methodology VM0015, page 30)
Vector (Satellite
or Airplane)
Sensor Resolution Coverage
Acquisition Date
Scene or Point Identifier
Spatial Spectral (Km²) (DD/MM/AAA) Path/
Latitude Row/
Longitude
Satélite Landsat 30 x 30 m 0,45 – 2,35 µm 185 x 185 km 2003-09-23 226 / 60
Satélite Landsat 30 x 30 m 0,45 – 2,35 µm 185 x 185 km 2004-10-11 226 / 60
Satélite Landsat 30 x 30 m 0,45 – 2,35 µm 185 x 185 km 2005-10-14 226 / 60
Satélite Landsat 30 x 30 m 0,45 – 2,35 µm 185 x 185 km 2006-10-01 226 / 60
Satélite Landsat 30 x 30 m 0,45 – 2,35 µm 185 x 185 km 2007-09-02 226 / 60
Satélite Landsat 30 x 30 m 0,45 – 2,35 µm 185 x 185 km 2008-08-19 226 / 60
Satélite Landsat 30 x 30 m 0,45 – 2,35 µm 185 x 185 km 2009-10-25 226 / 60
Satélite Landsat 30 x 30 m 0,45 – 2,35 µm 185 x 185 km 2010-10-12 226 / 60
Satélite Landsat 30 x 30 m 0,45 – 2,35 µm 185 x 185 km 2011-08-12 226 / 60
Satélite Landsat 30 x 30 m 0,45 – 2,35 µm 185 x 185 km 2012-06-24 226 / 60
Satélite Landsat 30 x 30 m 0,45 – 2,35 µm 185 x 185 km 2013-09-18 226 / 60
Satélite Landsat 30 x 30 m 0,45 – 2,35 µm 185 x 185 km 2014-11-08 226 / 60
Satélite Landsat 30 x 30 m 0,45 – 2,35 µm 185 x 185 km 2001-09-17 226 / 61
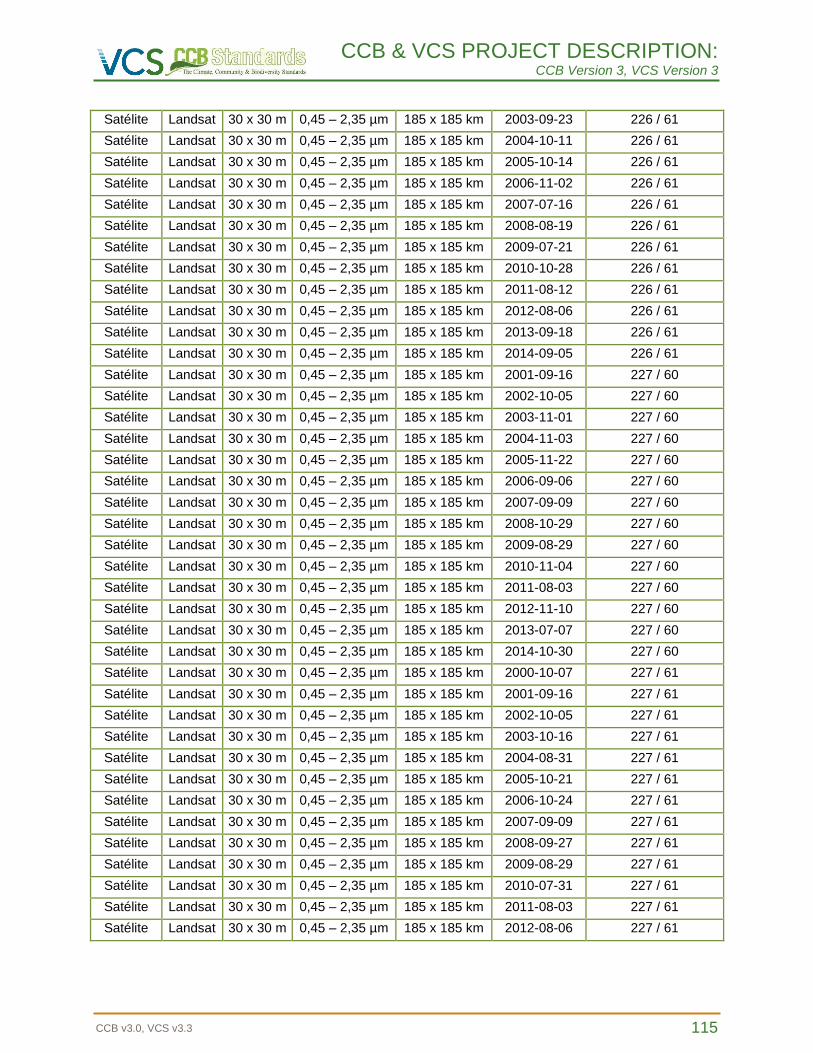
CCB & VCS PROJECT DESCRIPTION: CCB Version 3, VCS Version 3
CCB v3.0, VCS v3.3 115
Satélite Landsat 30 x 30 m 0,45 – 2,35 µm 185 x 185 km 2003-09-23 226 / 61
Satélite Landsat 30 x 30 m 0,45 – 2,35 µm 185 x 185 km 2004-10-11 226 / 61
Satélite Landsat 30 x 30 m 0,45 – 2,35 µm 185 x 185 km 2005-10-14 226 / 61
Satélite Landsat 30 x 30 m 0,45 – 2,35 µm 185 x 185 km 2006-11-02 226 / 61
Satélite Landsat 30 x 30 m 0,45 – 2,35 µm 185 x 185 km 2007-07-16 226 / 61
Satélite Landsat 30 x 30 m 0,45 – 2,35 µm 185 x 185 km 2008-08-19 226 / 61
Satélite Landsat 30 x 30 m 0,45 – 2,35 µm 185 x 185 km 2009-07-21 226 / 61
Satélite Landsat 30 x 30 m 0,45 – 2,35 µm 185 x 185 km 2010-10-28 226 / 61
Satélite Landsat 30 x 30 m 0,45 – 2,35 µm 185 x 185 km 2011-08-12 226 / 61
Satélite Landsat 30 x 30 m 0,45 – 2,35 µm 185 x 185 km 2012-08-06 226 / 61
Satélite Landsat 30 x 30 m 0,45 – 2,35 µm 185 x 185 km 2013-09-18 226 / 61
Satélite Landsat 30 x 30 m 0,45 – 2,35 µm 185 x 185 km 2014-09-05 226 / 61
Satélite Landsat 30 x 30 m 0,45 – 2,35 µm 185 x 185 km 2001-09-16 227 / 60
Satélite Landsat 30 x 30 m 0,45 – 2,35 µm 185 x 185 km 2002-10-05 227 / 60
Satélite Landsat 30 x 30 m 0,45 – 2,35 µm 185 x 185 km 2003-11-01 227 / 60
Satélite Landsat 30 x 30 m 0,45 – 2,35 µm 185 x 185 km 2004-11-03 227 / 60
Satélite Landsat 30 x 30 m 0,45 – 2,35 µm 185 x 185 km 2005-11-22 227 / 60
Satélite Landsat 30 x 30 m 0,45 – 2,35 µm 185 x 185 km 2006-09-06 227 / 60
Satélite Landsat 30 x 30 m 0,45 – 2,35 µm 185 x 185 km 2007-09-09 227 / 60
Satélite Landsat 30 x 30 m 0,45 – 2,35 µm 185 x 185 km 2008-10-29 227 / 60
Satélite Landsat 30 x 30 m 0,45 – 2,35 µm 185 x 185 km 2009-08-29 227 / 60
Satélite Landsat 30 x 30 m 0,45 – 2,35 µm 185 x 185 km 2010-11-04 227 / 60
Satélite Landsat 30 x 30 m 0,45 – 2,35 µm 185 x 185 km 2011-08-03 227 / 60
Satélite Landsat 30 x 30 m 0,45 – 2,35 µm 185 x 185 km 2012-11-10 227 / 60
Satélite Landsat 30 x 30 m 0,45 – 2,35 µm 185 x 185 km 2013-07-07 227 / 60
Satélite Landsat 30 x 30 m 0,45 – 2,35 µm 185 x 185 km 2014-10-30 227 / 60
Satélite Landsat 30 x 30 m 0,45 – 2,35 µm 185 x 185 km 2000-10-07 227 / 61
Satélite Landsat 30 x 30 m 0,45 – 2,35 µm 185 x 185 km 2001-09-16 227 / 61
Satélite Landsat 30 x 30 m 0,45 – 2,35 µm 185 x 185 km 2002-10-05 227 / 61
Satélite Landsat 30 x 30 m 0,45 – 2,35 µm 185 x 185 km 2003-10-16 227 / 61
Satélite Landsat 30 x 30 m 0,45 – 2,35 µm 185 x 185 km 2004-08-31 227 / 61
Satélite Landsat 30 x 30 m 0,45 – 2,35 µm 185 x 185 km 2005-10-21 227 / 61
Satélite Landsat 30 x 30 m 0,45 – 2,35 µm 185 x 185 km 2006-10-24 227 / 61
Satélite Landsat 30 x 30 m 0,45 – 2,35 µm 185 x 185 km 2007-09-09 227 / 61
Satélite Landsat 30 x 30 m 0,45 – 2,35 µm 185 x 185 km 2008-09-27 227 / 61
Satélite Landsat 30 x 30 m 0,45 – 2,35 µm 185 x 185 km 2009-08-29 227 / 61
Satélite Landsat 30 x 30 m 0,45 – 2,35 µm 185 x 185 km 2010-07-31 227 / 61
Satélite Landsat 30 x 30 m 0,45 – 2,35 µm 185 x 185 km 2011-08-03 227 / 61
Satélite Landsat 30 x 30 m 0,45 – 2,35 µm 185 x 185 km 2012-08-06 227 / 61
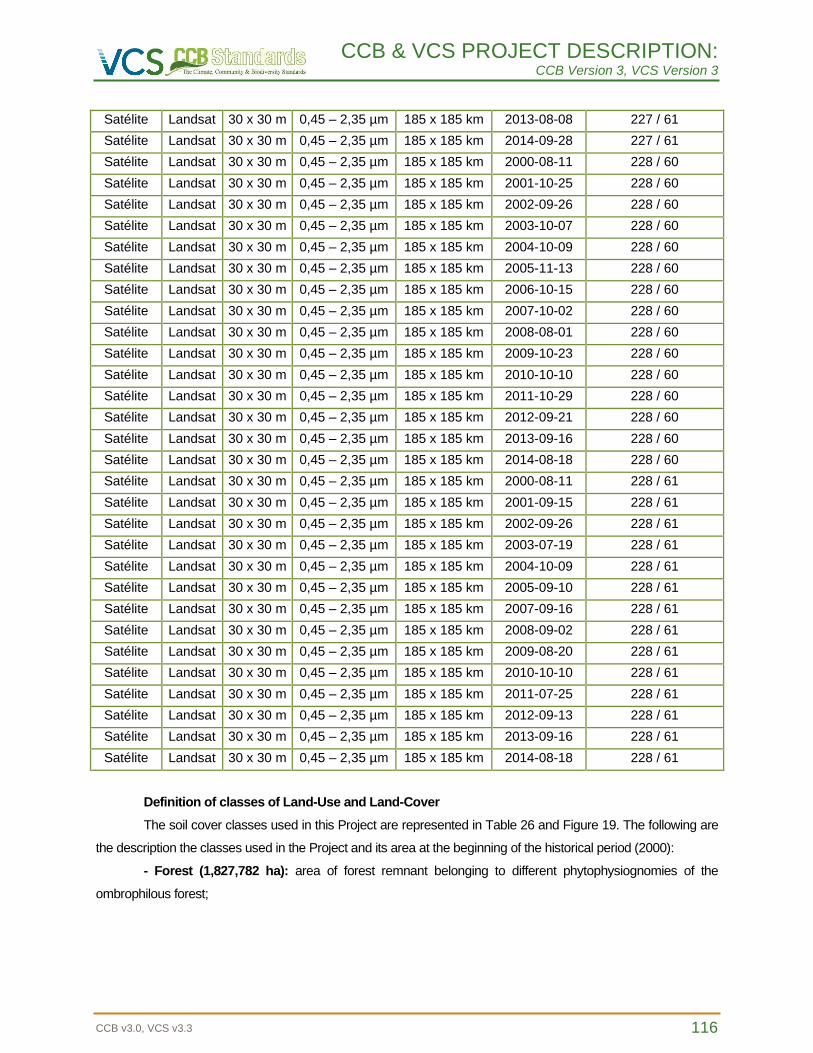
CCB & VCS PROJECT DESCRIPTION: CCB Version 3, VCS Version 3
CCB v3.0, VCS v3.3 116
Satélite Landsat 30 x 30 m 0,45 – 2,35 µm 185 x 185 km 2013-08-08 227 / 61
Satélite Landsat 30 x 30 m 0,45 – 2,35 µm 185 x 185 km 2014-09-28 227 / 61
Satélite Landsat 30 x 30 m 0,45 – 2,35 µm 185 x 185 km 2000-08-11 228 / 60
Satélite Landsat 30 x 30 m 0,45 – 2,35 µm 185 x 185 km 2001-10-25 228 / 60
Satélite Landsat 30 x 30 m 0,45 – 2,35 µm 185 x 185 km 2002-09-26 228 / 60
Satélite Landsat 30 x 30 m 0,45 – 2,35 µm 185 x 185 km 2003-10-07 228 / 60
Satélite Landsat 30 x 30 m 0,45 – 2,35 µm 185 x 185 km 2004-10-09 228 / 60
Satélite Landsat 30 x 30 m 0,45 – 2,35 µm 185 x 185 km 2005-11-13 228 / 60
Satélite Landsat 30 x 30 m 0,45 – 2,35 µm 185 x 185 km 2006-10-15 228 / 60
Satélite Landsat 30 x 30 m 0,45 – 2,35 µm 185 x 185 km 2007-10-02 228 / 60
Satélite Landsat 30 x 30 m 0,45 – 2,35 µm 185 x 185 km 2008-08-01 228 / 60
Satélite Landsat 30 x 30 m 0,45 – 2,35 µm 185 x 185 km 2009-10-23 228 / 60
Satélite Landsat 30 x 30 m 0,45 – 2,35 µm 185 x 185 km 2010-10-10 228 / 60
Satélite Landsat 30 x 30 m 0,45 – 2,35 µm 185 x 185 km 2011-10-29 228 / 60
Satélite Landsat 30 x 30 m 0,45 – 2,35 µm 185 x 185 km 2012-09-21 228 / 60
Satélite Landsat 30 x 30 m 0,45 – 2,35 µm 185 x 185 km 2013-09-16 228 / 60
Satélite Landsat 30 x 30 m 0,45 – 2,35 µm 185 x 185 km 2014-08-18 228 / 60
Satélite Landsat 30 x 30 m 0,45 – 2,35 µm 185 x 185 km 2000-08-11 228 / 61
Satélite Landsat 30 x 30 m 0,45 – 2,35 µm 185 x 185 km 2001-09-15 228 / 61
Satélite Landsat 30 x 30 m 0,45 – 2,35 µm 185 x 185 km 2002-09-26 228 / 61
Satélite Landsat 30 x 30 m 0,45 – 2,35 µm 185 x 185 km 2003-07-19 228 / 61
Satélite Landsat 30 x 30 m 0,45 – 2,35 µm 185 x 185 km 2004-10-09 228 / 61
Satélite Landsat 30 x 30 m 0,45 – 2,35 µm 185 x 185 km 2005-09-10 228 / 61
Satélite Landsat 30 x 30 m 0,45 – 2,35 µm 185 x 185 km 2007-09-16 228 / 61
Satélite Landsat 30 x 30 m 0,45 – 2,35 µm 185 x 185 km 2008-09-02 228 / 61
Satélite Landsat 30 x 30 m 0,45 – 2,35 µm 185 x 185 km 2009-08-20 228 / 61
Satélite Landsat 30 x 30 m 0,45 – 2,35 µm 185 x 185 km 2010-10-10 228 / 61
Satélite Landsat 30 x 30 m 0,45 – 2,35 µm 185 x 185 km 2011-07-25 228 / 61
Satélite Landsat 30 x 30 m 0,45 – 2,35 µm 185 x 185 km 2012-09-13 228 / 61
Satélite Landsat 30 x 30 m 0,45 – 2,35 µm 185 x 185 km 2013-09-16 228 / 61
Satélite Landsat 30 x 30 m 0,45 – 2,35 µm 185 x 185 km 2014-08-18 228 / 61
Definition of classes of Land-Use and Land-Cover
The soil cover classes used in this Project are represented in Table 26 and Figure 19. The following are
the description the classes used in the Project and its area at the beginning of the historical period (2000):
- Forest (1,827,782 ha): area of forest remnant belonging to different phytophysiognomies of the
ombrophilous forest;
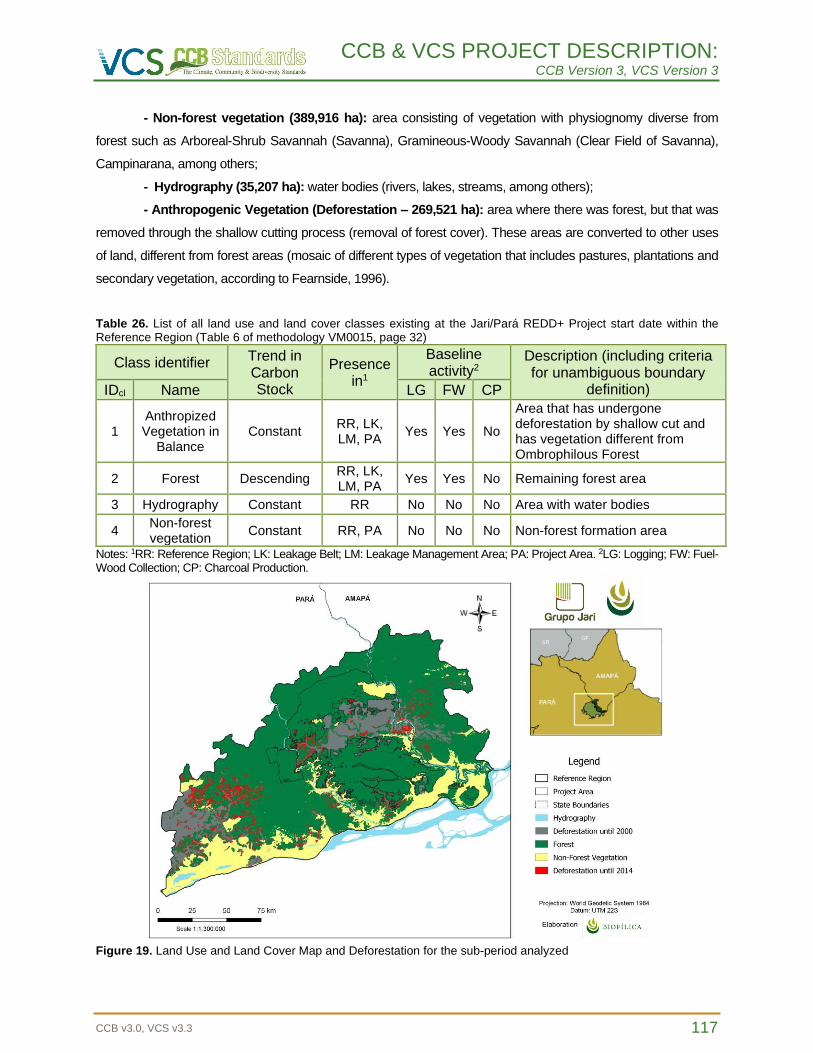
CCB & VCS PROJECT DESCRIPTION: CCB Version 3, VCS Version 3
CCB v3.0, VCS v3.3 117
- Non-forest vegetation (389,916 ha): area consisting of vegetation with physiognomy diverse from
forest such as Arboreal-Shrub Savannah (Savanna), Gramineous-Woody Savannah (Clear Field of Savanna),
Campinarana, among others;
- Hydrography (35,207 ha): water bodies (rivers, lakes, streams, among others);
- Anthropogenic Vegetation (Deforestation – 269,521 ha): area where there was forest, but that was
removed through the shallow cutting process (removal of forest cover). These areas are converted to other uses
of land, different from forest areas (mosaic of different types of vegetation that includes pastures, plantations and
secondary vegetation, according to Fearnside, 1996).
Table 26. List of all land use and land cover classes existing at the Jari/Pará REDD+ Project start date within the Reference Region (Table 6 of methodology VM0015, page 32)
Class identifier Trend in Carbon Stock
Presence in1
Baseline activity2
Description (including criteria for unambiguous boundary
definition) IDcl Name LG FW CP
1 Anthropized Vegetation in
Balance Constant
RR, LK, LM, PA
Yes Yes No
Area that has undergone deforestation by shallow cut and has vegetation different from Ombrophilous Forest
2 Forest Descending RR, LK, LM, PA
Yes Yes No Remaining forest area
3 Hydrography Constant RR No No No Area with water bodies
4 Non-forest vegetation
Constant RR, PA No No No Non-forest formation area
Notes: 1RR: Reference Region; LK: Leakage Belt; LM: Leakage Management Area; PA: Project Area. 2LG: Logging; FW: Fuel-Wood Collection; CP: Charcoal Production.
Figure 19. Land Use and Land Cover Map and Deforestation for the sub-period analyzed
CCB & VCS PROJECT DESCRIPTION: CCB Version 3, VCS Version 3
CCB v3.0, VCS v3.3 118
Definition of Categories of Land-Use and Land-Cover change
For the Jari/Pará REDD+ Project, the transition between two categories of land use was projected, with
the change of areas with forest cover to areas of anthropized vegetation (deforestation) (Table 27).
Table 27. List of land-use and land-cover change categories (Table 7b of methodology VM0015, page 33)
IDcl Name Trend in Carbon Stock
Presence in
Activity in the Baseline case1 Name
Trend in Carbon Stock
Presence in
Activity in the Project case²
LG FW CP LG FW CP
I1/F1 Forest Decreasing PA Yes Yes No Deforestation Constant LM Yes Yes No
I2/F1 Forest Decreasing LK Yes Yes No Deforestation Constant LM Yes Yes No
Note: 1LK: Leakage Belt; PA: Project Area; 2LG: Logging; FW: Fuel-Wood Collection; CP: Charcoal Production.
Analysis of the historical Land-Use and Land-Cover change
Mapping and deforestation data provided by PRODES were used to analyze the history of changes in
land use. The main activities carried out by the PRODES Project to monitor the forest cover of the Brazilian
Amazon will be detailed below.
Pre-processing
The procedures of imagery preprocessing performed by the PRODES Project are constituted in the
following steps (CÂMARA et al., 2006):
- Selection of images with lower cloud cover and acquisition date closer to dry season in the Amazon
and with adequate radiometric quality;
- Georeferencing of 30-meter spatial resolution images in 1:100,000 scale maps and NASA Ortho-
rectified MrSID format images.
Interpretation and classification
The method of classification of satellite images used by PRODES follows four main steps. First a
spectral mixing model is generated identifying the components of vegetation, soil and shade. This technique is
known as a linear spectral mixture model (MLME) that aims to estimate the percentage of vegetation, soil and
shade components for each cell (pixel) of the satellite image. The second step is the application of the
segmentation technique, which identifies in the satellite image spatially adjacent regions (segments) with similar
spectral characteristics. After segmentation, the segments are categorized individually to identify the forest, non-
forest vegetation, hydrography and deforestation classes (anthropic vegetation). Finally, the result of classified
segmentation is submitted to the process of editing or auditing the classification, performed by a specialist and
ending with the creation of state mosaics.
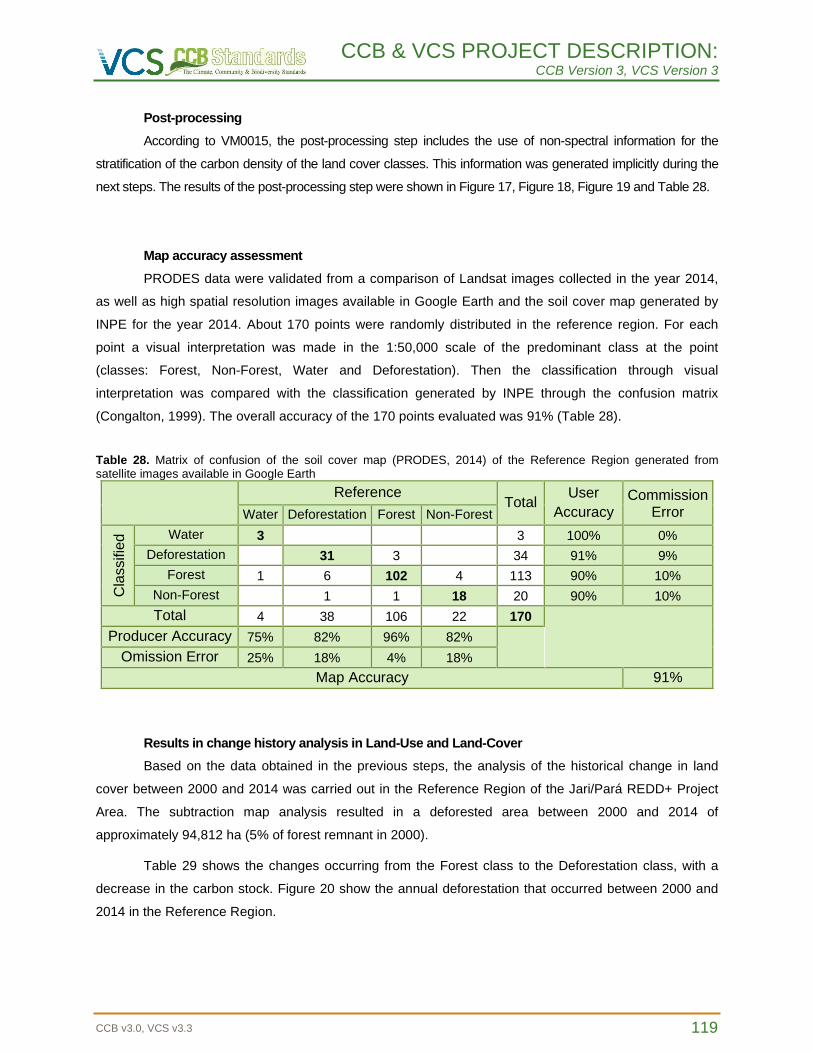
CCB & VCS PROJECT DESCRIPTION: CCB Version 3, VCS Version 3
CCB v3.0, VCS v3.3 119
Post-processing
According to VM0015, the post-processing step includes the use of non-spectral information for the
stratification of the carbon density of the land cover classes. This information was generated implicitly during the
next steps. The results of the post-processing step were shown in Figure 17, Figure 18, Figure 19 and Table 28.
Map accuracy assessment
PRODES data were validated from a comparison of Landsat images collected in the year 2014,
as well as high spatial resolution images available in Google Earth and the soil cover map generated by
INPE for the year 2014. About 170 points were randomly distributed in the reference region. For each
point a visual interpretation was made in the 1:50,000 scale of the predominant class at the point
(classes: Forest, Non-Forest, Water and Deforestation). Then the classification through visual
interpretation was compared with the classification generated by INPE through the confusion matrix
(Congalton, 1999). The overall accuracy of the 170 points evaluated was 91% (Table 28).
Table 28. Matrix of confusion of the soil cover map (PRODES, 2014) of the Reference Region generated from satellite images available in Google Earth
Reference Total
User
Accuracy Commission
Error Water Deforestation Forest Non-Forest
Cla
ssifie
d Water 3 3 100% 0%
Deforestation 31 3 34 91% 9%
Forest 1 6 102 4 113 90% 10%
Non-Forest 1 1 18 20 90% 10%
Total 4 38 106 22 170
Producer Accuracy 75% 82% 96% 82%
Omission Error 25% 18% 4% 18%
Map Accuracy 91%
Results in change history analysis in Land-Use and Land-Cover
Based on the data obtained in the previous steps, the analysis of the historical change in land
cover between 2000 and 2014 was carried out in the Reference Region of the Jari/Pará REDD+ Project
Area. The subtraction map analysis resulted in a deforested area between 2000 and 2014 of
approximately 94,812 ha (5% of forest remnant in 2000).
Table 29 shows the changes occurring from the Forest class to the Deforestation class, with a
decrease in the carbon stock. Figure 20 show the annual deforestation that occurred between 2000 and
2014 in the Reference Region.
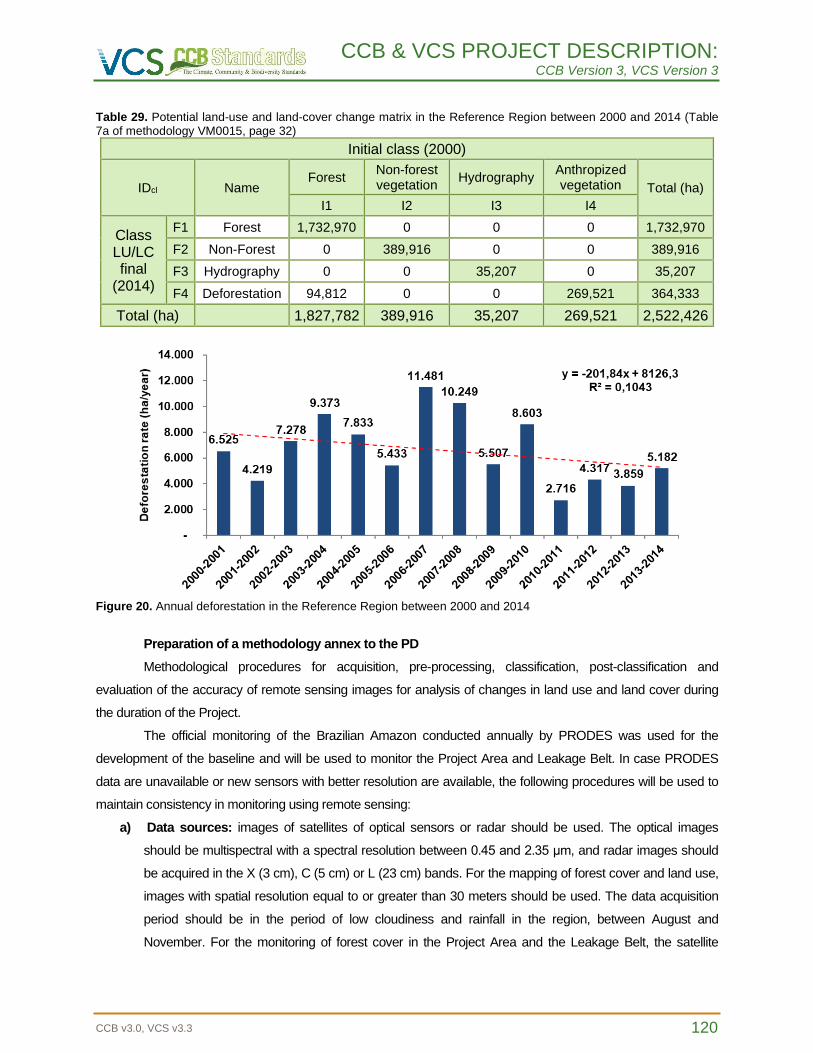
CCB & VCS PROJECT DESCRIPTION: CCB Version 3, VCS Version 3
CCB v3.0, VCS v3.3 120
Table 29. Potential land-use and land-cover change matrix in the Reference Region between 2000 and 2014 (Table 7a of methodology VM0015, page 32)
Initial class (2000)
IDcl Name Forest
Non-forest vegetation
Hydrography Anthropized vegetation Total (ha)
I1 I2 I3 I4
Class LU/LC final
(2014)
F1 Forest 1,732,970 0 0 0 1,732,970
F2 Non-Forest 0 389,916 0 0 389,916
F3 Hydrography 0 0 35,207 0 35,207
F4 Deforestation 94,812 0 0 269,521 364,333
Total (ha) 1,827,782 389,916 35,207 269,521 2,522,426
Figure 20. Annual deforestation in the Reference Region between 2000 and 2014
Preparation of a methodology annex to the PD
Methodological procedures for acquisition, pre-processing, classification, post-classification and
evaluation of the accuracy of remote sensing images for analysis of changes in land use and land cover during
the duration of the Project.
The official monitoring of the Brazilian Amazon conducted annually by PRODES was used for the
development of the baseline and will be used to monitor the Project Area and Leakage Belt. In case PRODES
data are unavailable or new sensors with better resolution are available, the following procedures will be used to
maintain consistency in monitoring using remote sensing:
a) Data sources: images of satellites of optical sensors or radar should be used. The optical images
should be multispectral with a spectral resolution between 0.45 and 2.35 μm, and radar images should
be acquired in the X (3 cm), C (5 cm) or L (23 cm) bands. For the mapping of forest cover and land use,
images with spatial resolution equal to or greater than 30 meters should be used. The data acquisition
period should be in the period of low cloudiness and rainfall in the region, between August and
November. For the monitoring of forest cover in the Project Area and the Leakage Belt, the satellite
CCB & VCS PROJECT DESCRIPTION: CCB Version 3, VCS Version 3
CCB v3.0, VCS v3.3 121
image should cover the area between the following coordinates: -2.00°/0.00°S & -54.00°/-51.50°W. They
will be used to monitor the data from the Forest Monitoring Project by satellite (PRODES Digital) of the
National Institute of Space Research (INPE) and the information provided by PRODES Digital can be
accessed at www.obt.inpe.br/prodes. Available data include shapefile and geotiff format maps on land
use and cover in the Brazilian Amazon for the base year of 1997, increased deforestation between 1997
and 2000 and annual increase for the years 2000 to 2012. PRODES Digital data are updated annually
between October and December of each year;
b) Pre-processing: the images must be geometrically corrected by means of georeferencing in the ArcGIS
10 software, using as reference topographic charts on a scale of 1:100000 or NASA images in ortho-
rectified MrSID10 format. The RMS error of the georeferencing must be less than one pixel for optical
image and approximately 1.5 pixel for radar images. The Universal Transverse Mercator (UTM)
coordinate system, Zone 22S and SIRGAS 2000 Datum must be used for all data. The vector database
provided by PRODES Digital should be converted into raster and resampled into pixels with 100 x 100 (1
ha);
c) Data classification: using multispectral images to transform values of digital numbers into scene
component (vegetation, soil and shade) by means of spectral mixing model algorithm. Select the images
of the soil and shadow component and apply the segmentation technique using the region growth
algorithm with the following similarity threshold parameters 8 and area threshold 4. The classification is
performed using the ISOSEG non-supervised algorithm with the acceptance of the 90% threshold for the
classes: forest, deforestation, non-forest vegetation, hydrography and cloud. These segmentation and
classification algorithms can be applied using the Spring 5 and TerraView 4 programs;
d) Post-Processing: the result of the classification in raster format will be transformed into vector format for
auditing the classification in ArcGis 10 For analysis of areas with cloud cover will be performed the visual
interpretation with alternative images in different dates within the same period or radar images, when
necessary will be realized through the field truth;
e) Classification accuracy assessment: was performed through the analysis of the general accuracy
and the kappa index obtained from a confusion matrix such as Congalton (1999). At least 50 randomly
distributed points from high spatial resolution satellite images ("4; 5 meters) and/or data collected in the
field are used. The minimum accuracy of classification mapping is 80%.
Step 3 of VM0015 - Analysis of agents, drivers and underlying causes of deforestation and their
likely future development
Identification of agents of deforestation
a) Name of the agents of deforestation in the Reference Region: the main agents of deforestation are
squatters.
CCB & VCS PROJECT DESCRIPTION: CCB Version 3, VCS Version 3
CCB v3.0, VCS v3.3 122
b) Relative importance of the amount of historical deforestation assigned to each agent or group:
The identified squatters account for 100% of the unplanned deforestation observed in the Reference
Region.
c) Brief Description: the deforestation agents of the Jari Valley region are mostly migrants who came
especially from other cities in the northern region of the country and the northeast region. These agents
are historically attracted to the region by enterprises such as those linked to the Jari Project,
infrastructure projects, mining, among others. In addition to the possibility of job offer, such agents are
attracted by the possibility of taking on indefinite or theoretically disputed areas. Such agents usually
invade areas belonging to the Grupo Jari claiming to be in lands that belong to the state government or
federal government. They clean up areas aims to take ownership, build improvements, and initiate
small-scale plantations and small-scale animal husbandry. Through these activities, which impact and
change the forest cover, the squatters seek to legitimize their occupation (LIMA and POZZOBON,
2005). Farmers who have been in the region for more than 10 years have as main characteristic the
development of activities related to extractivism and subsistence agriculture, being the production based
on the work force of the family. Small farms of up to 200 ha (POEMA, 2005) are formed through the
ownership of land among the squatter communities. These squatters perform deforestation for
temporary or permanent plantations and pastures at different stages of degradation. According to land
use and soil cover mapping data from the Amazon produced by the TerraClass Project (INPE and
EMBRAPA, 2014), 29% of deforested area in the Reference Region was used for the establishment of
pastures. The squatters in the Jari Valley region have a diffuse pattern of land occupation (GAVLAK,
2011), which is characterized by low density of properties, isolated occupation distributed along the main
road accesses of the region, such as areas near the roads derived from BR 156 in Amapá, PA 254 in
Pará, vicinal roads, along rivers and already occupied areas as shown in the Figure 21. Such agents
develop small-scale deforestation activities that begin with the opening of roads (bites or trails)
commonly used for encampment and which ultimately cause a deforestation clearing. Such
deforestation caused mainly by squatters occurs as a result of shifting agriculture, while the dynamics of
deforestation caused by smallholders occurs as a result of opening clearings for small-scale agriculture
and pasture areas. Added to this, much of the deforestation in the region is caused by a process called
"silent deforestation" that is very difficult to detect by satellite images (GTPPCDAP, 2009).
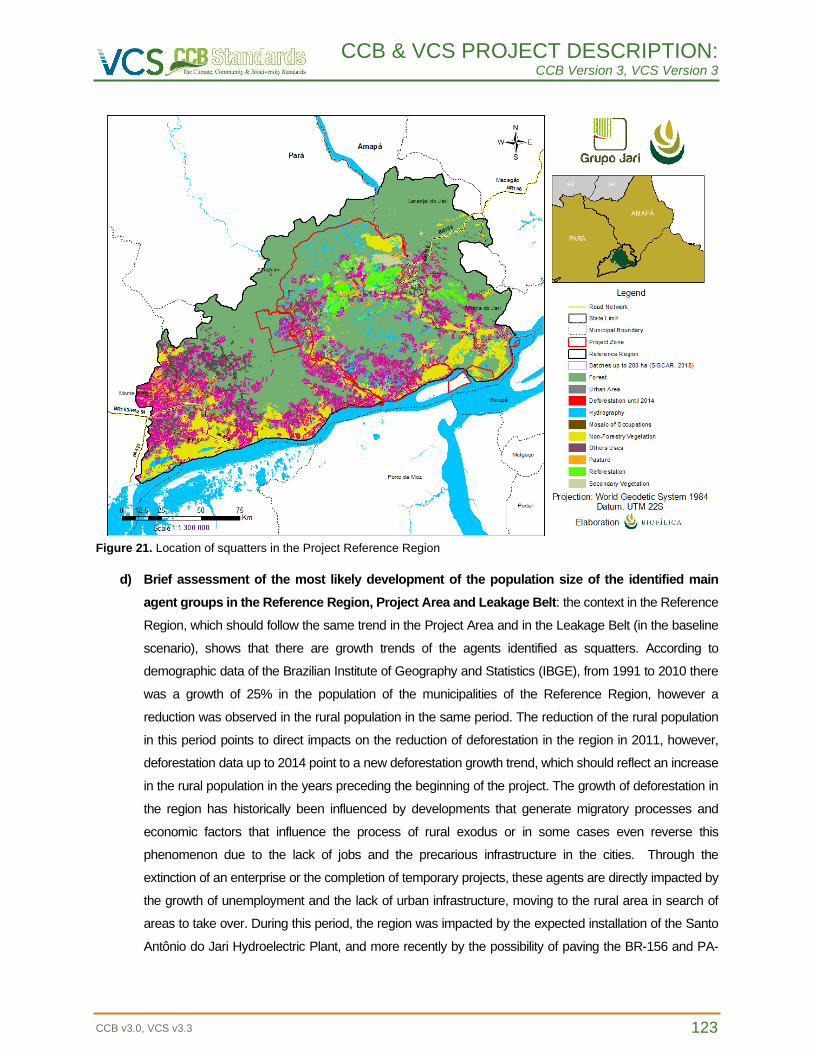
CCB & VCS PROJECT DESCRIPTION: CCB Version 3, VCS Version 3
CCB v3.0, VCS v3.3 123
Figure 21. Location of squatters in the Project Reference Region
d) Brief assessment of the most likely development of the population size of the identified main
agent groups in the Reference Region, Project Area and Leakage Belt: the context in the Reference
Region, which should follow the same trend in the Project Area and in the Leakage Belt (in the baseline
scenario), shows that there are growth trends of the agents identified as squatters. According to
demographic data of the Brazilian Institute of Geography and Statistics (IBGE), from 1991 to 2010 there
was a growth of 25% in the population of the municipalities of the Reference Region, however a
reduction was observed in the rural population in the same period. The reduction of the rural population
in this period points to direct impacts on the reduction of deforestation in the region in 2011, however,
deforestation data up to 2014 point to a new deforestation growth trend, which should reflect an increase
in the rural population in the years preceding the beginning of the project. The growth of deforestation in
the region has historically been influenced by developments that generate migratory processes and
economic factors that influence the process of rural exodus or in some cases even reverse this
phenomenon due to the lack of jobs and the precarious infrastructure in the cities. Through the
extinction of an enterprise or the completion of temporary projects, these agents are directly impacted by
the growth of unemployment and the lack of urban infrastructure, moving to the rural area in search of
areas to take over. During this period, the region was impacted by the expected installation of the Santo
Antônio do Jari Hydroelectric Plant, and more recently by the possibility of paving the BR-156 and PA-
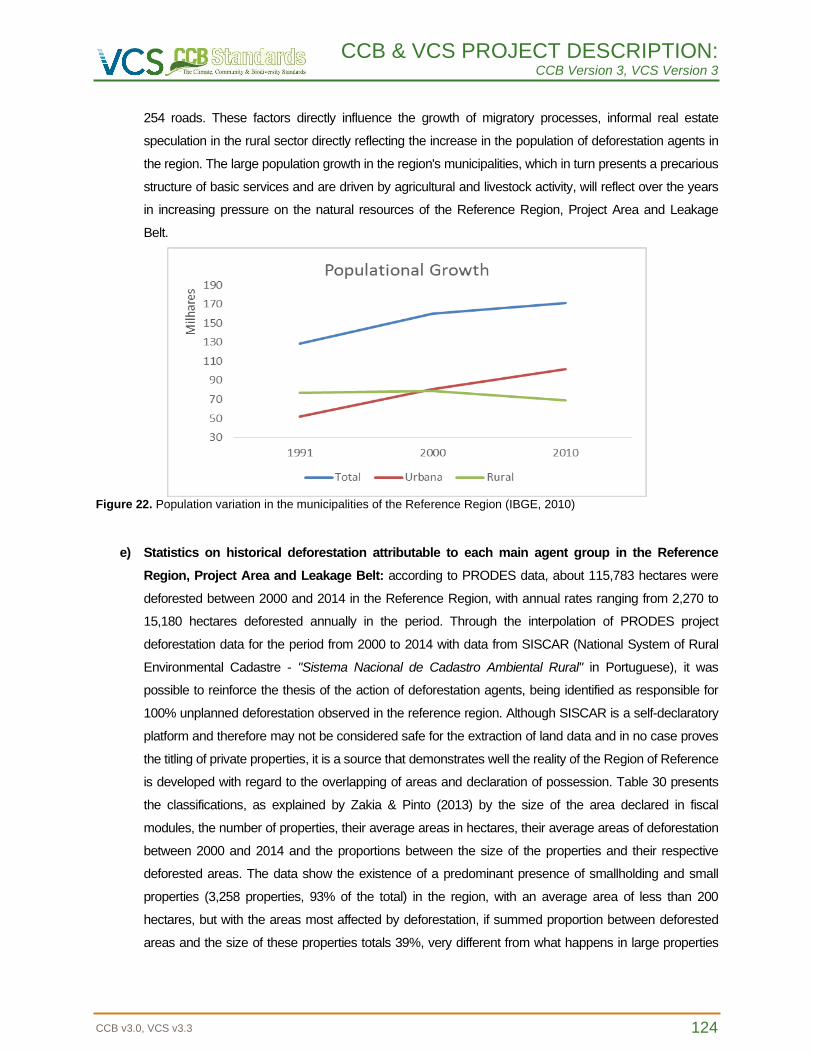
CCB & VCS PROJECT DESCRIPTION: CCB Version 3, VCS Version 3
CCB v3.0, VCS v3.3 124
254 roads. These factors directly influence the growth of migratory processes, informal real estate
speculation in the rural sector directly reflecting the increase in the population of deforestation agents in
the region. The large population growth in the region's municipalities, which in turn presents a precarious
structure of basic services and are driven by agricultural and livestock activity, will reflect over the years
in increasing pressure on the natural resources of the Reference Region, Project Area and Leakage
Belt.
Figure 22. Population variation in the municipalities of the Reference Region (IBGE, 2010)
e) Statistics on historical deforestation attributable to each main agent group in the Reference
Region, Project Area and Leakage Belt: according to PRODES data, about 115,783 hectares were
deforested between 2000 and 2014 in the Reference Region, with annual rates ranging from 2,270 to
15,180 hectares deforested annually in the period. Through the interpolation of PRODES project
deforestation data for the period from 2000 to 2014 with data from SISCAR (National System of Rural
Environmental Cadastre - "Sistema Nacional de Cadastro Ambiental Rural" in Portuguese), it was
possible to reinforce the thesis of the action of deforestation agents, being identified as responsible for
100% unplanned deforestation observed in the reference region. Although SISCAR is a self-declaratory
platform and therefore may not be considered safe for the extraction of land data and in no case proves
the titling of private properties, it is a source that demonstrates well the reality of the Region of Reference
is developed with regard to the overlapping of areas and declaration of possession. Table 30 presents
the classifications, as explained by Zakia & Pinto (2013) by the size of the area declared in fiscal
modules, the number of properties, their average areas in hectares, their average areas of deforestation
between 2000 and 2014 and the proportions between the size of the properties and their respective
deforested areas. The data show the existence of a predominant presence of smallholding and small
properties (3,258 properties, 93% of the total) in the region, with an average area of less than 200
hectares, but with the areas most affected by deforestation, if summed proportion between deforested
areas and the size of these properties totals 39%, very different from what happens in large properties
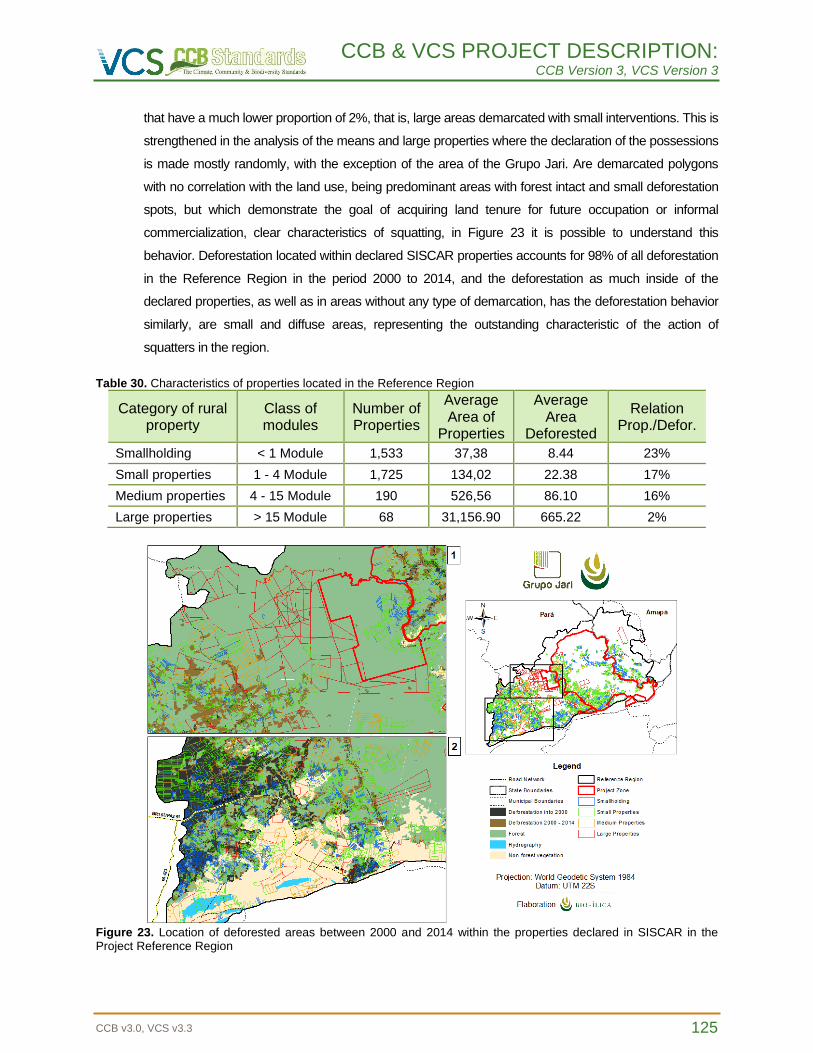
CCB & VCS PROJECT DESCRIPTION: CCB Version 3, VCS Version 3
CCB v3.0, VCS v3.3 125
that have a much lower proportion of 2%, that is, large areas demarcated with small interventions. This is
strengthened in the analysis of the means and large properties where the declaration of the possessions
is made mostly randomly, with the exception of the area of the Grupo Jari. Are demarcated polygons
with no correlation with the land use, being predominant areas with forest intact and small deforestation
spots, but which demonstrate the goal of acquiring land tenure for future occupation or informal
commercialization, clear characteristics of squatting, in Figure 23 it is possible to understand this
behavior. Deforestation located within declared SISCAR properties accounts for 98% of all deforestation
in the Reference Region in the period 2000 to 2014, and the deforestation as much inside of the
declared properties, as well as in areas without any type of demarcation, has the deforestation behavior
similarly, are small and diffuse areas, representing the outstanding characteristic of the action of
squatters in the region.
Table 30. Characteristics of properties located in the Reference Region
Category of rural property
Class of modules
Number of Properties
Average Area of
Properties
Average Area
Deforested
Relation Prop./Defor.
Smallholding < 1 Module 1,533 37,38 8.44 23%
Small properties 1 - 4 Module 1,725 134,02 22.38 17%
Medium properties 4 - 15 Module 190 526,56 86.10 16%
Large properties > 15 Module 68 31,156.90 665.22 2%
Figure 23. Location of deforested areas between 2000 and 2014 within the properties declared in SISCAR in the Project Reference Region
CCB & VCS PROJECT DESCRIPTION: CCB Version 3, VCS Version 3
CCB v3.0, VCS v3.3 126
Identification of deforestation drivers
a) Driver variables that explain the quantity (hectares) of deforestation
• Population growth;
• Demand for new areas for agriculture and small pasture.
Population growth:
1. Brief description: The Reference Region is located in a new frontier of expansion of the Amazon
region, presenting a process of constant migration of workers to support the projects in the region. In the
past, the installation of the Jari Project started the irregular formation of the Laranjal do Jari
encampment, which housed most of the manual workers who served the construction project. This is a
common phenomenon in the Amazon region, where it is estimated that on average 40% of the migratory
population of medium and large projects end up establishing themselves in the regions, after the
completion of the construction of the projects. Among the infrastructure projects in the vicinity of the
Reference Region, which are a major influence on population growth, the construction of the Santo
Antônio hydroelectric plant - in the northeast portion of the region - is scheduled to begin in 2011 and
start operations in 2015; the BR-156 paving project linking Laranjal do Jari to the capital of Amapá, and
PA-254 to the southwest linking the municipalities of Prainha to Oriximiná; and the activities related to
the construction and maintenance of the Oriximiná-Jurupari-Laranjal Transmission Line.
2. Impact on agent group’s decision to deforest: Infrastructure projects already carried out in the past or
planned for the coming years represent a major impact on the behavior of deforestation agents, since
such investments attract labor from other regions and still generate expectations of economic growth in
the region.
3. Likely future development: The influence of the infrastructure projects on the deforestation dynamics
of the region was simulated in the deforestation model following the same methodology as the REDD+
Jari/Amapá Project. The main assumption was that population growth may increase the risk of
deforestation in the vicinity of the Santo Antônio hydroelectric plant, the BR-156 and PA-254 highways,
and the Oriximiná-Jurupari-Laranjal transmission line. The official population data (IBGE) refer to
municipalities, since these are areas of great extensions and the Reference Region is constituted by
several parts of the same, besides the data outdated, it is not possible to accurately raise the population
numbers of the project region, because of this, it is considered that the population projection data have
low accuracy to be projected, the use of an attractiveness mask was adopted – same procedure
validated in VCS REDD+ Jari/Amapá.
4. Measures that will be implemented: Infrastructure projects represent a real possibility of developing
and attracting investments to more remote regions in the Amazon, but generate speculative processes
that do not correspond to real demand. In these processes, hundreds of families are attracted to these
regions with prospects of jobs and a new life, a fact that does not become reality in most cases. The
tendency of marginalization of a large part of the population, due to the lack of employment and
CCB & VCS PROJECT DESCRIPTION: CCB Version 3, VCS Version 3
CCB v3.0, VCS v3.3 127
infrastructure in urban areas, directly influences the demand for rural areas and the exploitation of
natural resources. In this context, the project intends to work directly with the rural populations in the
project zone, fomenting actions that provide socioeconomic development in the field, the application of
responsible agricultural practices and the reduction of predatory exploitation of natural resources. In this
way, the project aims to propagate responsible and whenever possible sustainable practices in the
region, generating socioeconomic development and mitigating the impacts generated by population
growth.
Demand for new areas for agriculture and small pasture:
1. Brief description: Between 2000 and 2014 92,575 hectares were deforested in the Reference Region,
representing an annual average of 6,613 hectares. According to Poema (2005), up to 2005 there were
2,348 rural families (squatters) living in the Jari Valley. According to data collected in the field and
presented by these authors, a rural family deforests an average of 1 ha/year for planting the plot, or up to
2 ha/year considering that most of the families maintain two plots. This can have an impact on the forest
between 2,500 and 5,000 ha per year in the region. In addition to the area opened annually by rural
families, the dynamics of demand for agricultural areas is influenced by population growth in the region,
since rural population growth is directly related to deforestation, as highlighted in the analysis of
deforestation agents.
2. Impact on agent group’s decision to deforest: The demand for new areas of agriculture is influenced
by two main factors: the lack of technical knowledge of the rural families, who need to enlarge the
cultivated area due to the low productivity of the plantations; and population growth, which increases the
pressure for natural resources in rural areas that are easily accessible. Since, in the scenario without
project, there is no prospect of a shift from productive systems to a model of agriculture less impacting to
the environment, added to the tendency of population growth in the region, the most probable behavior
of the agents is related to the practices implemented in the scenario business as usual, increasing the
demand for new areas.
3. Likely future development: According to IBGE data, during the reference period analyzed (2000-
2014), there was a 43% increase in the area used for agriculture in the municipalities of the Reference
Region (SIDRA/IBGE, 2014). In addition, it is important to note that IBGE data are official and refer to the
formal agricultural production in these municipalities. On the other hand, much of the agro-extractive
production in the region still informal and there are no clear Figures for the total area used for agriculture
by the rural population of the region. Nevertheless, the indicators of population growth and deforestation
in the region in recent years point to a constant trend of increasing demand for agricultural areas.
4. Measures that will be implemented: The actions planned to be implemented during the project
management plan will have as main objective the promotion of socioeconomic development in the field,
offering alternatives for families to diversify and increase their productions. Through the provision of
technical assistance and organizational support, the project aims to reduce the progress of families over
CCB & VCS PROJECT DESCRIPTION: CCB Version 3, VCS Version 3
CCB v3.0, VCS v3.3 128
the forest, as well as to provide for the reforestation of degraded areas with the use of species of
economic interest.
b) Driver variables explaining the location of deforestation
Using the weight-of-evidence method, developed by Sangermano et al. (2010), it was calculated the
influence of 9 spatial variables on the occurrence of deforestation in the Reference Region. This method is used
to evaluate the importance of the independent variables, comparing the standard deviation of the independent
variables inside and outside deforestation. These variables were analyzed in the calibration period of the specially
explicit model (2000-2007), serving as a basis for the projection of the deforestation scenario. Figure 32 shows
the importance level of each of the variables on a scale from 0 (zero) to 1 (one), where values close to "one"
indicate greater importance. It can be observed that the distance from the deforestation increment and the old
deforestation were the most significant variables for the special modeling of deforestation.
List of Drivers that explain the location of deforestation
• Distance of deforestation increment;
• Distance from settlements;
• Distance from old deforestation;
• Distance from roads;
• Geology;
• Slope;
• Elevation of the Terrain;
• Hydrography distance;
• Distance from roads used by Grupo Jari.
The description of the variables analyzed to explain the occurrence of deforestation in the
historical reference period is presented below
Deforestation increment distance: Variation of the Euclidean distance of the deforestation increment
cells within the historical period analyzed. Represents edge areas of the forest that can be transformed into
another type of land cover due to the proximity to previously deforested areas.
Settlement distance: Variation of the Euclidean distance of the rural settlements defined by INCRA.
The distance from rural settlements influences the action of deforestation agents.
Distance from old deforestation: Variation of the Euclidean distance of accumulated deforestation to
the first year of the historical reference period (2000). Represents edge areas of the forest that can be
transformed into another type of land cover due to proximity to previously cleared areas.
CCB & VCS PROJECT DESCRIPTION: CCB Version 3, VCS Version 3
CCB v3.0, VCS v3.3 129
Distance from roads: Variation of the Euclidean distance of the official and unofficial roads of the
Reference Region. Forests close to roads and branches are more accessible and thus become more susceptible
to deforestation.
Geology: Variation of the empirical probability of changes in land use in different geological classes.
Some geological classes are more susceptible to deforestation than others.
Slope: Variation of mean slope per mapped cell in the Reference Region. The degree of slope of the
terrain has a direct influence on the possibility of occurrence of deforestation.
Elevation in terrain: Variation of average elevation per cell mapped in the Reference Region. Variations
in land elevation directly influence the probability of occurrence of deforestation.
Hydrographic distance: Variation of the Euclidean distance of the navigable rivers of the Reference
Region. Forests close to navigable rivers are also more accessible and thus more susceptible to deforestation.
Distance from Jari roads: Variation of the Euclidean distance of the roads used by Grupo Jari. Forests
close to roads and branches are more accessible and thus become more susceptible to deforestation.
c) Identification of underlying causes of deforestation
1. Brief Description: The implementation of large infrastructure projects, population settlements and
activities related to agriculture and livestock are directly related to deforestation rates in the Amazon
region. Lately, there has been an increase in the action of diffuse deforestation, that is, caused by small
farmers and squatters, and over the years may become a linear pattern (deforestation along roads and
branches) and become large patches of deforested areas (GAVLAK, 2011). The Reference Region of
the Project has a high potential for forest exploitation, since it was not explored with the same intensity
as other regions in the Amazon deforestation arch. In this way it is evident that it is a region of great
economic potential for illegal logging activity - common in the expansion frontiers in the Amazon.
2. Impact on agent group’s decision to deforest: The opening of roads followed by the consolidation of
infrastructures are the main steps for the expansion of deforestation in frontier areas, as is the case of
the Reference Region. Therefore, as new infrastructure projects are implemented, and access logistics
becomes more attractive to the region, different agents may be drawn in search of natural resources
such as timber and mining, or real estate speculation.
3. Likely future development: Consolidated infrastructure projects such as the construction of the Santo
Antônio hydroelectric plant, the paving of the BR-156 and PA-245 highways, and the installation of the
Oriximiná-Jurupari-Laranjal transmission line, as well as projects under development such as the
Hydroelectric Panama, which should be installed near the waterfall of the same name in the Paru River,
represent a great potential of influence in the deforestation, causing, besides social impacts, great
pressure on natural resources of the region. In addition, the context of fragility, or in some cases non-
existent, governance of the federal and state governments (Pará and Amapá) may aggravate these
problems, resulting in impunity for most illegal practices and potentially causing a significant increase in
deforestation in the region.
CCB & VCS PROJECT DESCRIPTION: CCB Version 3, VCS Version 3
CCB v3.0, VCS v3.3 130
4. Measures that will be implemented: the actions proposed by the project should counterpoint the trend
of continuity of the activities carried out in the business as usual scenario. Through actions that
encourage the responsible exploitation of natural resources, low carbon agriculture and the recovery of
degraded areas, the project should promote the conservation of natural resources coupled with
socioeconomic development. From these initiatives it is expected that most of the potential impacts that
would be generated by the agents, drivers and underlying causes will be mitigated in the project
scenario.
d) Analysis of chain of events leading to deforestation
The chain of events leading to deforestation in the project region is initially driven by planning for
infrastructure implementation, which promote migratory movements along with the need to open up forest areas,
generating real estate speculation and access to previously remote areas. This process began in the northern
region of Brazil through colonization projects, such as the Jari Project itself implemented in the late 1960s.
The population growth generated by the investments in infrastructure and enterprises/undertakings
installed in the region, initially demand the opening of areas for roads, delimitation of urban areas and areas for
installation of improvements. In a second moment, with the growth of the migratory process, many of these
people settle in rural and peripheral areas of the enterprises/undertakings. These agents began to live on agro-
extractive production, mixing extractive practices with subsistence agriculture, standing out in the Jari Valley the
production of cassava and the extraction of Brazil nuts (GRUPO ORSA/ICCO/BOP INOVATION, 2010).
In the common practice scenario of carried out by the agents identified in the region, it is characterized
the opening of plots for the implementation of agricultural crops. The practices adopted by these agents, such as
fires, and deforestation to the edge of the rivers, besides generating environmental impact, reduce the
productivity of the plantations, generating the need to open new forest areas to maintain production. This context
is directly related to other factors, such as low diversification of production and low productivity, and the difficulty
of accessing public policies, which results in low levels of income for these agents.
Over the years infrastructure projects generate a great social burden for the region, since they foment
the population growth in regions of low government performance, which, in turn, does not offer the basic
conditions to provide the adequate development of these regions. This scenario results in the growth of illegal
activities, the disFigurament of forests, and the disorderly occupation of the territory.
The deforestation identified in the project region within the historical reference period shows great
influence from the proximity of roads, branches, navigable rivers and previously deforested areas. This pattern is
common throughout the Amazon, but becomes more evident in the project region, since most of the region's
forests are still preserved due to difficult access.
e) Conclusion
Based on the data and information presented in the socioeconomic diagnoses carried out by the project
(Casa da Floresta, 2016, Coutinho, 2018) and other studies used as reference (POEMA, 2005,
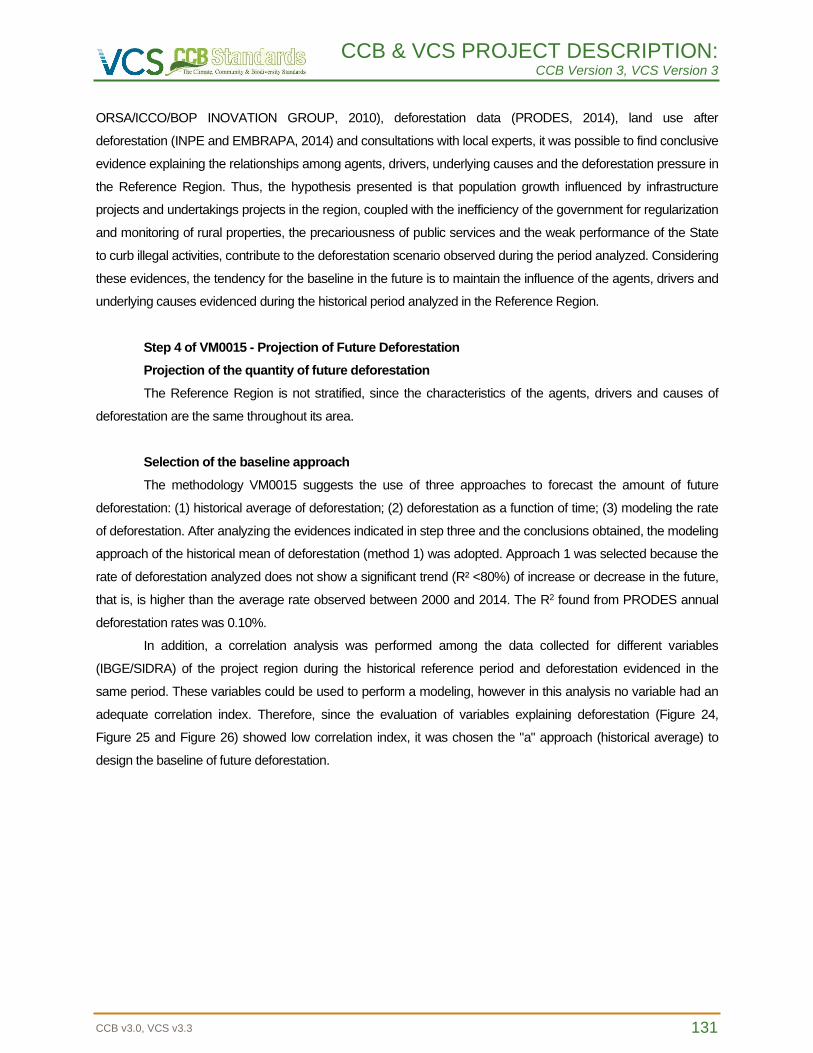
CCB & VCS PROJECT DESCRIPTION: CCB Version 3, VCS Version 3
CCB v3.0, VCS v3.3 131
ORSA/ICCO/BOP INOVATION GROUP, 2010), deforestation data (PRODES, 2014), land use after
deforestation (INPE and EMBRAPA, 2014) and consultations with local experts, it was possible to find conclusive
evidence explaining the relationships among agents, drivers, underlying causes and the deforestation pressure in
the Reference Region. Thus, the hypothesis presented is that population growth influenced by infrastructure
projects and undertakings projects in the region, coupled with the inefficiency of the government for regularization
and monitoring of rural properties, the precariousness of public services and the weak performance of the State
to curb illegal activities, contribute to the deforestation scenario observed during the period analyzed. Considering
these evidences, the tendency for the baseline in the future is to maintain the influence of the agents, drivers and
underlying causes evidenced during the historical period analyzed in the Reference Region.
Step 4 of VM0015 - Projection of Future Deforestation
Projection of the quantity of future deforestation
The Reference Region is not stratified, since the characteristics of the agents, drivers and causes of
deforestation are the same throughout its area.
Selection of the baseline approach
The methodology VM0015 suggests the use of three approaches to forecast the amount of future
deforestation: (1) historical average of deforestation; (2) deforestation as a function of time; (3) modeling the rate
of deforestation. After analyzing the evidences indicated in step three and the conclusions obtained, the modeling
approach of the historical mean of deforestation (method 1) was adopted. Approach 1 was selected because the
rate of deforestation analyzed does not show a significant trend (R² <80%) of increase or decrease in the future,
that is, is higher than the average rate observed between 2000 and 2014. The R2 found from PRODES annual
deforestation rates was 0.10%.
In addition, a correlation analysis was performed among the data collected for different variables
(IBGE/SIDRA) of the project region during the historical reference period and deforestation evidenced in the
same period. These variables could be used to perform a modeling, however in this analysis no variable had an
adequate correlation index. Therefore, since the evaluation of variables explaining deforestation (Figure 24,
Figure 25 and Figure 26) showed low correlation index, it was chosen the "a" approach (historical average) to
design the baseline of future deforestation.
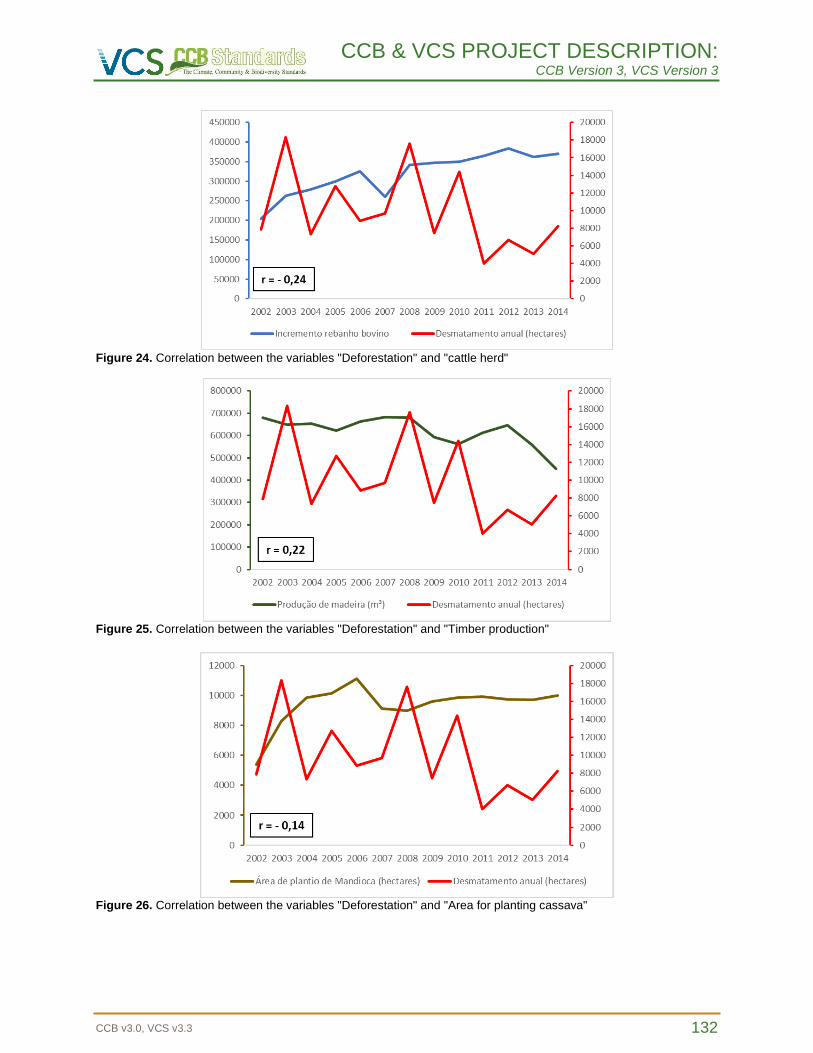
CCB & VCS PROJECT DESCRIPTION: CCB Version 3, VCS Version 3
CCB v3.0, VCS v3.3 132
Figure 24. Correlation between the variables "Deforestation" and "cattle herd"
Figure 25. Correlation between the variables "Deforestation" and "Timber production"
Figure 26. Correlation between the variables "Deforestation" and "Area for planting cassava"
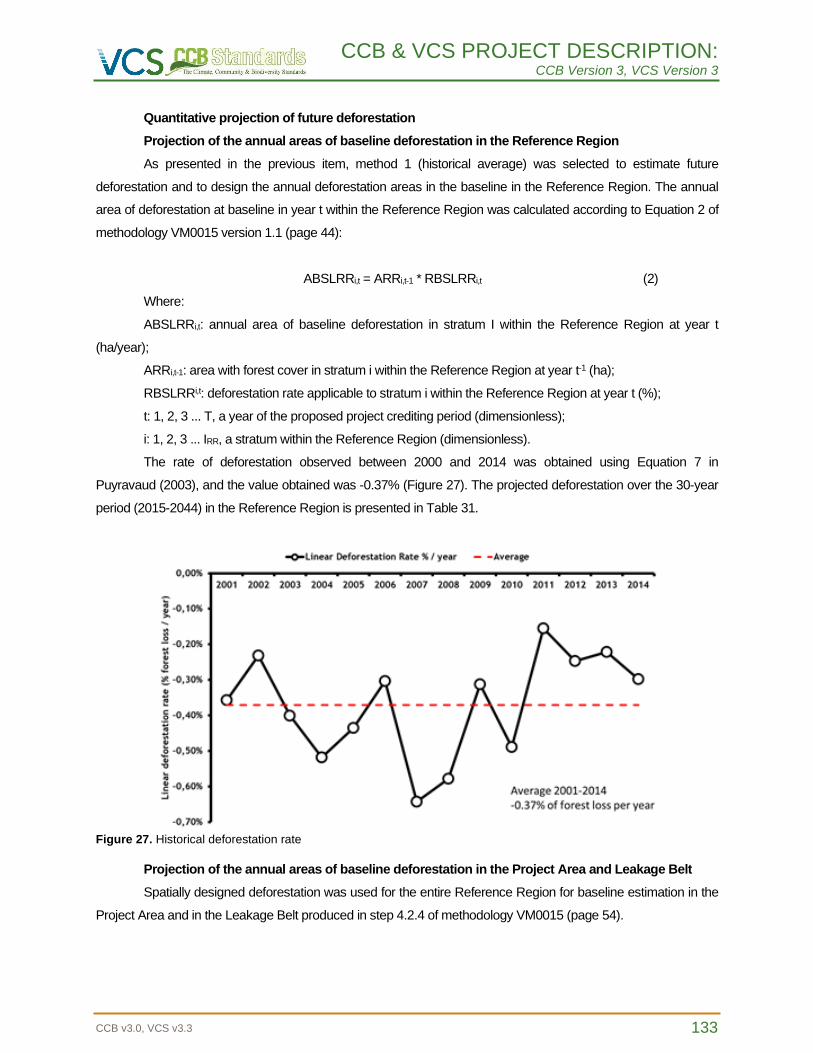
CCB & VCS PROJECT DESCRIPTION: CCB Version 3, VCS Version 3
CCB v3.0, VCS v3.3 133
Quantitative projection of future deforestation
Projection of the annual areas of baseline deforestation in the Reference Region
As presented in the previous item, method 1 (historical average) was selected to estimate future
deforestation and to design the annual deforestation areas in the baseline in the Reference Region. The annual
area of deforestation at baseline in year t within the Reference Region was calculated according to Equation 2 of
methodology VM0015 version 1.1 (page 44):
ABSLRRi,t = ARRi,t-1 * RBSLRRi,t (2)
Where:
ABSLRRi,t: annual area of baseline deforestation in stratum I within the Reference Region at year t
(ha/year);
ARRi,t-1: area with forest cover in stratum i within the Reference Region at year t-1 (ha);
RBSLRRi,t: deforestation rate applicable to stratum i within the Reference Region at year t (%);
t: 1, 2, 3 ... T, a year of the proposed project crediting period (dimensionless);
i: 1, 2, 3 ... IRR, a stratum within the Reference Region (dimensionless).
The rate of deforestation observed between 2000 and 2014 was obtained using Equation 7 in
Puyravaud (2003), and the value obtained was -0.37% (Figure 27). The projected deforestation over the 30-year
period (2015-2044) in the Reference Region is presented in Table 31.
Figure 27. Historical deforestation rate
Projection of the annual areas of baseline deforestation in the Project Area and Leakage Belt
Spatially designed deforestation was used for the entire Reference Region for baseline estimation in the
Project Area and in the Leakage Belt produced in step 4.2.4 of methodology VM0015 (page 54).
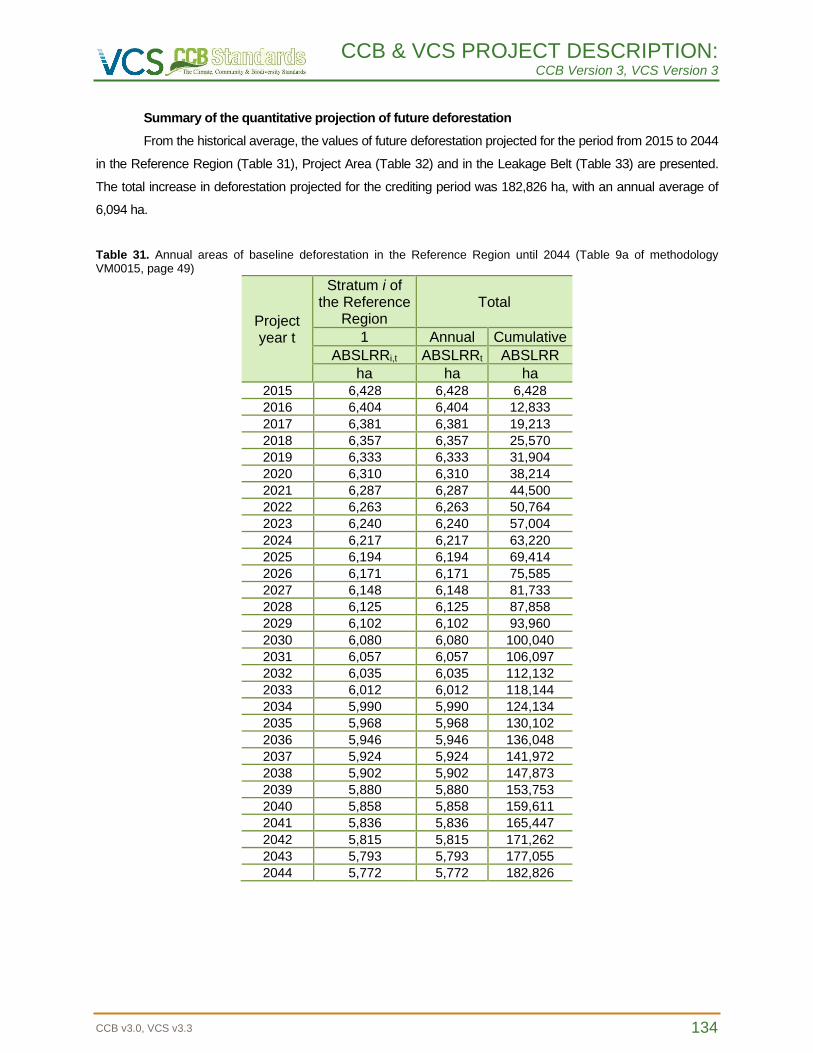
CCB & VCS PROJECT DESCRIPTION: CCB Version 3, VCS Version 3
CCB v3.0, VCS v3.3 134
Summary of the quantitative projection of future deforestation
From the historical average, the values of future deforestation projected for the period from 2015 to 2044
in the Reference Region (Table 31), Project Area (Table 32) and in the Leakage Belt (Table 33) are presented.
The total increase in deforestation projected for the crediting period was 182,826 ha, with an annual average of
6,094 ha.
Table 31. Annual areas of baseline deforestation in the Reference Region until 2044 (Table 9a of methodology VM0015, page 49)
Project year t
Stratum i of the Reference
Region Total
1 Annual Cumulative
ABSLRRi,t ABSLRRt ABSLRR
ha ha ha 2015 6,428 6,428 6,428
2016 6,404 6,404 12,833
2017 6,381 6,381 19,213
2018 6,357 6,357 25,570
2019 6,333 6,333 31,904
2020 6,310 6,310 38,214
2021 6,287 6,287 44,500
2022 6,263 6,263 50,764
2023 6,240 6,240 57,004
2024 6,217 6,217 63,220
2025 6,194 6,194 69,414
2026 6,171 6,171 75,585
2027 6,148 6,148 81,733
2028 6,125 6,125 87,858
2029 6,102 6,102 93,960
2030 6,080 6,080 100,040
2031 6,057 6,057 106,097
2032 6,035 6,035 112,132
2033 6,012 6,012 118,144
2034 5,990 5,990 124,134
2035 5,968 5,968 130,102
2036 5,946 5,946 136,048
2037 5,924 5,924 141,972
2038 5,902 5,902 147,873
2039 5,880 5,880 153,753
2040 5,858 5,858 159,611
2041 5,836 5,836 165,447
2042 5,815 5,815 171,262
2043 5,793 5,793 177,055
2044 5,772 5,772 182,826
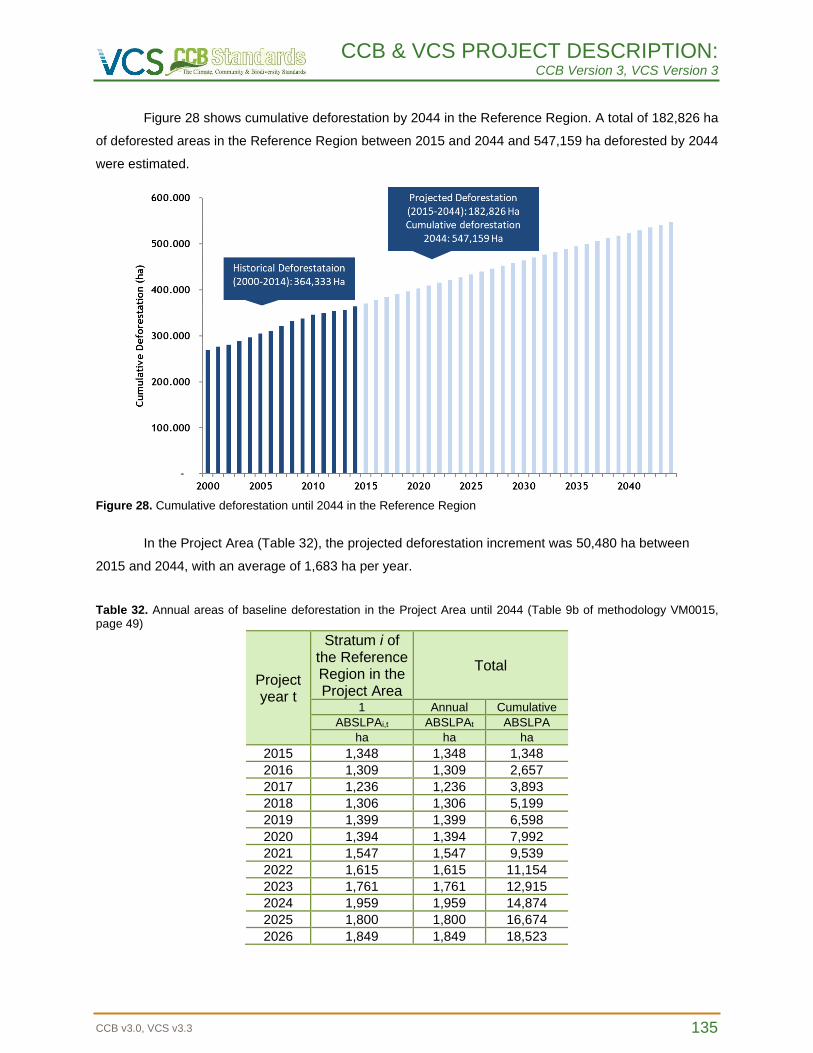
CCB & VCS PROJECT DESCRIPTION: CCB Version 3, VCS Version 3
CCB v3.0, VCS v3.3 135
Figure 28 shows cumulative deforestation by 2044 in the Reference Region. A total of 182,826 ha
of deforested areas in the Reference Region between 2015 and 2044 and 547,159 ha deforested by 2044
were estimated.
Figure 28. Cumulative deforestation until 2044 in the Reference Region
In the Project Area (Table 32), the projected deforestation increment was 50,480 ha between
2015 and 2044, with an average of 1,683 ha per year.
Table 32. Annual areas of baseline deforestation in the Project Area until 2044 (Table 9b of methodology VM0015, page 49)
Project year t
Stratum i of the Reference Region in the Project Area
Total
1 Annual Cumulative
ABSLPAi,t ABSLPAt ABSLPA
ha ha ha
2015 1,348 1,348 1,348
2016 1,309 1,309 2,657
2017 1,236 1,236 3,893
2018 1,306 1,306 5,199
2019 1,399 1,399 6,598
2020 1,394 1,394 7,992
2021 1,547 1,547 9,539
2022 1,615 1,615 11,154
2023 1,761 1,761 12,915
2024 1,959 1,959 14,874
2025 1,800 1,800 16,674
2026 1,849 1,849 18,523
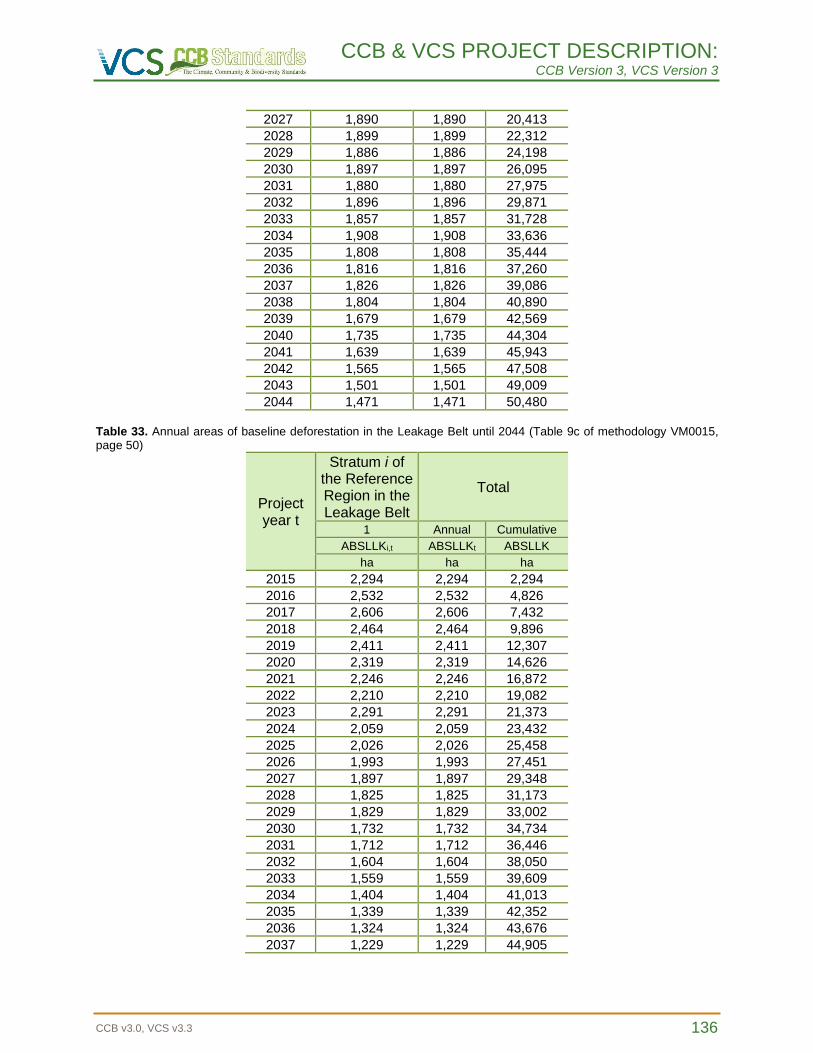
CCB & VCS PROJECT DESCRIPTION: CCB Version 3, VCS Version 3
CCB v3.0, VCS v3.3 136
2027 1,890 1,890 20,413
2028 1,899 1,899 22,312
2029 1,886 1,886 24,198
2030 1,897 1,897 26,095
2031 1,880 1,880 27,975
2032 1,896 1,896 29,871
2033 1,857 1,857 31,728
2034 1,908 1,908 33,636
2035 1,808 1,808 35,444
2036 1,816 1,816 37,260
2037 1,826 1,826 39,086
2038 1,804 1,804 40,890
2039 1,679 1,679 42,569
2040 1,735 1,735 44,304
2041 1,639 1,639 45,943
2042 1,565 1,565 47,508
2043 1,501 1,501 49,009
2044 1,471 1,471 50,480 Table 33. Annual areas of baseline deforestation in the Leakage Belt until 2044 (Table 9c of methodology VM0015, page 50)
Project year t
Stratum i of the Reference Region in the Leakage Belt
Total
1 Annual Cumulative
ABSLLKi,t ABSLLKt ABSLLK
ha ha ha
2015 2,294 2,294 2,294
2016 2,532 2,532 4,826
2017 2,606 2,606 7,432
2018 2,464 2,464 9,896
2019 2,411 2,411 12,307
2020 2,319 2,319 14,626
2021 2,246 2,246 16,872
2022 2,210 2,210 19,082
2023 2,291 2,291 21,373
2024 2,059 2,059 23,432
2025 2,026 2,026 25,458
2026 1,993 1,993 27,451
2027 1,897 1,897 29,348
2028 1,825 1,825 31,173
2029 1,829 1,829 33,002
2030 1,732 1,732 34,734
2031 1,712 1,712 36,446
2032 1,604 1,604 38,050
2033 1,559 1,559 39,609
2034 1,404 1,404 41,013
2035 1,339 1,339 42,352
2036 1,324 1,324 43,676
2037 1,229 1,229 44,905
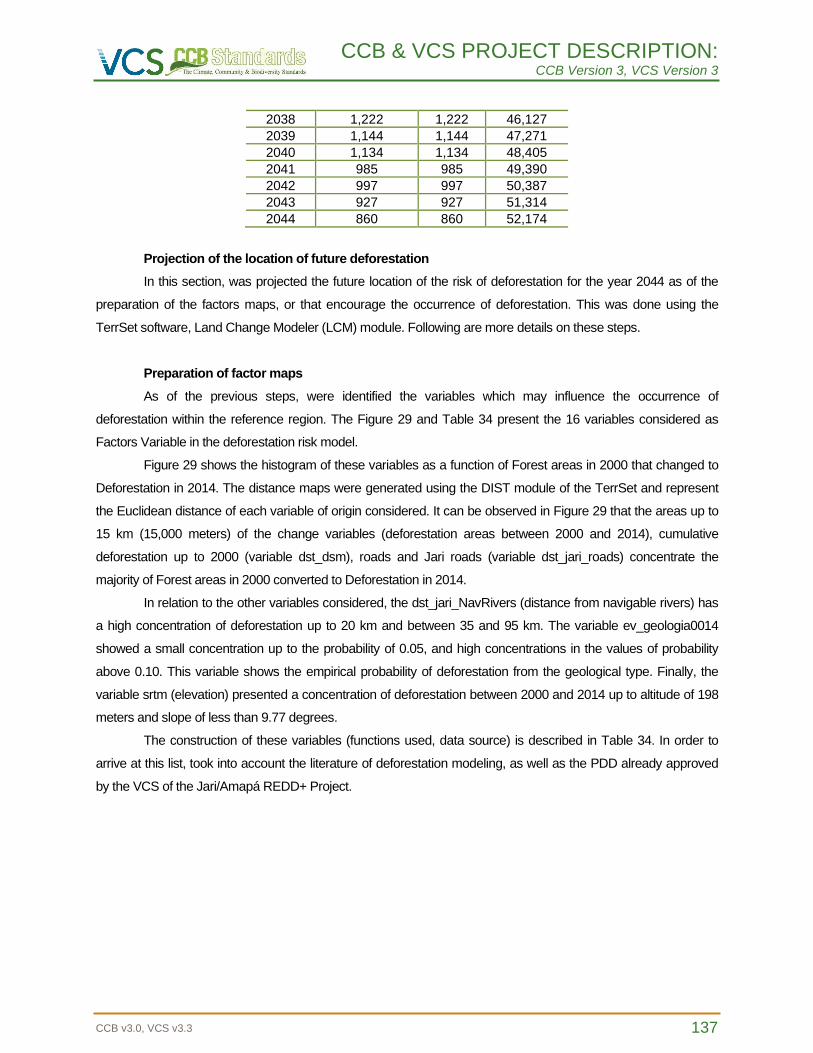
CCB & VCS PROJECT DESCRIPTION: CCB Version 3, VCS Version 3
CCB v3.0, VCS v3.3 137
2038 1,222 1,222 46,127
2039 1,144 1,144 47,271
2040 1,134 1,134 48,405
2041 985 985 49,390
2042 997 997 50,387
2043 927 927 51,314
2044 860 860 52,174
Projection of the location of future deforestation
In this section, was projected the future location of the risk of deforestation for the year 2044 as of the
preparation of the factors maps, or that encourage the occurrence of deforestation. This was done using the
TerrSet software, Land Change Modeler (LCM) module. Following are more details on these steps.
Preparation of factor maps
As of the previous steps, were identified the variables which may influence the occurrence of
deforestation within the reference region. The Figure 29 and Table 34 present the 16 variables considered as
Factors Variable in the deforestation risk model.
Figure 29 shows the histogram of these variables as a function of Forest areas in 2000 that changed to
Deforestation in 2014. The distance maps were generated using the DIST module of the TerrSet and represent
the Euclidean distance of each variable of origin considered. It can be observed in Figure 29 that the areas up to
15 km (15,000 meters) of the change variables (deforestation areas between 2000 and 2014), cumulative
deforestation up to 2000 (variable dst_dsm), roads and Jari roads (variable dst_jari_roads) concentrate the
majority of Forest areas in 2000 converted to Deforestation in 2014.
In relation to the other variables considered, the dst_jari_NavRivers (distance from navigable rivers) has
a high concentration of deforestation up to 20 km and between 35 and 95 km. The variable ev_geologia0014
showed a small concentration up to the probability of 0.05, and high concentrations in the values of probability
above 0.10. This variable shows the empirical probability of deforestation from the geological type. Finally, the
variable srtm (elevation) presented a concentration of deforestation between 2000 and 2014 up to altitude of 198
meters and slope of less than 9.77 degrees.
The construction of these variables (functions used, data source) is described in Table 34. In order to
arrive at this list, took into account the literature of deforestation modeling, as well as the PDD already approved
by the VCS of the Jari/Amapá REDD+ Project.
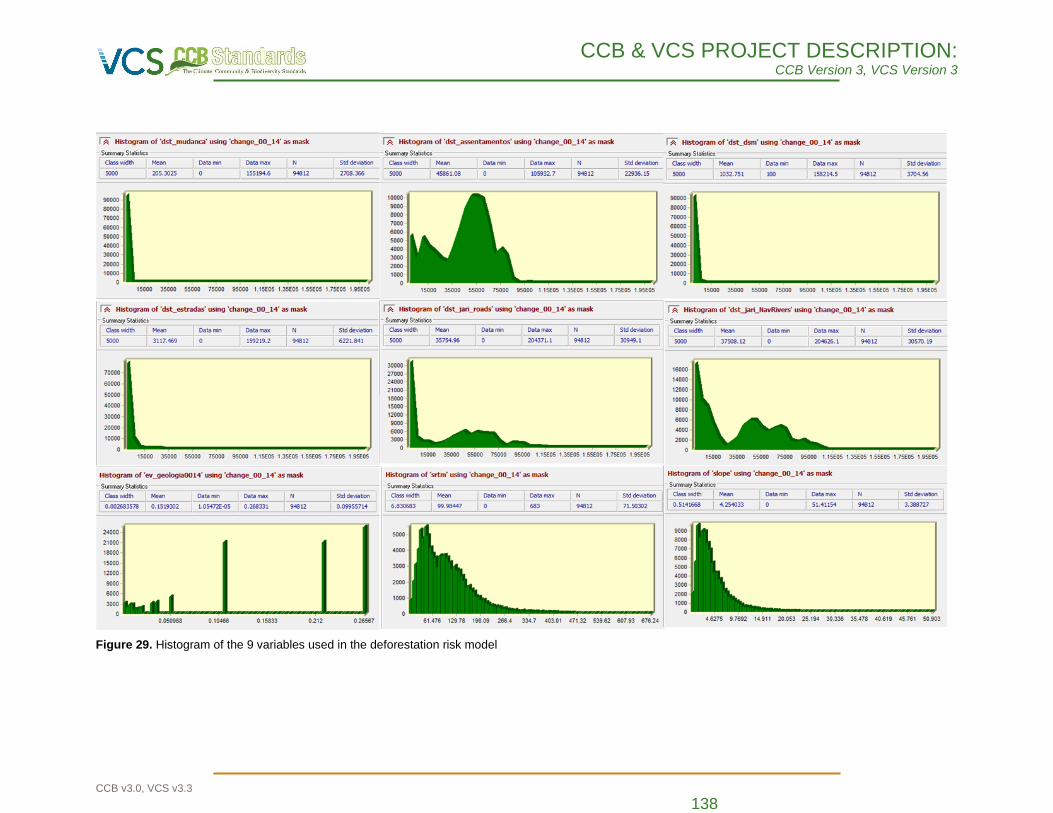
CCB & VCS PROJECT DESCRIPTION: CCB Version 3, VCS Version 3
CCB v3.0, VCS v3.3 138
Figure 29. Histogram of the 9 variables used in the deforestation risk model
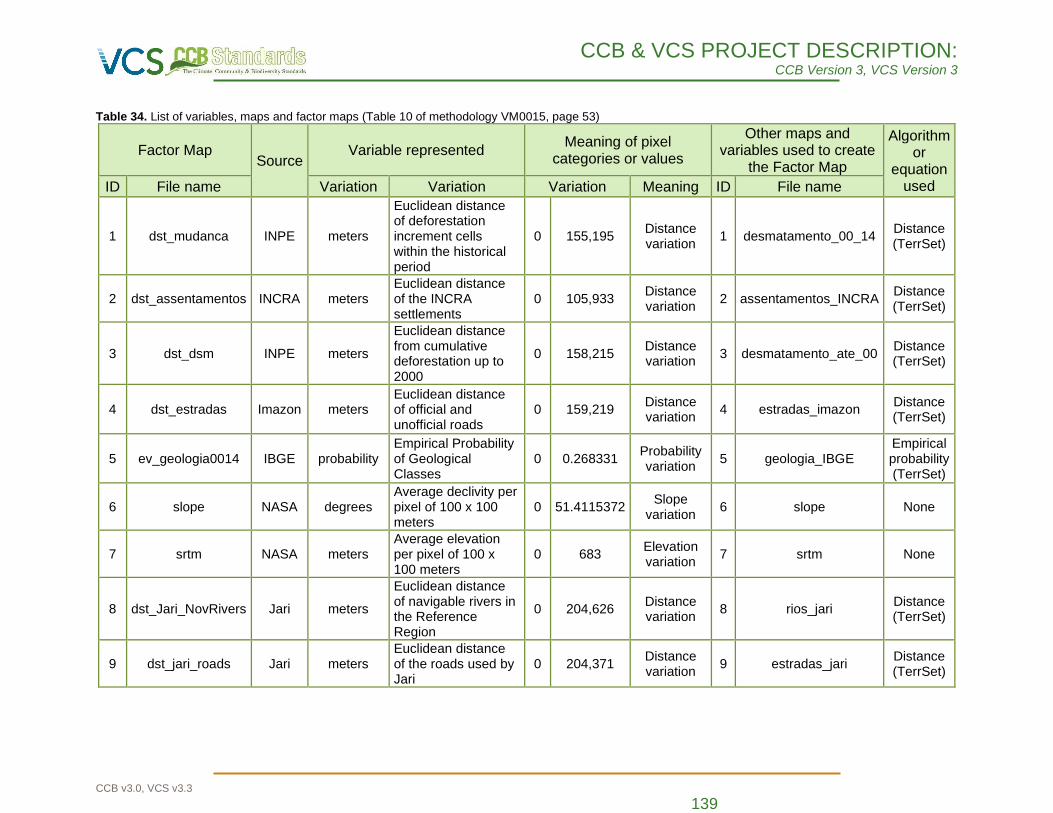
CCB & VCS PROJECT DESCRIPTION: CCB Version 3, VCS Version 3
CCB v3.0, VCS v3.3 139
Table 34. List of variables, maps and factor maps (Table 10 of methodology VM0015, page 53)
Factor Map Source
Variable represented Meaning of pixel
categories or values
Other maps and variables used to create
the Factor Map
Algorithm or
equation used ID File name Variation Variation Variation Meaning ID File name
1 dst_mudanca INPE meters
Euclidean distance of deforestation increment cells within the historical period
0 155,195 Distance variation
1 desmatamento_00_14 Distance (TerrSet)
2 dst_assentamentos INCRA meters Euclidean distance of the INCRA settlements
0 105,933 Distance variation
2 assentamentos_INCRA Distance (TerrSet)
3 dst_dsm INPE meters
Euclidean distance from cumulative deforestation up to 2000
0 158,215 Distance variation
3 desmatamento_ate_00 Distance (TerrSet)
4 dst_estradas Imazon meters Euclidean distance of official and unofficial roads
0 159,219 Distance variation
4 estradas_imazon Distance (TerrSet)
5 ev_geologia0014 IBGE probability Empirical Probability of Geological Classes
0 0.268331 Probability variation
5 geologia_IBGE Empirical probability (TerrSet)
6 slope NASA degrees Average declivity per pixel of 100 x 100 meters
0 51.4115372 Slope
variation 6 slope None
7 srtm NASA meters Average elevation per pixel of 100 x 100 meters
0 683 Elevation variation
7 srtm None
8 dst_Jari_NovRivers Jari meters
Euclidean distance of navigable rivers in the Reference Region
0 204,626 Distance variation
8 rios_jari Distance (TerrSet)
9 dst_jari_roads Jari meters Euclidean distance of the roads used by Jari
0 204,371 Distance variation
9 estradas_jari Distance (TerrSet)
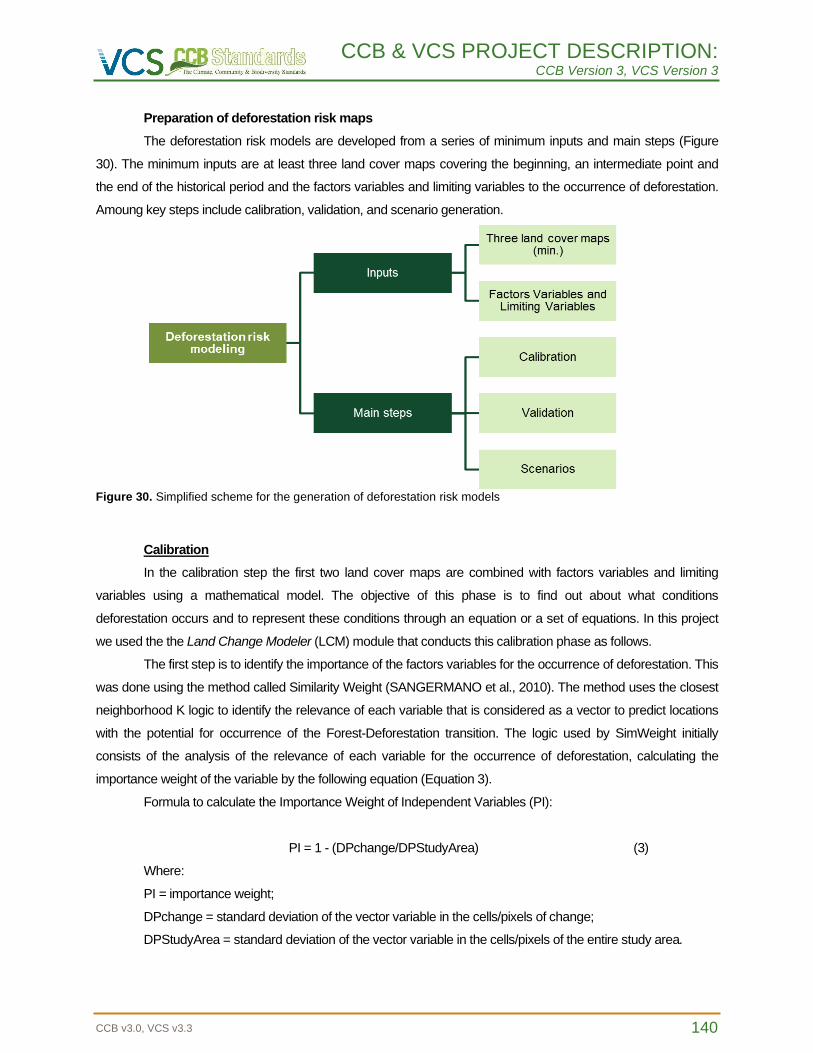
CCB & VCS PROJECT DESCRIPTION: CCB Version 3, VCS Version 3
CCB v3.0, VCS v3.3 140
Preparation of deforestation risk maps
The deforestation risk models are developed from a series of minimum inputs and main steps (Figure
30). The minimum inputs are at least three land cover maps covering the beginning, an intermediate point and
the end of the historical period and the factors variables and limiting variables to the occurrence of deforestation.
Amoung key steps include calibration, validation, and scenario generation.
Figure 30. Simplified scheme for the generation of deforestation risk models
Calibration
In the calibration step the first two land cover maps are combined with factors variables and limiting
variables using a mathematical model. The objective of this phase is to find out about what conditions
deforestation occurs and to represent these conditions through an equation or a set of equations. In this project
we used the the Land Change Modeler (LCM) module that conducts this calibration phase as follows.
The first step is to identify the importance of the factors variables for the occurrence of deforestation. This
was done using the method called Similarity Weight (SANGERMANO et al., 2010). The method uses the closest
neighborhood K logic to identify the relevance of each variable that is considered as a vector to predict locations
with the potential for occurrence of the Forest-Deforestation transition. The logic used by SimWeight initially
consists of the analysis of the relevance of each variable for the occurrence of deforestation, calculating the
importance weight of the variable by the following equation (Equation 3).
Formula to calculate the Importance Weight of Independent Variables (PI):
PI = 1 - (DPchange/DPStudyArea) (3)
Where:
PI = importance weight;
DPchange = standard deviation of the vector variable in the cells/pixels of change;
DPStudyArea = standard deviation of the vector variable in the cells/pixels of the entire study area.
CCB & VCS PROJECT DESCRIPTION: CCB Version 3, VCS Version 3
CCB v3.0, VCS v3.3 141
Then SimWeight calculates the risk of deforestation by combining change cells and persistence. For this
was used only the information of the variables with PI greater than 0.1. This information was combined by the
following formula adapted from Sangermano et al. (2010) (Equation 4):
Formula to calculate the Deforestation Risk:
(4)
Where:
RiscoDesm = risk value of occurrence of change ranging from 0 (low) to 1 (high);
c = number of cells/pixels of change;
d = distance in cells/pixels between the pixels of change;
i = change pixel identifier;
k = distance in cells/pixels of neighbors closest to the change pixel.
The use of Equation 4 results in a map with transition potential, which detects the areas with favorable
conditions of deforestation occurrence over areas with the Forest class (Figure 31). This map is given as the
starting point for allocating future rates of deforestation, and from this the annual rates are allocated along with
some dynamic variables. The accessibility variable of old deforestation is an example of a dynamic variable.
Validation
The validation consists of comparing the result of the already calibrated mathematical model with the
factors variables with a real data. It is generated in this phase, a land cover map simulated of the third point of
time of the historical period. The next step is to compare this simulated map with the actual land cover map from
the third point of time.
Scenarios
In the scenario step the future deforestation rates are projected for a given time horizon and some main
assumptions are assumed. In this REDD+ Project the projection period of deforestation is from 2015 to 2044 and
the assumed assumption was that the annual rate of historical deforestation occurred between 2000 and 2014
would reproduce steadily.
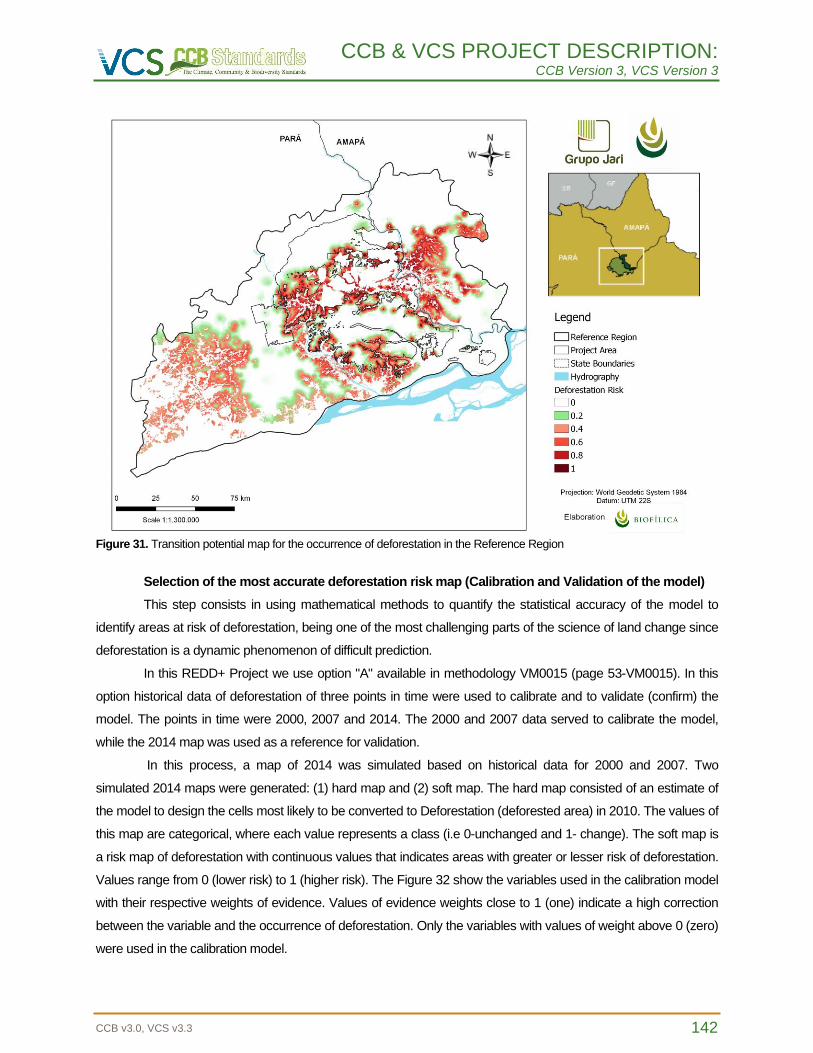
CCB & VCS PROJECT DESCRIPTION: CCB Version 3, VCS Version 3
CCB v3.0, VCS v3.3 142
Figure 31. Transition potential map for the occurrence of deforestation in the Reference Region
Selection of the most accurate deforestation risk map (Calibration and Validation of the model)
This step consists in using mathematical methods to quantify the statistical accuracy of the model to
identify areas at risk of deforestation, being one of the most challenging parts of the science of land change since
deforestation is a dynamic phenomenon of difficult prediction.
In this REDD+ Project we use option "A" available in methodology VM0015 (page 53-VM0015). In this
option historical data of deforestation of three points in time were used to calibrate and to validate (confirm) the
model. The points in time were 2000, 2007 and 2014. The 2000 and 2007 data served to calibrate the model,
while the 2014 map was used as a reference for validation.
In this process, a map of 2014 was simulated based on historical data for 2000 and 2007. Two
simulated 2014 maps were generated: (1) hard map and (2) soft map. The hard map consisted of an estimate of
the model to design the cells most likely to be converted to Deforestation (deforested area) in 2010. The values of
this map are categorical, where each value represents a class (i.e 0-unchanged and 1- change). The soft map is
a risk map of deforestation with continuous values that indicates areas with greater or lesser risk of deforestation.
Values range from 0 (lower risk) to 1 (higher risk). The Figure 32 show the variables used in the calibration model
with their respective weights of evidence. Values of evidence weights close to 1 (one) indicate a high correction
between the variable and the occurrence of deforestation. Only the variables with values of weight above 0 (zero)
were used in the calibration model.
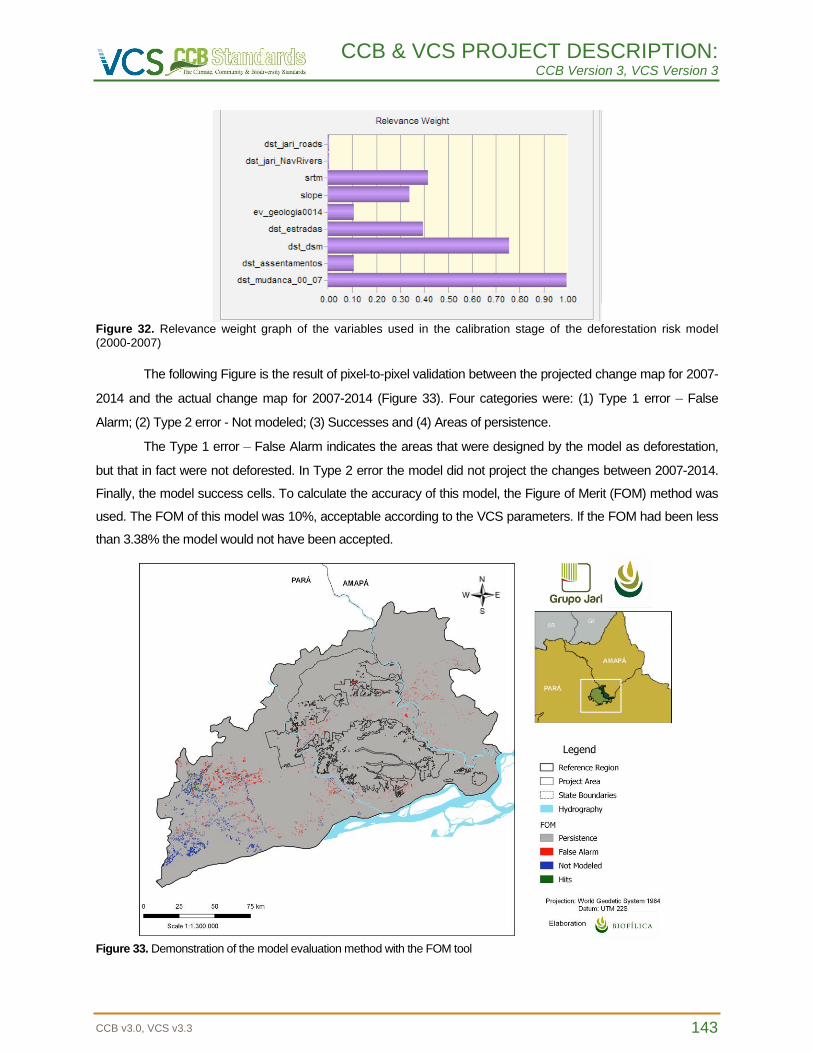
CCB & VCS PROJECT DESCRIPTION: CCB Version 3, VCS Version 3
CCB v3.0, VCS v3.3 143
Figure 32. Relevance weight graph of the variables used in the calibration stage of the deforestation risk model (2000-2007)
The following Figure is the result of pixel-to-pixel validation between the projected change map for 2007-
2014 and the actual change map for 2007-2014 (Figure 33). Four categories were: (1) Type 1 error – False
Alarm; (2) Type 2 error - Not modeled; (3) Successes and (4) Areas of persistence.
The Type 1 error – False Alarm indicates the areas that were designed by the model as deforestation,
but that in fact were not deforested. In Type 2 error the model did not project the changes between 2007-2014.
Finally, the model success cells. To calculate the accuracy of this model, the Figure of Merit (FOM) method was
used. The FOM of this model was 10%, acceptable according to the VCS parameters. If the FOM had been less
than 3.38% the model would not have been accepted.
Figure 33. Demonstration of the model evaluation method with the FOM tool
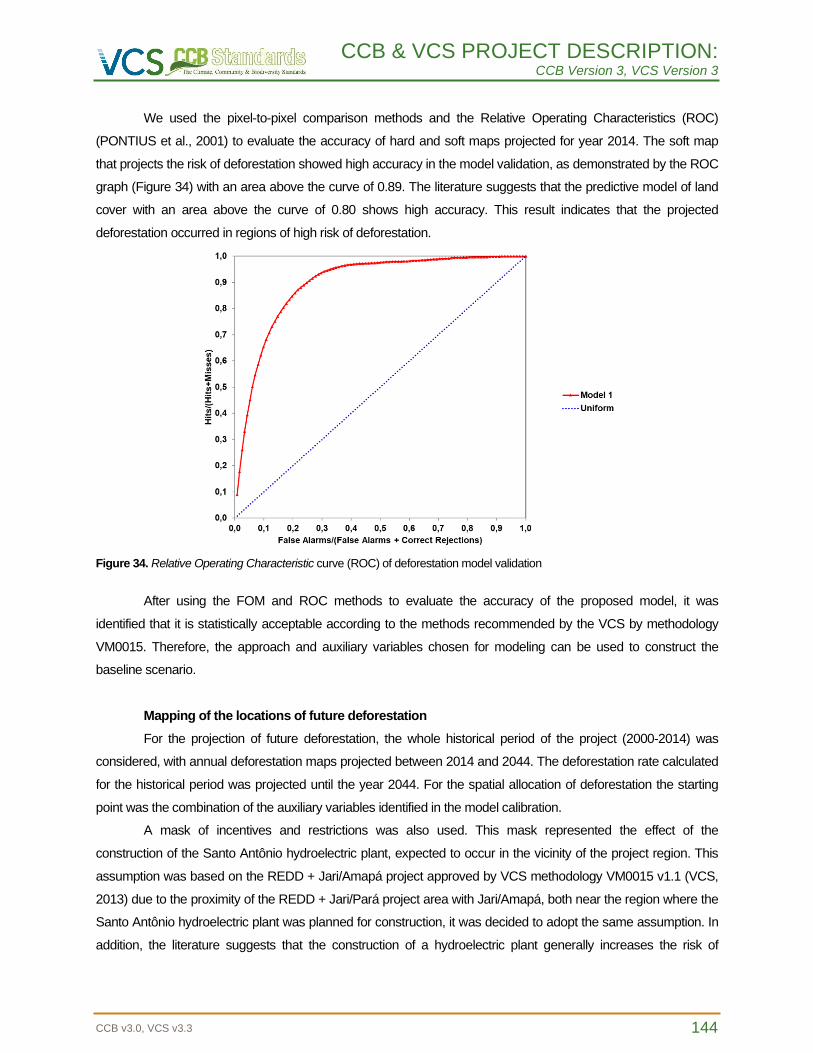
CCB & VCS PROJECT DESCRIPTION: CCB Version 3, VCS Version 3
CCB v3.0, VCS v3.3 144
We used the pixel-to-pixel comparison methods and the Relative Operating Characteristics (ROC)
(PONTIUS et al., 2001) to evaluate the accuracy of hard and soft maps projected for year 2014. The soft map
that projects the risk of deforestation showed high accuracy in the model validation, as demonstrated by the ROC
graph (Figure 34) with an area above the curve of 0.89. The literature suggests that the predictive model of land
cover with an area above the curve of 0.80 shows high accuracy. This result indicates that the projected
deforestation occurred in regions of high risk of deforestation.
Figure 34. Relative Operating Characteristic curve (ROC) of deforestation model validation
After using the FOM and ROC methods to evaluate the accuracy of the proposed model, it was
identified that it is statistically acceptable according to the methods recommended by the VCS by methodology
VM0015. Therefore, the approach and auxiliary variables chosen for modeling can be used to construct the
baseline scenario.
Mapping of the locations of future deforestation
For the projection of future deforestation, the whole historical period of the project (2000-2014) was
considered, with annual deforestation maps projected between 2014 and 2044. The deforestation rate calculated
for the historical period was projected until the year 2044. For the spatial allocation of deforestation the starting
point was the combination of the auxiliary variables identified in the model calibration.
A mask of incentives and restrictions was also used. This mask represented the effect of the
construction of the Santo Antônio hydroelectric plant, expected to occur in the vicinity of the project region. This
assumption was based on the REDD + Jari/Amapá project approved by VCS methodology VM0015 v1.1 (VCS,
2013) due to the proximity of the REDD + Jari/Pará project area with Jari/Amapá, both near the region where the
Santo Antônio hydroelectric plant was planned for construction, it was decided to adopt the same assumption. In
addition, the literature suggests that the construction of a hydroelectric plant generally increases the risk of
CCB & VCS PROJECT DESCRIPTION: CCB Version 3, VCS Version 3
CCB v3.0, VCS v3.3 145
deforestation in the regions near the construction due to a localized increase in population (Barreto et al, 2011).
To represent this effect, an incentive mask should be considered from the distance of the work.
To generate this mask, a map of the euclidean distance of the hydroelectric was first generated. Then,
this distance map was rescaled between data 0 and 1 using the Fuzzy function of TerrSet. Values close to 1
were those located near the hydroelectric dam and those close to zero, the most distant areas. Finally, the
incentive or restriction mask was added by the map of risk of deforestation (transition potential maps) to estimate
the effect of the hydroelectric plant in the risk of deforestation.
The old deforestation distance variable was calculated dynamically in each model interaction. The entire
process was conducted in TerrSet software. Figure 35 below shows deforestation in the Reference Regions,
Project Area and Leakage Belt (Tables 9b and 9c of methodology VM0015, pages 49 and 50).
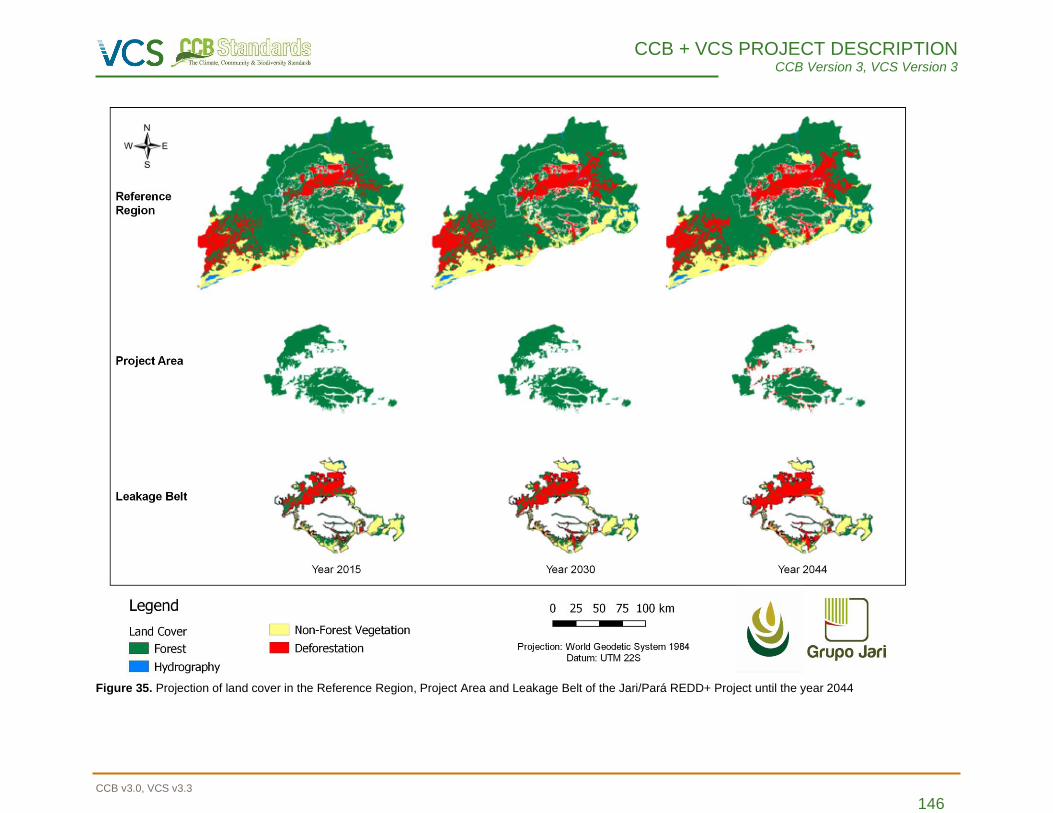
CCB + VCS PROJECT DESCRIPTION CCB Version 3, VCS Version 3
CCB v3.0, VCS v3.3 146
Figure 35. Projection of land cover in the Reference Region, Project Area and Leakage Belt of the Jari/Pará REDD+ Project until the year 2044
CCB + VCS PROJECT DESCRIPTION CCB Version 3, VCS Version 3
CCB v3.0, VCS v3.3 147
3.1.5 Additionality
The additionality of the project was analyzed according to the tool approved by VCS "VT0001 - Tool for
the Demonstration and Assessment of Additionality in VCS Agriculture, Forestry and Other Land Use (AFOLU)
Project Activities", version 3.0, of February 1, 2012.
The tool's applicability conditions are met because:
• The AFOLU activities are equal or similar to the design of the proposed activities within their respective
limits or registered as Project VCS AFOLU, and do not lead to a breach of any applicable law even if this
law is not applied; and
• The VM0015 baseline methodology provides a step-by-step approach to justify the determination of the
most plausible baseline scenario (see "Part 2 - Methodology Steps for ex ante estimation of GHG
Emissions Reductions" of VM0015).
Step 1. Identification of alternative land use scenarios to those proposed VCS AFOLU project
activity
Sub-step 1a. – Identify credible alternative land use scenarios to the proposed VCS AFOLU
project activity
The scenarios described in this item were based on the data collected by the socioeconomic study
conducted in 2016 and by the field consultation conducted in 2018, which included the use of secondary
(literature review) and primary data, resulted from interviews and reports of residents and representatives of local
institutions.
Among the realistic and credible alternative land use scenarios that would occur within the boundaries of
the Project in the absence of the AFOLU Project activity registered in the VCS, were considered the following:
i) Continuation of land use activities prior to Project (baseline scenario)
The project region is located on the Amazonian expansion frontier, where the dynamics of changes in
land use is directly related to expansion projects for infrastructure and logistics. The establishment of these
undertakings results in the generation of access logistics, attracting people to the region in search of
opportunities, and later much of them becomes an agent of deforestation. Projects such as the construction of
hydroelectrics, paving of roads, mining, among others, attract migrants in search of jobs and land. The
development of these undertakings is constant and, besides generating large social impacts, it generates great
pressure on natural resources of the region.
These "deforestation agents" are defined as squatters who settle in rural areas, performing deforestation
through the construction of improvements, subsistence plantations or even the raising of animals in degraded
pastures, and through these practices seek to legitimize their occupation. An additional factor that encourages
the continuity of this dynamic of illegal practices in the region is the fact that, unlike other areas of the Amazon
deforestation arc, this region has not yet been degraded with great intensity, which maintains its high potential for
forest exploitation, in addition, indicators of population growth and deforestation in recent years show a steady
CCB + VCS PROJECT DESCRIPTION CCB Version 3, VCS Version 3
CCB v3.0, VCS v3.3 148
trend of increasing demand for agricultural areas. The current scenario in the region still has fragility and low
governance by state and federal governments, showing no sign of change, resulting in impunity for illegal
practices and increasing the occurrence of deforestation in the region.
In addition, although the Grupo Jari does a work of assistance to local communities through the
Fundação Jari, the population increase should considerably reduce the efficiency of the work done, drastically
increasing social and environmental impacts in the region. Predatory activities will be considerably intensified with
the proliferation of degraded and unproductive agricultural areas, considering the low level of training and
technical assistance, and consequently generating pressure under new areas.
According to Poema (2005), up to 2005, 2,338 rural families (squatters) lived in the Jari Valley and,
according to the data collected in the field, a rural family usually deforest a plot of an average of 1 ha/year for
cultivate the land, or up to 2 ha/year considering that most of the families use to maintain two plots, which can
have a total impact on the forest between 2,500 to 5,000 ha per year in the region. With the continuation of this
dynamic, for the next 30 years, a loss of 182,826 hectares is projected in this scenario, of which 50,480 hectares
are expected to be deforested in the Project Area. In the described scenario, this dynamic tends to be maintained
until a large part of the forest cover is altered, generating an inestimable impact on local biodiversity, and further
deepening social and economic problems. In this way, this scenario can be classified as the common practice
scenario in the region, or “business as usual” scenario.
ii) Sustainable Forestry Management, without complementary activities to contain/monitor unplanned
deforestation (inserted in the baseline)
This scenario represents the conduction of sustainable forest management activities within all relevant
regulations, norms, standards and legislation, without additional investments in forest conservation, communities
and biodiversity.
The Sustainable Forestry Management, especially that one that follows the assumptions of certification,
is recognized by several experts as a tool for forest conservation, maintenance of forest carbon stocks and
reduction of deforestation rates (PORTER-BOLLAND et al., 2012; VERÍSSIMO et al., 1992; BARRETO et al.,
1998; HOLMES et al., 2002 apud SABOGAL et al., 2006; PUTZ et al., 2008; SPATHELF et al., 2004). This is
mainly due to the application of low impact exploration techniques, continuous monitoring of the forest and the
social and environmental impacts of the operation, physical presence, land management and generation of
economic value for the forest areas.
However, in a context such as scenario (i), Forest Management in these ways is not considered an
economically advantageous practice, since there are several barriers for the entrepreneur who wishes to follow
this path. The implementation of a legal and certified management plan is bureaucratic and costly, where the
operator must comply with numerous rules, laws and apply a large investment. Nevertheless, the establishment
of a legalized and certified management plan does not guarantee advantages in the market, where the product
competes unequally with the supply of illegal and/or doubtful wood that forces the responsible entrepreneur to

CCB + VCS PROJECT DESCRIPTION CCB Version 3, VCS Version 3
CCB v3.0, VCS v3.3 149
reduce the price of their product and, consequently, their profit margin. In addition, the forest owner needs to live
daily with the outside pressure under the area, since in times of fragility his property will surely be invaded.
In counterpoint to the reality of legalized forest management, the occupation and opening of areas for
the implementation of low productivity farming practices becomes more advantageous, since the enforcement is
inefficient and the expenses for the implantation and maintenance of the area in general are substantially lower. It
is also important to consider the valorization potential of deforested areas that generate real estate speculation
and land conflicts in these regions. Because of so many adversities and barriers, the legitimate owner of forest
areas, in most cases, opts for the sale of the property, since it can not afford the management activities and much
less deal with the uncertainty of the market, moments of financial crisis can lead to fragility in the security of
property that would certainly result in situations of illegal deforestation and property encroachment.
Therefore, forest management activity, which is not the most attractive economic activity in the context of
the region, and is already experiencing financial difficulties (as in other situations throughout the Amazon),
becomes even more infeasible without the addition of additional revenue resulting from the commercialization of
the credits registered in the VCS.
iii) Multiple Use Forest Management with REDD+ activities without registration as a VCS AFOLU Project
This scenario represents the conduct of sustainable forest management activities combining logging and
other non-timber resources. The implementation of such activities is sought by placing them within all relevant
regulations, norms, standards and legislation., In this scenario the Multiple Use Forest Management is
complemented with activities to contain and monitor deforestation caused by the agents identified in the scenario
(i) and investments directed to the forest conservation, communities and biodiversity, as described in section
2.1.11.
As described in scenario (ii), forest management is recognized by many experts as a tool for forest
conservation, but in a context such as scenario (i) still can not be considered an advantageous option, not only by
the bureaucracy of regularization processes, but also by the market uncertainties , external pressures of invasion
under the area and to be in a scenario where the occupation and the opening of areas for implantation of
agricultural practices of low productivity become more advantageous than the management activities, points that
often take the owners areas sell their property. Besides to the Timber Forest Management, scenario (iii) includes
the incentive for community forest management, which includes timber and non-timber products. In this scenario,
direct investments are expected in activities aimed at the low-impact exploitation of forest resources in
partnership with local communities, as envisaged in the Sustainable Forest Management Plan of 2015.
In this context, to ensure the effectiveness of the REDD+ actions in relation to the containment and
monitoring of deforestation, which constantly threatens the area, and the implementation of actions to strengthen
and intensify the work of the Fundação Jari, among other activities for promoting local socioeconomic
development, specific investments are necessary such as: training of specialized professionals, investment in
technology and intelligence, technical studies specific to REDD, intensification of patrimonial surveillance,
conducting courses and seminars with social actors in the environment, strengthening the Fundação Jari,
CCB + VCS PROJECT DESCRIPTION CCB Version 3, VCS Version 3
CCB v3.0, VCS v3.3 150
strengthening of associations of producers, improvement of biodiversity monitoring, among others. Since such
investments are not mandatory and are generally not carried out by the landowners, these activities could hardly
be implemented in the common practice scenario, hindering or preventing the generation of positive net impacts
in the region. Therefore, since that multiple use forest management activity is not the most attractive economic
activity in the region, the scenario (iii) becomes unfeasible without the premise of the addition of the additional
income resulting from credits registered by VCS.
Sub-step 1b. – Consistency of credible land use scenarios with enforced mandatory applicable
laws and regulations
From a project point of view, in scenarios proposed, scenarios (ii) e (iii) is in compliance with all
applicable legal and regulatory requirements, and the practices adopted in scenario (i) are not in accordance with
mandatory legislation and regulations.
This is because illegal or unauthorized deforestation occurs in a systematic and widespread manner in
the legal Amazon and especially in the project region, located in the "Arch of Deforestation". Following Higuchi, et
al (2009) from 1997 to 2003 the rate of allowed deforestation was 19%, that is, 81% of the deforestation identified
were not authorized by the responsible government agencies.
Considering the smallest administrative unit the municipality of Almeirim, and environmental regulations
Law 12.651/2012 (New Forest Code) Normative Instruction No. 02, DE 06 JULY 2015 that deal with the
suppression of native vegetation, any activity that requires the realization of suppression of native vegetation is
conditional on the issuance of a prior license (Vegetation Suppression Authorization - ASV). According to the
platform of the Integrated Environmental Monitoring and Licensing System (SIMLAM) managed by the
Environment and Sustainability Secretariat of Pará (SEMAS-PA), no authorizations for suppression of native
vegetation in the municipality were registered. In this way it can be deduced that all the suppression of vegetation
identified in the municipality of Almeirim in the period analyzed by the project was carried out in an illegal way.
The information obtained through the Amazon monitoring system carried out by INPE shows a trend of
deforestation growth in the Project region as of 2011, with the municipalities of Almeirim and Monte Alegre, in the
state of Pará, showing the highest growth rates, even without presenting any licensing record for such activities
(Figure 36).
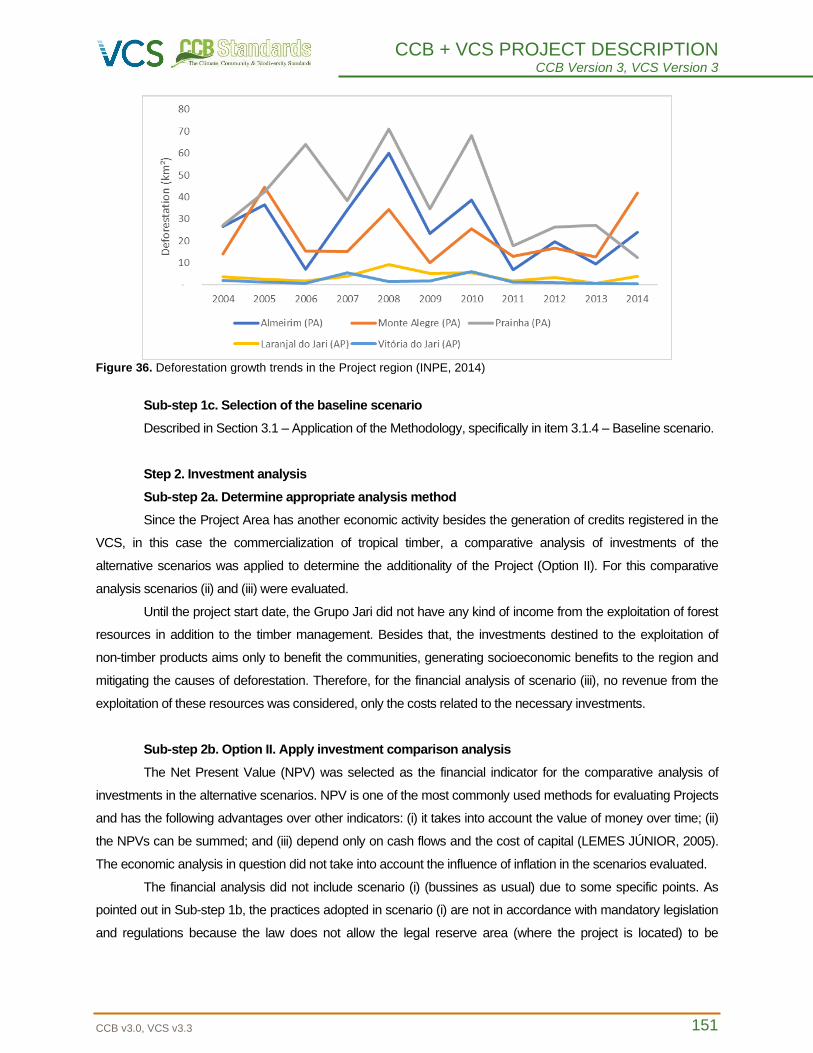
CCB + VCS PROJECT DESCRIPTION CCB Version 3, VCS Version 3
CCB v3.0, VCS v3.3 151
Figure 36. Deforestation growth trends in the Project region (INPE, 2014)
Sub-step 1c. Selection of the baseline scenario
Described in Section 3.1 – Application of the Methodology, specifically in item 3.1.4 – Baseline scenario.
Step 2. Investment analysis
Sub-step 2a. Determine appropriate analysis method
Since the Project Area has another economic activity besides the generation of credits registered in the
VCS, in this case the commercialization of tropical timber, a comparative analysis of investments of the
alternative scenarios was applied to determine the additionality of the Project (Option II). For this comparative
analysis scenarios (ii) and (iii) were evaluated.
Until the project start date, the Grupo Jari did not have any kind of income from the exploitation of forest
resources in addition to the timber management. Besides that, the investments destined to the exploitation of
non-timber products aims only to benefit the communities, generating socioeconomic benefits to the region and
mitigating the causes of deforestation. Therefore, for the financial analysis of scenario (iii), no revenue from the
exploitation of these resources was considered, only the costs related to the necessary investments.
Sub-step 2b. Option II. Apply investment comparison analysis
The Net Present Value (NPV) was selected as the financial indicator for the comparative analysis of
investments in the alternative scenarios. NPV is one of the most commonly used methods for evaluating Projects
and has the following advantages over other indicators: (i) it takes into account the value of money over time; (ii)
the NPVs can be summed; and (iii) depend only on cash flows and the cost of capital (LEMES JÚNIOR, 2005).
The economic analysis in question did not take into account the influence of inflation in the scenarios evaluated.
The financial analysis did not include scenario (i) (bussines as usual) due to some specific points. As
pointed out in Sub-step 1b, the practices adopted in scenario (i) are not in accordance with mandatory legislation
and regulations because the law does not allow the legal reserve area (where the project is located) to be

CCB + VCS PROJECT DESCRIPTION CCB Version 3, VCS Version 3
CCB v3.0, VCS v3.3 152
deforested for productive purposes without the proper authorization of the responsible agencies, and as pointed
out in the mentioned item, no authorizations for suppression of native vegetation in the municipality were
registered. In addition, the actions that occur in this scenario are not clearly planned, as demonstrated in the item
that describes the "Leakege Belt" it is not possible to evaluate the direct economic motivations of deforestation.
Also, the project proponents do not have an investment profile in the activities carried out under scenario (i), since
they are companies that work with environmental services seeking to cause the least possible impact in the
forest, using resources in a sustainable way, as can be verified in the Non-Permanence-Risk-Report, which
describes the skills, expertise, and knowledge of the project management team.
For this reason, the financial analysis took into account only scenarios (ii) and (iii), where scenario (ii)
represents the baseline scenario with management activities and scenario (iii) represents the same scenario as "
with the project "without registration VCS AFOLU. From the financial point of view, the analysis compares the
deficit forest management, which has already occurred in the project area, and which has great weaknesses in
the management of social impacts and in the patrimonial surveillance illustrated in scenario (ii), with the scenario
in which this same management proposes additional actions to solve the issues that put the project area at risk
without the sale of certified credits, demonstrated in scenario (iii).
Sub-step 2c. Calculation and comparison of financial indicators
The summary of sources of income and expenditure considered in the analysis is presented in Section
2.1.11 of this document (Project Activities and Theory of Change), where the proposed activities to
contain/monitor unplanned deforestation are described in detail and generate net benefits to the climate,
communities and biodiversity.
Table 35. Scenarios and their sources of income and expenses
Scenario Incomes Expenses
(ii) Timber Forest Management,
without complementary activities
to contain/monitor unplanned
deforestation and without
additional activities to benefit the
climate, communities and
biodiversity.
Sale of tropical timber from
low impact forest
management.
(-) Low Impact Forest
Management;
(iii) Multiple Use Forest
Management, with
complementary activities to
contain/monitor unplanned
deforestation and with additional
activities to benefit the climate,
communities and biodiversity.
Sale of tropical timber from
low impact forest
management.
(-) Multiple Use Forest
Management;
(-) Additional activities to
contain/monitor unplanned
deforestation and climate,
communities and biodiversity;
The free cash flow scenarios and comparative NPV analysis took into account the sources of revenue
(sale of timber) and expenses at a discount rate of 25%. Such discount rate was applied to both scenarios
CCB + VCS PROJECT DESCRIPTION CCB Version 3, VCS Version 3
CCB v3.0, VCS v3.3 153
analyzed in the project's economic and financial model and is intended to reflect the investment risk at a present
value in comparison to the scenarios analyzed by the investor.
For this analysis, scenarios II and III were compared, ie "without REDD+" scenario versus "with REDD+"
scenario, both of which do not consider the entry of additional resources beyond the commercialization of timber.
In scenario II, "without the project", the only activity is forest management. In scenario III, "with the project", the
activities of scenario II are added to the framework of additional activities proposed for the REDD+ Project.
As input data for the financial economic model were used in scenario II: Volume of timber harvested,
average price of timber commercialization, operating expenses, operational investments, taxes, payroll, among
others. In scenario III, the same expenses and cash flow of scenario II were considered, but the expected
expenses for the REDD+ Project activities, such as those related to the activities listed in Section 2.1.11, were
added.
The detailed information and documents related to the financial economic model are considered
commercially sensitive and were shared with the audit team on a confidential basis.
A conservative analysis of the expected 30 years for the Project reflected in a negative NPV for both
scenarios. This is due to the current financial condition of the timber forest management carried out by the Grupo
Jari, which did not present a single positive cash flow throughout the historical period analyzed. The forest
management results statement in the Project Area shows the high operational costs inherent in the activity and
points out negative prospects for the maintenance of the business in the future. In this analysis the NPV was R$ -
45,659,406 and R$ -48,246,809 for scenarios II and III respectively.
The financial analysis shows that the enterprise would not be able to invest in the additional activities
proposed by scenario III, since the forest management activity itself is at risk for the following years if there is no
growth in revenue or if the company is unable to implement actions aiming to reduce operating costs. This
analysis reinforces the need to generate additional resources that can provide the maintenance of the forest
cover and direct investments to the necessary activities raised by the REDD+ project. Once the forest
management activity is interrupted due to financial problems, the management capacity of the territory, especially
in the areas of pressure for deforestation, would be at risk. The Table 36 illustrates cumulatively the costs and
revenues for the scenarios presented within the projected cash flow up to 2044.
Table 36. Comparative result of the cash flow in both scenarios
(+) Incomes 1.527.660.000
(-) Expenses (1.870.530.000)
Result (342.870.000)
(+) Incomes 1.527.660.000
(-) Expenses (1.907.477.815)
Timber Forest Management (1.870.530.000)
REDD+ Activities (36.947.815)
Result (379.817.815)
Scenario III - 2015-2044 (R$)
Scenario II - 2015-2044 (R$)
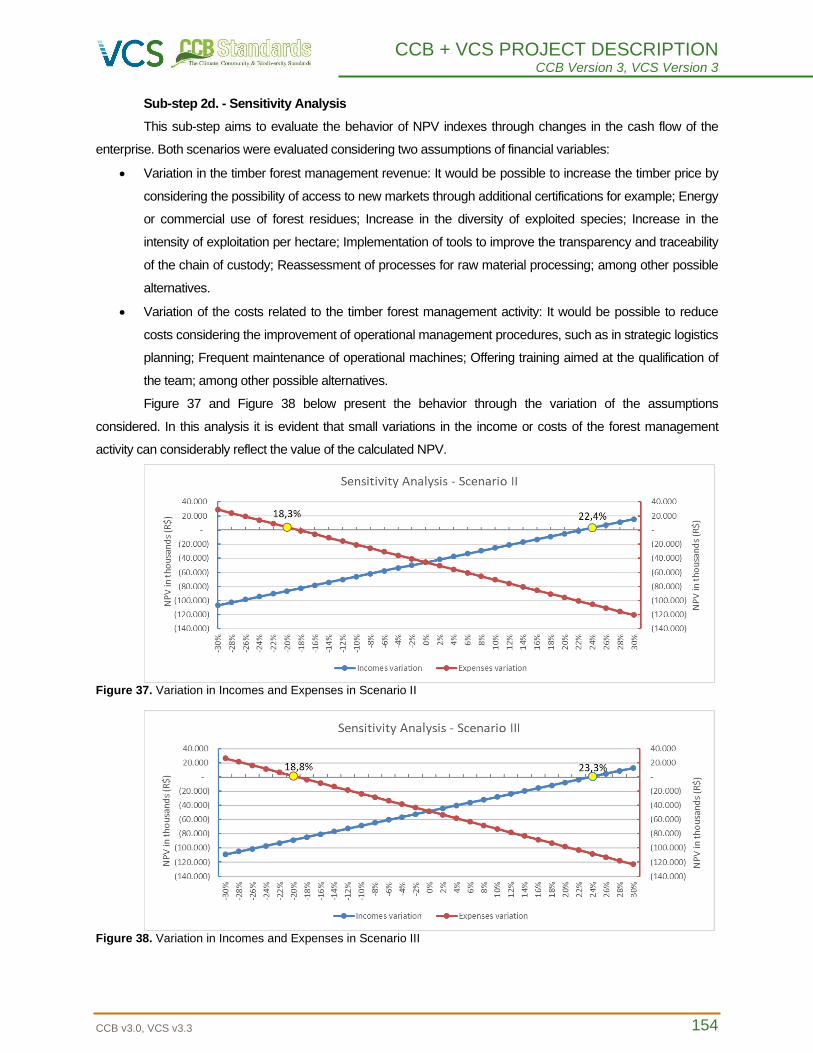
CCB + VCS PROJECT DESCRIPTION CCB Version 3, VCS Version 3
CCB v3.0, VCS v3.3 154
Sub-step 2d. - Sensitivity Analysis
This sub-step aims to evaluate the behavior of NPV indexes through changes in the cash flow of the
enterprise. Both scenarios were evaluated considering two assumptions of financial variables:
• Variation in the timber forest management revenue: It would be possible to increase the timber price by
considering the possibility of access to new markets through additional certifications for example; Energy
or commercial use of forest residues; Increase in the diversity of exploited species; Increase in the
intensity of exploitation per hectare; Implementation of tools to improve the transparency and traceability
of the chain of custody; Reassessment of processes for raw material processing; among other possible
alternatives.
• Variation of the costs related to the timber forest management activity: It would be possible to reduce
costs considering the improvement of operational management procedures, such as in strategic logistics
planning; Frequent maintenance of operational machines; Offering training aimed at the qualification of
the team; among other possible alternatives.
Figure 37 and Figure 38 below present the behavior through the variation of the assumptions
considered. In this analysis it is evident that small variations in the income or costs of the forest management
activity can considerably reflect the value of the calculated NPV.
Figure 37. Variation in Incomes and Expenses in Scenario II
Figure 38. Variation in Incomes and Expenses in Scenario III
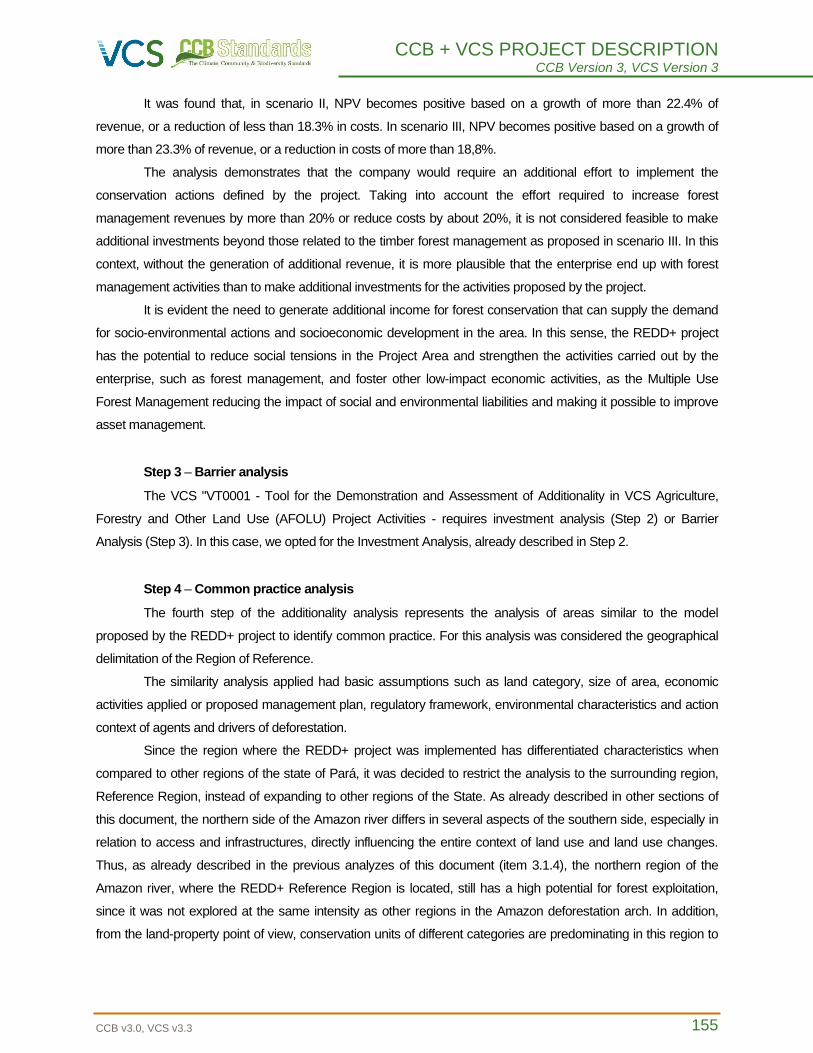
CCB + VCS PROJECT DESCRIPTION CCB Version 3, VCS Version 3
CCB v3.0, VCS v3.3 155
It was found that, in scenario II, NPV becomes positive based on a growth of more than 22.4% of
revenue, or a reduction of less than 18.3% in costs. In scenario III, NPV becomes positive based on a growth of
more than 23.3% of revenue, or a reduction in costs of more than 18,8%.
The analysis demonstrates that the company would require an additional effort to implement the
conservation actions defined by the project. Taking into account the effort required to increase forest
management revenues by more than 20% or reduce costs by about 20%, it is not considered feasible to make
additional investments beyond those related to the timber forest management as proposed in scenario III. In this
context, without the generation of additional revenue, it is more plausible that the enterprise end up with forest
management activities than to make additional investments for the activities proposed by the project.
It is evident the need to generate additional income for forest conservation that can supply the demand
for socio-environmental actions and socioeconomic development in the area. In this sense, the REDD+ project
has the potential to reduce social tensions in the Project Area and strengthen the activities carried out by the
enterprise, such as forest management, and foster other low-impact economic activities, as the Multiple Use
Forest Management reducing the impact of social and environmental liabilities and making it possible to improve
asset management.
Step 3 – Barrier analysis
The VCS "VT0001 - Tool for the Demonstration and Assessment of Additionality in VCS Agriculture,
Forestry and Other Land Use (AFOLU) Project Activities - requires investment analysis (Step 2) or Barrier
Analysis (Step 3). In this case, we opted for the Investment Analysis, already described in Step 2.
Step 4 – Common practice analysis
The fourth step of the additionality analysis represents the analysis of areas similar to the model
proposed by the REDD+ project to identify common practice. For this analysis was considered the geographical
delimitation of the Region of Reference.
The similarity analysis applied had basic assumptions such as land category, size of area, economic
activities applied or proposed management plan, regulatory framework, environmental characteristics and action
context of agents and drivers of deforestation.
Since the region where the REDD+ project was implemented has differentiated characteristics when
compared to other regions of the state of Pará, it was decided to restrict the analysis to the surrounding region,
Reference Region, instead of expanding to other regions of the State. As already described in other sections of
this document, the northern side of the Amazon river differs in several aspects of the southern side, especially in
relation to access and infrastructures, directly influencing the entire context of land use and land use changes.
Thus, as already described in the previous analyzes of this document (item 3.1.4), the northern region of the
Amazon river, where the REDD+ Reference Region is located, still has a high potential for forest exploitation,
since it was not explored at the same intensity as other regions in the Amazon deforestation arch. In addition,
from the land-property point of view, conservation units of different categories are predominating in this region to
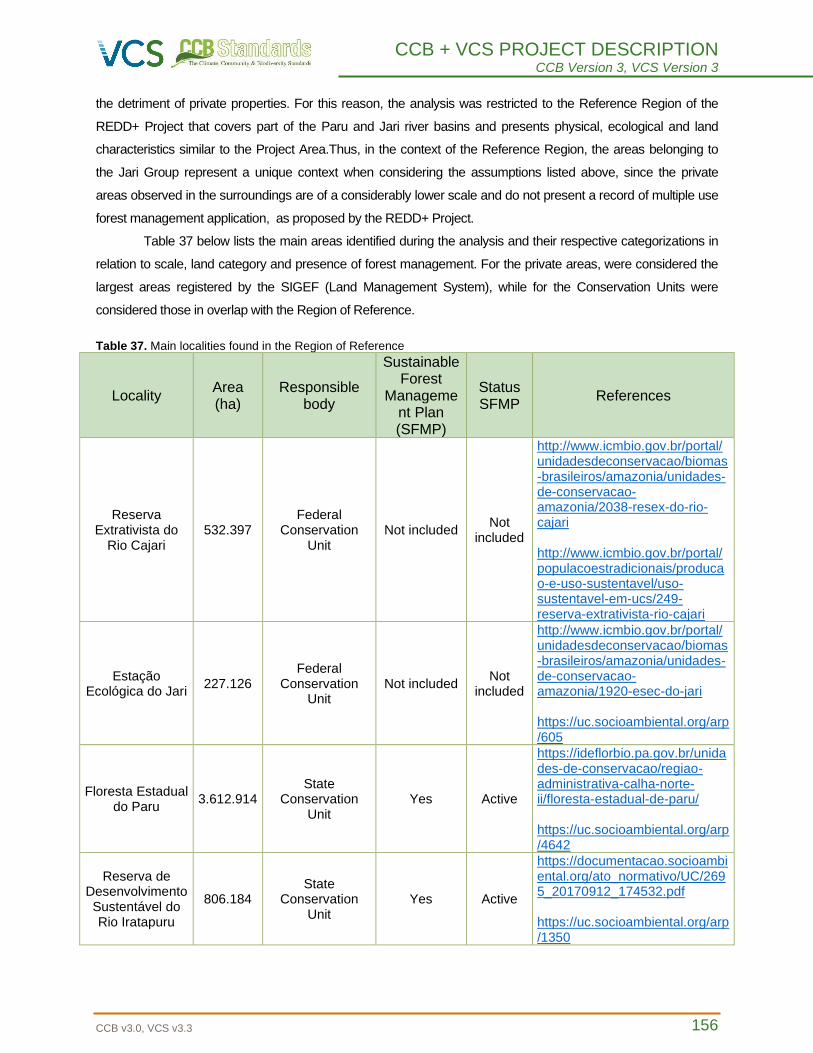
CCB + VCS PROJECT DESCRIPTION CCB Version 3, VCS Version 3
CCB v3.0, VCS v3.3 156
the detriment of private properties. For this reason, the analysis was restricted to the Reference Region of the
REDD+ Project that covers part of the Paru and Jari river basins and presents physical, ecological and land
characteristics similar to the Project Area.Thus, in the context of the Reference Region, the areas belonging to
the Jari Group represent a unique context when considering the assumptions listed above, since the private
areas observed in the surroundings are of a considerably lower scale and do not present a record of multiple use
forest management application, as proposed by the REDD+ Project.
Table 37 below lists the main areas identified during the analysis and their respective categorizations in
relation to scale, land category and presence of forest management. For the private areas, were considered the
largest areas registered by the SIGEF (Land Management System), while for the Conservation Units were
considered those in overlap with the Region of Reference.
Table 37. Main localities found in the Region of Reference
Locality Area (ha)
Responsible body
Sustainable Forest
Management Plan (SFMP)
Status SFMP
References
Reserva Extrativista do
Rio Cajari 532.397
Federal Conservation
Unit Not included
Not included
http://www.icmbio.gov.br/portal/unidadesdeconservacao/biomas-brasileiros/amazonia/unidades-de-conservacao-amazonia/2038-resex-do-rio-cajari http://www.icmbio.gov.br/portal/populacoestradicionais/producao-e-uso-sustentavel/uso-sustentavel-em-ucs/249-reserva-extrativista-rio-cajari
Estação Ecológica do Jari
227.126 Federal
Conservation Unit
Not included Not
included
http://www.icmbio.gov.br/portal/unidadesdeconservacao/biomas-brasileiros/amazonia/unidades-de-conservacao-amazonia/1920-esec-do-jari https://uc.socioambiental.org/arp/605
Floresta Estadual do Paru
3.612.914 State
Conservation Unit
Yes Active
https://ideflorbio.pa.gov.br/unidades-de-conservacao/regiao-administrativa-calha-norte-ii/floresta-estadual-de-paru/ https://uc.socioambiental.org/arp/4642
Reserva de Desenvolvimento Sustentável do Rio Iratapuru
806.184 State
Conservation Unit
Yes Active
https://documentacao.socioambiental.org/ato_normativo/UC/2695_20170912_174532.pdf https://uc.socioambiental.org/arp/1350
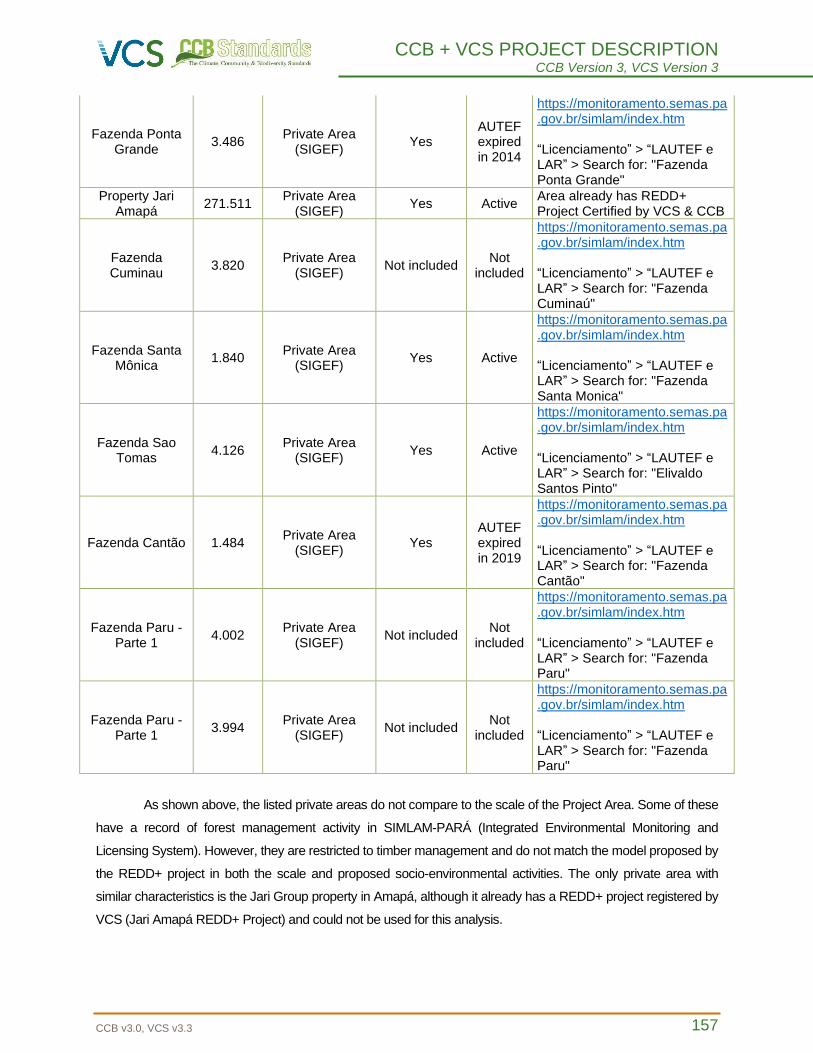
CCB + VCS PROJECT DESCRIPTION CCB Version 3, VCS Version 3
CCB v3.0, VCS v3.3 157
Fazenda Ponta Grande
3.486 Private Area
(SIGEF) Yes
AUTEF expired in 2014
https://monitoramento.semas.pa.gov.br/simlam/index.htm “Licenciamento” > “LAUTEF e LAR” > Search for: "Fazenda Ponta Grande"
Property Jari Amapá
271.511 Private Area
(SIGEF) Yes Active
Area already has REDD+ Project Certified by VCS & CCB
Fazenda Cuminau
3.820 Private Area
(SIGEF) Not included
Not included
https://monitoramento.semas.pa.gov.br/simlam/index.htm “Licenciamento” > “LAUTEF e LAR” > Search for: "Fazenda Cuminaú"
Fazenda Santa Mônica
1.840 Private Area
(SIGEF) Yes Active
https://monitoramento.semas.pa.gov.br/simlam/index.htm “Licenciamento” > “LAUTEF e LAR” > Search for: "Fazenda Santa Monica"
Fazenda Sao Tomas
4.126 Private Area
(SIGEF) Yes Active
https://monitoramento.semas.pa.gov.br/simlam/index.htm “Licenciamento” > “LAUTEF e LAR” > Search for: "Elivaldo Santos Pinto"
Fazenda Cantão 1.484 Private Area
(SIGEF) Yes
AUTEF expired in 2019
https://monitoramento.semas.pa.gov.br/simlam/index.htm “Licenciamento” > “LAUTEF e LAR” > Search for: "Fazenda Cantão"
Fazenda Paru - Parte 1
4.002 Private Area
(SIGEF) Not included
Not included
https://monitoramento.semas.pa.gov.br/simlam/index.htm “Licenciamento” > “LAUTEF e LAR” > Search for: "Fazenda Paru"
Fazenda Paru - Parte 1
3.994 Private Area
(SIGEF) Not included
Not included
https://monitoramento.semas.pa.gov.br/simlam/index.htm “Licenciamento” > “LAUTEF e LAR” > Search for: "Fazenda Paru"
As shown above, the listed private areas do not compare to the scale of the Project Area. Some of these
have a record of forest management activity in SIMLAM-PARÁ (Integrated Environmental Monitoring and
Licensing System). However, they are restricted to timber management and do not match the model proposed by
the REDD+ project in both the scale and proposed socio-environmental activities. The only private area with
similar characteristics is the Jari Group property in Amapá, although it already has a REDD+ project registered by
VCS (Jari Amapá REDD+ Project) and could not be used for this analysis.
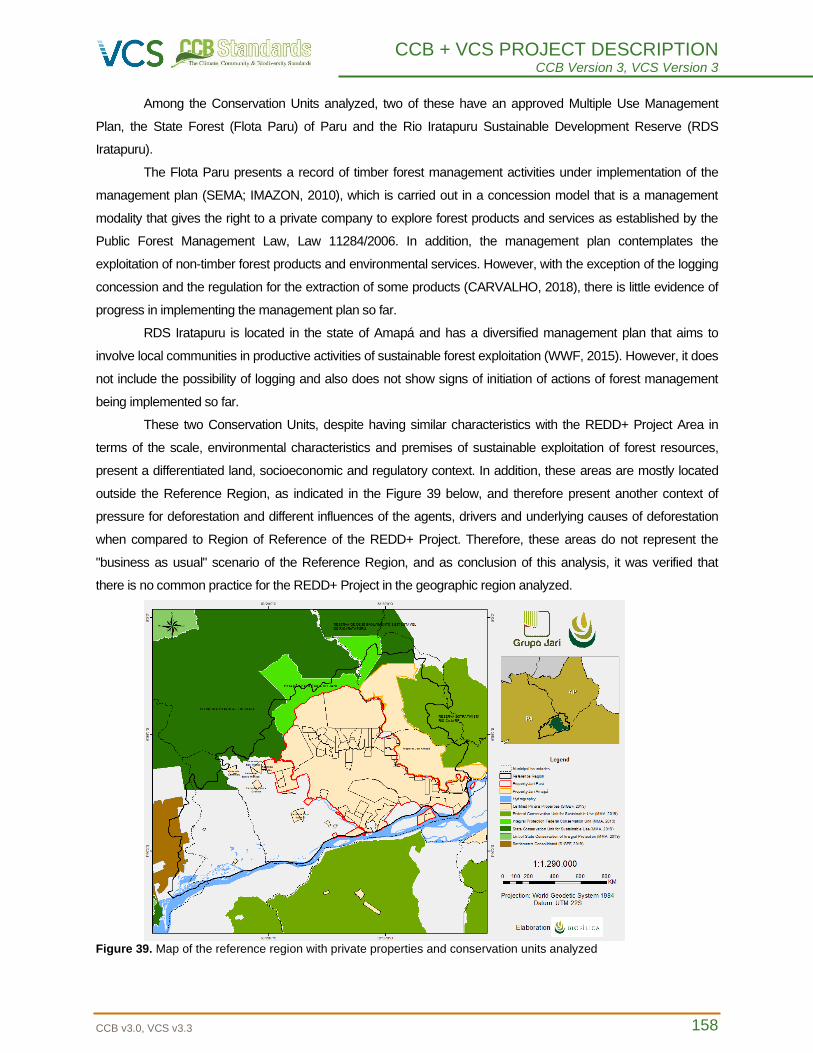
CCB + VCS PROJECT DESCRIPTION CCB Version 3, VCS Version 3
CCB v3.0, VCS v3.3 158
Among the Conservation Units analyzed, two of these have an approved Multiple Use Management
Plan, the State Forest (Flota Paru) of Paru and the Rio Iratapuru Sustainable Development Reserve (RDS
Iratapuru).
The Flota Paru presents a record of timber forest management activities under implementation of the
management plan (SEMA; IMAZON, 2010), which is carried out in a concession model that is a management
modality that gives the right to a private company to explore forest products and services as established by the
Public Forest Management Law, Law 11284/2006. In addition, the management plan contemplates the
exploitation of non-timber forest products and environmental services. However, with the exception of the logging
concession and the regulation for the extraction of some products (CARVALHO, 2018), there is little evidence of
progress in implementing the management plan so far.
RDS Iratapuru is located in the state of Amapá and has a diversified management plan that aims to
involve local communities in productive activities of sustainable forest exploitation (WWF, 2015). However, it does
not include the possibility of logging and also does not show signs of initiation of actions of forest management
being implemented so far.
These two Conservation Units, despite having similar characteristics with the REDD+ Project Area in
terms of the scale, environmental characteristics and premises of sustainable exploitation of forest resources,
present a differentiated land, socioeconomic and regulatory context. In addition, these areas are mostly located
outside the Reference Region, as indicated in the Figure 39 below, and therefore present another context of
pressure for deforestation and different influences of the agents, drivers and underlying causes of deforestation
when compared to Region of Reference of the REDD+ Project. Therefore, these areas do not represent the
"business as usual" scenario of the Reference Region, and as conclusion of this analysis, it was verified that
there is no common practice for the REDD+ Project in the geographic region analyzed.
Figure 39. Map of the reference region with private properties and conservation units analyzed
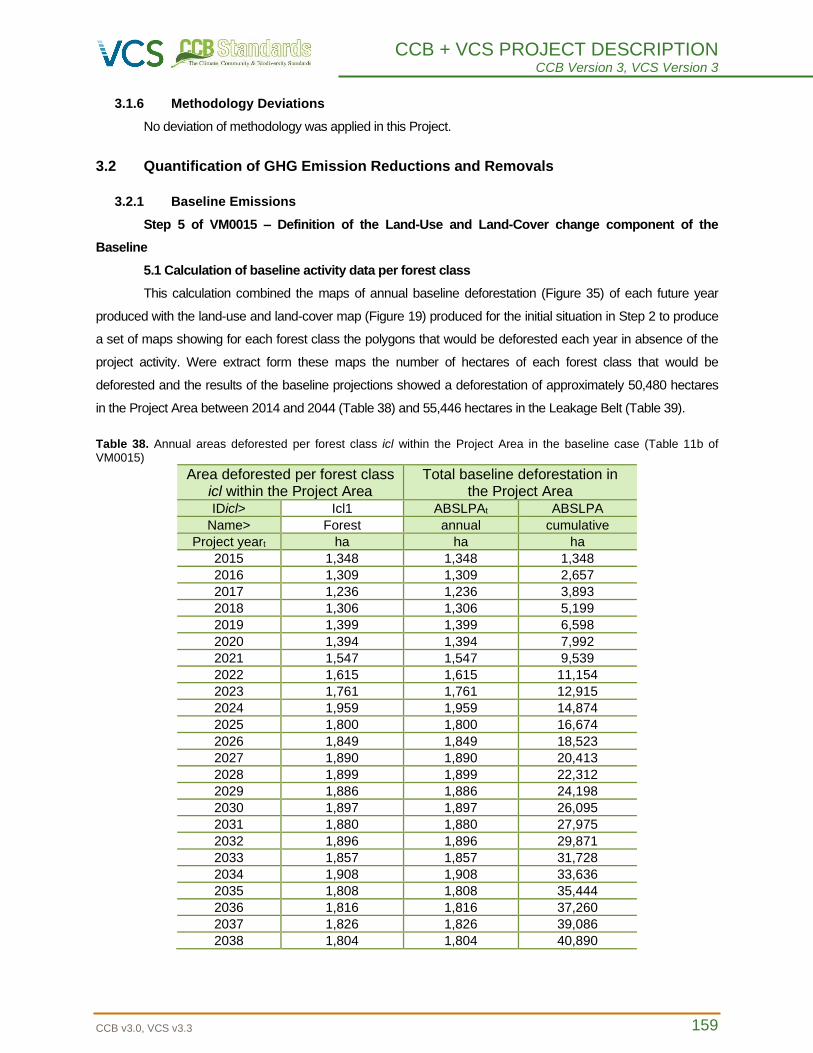
CCB + VCS PROJECT DESCRIPTION CCB Version 3, VCS Version 3
CCB v3.0, VCS v3.3 159
3.1.6 Methodology Deviations
No deviation of methodology was applied in this Project.
3.2 Quantification of GHG Emission Reductions and Removals
3.2.1 Baseline Emissions
Step 5 of VM0015 – Definition of the Land-Use and Land-Cover change component of the
Baseline
5.1 Calculation of baseline activity data per forest class
This calculation combined the maps of annual baseline deforestation (Figure 35) of each future year
produced with the land-use and land-cover map (Figure 19) produced for the initial situation in Step 2 to produce
a set of maps showing for each forest class the polygons that would be deforested each year in absence of the
project activity. Were extract form these maps the number of hectares of each forest class that would be
deforested and the results of the baseline projections showed a deforestation of approximately 50,480 hectares
in the Project Area between 2014 and 2044 (Table 38) and 55,446 hectares in the Leakage Belt (Table 39).
Table 38. Annual areas deforested per forest class icl within the Project Area in the baseline case (Table 11b of VM0015)
Area deforested per forest class icl within the Project Area
Total baseline deforestation in the Project Area
IDicl> Icl1 ABSLPAt ABSLPA
Name> Forest annual cumulative
Project yeart ha ha ha
2015 1,348 1,348 1,348
2016 1,309 1,309 2,657
2017 1,236 1,236 3,893
2018 1,306 1,306 5,199
2019 1,399 1,399 6,598
2020 1,394 1,394 7,992
2021 1,547 1,547 9,539
2022 1,615 1,615 11,154
2023 1,761 1,761 12,915
2024 1,959 1,959 14,874
2025 1,800 1,800 16,674
2026 1,849 1,849 18,523
2027 1,890 1,890 20,413
2028 1,899 1,899 22,312
2029 1,886 1,886 24,198
2030 1,897 1,897 26,095
2031 1,880 1,880 27,975
2032 1,896 1,896 29,871
2033 1,857 1,857 31,728
2034 1,908 1,908 33,636
2035 1,808 1,808 35,444
2036 1,816 1,816 37,260
2037 1,826 1,826 39,086
2038 1,804 1,804 40,890
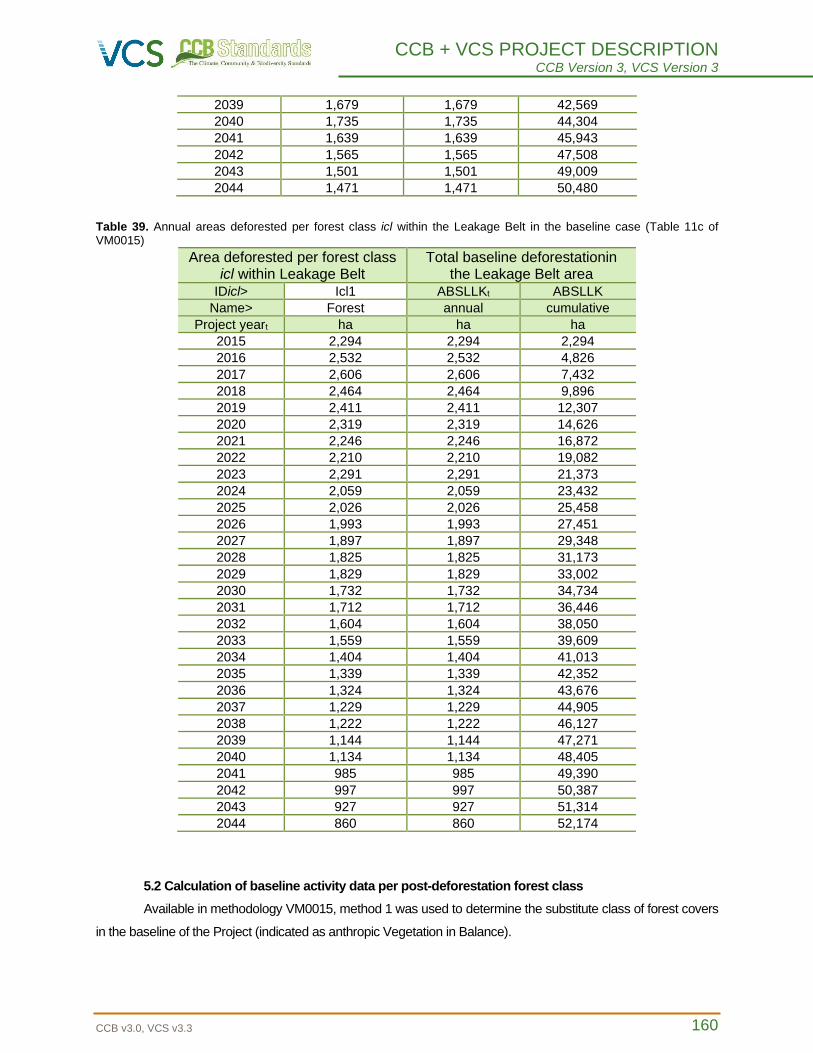
CCB + VCS PROJECT DESCRIPTION CCB Version 3, VCS Version 3
CCB v3.0, VCS v3.3 160
2039 1,679 1,679 42,569
2040 1,735 1,735 44,304
2041 1,639 1,639 45,943
2042 1,565 1,565 47,508
2043 1,501 1,501 49,009
2044 1,471 1,471 50,480
Table 39. Annual areas deforested per forest class icl within the Leakage Belt in the baseline case (Table 11c of VM0015)
Area deforested per forest class icl within Leakage Belt
Total baseline deforestationin the Leakage Belt area
IDicl> Icl1 ABSLLKt ABSLLK
Name> Forest annual cumulative
Project yeart ha ha ha
2015 2,294 2,294 2,294
2016 2,532 2,532 4,826
2017 2,606 2,606 7,432
2018 2,464 2,464 9,896
2019 2,411 2,411 12,307
2020 2,319 2,319 14,626
2021 2,246 2,246 16,872
2022 2,210 2,210 19,082
2023 2,291 2,291 21,373
2024 2,059 2,059 23,432
2025 2,026 2,026 25,458
2026 1,993 1,993 27,451
2027 1,897 1,897 29,348
2028 1,825 1,825 31,173
2029 1,829 1,829 33,002
2030 1,732 1,732 34,734
2031 1,712 1,712 36,446
2032 1,604 1,604 38,050
2033 1,559 1,559 39,609
2034 1,404 1,404 41,013
2035 1,339 1,339 42,352
2036 1,324 1,324 43,676
2037 1,229 1,229 44,905
2038 1,222 1,222 46,127
2039 1,144 1,144 47,271
2040 1,134 1,134 48,405
2041 985 985 49,390
2042 997 997 50,387
2043 927 927 51,314
2044 860 860 52,174
5.2 Calculation of baseline activity data per post-deforestation forest class
Available in methodology VM0015, method 1 was used to determine the substitute class of forest covers
in the baseline of the Project (indicated as anthropic Vegetation in Balance).
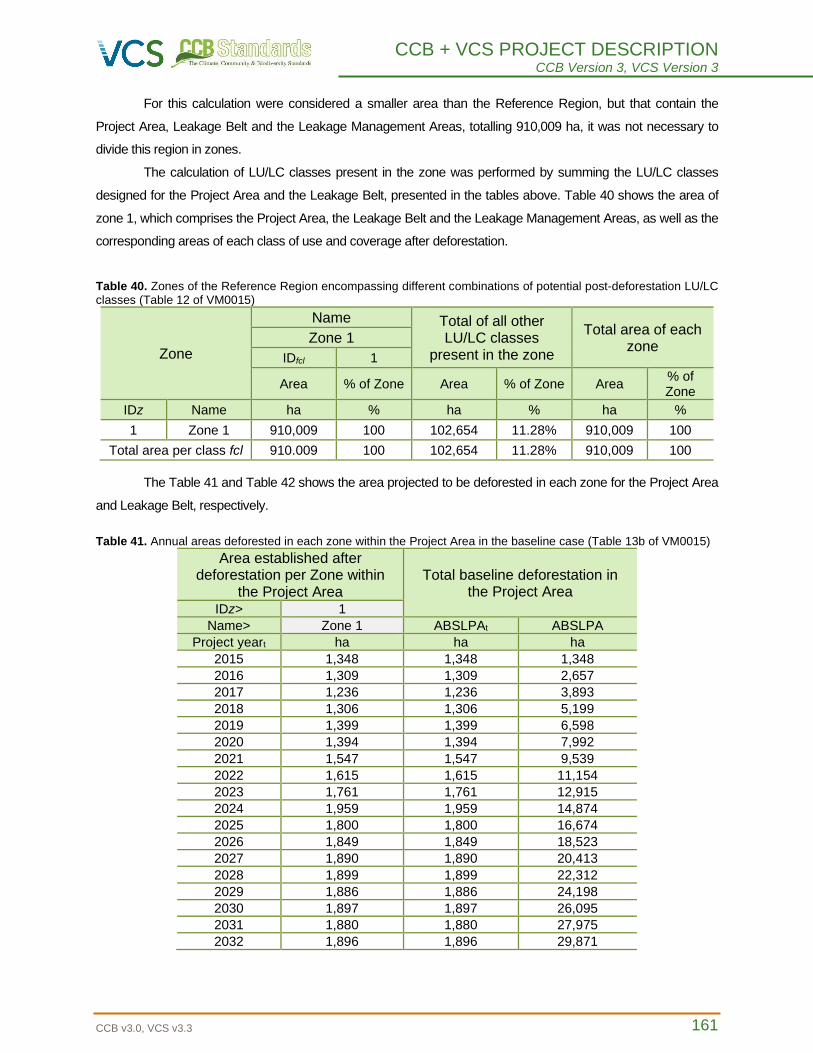
CCB + VCS PROJECT DESCRIPTION CCB Version 3, VCS Version 3
CCB v3.0, VCS v3.3 161
For this calculation were considered a smaller area than the Reference Region, but that contain the
Project Area, Leakage Belt and the Leakage Management Areas, totalling 910,009 ha, it was not necessary to
divide this region in zones.
The calculation of LU/LC classes present in the zone was performed by summing the LU/LC classes
designed for the Project Area and the Leakage Belt, presented in the tables above. Table 40 shows the area of
zone 1, which comprises the Project Area, the Leakage Belt and the Leakage Management Areas, as well as the
corresponding areas of each class of use and coverage after deforestation.
Table 40. Zones of the Reference Region encompassing different combinations of potential post-deforestation LU/LC classes (Table 12 of VM0015)
Zone
Name Total of all other LU/LC classes
present in the zone
Total area of each zone
Zone 1
IDfcl 1
Area % of Zone Area % of Zone Area % of Zone
IDz Name ha % ha % ha %
1 Zone 1 910,009 100 102,654 11.28% 910,009 100
Total area per class fcl 910.009 100 102,654 11.28% 910,009 100
The Table 41 and Table 42 shows the area projected to be deforested in each zone for the Project Area
and Leakage Belt, respectively.
Table 41. Annual areas deforested in each zone within the Project Area in the baseline case (Table 13b of VM0015)
Area established after deforestation per Zone within
the Project Area Total baseline deforestation in
the Project Area IDz> 1
Name> Zone 1 ABSLPAt ABSLPA
Project yeart ha ha ha
2015 1,348 1,348 1,348
2016 1,309 1,309 2,657
2017 1,236 1,236 3,893
2018 1,306 1,306 5,199
2019 1,399 1,399 6,598
2020 1,394 1,394 7,992
2021 1,547 1,547 9,539
2022 1,615 1,615 11,154
2023 1,761 1,761 12,915
2024 1,959 1,959 14,874
2025 1,800 1,800 16,674
2026 1,849 1,849 18,523
2027 1,890 1,890 20,413
2028 1,899 1,899 22,312
2029 1,886 1,886 24,198
2030 1,897 1,897 26,095
2031 1,880 1,880 27,975
2032 1,896 1,896 29,871
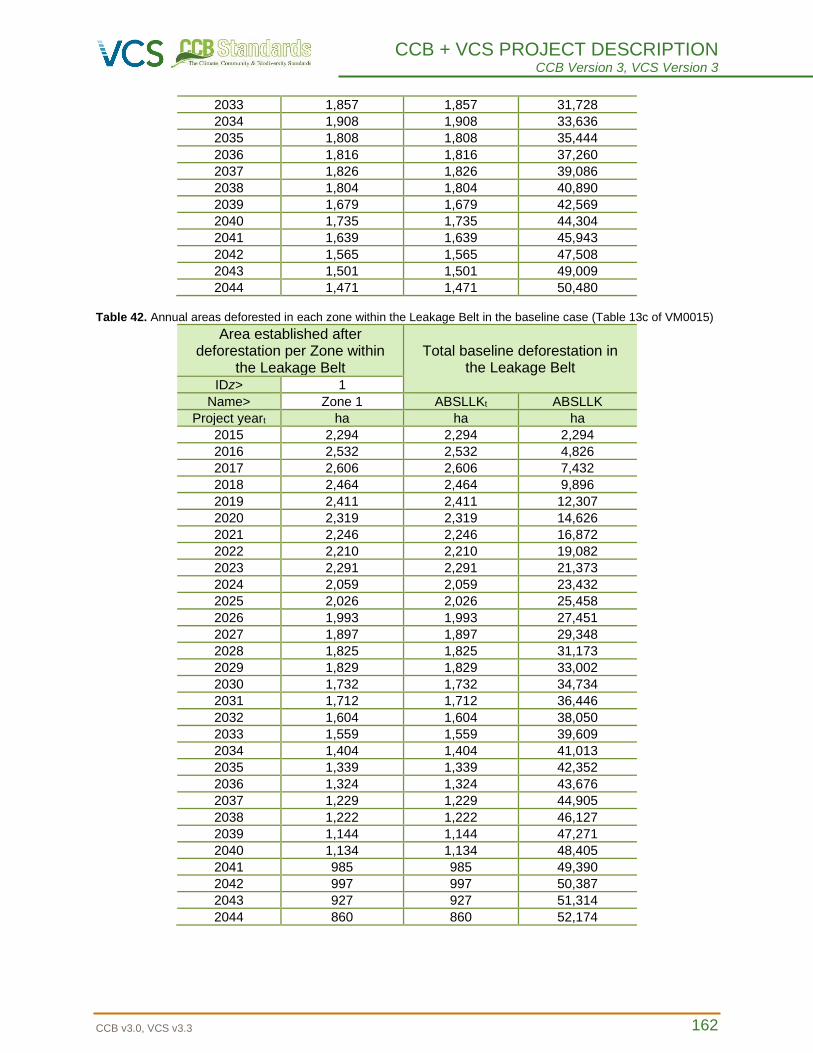
CCB + VCS PROJECT DESCRIPTION CCB Version 3, VCS Version 3
CCB v3.0, VCS v3.3 162
2033 1,857 1,857 31,728
2034 1,908 1,908 33,636
2035 1,808 1,808 35,444
2036 1,816 1,816 37,260
2037 1,826 1,826 39,086
2038 1,804 1,804 40,890
2039 1,679 1,679 42,569
2040 1,735 1,735 44,304
2041 1,639 1,639 45,943
2042 1,565 1,565 47,508
2043 1,501 1,501 49,009
2044 1,471 1,471 50,480 Table 42. Annual areas deforested in each zone within the Leakage Belt in the baseline case (Table 13c of VM0015)
Area established after deforestation per Zone within
the Leakage Belt Total baseline deforestation in
the Leakage Belt IDz> 1
Name> Zone 1 ABSLLKt ABSLLK
Project yeart ha ha ha
2015 2,294 2,294 2,294
2016 2,532 2,532 4,826
2017 2,606 2,606 7,432
2018 2,464 2,464 9,896
2019 2,411 2,411 12,307
2020 2,319 2,319 14,626
2021 2,246 2,246 16,872
2022 2,210 2,210 19,082
2023 2,291 2,291 21,373
2024 2,059 2,059 23,432
2025 2,026 2,026 25,458
2026 1,993 1,993 27,451
2027 1,897 1,897 29,348
2028 1,825 1,825 31,173
2029 1,829 1,829 33,002
2030 1,732 1,732 34,734
2031 1,712 1,712 36,446
2032 1,604 1,604 38,050
2033 1,559 1,559 39,609
2034 1,404 1,404 41,013
2035 1,339 1,339 42,352
2036 1,324 1,324 43,676
2037 1,229 1,229 44,905
2038 1,222 1,222 46,127
2039 1,144 1,144 47,271
2040 1,134 1,134 48,405
2041 985 985 49,390
2042 997 997 50,387
2043 927 927 51,314
2044 860 860 52,174
CCB + VCS PROJECT DESCRIPTION CCB Version 3, VCS Version 3
CCB v3.0, VCS v3.3 163
5.3 Calculation of baseline activity data per LU/LC change category
Does not apply, the Method 2 was not applied.
Step 6 of VM0015 - Estimation of baseline carbon stock changes and Non-CO2 emissions
The estimate of the carbon stock for the Forest class was reached through forest inventory carried out
by the technical team of FRM Brasil, in the year 2016, in partnership with Biofílica Investimentos Ambientais. The
main results found in this study will be described below, and more information can be obtained in the document
Final Report for the Determination of Forest Carbon Stock.
6.1 Estimation of baseline carbon stock changes
6.1.1 Estimatiton of the average carbon stocks of each LU/LC class
The implementation of the forest inventory in the Jari/Pará REDD+ Project Area adopted the
recommendations presented in the VCS approved methodology VM0015, distributing the plots proportionally to
the area of each typology and considering a uniform distribution of plots in the management area. As already
presented in section 2.1.5 – Physical Parameters a total of 10 typologies were identified in the Project Area,
which resulted in a total of 70 planned initial sample units. In addition, it was also considered an analysis for the
plots implanted in managed areas and unmanaged areas. All plots were evenly distributed to cover much of the
Project Area.
According to EMBRAPA (2005), the permanent plots may be have a circular, square or rectangular
shape. However, the most used shape is the square in tropical forests. Based on this guideline, the inventory was
carried out in 1-hectare square plots, as it was found that with this format and dimension it is possible to obtain
greater representativity and less difficulty of operation.
For each plot, data will be collected from the arboreal stratum, collecting individuals with Diameter at the
Chest Height (DCH) of more than 20 centimeters and for better ordering each plot was divided into subunits of
0.25 hectares. Each implemented plot received an identification plate with the unit number this numbering was
allocated at the start point of each plot, and was also done for the subunits (Figure 40).
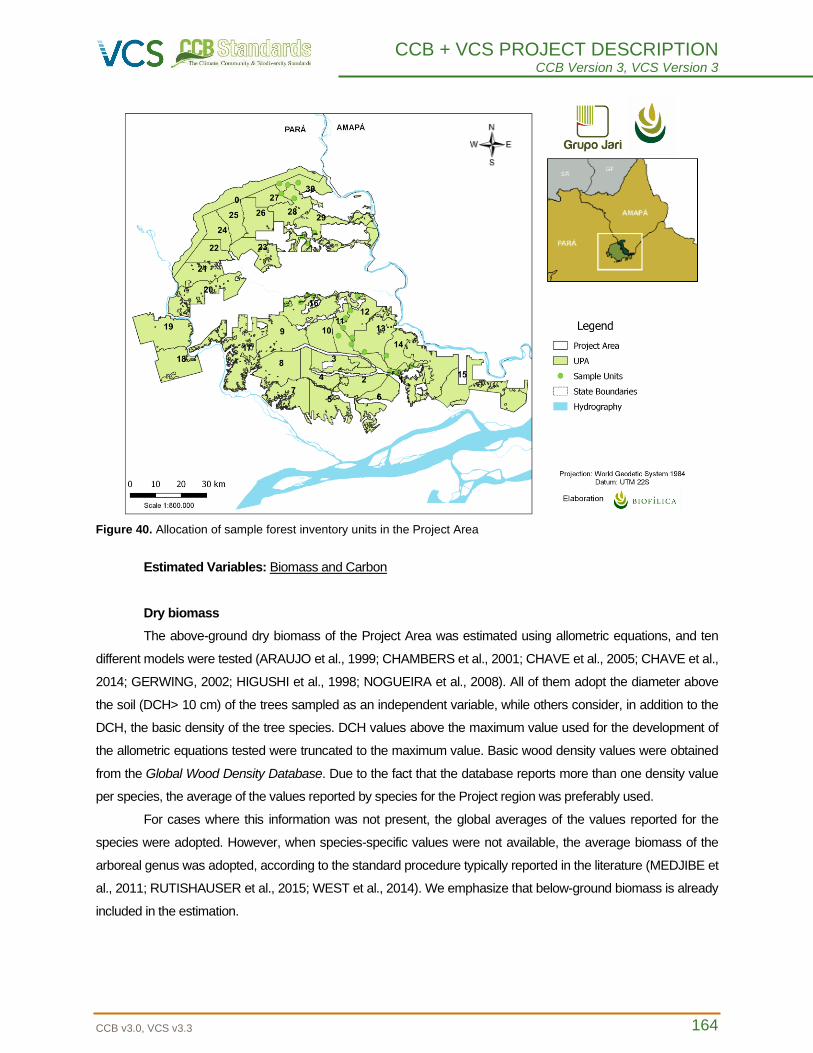
CCB + VCS PROJECT DESCRIPTION CCB Version 3, VCS Version 3
CCB v3.0, VCS v3.3 164
Figure 40. Allocation of sample forest inventory units in the Project Area
Estimated Variables: Biomass and Carbon
Dry biomass
The above-ground dry biomass of the Project Area was estimated using allometric equations, and ten
different models were tested (ARAUJO et al., 1999; CHAMBERS et al., 2001; CHAVE et al., 2005; CHAVE et al.,
2014; GERWING, 2002; HIGUSHI et al., 1998; NOGUEIRA et al., 2008). All of them adopt the diameter above
the soil (DCH> 10 cm) of the trees sampled as an independent variable, while others consider, in addition to the
DCH, the basic density of the tree species. DCH values above the maximum value used for the development of
the allometric equations tested were truncated to the maximum value. Basic wood density values were obtained
from the Global Wood Density Database. Due to the fact that the database reports more than one density value
per species, the average of the values reported by species for the Project region was preferably used.
For cases where this information was not present, the global averages of the values reported for the
species were adopted. However, when species-specific values were not available, the average biomass of the
arboreal genus was adopted, according to the standard procedure typically reported in the literature (MEDJIBE et
al., 2011; RUTISHAUSER et al., 2015; WEST et al., 2014). We emphasize that below-ground biomass is already
included in the estimation.
CCB + VCS PROJECT DESCRIPTION CCB Version 3, VCS Version 3
CCB v3.0, VCS v3.3 165
To quantify the biomass, we used the allometric equation described by Nogueira et al. (2008), showing
more appropriate for the region of study. The following is a description of Equation (5):
(5)
Where:
B: dry biomass (kg);
DCH: diameter at breast height (1.30 cm);
Carbon Content
In accordance with the methodology VM0015, the carbon stocks were quantified in tons of carbon
dioxide equivalent per hectare (tCO2-e ha-1). For calculations and conservatively, the estimated carbon stocks
considered only the biomass reservoirs above and below the ground. The following equation was used for the
conversion of the dry biomass into tCO2-e ha-1 based on the sampled trees and their respective plots and
subplots (Equation 6):
(6)
Where:
Bi,j,k: ton of dry biomass per hectare of tree i in plot j and sub plot k;
S: fraction of biomass below the ground in relation to Bi;
FC: fraction of biomass carbon.
The carbon fraction of biomass used for the calculations was 0.485, value reported by Silva (2007) and
previously used in other REDD+ Projects implemented in the Brazilian Amazon. The proportion of below-ground
biomass was estimated with the standard value reported by Nogueira et al. (2008), corresponding to 25.8% of
above-ground biomass.
Sampling Effort
The sampling effort (number of plots to be implanted) was estimated according to the Equation A3-1 of
the methodology VM0015 (Equation 7):
(7)
Where:
t: value of the t-student table at the 95% confidence level;
E: maximum allowed value of sampling error (10%);
CV: coefficient of variation for biomass in tropical forests (%);
N: possible number of sample plots.
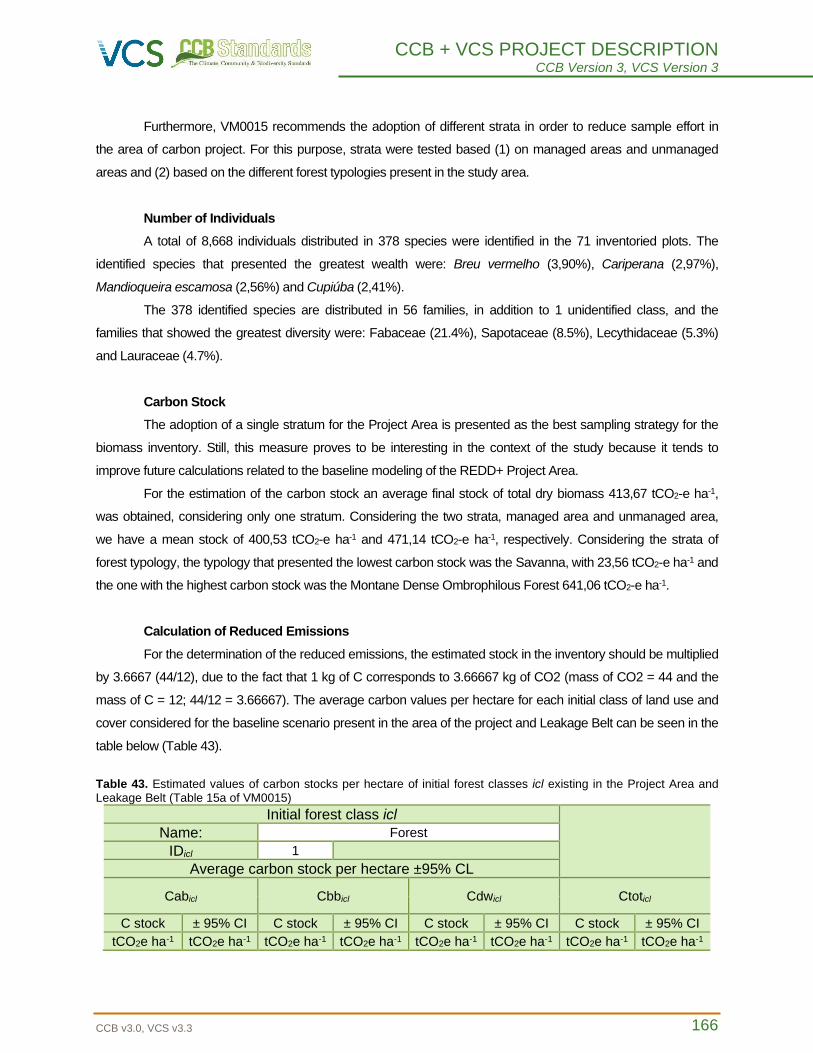
CCB + VCS PROJECT DESCRIPTION CCB Version 3, VCS Version 3
CCB v3.0, VCS v3.3 166
Furthermore, VM0015 recommends the adoption of different strata in order to reduce sample effort in
the area of carbon project. For this purpose, strata were tested based (1) on managed areas and unmanaged
areas and (2) based on the different forest typologies present in the study area.
Number of Individuals
A total of 8,668 individuals distributed in 378 species were identified in the 71 inventoried plots. The
identified species that presented the greatest wealth were: Breu vermelho (3,90%), Cariperana (2,97%),
Mandioqueira escamosa (2,56%) and Cupiúba (2,41%).
The 378 identified species are distributed in 56 families, in addition to 1 unidentified class, and the
families that showed the greatest diversity were: Fabaceae (21.4%), Sapotaceae (8.5%), Lecythidaceae (5.3%)
and Lauraceae (4.7%).
Carbon Stock
The adoption of a single stratum for the Project Area is presented as the best sampling strategy for the
biomass inventory. Still, this measure proves to be interesting in the context of the study because it tends to
improve future calculations related to the baseline modeling of the REDD+ Project Area.
For the estimation of the carbon stock an average final stock of total dry biomass 413,67 tCO2-e ha-1,
was obtained, considering only one stratum. Considering the two strata, managed area and unmanaged area,
we have a mean stock of 400,53 tCO2-e ha-1 and 471,14 tCO2-e ha-1, respectively. Considering the strata of
forest typology, the typology that presented the lowest carbon stock was the Savanna, with 23,56 tCO2-e ha-1 and
the one with the highest carbon stock was the Montane Dense Ombrophilous Forest 641,06 tCO2-e ha-1.
Calculation of Reduced Emissions
For the determination of the reduced emissions, the estimated stock in the inventory should be multiplied
by 3.6667 (44/12), due to the fact that 1 kg of C corresponds to 3.66667 kg of CO2 (mass of CO2 = 44 and the
mass of C = 12; 44/12 = 3.66667). The average carbon values per hectare for each initial class of land use and
cover considered for the baseline scenario present in the area of the project and Leakage Belt can be seen in the
table below (Table 43).
Table 43. Estimated values of carbon stocks per hectare of initial forest classes icl existing in the Project Area and Leakage Belt (Table 15a of VM0015)
Initial forest class icl
Name: Forest
IDicl 1
Average carbon stock per hectare ±95% CL
Cabicl Cbbicl Cdwicl Ctoticl
C stock ± 95% CI C stock ± 95% CI C stock ± 95% CI C stock ± 95% CI
tCO2e ha-1 tCO2e ha-1 tCO2e ha-1 tCO2e ha-1 tCO2e ha-1 tCO2e ha-1 tCO2e ha-1 tCO2e ha-1
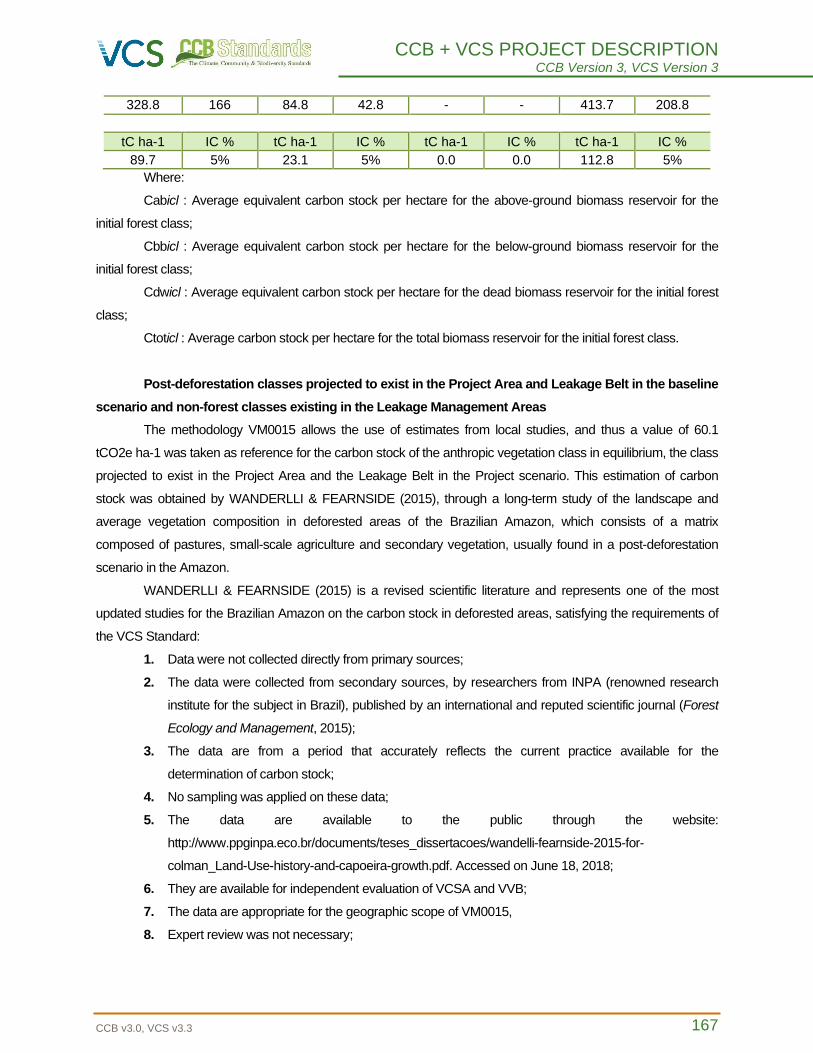
CCB + VCS PROJECT DESCRIPTION CCB Version 3, VCS Version 3
CCB v3.0, VCS v3.3 167
328.8 166 84.8 42.8 - - 413.7 208.8
tC ha-1 IC % tC ha-1 IC % tC ha-1 IC % tC ha-1 IC %
89.7 5% 23.1 5% 0.0 0.0 112.8 5%
Where:
Cabicl : Average equivalent carbon stock per hectare for the above-ground biomass reservoir for the
initial forest class;
Cbbicl : Average equivalent carbon stock per hectare for the below-ground biomass reservoir for the
initial forest class;
Cdwicl : Average equivalent carbon stock per hectare for the dead biomass reservoir for the initial forest
class;
Ctoticl : Average carbon stock per hectare for the total biomass reservoir for the initial forest class.
Post-deforestation classes projected to exist in the Project Area and Leakage Belt in the baseline
scenario and non-forest classes existing in the Leakage Management Areas
The methodology VM0015 allows the use of estimates from local studies, and thus a value of 60.1
tCO2e ha-1 was taken as reference for the carbon stock of the anthropic vegetation class in equilibrium, the class
projected to exist in the Project Area and the Leakage Belt in the Project scenario. This estimation of carbon
stock was obtained by WANDERLLI & FEARNSIDE (2015), through a long-term study of the landscape and
average vegetation composition in deforested areas of the Brazilian Amazon, which consists of a matrix
composed of pastures, small-scale agriculture and secondary vegetation, usually found in a post-deforestation
scenario in the Amazon.
WANDERLLI & FEARNSIDE (2015) is a revised scientific literature and represents one of the most
updated studies for the Brazilian Amazon on the carbon stock in deforested areas, satisfying the requirements of
the VCS Standard:
1. Data were not collected directly from primary sources;
2. The data were collected from secondary sources, by researchers from INPA (renowned research
institute for the subject in Brazil), published by an international and reputed scientific journal (Forest
Ecology and Management, 2015);
3. The data are from a period that accurately reflects the current practice available for the
determination of carbon stock;
4. No sampling was applied on these data;
5. The data are available to the public through the website:
http://www.ppginpa.eco.br/documents/teses_dissertacoes/wandelli-fearnside-2015-for-
colman_Land-Use-history-and-capoeira-growth.pdf. Accessed on June 18, 2018;
6. They are available for independent evaluation of VCSA and VVB;
7. The data are appropriate for the geographic scope of VM0015,
8. Expert review was not necessary;
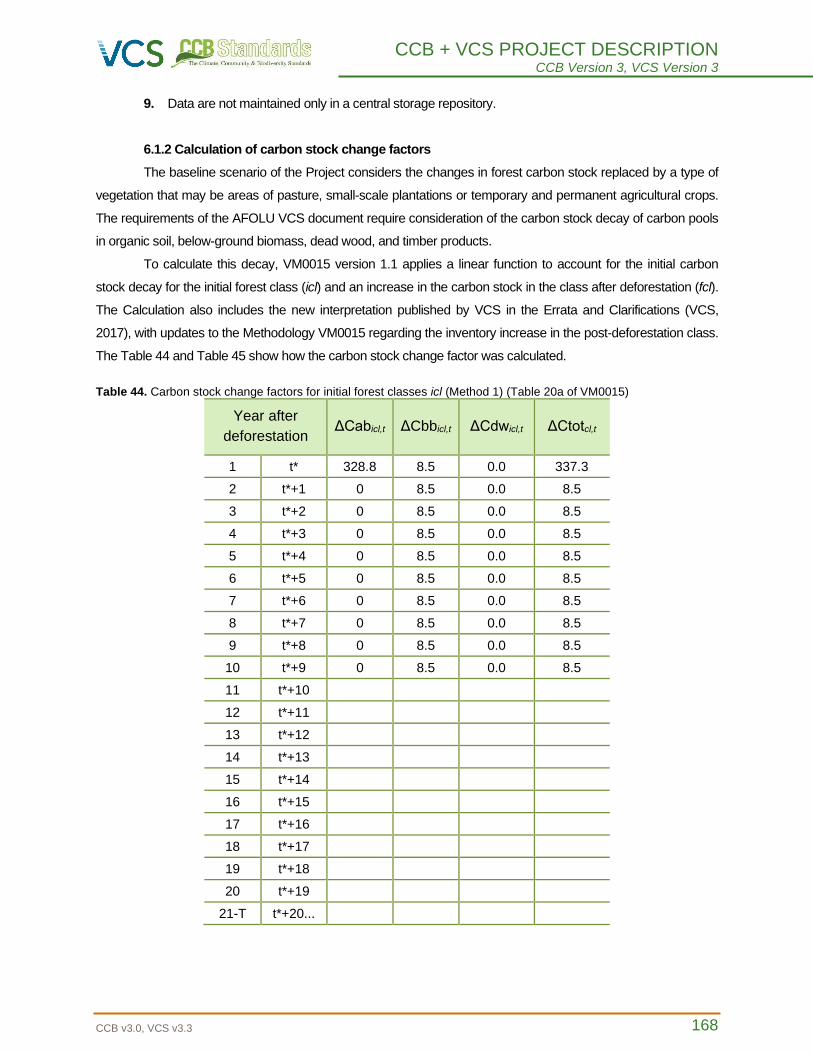
CCB + VCS PROJECT DESCRIPTION CCB Version 3, VCS Version 3
CCB v3.0, VCS v3.3 168
9. Data are not maintained only in a central storage repository.
6.1.2 Calculation of carbon stock change factors
The baseline scenario of the Project considers the changes in forest carbon stock replaced by a type of
vegetation that may be areas of pasture, small-scale plantations or temporary and permanent agricultural crops.
The requirements of the AFOLU VCS document require consideration of the carbon stock decay of carbon pools
in organic soil, below-ground biomass, dead wood, and timber products.
To calculate this decay, VM0015 version 1.1 applies a linear function to account for the initial carbon
stock decay for the initial forest class (icl) and an increase in the carbon stock in the class after deforestation (fcl).
The Calculation also includes the new interpretation published by VCS in the Errata and Clarifications (VCS,
2017), with updates to the Methodology VM0015 regarding the inventory increase in the post-deforestation class.
The Table 44 and Table 45 show how the carbon stock change factor was calculated.
Table 44. Carbon stock change factors for initial forest classes icl (Method 1) (Table 20a of VM0015)
Year after
deforestation ΔCabicl,t ΔCbbicl,t ΔCdwicl,t ΔCtotcl,t
1 t* 328.8 8.5 0.0 337.3
2 t*+1 0 8.5 0.0 8.5
3 t*+2 0 8.5 0.0 8.5
4 t*+3 0 8.5 0.0 8.5
5 t*+4 0 8.5 0.0 8.5
6 t*+5 0 8.5 0.0 8.5
7 t*+6 0 8.5 0.0 8.5
8 t*+7 0 8.5 0.0 8.5
9 t*+8 0 8.5 0.0 8.5
10 t*+9 0 8.5 0.0 8.5
11 t*+10
12 t*+11
13 t*+12
14 t*+13
15 t*+14
16 t*+15
17 t*+16
18 t*+17
19 t*+18
20 t*+19
21-T t*+20...
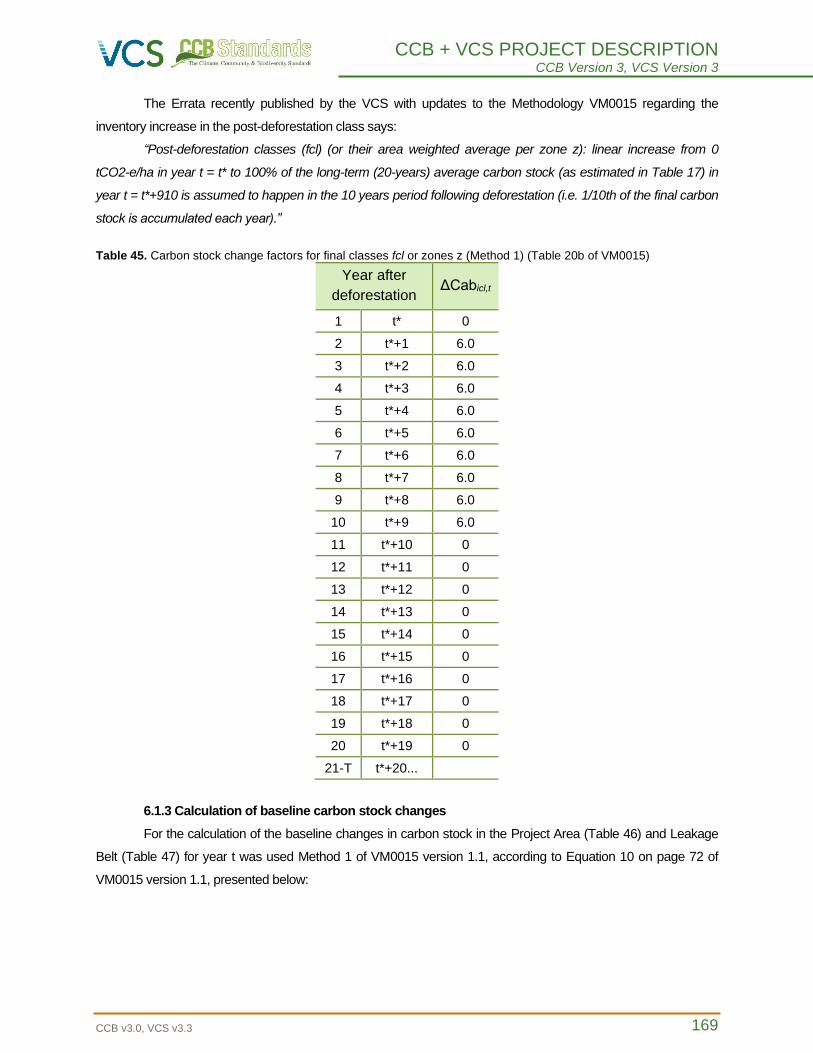
CCB + VCS PROJECT DESCRIPTION CCB Version 3, VCS Version 3
CCB v3.0, VCS v3.3 169
The Errata recently published by the VCS with updates to the Methodology VM0015 regarding the
inventory increase in the post-deforestation class says:
“Post-deforestation classes (fcl) (or their area weighted average per zone z): linear increase from 0
tCO2-e/ha in year t = t* to 100% of the long-term (20-years) average carbon stock (as estimated in Table 17) in
year t = t*+910 is assumed to happen in the 10 years period following deforestation (i.e. 1/10th of the final carbon
stock is accumulated each year).”
Table 45. Carbon stock change factors for final classes fcl or zones z (Method 1) (Table 20b of VM0015)
Year after
deforestation ΔCabicl,t
1 t* 0
2 t*+1 6.0
3 t*+2 6.0
4 t*+3 6.0
5 t*+4 6.0
6 t*+5 6.0
7 t*+6 6.0
8 t*+7 6.0
9 t*+8 6.0
10 t*+9 6.0
11 t*+10 0
12 t*+11 0
13 t*+12 0
14 t*+13 0
15 t*+14 0
16 t*+15 0
17 t*+16 0
18 t*+17 0
19 t*+18 0
20 t*+19 0
21-T t*+20...
6.1.3 Calculation of baseline carbon stock changes
For the calculation of the baseline changes in carbon stock in the Project Area (Table 46) and Leakage
Belt (Table 47) for year t was used Method 1 of VM0015 version 1.1, according to Equation 10 on page 72 of
VM0015 version 1.1, presented below:
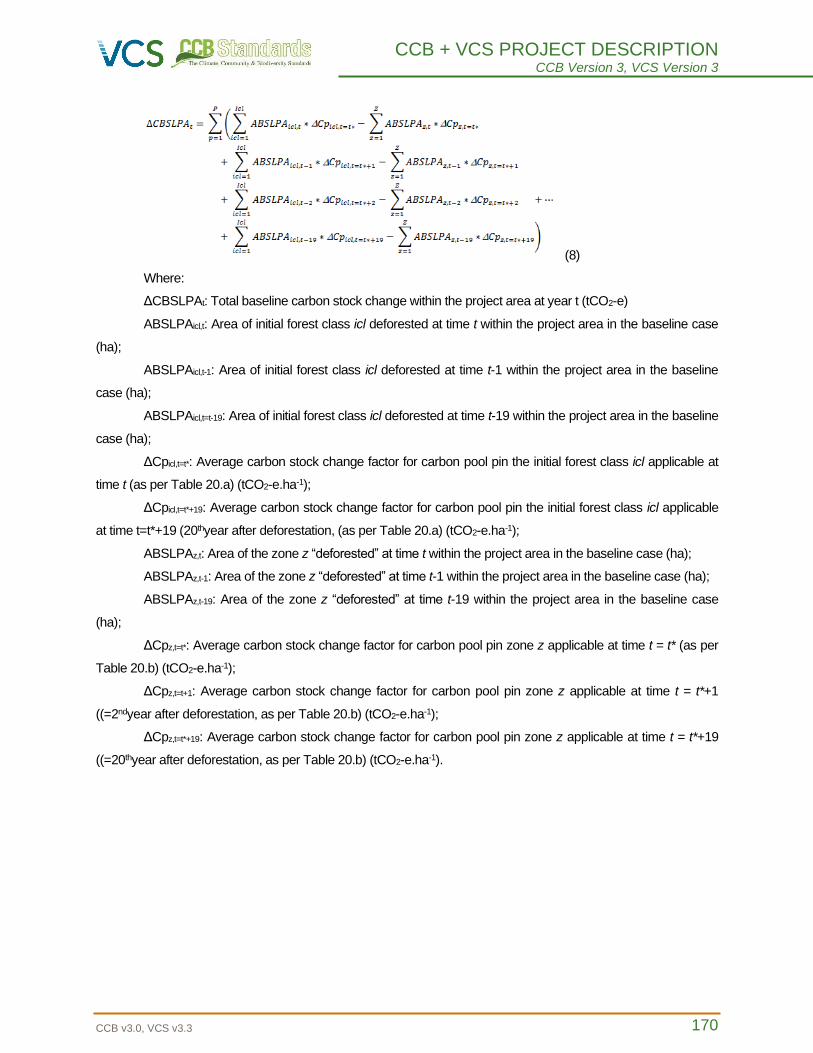
CCB + VCS PROJECT DESCRIPTION CCB Version 3, VCS Version 3
CCB v3.0, VCS v3.3 170
(8)
Where:
ΔCBSLPAt: Total baseline carbon stock change within the project area at year t (tCO2-e)
ABSLPAicl,t: Area of initial forest class icl deforested at time t within the project area in the baseline case
(ha);
ABSLPAicl,t-1: Area of initial forest class icl deforested at time t-1 within the project area in the baseline
case (ha);
ABSLPAicl,t=t-19: Area of initial forest class icl deforested at time t-19 within the project area in the baseline
case (ha);
ΔCpicl,t=t*: Average carbon stock change factor for carbon pool pin the initial forest class icl applicable at
time t (as per Table 20.a) (tCO2-e.ha-1);
ΔCpicl,t=t*+19: Average carbon stock change factor for carbon pool pin the initial forest class icl applicable
at time t=t*+19 (20thyear after deforestation, (as per Table 20.a) (tCO2-e.ha-1);
ABSLPAz,t: Area of the zone z “deforested” at time t within the project area in the baseline case (ha);
ABSLPAz,t-1: Area of the zone z “deforested” at time t-1 within the project area in the baseline case (ha);
ABSLPAz,t-19: Area of the zone z “deforested” at time t-19 within the project area in the baseline case
(ha);
ΔCpz,t=t*: Average carbon stock change factor for carbon pool pin zone z applicable at time t = t* (as per
Table 20.b) (tCO2-e.ha-1);
ΔCpz,t=t+1: Average carbon stock change factor for carbon pool pin zone z applicable at time t = t*+1
((=2ndyear after deforestation, as per Table 20.b) (tCO2-e.ha-1);
ΔCpz,t=t*+19: Average carbon stock change factor for carbon pool pin zone z applicable at time t = t*+19
((=20thyear after deforestation, as per Table 20.b) (tCO2-e.ha-1).
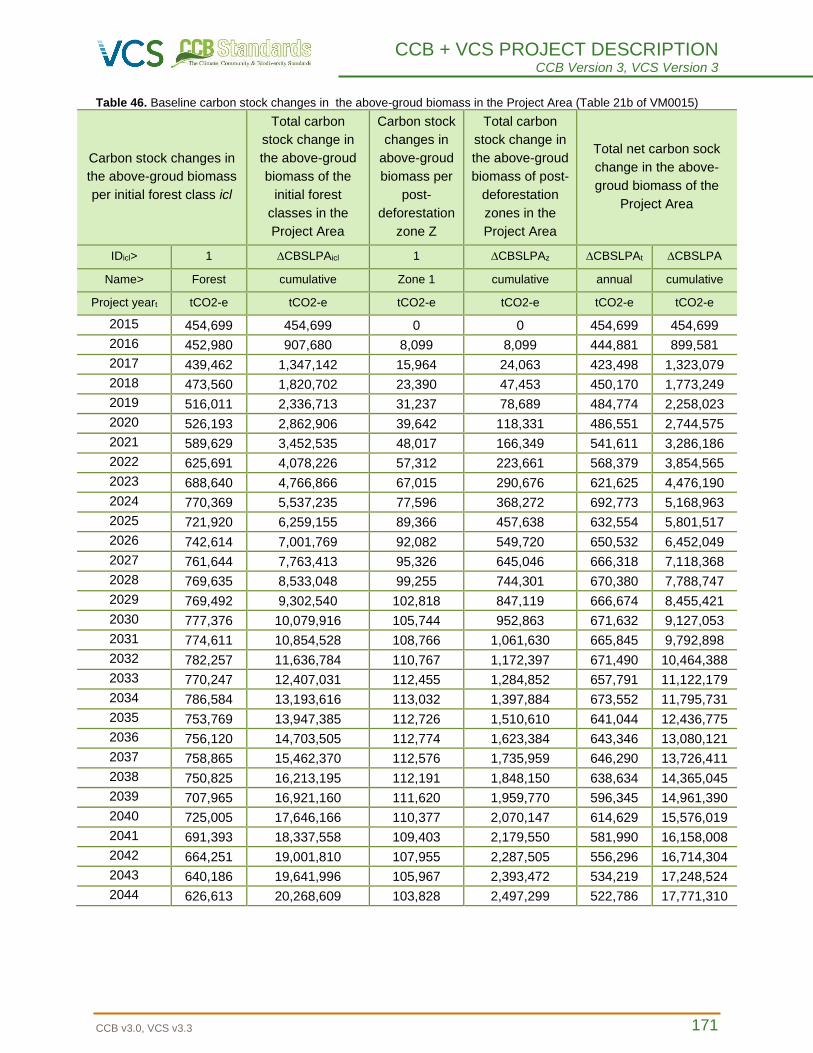
CCB + VCS PROJECT DESCRIPTION CCB Version 3, VCS Version 3
CCB v3.0, VCS v3.3 171
Table 46. Baseline carbon stock changes in the above-groud biomass in the Project Area (Table 21b of VM0015)
Carbon stock changes in
the above-groud biomass
per initial forest class icl
Total carbon
stock change in
the above-groud
biomass of the
initial forest
classes in the
Project Area
Carbon stock
changes in
above-groud
biomass per
post-
deforestation
zone Z
Total carbon
stock change in
the above-groud
biomass of post-
deforestation
zones in the
Project Area
Total net carbon sock
change in the above-
groud biomass of the
Project Area
IDicl> 1 ∆CBSLPAicl 1 ∆CBSLPAz ∆CBSLPAt ∆CBSLPA
Name> Forest cumulative Zone 1 cumulative annual cumulative
Project yeart tCO2-e tCO2-e tCO2-e tCO2-e tCO2-e tCO2-e
2015 454,699 454,699 0 0 454,699 454,699
2016 452,980 907,680 8,099 8,099 444,881 899,581
2017 439,462 1,347,142 15,964 24,063 423,498 1,323,079
2018 473,560 1,820,702 23,390 47,453 450,170 1,773,249
2019 516,011 2,336,713 31,237 78,689 484,774 2,258,023
2020 526,193 2,862,906 39,642 118,331 486,551 2,744,575
2021 589,629 3,452,535 48,017 166,349 541,611 3,286,186
2022 625,691 4,078,226 57,312 223,661 568,379 3,854,565
2023 688,640 4,766,866 67,015 290,676 621,625 4,476,190
2024 770,369 5,537,235 77,596 368,272 692,773 5,168,963
2025 721,920 6,259,155 89,366 457,638 632,554 5,801,517
2026 742,614 7,001,769 92,082 549,720 650,532 6,452,049
2027 761,644 7,763,413 95,326 645,046 666,318 7,118,368
2028 769,635 8,533,048 99,255 744,301 670,380 7,788,747
2029 769,492 9,302,540 102,818 847,119 666,674 8,455,421
2030 777,376 10,079,916 105,744 952,863 671,632 9,127,053
2031 774,611 10,854,528 108,766 1,061,630 665,845 9,792,898
2032 782,257 11,636,784 110,767 1,172,397 671,490 10,464,388
2033 770,247 12,407,031 112,455 1,284,852 657,791 11,122,179
2034 786,584 13,193,616 113,032 1,397,884 673,552 11,795,731
2035 753,769 13,947,385 112,726 1,510,610 641,044 12,436,775
2036 756,120 14,703,505 112,774 1,623,384 643,346 13,080,121
2037 758,865 15,462,370 112,576 1,735,959 646,290 13,726,411
2038 750,825 16,213,195 112,191 1,848,150 638,634 14,365,045
2039 707,965 16,921,160 111,620 1,959,770 596,345 14,961,390
2040 725,005 17,646,166 110,377 2,070,147 614,629 15,576,019
2041 691,393 18,337,558 109,403 2,179,550 581,990 16,158,008
2042 664,251 19,001,810 107,955 2,287,505 556,296 16,714,304
2043 640,186 19,641,996 105,967 2,393,472 534,219 17,248,524
2044 626,613 20,268,609 103,828 2,497,299 522,786 17,771,310
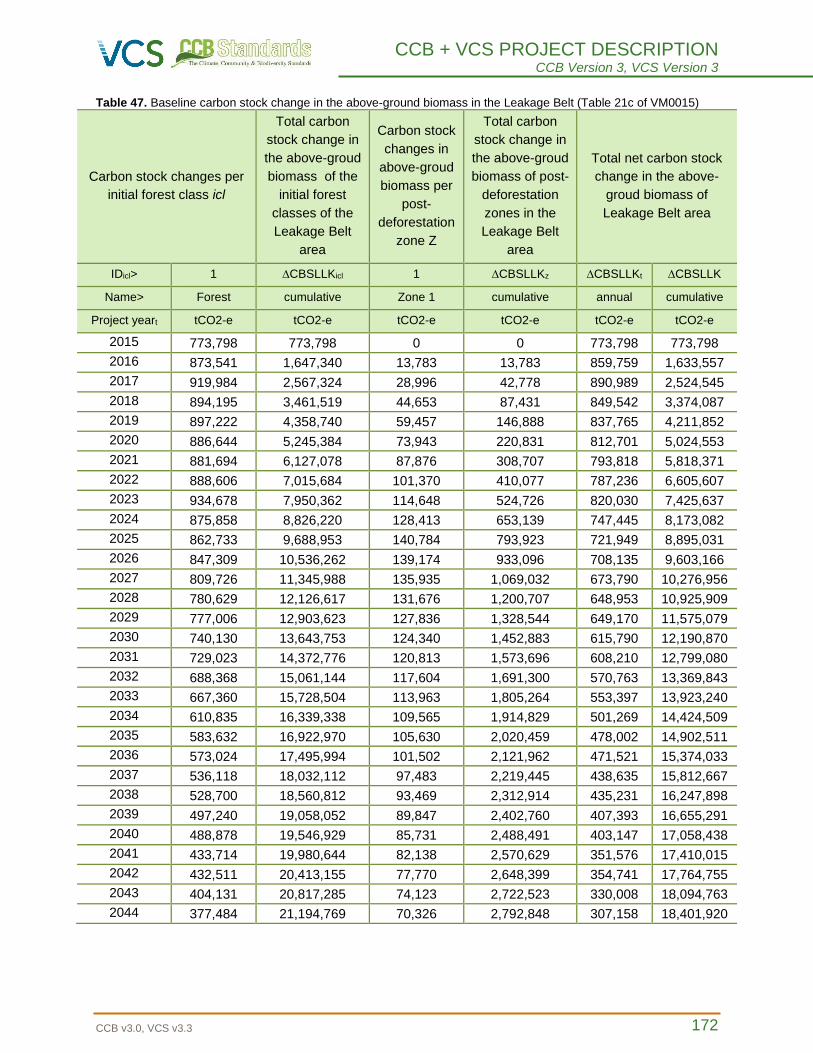
CCB + VCS PROJECT DESCRIPTION CCB Version 3, VCS Version 3
CCB v3.0, VCS v3.3 172
Table 47. Baseline carbon stock change in the above-ground biomass in the Leakage Belt (Table 21c of VM0015)
Carbon stock changes per
initial forest class icl
Total carbon
stock change in
the above-groud
biomass of the
initial forest
classes of the
Leakage Belt
area
Carbon stock
changes in
above-groud
biomass per
post-
deforestation
zone Z
Total carbon
stock change in
the above-groud
biomass of post-
deforestation
zones in the
Leakage Belt
area
Total net carbon stock
change in the above-
groud biomass of
Leakage Belt area
IDicl> 1 ∆CBSLLKicl 1 ∆CBSLLKz ∆CBSLLKt ∆CBSLLK
Name> Forest cumulative Zone 1 cumulative annual cumulative
Project yeart tCO2-e tCO2-e tCO2-e tCO2-e tCO2-e tCO2-e
2015 773,798 773,798 0 0 773,798 773,798
2016 873,541 1,647,340 13,783 13,783 859,759 1,633,557
2017 919,984 2,567,324 28,996 42,778 890,989 2,524,545
2018 894,195 3,461,519 44,653 87,431 849,542 3,374,087
2019 897,222 4,358,740 59,457 146,888 837,765 4,211,852
2020 886,644 5,245,384 73,943 220,831 812,701 5,024,553
2021 881,694 6,127,078 87,876 308,707 793,818 5,818,371
2022 888,606 7,015,684 101,370 410,077 787,236 6,605,607
2023 934,678 7,950,362 114,648 524,726 820,030 7,425,637
2024 875,858 8,826,220 128,413 653,139 747,445 8,173,082
2025 862,733 9,688,953 140,784 793,923 721,949 8,895,031
2026 847,309 10,536,262 139,174 933,096 708,135 9,603,166
2027 809,726 11,345,988 135,935 1,069,032 673,790 10,276,956
2028 780,629 12,126,617 131,676 1,200,707 648,953 10,925,909
2029 777,006 12,903,623 127,836 1,328,544 649,170 11,575,079
2030 740,130 13,643,753 124,340 1,452,883 615,790 12,190,870
2031 729,023 14,372,776 120,813 1,573,696 608,210 12,799,080
2032 688,368 15,061,144 117,604 1,691,300 570,763 13,369,843
2033 667,360 15,728,504 113,963 1,805,264 553,397 13,923,240
2034 610,835 16,339,338 109,565 1,914,829 501,269 14,424,509
2035 583,632 16,922,970 105,630 2,020,459 478,002 14,902,511
2036 573,024 17,495,994 101,502 2,121,962 471,521 15,374,033
2037 536,118 18,032,112 97,483 2,219,445 438,635 15,812,667
2038 528,700 18,560,812 93,469 2,312,914 435,231 16,247,898
2039 497,240 19,058,052 89,847 2,402,760 407,393 16,655,291
2040 488,878 19,546,929 85,731 2,488,491 403,147 17,058,438
2041 433,714 19,980,644 82,138 2,570,629 351,576 17,410,015
2042 432,511 20,413,155 77,770 2,648,399 354,741 17,764,755
2043 404,131 20,817,285 74,123 2,722,523 330,008 18,094,763
2044 377,484 21,194,769 70,326 2,792,848 307,158 18,401,920
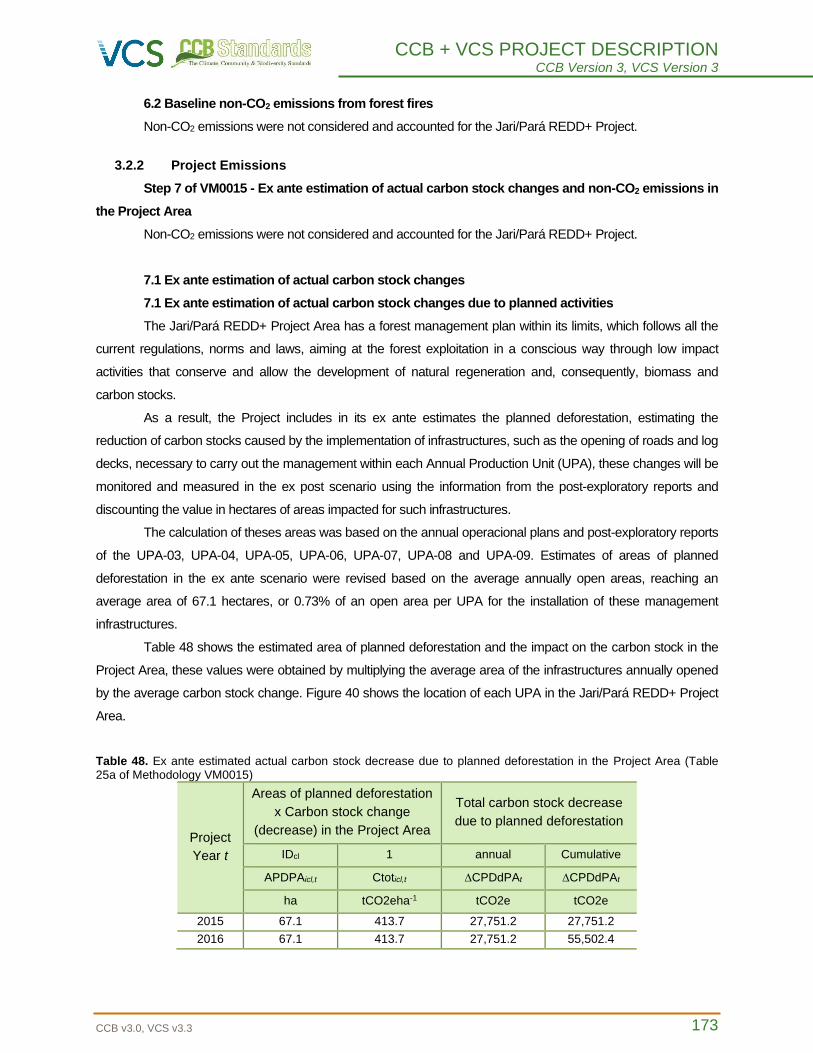
CCB + VCS PROJECT DESCRIPTION CCB Version 3, VCS Version 3
CCB v3.0, VCS v3.3 173
6.2 Baseline non-CO2 emissions from forest fires
Non-CO2 emissions were not considered and accounted for the Jari/Pará REDD+ Project.
3.2.2 Project Emissions
Step 7 of VM0015 - Ex ante estimation of actual carbon stock changes and non-CO2 emissions in
the Project Area
Non-CO2 emissions were not considered and accounted for the Jari/Pará REDD+ Project.
7.1 Ex ante estimation of actual carbon stock changes
7.1 Ex ante estimation of actual carbon stock changes due to planned activities
The Jari/Pará REDD+ Project Area has a forest management plan within its limits, which follows all the
current regulations, norms and laws, aiming at the forest exploitation in a conscious way through low impact
activities that conserve and allow the development of natural regeneration and, consequently, biomass and
carbon stocks.
As a result, the Project includes in its ex ante estimates the planned deforestation, estimating the
reduction of carbon stocks caused by the implementation of infrastructures, such as the opening of roads and log
decks, necessary to carry out the management within each Annual Production Unit (UPA), these changes will be
monitored and measured in the ex post scenario using the information from the post-exploratory reports and
discounting the value in hectares of areas impacted for such infrastructures.
The calculation of theses areas was based on the annual operacional plans and post-exploratory reports
of the UPA-03, UPA-04, UPA-05, UPA-06, UPA-07, UPA-08 and UPA-09. Estimates of areas of planned
deforestation in the ex ante scenario were revised based on the average annually open areas, reaching an
average area of 67.1 hectares, or 0.73% of an open area per UPA for the installation of these management
infrastructures.
Table 48 shows the estimated area of planned deforestation and the impact on the carbon stock in the
Project Area, these values were obtained by multiplying the average area of the infrastructures annually opened
by the average carbon stock change. Figure 40 shows the location of each UPA in the Jari/Pará REDD+ Project
Area.
Table 48. Ex ante estimated actual carbon stock decrease due to planned deforestation in the Project Area (Table 25a of Methodology VM0015)
Project
Year t
Areas of planned deforestation
x Carbon stock change
(decrease) in the Project Area
Total carbon stock decrease
due to planned deforestation
IDcl 1 annual Cumulative
APDPAicl,t Ctoticl,t ∆CPDdPAt ∆CPDdPAt
ha tCO2eha-1 tCO2e tCO2e
2015 67.1 413.7 27,751.2 27,751.2
2016 67.1 413.7 27,751.2 55,502.4
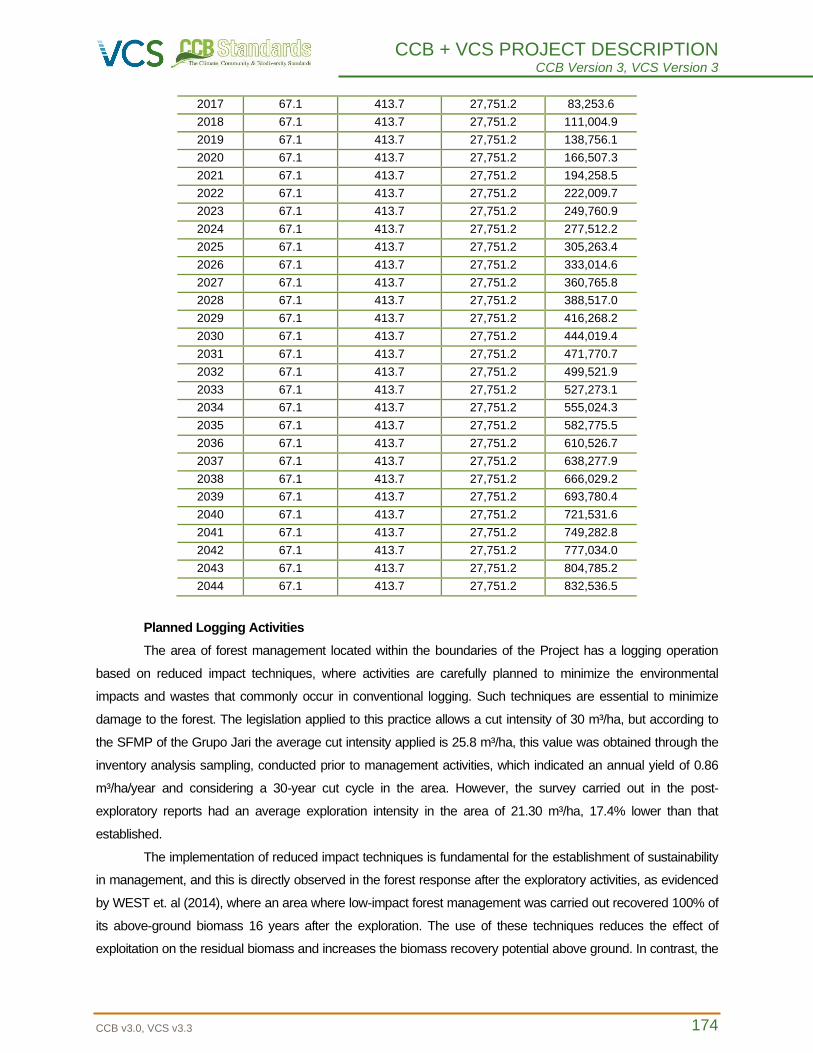
CCB + VCS PROJECT DESCRIPTION CCB Version 3, VCS Version 3
CCB v3.0, VCS v3.3 174
2017 67.1 413.7 27,751.2 83,253.6
2018 67.1 413.7 27,751.2 111,004.9
2019 67.1 413.7 27,751.2 138,756.1
2020 67.1 413.7 27,751.2 166,507.3
2021 67.1 413.7 27,751.2 194,258.5
2022 67.1 413.7 27,751.2 222,009.7
2023 67.1 413.7 27,751.2 249,760.9
2024 67.1 413.7 27,751.2 277,512.2
2025 67.1 413.7 27,751.2 305,263.4
2026 67.1 413.7 27,751.2 333,014.6
2027 67.1 413.7 27,751.2 360,765.8
2028 67.1 413.7 27,751.2 388,517.0
2029 67.1 413.7 27,751.2 416,268.2
2030 67.1 413.7 27,751.2 444,019.4
2031 67.1 413.7 27,751.2 471,770.7
2032 67.1 413.7 27,751.2 499,521.9
2033 67.1 413.7 27,751.2 527,273.1
2034 67.1 413.7 27,751.2 555,024.3
2035 67.1 413.7 27,751.2 582,775.5
2036 67.1 413.7 27,751.2 610,526.7
2037 67.1 413.7 27,751.2 638,277.9
2038 67.1 413.7 27,751.2 666,029.2
2039 67.1 413.7 27,751.2 693,780.4
2040 67.1 413.7 27,751.2 721,531.6
2041 67.1 413.7 27,751.2 749,282.8
2042 67.1 413.7 27,751.2 777,034.0
2043 67.1 413.7 27,751.2 804,785.2
2044 67.1 413.7 27,751.2 832,536.5
Planned Logging Activities
The area of forest management located within the boundaries of the Project has a logging operation
based on reduced impact techniques, where activities are carefully planned to minimize the environmental
impacts and wastes that commonly occur in conventional logging. Such techniques are essential to minimize
damage to the forest. The legislation applied to this practice allows a cut intensity of 30 m³/ha, but according to
the SFMP of the Grupo Jari the average cut intensity applied is 25.8 m³/ha, this value was obtained through the
inventory analysis sampling, conducted prior to management activities, which indicated an annual yield of 0.86
m³/ha/year and considering a 30-year cut cycle in the area. However, the survey carried out in the post-
exploratory reports had an average exploration intensity in the area of 21.30 m³/ha, 17.4% lower than that
established.
The implementation of reduced impact techniques is fundamental for the establishment of sustainability
in management, and this is directly observed in the forest response after the exploratory activities, as evidenced
by WEST et. al (2014), where an area where low-impact forest management was carried out recovered 100% of
its above-ground biomass 16 years after the exploration. The use of these techniques reduces the effect of
exploitation on the residual biomass and increases the biomass recovery potential above ground. In contrast, the
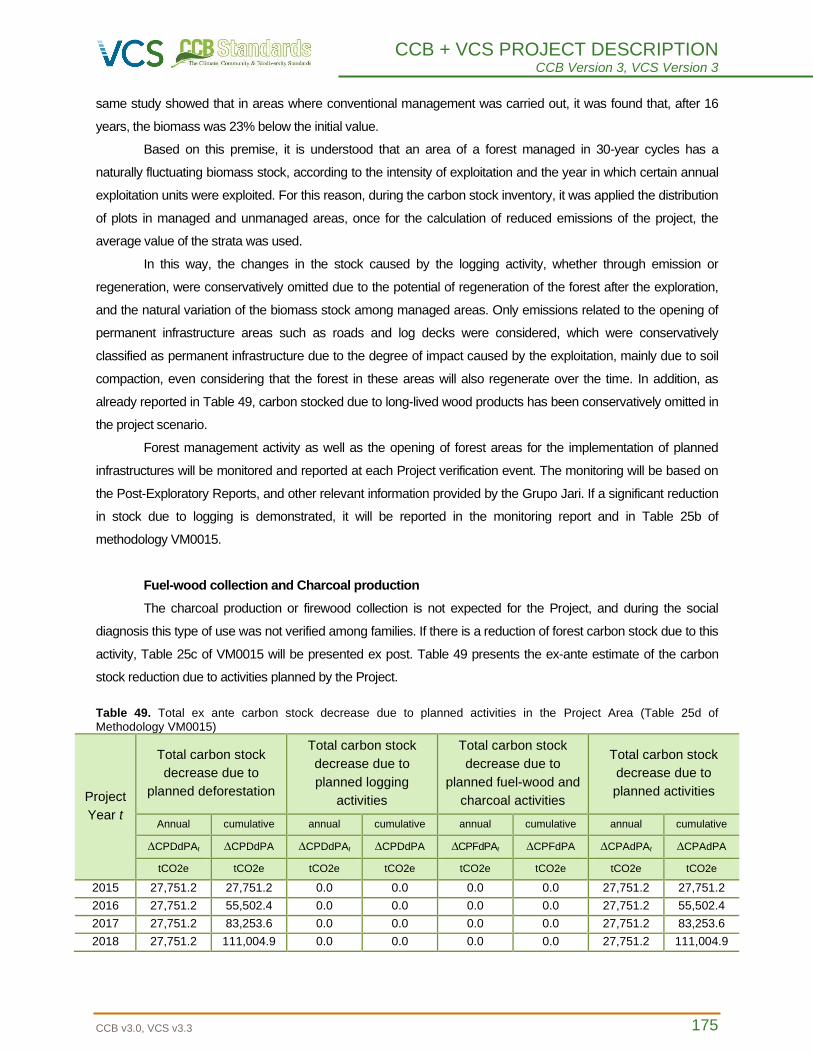
CCB + VCS PROJECT DESCRIPTION CCB Version 3, VCS Version 3
CCB v3.0, VCS v3.3 175
same study showed that in areas where conventional management was carried out, it was found that, after 16
years, the biomass was 23% below the initial value.
Based on this premise, it is understood that an area of a forest managed in 30-year cycles has a
naturally fluctuating biomass stock, according to the intensity of exploitation and the year in which certain annual
exploitation units were exploited. For this reason, during the carbon stock inventory, it was applied the distribution
of plots in managed and unmanaged areas, once for the calculation of reduced emissions of the project, the
average value of the strata was used.
In this way, the changes in the stock caused by the logging activity, whether through emission or
regeneration, were conservatively omitted due to the potential of regeneration of the forest after the exploration,
and the natural variation of the biomass stock among managed areas. Only emissions related to the opening of
permanent infrastructure areas such as roads and log decks were considered, which were conservatively
classified as permanent infrastructure due to the degree of impact caused by the exploitation, mainly due to soil
compaction, even considering that the forest in these areas will also regenerate over the time. In addition, as
already reported in Table 49, carbon stocked due to long-lived wood products has been conservatively omitted in
the project scenario.
Forest management activity as well as the opening of forest areas for the implementation of planned
infrastructures will be monitored and reported at each Project verification event. The monitoring will be based on
the Post-Exploratory Reports, and other relevant information provided by the Grupo Jari. If a significant reduction
in stock due to logging is demonstrated, it will be reported in the monitoring report and in Table 25b of
methodology VM0015.
Fuel-wood collection and Charcoal production
The charcoal production or firewood collection is not expected for the Project, and during the social
diagnosis this type of use was not verified among families. If there is a reduction of forest carbon stock due to this
activity, Table 25c of VM0015 will be presented ex post. Table 49 presents the ex-ante estimate of the carbon
stock reduction due to activities planned by the Project.
Table 49. Total ex ante carbon stock decrease due to planned activities in the Project Area (Table 25d of Methodology VM0015)
Project
Year t
Total carbon stock
decrease due to
planned deforestation
Total carbon stock
decrease due to
planned logging
activities
Total carbon stock
decrease due to
planned fuel-wood and
charcoal activities
Total carbon stock
decrease due to
planned activities
Annual cumulative annual cumulative annual cumulative annual cumulative
∆CPDdPAt ∆CPDdPA ∆CPDdPAt ∆CPDdPA ∆CPFdPAt ∆CPFdPA ∆CPAdPAt ∆CPAdPA
tCO2e tCO2e tCO2e tCO2e tCO2e tCO2e tCO2e tCO2e
2015 27,751.2 27,751.2 0.0 0.0 0.0 0.0 27,751.2 27,751.2
2016 27,751.2 55,502.4 0.0 0.0 0.0 0.0 27,751.2 55,502.4
2017 27,751.2 83,253.6 0.0 0.0 0.0 0.0 27,751.2 83,253.6
2018 27,751.2 111,004.9 0.0 0.0 0.0 0.0 27,751.2 111,004.9
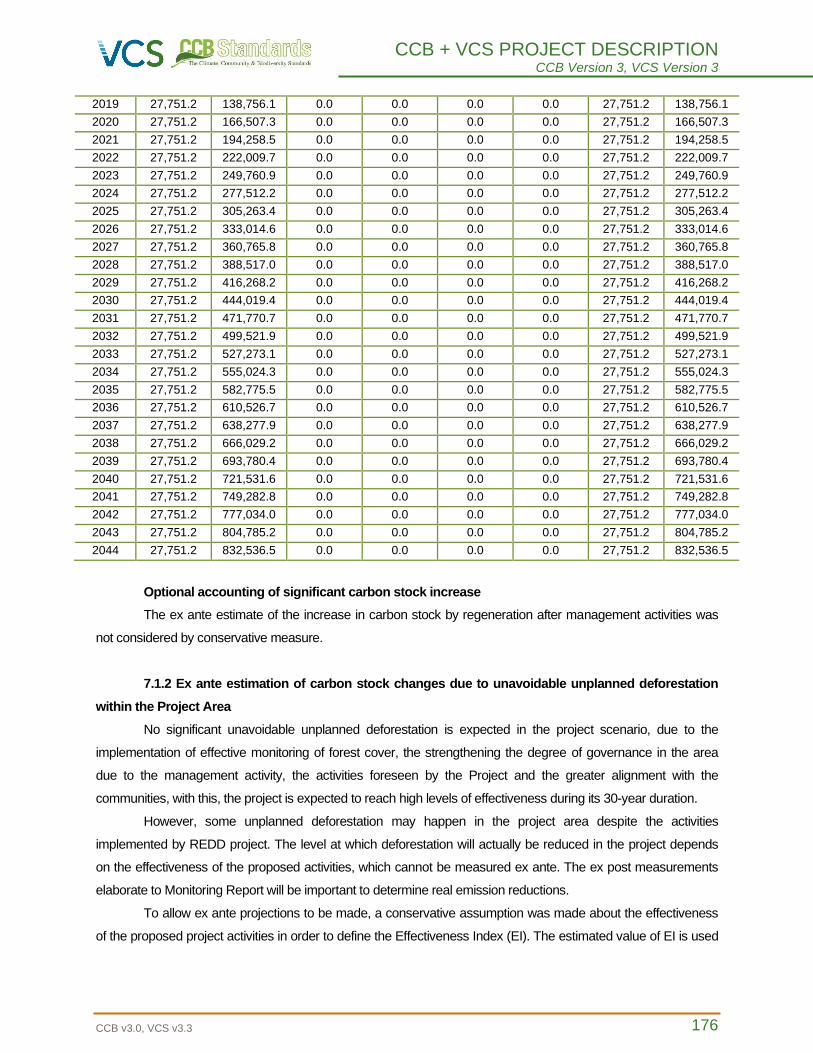
CCB + VCS PROJECT DESCRIPTION CCB Version 3, VCS Version 3
CCB v3.0, VCS v3.3 176
2019 27,751.2 138,756.1 0.0 0.0 0.0 0.0 27,751.2 138,756.1
2020 27,751.2 166,507.3 0.0 0.0 0.0 0.0 27,751.2 166,507.3
2021 27,751.2 194,258.5 0.0 0.0 0.0 0.0 27,751.2 194,258.5
2022 27,751.2 222,009.7 0.0 0.0 0.0 0.0 27,751.2 222,009.7
2023 27,751.2 249,760.9 0.0 0.0 0.0 0.0 27,751.2 249,760.9
2024 27,751.2 277,512.2 0.0 0.0 0.0 0.0 27,751.2 277,512.2
2025 27,751.2 305,263.4 0.0 0.0 0.0 0.0 27,751.2 305,263.4
2026 27,751.2 333,014.6 0.0 0.0 0.0 0.0 27,751.2 333,014.6
2027 27,751.2 360,765.8 0.0 0.0 0.0 0.0 27,751.2 360,765.8
2028 27,751.2 388,517.0 0.0 0.0 0.0 0.0 27,751.2 388,517.0
2029 27,751.2 416,268.2 0.0 0.0 0.0 0.0 27,751.2 416,268.2
2030 27,751.2 444,019.4 0.0 0.0 0.0 0.0 27,751.2 444,019.4
2031 27,751.2 471,770.7 0.0 0.0 0.0 0.0 27,751.2 471,770.7
2032 27,751.2 499,521.9 0.0 0.0 0.0 0.0 27,751.2 499,521.9
2033 27,751.2 527,273.1 0.0 0.0 0.0 0.0 27,751.2 527,273.1
2034 27,751.2 555,024.3 0.0 0.0 0.0 0.0 27,751.2 555,024.3
2035 27,751.2 582,775.5 0.0 0.0 0.0 0.0 27,751.2 582,775.5
2036 27,751.2 610,526.7 0.0 0.0 0.0 0.0 27,751.2 610,526.7
2037 27,751.2 638,277.9 0.0 0.0 0.0 0.0 27,751.2 638,277.9
2038 27,751.2 666,029.2 0.0 0.0 0.0 0.0 27,751.2 666,029.2
2039 27,751.2 693,780.4 0.0 0.0 0.0 0.0 27,751.2 693,780.4
2040 27,751.2 721,531.6 0.0 0.0 0.0 0.0 27,751.2 721,531.6
2041 27,751.2 749,282.8 0.0 0.0 0.0 0.0 27,751.2 749,282.8
2042 27,751.2 777,034.0 0.0 0.0 0.0 0.0 27,751.2 777,034.0
2043 27,751.2 804,785.2 0.0 0.0 0.0 0.0 27,751.2 804,785.2
2044 27,751.2 832,536.5 0.0 0.0 0.0 0.0 27,751.2 832,536.5
Optional accounting of significant carbon stock increase
The ex ante estimate of the increase in carbon stock by regeneration after management activities was
not considered by conservative measure.
7.1.2 Ex ante estimation of carbon stock changes due to unavoidable unplanned deforestation
within the Project Area
No significant unavoidable unplanned deforestation is expected in the project scenario, due to the
implementation of effective monitoring of forest cover, the strengthening the degree of governance in the area
due to the management activity, the activities foreseen by the Project and the greater alignment with the
communities, with this, the project is expected to reach high levels of effectiveness during its 30-year duration.
However, some unplanned deforestation may happen in the project area despite the activities
implemented by REDD project. The level at which deforestation will actually be reduced in the project depends
on the effectiveness of the proposed activities, which cannot be measured ex ante. The ex post measurements
elaborate to Monitoring Report will be important to determine real emission reductions.
To allow ex ante projections to be made, a conservative assumption was made about the effectiveness
of the proposed project activities in order to define the Effectiveness Index (EI). The estimated value of EI is used
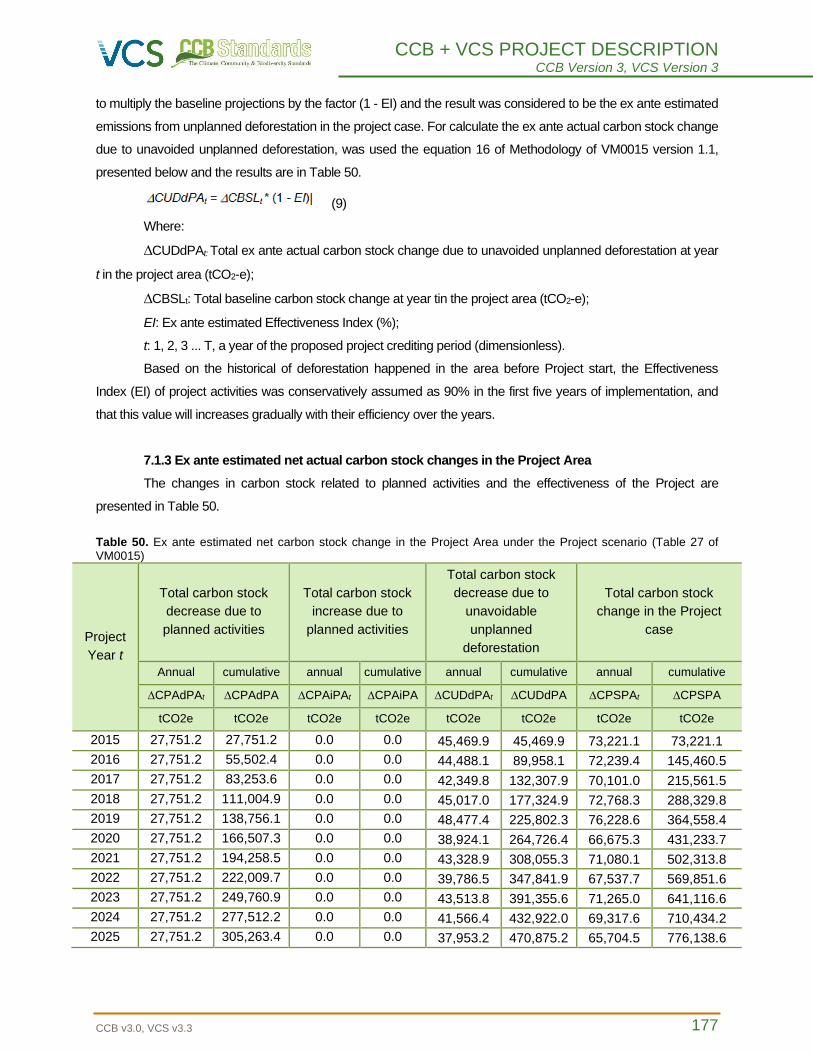
CCB + VCS PROJECT DESCRIPTION CCB Version 3, VCS Version 3
CCB v3.0, VCS v3.3 177
to multiply the baseline projections by the factor (1 - EI) and the result was considered to be the ex ante estimated
emissions from unplanned deforestation in the project case. For calculate the ex ante actual carbon stock change
due to unavoided unplanned deforestation, was used the equation 16 of Methodology of VM0015 version 1.1,
presented below and the results are in Table 50.
(9)
Where:
∆CUDdPAt: Total ex ante actual carbon stock change due to unavoided unplanned deforestation at year
t in the project area (tCO2-e);
∆CBSLt: Total baseline carbon stock change at year tin the project area (tCO2-e);
EI: Ex ante estimated Effectiveness Index (%);
t: 1, 2, 3 ... T, a year of the proposed project crediting period (dimensionless).
Based on the historical of deforestation happened in the area before Project start, the Effectiveness
Index (EI) of project activities was conservatively assumed as 90% in the first five years of implementation, and
that this value will increases gradually with their efficiency over the years.
7.1.3 Ex ante estimated net actual carbon stock changes in the Project Area
The changes in carbon stock related to planned activities and the effectiveness of the Project are
presented in Table 50.
Table 50. Ex ante estimated net carbon stock change in the Project Area under the Project scenario (Table 27 of VM0015)
Project
Year t
Total carbon stock
decrease due to
planned activities
Total carbon stock
increase due to
planned activities
Total carbon stock
decrease due to
unavoidable
unplanned
deforestation
Total carbon stock
change in the Project
case
Annual cumulative annual cumulative annual cumulative annual cumulative
∆CPAdPAt ∆CPAdPA ∆CPAiPAt ∆CPAiPA ∆CUDdPAt ∆CUDdPA ∆CPSPAt ∆CPSPA
tCO2e tCO2e tCO2e tCO2e tCO2e tCO2e tCO2e tCO2e
2015 27,751.2 27,751.2 0.0 0.0 45,469.9 45,469.9 73,221.1 73,221.1
2016 27,751.2 55,502.4 0.0 0.0 44,488.1 89,958.1 72,239.4 145,460.5
2017 27,751.2 83,253.6 0.0 0.0 42,349.8 132,307.9 70,101.0 215,561.5
2018 27,751.2 111,004.9 0.0 0.0 45,017.0 177,324.9 72,768.3 288,329.8
2019 27,751.2 138,756.1 0.0 0.0 48,477.4 225,802.3 76,228.6 364,558.4
2020 27,751.2 166,507.3 0.0 0.0 38,924.1 264,726.4 66,675.3 431,233.7
2021 27,751.2 194,258.5 0.0 0.0 43,328.9 308,055.3 71,080.1 502,313.8
2022 27,751.2 222,009.7 0.0 0.0 39,786.5 347,841.9 67,537.7 569,851.6
2023 27,751.2 249,760.9 0.0 0.0 43,513.8 391,355.6 71,265.0 641,116.6
2024 27,751.2 277,512.2 0.0 0.0 41,566.4 432,922.0 69,317.6 710,434.2
2025 27,751.2 305,263.4 0.0 0.0 37,953.2 470,875.2 65,704.5 776,138.6
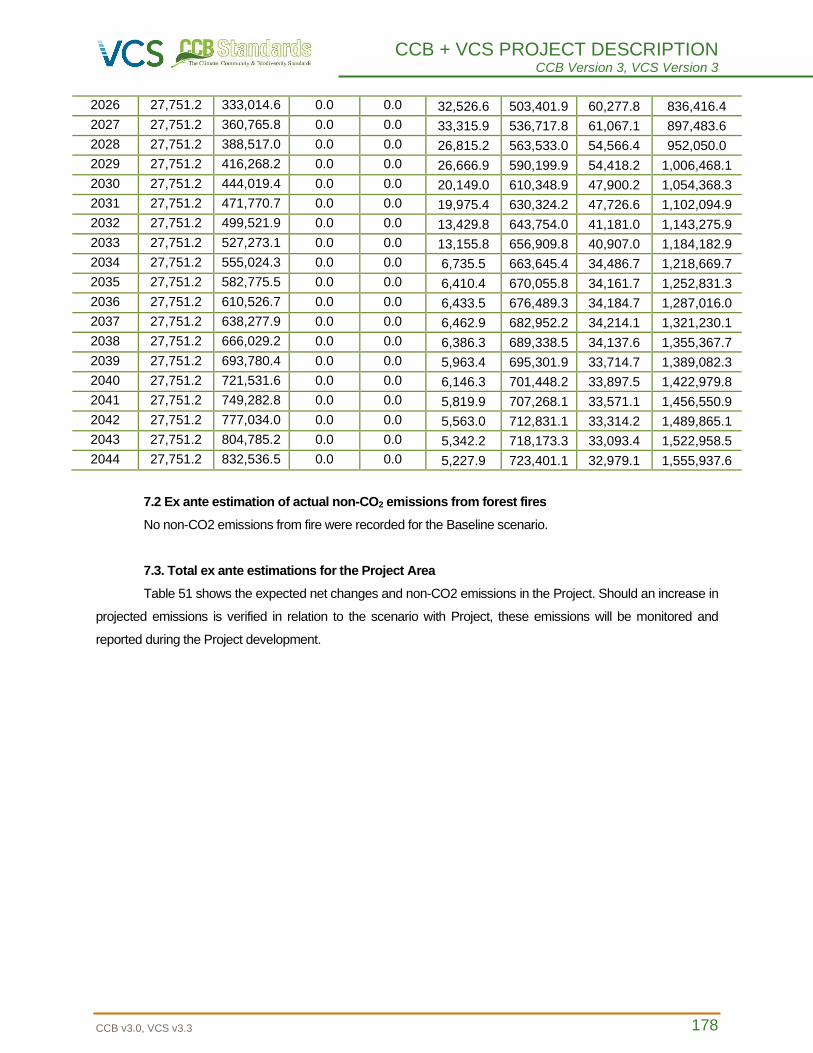
CCB + VCS PROJECT DESCRIPTION CCB Version 3, VCS Version 3
CCB v3.0, VCS v3.3 178
2026 27,751.2 333,014.6 0.0 0.0 32,526.6 503,401.9 60,277.8 836,416.4
2027 27,751.2 360,765.8 0.0 0.0 33,315.9 536,717.8 61,067.1 897,483.6
2028 27,751.2 388,517.0 0.0 0.0 26,815.2 563,533.0 54,566.4 952,050.0
2029 27,751.2 416,268.2 0.0 0.0 26,666.9 590,199.9 54,418.2 1,006,468.1
2030 27,751.2 444,019.4 0.0 0.0 20,149.0 610,348.9 47,900.2 1,054,368.3
2031 27,751.2 471,770.7 0.0 0.0 19,975.4 630,324.2 47,726.6 1,102,094.9
2032 27,751.2 499,521.9 0.0 0.0 13,429.8 643,754.0 41,181.0 1,143,275.9
2033 27,751.2 527,273.1 0.0 0.0 13,155.8 656,909.8 40,907.0 1,184,182.9
2034 27,751.2 555,024.3 0.0 0.0 6,735.5 663,645.4 34,486.7 1,218,669.7
2035 27,751.2 582,775.5 0.0 0.0 6,410.4 670,055.8 34,161.7 1,252,831.3
2036 27,751.2 610,526.7 0.0 0.0 6,433.5 676,489.3 34,184.7 1,287,016.0
2037 27,751.2 638,277.9 0.0 0.0 6,462.9 682,952.2 34,214.1 1,321,230.1
2038 27,751.2 666,029.2 0.0 0.0 6,386.3 689,338.5 34,137.6 1,355,367.7
2039 27,751.2 693,780.4 0.0 0.0 5,963.4 695,301.9 33,714.7 1,389,082.3
2040 27,751.2 721,531.6 0.0 0.0 6,146.3 701,448.2 33,897.5 1,422,979.8
2041 27,751.2 749,282.8 0.0 0.0 5,819.9 707,268.1 33,571.1 1,456,550.9
2042 27,751.2 777,034.0 0.0 0.0 5,563.0 712,831.1 33,314.2 1,489,865.1
2043 27,751.2 804,785.2 0.0 0.0 5,342.2 718,173.3 33,093.4 1,522,958.5
2044 27,751.2 832,536.5 0.0 0.0 5,227.9 723,401.1 32,979.1 1,555,937.6
7.2 Ex ante estimation of actual non-CO2 emissions from forest fires
No non-CO2 emissions from fire were recorded for the Baseline scenario.
7.3. Total ex ante estimations for the Project Area
Table 51 shows the expected net changes and non-CO2 emissions in the Project. Should an increase in
projected emissions is verified in relation to the scenario with Project, these emissions will be monitored and
reported during the Project development.
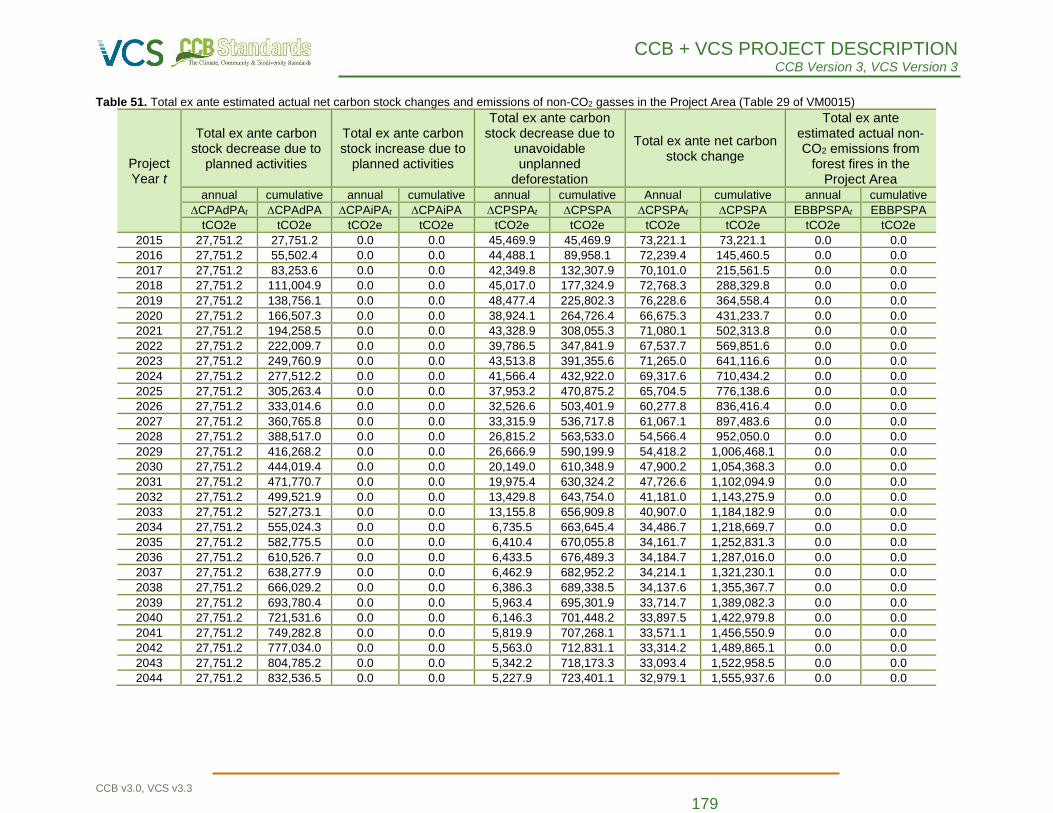
CCB + VCS PROJECT DESCRIPTION CCB Version 3, VCS Version 3
CCB v3.0, VCS v3.3 179
Table 51. Total ex ante estimated actual net carbon stock changes and emissions of non-CO2 gasses in the Project Area (Table 29 of VM0015)
Project Year t
Total ex ante carbon stock decrease due to
planned activities
Total ex ante carbon stock increase due to
planned activities
Total ex ante carbon stock decrease due to
unavoidable unplanned
deforestation
Total ex ante net carbon stock change
Total ex ante estimated actual non-CO2 emissions from
forest fires in the Project Area
annual cumulative annual cumulative annual cumulative Annual cumulative annual cumulative
∆CPAdPAt ∆CPAdPA ∆CPAiPAt ∆CPAiPA ∆CPSPAt ∆CPSPA ∆CPSPAt ∆CPSPA EBBPSPAt EBBPSPA
tCO2e tCO2e tCO2e tCO2e tCO2e tCO2e tCO2e tCO2e tCO2e tCO2e
2015 27,751.2 27,751.2 0.0 0.0 45,469.9 45,469.9 73,221.1 73,221.1 0.0 0.0
2016 27,751.2 55,502.4 0.0 0.0 44,488.1 89,958.1 72,239.4 145,460.5 0.0 0.0
2017 27,751.2 83,253.6 0.0 0.0 42,349.8 132,307.9 70,101.0 215,561.5 0.0 0.0
2018 27,751.2 111,004.9 0.0 0.0 45,017.0 177,324.9 72,768.3 288,329.8 0.0 0.0
2019 27,751.2 138,756.1 0.0 0.0 48,477.4 225,802.3 76,228.6 364,558.4 0.0 0.0
2020 27,751.2 166,507.3 0.0 0.0 38,924.1 264,726.4 66,675.3 431,233.7 0.0 0.0
2021 27,751.2 194,258.5 0.0 0.0 43,328.9 308,055.3 71,080.1 502,313.8 0.0 0.0
2022 27,751.2 222,009.7 0.0 0.0 39,786.5 347,841.9 67,537.7 569,851.6 0.0 0.0
2023 27,751.2 249,760.9 0.0 0.0 43,513.8 391,355.6 71,265.0 641,116.6 0.0 0.0
2024 27,751.2 277,512.2 0.0 0.0 41,566.4 432,922.0 69,317.6 710,434.2 0.0 0.0
2025 27,751.2 305,263.4 0.0 0.0 37,953.2 470,875.2 65,704.5 776,138.6 0.0 0.0
2026 27,751.2 333,014.6 0.0 0.0 32,526.6 503,401.9 60,277.8 836,416.4 0.0 0.0
2027 27,751.2 360,765.8 0.0 0.0 33,315.9 536,717.8 61,067.1 897,483.6 0.0 0.0
2028 27,751.2 388,517.0 0.0 0.0 26,815.2 563,533.0 54,566.4 952,050.0 0.0 0.0
2029 27,751.2 416,268.2 0.0 0.0 26,666.9 590,199.9 54,418.2 1,006,468.1 0.0 0.0
2030 27,751.2 444,019.4 0.0 0.0 20,149.0 610,348.9 47,900.2 1,054,368.3 0.0 0.0
2031 27,751.2 471,770.7 0.0 0.0 19,975.4 630,324.2 47,726.6 1,102,094.9 0.0 0.0
2032 27,751.2 499,521.9 0.0 0.0 13,429.8 643,754.0 41,181.0 1,143,275.9 0.0 0.0
2033 27,751.2 527,273.1 0.0 0.0 13,155.8 656,909.8 40,907.0 1,184,182.9 0.0 0.0
2034 27,751.2 555,024.3 0.0 0.0 6,735.5 663,645.4 34,486.7 1,218,669.7 0.0 0.0
2035 27,751.2 582,775.5 0.0 0.0 6,410.4 670,055.8 34,161.7 1,252,831.3 0.0 0.0
2036 27,751.2 610,526.7 0.0 0.0 6,433.5 676,489.3 34,184.7 1,287,016.0 0.0 0.0
2037 27,751.2 638,277.9 0.0 0.0 6,462.9 682,952.2 34,214.1 1,321,230.1 0.0 0.0
2038 27,751.2 666,029.2 0.0 0.0 6,386.3 689,338.5 34,137.6 1,355,367.7 0.0 0.0
2039 27,751.2 693,780.4 0.0 0.0 5,963.4 695,301.9 33,714.7 1,389,082.3 0.0 0.0
2040 27,751.2 721,531.6 0.0 0.0 6,146.3 701,448.2 33,897.5 1,422,979.8 0.0 0.0
2041 27,751.2 749,282.8 0.0 0.0 5,819.9 707,268.1 33,571.1 1,456,550.9 0.0 0.0
2042 27,751.2 777,034.0 0.0 0.0 5,563.0 712,831.1 33,314.2 1,489,865.1 0.0 0.0
2043 27,751.2 804,785.2 0.0 0.0 5,342.2 718,173.3 33,093.4 1,522,958.5 0.0 0.0
2044 27,751.2 832,536.5 0.0 0.0 5,227.9 723,401.1 32,979.1 1,555,937.6 0.0 0.0
CCB + VCS PROJECT DESCRIPTION CCB Version 3, VCS Version 3
CCB v3.0, VCS v3.3 180
3.2.3 Leakage
Step 8 of VM0015 – Ex ante estimation of leakage
8.1 Ex ante estimation of the decrease in carbon stocks and increase in GHG emissions due to
leakage prevention measures
Initially, it is expected that leakage prevention measures will be employed within the limits of Gleba Jari I,
conducting courses and training related to sustainable development and conservation and environmental
awareness. Subsequently, outside the limits of the Project (Project Zone), through assistance to associations of
small farmers in the environment. These initiatives will focus not only on training and guidance for farmers in the
region but also on raising people's awareness of environmental issues and preserving the forest.
As already mentioned in this document, it is not expected to develop any activity that could lead to the
reduction of carbon stocks or the increase of GHG emissions compared to the baseline scenario. If there are
significant changes in carbon stock, these activities will be monitored, accounted for and reported.
8.1.1 Carbon stock changes due to activities implemented in Leakage Management Areas
Table 30c of VM0015 is not applicable because no reduction is expected due to the implementation of
activities. If there are significant changes in carbon stock, these activities will be monitored, accounted for and
reported.
8.1.2 Ex ante estimation of CH4 and N2O emissions from grazing animals intensification of
livestock
According to the above, there are no activities that will lead to a significant increase in methane and
nitrous oxide emissions. Therefore, Tables 31 and 32 of VM0015 were not applied.
8.1.3 Total ex-ante estimated carbon stock changes and increases in GHG emissions due to
leakage prevention measures
Table 33 of VM0015 does not apply.
8.2 Ex ante estimation of the decrease in carbon stocks and increase in GHG emissions due to
activity displacement leakage
Activities that will cause deforestation within the project area in the baseline case could be displaced
outside the project boundary due to the implementation of the AUD project activity. A greater decrease in carbon
stocks within the leakage belt during the project scenario than those predicted ex ante would indicate
displacement of deforestation activities due to the project.
The ex ante activity displacement leakage was calculated based on the anticipated combined
effectiveness of the proposed leakage prevention measures and project activities. Deforestation agents in the
project region are migrant squatters from other northern and northeastern regions of the country as described in
Step 3. Considering that the area of the Leakage Belt is part of Gleba Jari I (Project Zone), that is, it is inserted
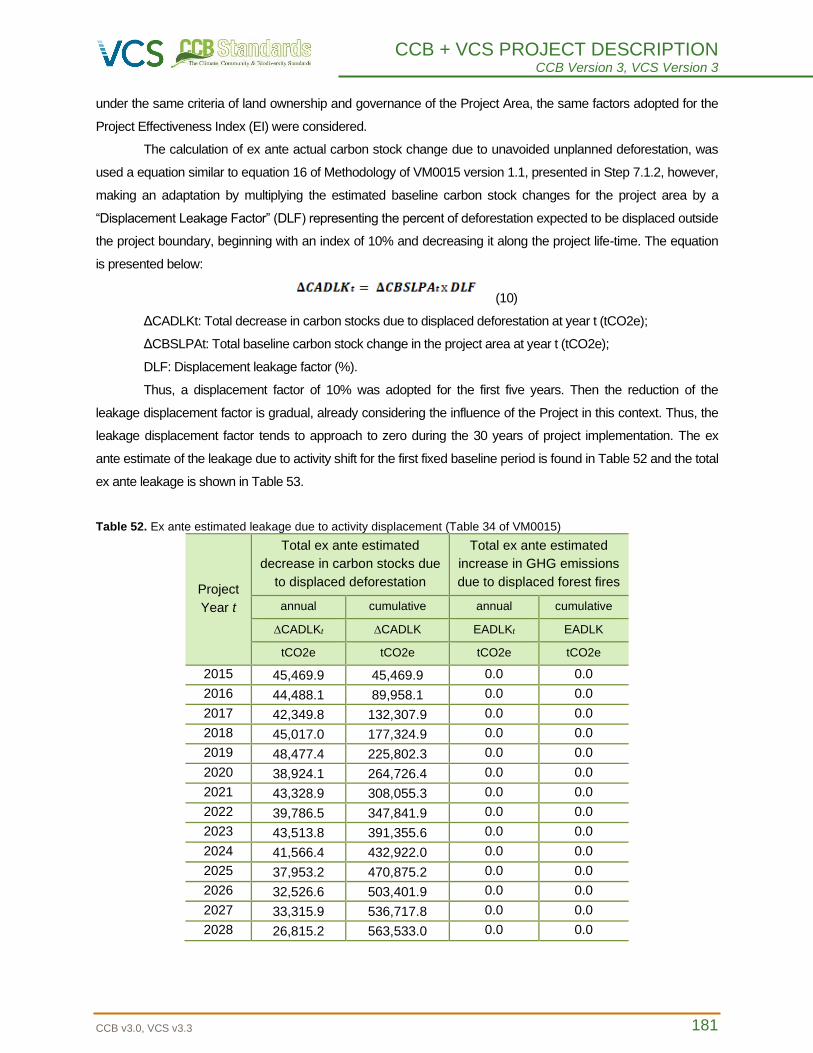
CCB + VCS PROJECT DESCRIPTION CCB Version 3, VCS Version 3
CCB v3.0, VCS v3.3 181
under the same criteria of land ownership and governance of the Project Area, the same factors adopted for the
Project Effectiveness Index (EI) were considered.
The calculation of ex ante actual carbon stock change due to unavoided unplanned deforestation, was
used a equation similar to equation 16 of Methodology of VM0015 version 1.1, presented in Step 7.1.2, however,
making an adaptation by multiplying the estimated baseline carbon stock changes for the project area by a
“Displacement Leakage Factor” (DLF) representing the percent of deforestation expected to be displaced outside
the project boundary, beginning with an index of 10% and decreasing it along the project life-time. The equation
is presented below:
(10)
ΔCADLKt: Total decrease in carbon stocks due to displaced deforestation at year t (tCO2e);
ΔCBSLPAt: Total baseline carbon stock change in the project area at year t (tCO2e);
DLF: Displacement leakage factor (%).
Thus, a displacement factor of 10% was adopted for the first five years. Then the reduction of the
leakage displacement factor is gradual, already considering the influence of the Project in this context. Thus, the
leakage displacement factor tends to approach to zero during the 30 years of project implementation. The ex
ante estimate of the leakage due to activity shift for the first fixed baseline period is found in Table 52 and the total
ex ante leakage is shown in Table 53.
Table 52. Ex ante estimated leakage due to activity displacement (Table 34 of VM0015)
Project
Year t
Total ex ante estimated
decrease in carbon stocks due
to displaced deforestation
Total ex ante estimated
increase in GHG emissions
due to displaced forest fires
annual cumulative annual cumulative
∆CADLKt ∆CADLK EADLKt EADLK
tCO2e tCO2e tCO2e tCO2e
2015 45,469.9 45,469.9 0.0 0.0
2016 44,488.1 89,958.1 0.0 0.0
2017 42,349.8 132,307.9 0.0 0.0
2018 45,017.0 177,324.9 0.0 0.0
2019 48,477.4 225,802.3 0.0 0.0
2020 38,924.1 264,726.4 0.0 0.0
2021 43,328.9 308,055.3 0.0 0.0
2022 39,786.5 347,841.9 0.0 0.0
2023 43,513.8 391,355.6 0.0 0.0
2024 41,566.4 432,922.0 0.0 0.0
2025 37,953.2 470,875.2 0.0 0.0
2026 32,526.6 503,401.9 0.0 0.0
2027 33,315.9 536,717.8 0.0 0.0
2028 26,815.2 563,533.0 0.0 0.0
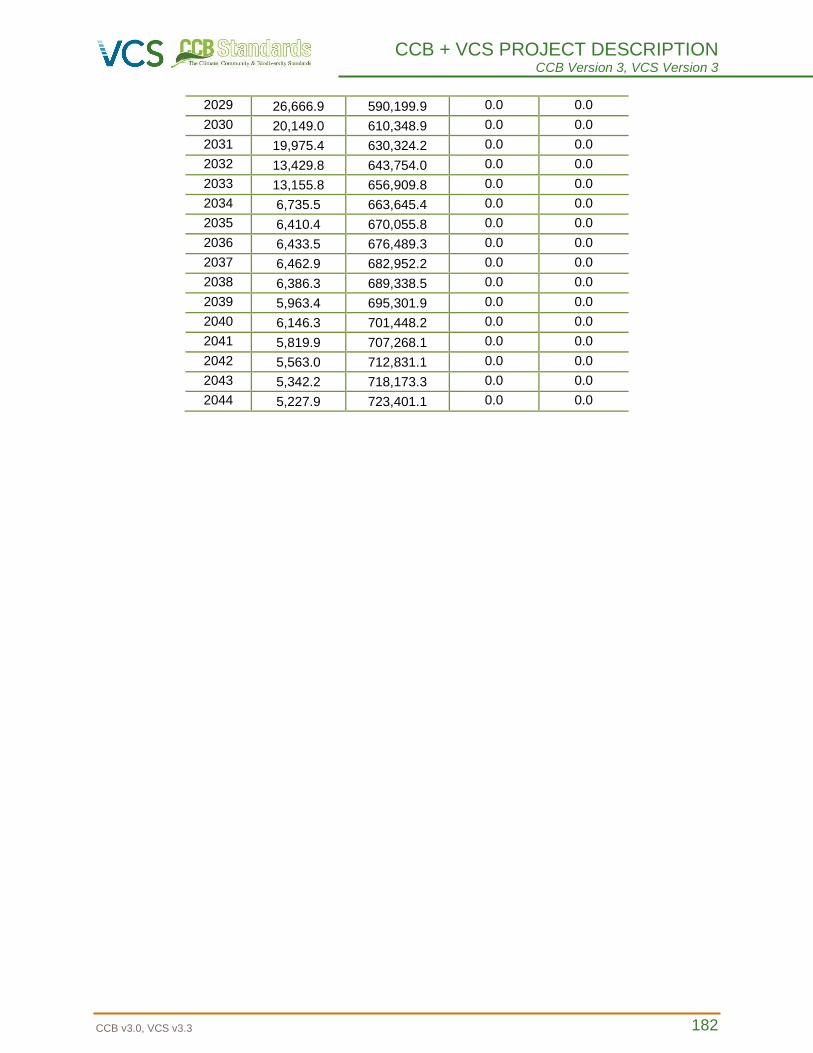
CCB + VCS PROJECT DESCRIPTION CCB Version 3, VCS Version 3
CCB v3.0, VCS v3.3 182
2029 26,666.9 590,199.9 0.0 0.0
2030 20,149.0 610,348.9 0.0 0.0
2031 19,975.4 630,324.2 0.0 0.0
2032 13,429.8 643,754.0 0.0 0.0
2033 13,155.8 656,909.8 0.0 0.0
2034 6,735.5 663,645.4 0.0 0.0
2035 6,410.4 670,055.8 0.0 0.0
2036 6,433.5 676,489.3 0.0 0.0
2037 6,462.9 682,952.2 0.0 0.0
2038 6,386.3 689,338.5 0.0 0.0
2039 5,963.4 695,301.9 0.0 0.0
2040 6,146.3 701,448.2 0.0 0.0
2041 5,819.9 707,268.1 0.0 0.0
2042 5,563.0 712,831.1 0.0 0.0
2043 5,342.2 718,173.3 0.0 0.0
2044 5,227.9 723,401.1 0.0 0.0
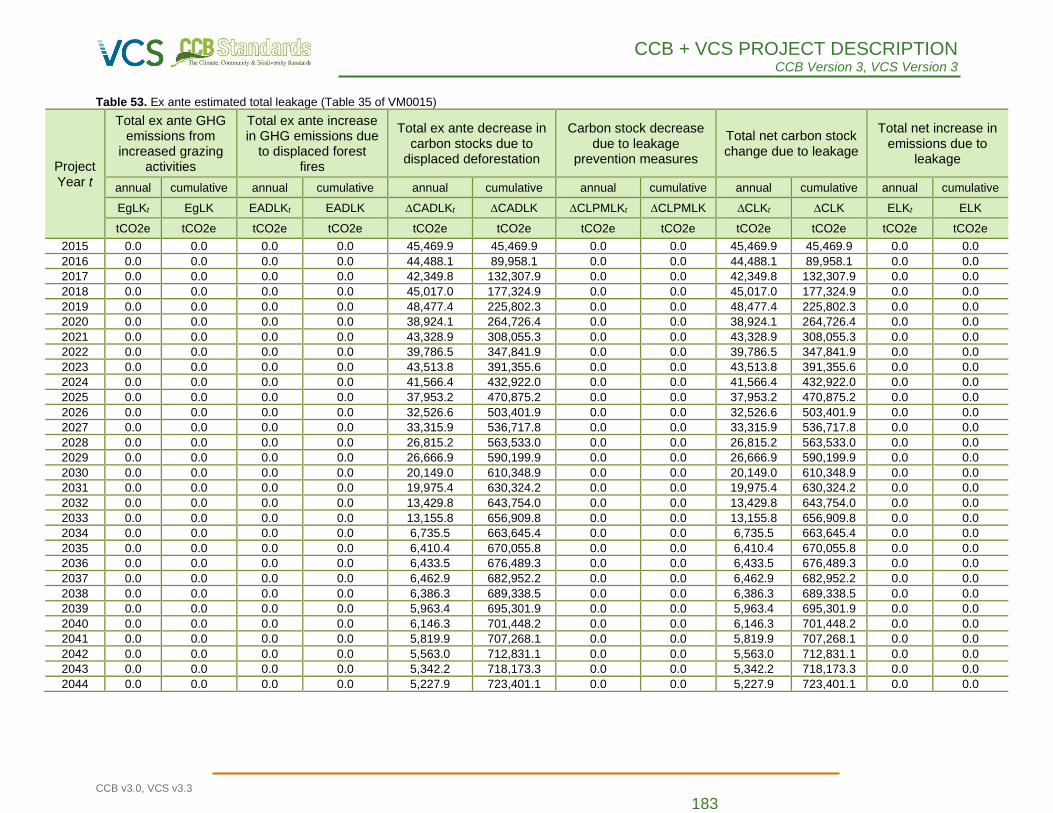
CCB + VCS PROJECT DESCRIPTION CCB Version 3, VCS Version 3
CCB v3.0, VCS v3.3 183
Table 53. Ex ante estimated total leakage (Table 35 of VM0015)
Project Year t
Total ex ante GHG emissions from
increased grazing activities
Total ex ante increase in GHG emissions due
to displaced forest fires
Total ex ante decrease in carbon stocks due to
displaced deforestation
Carbon stock decrease due to leakage
prevention measures
Total net carbon stock change due to leakage
Total net increase in emissions due to
leakage
annual cumulative annual cumulative annual cumulative annual cumulative annual cumulative annual cumulative
EgLKt EgLK EADLKt EADLK ∆CADLKt ∆CADLK ∆CLPMLKt ∆CLPMLK ∆CLKt ∆CLK ELKt ELK
tCO2e tCO2e tCO2e tCO2e tCO2e tCO2e tCO2e tCO2e tCO2e tCO2e tCO2e tCO2e
2015 0.0 0.0 0.0 0.0 45,469.9 45,469.9 0.0 0.0 45,469.9 45,469.9 0.0 0.0
2016 0.0 0.0 0.0 0.0 44,488.1 89,958.1 0.0 0.0 44,488.1 89,958.1 0.0 0.0
2017 0.0 0.0 0.0 0.0 42,349.8 132,307.9 0.0 0.0 42,349.8 132,307.9 0.0 0.0
2018 0.0 0.0 0.0 0.0 45,017.0 177,324.9 0.0 0.0 45,017.0 177,324.9 0.0 0.0
2019 0.0 0.0 0.0 0.0 48,477.4 225,802.3 0.0 0.0 48,477.4 225,802.3 0.0 0.0
2020 0.0 0.0 0.0 0.0 38,924.1 264,726.4 0.0 0.0 38,924.1 264,726.4 0.0 0.0
2021 0.0 0.0 0.0 0.0 43,328.9 308,055.3 0.0 0.0 43,328.9 308,055.3 0.0 0.0
2022 0.0 0.0 0.0 0.0 39,786.5 347,841.9 0.0 0.0 39,786.5 347,841.9 0.0 0.0
2023 0.0 0.0 0.0 0.0 43,513.8 391,355.6 0.0 0.0 43,513.8 391,355.6 0.0 0.0
2024 0.0 0.0 0.0 0.0 41,566.4 432,922.0 0.0 0.0 41,566.4 432,922.0 0.0 0.0
2025 0.0 0.0 0.0 0.0 37,953.2 470,875.2 0.0 0.0 37,953.2 470,875.2 0.0 0.0
2026 0.0 0.0 0.0 0.0 32,526.6 503,401.9 0.0 0.0 32,526.6 503,401.9 0.0 0.0
2027 0.0 0.0 0.0 0.0 33,315.9 536,717.8 0.0 0.0 33,315.9 536,717.8 0.0 0.0
2028 0.0 0.0 0.0 0.0 26,815.2 563,533.0 0.0 0.0 26,815.2 563,533.0 0.0 0.0
2029 0.0 0.0 0.0 0.0 26,666.9 590,199.9 0.0 0.0 26,666.9 590,199.9 0.0 0.0
2030 0.0 0.0 0.0 0.0 20,149.0 610,348.9 0.0 0.0 20,149.0 610,348.9 0.0 0.0
2031 0.0 0.0 0.0 0.0 19,975.4 630,324.2 0.0 0.0 19,975.4 630,324.2 0.0 0.0
2032 0.0 0.0 0.0 0.0 13,429.8 643,754.0 0.0 0.0 13,429.8 643,754.0 0.0 0.0
2033 0.0 0.0 0.0 0.0 13,155.8 656,909.8 0.0 0.0 13,155.8 656,909.8 0.0 0.0
2034 0.0 0.0 0.0 0.0 6,735.5 663,645.4 0.0 0.0 6,735.5 663,645.4 0.0 0.0
2035 0.0 0.0 0.0 0.0 6,410.4 670,055.8 0.0 0.0 6,410.4 670,055.8 0.0 0.0
2036 0.0 0.0 0.0 0.0 6,433.5 676,489.3 0.0 0.0 6,433.5 676,489.3 0.0 0.0
2037 0.0 0.0 0.0 0.0 6,462.9 682,952.2 0.0 0.0 6,462.9 682,952.2 0.0 0.0
2038 0.0 0.0 0.0 0.0 6,386.3 689,338.5 0.0 0.0 6,386.3 689,338.5 0.0 0.0
2039 0.0 0.0 0.0 0.0 5,963.4 695,301.9 0.0 0.0 5,963.4 695,301.9 0.0 0.0
2040 0.0 0.0 0.0 0.0 6,146.3 701,448.2 0.0 0.0 6,146.3 701,448.2 0.0 0.0
2041 0.0 0.0 0.0 0.0 5,819.9 707,268.1 0.0 0.0 5,819.9 707,268.1 0.0 0.0
2042 0.0 0.0 0.0 0.0 5,563.0 712,831.1 0.0 0.0 5,563.0 712,831.1 0.0 0.0
2043 0.0 0.0 0.0 0.0 5,342.2 718,173.3 0.0 0.0 5,342.2 718,173.3 0.0 0.0
2044 0.0 0.0 0.0 0.0 5,227.9 723,401.1 0.0 0.0 5,227.9 723,401.1 0.0 0.0
CCB + VCS PROJECT DESCRIPTION CCB Version 3, VCS Version 3
CCB v3.0, VCS v3.3 184
3.2.4 Net GHG Emission Reductions and Removals
Step 9 of VM0015 – Ex ante total net anthropogenic GHG emission reductions
9.1 Significance assessment
Using the document “EB-CDM approved “Tool for testing significance of GHG emissions in A/R CDM
Project activities” it was possible to verify that above-ground biomass will contribute 79% of the expected
emissions in the baseline scenario and biomass below ground will contribute 21%.
9.2 Calculation of ex ante estimation of total net GHG emissions reductions
The Equation 19 suggested by VM0015, presented below, was used for the ex ante estimation of the
project emissions reductions, and the results are presented in Table 54.
(11)
Where:
∆REDDt: Ex ante estimated net anthropogenic greenhouse gas emission reduction attributable
to the AUD project activity at year t (tCO2e);
∆CBSLPAt: Sum of baseline carbon stock changes in the project area at year t (tCO2e);
EBBBSLPAt: Sum of baseline emissions from biomass burning in the project area at year t
(tCO2e);
∆CPSPAt: Sum of ex ante estimated actual carbon stock changes in the project area at year t (tCO2e);
EBBPSPAt: Sum of (ex ante estimated) actual emissions from biomass burning in the project area at
year t (tCO2e);
∆CLKt: Sum of ex ante estimated leakage net carbon stock changes at year t (tCO2e);
ELKt: Sum of ex ante estimated leakage emissions at year t (tCO2e);
t: 1, 2, 3 ... T, a year of the proposed project crediting period (dimensionless).
9.3 Calculation of ex ante Verified Carbon Units (VCUs)
To estimate the number of VCUs, we used Equation 20 of VM0015. The Risk Factor parameter of the
Project was estimated through the document VCS AFOLU Non-Permanence Risk Tool, resulting in 11%. The
general results are presented in Table 54.
(12)
(13)
Where:
VCUt: Number of Verified Carbon Units that can be traded at time t (tCO2e);
∆REDDt: Ex ante estimated net anthropogenic greenhouse gas emission reduction attributable to the
AUD project activity at year t (tCO2e);
CCB + VCS PROJECT DESCRIPTION CCB Version 3, VCS Version 3
CCB v3.0, VCS v3.3 185
VBCt: Number of Buffer Credits deposited in the VCS Buffer at time t (t CO2-e);
∆CBSLPAt: Sum of baseline carbon stock changes in the project area at year t (tCO2e);
∆CPSPAt: Sum of ex ante estimated actual carbon stock changes in the project area at year t (tCO2e);
RFt: Risk factor used to calculate VCS buffer credits (%);
t: 1, 2, 3 ... T, a year of the proposed project crediting period (dimensionless).
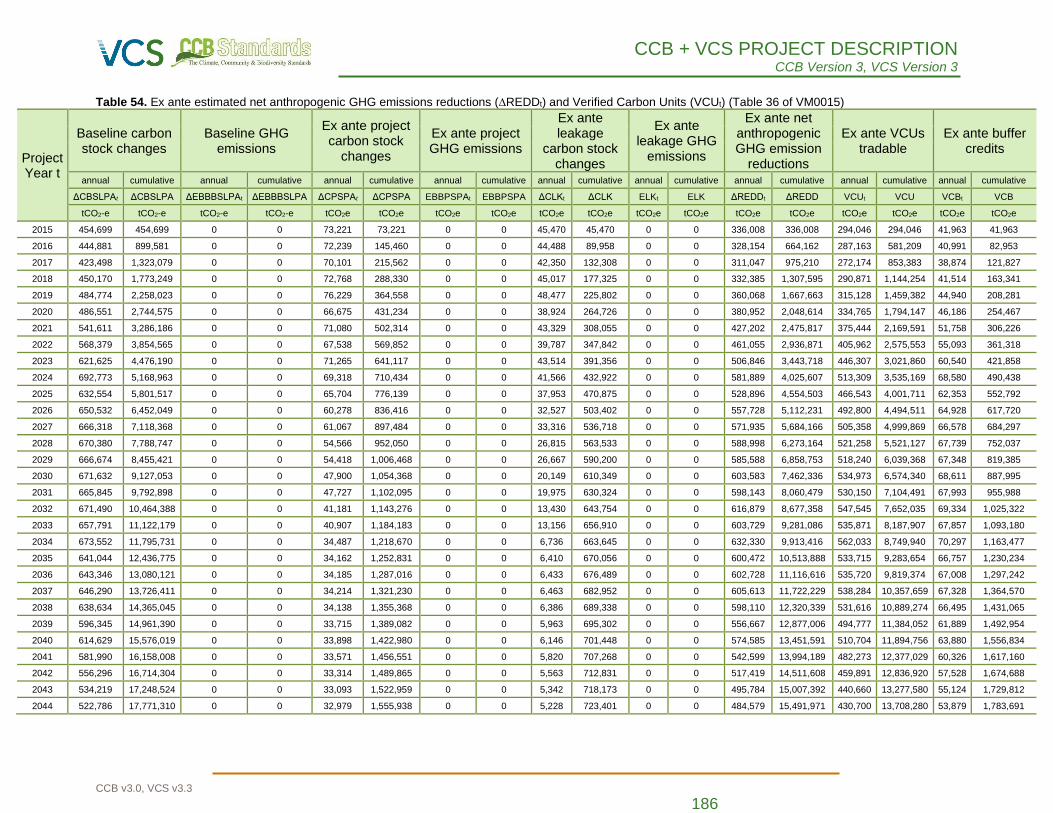
CCB + VCS PROJECT DESCRIPTION CCB Version 3, VCS Version 3
CCB v3.0, VCS v3.3 186
Table 54. Ex ante estimated net anthropogenic GHG emissions reductions (∆REDDt) and Verified Carbon Units (VCUt) (Table 36 of VM0015)
Project Year t
Baseline carbon stock changes
Baseline GHG emissions
Ex ante project carbon stock
changes
Ex ante project GHG emissions
Ex ante leakage
carbon stock changes
Ex ante leakage GHG
emissions
Ex ante net anthropogenic GHG emission
reductions
Ex ante VCUs tradable
Ex ante buffer credits
annual cumulative annual cumulative annual cumulative annual cumulative annual cumulative annual cumulative annual cumulative annual cumulative annual cumulative
ΔCBSLPAt ΔCBSLPA ΔEBBBSLPAt ΔEBBBSLPA ΔCPSPAt ΔCPSPA EBBPSPAt EBBPSPA ΔCLKt ΔCLK ELKt ELK ΔREDDt ΔREDD VCUt VCU VCBt VCB
tCO2-e tCO2-e tCO2-e tCO2-e tCO2e tCO2e tCO2e tCO2e tCO2e tCO2e tCO2e tCO2e tCO2e tCO2e tCO2e tCO2e tCO2e tCO2e
2015 454,699 454,699 0 0 73,221 73,221 0 0 45,470 45,470 0 0 336,008 336,008 294,046 294,046 41,963 41,963
2016 444,881 899,581 0 0 72,239 145,460 0 0 44,488 89,958 0 0 328,154 664,162 287,163 581,209 40,991 82,953
2017 423,498 1,323,079 0 0 70,101 215,562 0 0 42,350 132,308 0 0 311,047 975,210 272,174 853,383 38,874 121,827
2018 450,170 1,773,249 0 0 72,768 288,330 0 0 45,017 177,325 0 0 332,385 1,307,595 290,871 1,144,254 41,514 163,341
2019 484,774 2,258,023 0 0 76,229 364,558 0 0 48,477 225,802 0 0 360,068 1,667,663 315,128 1,459,382 44,940 208,281
2020 486,551 2,744,575 0 0 66,675 431,234 0 0 38,924 264,726 0 0 380,952 2,048,614 334,765 1,794,147 46,186 254,467
2021 541,611 3,286,186 0 0 71,080 502,314 0 0 43,329 308,055 0 0 427,202 2,475,817 375,444 2,169,591 51,758 306,226
2022 568,379 3,854,565 0 0 67,538 569,852 0 0 39,787 347,842 0 0 461,055 2,936,871 405,962 2,575,553 55,093 361,318
2023 621,625 4,476,190 0 0 71,265 641,117 0 0 43,514 391,356 0 0 506,846 3,443,718 446,307 3,021,860 60,540 421,858
2024 692,773 5,168,963 0 0 69,318 710,434 0 0 41,566 432,922 0 0 581,889 4,025,607 513,309 3,535,169 68,580 490,438
2025 632,554 5,801,517 0 0 65,704 776,139 0 0 37,953 470,875 0 0 528,896 4,554,503 466,543 4,001,711 62,353 552,792
2026 650,532 6,452,049 0 0 60,278 836,416 0 0 32,527 503,402 0 0 557,728 5,112,231 492,800 4,494,511 64,928 617,720
2027 666,318 7,118,368 0 0 61,067 897,484 0 0 33,316 536,718 0 0 571,935 5,684,166 505,358 4,999,869 66,578 684,297
2028 670,380 7,788,747 0 0 54,566 952,050 0 0 26,815 563,533 0 0 588,998 6,273,164 521,258 5,521,127 67,739 752,037
2029 666,674 8,455,421 0 0 54,418 1,006,468 0 0 26,667 590,200 0 0 585,588 6,858,753 518,240 6,039,368 67,348 819,385
2030 671,632 9,127,053 0 0 47,900 1,054,368 0 0 20,149 610,349 0 0 603,583 7,462,336 534,973 6,574,340 68,611 887,995
2031 665,845 9,792,898 0 0 47,727 1,102,095 0 0 19,975 630,324 0 0 598,143 8,060,479 530,150 7,104,491 67,993 955,988
2032 671,490 10,464,388 0 0 41,181 1,143,276 0 0 13,430 643,754 0 0 616,879 8,677,358 547,545 7,652,035 69,334 1,025,322
2033 657,791 11,122,179 0 0 40,907 1,184,183 0 0 13,156 656,910 0 0 603,729 9,281,086 535,871 8,187,907 67,857 1,093,180
2034 673,552 11,795,731 0 0 34,487 1,218,670 0 0 6,736 663,645 0 0 632,330 9,913,416 562,033 8,749,940 70,297 1,163,477
2035 641,044 12,436,775 0 0 34,162 1,252,831 0 0 6,410 670,056 0 0 600,472 10,513,888 533,715 9,283,654 66,757 1,230,234
2036 643,346 13,080,121 0 0 34,185 1,287,016 0 0 6,433 676,489 0 0 602,728 11,116,616 535,720 9,819,374 67,008 1,297,242
2037 646,290 13,726,411 0 0 34,214 1,321,230 0 0 6,463 682,952 0 0 605,613 11,722,229 538,284 10,357,659 67,328 1,364,570
2038 638,634 14,365,045 0 0 34,138 1,355,368 0 0 6,386 689,338 0 0 598,110 12,320,339 531,616 10,889,274 66,495 1,431,065
2039 596,345 14,961,390 0 0 33,715 1,389,082 0 0 5,963 695,302 0 0 556,667 12,877,006 494,777 11,384,052 61,889 1,492,954
2040 614,629 15,576,019 0 0 33,898 1,422,980 0 0 6,146 701,448 0 0 574,585 13,451,591 510,704 11,894,756 63,880 1,556,834
2041 581,990 16,158,008 0 0 33,571 1,456,551 0 0 5,820 707,268 0 0 542,599 13,994,189 482,273 12,377,029 60,326 1,617,160
2042 556,296 16,714,304 0 0 33,314 1,489,865 0 0 5,563 712,831 0 0 517,419 14,511,608 459,891 12,836,920 57,528 1,674,688
2043 534,219 17,248,524 0 0 33,093 1,522,959 0 0 5,342 718,173 0 0 495,784 15,007,392 440,660 13,277,580 55,124 1,729,812
2044 522,786 17,771,310 0 0 32,979 1,555,938 0 0 5,228 723,401 0 0 484,579 15,491,971 430,700 13,708,280 53,879 1,783,691
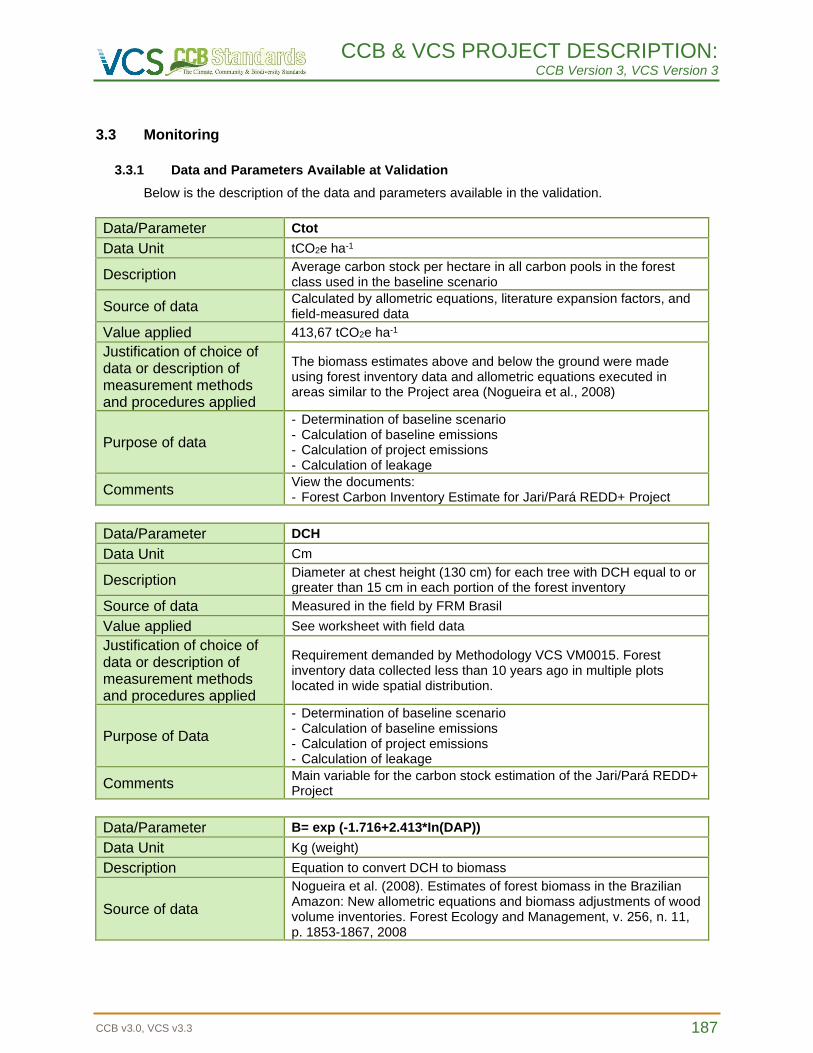
CCB & VCS PROJECT DESCRIPTION: CCB Version 3, VCS Version 3
CCB v3.0, VCS v3.3 187
3.3 Monitoring
3.3.1 Data and Parameters Available at Validation
Below is the description of the data and parameters available in the validation.
Data/Parameter Ctot
Data Unit tCO2e ha-1
Description Average carbon stock per hectare in all carbon pools in the forest class used in the baseline scenario
Source of data Calculated by allometric equations, literature expansion factors, and field-measured data
Value applied 413,67 tCO2e ha-1
Justification of choice of data or description of measurement methods and procedures applied
The biomass estimates above and below the ground were made using forest inventory data and allometric equations executed in areas similar to the Project area (Nogueira et al., 2008)
Purpose of data
- Determination of baseline scenario - Calculation of baseline emissions - Calculation of project emissions - Calculation of leakage
Comments View the documents: - Forest Carbon Inventory Estimate for Jari/Pará REDD+ Project
Data/Parameter DCH
Data Unit Cm
Description Diameter at chest height (130 cm) for each tree with DCH equal to or greater than 15 cm in each portion of the forest inventory
Source of data Measured in the field by FRM Brasil
Value applied See worksheet with field data
Justification of choice of data or description of measurement methods and procedures applied
Requirement demanded by Methodology VCS VM0015. Forest inventory data collected less than 10 years ago in multiple plots located in wide spatial distribution.
Purpose of Data
- Determination of baseline scenario - Calculation of baseline emissions - Calculation of project emissions - Calculation of leakage
Comments Main variable for the carbon stock estimation of the Jari/Pará REDD+ Project
Data/Parameter B= exp (-1.716+2.413*In(DAP))
Data Unit Kg (weight)
Description Equation to convert DCH to biomass
Source of data
Nogueira et al. (2008). Estimates of forest biomass in the Brazilian Amazon: New allometric equations and biomass adjustments of wood volume inventories. Forest Ecology and Management, v. 256, n. 11, p. 1853-1867, 2008
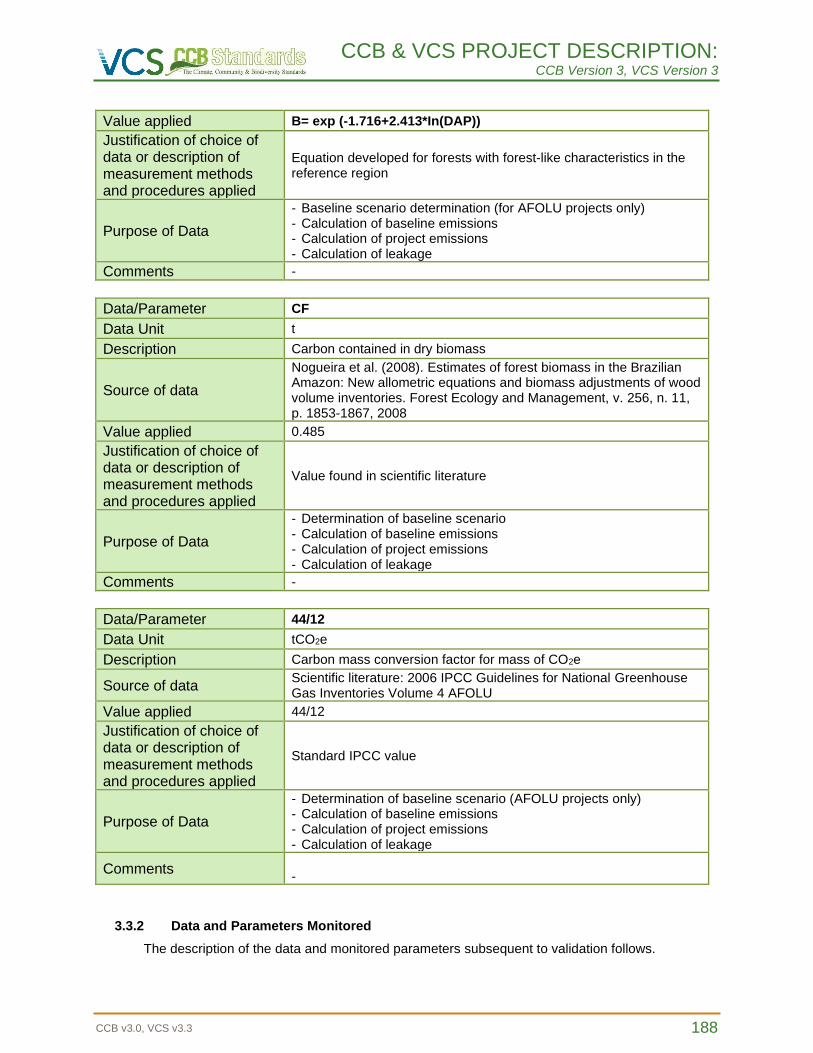
CCB & VCS PROJECT DESCRIPTION: CCB Version 3, VCS Version 3
CCB v3.0, VCS v3.3 188
Value applied B= exp (-1.716+2.413*In(DAP))
Justification of choice of data or description of measurement methods and procedures applied
Equation developed for forests with forest-like characteristics in the reference region
Purpose of Data
- Baseline scenario determination (for AFOLU projects only) - Calculation of baseline emissions - Calculation of project emissions - Calculation of leakage
Comments -
Data/Parameter CF
Data Unit t
Description Carbon contained in dry biomass
Source of data
Nogueira et al. (2008). Estimates of forest biomass in the Brazilian Amazon: New allometric equations and biomass adjustments of wood volume inventories. Forest Ecology and Management, v. 256, n. 11, p. 1853-1867, 2008
Value applied 0.485
Justification of choice of data or description of measurement methods and procedures applied
Value found in scientific literature
Purpose of Data
- Determination of baseline scenario - Calculation of baseline emissions - Calculation of project emissions - Calculation of leakage
Comments -
Data/Parameter 44/12
Data Unit tCO2e
Description Carbon mass conversion factor for mass of CO2e
Source of data Scientific literature: 2006 IPCC Guidelines for National Greenhouse Gas Inventories Volume 4 AFOLU
Value applied 44/12
Justification of choice of data or description of measurement methods and procedures applied
Standard IPCC value
Purpose of Data
- Determination of baseline scenario (AFOLU projects only) - Calculation of baseline emissions - Calculation of project emissions - Calculation of leakage
Comments -
3.3.2 Data and Parameters Monitored
The description of the data and monitored parameters subsequent to validation follows.
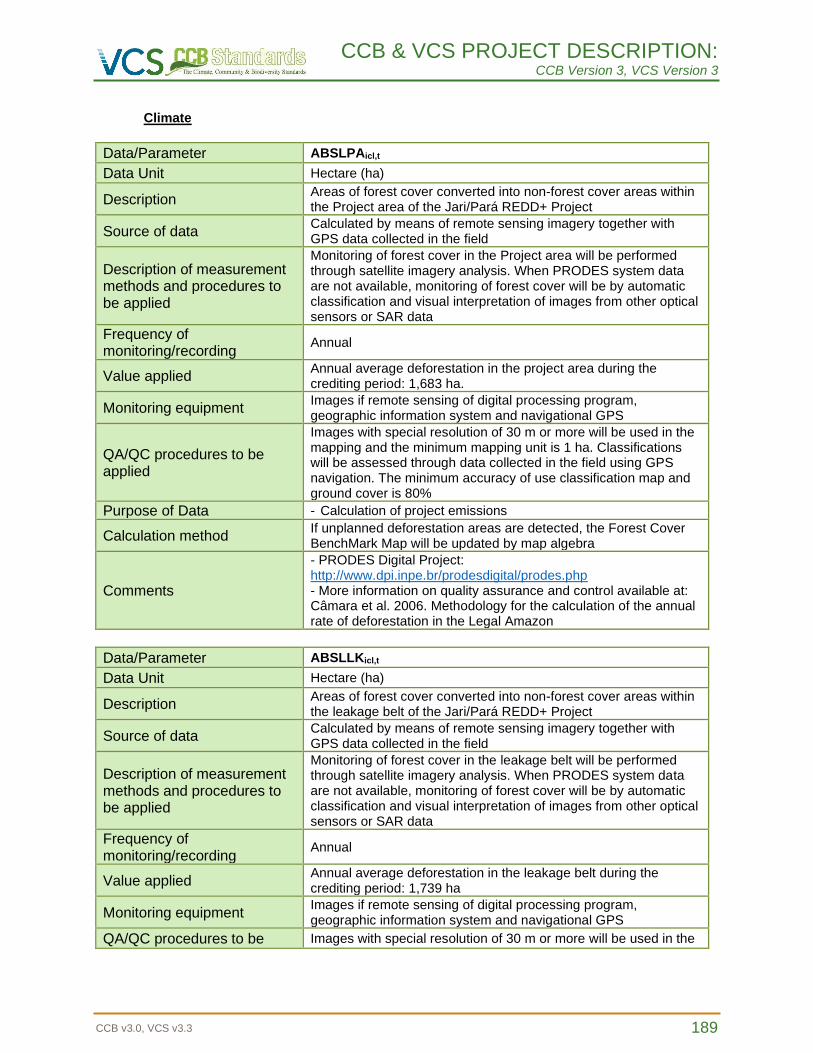
CCB & VCS PROJECT DESCRIPTION: CCB Version 3, VCS Version 3
CCB v3.0, VCS v3.3 189
Climate
Data/Parameter ABSLPAicl,t
Data Unit Hectare (ha)
Description Areas of forest cover converted into non-forest cover areas within the Project area of the Jari/Pará REDD+ Project
Source of data Calculated by means of remote sensing imagery together with GPS data collected in the field
Description of measurement methods and procedures to be applied
Monitoring of forest cover in the Project area will be performed through satellite imagery analysis. When PRODES system data are not available, monitoring of forest cover will be by automatic classification and visual interpretation of images from other optical sensors or SAR data
Frequency of monitoring/recording
Annual
Value applied Annual average deforestation in the project area during the crediting period: 1,683 ha.
Monitoring equipment Images if remote sensing of digital processing program, geographic information system and navigational GPS
QA/QC procedures to be applied
Images with special resolution of 30 m or more will be used in the mapping and the minimum mapping unit is 1 ha. Classifications will be assessed through data collected in the field using GPS navigation. The minimum accuracy of use classification map and ground cover is 80%
Purpose of Data - Calculation of project emissions
Calculation method If unplanned deforestation areas are detected, the Forest Cover BenchMark Map will be updated by map algebra
Comments
- PRODES Digital Project: http://www.dpi.inpe.br/prodesdigital/prodes.php - More information on quality assurance and control available at: Câmara et al. 2006. Methodology for the calculation of the annual rate of deforestation in the Legal Amazon
Data/Parameter ABSLLKicl,t
Data Unit Hectare (ha)
Description Areas of forest cover converted into non-forest cover areas within the leakage belt of the Jari/Pará REDD+ Project
Source of data Calculated by means of remote sensing imagery together with GPS data collected in the field
Description of measurement methods and procedures to be applied
Monitoring of forest cover in the leakage belt will be performed through satellite imagery analysis. When PRODES system data are not available, monitoring of forest cover will be by automatic classification and visual interpretation of images from other optical sensors or SAR data
Frequency of monitoring/recording
Annual
Value applied Annual average deforestation in the leakage belt during the crediting period: 1,739 ha
Monitoring equipment Images if remote sensing of digital processing program, geographic information system and navigational GPS
QA/QC procedures to be Images with special resolution of 30 m or more will be used in the
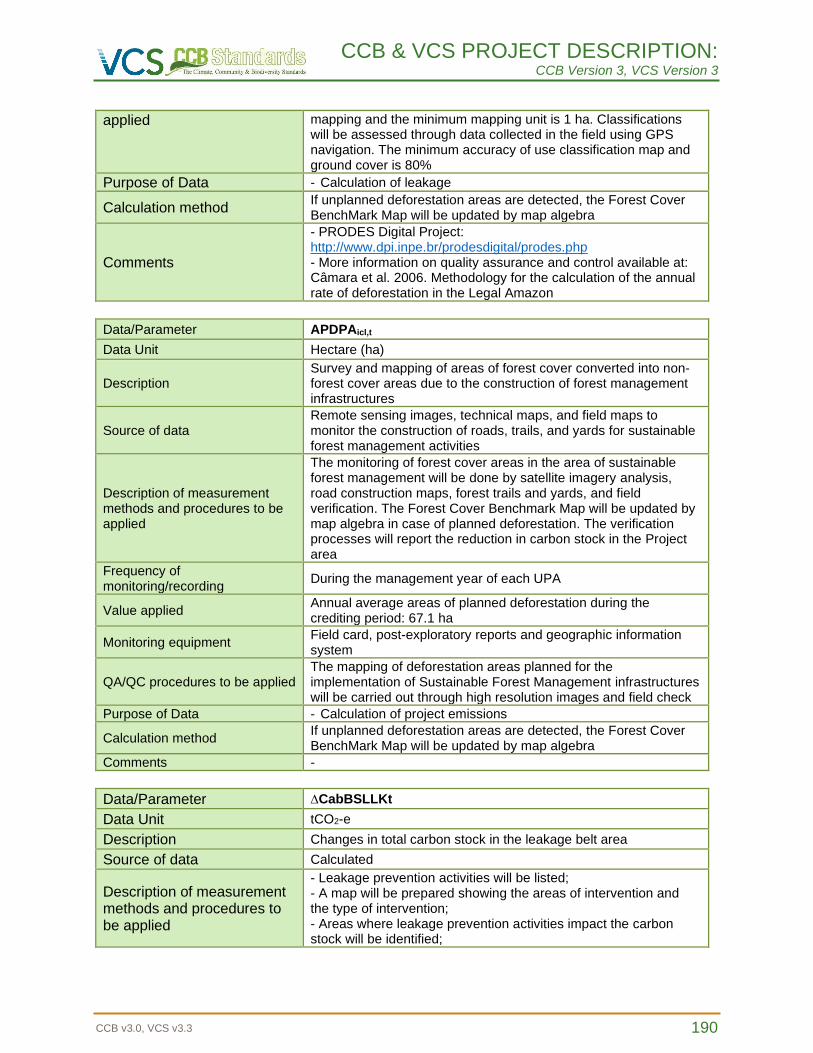
CCB & VCS PROJECT DESCRIPTION: CCB Version 3, VCS Version 3
CCB v3.0, VCS v3.3 190
applied mapping and the minimum mapping unit is 1 ha. Classifications will be assessed through data collected in the field using GPS navigation. The minimum accuracy of use classification map and ground cover is 80%
Purpose of Data - Calculation of leakage
Calculation method If unplanned deforestation areas are detected, the Forest Cover BenchMark Map will be updated by map algebra
Comments
- PRODES Digital Project: http://www.dpi.inpe.br/prodesdigital/prodes.php - More information on quality assurance and control available at: Câmara et al. 2006. Methodology for the calculation of the annual rate of deforestation in the Legal Amazon
Data/Parameter APDPAicl,t
Data Unit Hectare (ha)
Description Survey and mapping of areas of forest cover converted into non-forest cover areas due to the construction of forest management infrastructures
Source of data Remote sensing images, technical maps, and field maps to monitor the construction of roads, trails, and yards for sustainable forest management activities
Description of measurement methods and procedures to be applied
The monitoring of forest cover areas in the area of sustainable forest management will be done by satellite imagery analysis, road construction maps, forest trails and yards, and field verification. The Forest Cover Benchmark Map will be updated by map algebra in case of planned deforestation. The verification processes will report the reduction in carbon stock in the Project area
Frequency of monitoring/recording
During the management year of each UPA
Value applied Annual average areas of planned deforestation during the crediting period: 67.1 ha
Monitoring equipment Field card, post-exploratory reports and geographic information system
QA/QC procedures to be applied The mapping of deforestation areas planned for the implementation of Sustainable Forest Management infrastructures will be carried out through high resolution images and field check
Purpose of Data - Calculation of project emissions
Calculation method If unplanned deforestation areas are detected, the Forest Cover BenchMark Map will be updated by map algebra
Comments -
Data/Parameter ∆CabBSLLKt
Data Unit tCO2-e
Description Changes in total carbon stock in the leakage belt area
Source of data Calculated
Description of measurement methods and procedures to be applied
- Leakage prevention activities will be listed; - A map will be prepared showing the areas of intervention and the type of intervention; - Areas where leakage prevention activities impact the carbon stock will be identified;
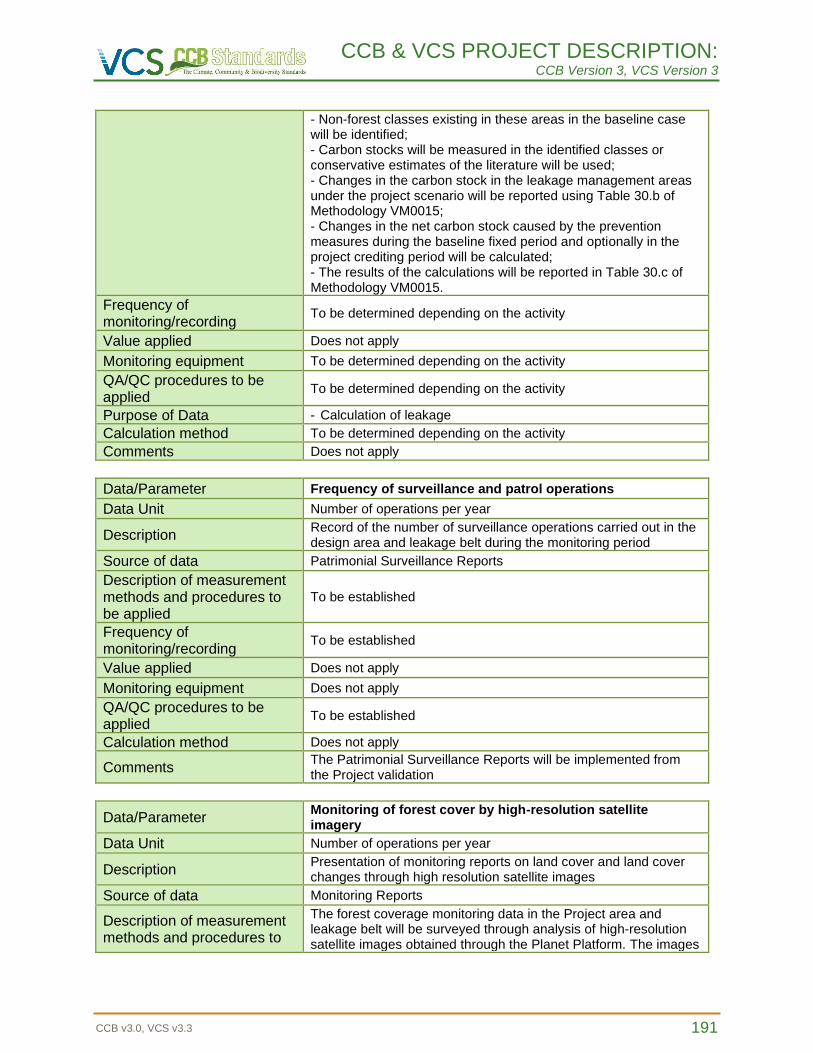
CCB & VCS PROJECT DESCRIPTION: CCB Version 3, VCS Version 3
CCB v3.0, VCS v3.3 191
- Non-forest classes existing in these areas in the baseline case will be identified; - Carbon stocks will be measured in the identified classes or conservative estimates of the literature will be used; - Changes in the carbon stock in the leakage management areas under the project scenario will be reported using Table 30.b of Methodology VM0015; - Changes in the net carbon stock caused by the prevention measures during the baseline fixed period and optionally in the project crediting period will be calculated; - The results of the calculations will be reported in Table 30.c of Methodology VM0015.
Frequency of monitoring/recording
To be determined depending on the activity
Value applied Does not apply
Monitoring equipment To be determined depending on the activity
QA/QC procedures to be applied
To be determined depending on the activity
Purpose of Data - Calculation of leakage
Calculation method To be determined depending on the activity
Comments Does not apply
Data/Parameter Frequency of surveillance and patrol operations
Data Unit Number of operations per year
Description Record of the number of surveillance operations carried out in the design area and leakage belt during the monitoring period
Source of data Patrimonial Surveillance Reports
Description of measurement methods and procedures to be applied
To be established
Frequency of monitoring/recording
To be established
Value applied Does not apply
Monitoring equipment Does not apply
QA/QC procedures to be applied
To be established
Calculation method Does not apply
Comments The Patrimonial Surveillance Reports will be implemented from the Project validation
Data/Parameter Monitoring of forest cover by high-resolution satellite imagery
Data Unit Number of operations per year
Description Presentation of monitoring reports on land cover and land cover changes through high resolution satellite images
Source of data Monitoring Reports
Description of measurement methods and procedures to
The forest coverage monitoring data in the Project area and leakage belt will be surveyed through analysis of high-resolution satellite images obtained through the Planet Platform. The images
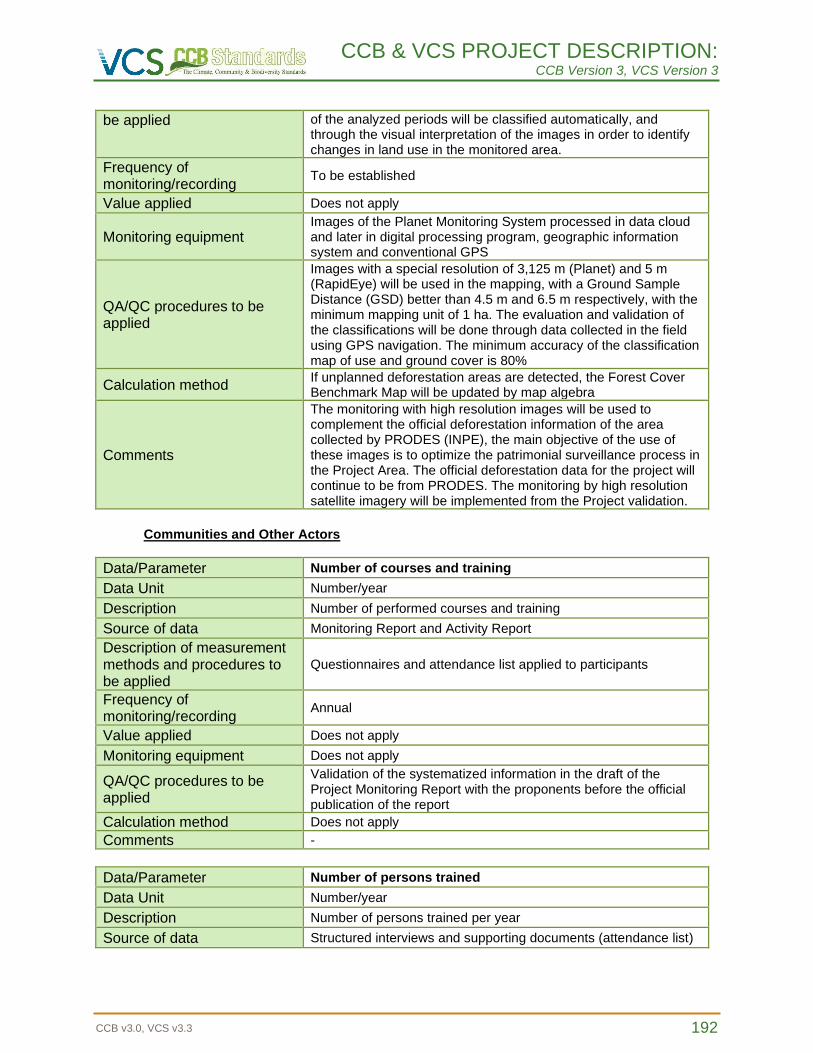
CCB & VCS PROJECT DESCRIPTION: CCB Version 3, VCS Version 3
CCB v3.0, VCS v3.3 192
be applied of the analyzed periods will be classified automatically, and through the visual interpretation of the images in order to identify changes in land use in the monitored area.
Frequency of monitoring/recording
To be established
Value applied Does not apply
Monitoring equipment Images of the Planet Monitoring System processed in data cloud and later in digital processing program, geographic information system and conventional GPS
QA/QC procedures to be applied
Images with a special resolution of 3,125 m (Planet) and 5 m (RapidEye) will be used in the mapping, with a Ground Sample Distance (GSD) better than 4.5 m and 6.5 m respectively, with the minimum mapping unit of 1 ha. The evaluation and validation of the classifications will be done through data collected in the field using GPS navigation. The minimum accuracy of the classification map of use and ground cover is 80%
Calculation method If unplanned deforestation areas are detected, the Forest Cover Benchmark Map will be updated by map algebra
Comments
The monitoring with high resolution images will be used to complement the official deforestation information of the area collected by PRODES (INPE), the main objective of the use of these images is to optimize the patrimonial surveillance process in the Project Area. The official deforestation data for the project will continue to be from PRODES. The monitoring by high resolution satellite imagery will be implemented from the Project validation.
Communities and Other Actors
Data/Parameter Number of courses and training
Data Unit Number/year
Description Number of performed courses and training
Source of data Monitoring Report and Activity Report
Description of measurement methods and procedures to be applied
Questionnaires and attendance list applied to participants
Frequency of monitoring/recording
Annual
Value applied Does not apply
Monitoring equipment Does not apply
QA/QC procedures to be applied
Validation of the systematized information in the draft of the Project Monitoring Report with the proponents before the official publication of the report
Calculation method Does not apply
Comments -
Data/Parameter Number of persons trained
Data Unit Number/year
Description Number of persons trained per year
Source of data Structured interviews and supporting documents (attendance list)
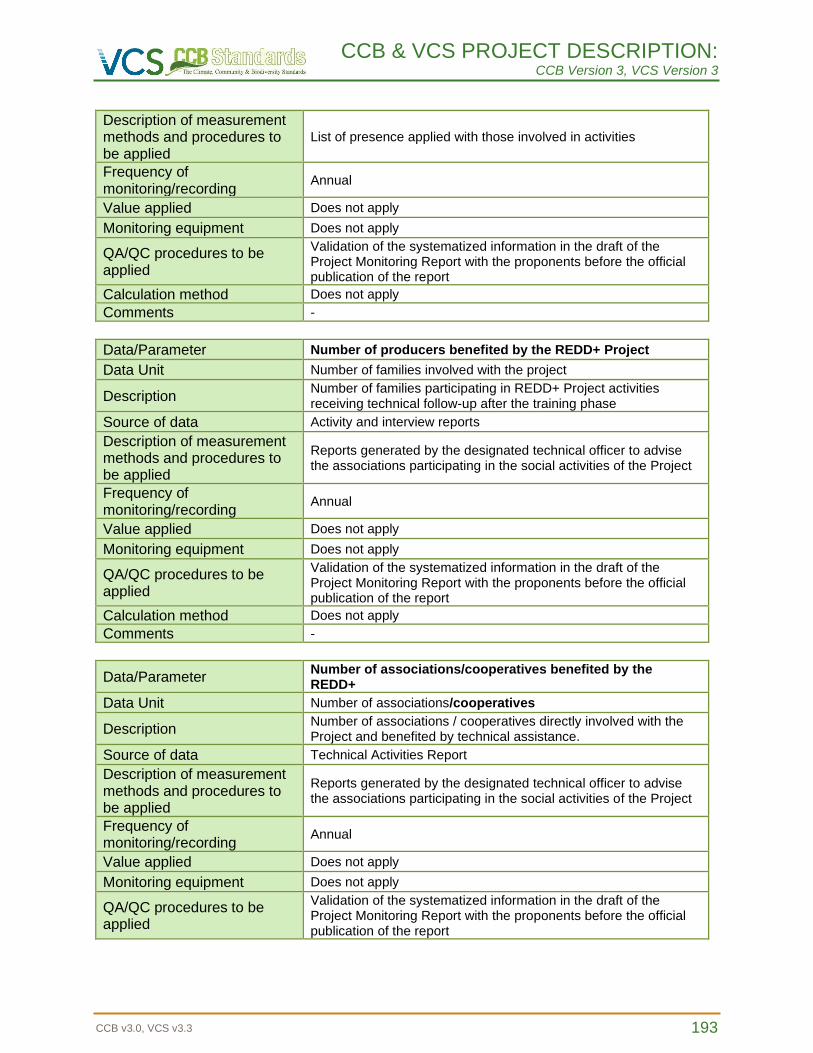
CCB & VCS PROJECT DESCRIPTION: CCB Version 3, VCS Version 3
CCB v3.0, VCS v3.3 193
Description of measurement methods and procedures to be applied
List of presence applied with those involved in activities
Frequency of monitoring/recording
Annual
Value applied Does not apply
Monitoring equipment Does not apply
QA/QC procedures to be applied
Validation of the systematized information in the draft of the Project Monitoring Report with the proponents before the official publication of the report
Calculation method Does not apply
Comments -
Data/Parameter Number of producers benefited by the REDD+ Project
Data Unit Number of families involved with the project
Description Number of families participating in REDD+ Project activities receiving technical follow-up after the training phase
Source of data Activity and interview reports
Description of measurement methods and procedures to be applied
Reports generated by the designated technical officer to advise the associations participating in the social activities of the Project
Frequency of monitoring/recording
Annual
Value applied Does not apply
Monitoring equipment Does not apply
QA/QC procedures to be applied
Validation of the systematized information in the draft of the Project Monitoring Report with the proponents before the official publication of the report
Calculation method Does not apply
Comments -
Data/Parameter Number of associations/cooperatives benefited by the REDD+
Data Unit Number of associations/cooperatives
Description Number of associations / cooperatives directly involved with the Project and benefited by technical assistance.
Source of data Technical Activities Report
Description of measurement methods and procedures to be applied
Reports generated by the designated technical officer to advise the associations participating in the social activities of the Project
Frequency of monitoring/recording
Annual
Value applied Does not apply
Monitoring equipment Does not apply
QA/QC procedures to be applied
Validation of the systematized information in the draft of the Project Monitoring Report with the proponents before the official publication of the report
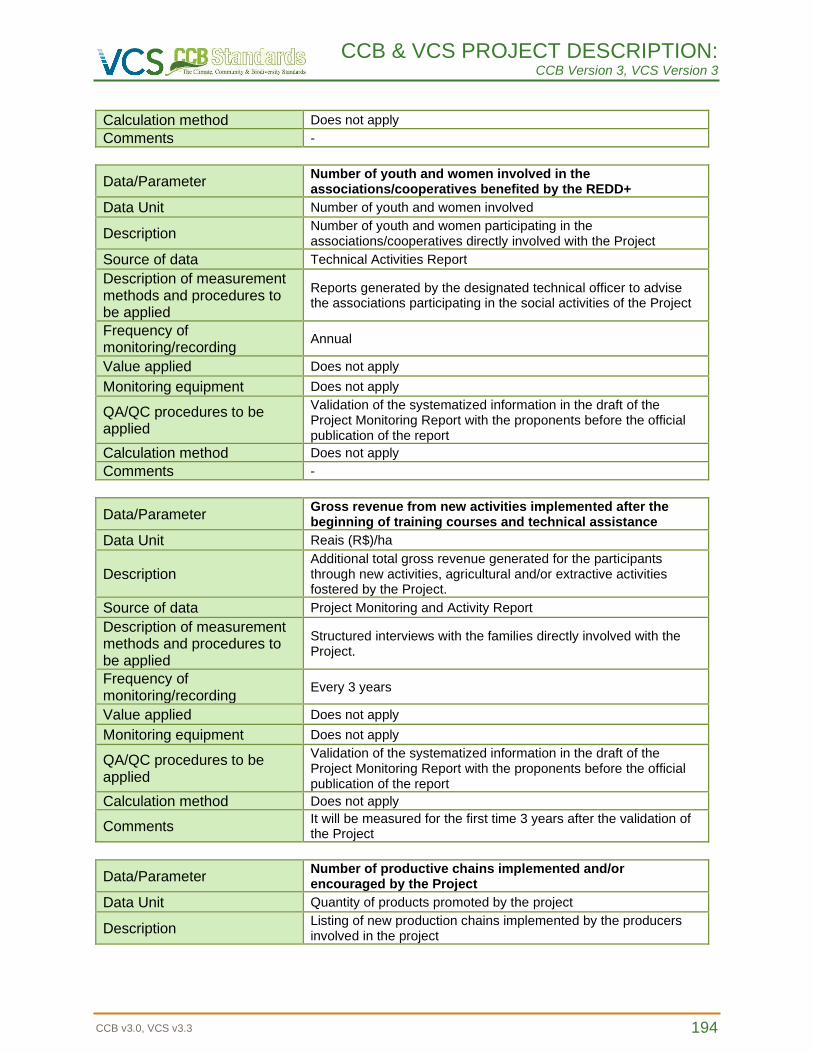
CCB & VCS PROJECT DESCRIPTION: CCB Version 3, VCS Version 3
CCB v3.0, VCS v3.3 194
Calculation method Does not apply
Comments -
Data/Parameter Number of youth and women involved in the associations/cooperatives benefited by the REDD+
Data Unit Number of youth and women involved
Description Number of youth and women participating in the associations/cooperatives directly involved with the Project
Source of data Technical Activities Report
Description of measurement methods and procedures to be applied
Reports generated by the designated technical officer to advise the associations participating in the social activities of the Project
Frequency of monitoring/recording
Annual
Value applied Does not apply
Monitoring equipment Does not apply
QA/QC procedures to be applied
Validation of the systematized information in the draft of the Project Monitoring Report with the proponents before the official publication of the report
Calculation method Does not apply
Comments -
Data/Parameter Gross revenue from new activities implemented after the beginning of training courses and technical assistance
Data Unit Reais (R$)/ha
Description Additional total gross revenue generated for the participants through new activities, agricultural and/or extractive activities fostered by the Project.
Source of data Project Monitoring and Activity Report
Description of measurement methods and procedures to be applied
Structured interviews with the families directly involved with the Project.
Frequency of monitoring/recording
Every 3 years
Value applied Does not apply
Monitoring equipment Does not apply
QA/QC procedures to be applied
Validation of the systematized information in the draft of the Project Monitoring Report with the proponents before the official publication of the report
Calculation method Does not apply
Comments It will be measured for the first time 3 years after the validation of the Project
Data/Parameter Number of productive chains implemented and/or encouraged by the Project
Data Unit Quantity of products promoted by the project
Description Listing of new production chains implemented by the producers involved in the project
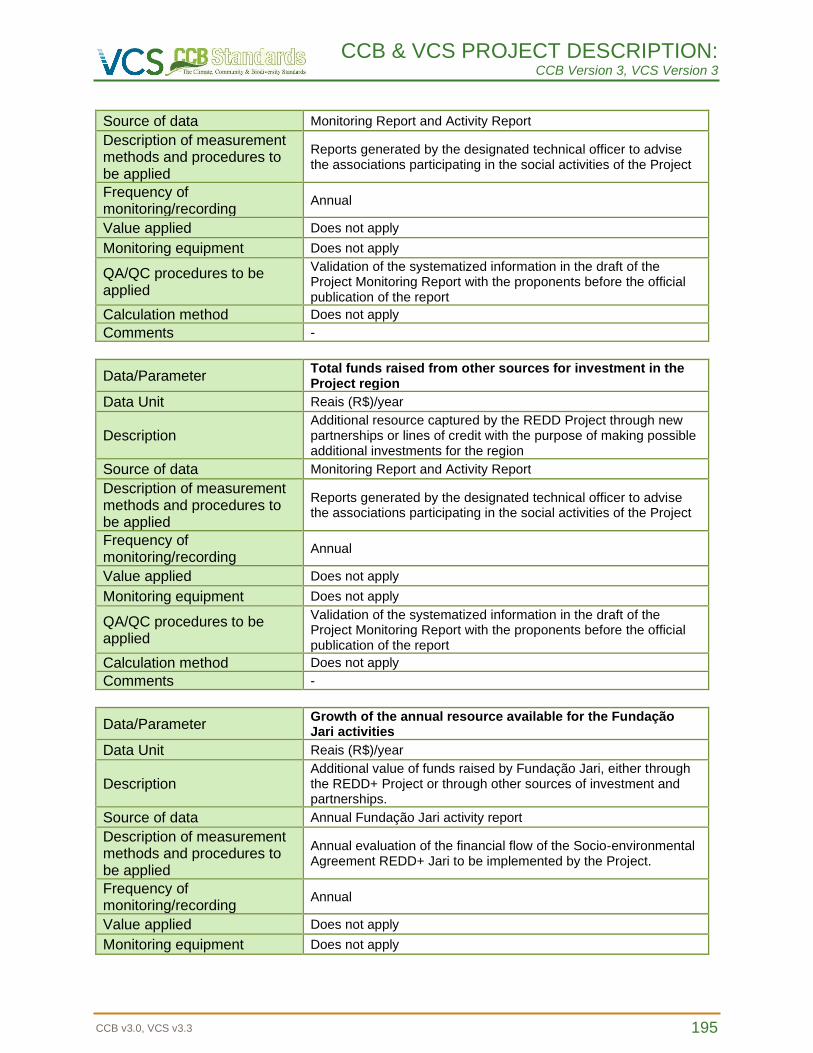
CCB & VCS PROJECT DESCRIPTION: CCB Version 3, VCS Version 3
CCB v3.0, VCS v3.3 195
Source of data Monitoring Report and Activity Report
Description of measurement methods and procedures to be applied
Reports generated by the designated technical officer to advise the associations participating in the social activities of the Project
Frequency of monitoring/recording
Annual
Value applied Does not apply
Monitoring equipment Does not apply
QA/QC procedures to be applied
Validation of the systematized information in the draft of the Project Monitoring Report with the proponents before the official publication of the report
Calculation method Does not apply
Comments -
Data/Parameter Total funds raised from other sources for investment in the Project region
Data Unit Reais (R$)/year
Description Additional resource captured by the REDD Project through new partnerships or lines of credit with the purpose of making possible additional investments for the region
Source of data Monitoring Report and Activity Report
Description of measurement methods and procedures to be applied
Reports generated by the designated technical officer to advise the associations participating in the social activities of the Project
Frequency of monitoring/recording
Annual
Value applied Does not apply
Monitoring equipment Does not apply
QA/QC procedures to be applied
Validation of the systematized information in the draft of the Project Monitoring Report with the proponents before the official publication of the report
Calculation method Does not apply
Comments -
Data/Parameter Growth of the annual resource available for the Fundação Jari activities
Data Unit Reais (R$)/year
Description Additional value of funds raised by Fundação Jari, either through the REDD+ Project or through other sources of investment and partnerships.
Source of data Annual Fundação Jari activity report
Description of measurement methods and procedures to be applied
Annual evaluation of the financial flow of the Socio-environmental Agreement REDD+ Jari to be implemented by the Project.
Frequency of monitoring/recording
Annual
Value applied Does not apply
Monitoring equipment Does not apply
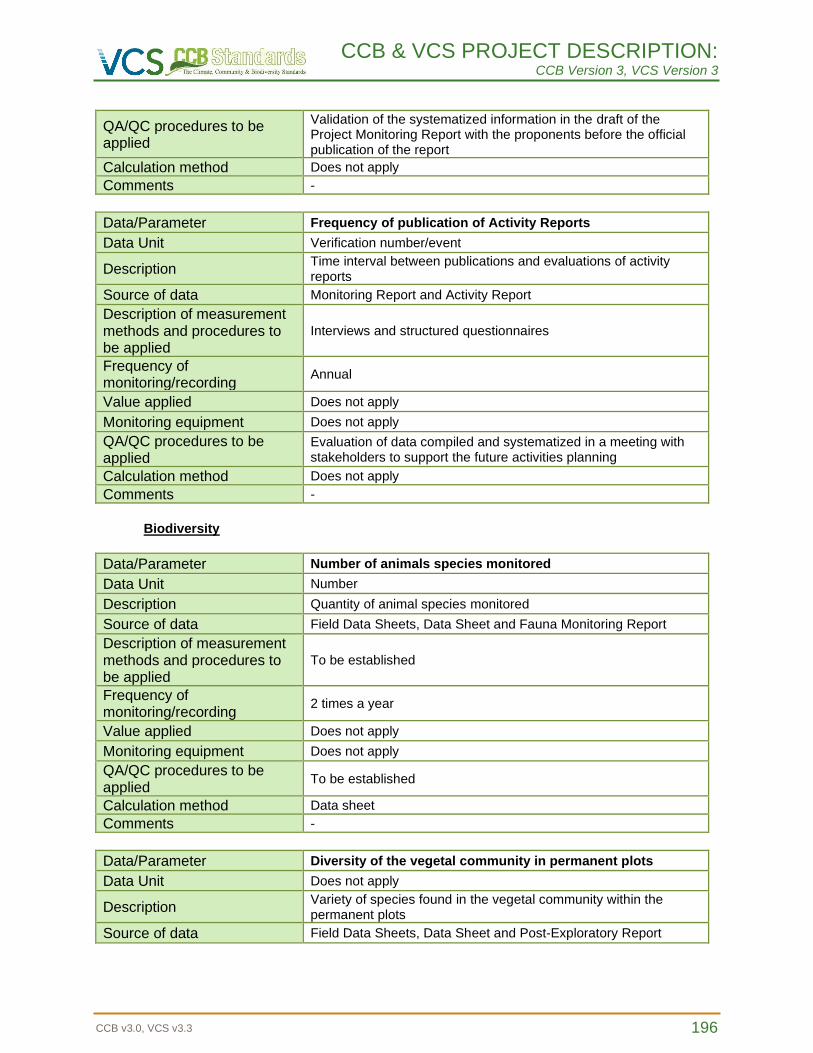
CCB & VCS PROJECT DESCRIPTION: CCB Version 3, VCS Version 3
CCB v3.0, VCS v3.3 196
QA/QC procedures to be applied
Validation of the systematized information in the draft of the Project Monitoring Report with the proponents before the official publication of the report
Calculation method Does not apply
Comments -
Data/Parameter Frequency of publication of Activity Reports
Data Unit Verification number/event
Description Time interval between publications and evaluations of activity reports
Source of data Monitoring Report and Activity Report
Description of measurement methods and procedures to be applied
Interviews and structured questionnaires
Frequency of monitoring/recording
Annual
Value applied Does not apply
Monitoring equipment Does not apply
QA/QC procedures to be applied
Evaluation of data compiled and systematized in a meeting with stakeholders to support the future activities planning
Calculation method Does not apply
Comments -
Biodiversity
Data/Parameter Number of animals species monitored
Data Unit Number
Description Quantity of animal species monitored
Source of data Field Data Sheets, Data Sheet and Fauna Monitoring Report
Description of measurement methods and procedures to be applied
To be established
Frequency of monitoring/recording
2 times a year
Value applied Does not apply
Monitoring equipment Does not apply
QA/QC procedures to be applied
To be established
Calculation method Data sheet
Comments -
Data/Parameter Diversity of the vegetal community in permanent plots
Data Unit Does not apply
Description Variety of species found in the vegetal community within the permanent plots
Source of data Field Data Sheets, Data Sheet and Post-Exploratory Report
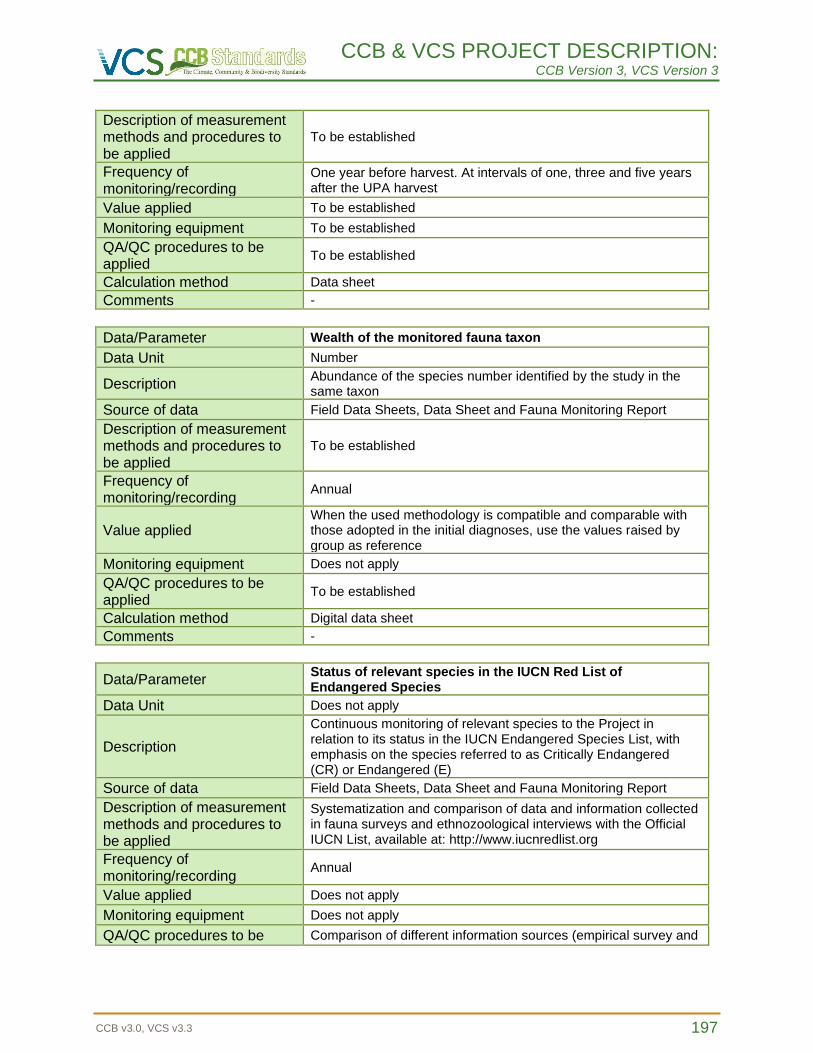
CCB & VCS PROJECT DESCRIPTION: CCB Version 3, VCS Version 3
CCB v3.0, VCS v3.3 197
Description of measurement methods and procedures to be applied
To be established
Frequency of monitoring/recording
One year before harvest. At intervals of one, three and five years after the UPA harvest
Value applied To be established
Monitoring equipment To be established
QA/QC procedures to be applied
To be established
Calculation method Data sheet
Comments -
Data/Parameter Wealth of the monitored fauna taxon
Data Unit Number
Description Abundance of the species number identified by the study in the same taxon
Source of data Field Data Sheets, Data Sheet and Fauna Monitoring Report
Description of measurement methods and procedures to be applied
To be established
Frequency of monitoring/recording
Annual
Value applied When the used methodology is compatible and comparable with those adopted in the initial diagnoses, use the values raised by group as reference
Monitoring equipment Does not apply
QA/QC procedures to be applied
To be established
Calculation method Digital data sheet
Comments -
Data/Parameter Status of relevant species in the IUCN Red List of Endangered Species
Data Unit Does not apply
Description
Continuous monitoring of relevant species to the Project in relation to its status in the IUCN Endangered Species List, with emphasis on the species referred to as Critically Endangered (CR) or Endangered (E)
Source of data Field Data Sheets, Data Sheet and Fauna Monitoring Report
Description of measurement methods and procedures to be applied
Systematization and comparison of data and information collected in fauna surveys and ethnozoological interviews with the Official IUCN List, available at: http://www.iucnredlist.org
Frequency of monitoring/recording
Annual
Value applied Does not apply
Monitoring equipment Does not apply
QA/QC procedures to be Comparison of different information sources (empirical survey and
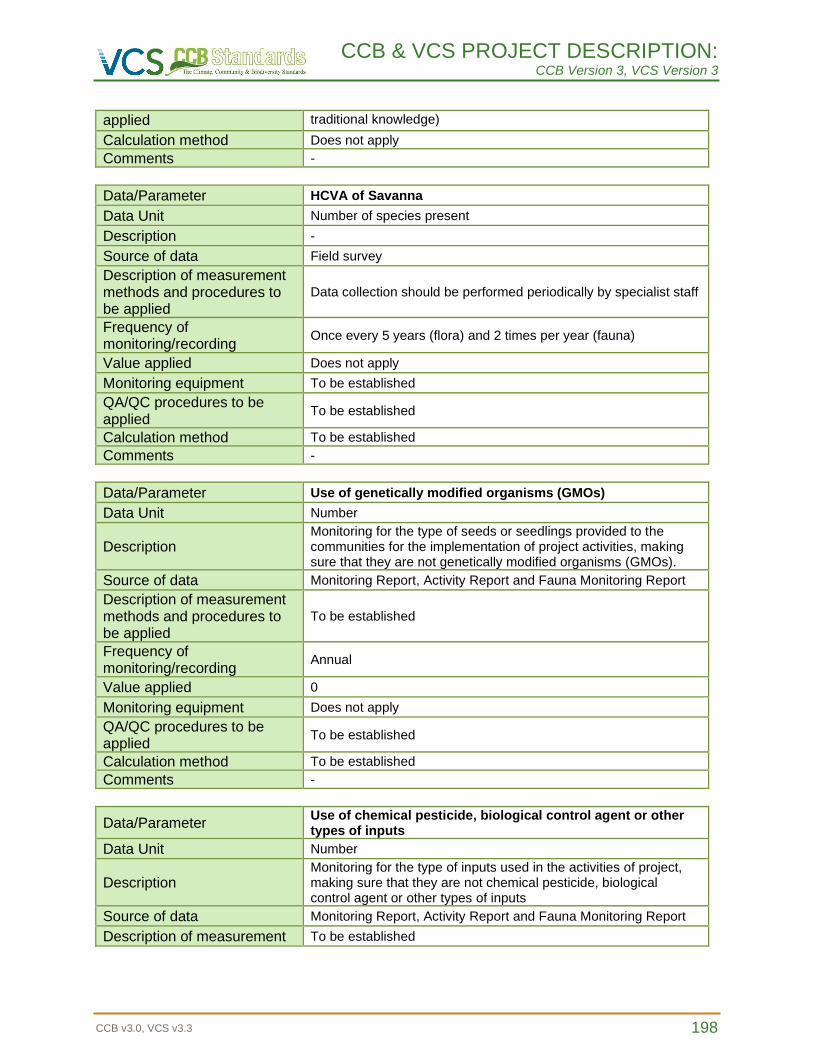
CCB & VCS PROJECT DESCRIPTION: CCB Version 3, VCS Version 3
CCB v3.0, VCS v3.3 198
applied traditional knowledge)
Calculation method Does not apply
Comments -
Data/Parameter HCVA of Savanna
Data Unit Number of species present
Description -
Source of data Field survey
Description of measurement methods and procedures to be applied
Data collection should be performed periodically by specialist staff
Frequency of monitoring/recording
Once every 5 years (flora) and 2 times per year (fauna)
Value applied Does not apply
Monitoring equipment To be established
QA/QC procedures to be applied
To be established
Calculation method To be established
Comments -
Data/Parameter Use of genetically modified organisms (GMOs)
Data Unit Number
Description Monitoring for the type of seeds or seedlings provided to the communities for the implementation of project activities, making sure that they are not genetically modified organisms (GMOs).
Source of data Monitoring Report, Activity Report and Fauna Monitoring Report
Description of measurement methods and procedures to be applied
To be established
Frequency of monitoring/recording
Annual
Value applied 0
Monitoring equipment Does not apply
QA/QC procedures to be applied
To be established
Calculation method To be established
Comments -
Data/Parameter Use of chemical pesticide, biological control agent or other types of inputs
Data Unit Number
Description Monitoring for the type of inputs used in the activities of project, making sure that they are not chemical pesticide, biological control agent or other types of inputs
Source of data Monitoring Report, Activity Report and Fauna Monitoring Report
Description of measurement To be established
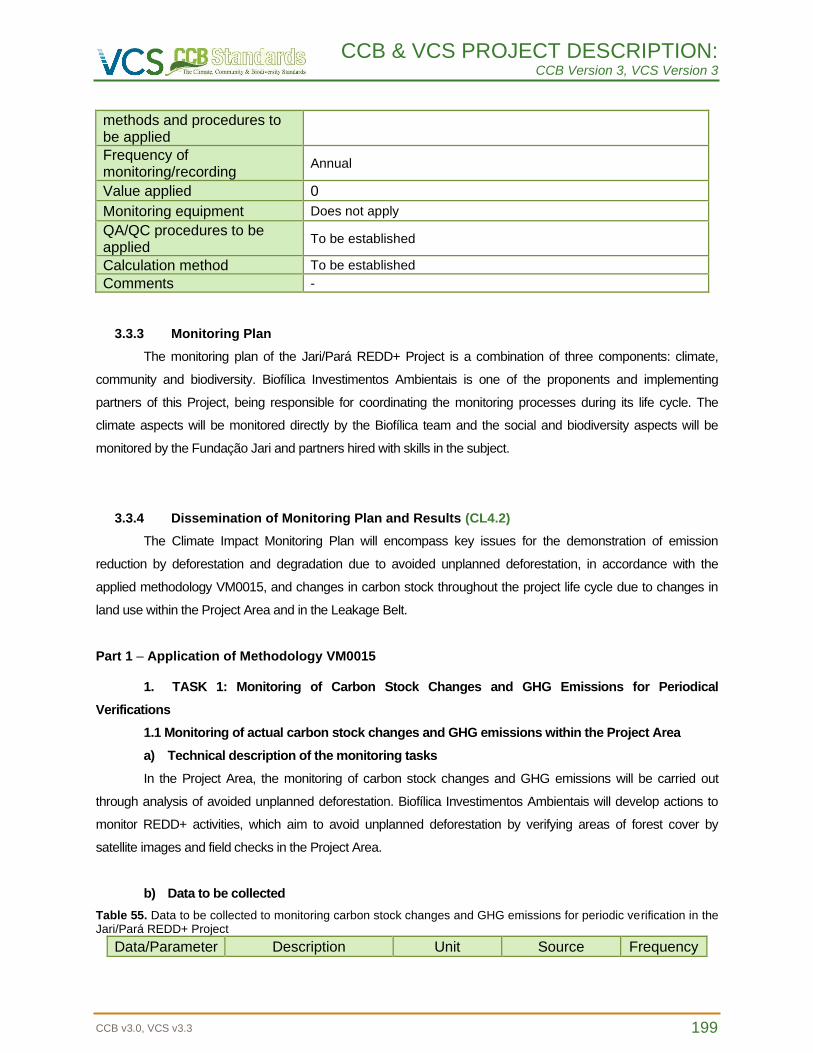
CCB & VCS PROJECT DESCRIPTION: CCB Version 3, VCS Version 3
CCB v3.0, VCS v3.3 199
methods and procedures to be applied
Frequency of monitoring/recording
Annual
Value applied 0
Monitoring equipment Does not apply
QA/QC procedures to be applied
To be established
Calculation method To be established
Comments -
3.3.3 Monitoring Plan
The monitoring plan of the Jari/Pará REDD+ Project is a combination of three components: climate,
community and biodiversity. Biofílica Investimentos Ambientais is one of the proponents and implementing
partners of this Project, being responsible for coordinating the monitoring processes during its life cycle. The
climate aspects will be monitored directly by the Biofílica team and the social and biodiversity aspects will be
monitored by the Fundação Jari and partners hired with skills in the subject.
3.3.4 Dissemination of Monitoring Plan and Results (CL4.2)
The Climate Impact Monitoring Plan will encompass key issues for the demonstration of emission
reduction by deforestation and degradation due to avoided unplanned deforestation, in accordance with the
applied methodology VM0015, and changes in carbon stock throughout the project life cycle due to changes in
land use within the Project Area and in the Leakage Belt.
Part 1 – Application of Methodology VM0015
1. TASK 1: Monitoring of Carbon Stock Changes and GHG Emissions for Periodical
Verifications
1.1 Monitoring of actual carbon stock changes and GHG emissions within the Project Area
a) Technical description of the monitoring tasks
In the Project Area, the monitoring of carbon stock changes and GHG emissions will be carried out
through analysis of avoided unplanned deforestation. Biofílica Investimentos Ambientais will develop actions to
monitor REDD+ activities, which aim to avoid unplanned deforestation by verifying areas of forest cover by
satellite images and field checks in the Project Area.
b) Data to be collected
Table 55. Data to be collected to monitoring carbon stock changes and GHG emissions for periodic verification in the Jari/Pará REDD+ Project
Data/Parameter Description Unit Source Frequency
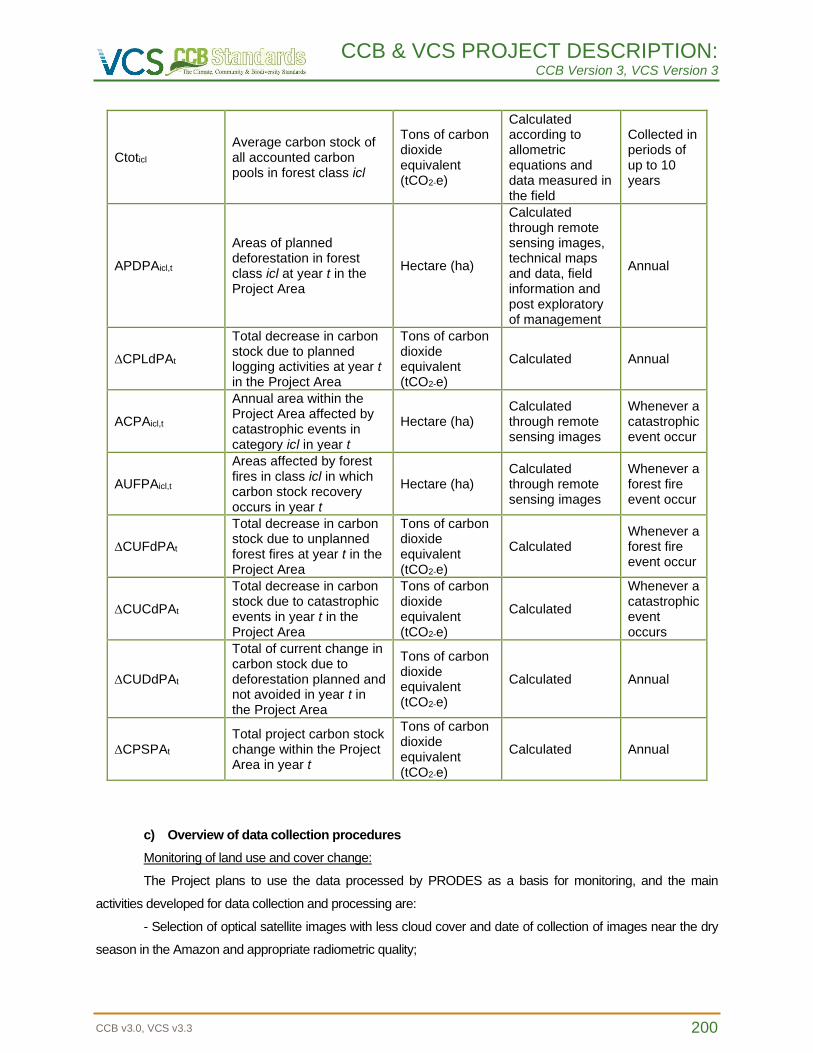
CCB & VCS PROJECT DESCRIPTION: CCB Version 3, VCS Version 3
CCB v3.0, VCS v3.3 200
Ctoticl Average carbon stock of all accounted carbon pools in forest class icl
Tons of carbon dioxide equivalent (tCO2-e)
Calculated according to allometric equations and data measured in the field
Collected in periods of up to 10 years
APDPAicl,t
Areas of planned deforestation in forest class icl at year t in the Project Area
Hectare (ha)
Calculated through remote sensing images, technical maps and data, field information and post exploratory of management
Annual
∆CPLdPAt
Total decrease in carbon stock due to planned logging activities at year t in the Project Area
Tons of carbon dioxide equivalent (tCO2-e)
Calculated Annual
ACPAicl,t
Annual area within the Project Area affected by catastrophic events in category icl in year t
Hectare (ha) Calculated through remote sensing images
Whenever a catastrophic event occur
AUFPAicl,t
Areas affected by forest fires in class icl in which carbon stock recovery occurs in year t
Hectare (ha) Calculated through remote sensing images
Whenever a forest fire event occur
∆CUFdPAt
Total decrease in carbon stock due to unplanned forest fires at year t in the Project Area
Tons of carbon dioxide equivalent (tCO2-e)
Calculated Whenever a forest fire event occur
∆CUCdPAt
Total decrease in carbon stock due to catastrophic events in year t in the Project Area
Tons of carbon dioxide equivalent (tCO2-e)
Calculated
Whenever a catastrophic event occurs
∆CUDdPAt
Total of current change in carbon stock due to deforestation planned and not avoided in year t in the Project Area
Tons of carbon dioxide equivalent (tCO2-e)
Calculated Annual
∆CPSPAt Total project carbon stock change within the Project Area in year t
Tons of carbon dioxide equivalent (tCO2-e)
Calculated Annual
c) Overview of data collection procedures
Monitoring of land use and cover change:
The Project plans to use the data processed by PRODES as a basis for monitoring, and the main
activities developed for data collection and processing are:
- Selection of optical satellite images with less cloud cover and date of collection of images near the dry
season in the Amazon and appropriate radiometric quality;
CCB & VCS PROJECT DESCRIPTION: CCB Version 3, VCS Version 3
CCB v3.0, VCS v3.3 201
- Georeferencing of satellite imagery with scale 1: 100,000 topographic maps or NASA images in ortho-
rectified MrSID format;
- Production of a spectral mixing model to estimate the percentage of vegetation, soil and shade
components for each pixel in the image;
- Use of segmentation technique determining in the satellite image the spatially adjacent regions
(segments) with similar spectral characteristics;
- Classification of the segments to identify forest classes, non-forest vegetation and deforestation.
Carbon stock monitoring and non-CO2 emissions:
Carbon stock changes (reduction) will be monitored through the forest inventory and the measurement
of the Diameter at Chest Height (130 cm), for each tree with DCH equal to or greater than 15 cm in each plot of
the forest inventory. The most widely used variable to estimate the carbon stock and changes in the carbon stock
of the Jari/Pará REDD+ Project is the DCH.
d) Quality control and quality assurance procedures
Monitoring of Land-Use and Land-Cover change:
The mapping of deforestation occurrence data will be done through data collected in GPS navigation in
order to corroborate the information obtained by satellite images. The minimum classification accuracy for use
and ground cover is 80%. For cloud-covered areas, images of SAR sensors such as RADARSAT-2, Cosmo
SkyMed or TerraSAR-X will be used.
Biofílica Investimentos Ambientais will be responsible for storing during the Project period the original
digital data (raster) and processed (vectors) of satellite images, coordinates, technical maps, photos and field
cards. Maps with installed infrastructure, satellite images and annual deforestation reports will be made available
to the verification body at each verification event.
Carbon stock monitoring and non-CO2 emissions:
The Grupo Jari will be responsible for keeping the original reports and field records stored and Biofílica
Investimentos Ambientais will keep a digital copy of these documents throughout the duration of the Project.
Spreadsheets, forest inventory reports, and parcel monitoring reports will be made available to verifiers at each
verification event.
e) Data archiving
Biofílica Investimentos Ambientais will keep all Jari/Pará REDD+ Project data and reports stored in
digital files for the duration of the Project. The original reports and collected field records produced by the forest
management activity will be stored by the Grupo Jari and as previously stated, Biofílica Investimentos Ambientais
will keep a copy of these documents filed in digital format throughout the Project.
CCB & VCS PROJECT DESCRIPTION: CCB Version 3, VCS Version 3
CCB v3.0, VCS v3.3 202
Through the Fundação Jari Activity Report and Impact Report prepared periodically, compilation and
announcement of social activities results will be carried out, being made available in digital format. All documents
related to the monitoring of the Jari/Pará REDD+ Project will be gathered in paper and/or digital files and made
available to the verifiers at each verification event.
f) Organization and responsibilities of the parties involved in all of the above
These activities are the responsibility of Biofílica Investimentos Ambientais, of the Grupo Jari and the
Fundação Jari.
Monitorind of actual carbon stock changes and GHG emissions within the Project Area
1.1.1 Monitoring of Project Implementation
Implementation of REDD+ activities will be monitored through physical-financial timelines, performance
and quality monitoring reports, forest cover maps, meeting reports, land invasion police reports and other actions
to control illegal deforestation, and other relevant documents.
1.1.2 Monitoring of Land-Use and Land-Cover change within the Project Area
The planned and unplanned deforestation monitoring will be developed by mapping the forest coverage
of the Project Area, data provided annually by PRODES, using satellite images with spatial resolution of 30
meters. Subsequently the mapping will be validated from the assessment of accuracy with high resolution images
and field verification, when necessary. The monitoring of deforestation for the implementation of infrastructures of
social activities will be carried out through specific field files and for the construction of roads, branches and
storage yards within the Project Area will be used Post-Exploratory Reports and maps and satellite images
containing information on forest cover areas converted into the non-forest class. Aiming for greater flexibility in the
deforestation mapping process, different techniques for classification and visual interpretation can be used during
the Project progress, such as complementary mapping using alternative images and sensors and data collected
in the field.
Data on deforestation events will be compared to the baseline scenario. The emission reduction values
for the monitored period will be based on the comparison between the expected deforestation and the actual
deforestation.
1.1.3 Monitoring of carbon stock changes and non-CO2 emissions from forest fires
Within the Project Area:
It is hoped that the ex ante estimate of carbon stock for forest class will not change during the baseline
period. However, Methodology VM0015 requests monitoring of the carbon stock in the Project Area subject to the
relevant decrease of the carbon stock in the Project scenario in accordance with the ex ante evaluation due to
controlled deforestation and planned management activities, or areas subject to the unplanned and significant
decrease of the carbon stock in the Project scenario.
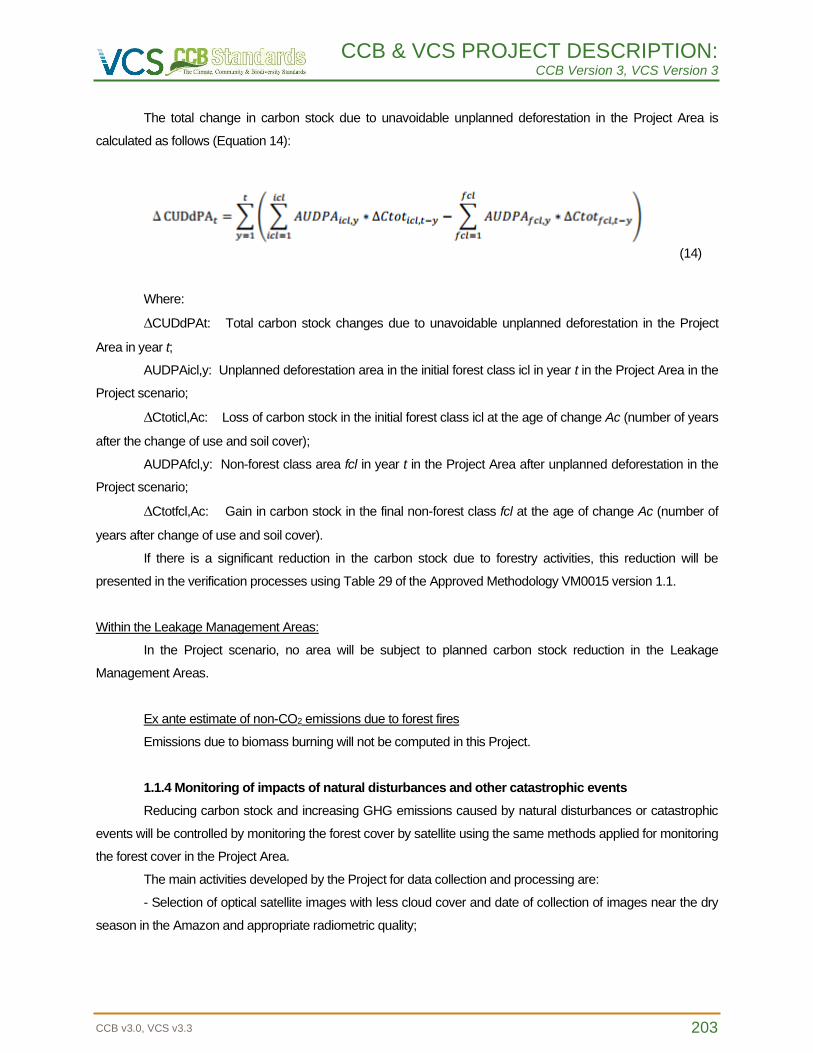
CCB & VCS PROJECT DESCRIPTION: CCB Version 3, VCS Version 3
CCB v3.0, VCS v3.3 203
The total change in carbon stock due to unavoidable unplanned deforestation in the Project Area is
calculated as follows (Equation 14):
(14)
Where:
∆CUDdPAt: Total carbon stock changes due to unavoidable unplanned deforestation in the Project
Area in year t;
AUDPAicl,y: Unplanned deforestation area in the initial forest class icl in year t in the Project Area in the
Project scenario;
∆Ctoticl,Ac: Loss of carbon stock in the initial forest class icl at the age of change Ac (number of years
after the change of use and soil cover);
AUDPAfcl,y: Non-forest class area fcl in year t in the Project Area after unplanned deforestation in the
Project scenario;
∆Ctotfcl,Ac: Gain in carbon stock in the final non-forest class fcl at the age of change Ac (number of
years after change of use and soil cover).
If there is a significant reduction in the carbon stock due to forestry activities, this reduction will be
presented in the verification processes using Table 29 of the Approved Methodology VM0015 version 1.1.
Within the Leakage Management Areas:
In the Project scenario, no area will be subject to planned carbon stock reduction in the Leakage
Management Areas.
Ex ante estimate of non-CO2 emissions due to forest fires
Emissions due to biomass burning will not be computed in this Project.
1.1.4 Monitoring of impacts of natural disturbances and other catastrophic events
Reducing carbon stock and increasing GHG emissions caused by natural disturbances or catastrophic
events will be controlled by monitoring the forest cover by satellite using the same methods applied for monitoring
the forest cover in the Project Area.
The main activities developed by the Project for data collection and processing are:
- Selection of optical satellite images with less cloud cover and date of collection of images near the dry
season in the Amazon and appropriate radiometric quality;
CCB & VCS PROJECT DESCRIPTION: CCB Version 3, VCS Version 3
CCB v3.0, VCS v3.3 204
- Georeferencing of satellite imagery with scale 1: 100,000 topographic maps or NASA images in ortho-
rectified MrSID format;
- Mapping of areas of forest cover reached.
The multiplication of the mapped area of forest loss by the average forest carbon stock will be used to
estimate the emissions caused by natural disturbances or catastrophic events. If there is a significant decrease in
the carbon stock due to natural disturbances or catastrophic events, this reduction will be reported in the
verification processes using Tables 25e, 25f and 25g of the Approved Methodology VM0015 version 1.1.
1.2 Monitoring of Leakage
a) Technical description of monitoring tasks
The Jari/Pará REDD+ Project will include two monitoring activities for leakage sources:
- Monitoring the reduction in carbon stocks and/or increase in GHG emissions correlated with leakage
prevention measures if project proponents implement activities such as tree planting, agricultural intensification,
fertilization, forage production and/or other measures of improvement in agricultural areas and pastures. In case
these activities imply a reduction in carbon stocks and/or an increase in GHG emissions in the Leakage
Management Areas, these carbon stock changes and/or GHG emissions will be calculated by Biofílica
Investimentos Ambientais.
- Monitoring of forest cover in the Leakage Belt through satellite imagery will be conducted by Biofílica
Investimentos Ambientais.
b) Data to be collected
Table 56. Data to be collected for leakage monitoring for Jari/Pará REDD+ Project
Data Description Unit Source Frequency
∆CLPMLKt Reduction of carbon stock due to measures to prevent leakage
Tons of carbon dioxide equivalent (tCO2-e)
Calculated Annual
EgLKt
Emissions resulted from animals on pastures in Leakage Management Area in year t
Tons of carbon dioxide equivalent (tCO2-e)
Calculated Annual
ELPMLKt
Total annual increase of GHG emissions derived from measures to prevent leakage in year t
Tons of carbon dioxide equivalent (tCO2-e)
Calculated Annual
∆CabBSLLKt Total change in carbon stock in the Leakage Belt area
Tons of carbon dioxide equivalent (tCO2-e)
Calculated Annual
c) Overview of the data collection procedures
Monitoring of carbon stock changes and GHG emissions associated to leakage prevention activities
CCB & VCS PROJECT DESCRIPTION: CCB Version 3, VCS Version 3
CCB v3.0, VCS v3.3 205
In order to validate the monitoring of carbon stock changes due to the activities implemented in the
Leakage Management Areas, the main activities carried out by the Project for data collection and processing are:
- List of leakage prevention activities;
- Production of map showing the intervention areas and type of intervention;
- Recognition of areas where leakage prevention activities have an impact on the carbon stock;
- Non-forest classes existing in these areas in the baseline case will be identified;
- The carbon stocks in the identified classes will be measured or there will be use of a conservative
estimation of literature;
- Carbon stock changes in the Leakage Management Areas under the project scenario will be reported
using Table 30b of VM0015;
- Calculation of net changes in carbon stock caused by leakage prevention measures during the fixed
period of the baseline and crediting period of the Project;
- The results of the calculations will be reported by Table 30c of approved Methodology VM0015.
Monitoring of carbon stock decrease and increase in GHG emissions due to activity displacement
leakage
Monitoring of carbon stock changes
The processes used to monitor deforestation in the Project Area will be the same for data collection (item
1.2 above).
Monitoring of increases in GHG emissions
Emissions due to forest fires are not computed at the baseline.
d) Quality control procedures and quality assurance
Monitoring of carbon stock changes and GHG emissions associated to leakage prevention activities
To be determined according to the activity, if implemented.
Monitoring of carbon stock decrease and increase in GHG emissions due to activity displacement
leakage
The procedures for quality control and quality assurance will be carried out with the same methods used
to monitor deforestation in the Project Area (section 1.1).
e) Data filing
The original reports and field maps will be stored by the Grupo Jari. Biofílica Investimentos Ambientais
will be responsible for storing during the Project period the original digital data (raster) and processed (vectors) of
satellite images, coordinates, technical maps, photos and field cards. Maps with installed infrastructure, satellite
images and annual deforestation reports will be made available to the verification body at each verification event.
CCB & VCS PROJECT DESCRIPTION: CCB Version 3, VCS Version 3
CCB v3.0, VCS v3.3 206
f) Organization and responsibilities of parties involved on the above points
These activities are the responsibility of Biofílica Investimentos Ambientais and the Grupo Jari.
1.2.1 Monitoring of carbon stock changes and GHG emissions associated to leakage prevention
activities
It is not expected that there will be a decrease in the carbon stock due to the activities developed in
Leakage Management Areas, since no agrarian improvement or management of pasture areas capable of
altering the carbon stock and increasing GHG emissions when compared to the baseline scenario has plans to
be implemented. However, should such activities prove necessary, the ex-ante changes in carbon stock and
GHG emissions associated with these activities will be estimated in accordance with step 8 of the Approved
Methodology VM0015. If the results are relevant, they will be monitored and the data made available to the
verifiers at each verification event using Tables 30b, 30c, 31, 32 and 33 of Methodology VM0015 version 1.1.
The following activities in Leakage Management Areas may lead to a reduction in carbon stock or an
increase in GHG emissions:
- Changes in carbon stock from activities implemented in the Leakage Management Areas;
- Emissions of methane (CH4) and nitrous oxide (N2O) from intensification of livestock (involving a
change in the animals’ diet and/or number of animals).
Nitrous oxide (N2O) emissions from nitrogen fertilization are always considered insignificant, according to
the latest version of the VCS standard. The consumption of fossil fuels is always considered insignificant in AUD
of the project activities and should not be considered.
1.2.2 Monitoring of carbon stock decrease and increase in GHG emissions due to activity
displacement leakage
Activity data for the Leakage Belt area will be produced using the same methods applied to monitoring
deforestation in the Project Area (item 1.2 above). If there is a deforestation event larger than expected for the
baseline scenario during the monitoring process and it is recognized in the Leakage Belt and deforestation is
attributed to deforestation agents in the Project Area, the losses in the carbon stock will be accounted for and
reported using Tables 22c and 21c of the Approved Methodology VM0015 version 1.1.
The total carbon stock changes from unavoidable unplanned deforestation in the Leakage Belt area is
calculated as follows (Equation 15):
(15)
CCB & VCS PROJECT DESCRIPTION: CCB Version 3, VCS Version 3
CCB v3.0, VCS v3.3 207
Where:
∆CBSLLKt: Total carbon stock changes due to unavoidable unplanned deforestation in the area of the
Leakage Belt in year t;
AUDLKicl,y: Unplanned deforestation area in the initial forest class icl in year t in the area of the
Leakage Belt in the Project scenario;
∆Ctoticl,Ac: Loss in the carbon stock in the initial forest class icl at the age of change Ac (number of
years after the change of LU/LC);
AUDLKfcl,y: Non-forest class area fcl in year t in the Leakage Belt area after unplanned deforestation in
the Project scenario;
∆Ctotfcl,Ac: Gain in carbon stock in the final non-forest class fcl at the age of change Ac (number of
years after the change of LU/LC).
1.2.3 Total ex post estimated leakage
The results will be demonstrated to the verifiers at each verification event using Table 35 of the
Approved Methodology VM0015 version 1.1.
1.3 Ex post net anthopogenic GHG emission reductions
a) Technical description of monitoring tasks
In the verification procedures, the results will be depicted using Table 36 of approved Methodology
VM0015 version 1.1 along with spatial data (deforestation maps, when available).
b) Data to be collected
Table 57. Data to be collected to monitor the net ex-post GHG gases reductions for the Jari/Pará REDD+ Project
Data Description Unit Source Frequency
∆REDD,t
Liquid reduction anthropogenic emissionsof GHG related to AUD activities of the Project in year t
Tons of carbon dioxide equivalent (tCO2-e)
Calculated Annual
VCU,t Number of Verified Carbon Units (VCUs) to be available for commercialization in year t
Tons of carbon dioxide equivalent (tCO2-e)
Calculated Annual
c) Brief description of the data collection procedures
The calculation of the number of Verified Carbon Units (VCUs) to be produced by the Jari/Pará REDD+
Project activities in year t will be done using Equations 19 and 20 of Methodology VM0015 version 1.1.
d) Quality control procedures and quality assurance
All tasks and tools listed in part 2 of the Approved Methodology VM0015 will be used to ensure that the
data are suitable for the verification process and the number of Verified Carbon Units is reliable.
CCB & VCS PROJECT DESCRIPTION: CCB Version 3, VCS Version 3
CCB v3.0, VCS v3.3 208
e) Data filing
Biofílica Investimentos Ambientais will store all Jari/Pará REDD+ Project data and reports in digital files
during the Project. All documents related to Project monitoring will be compiled into paper and/or digital files, and
made available to the verifiers at each verification event.
f) Organization and responsibilities of the parties involved in the above
These activities are the responsibility of Biofílica Investimentos Ambientais.
2. TASK 2: Revisiting the Baseline Projections for the Future Fixed Baseline Period
2.1 Update information on agents, drivers and underlying causes of deforestation
They will be updated and used in the revision of baseline projections after 10-year fixed period, statistical
and spatial data, studies and information on agents, drives and underlying causes of deforestation required to
carry out Steps 2 and 3 of the Approved Methodology Version VM0015.Monitoring data on sustainable forest
management and other activities developed in the Project Area will be used where available.
2.2 Adjustment of the Land-Use and Land-Cover change component of the baseline
If, during the next fixed baseline period, any national or subnational baseline becomes available, it will be
applied to the next period. If there is no national or subnational baseline available, Step 4 of Methodology
VM0015 will be redone by considering the 10-year period (2015-2024) and using updated variables on the
agents, drivers and underlying causes of deforestation in the Reference Region. The area of annual deforestation
and the location of deforestation at the baseline are the two main components to be revisited.
The assumptions and hypotheses considered in the modeling of the dynamic component of future
deforestation (population data), as well as the data used in the spatial projection (updating of highways, location
and distance of new deforestation) will be reviewed and updated.
2.3 Adjustment of the carbon component of the baseline
According to the results generated during the changes in the carbon stock monitoring processes
throughout the Project, the spatial estimate of the carbon component can be reviewed in Methodology VM0015
version 1.1, Part 3, item 1.1.3. New techniques can be analyzed for estimating spatial biomass, such as LIDAR or
interferometric SAR data.
3.3.5 Monitoring Plan of Impacts to the Community and Other Actors
An Initial Monitoring Plan for Impacts to Communities is presented below, and the complete
monitoring plan should be completed later and posted on the Internet and communicated to the
communities, project proponents, partners and other stakeholders.
a) Technical description of monitoring tasks
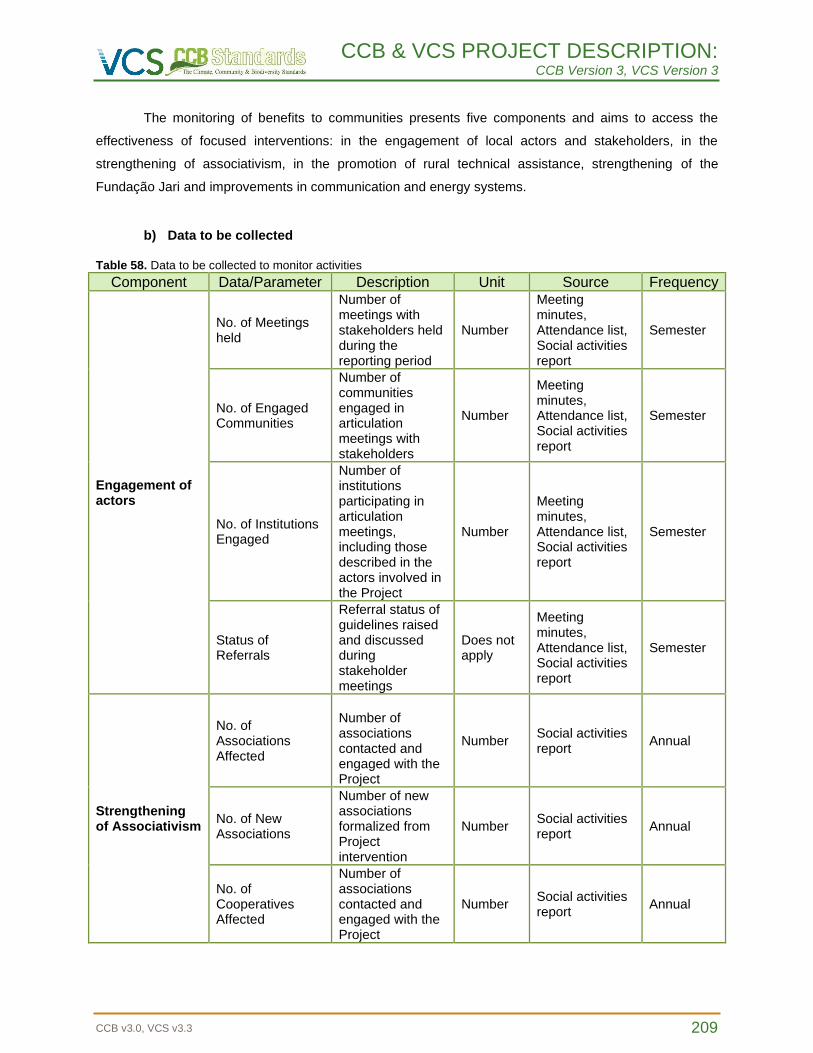
CCB & VCS PROJECT DESCRIPTION: CCB Version 3, VCS Version 3
CCB v3.0, VCS v3.3 209
The monitoring of benefits to communities presents five components and aims to access the
effectiveness of focused interventions: in the engagement of local actors and stakeholders, in the
strengthening of associativism, in the promotion of rural technical assistance, strengthening of the
Fundação Jari and improvements in communication and energy systems.
b) Data to be collected
Table 58. Data to be collected to monitor activities
Component Data/Parameter Description Unit Source Frequency
Engagement of actors
No. of Meetings held
Number of meetings with stakeholders held during the reporting period
Number
Meeting minutes, Attendance list, Social activities report
Semester
No. of Engaged Communities
Number of communities engaged in articulation meetings with stakeholders
Number
Meeting minutes, Attendance list, Social activities report
Semester
No. of Institutions Engaged
Number of institutions participating in articulation meetings, including those described in the actors involved in the Project
Number
Meeting minutes, Attendance list, Social activities report
Semester
Status of Referrals
Referral status of guidelines raised and discussed during stakeholder meetings
Does not apply
Meeting minutes, Attendance list, Social activities report
Semester
Strengthening of Associativism
No. of Associations Affected
Number of associations contacted and engaged with the Project
Number Social activities report
Annual
No. of New Associations
Number of new associations formalized from Project intervention
Number Social activities report
Annual
No. of Cooperatives Affected
Number of associations contacted and engaged with the Project
Number Social activities report
Annual
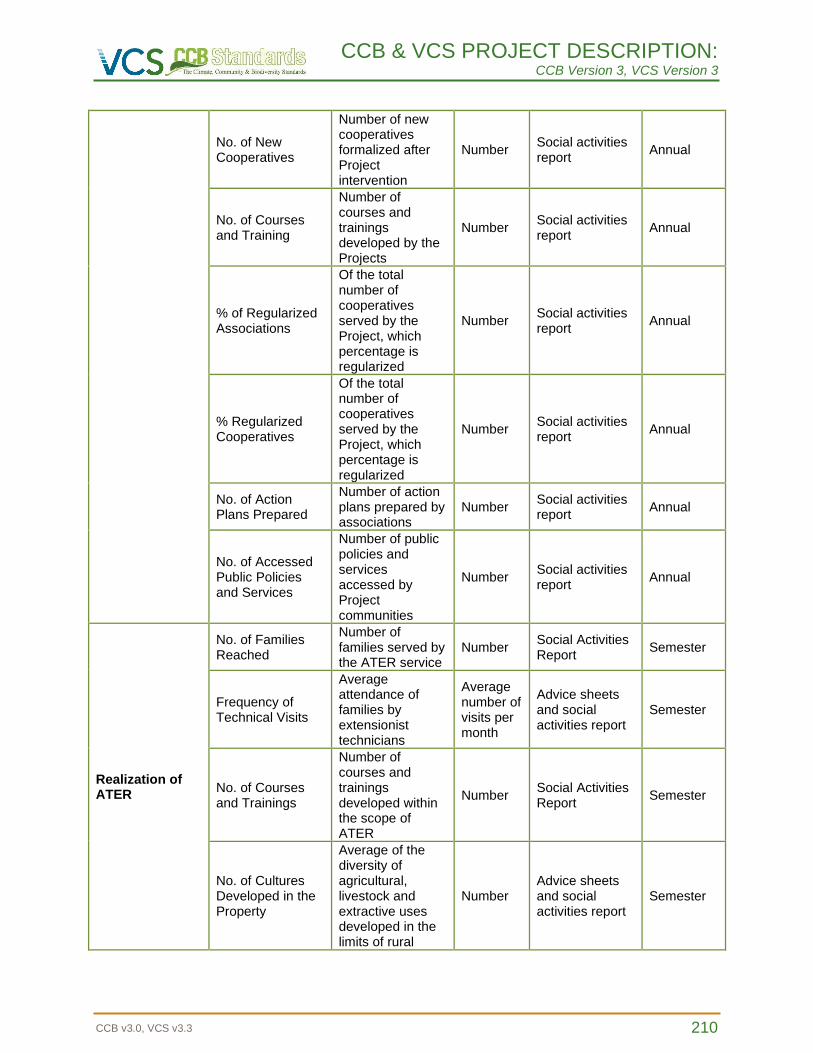
CCB & VCS PROJECT DESCRIPTION: CCB Version 3, VCS Version 3
CCB v3.0, VCS v3.3 210
No. of New Cooperatives
Number of new cooperatives formalized after Project intervention
Number Social activities report
Annual
No. of Courses and Training
Number of courses and trainings developed by the Projects
Number Social activities report
Annual
% of Regularized Associations
Of the total number of cooperatives served by the Project, which percentage is regularized
Number Social activities report
Annual
% Regularized Cooperatives
Of the total number of cooperatives served by the Project, which percentage is regularized
Number Social activities report
Annual
No. of Action Plans Prepared
Number of action plans prepared by associations
Number Social activities report
Annual
No. of Accessed Public Policies and Services
Number of public policies and services accessed by Project communities
Number Social activities report
Annual
Realization of ATER
No. of Families Reached
Number of families served by the ATER service
Number Social Activities Report
Semester
Frequency of Technical Visits
Average attendance of families by extensionist technicians
Average number of visits per month
Advice sheets and social activities report
Semester
No. of Courses and Trainings
Number of courses and trainings developed within the scope of ATER
Number Social Activities Report
Semester
No. of Cultures Developed in the Property
Average of the diversity of agricultural, livestock and extractive uses developed in the limits of rural
Number Advice sheets and social activities report
Semester
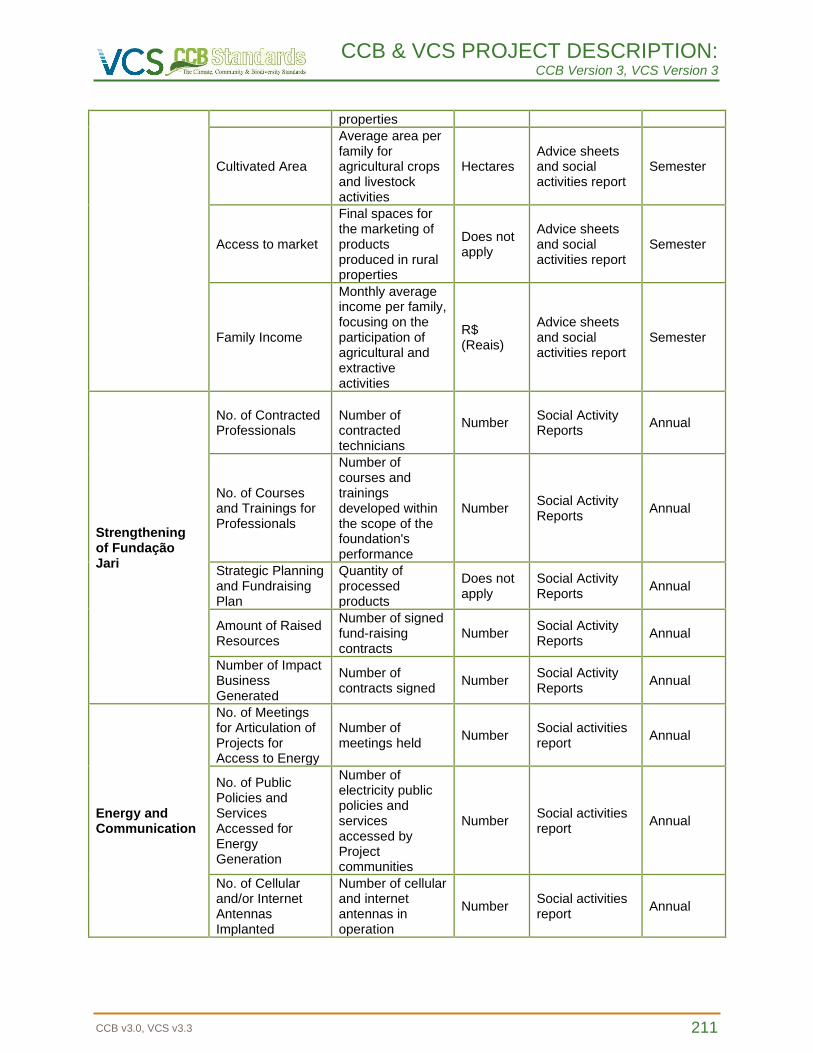
CCB & VCS PROJECT DESCRIPTION: CCB Version 3, VCS Version 3
CCB v3.0, VCS v3.3 211
properties
Cultivated Area
Average area per family for agricultural crops and livestock activities
Hectares Advice sheets and social activities report
Semester
Access to market
Final spaces for the marketing of products produced in rural properties
Does not apply
Advice sheets and social activities report
Semester
Family Income
Monthly average income per family, focusing on the participation of agricultural and extractive activities
R$ (Reais)
Advice sheets and social activities report
Semester
Strengthening of Fundação Jari
No. of Contracted Professionals
Number of contracted technicians
Number Social Activity Reports
Annual
No. of Courses and Trainings for Professionals
Number of courses and trainings developed within the scope of the foundation's performance
Number Social Activity Reports
Annual
Strategic Planning and Fundraising Plan
Quantity of processed products
Does not apply
Social Activity Reports
Annual
Amount of Raised Resources
Number of signed fund-raising contracts
Number Social Activity Reports
Annual
Number of Impact Business Generated
Number of contracts signed
Number Social Activity Reports
Annual
Energy and Communication
No. of Meetings for Articulation of Projects for Access to Energy
Number of meetings held
Number Social activities report
Annual
No. of Public Policies and Services Accessed for Energy Generation
Number of electricity public policies and services accessed by Project communities
Number Social activities report
Annual
No. of Cellular and/or Internet Antennas Implanted
Number of cellular and internet antennas in operation
Number Social activities report
Annual
CCB & VCS PROJECT DESCRIPTION: CCB Version 3, VCS Version 3
CCB v3.0, VCS v3.3 212
c) Summary of the data collection procedure
The data will be collected during and after the activities with stakeholders and/or through specific
interviews. This information will be systematized and presented through reports of social activities of the
Project, every six months.
d) Quality control and assurance procedures
The data collected and portrayed in the reports will be presented and validated during the
technical chamber meetings, for which the affected producers, associations and cooperatives will be
invited to participate as members throughout the project life cycle.
e) Data filing
All data and reports produced by the Jari/Pará REDD+ Project will be stored by Biofílica
Investimentos Ambientais through digital archives during the Project life cycle. Original (physical) reports,
meeting minutes and field records produced will be stored by the Fundação Jari in the execution of social
activities. Biofílica Investimentos Ambientais will maintain a copy of these documents in digital format
throughout the Project. All documents related to the monitoring of the Jari/Pará REDD+ Project will be
gathered in physical and/or virtual archives and made available to the verification body in each verification
event.
f) Organization and responsibilities of the parties involved in the above
All monitoring activities are the responsibility of Biofílica Investimentos Ambientais and the
Fundação Jari in the execution of social activities.
3.3.6 Monitoring Plan on Biodiversity Impacts
The biodiversity-related monitoring plan aims at implementing the assessment of the local
community of flora and fauna in the face of management practices and forest integrity. For the flora, the
monitoring plan includes the remeasurement of permanent plots with a frequency of 5 years, in order to
evaluate the forest dynamics (recruitment rates, mortality, species substitution) and variations in the
carbon stock. For the fauna, it is planned to implant two annual campaigns, one per semester so that
seasonal variations, such as the presence of migratory species and reproductive periods, are considered.
Regarding the HCVA’s, the verification of the adopted measures effectiveness to maintain and improve
them is already incorporated within the described tasks.
a) Technical description of monitoring tasks
Data and parameters to be collected are in section 3.3.2 – Data and Parameters Monitored of this
document.
CCB & VCS PROJECT DESCRIPTION: CCB Version 3, VCS Version 3
CCB v3.0, VCS v3.3 213
b) Data to be collected
An annual monitoring will be carried out for the parameters related to the impacts of the Project
activities. The parameters associated to the survey of fauna will be collected at least twice a year
(summer and winter). This information will be systematized and presented through fauna monitoring
reports related to a monitoring year, previous to each verification event.
During the studies will be collected the data of the relevant species. This information will be
systematized and presented through fauna monitoring reports related to a monitoring year, previous to
each verification event.
c) Quality control and assurance procedure
The quality control procedures associated with data collection will depend on the internal procedures of
the organization responsible for the field surveys of each study.
The surveys based on ethnozoology will be presented and validated during meetings with stakeholders,
from which surrounding communities will be invited to participate as members throughout the project life cycle.
d) Data filing
All data and reports produced by the Jari/Pará REDD+ Project will be stored by Biofílica Investimentos
Ambientais through digital archives during the Project life cycle. Original (physical) reports and field records
produced will be stored by the organizations responsible for the field surveys and/or the Grupo Jari. Biofílica will
keep a copy of these documents in digital format throughout the Project. All documents relating to Project
monitoring will be gathered in physical and/or virtual archives and made available to the verification body at each
verification event.
e) Organization and responsibilities of the parties involved in the above
All monitoring activities are the responsibility of Biofílica Investimentos Ambientais, of the collaborating
organizations in biodiversity studies and of the teaching and research institution to participate.
3.3.7 Dissemination of Monitoring Plan and Results (CL4.2)
It will be through the website of Biofílica Investimentos Ambientais that the monitoring plan, as well as its
results obtained will be available to the public. Statements of relevant and summary information addressed to
communities and stakeholders will be transmitted through the REDD+ Technical Chamber and visits by
Foundation technicians to rural communities.
3.4 Optional Criterion: Climate Change Adaptation Benefits
Does not apply. This project is not intended to be validated for the Gold Level of this section.
CCB & VCS PROJECT DESCRIPTION: CCB Version 3, VCS Version 3
CCB v3.0, VCS v3.3 214
3.4.1 Regional Climate Change Scenarios (GL1.1)
Does not apply.
3.4.2 Climate Change Impacts (GL1.2)
Does not apply.
3.4.3 Measures Needed and Designed for Adaptation (GL1.3)
Does not apply.
4 COMMUNITY
4.1 Without-Project Community Scenario
4.1.1 Descriptions of Communities at Project Start (CM1.1)
Historical social transformations in the territory
The occupation of the Jari Valley can be defined by several different moments. The first is related to the
indigenous occupation by various ethnic groups, such as Waiãpi, Aparaí, Wayana, Tiriyós, Katxuayana, Karanã,
Kastumi (the last two are already extinct), among others. These people who lived in the region practiced hunting,
fishing and the use of forest resources as a survival mechanism.
The European occupation of the municipality of Almeirim (PA), municipality of the communities involved
in the Project, began between 1634 and 1637, when the Captaincy of the North Cape was granted to Bento
Maciel Parente (MORAES & MORAES, 2000). It has two different versions. The first indicates as a historical
landmark the construction of a fort by the Dutch in a village called Paru and the second attributes the origin of the
municipality to the Capuchin Friars of Santo Antônio who built the village of Paru as a catechesis area for the
Indians of the region (IBGE, 2005; SEPOF, 2008). In 1758, the village acquired category of Town, being called
Almeirim. However, in the time of Independence, it became extinct.
As reported in the Environmental-Economic Diagnosis of the municipality of Almeirim-Pará (IFT, 2010),
in 1985, Almeirim was the scene of the Cabanagem movement, being invaded and almost totally destroyed. With
the advent of the Republic, in 1890, it regained the category of Town and in the same year it gained the one of
Municipality. However, in 1930, the municipality was extinguished, being its territory annexed to Prainha, but
returning the old position in the same year (UFPA, 2008). According to the territorial division of the State of Pará,
in 1936, Almeirim was presented subdivided into four districts: Almeirim, Boca do Braço, Santana do Cajari and
Santo Antônio do Caracuru. In the administrative formation of Almeirim, since 1983, through State Law No. 5075,
of May 2, the district of Monte Dourado was created and annexed to the municipality of Almeirim, thus being in
CCB & VCS PROJECT DESCRIPTION: CCB Version 3, VCS Version 3
CCB v3.0, VCS v3.3 215
territorial division dated 18/08/1988, the municipality is made up of 3 districts: Almeirim, Arumanduba and Monte
Dourado, remaining in this way since that date (IBGE, 2005; SEPOF, 2008).
The cultural manifestations of the municipality are characterized mainly by the performance of religious
festivities in honor of several saints, most notably the feast of the saint patroness of the city, Nossa Senhora da
Conceição, held in December, and of São Benedito, held in June. The two events are practiced by the society of
Almeirim with great devotion, with the execution of novenas, procession and camp feasts (SEPOF, 2008). Also
outstanding are the dança do gambá (possum dance), carried out by the Castro family for more than 100 years,
which are remnants of quilombos residents in the municipality. In addition, the municipality stands out regionally
as musical, artistic and football crib. Every year, in August, the Art and Culture Fair of Almeirim – FEARCA is
held, being the largest party in the city, attracting thousands of visitors from all over the region. Two other
important dates are the birthdays of the district of Monte Dourado and the municipality of Almeirim. (IFT, 2010)
The agricultural and extractive culture is well preserved, and the second is more representative,
highlighting the historical and cultural relationship, for mastery and appropriation of knowledge on ecosystems
and low-impact activities on the environment. In this way, although Almeirim's society yearns for the change in
the local scenario for development, it is in favor of maintaining the reproduction of historical social traditions. In
this context, the rural communities maintain the tradition of important events, which are the festivals of Brazil nut,
golden bream, shrimp and acarí. (IFT, 2010).
Contemporary features of the territory
Currently, according to estimates published in the Official Gazette of the Union, the population living in
2014 in the municipality of Almeirim is 33,466 (thirty-three thousand, four hundred and sixty-six) inhabitants,
maintaining between 1991 and 2014 a population between 30,000 and 34,000 inhabitants. The municipality has
an area of 72,960 km² (IBGE, 2011) and is located in the physiographic zone of the Lower Amazon. Despite an
increase in the urbanization rate in the municipality between 2000 and 2010, from 55.7% to 59.4%, the rural
population is still quite significant, accounting for 40.6% in the 2010 IBGE demographic census (Figure 41).
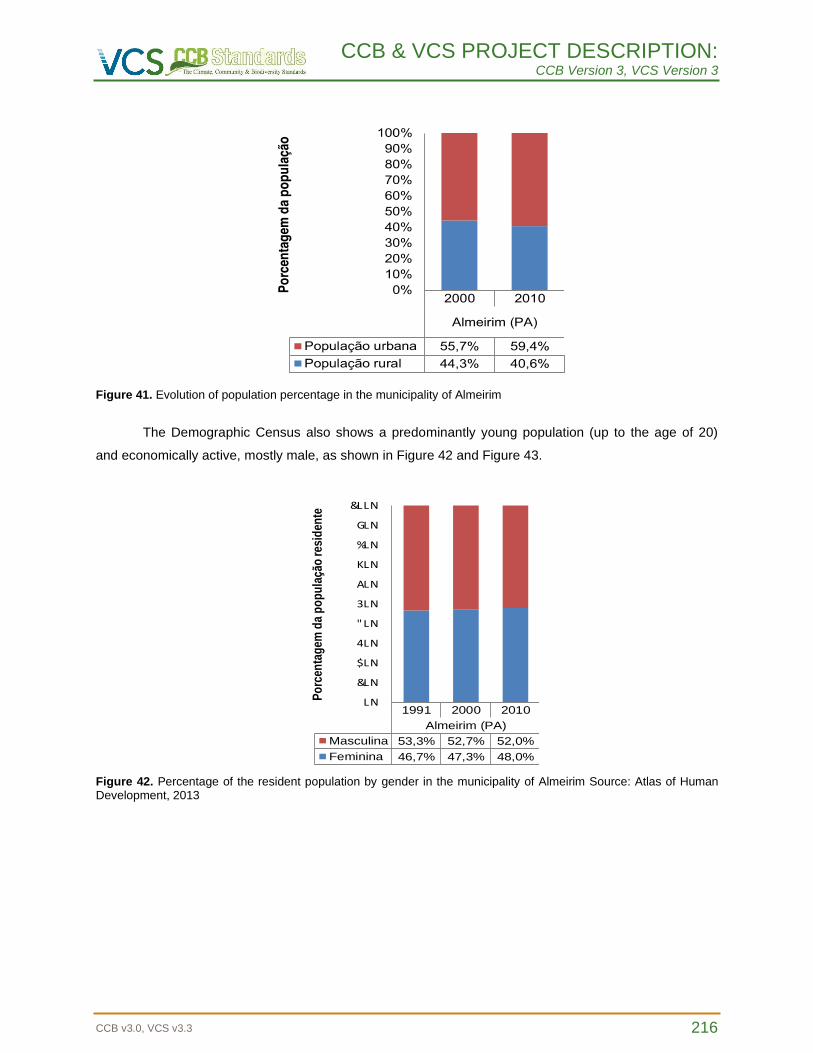
CCB & VCS PROJECT DESCRIPTION: CCB Version 3, VCS Version 3
CCB v3.0, VCS v3.3 216
Figure 41. Evolution of population percentage in the municipality of Almeirim
The Demographic Census also shows a predominantly young population (up to the age of 20)
and economically active, mostly male, as shown in Figure 42 and Figure 43.
Contextualização Regional e Plano de Trabalho Módulo Socioeconomia Projeto REDD+ Jari-Pará
Casa da Floresta Assessoria Ambiental Ltda. 19
Figura 5. Porcentagem da população residente por gênero. Fonte: Atlas do Desenvolvimento Humano, 2013.
1991 2000 2010 1991 2000 2010 1991 2000 2010
Almeirim (PA) Laranjal do Jari (AP) Vitória do Jari (AP)
Masculina 53,3% 52,7% 52,0% 51,7% 51,5% 51,2% 50,9% 51,5% 51,7%
Feminina 46,7% 47,3% 48,0% 48,3% 48,5% 48,8% 49,1% 48,5% 48,3%
LN
&LN
$LN
4LN
"LN
3LN
ALN
KLN
%LN
GLN
&LLN
Po
rcen
tag
em d
a p
op
ula
ção
res
iden
te
Figure 42. Percentage of the resident population by gender in the municipality of Almeirim Source: Atlas of Human Development, 2013
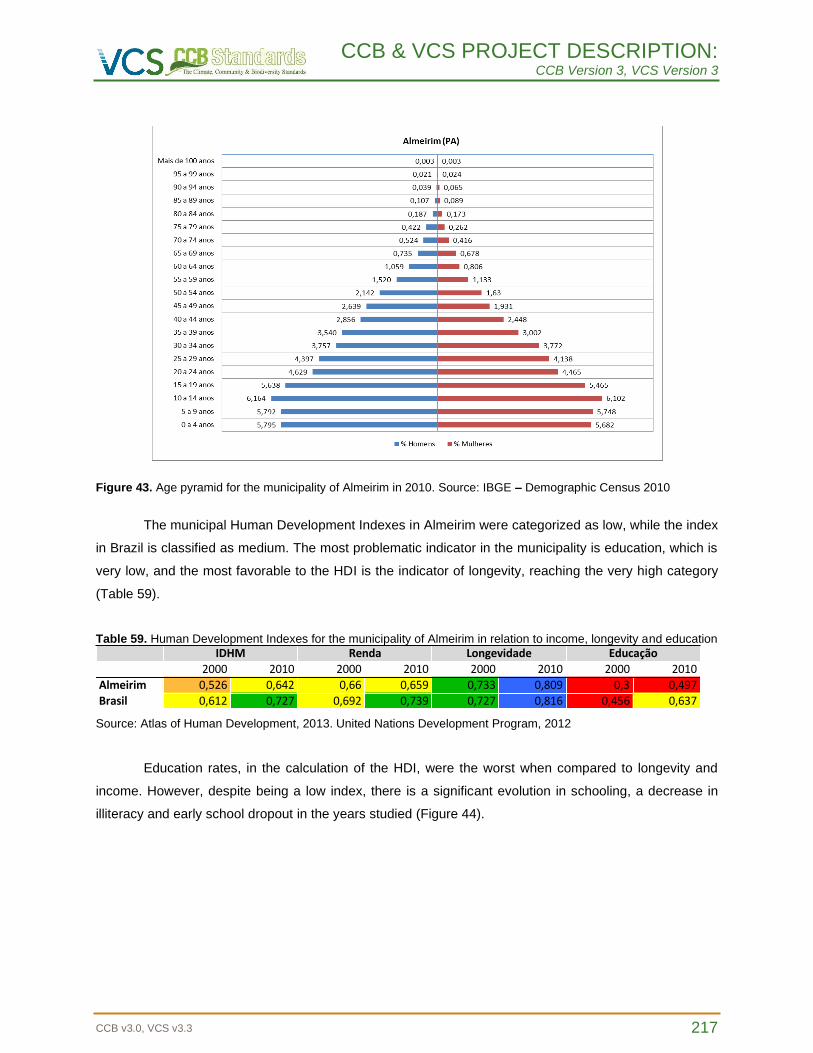
CCB & VCS PROJECT DESCRIPTION: CCB Version 3, VCS Version 3
CCB v3.0, VCS v3.3 217
Contextualização Regional e Plano de Trabalho Módulo Socioeconomia Projeto REDD+ Jari-Pará
Casa da Floresta Assessoria Ambiental Ltda. 19
Figura 5. Porcentagem da população residente por gênero. Fonte: Atlas do Desenvolvimento Humano, 2013.
1991 2000 2010 1991 2000 2010 1991 2000 2010
Almeirim (PA) Laranjal do Jari (AP) Vitória do Jari (AP)
Masculina 53,3% 52,7% 52,0% 51,7% 51,5% 51,2% 50,9% 51,5% 51,7%
Feminina 46,7% 47,3% 48,0% 48,3% 48,5% 48,8% 49,1% 48,5% 48,3%
LN
&LN
$LN
4LN
"LN
3LN
ALN
KLN
%LN
GLN
&LLN
Po
rcen
tag
em
da p
op
ula
ção
resid
en
te
Figure 43. Age pyramid for the municipality of Almeirim in 2010. Source: IBGE – Demographic Census 2010
The municipal Human Development Indexes in Almeirim were categorized as low, while the index
in Brazil is classified as medium. The most problematic indicator in the municipality is education, which is
very low, and the most favorable to the HDI is the indicator of longevity, reaching the very high category
(Table 59).
Table 59. Human Development Indexes for the municipality of Almeirim in relation to income, longevity and education
2000 2010 2000 2010 2000 2010 2000 2010Almeirim 0,526 0,642 0,66 0,659 0,733 0,809 0,3 0,497Brasil 0,612 0,727 0,692 0,739 0,727 0,816 0,456 0,637
IDHM Renda Longevidade Educação
Source: Atlas of Human Development, 2013. United Nations Development Program, 2012
Education rates, in the calculation of the HDI, were the worst when compared to longevity and
income. However, despite being a low index, there is a significant evolution in schooling, a decrease in
illiteracy and early school dropout in the years studied (Figure 44).
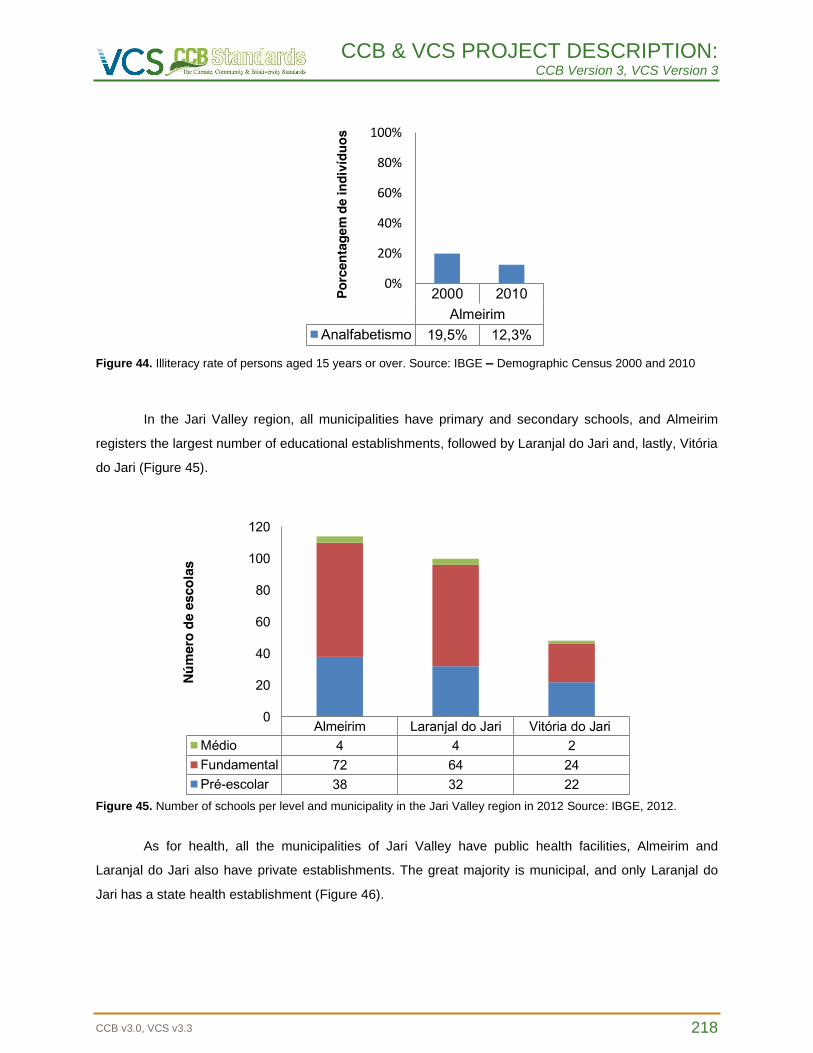
CCB & VCS PROJECT DESCRIPTION: CCB Version 3, VCS Version 3
CCB v3.0, VCS v3.3 218
Figure 44. Illiteracy rate of persons aged 15 years or over. Source: IBGE – Demographic Census 2000 and 2010
In the Jari Valley region, all municipalities have primary and secondary schools, and Almeirim
registers the largest number of educational establishments, followed by Laranjal do Jari and, lastly, Vitória
do Jari (Figure 45).
Figure 45. Number of schools per level and municipality in the Jari Valley region in 2012 Source: IBGE, 2012.
As for health, all the municipalities of Jari Valley have public health facilities, Almeirim and
Laranjal do Jari also have private establishments. The great majority is municipal, and only Laranjal do
Jari has a state health establishment (Figure 46).
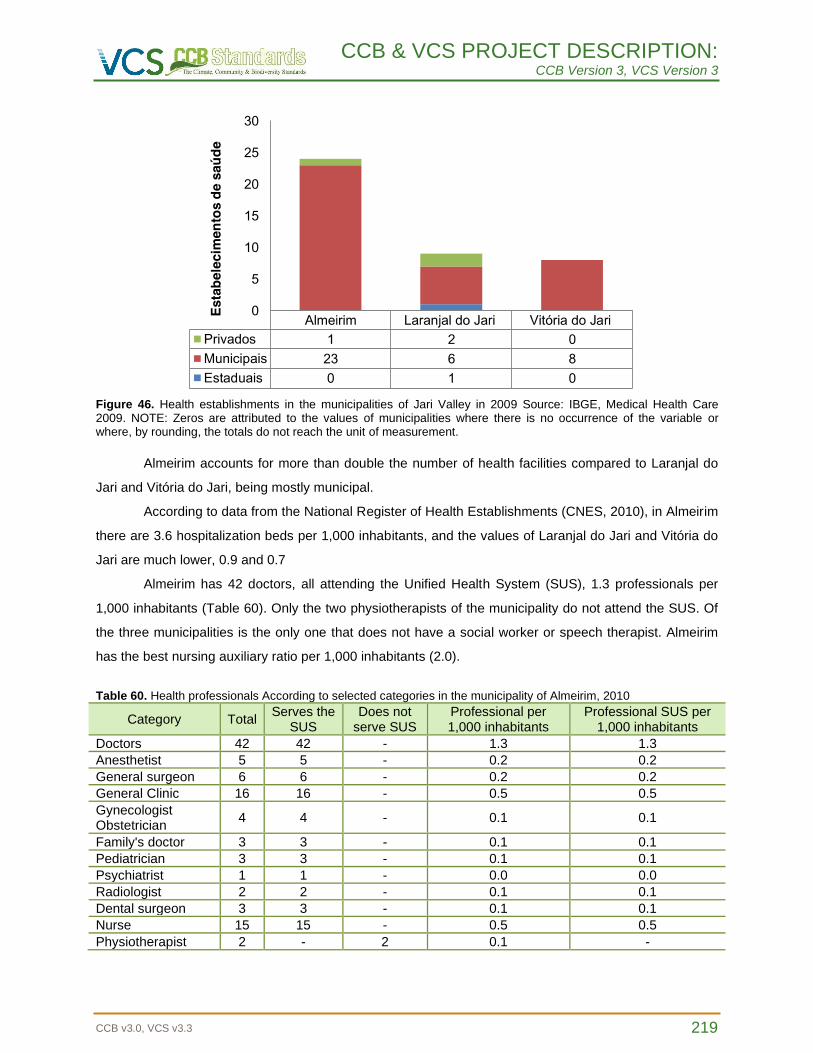
CCB & VCS PROJECT DESCRIPTION: CCB Version 3, VCS Version 3
CCB v3.0, VCS v3.3 219
Figure 46. Health establishments in the municipalities of Jari Valley in 2009 Source: IBGE, Medical Health Care 2009. NOTE: Zeros are attributed to the values of municipalities where there is no occurrence of the variable or where, by rounding, the totals do not reach the unit of measurement.
Almeirim accounts for more than double the number of health facilities compared to Laranjal do
Jari and Vitória do Jari, being mostly municipal.
According to data from the National Register of Health Establishments (CNES, 2010), in Almeirim
there are 3.6 hospitalization beds per 1,000 inhabitants, and the values of Laranjal do Jari and Vitória do
Jari are much lower, 0.9 and 0.7
Almeirim has 42 doctors, all attending the Unified Health System (SUS), 1.3 professionals per
1,000 inhabitants (Table 60). Only the two physiotherapists of the municipality do not attend the SUS. Of
the three municipalities is the only one that does not have a social worker or speech therapist. Almeirim
has the best nursing auxiliary ratio per 1,000 inhabitants (2.0).
Table 60. Health professionals According to selected categories in the municipality of Almeirim, 2010
Category Total Serves the
SUS Does not
serve SUS Professional per 1,000 inhabitants
Professional SUS per 1,000 inhabitants
Doctors 42 42 - 1.3 1.3
Anesthetist 5 5 - 0.2 0.2
General surgeon 6 6 - 0.2 0.2
General Clinic 16 16 - 0.5 0.5
Gynecologist Obstetrician
4 4 - 0.1 0.1
Family's doctor 3 3 - 0.1 0.1
Pediatrician 3 3 - 0.1 0.1
Psychiatrist 1 1 - 0.0 0.0
Radiologist 2 2 - 0.1 0.1
Dental surgeon 3 3 - 0.1 0.1
Nurse 15 15 - 0.5 0.5
Physiotherapist 2 - 2 0.1 -
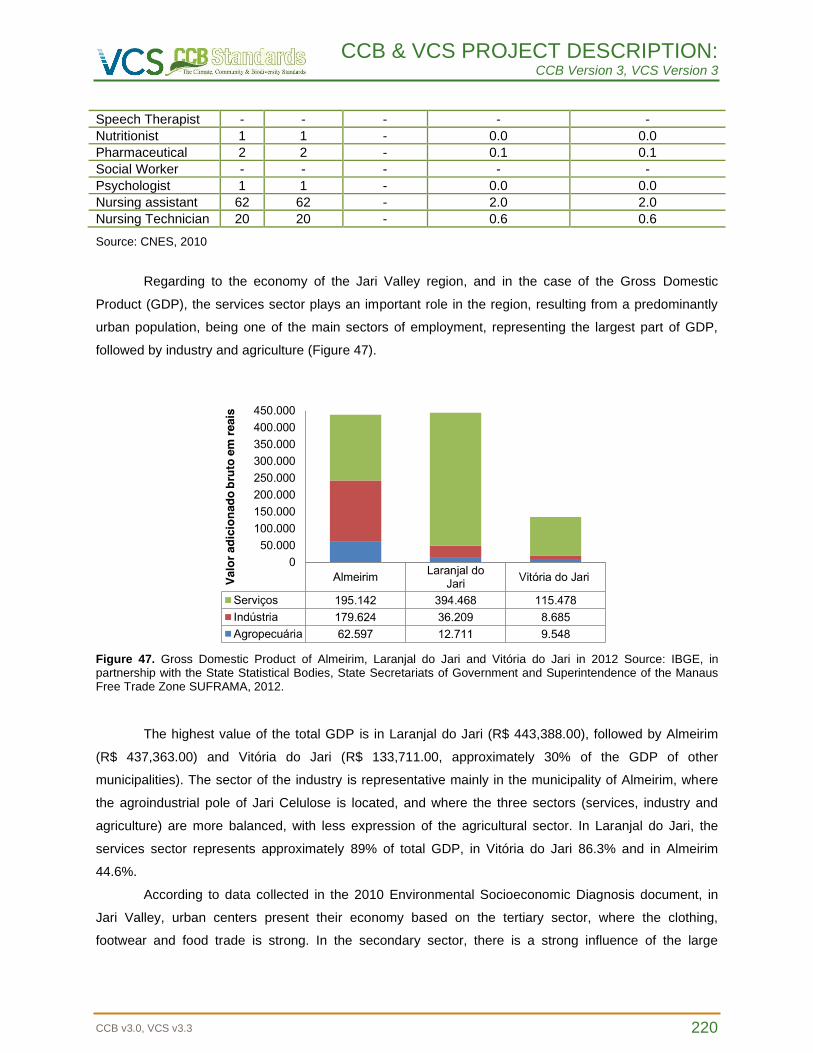
CCB & VCS PROJECT DESCRIPTION: CCB Version 3, VCS Version 3
CCB v3.0, VCS v3.3 220
Speech Therapist - - - - -
Nutritionist 1 1 - 0.0 0.0
Pharmaceutical 2 2 - 0.1 0.1
Social Worker - - - - -
Psychologist 1 1 - 0.0 0.0
Nursing assistant 62 62 - 2.0 2.0
Nursing Technician 20 20 - 0.6 0.6 Source: CNES, 2010
Regarding to the economy of the Jari Valley region, and in the case of the Gross Domestic
Product (GDP), the services sector plays an important role in the region, resulting from a predominantly
urban population, being one of the main sectors of employment, representing the largest part of GDP,
followed by industry and agriculture (Figure 47).
Figure 47. Gross Domestic Product of Almeirim, Laranjal do Jari and Vitória do Jari in 2012 Source: IBGE, in partnership with the State Statistical Bodies, State Secretariats of Government and Superintendence of the Manaus Free Trade Zone SUFRAMA, 2012.
The highest value of the total GDP is in Laranjal do Jari (R$ 443,388.00), followed by Almeirim
(R$ 437,363.00) and Vitória do Jari (R$ 133,711.00, approximately 30% of the GDP of other
municipalities). The sector of the industry is representative mainly in the municipality of Almeirim, where
the agroindustrial pole of Jari Celulose is located, and where the three sectors (services, industry and
agriculture) are more balanced, with less expression of the agricultural sector. In Laranjal do Jari, the
services sector represents approximately 89% of total GDP, in Vitória do Jari 86.3% and in Almeirim
44.6%.
According to data collected in the 2010 Environmental Socioeconomic Diagnosis document, in
Jari Valley, urban centers present their economy based on the tertiary sector, where the clothing,
footwear and food trade is strong. In the secondary sector, there is a strong influence of the large
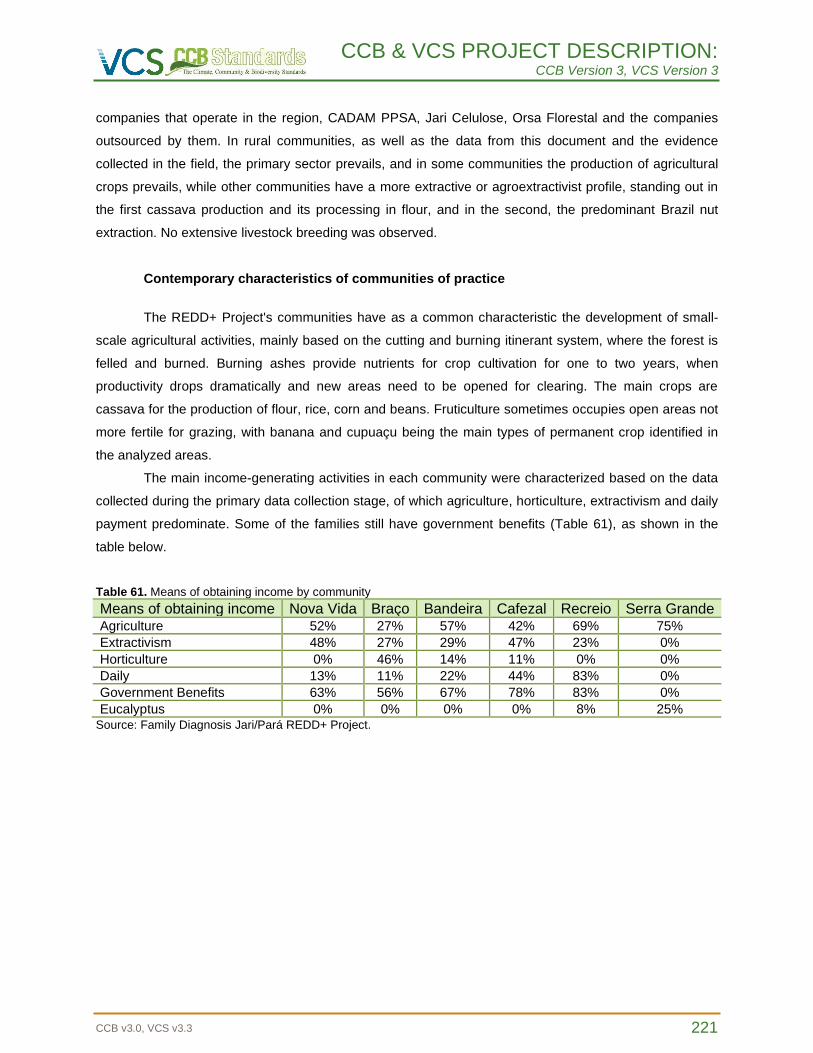
CCB & VCS PROJECT DESCRIPTION: CCB Version 3, VCS Version 3
CCB v3.0, VCS v3.3 221
companies that operate in the region, CADAM PPSA, Jari Celulose, Orsa Florestal and the companies
outsourced by them. In rural communities, as well as the data from this document and the evidence
collected in the field, the primary sector prevails, and in some communities the production of agricultural
crops prevails, while other communities have a more extractive or agroextractivist profile, standing out in
the first cassava production and its processing in flour, and in the second, the predominant Brazil nut
extraction. No extensive livestock breeding was observed.
Contemporary characteristics of communities of practice
The REDD+ Project's communities have as a common characteristic the development of small-
scale agricultural activities, mainly based on the cutting and burning itinerant system, where the forest is
felled and burned. Burning ashes provide nutrients for crop cultivation for one to two years, when
productivity drops dramatically and new areas need to be opened for clearing. The main crops are
cassava for the production of flour, rice, corn and beans. Fruticulture sometimes occupies open areas not
more fertile for grazing, with banana and cupuaçu being the main types of permanent crop identified in
the analyzed areas.
The main income-generating activities in each community were characterized based on the data
collected during the primary data collection stage, of which agriculture, horticulture, extractivism and daily
payment predominate. Some of the families still have government benefits (Table 61), as shown in the
table below.
Table 61. Means of obtaining income by community
Means of obtaining income Nova Vida Braço Bandeira Cafezal Recreio Serra Grande Agriculture 52% 27% 57% 42% 69% 75%
Extractivism 48% 27% 29% 47% 23% 0%
Horticulture 0% 46% 14% 11% 0% 0%
Daily 13% 11% 22% 44% 83% 0%
Government Benefits 63% 56% 67% 78% 83% 0%
Eucalyptus 0% 0% 0% 0% 8% 25% Source: Family Diagnosis Jari/Pará REDD+ Project.
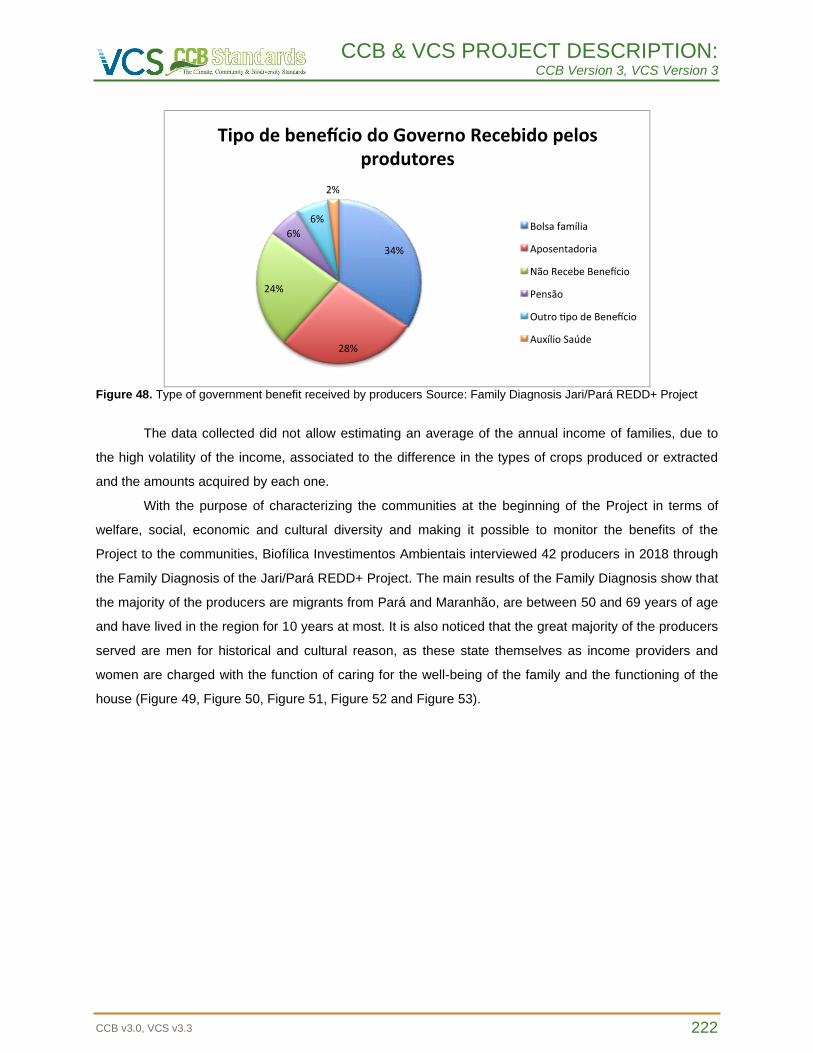
CCB & VCS PROJECT DESCRIPTION: CCB Version 3, VCS Version 3
CCB v3.0, VCS v3.3 222
34%
28%
24%
6%
6%
2%
Tipodebene ciodoGovernoRecebidopelosprodutores
Bolsafamília
Aposentadoria
NãoRecebeBene cio
Pensão
Outro podeBene cio
AuxílioSaúde
Figure 48. Type of government benefit received by producers Source: Family Diagnosis Jari/Pará REDD+ Project
The data collected did not allow estimating an average of the annual income of families, due to
the high volatility of the income, associated to the difference in the types of crops produced or extracted
and the amounts acquired by each one.
With the purpose of characterizing the communities at the beginning of the Project in terms of
welfare, social, economic and cultural diversity and making it possible to monitor the benefits of the
Project to the communities, Biofílica Investimentos Ambientais interviewed 42 producers in 2018 through
the Family Diagnosis of the Jari/Pará REDD+ Project. The main results of the Family Diagnosis show that
the majority of the producers are migrants from Pará and Maranhão, are between 50 and 69 years of age
and have lived in the region for 10 years at most. It is also noticed that the great majority of the producers
served are men for historical and cultural reason, as these state themselves as income providers and
women are charged with the function of caring for the well-being of the family and the functioning of the
house (Figure 49, Figure 50, Figure 51, Figure 52 and Figure 53).
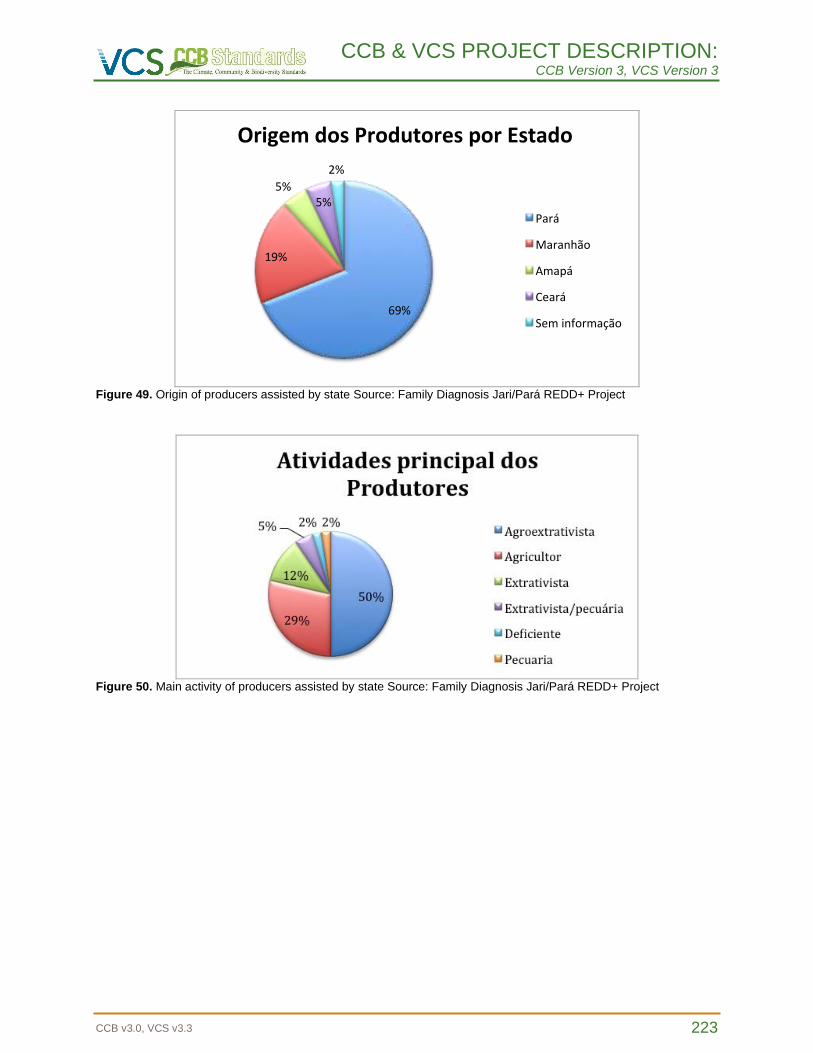
CCB & VCS PROJECT DESCRIPTION: CCB Version 3, VCS Version 3
CCB v3.0, VCS v3.3 223
69%
19%
5%5%
2%
OrigemdosProdutoresporEstado
Pará
Maranhão
Amapá
Ceará
Seminformação
Figure 49. Origin of producers assisted by state Source: Family Diagnosis Jari/Pará REDD+ Project
Figure 50. Main activity of producers assisted by state Source: Family Diagnosis Jari/Pará REDD+ Project
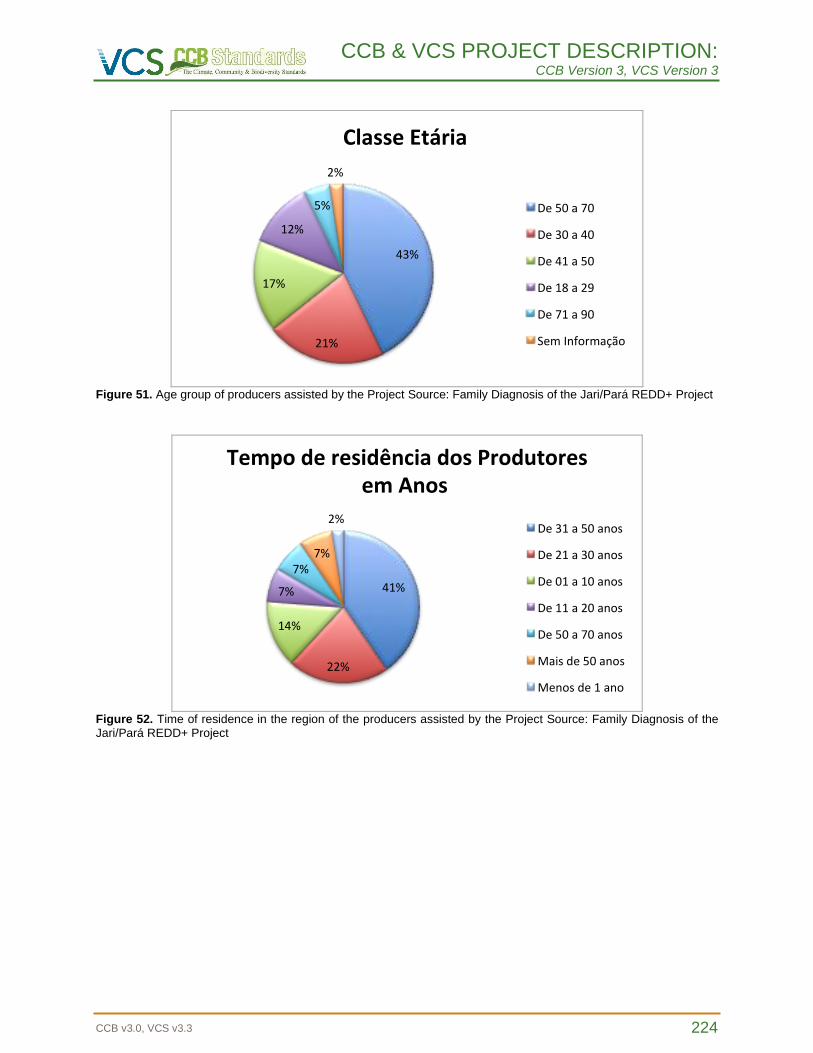
CCB & VCS PROJECT DESCRIPTION: CCB Version 3, VCS Version 3
CCB v3.0, VCS v3.3 224
43%
21%
17%
12%
5%
2%
ClasseEtária
De50a70
De30a40
De41a50
De18a29
De71a90
SemInformação
Figure 51. Age group of producers assisted by the Project Source: Family Diagnosis of the Jari/Pará REDD+ Project
41%
22%
14%
7%
7%7%
2%
TempoderesidênciadosProdutoresemAnos
De31a50anos
De21a30anos
De01a10anos
De11a20anos
De50a70anos
Maisde50anos
Menosde1ano
Figure 52. Time of residence in the region of the producers assisted by the Project Source: Family Diagnosis of the Jari/Pará REDD+ Project
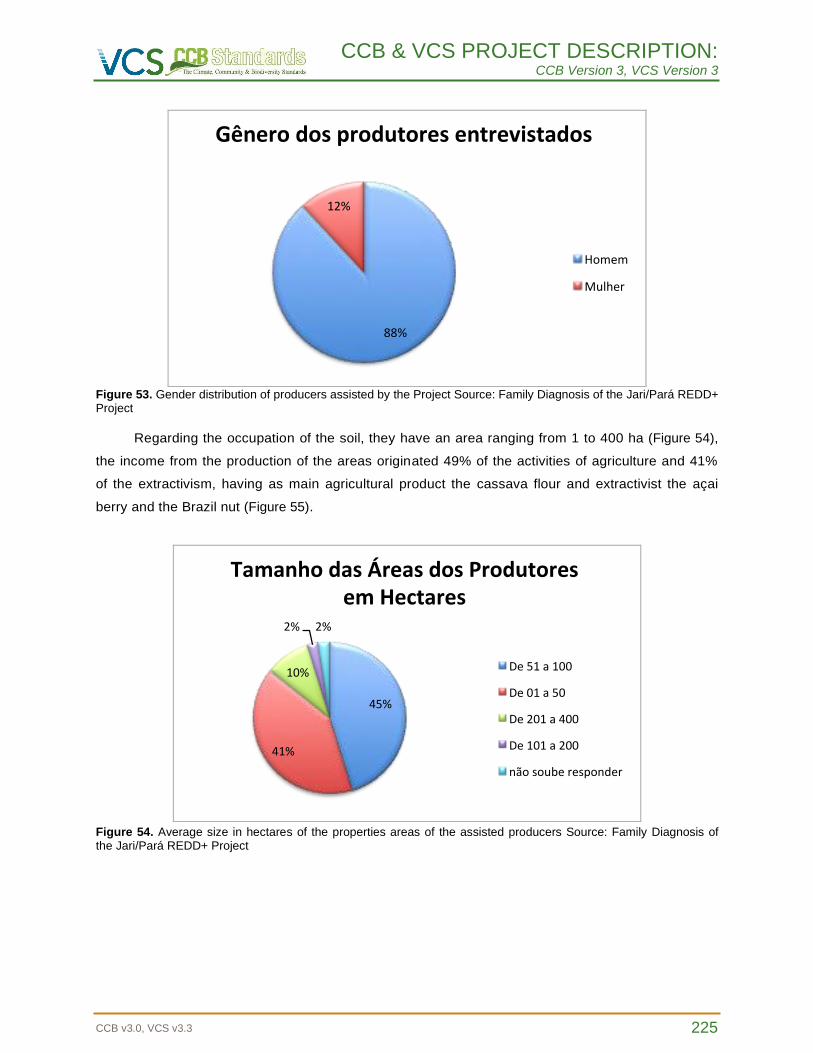
CCB & VCS PROJECT DESCRIPTION: CCB Version 3, VCS Version 3
CCB v3.0, VCS v3.3 225
88%
12%
Gênerodosprodutoresentrevistados
Homem
Mulher
Figure 53. Gender distribution of producers assisted by the Project Source: Family Diagnosis of the Jari/Pará REDD+ Project
Regarding the occupation of the soil, they have an area ranging from 1 to 400 ha (Figure 54),
the income from the production of the areas originated 49% of the activities of agriculture and 41%
of the extractivism, having as main agricultural product the cassava flour and extractivist the açai
berry and the Brazil nut (Figure 55).
45%
41%
10%
2% 2%
TamanhodasÁreasdosProdutoresemHectares
De51a100
De01a50
De201a400
De101a200
nãosouberesponder
Figure 54. Average size in hectares of the properties areas of the assisted producers Source: Family Diagnosis of the Jari/Pará REDD+ Project
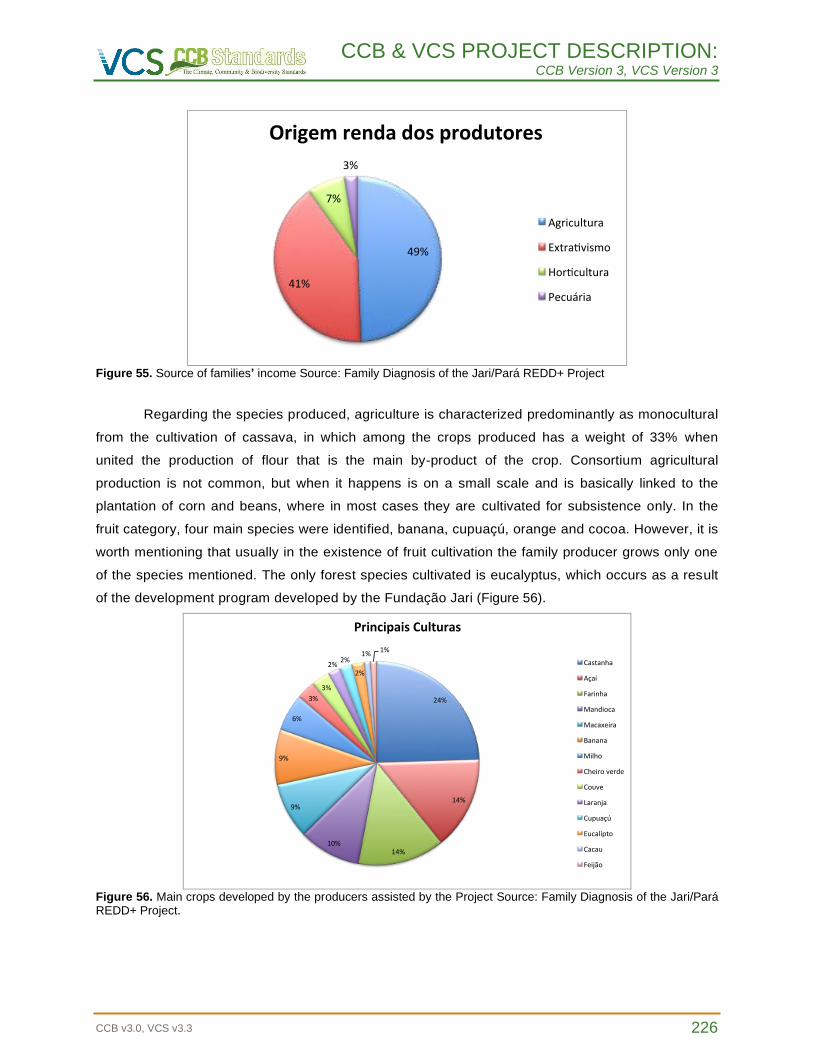
CCB & VCS PROJECT DESCRIPTION: CCB Version 3, VCS Version 3
CCB v3.0, VCS v3.3 226
49%
41%
7%
3%
Origemrendadosprodutores
Agricultura
Extra vismo
Hor cultura
Pecuária
Figure 55. Source of families’ income Source: Family Diagnosis of the Jari/Pará REDD+ Project
Regarding the species produced, agriculture is characterized predominantly as monocultural
from the cultivation of cassava, in which among the crops produced has a weight of 33% when
united the production of flour that is the main by-product of the crop. Consortium agricultural
production is not common, but when it happens is on a small scale and is basically linked to the
plantation of corn and beans, where in most cases they are cultivated for subsistence only. In the
fruit category, four main species were identified, banana, cupuaçú, orange and cocoa. However, it is
worth mentioning that usually in the existence of fruit cultivation the family producer grows only one
of the species mentioned. The only forest species cultivated is eucalyptus, which occurs as a result
of the development program developed by the Fundação Jari (Figure 56).
24%
14%
14%10%
9%
9%
6%
3%
3%
2%2%
2%
1%1%
PrincipaisCulturas
Castanha
Açaí
Farinha
Mandioca
Macaxeira
Banana
Milho
Cheiroverde
Couve
Laranja
Cupuaçú
Eucalipto
Cacau
Feijão
Figure 56. Main crops developed by the producers assisted by the Project Source: Family Diagnosis of the Jari/Pará REDD+ Project.
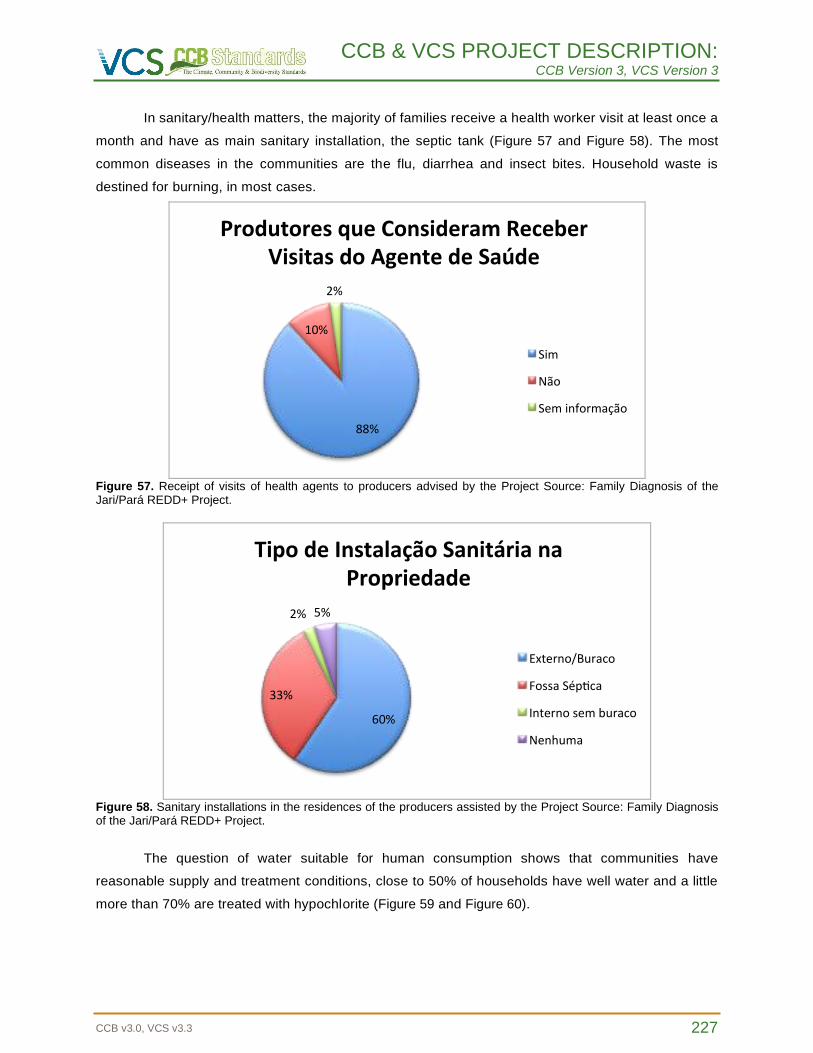
CCB & VCS PROJECT DESCRIPTION: CCB Version 3, VCS Version 3
CCB v3.0, VCS v3.3 227
In sanitary/health matters, the majority of families receive a health worker visit at least once a
month and have as main sanitary installation, the septic tank (Figure 57 and Figure 58). The most
common diseases in the communities are the flu, diarrhea and insect bites. Household waste is
destined for burning, in most cases.
88%
10%
2%
ProdutoresqueConsideramReceberVisitasdoAgentedeSaúde
Sim
Não
Seminformação
Figure 57. Receipt of visits of health agents to producers advised by the Project Source: Family Diagnosis of the Jari/Pará REDD+ Project.
60%
33%
2%5%
TipodeInstalaçãoSanitárianaPropriedade
Externo/Buraco
FossaSép ca
Internosemburaco
Nenhuma
Figure 58. Sanitary installations in the residences of the producers assisted by the Project Source: Family Diagnosis of the Jari/Pará REDD+ Project.
The question of water suitable for human consumption shows that communities have
reasonable supply and treatment conditions, close to 50% of households have well water and a little
more than 70% are treated with hypochlorite (Figure 59 and Figure 60).
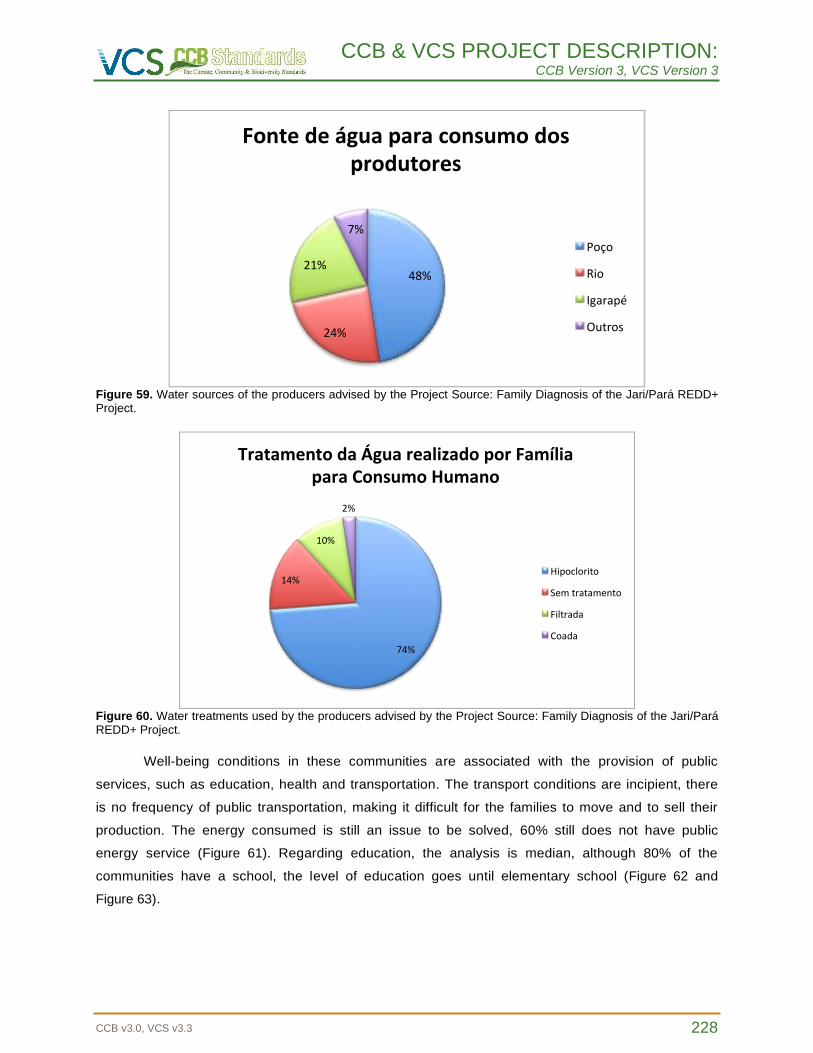
CCB & VCS PROJECT DESCRIPTION: CCB Version 3, VCS Version 3
CCB v3.0, VCS v3.3 228
48%
24%
21%
7%
Fontedeáguaparaconsumodosprodutores
Poço
Rio
Igarapé
Outros
Figure 59. Water sources of the producers advised by the Project Source: Family Diagnosis of the Jari/Pará REDD+ Project.
74%
14%
10%
2%
TratamentodaÁguarealizadoporFamíliaparaConsumoHumano
Hipoclorito
Semtratamento
Filtrada
Coada
Figure 60. Water treatments used by the producers advised by the Project Source: Family Diagnosis of the Jari/Pará REDD+ Project.
Well-being conditions in these communities are associated with the provision of public
services, such as education, health and transportation. The transport conditions are incipient, there
is no frequency of public transportation, making it difficult for the families to move and to sell their
production. The energy consumed is still an issue to be solved, 60% still does not have public
energy service (Figure 61). Regarding education, the analysis is median, although 80% of the
communities have a school, the level of education goes until elementary school (Figure 62 and
Figure 63).
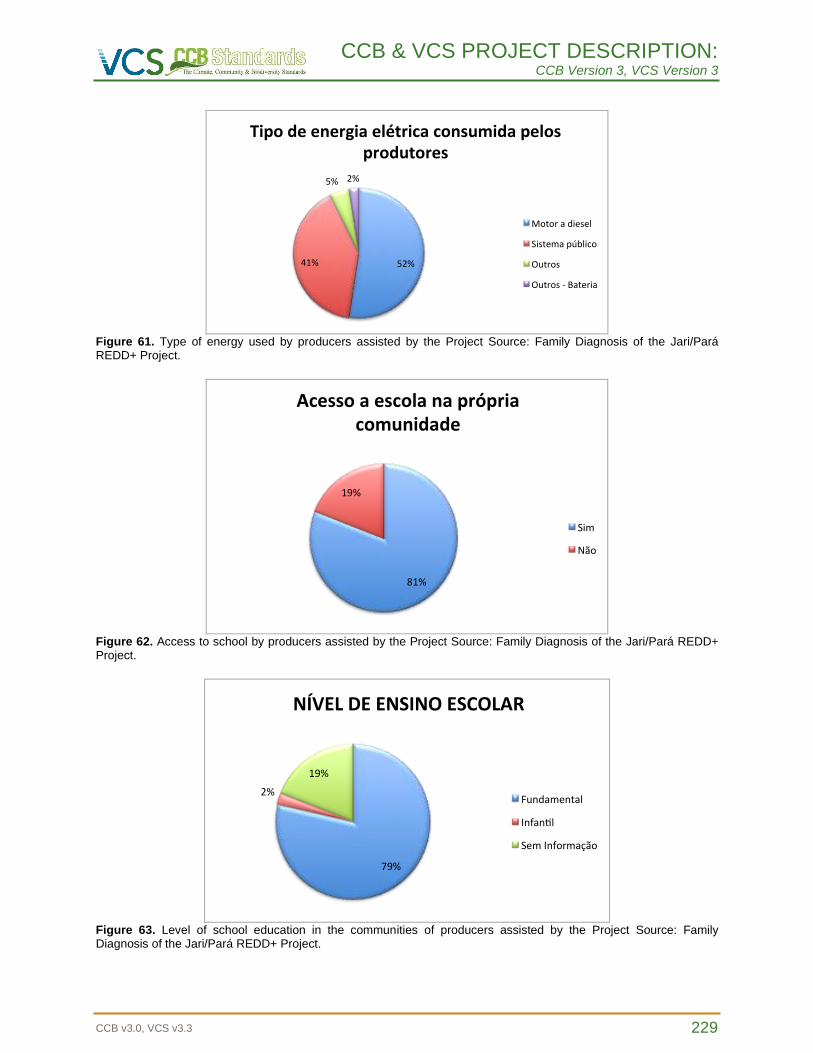
CCB & VCS PROJECT DESCRIPTION: CCB Version 3, VCS Version 3
CCB v3.0, VCS v3.3 229
52%41%
5% 2%
Tipodeenergiaelétricaconsumidapelosprodutores
Motoradiesel
Sistemapúblico
Outros
Outros-Bateria
Figure 61. Type of energy used by producers assisted by the Project Source: Family Diagnosis of the Jari/Pará REDD+ Project.
81%
19%
Acessoaescolanaprópriacomunidade
Sim
Não
Figure 62. Access to school by producers assisted by the Project Source: Family Diagnosis of the Jari/Pará REDD+ Project.
79%
2%
19%
NÍVELDEENSINOESCOLAR
Fundamental
Infan l
SemInformação
Figure 63. Level of school education in the communities of producers assisted by the Project Source: Family Diagnosis of the Jari/Pará REDD+ Project.
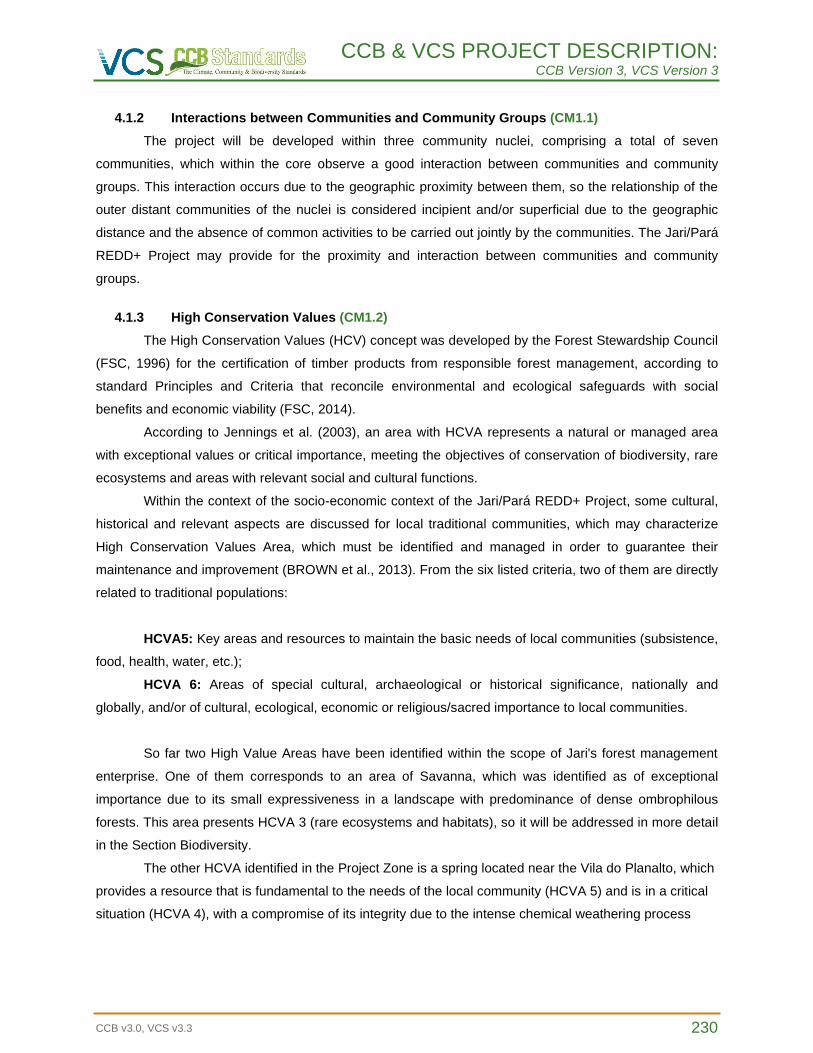
CCB & VCS PROJECT DESCRIPTION: CCB Version 3, VCS Version 3
CCB v3.0, VCS v3.3 230
4.1.2 Interactions between Communities and Community Groups (CM1.1)
The project will be developed within three community nuclei, comprising a total of seven
communities, which within the core observe a good interaction between communities and community
groups. This interaction occurs due to the geographic proximity between them, so the relationship of the
outer distant communities of the nuclei is considered incipient and/or superficial due to the geographic
distance and the absence of common activities to be carried out jointly by the communities. The Jari/Pará
REDD+ Project may provide for the proximity and interaction between communities and community
groups.
4.1.3 High Conservation Values (CM1.2)
The High Conservation Values (HCV) concept was developed by the Forest Stewardship Council
(FSC, 1996) for the certification of timber products from responsible forest management, according to
standard Principles and Criteria that reconcile environmental and ecological safeguards with social
benefits and economic viability (FSC, 2014).
According to Jennings et al. (2003), an area with HCVA represents a natural or managed area
with exceptional values or critical importance, meeting the objectives of conservation of biodiversity, rare
ecosystems and areas with relevant social and cultural functions.
Within the context of the socio-economic context of the Jari/Pará REDD+ Project, some cultural,
historical and relevant aspects are discussed for local traditional communities, which may characterize
High Conservation Values Area, which must be identified and managed in order to guarantee their
maintenance and improvement (BROWN et al., 2013). From the six listed criteria, two of them are directly
related to traditional populations:
HCVA5: Key areas and resources to maintain the basic needs of local communities (subsistence,
food, health, water, etc.);
HCVA 6: Areas of special cultural, archaeological or historical significance, nationally and
globally, and/or of cultural, ecological, economic or religious/sacred importance to local communities.
So far two High Value Areas have been identified within the scope of Jari's forest management
enterprise. One of them corresponds to an area of Savanna, which was identified as of exceptional
importance due to its small expressiveness in a landscape with predominance of dense ombrophilous
forests. This area presents HCVA 3 (rare ecosystems and habitats), so it will be addressed in more detail
in the Section Biodiversity.
The other HCVA identified in the Project Zone is a spring located near the Vila do Planalto, which
provides a resource that is fundamental to the needs of the local community (HCVA 5) and is in a critical
situation (HCVA 4), with a compromise of its integrity due to the intense chemical weathering process
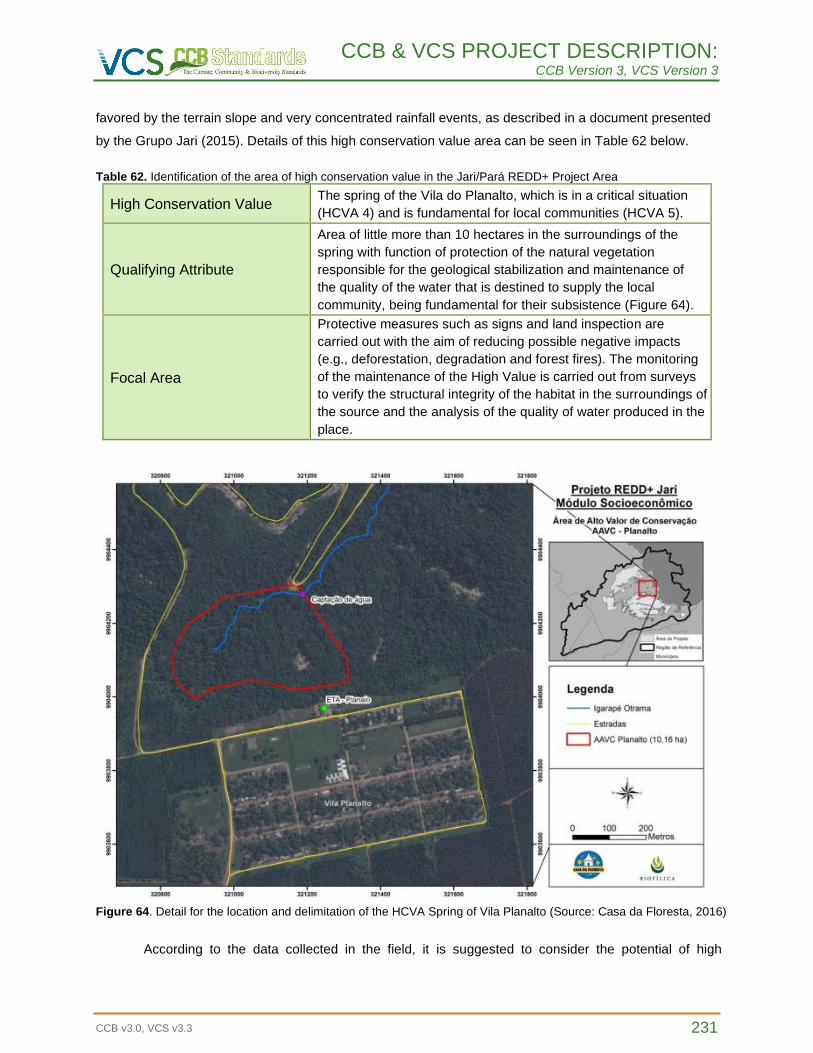
CCB & VCS PROJECT DESCRIPTION: CCB Version 3, VCS Version 3
CCB v3.0, VCS v3.3 231
favored by the terrain slope and very concentrated rainfall events, as described in a document presented
by the Grupo Jari (2015). Details of this high conservation value area can be seen in Table 62 below.
Table 62. Identification of the area of high conservation value in the Jari/Pará REDD+ Project Area
High Conservation Value The spring of the Vila do Planalto, which is in a critical situation
(HCVA 4) and is fundamental for local communities (HCVA 5).
Qualifying Attribute
Area of little more than 10 hectares in the surroundings of the
spring with function of protection of the natural vegetation
responsible for the geological stabilization and maintenance of
the quality of the water that is destined to supply the local
community, being fundamental for their subsistence (Figure 64).
Focal Area
Protective measures such as signs and land inspection are
carried out with the aim of reducing possible negative impacts
(e.g., deforestation, degradation and forest fires). The monitoring
of the maintenance of the High Value is carried out from surveys
to verify the structural integrity of the habitat in the surroundings of
the source and the analysis of the quality of water produced in the
place.
Figure 64. Detail for the location and delimitation of the HCVA Spring of Vila Planalto (Source: Casa da Floresta, 2016)
According to the data collected in the field, it is suggested to consider the potential of high
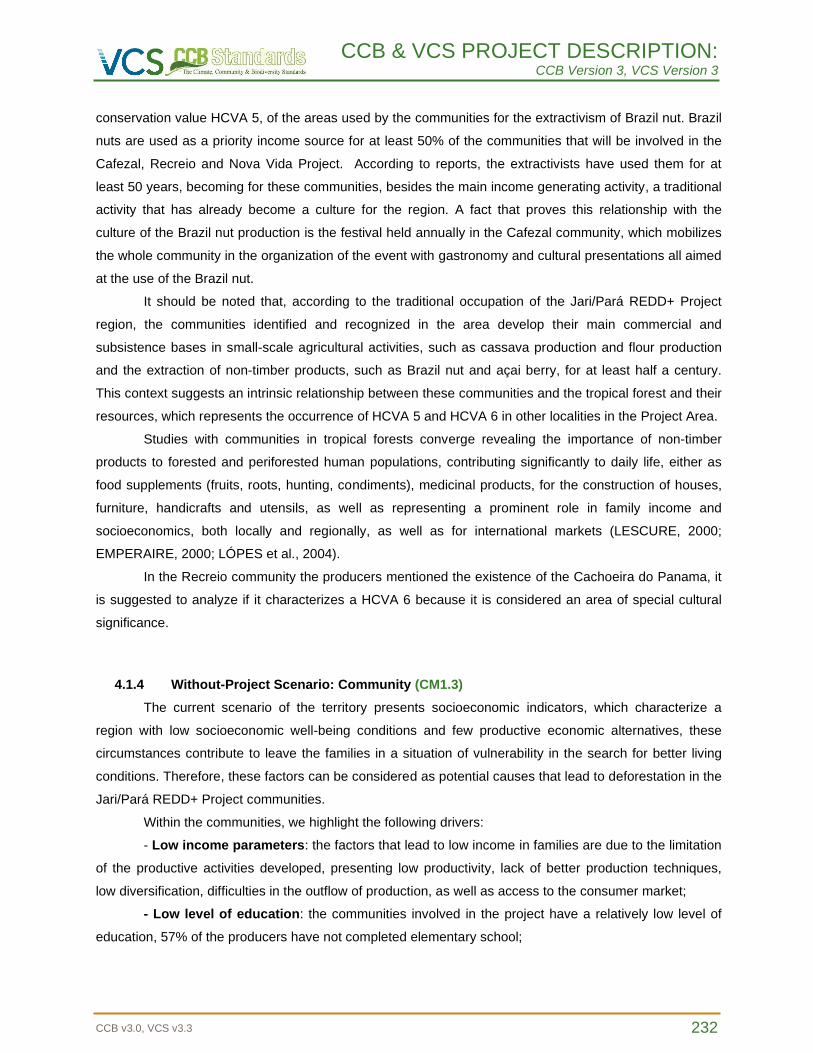
CCB & VCS PROJECT DESCRIPTION: CCB Version 3, VCS Version 3
CCB v3.0, VCS v3.3 232
conservation value HCVA 5, of the areas used by the communities for the extractivism of Brazil nut. Brazil
nuts are used as a priority income source for at least 50% of the communities that will be involved in the
Cafezal, Recreio and Nova Vida Project. According to reports, the extractivists have used them for at
least 50 years, becoming for these communities, besides the main income generating activity, a traditional
activity that has already become a culture for the region. A fact that proves this relationship with the
culture of the Brazil nut production is the festival held annually in the Cafezal community, which mobilizes
the whole community in the organization of the event with gastronomy and cultural presentations all aimed
at the use of the Brazil nut.
It should be noted that, according to the traditional occupation of the Jari/Pará REDD+ Project
region, the communities identified and recognized in the area develop their main commercial and
subsistence bases in small-scale agricultural activities, such as cassava production and flour production
and the extraction of non-timber products, such as Brazil nut and açai berry, for at least half a century.
This context suggests an intrinsic relationship between these communities and the tropical forest and their
resources, which represents the occurrence of HCVA 5 and HCVA 6 in other localities in the Project Area.
Studies with communities in tropical forests converge revealing the importance of non-timber
products to forested and periforested human populations, contributing significantly to daily life, either as
food supplements (fruits, roots, hunting, condiments), medicinal products, for the construction of houses,
furniture, handicrafts and utensils, as well as representing a prominent role in family income and
socioeconomics, both locally and regionally, as well as for international markets (LESCURE, 2000;
EMPERAIRE, 2000; LÓPES et al., 2004).
In the Recreio community the producers mentioned the existence of the Cachoeira do Panama, it
is suggested to analyze if it characterizes a HCVA 6 because it is considered an area of special cultural
significance.
4.1.4 Without-Project Scenario: Community (CM1.3)
The current scenario of the territory presents socioeconomic indicators, which characterize a
region with low socioeconomic well-being conditions and few productive economic alternatives, these
circumstances contribute to leave the families in a situation of vulnerability in the search for better living
conditions. Therefore, these factors can be considered as potential causes that lead to deforestation in the
Jari/Pará REDD+ Project communities.
Within the communities, we highlight the following drivers:
- Low income parameters: the factors that lead to low income in families are due to the limitation
of the productive activities developed, presenting low productivity, lack of better production techniques,
low diversification, difficulties in the outflow of production, as well as access to the consumer market;
- Low level of education: the communities involved in the project have a relatively low level of
education, 57% of the producers have not completed elementary school;
CCB & VCS PROJECT DESCRIPTION: CCB Version 3, VCS Version 3
CCB v3.0, VCS v3.3 233
- Developed activities: the agricultural and livestock activities carried out by the producers are
developed with the lack of technologies and good productive practices, a fact that contributes to
deforestation. In agriculture, the production system used is the cutting and burning system, in which
producers every two or three years, due to the infertility of the soil, have the need to open new areas and
carry out the burning, to start a new cycle Livestock, despite the low scale, is still done in a conventional
way with the opening of large areas for grazing. Despite the low incidence of interviewed producers
practicing this activity, it was verified from the interviews that some of the producers are interested in the
opening of areas for pasture, a factor that is a great motivation for deforestation;
- Low social organization: the need for access to public policies and the guarantee of
exceptional rights in communities is a fundamental factor in the search for socioeconomic well-being for
families, and this is based on a good political and institutional articulation. However, the communities
involved have a low level of social organization, which weakens the local conditions of search for these
fundamental rights, such as access to education, communication, energy and health. Of the producers
interviewed, 50% participate in some community organization, the other 50% do not participate or do not
have an organization that represents them. It is worth mentioning that of the existing organizations, only
one showed a certain level of social organization, the others showed latent weaknesses in both
management and recognition by producers.
According to this information, we can affirm that adverse socioeconomic conditions stimulate
illegal economic activities, such as the predatory extraction of non-timber forest products and forest
products, leading to a series of negative impacts on the ecological processes of the forest and the
depletion of natural resources of interest (ASNER et al., 2009).
It was also confirmed that extractive activities are the basis of subsistence for many rural
communities in the region, but there is no satisfactory data available on this management, which
represents a unique gap in assessing whether these activities occur predatorily or not. It was found that
despite planning for the time for harvesting and organization of the producers for collection, there is no
planning for the areas to be collected or for the productive scale. Bioecological studies of exploited
species, such as population dynamics, phenology, genetics and gene flow, among others, are necessary
to analyze the renewal, and consequent sustainability, of resources exploited over time, as well as the
adequacy of forest management (BENSUSAN; ARMSTRONG, 2008; EMPERAIRE, 2000; SEBBENN et
al., 2000).
Finally, we can consider within the scope of the Project that agriculture represents the greatest
potential driver of deforestation. The activity has low yield in production and has been demanding ever
larger areas, which requires attention on the part of the actions directed to the rural development and the
combat to the deforestation, to increase the yield per hectare without the necessity of the opening of new
areas. It is also possible to foresee an increase in the areas destined to livestock, considering the interest
of the producers and considering the increase of the effective herd and of the urban food demand and
habits.
CCB & VCS PROJECT DESCRIPTION: CCB Version 3, VCS Version 3
CCB v3.0, VCS v3.3 234
Given the exposed situation, we can predict two possible scenarios for deforestation in the project
Reference Region (Table 63). Scenario 1 represents the continuity of the status quo, without the REDD+
Project, leading to increasing pressure on forest resources and consequent increase in deforestation.
Scenario 2 highlights actions aimed at socioeconomic development based on the REDD+ Project, which
are likely to mitigate impacts on forest resources and avoid deforestation in the region.
The Jari/Pará REDD+ Project actions that stimulate the increase and improvement of income,
especially in the rural area from agriculture and sustainable extractive practices, are essential to achieve
the goals of reducing emissions by deforestation and degradation, enabling the maintenance of families in
the rural area and an increase in the supply of properly produced food.
It is necessary to stimulate the search for actions that can contribute to the development of public
policies focused on education, access to energy and communication. The education of the rural and urban
population is essential to optimize forest knowledge and management, as well as guarantee better income
and employment conditions. In addition, education is an important tool for the population to participate
more in political spaces and decision-making on natural resources.
Another important measure for the success of these actions is community empowerment, based
on strengthening and consolidating social organizations, aiming at the integral and effective participation
of community members in decision-making, implementation and management of local socioeconomic
development projects, contributing to the management of risks associated with rural activities and the
improvement of socioeconomic aspects by the community members themselves.
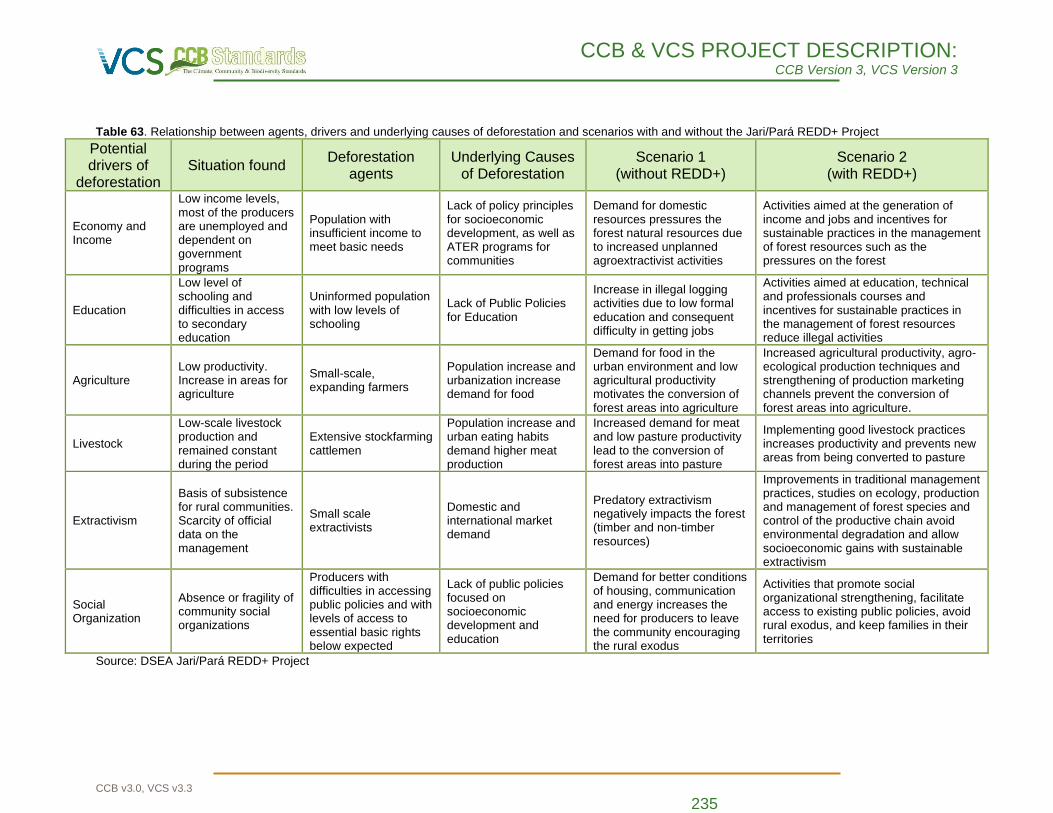
CCB & VCS PROJECT DESCRIPTION: CCB Version 3, VCS Version 3
CCB v3.0, VCS v3.3 235
Table 63. Relationship between agents, drivers and underlying causes of deforestation and scenarios with and without the Jari/Pará REDD+ Project
Potential drivers of
deforestation Situation found
Deforestation agents
Underlying Causes of Deforestation
Scenario 1 (without REDD+)
Scenario 2 (with REDD+)
Economy and Income
Low income levels, most of the producers are unemployed and dependent on government programs
Population with insufficient income to meet basic needs
Lack of policy principles for socioeconomic development, as well as ATER programs for communities
Demand for domestic resources pressures the forest natural resources due to increased unplanned agroextractivist activities
Activities aimed at the generation of income and jobs and incentives for sustainable practices in the management of forest resources such as the pressures on the forest
Education
Low level of schooling and difficulties in access to secondary education
Uninformed population with low levels of schooling
Lack of Public Policies for Education
Increase in illegal logging activities due to low formal education and consequent difficulty in getting jobs
Activities aimed at education, technical and professionals courses and incentives for sustainable practices in the management of forest resources reduce illegal activities
Agriculture Low productivity. Increase in areas for agriculture
Small-scale, expanding farmers
Population increase and urbanization increase demand for food
Demand for food in the urban environment and low agricultural productivity motivates the conversion of forest areas into agriculture
Increased agricultural productivity, agro-ecological production techniques and strengthening of production marketing channels prevent the conversion of forest areas into agriculture.
Livestock
Low-scale livestock production and remained constant during the period
Extensive stockfarming cattlemen
Population increase and urban eating habits demand higher meat production
Increased demand for meat and low pasture productivity lead to the conversion of forest areas into pasture
Implementing good livestock practices increases productivity and prevents new areas from being converted to pasture
Extractivism
Basis of subsistence for rural communities. Scarcity of official data on the management
Small scale extractivists
Domestic and international market demand
Predatory extractivism negatively impacts the forest (timber and non-timber resources)
Improvements in traditional management practices, studies on ecology, production and management of forest species and control of the productive chain avoid environmental degradation and allow socioeconomic gains with sustainable extractivism
Social Organization
Absence or fragility of community social organizations
Producers with difficulties in accessing public policies and with levels of access to essential basic rights below expected
Lack of public policies focused on socioeconomic development and education
Demand for better conditions of housing, communication and energy increases the need for producers to leave the community encouraging the rural exodus
Activities that promote social organizational strengthening, facilitate access to existing public policies, avoid rural exodus, and keep families in their territories
Source: DSEA Jari/Pará REDD+ Project
CCB & VCS PROJECT DESCRIPTION: CCB Version 3, VCS Version 3
CCB v3.0, VCS v3.3 236
The guarantee of access to a positive scenario and the good progress of the Project demands a
rural development agent, with expertise and capacity to attend to the needs of the families. Currently, this
role is assumed by the Fundação Jari, actions for its strengthening are planned, with a view to
maintaining and expanding its operations, visualizing a more positive scenario for the Project.
Therefore, it is concluded that the most probable scenario for the communities in the absence of the
Project would be the continuity of the chain of events that leads to deforestation, such as low levels of
income, little diversification of production combined with low productivity, difficulty in accessing public
policies, among others, due to the lack of action of the Fundação Jari, which carries out actions to
promote well-being and economic development in the communities. The unfeasibility of the Foundation's
activities would result in the continuity of the problems encountered in the communities, such as:
• Small producers with little access to public policies;
• Low social organization;
• Development of shifting agriculture of low technology, profitability and productivity;
• Absence of specialized rural technical assistance;
• Lack of access to communication and energy.
In this scenario, considering no significant improvement in public management models, the
tendency would be for the rate of deforestation to continue unaltered or increase and thus the
socioeconomic context shown above would remain stagnant or worsen due to the demographic increase
and the increase in pressures on the deforestation hidden causes.
In the event of a catastrophic scenario, it is possible that the situation of the Project communities
will deepen the indicators of deterioration in the following:
a) Social: continuity of levels of education, health, energy, communication, living conditions,
and other infrastructures, in an incipient way;
b) Economic: stagnation and decrease in family income, agriculture and alternatives to promote
diversification and verticalization of production, production outflow;
c) Environmental: degradation of forests and water sources, accumulation of residues,
potentiating of illegal logging, and looting of existing natural resources;
d) Associative: weakening and absence of representative entities, in view of the high demand
for the strengthening of social organizations.
Such a condition presented in this scenario may result in rural exodus, that is, the departure of
the inhabitants to the cities, where there is a risk of marginalization due to the low labor absorption
conditions in the Jari Valley.
The stagnation of the educational level and information related to the guarantee of rights is also
directly related to the current use of land. Poverty favors inadequate sanitation facilities and access to
health infrastructure would remain inadequate in communities.
CCB & VCS PROJECT DESCRIPTION: CCB Version 3, VCS Version 3
CCB v3.0, VCS v3.3 237
In the scenario with the presence of the Jari/Pará REDD+ Project, communities are perceived
with increasing levels of socioeconomic conditions, reaching levels of development from their production
until access to public policies that ensure the continuity of families in communities, avoiding rural exodus.
In addition, with the Project and from the strengthening of the Fundação Jari, a process of innovation is
created to develop a strategy of a business structure of social impact, generating a favorable business
environment economically, environmentally, and socially sustainable.
4.2 Net Positive Community Impacts
4.2.1 Expected Community Impacts (CM2.1)
The impacts of the Project were estimated based on the analysis theory of changes and causal
relationships between activities, results and consequent impacts proposed by Richards and Panfil (2011),
detailed in Table 10 of this document.
Impacts to the communities described below include benefits, costs, and risks, including those
related to social, cultural, environmental, and economic aspects; the following items present issues
related to impacts for communities.
Direct impacts
The opportunities that the Project will provide to the communities will generate a chain of direct
impacts such as:
• Producers trained in better production techniques;
• Access to technical assistance and rural extension services directed to the reality of each
community;
• Creation of new spaces of participation generating opportunities of direct communication with
other interested parties;
• Qualified information about access to public policies;
• Access to training in agroforestry and agricultural techniques;
• Access to management, leadership and finance training;
• Generation of an institutional environment favorable to the generation of new businesses;
• Strengthened social organization;
• Communication with new markets;
• Increased knowledge and skills in agroforestry systems, agricultural production and REDD+;
• Environmental awareness in waste management;
• Knowledge in fire control and management techniques.
Indirect impacts
Empowerment of resource management, access to information on global trends, increased self-
CCB & VCS PROJECT DESCRIPTION: CCB Version 3, VCS Version 3
CCB v3.0, VCS v3.3 238
esteem and confidence, greater access to local public policies, greater opportunities for access to credit
(loans), conscientiously used natural resources, rural community settlement and consequent reduction of
rural exodus and urban marginalization, mitigation of risks of extreme climatic events, access to energy in
desirable quantity and quality, increased availability of food, approximation and dialogue with public
agents.
Costs
No significant cost is expected from community groups, only the time that producers should invest
in the development of activities is considered as a cost to communities.
Potential risks
The risks to the described communities are mainly related to the lack of interest of other
stakeholders, for example, governmental institutions in participating in Project activities, coming from
outsiders, reducing the supply of natural resources (hunting and non-forest wood products).
One of the potential risks that the Project could cause to the well-being of the Community Groups
is related to the increase in the number of local populations that migrates to the Project Area in search of
the benefits generated by the Project in the course of its execution. However, this population movement
and related impacts are not expected, since only communities that are already established and
consolidated in the area can participate in the activities of the Project. In addition, territorial patrols and
land monitoring are conducted by Grupo Jari teams to avoid new land invasions and deforestation.
Any other negative impact of the Project is not expected because participation in Project activities
is voluntary and the Project does not impose any restrictions on land use to established rural
communities. Among the rural communities not served by the Project, no negative impact is expected, as
they will also not be subject to any type of land restriction, nor will be contained to change their way of
life.
4.2.2 Negative Community Impact Mitigation (CM2.2)
As mentioned in the section above (section 4.2.1 – Expected Community Impacts), the Jari/Pará
REDD+ Project does not provide negative impacts to the well-being of local communities. Some potential
risks are identified as a lack of interest from other stakeholders and an increase in the number of local
people due to migration to the Project Area.
In order to mitigate these risks, some measures can be taken to consolidate the involvement of all
parties involved in the decision-making processes of the Project activities in the Technical Chambers and
DRP Workshops, as well as to improve already existing communication tools. Another mitigation measure
to minimize the risks of invasion and increase in the number of people in the region is through the
expansion of land surveillance and territorial patrols.
CCB & VCS PROJECT DESCRIPTION: CCB Version 3, VCS Version 3
CCB v3.0, VCS v3.3 239
For maintenance and improvement of the High Value Area for Conservation (HCVA), protection
measures such as signs and land inspection are carried out. The monitoring of the HCVA is carried out
from surveys to verify the structural integrity of the habitat in the surroundings of the spring and the quality
analysis of the water produced in the place.
4.2.3 Net Positive Community Well-Being (CM2.3, GL1.4)
The Jari/Pará REDD+ Project proposes a socioeconomic development process for the
communities involved in the Project, focusing in particular on social strengthening, through the
consolidation of local social organizations and the provision of a differentiated ATER with a focus on
diversification, increase and production commercialization, associated to activities with social and
environmental focus. To this end, training and direct training for producers will be carried out through
participatory strategies with the joint construction of knowledge and the most appropriate techniques for
the communities, maximizing the results to be obtained and continuously involving producers in
management.
In the scenario without Project, as described in item 4.1.4 – Scenario without Project: Community,
the lack of public policies and the context of low income cause the communities of the Project Area to
seek more favorable alternatives to increase income from increasing land use in an unplanned way.
Another problem in the current scenario is inefficient and unprofitable agriculture and difficulties in market
access that result in difficulties for the well-being of people living in these communities.
The Jari/Pará REDD+ Project proposes to consolidate a plan for socioeconomic development
focused on strengthening social organizations, improving productive processes with the provision of rural
technical assistance, strengthening the Fundação Jari and facilitating the community communication
system.
The Project aims to create opportunities for communities with the following net positive impacts:
1. Involvement of local actors in participatory management models to assist them in the
empowerment of local management, through the participation of local technical chambers’ meetings;
2. Facilitate the aggregation of community social capital. in the quest for social organization,
based on the search for collective commitments with a view to guaranteeing essential basic rights;
3. Facilitate access to public policies in order to guarantee public goods and services in the
context of the strengthening of social and third sector organizations, trade unions, companies, and
communities;
4. Opportunity to develop business chains of social impact, through rural technical assistance,
training and research and facilitation of access to markets;
5. Improve community energy and communication systems by bringing them into contact with the
world.
The main problems that will be addressed in this context are:
CCB & VCS PROJECT DESCRIPTION: CCB Version 3, VCS Version 3
CCB v3.0, VCS v3.3 240
• Low access to public policies;
• Low social organization;
• Family farming with low rates of diversification, productivity and profitability;
• Absence of specialized ATER;
• Difficulties of access to the market for products from extractivism and agriculture.
In addition to the positive impacts, the Project, working on aspects of associative strengthening,
improvement of family agriculture, provision of technical assistance and improvement in energy and
communication systems, is intended to influence social issues and the living conditions of communities
around the Project Area, in order to reduce social vulnerability and rural exodus, providing families with
an improvement in the quality of life and income stability allowing families to obtain goods and services
that promote economic and social well-being.
4.2.4 High Conservation Values Protected (CM2.4)
So far, during the preliminary assessment conducted with the DSEA (socioeconomic and
environmental diagnosis) studies, no impacts were identified on high conservation value attributes related
to social issues (HCVA 5 and 6). However, if these are to be identified at some future time, measures
must be taken to ensure that there are no negative net impacts to the attributes. However, attention is
requested to the Brazil nut Trees, the management of these species should be implemented to ensure
the continuity of their production.
Brazil nut deserves special care, since, along with other non-timber forest products, such as
copaiba and andiroba, they have an importance as a source of income for local traditional communities.
For this reason, any valuable tree species to support communities must be protected. And, in addition to
the commitment of the Grupo Jari in preserving these species, Brazil nut is still protected by Brazilian
federal law (Federal Decree No. 5.975 of November 30, 2006), and felling this tree would constitute an
illegal activity.
In the activity of sustainable forest management, during the planning phase, is conducted forest
inventory 100% of all trees present in the explored UPA (Annual Production Unit, Unidade de Produção
Anual, in Portuguese) before harvest held in the respective year. During this inventory, beyond the
commercial trees, all other species are inventoried, especially those that have some kind of "social
interest" or are protected by the legislation such as Brazil nut, Copaíba and Andiroba. The main objective
of this activity is to assist the forestry team in harvest planning without damaging these species. In
addition, signs and warnings are distributed at the site of the operation and surrounding communities are
advised. There is no access restriction for local communities extractivist (only for outsiders), but the signs
and warnings are extremely important to avoid risk.
Although this inventory is carried out, the use of these data is mainly directed on sustainable
forest management activities. So, in order to improve a better understanding about the extractivist
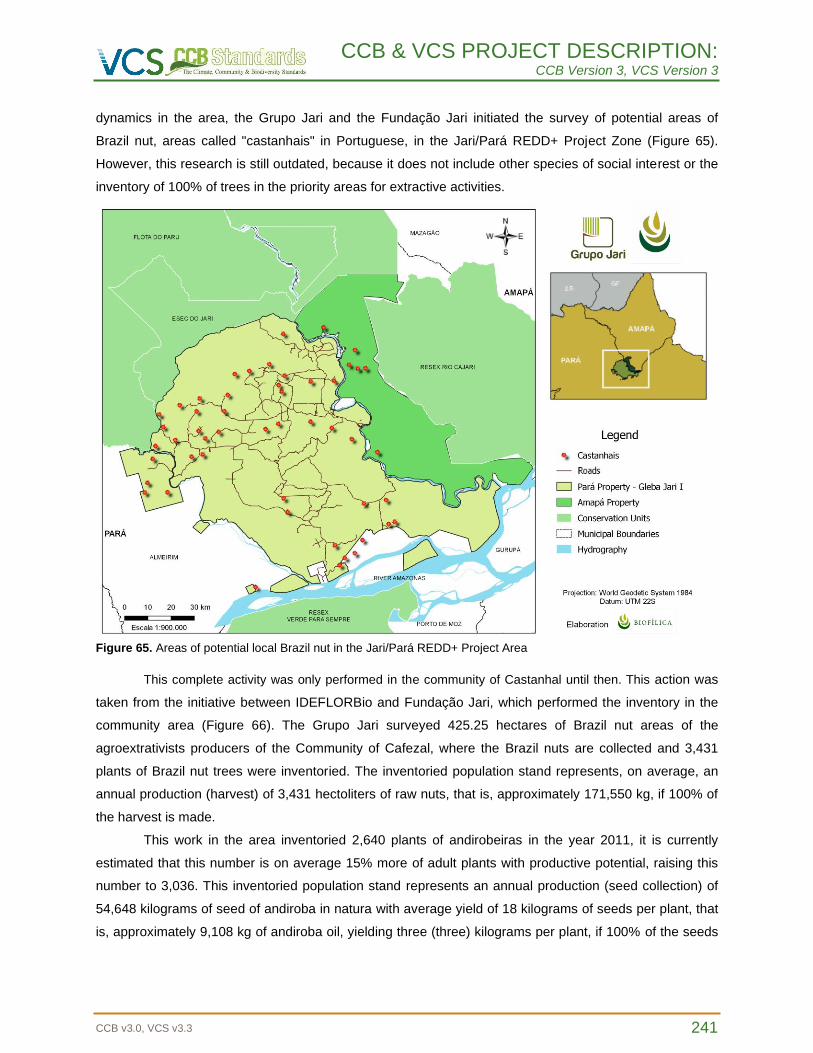
CCB & VCS PROJECT DESCRIPTION: CCB Version 3, VCS Version 3
CCB v3.0, VCS v3.3 241
dynamics in the area, the Grupo Jari and the Fundação Jari initiated the survey of potential areas of
Brazil nut, areas called "castanhais" in Portuguese, in the Jari/Pará REDD+ Project Zone (Figure 65).
However, this research is still outdated, because it does not include other species of social interest or the
inventory of 100% of trees in the priority areas for extractive activities.
Figure 65. Areas of potential local Brazil nut in the Jari/Pará REDD+ Project Area
This complete activity was only performed in the community of Castanhal until then. This action was
taken from the initiative between IDEFLORBio and Fundação Jari, which performed the inventory in the
community area (Figure 66). The Grupo Jari surveyed 425.25 hectares of Brazil nut areas of the
agroextrativists producers of the Community of Cafezal, where the Brazil nuts are collected and 3,431
plants of Brazil nut trees were inventoried. The inventoried population stand represents, on average, an
annual production (harvest) of 3,431 hectoliters of raw nuts, that is, approximately 171,550 kg, if 100% of
the harvest is made.
This work in the area inventoried 2,640 plants of andirobeiras in the year 2011, it is currently
estimated that this number is on average 15% more of adult plants with productive potential, raising this
number to 3,036. This inventoried population stand represents an annual production (seed collection) of
54,648 kilograms of seed of andiroba in natura with average yield of 18 kilograms of seeds per plant, that
is, approximately 9,108 kg of andiroba oil, yielding three (three) kilograms per plant, if 100% of the seeds
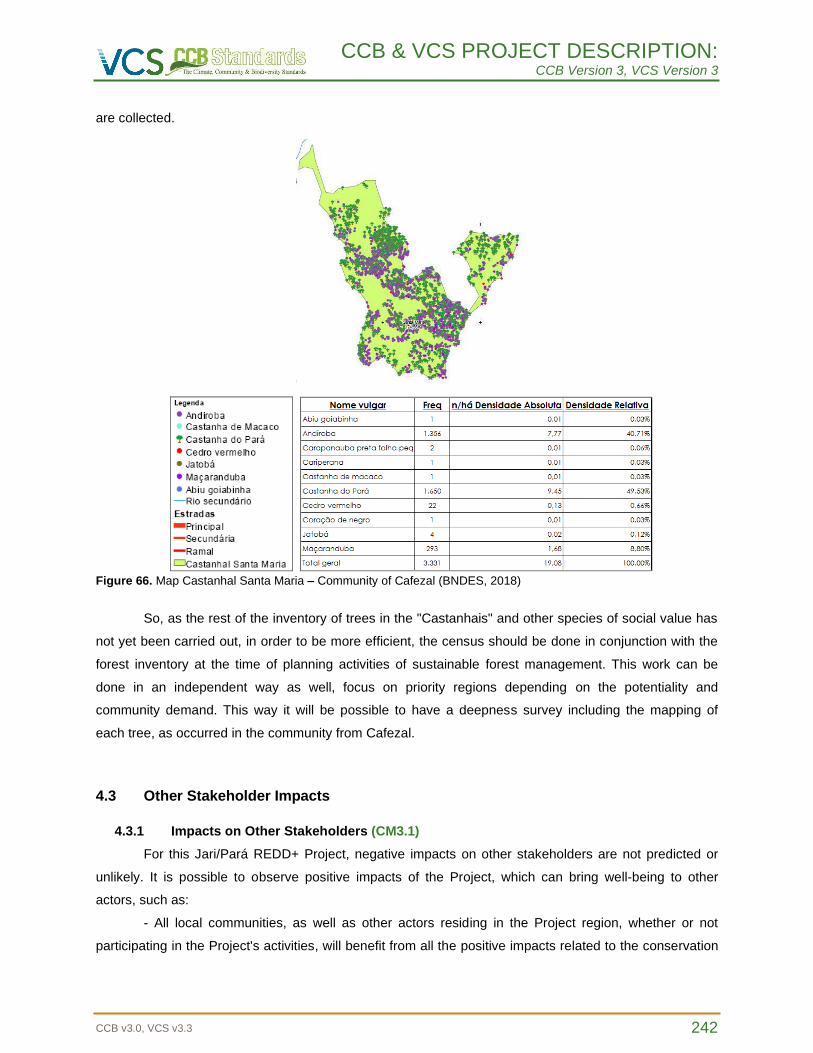
CCB & VCS PROJECT DESCRIPTION: CCB Version 3, VCS Version 3
CCB v3.0, VCS v3.3 242
are collected.
Figure 66. Map Castanhal Santa Maria – Community of Cafezal (BNDES, 2018)
So, as the rest of the inventory of trees in the "Castanhais" and other species of social value has
not yet been carried out, in order to be more efficient, the census should be done in conjunction with the
forest inventory at the time of planning activities of sustainable forest management. This work can be
done in an independent way as well, focus on priority regions depending on the potentiality and
community demand. This way it will be possible to have a deepness survey including the mapping of
each tree, as occurred in the community from Cafezal.
4.3 Other Stakeholder Impacts
4.3.1 Impacts on Other Stakeholders (CM3.1)
For this Jari/Pará REDD+ Project, negative impacts on other stakeholders are not predicted or
unlikely. It is possible to observe positive impacts of the Project, which can bring well-being to other
actors, such as:
- All local communities, as well as other actors residing in the Project region, whether or not
participating in the Project's activities, will benefit from all the positive impacts related to the conservation
CCB & VCS PROJECT DESCRIPTION: CCB Version 3, VCS Version 3
CCB v3.0, VCS v3.3 243
and protection of forest cover;
- The activities of the Project lead to a greater commercial turnaround in the region, thus
contributing to the increase of income and purchasing power among the producers that participate in
these activities, benefiting local merchants;
- All the communities in the region will benefit not only the participants in the Project activities, but
also the improvements made in the roads and branches, in the flow of production, in school buses and
with greater access to public policies.
As indicated above, the negative impacts from these activities are unlikely, and may be:
- Competition regarding the time allocation of community members, time allocated in meetings
with government agencies and other institutions versus time allocated to the agricultural activity;
- Failure to communicate the actions of the Project and in the establishment of possible conflicts
arising from the implementation and conduction of the activities.
4.3.2 Mitigation of Negative Impacts on Other Stakeholders (CM3.2)
As mentioned above, negative impacts on other stakeholders in this Project are not expected or
unlikely to occur. A mitigating measure is the implementation of participatory strategies in the design of
the activity and in the decision making regarding the most appropriate moment and structure of
interaction, with the joint construction of the agenda minimizing the overlap of activities, just as it has
been done. In addition, a conflict resolution procedure has been structured and, if it is not being effective,
it is recommended that the forms of communication and referral of conflicts be adapted.
4.3.3 Net Impacts on Other Stakeholders (CM3.3)
As described and detailed in section 4.3.1 – Impacts on Other Stakeholders, other negative
impacts on the well-being of other groups of local actors are unlikely, since the project does not limit
access to natural resources in the Project Area of any agent originally dependent on these resources, and
the activities to be carried out in relation to the surrounding communities are based mainly on articulation
with government agencies and other local institutions precisely to promote improvement in living
conditions, greater access to public policies, and rural extension and technical assistance. The activities
outlined and proposed for this Project only crave impacts that promote inclusion and well-being to
communities and other stakeholders.
CCB & VCS PROJECT DESCRIPTION: CCB Version 3, VCS Version 3
CCB v3.0, VCS v3.3 244
4.4 Community Impact Monitoring
4.4.1 Community Monitoring Plan (CM4.1, CM4.2, GL1.4, GL2.2, GL2.3, GL2.5)
Monitoring the impacts of the Project on communities and other stakeholders is an important
management tool, making it possible to evaluate the effectiveness of the activities in achieving the
proposed objectives.
It is important to create an impact monitoring system on communities. At first, the same should be
done by the technicians of the Fundação Jari, based on the initial data collected in the family diagnosis,
which demonstrates the initial conditions of the families.
It is important to clearly identify which development indicators are intended to be modified, as well
as to price them. In this sense, the development of a monitoring system for the Project is suggested,
based on the targets set for the construction of the indicators to be collected, the verification tools and the
procedures for analysis and evaluation of results and evaluation, to indicate, where necessary, the
essential measures to improve the intended progress.
An Initial Plan for Monitoring Impacts to Communities is described in section 3.3.5 – Monitoring
Plan of Impacts to the Community and Other Actors, which essentially covers process indicators and part
of the results indicators. Subsequently, it is intended to complement this initial monitoring plan, with the
need for its evaluation and validation by stakeholders.
The Initial Plan for Monitoring Impacts to Communities contains, in essence, process indicators
and part of the results indicators. For the presentation of the Comprehensive Monitoring Plan for Impacts
to Communities, the plan presented here will be evaluated and validated by stakeholders, the process
and results indicators will be complemented and the impact indicators will be established.
The activities carried out by the Jari/Pará REDD+ Project, as well as the monitoring, aim to
access the effectiveness of the focused interventions: engagement of local actors and stakeholders,
strengthening of associativism, promotion of rural technical assistance, strengthening of the Fundação
Jari and improvements in communication and energy systems. Monitoring of benefits to communities has
five components:
- Monitoring of stakeholder engagement, which aims to monitor the implementation of activities
linked to the articulation and engagement of institutions and entities (governmental, nongovernmental and
private) to facilitate communities in access to public policies, basic services and rural development, from
the constitution of technical chambers;
- Monitoring the strengthening of associativism, focusing on activities (courses, trainings and
articulations) developed to strengthen associativism, its results and impacts;
- Monitoring activities to coordinate rural technical assistance services, monitoring the result in
increasing diversification, agroextractivist productivity and the implementation of more sustainable
techniques and technologies, as well as market access;
CCB & VCS PROJECT DESCRIPTION: CCB Version 3, VCS Version 3
CCB v3.0, VCS v3.3 245
- Monitoring the Strengthening activities of the Fundação Jari, monitoring the outcome in
increasing the effectiveness of impact business development actions with communities;
- Monitoring of activities to improve energy supply and communication for communities,
monitoring the results of articulation efforts with the government for access to the Luz para Todos (Light
for Everyone) program and the results of installing telephony and internet access points in the
communities.
4.4.2 Monitoring Plan Dissemination (CM4.3)
As specified above (section 4.4.1 – Community Monitoring Plan), an Initial Monitoring Plan for
Community Impacts was demonstrated, and the complete monitoring plan should be finalized in the
future. This information will be disseminated on the internet and communicated to the communities,
project proponents, partners and other stakeholders.
4.5 Optional Criterion: Exceptional Community Benefits
Does not apply. This project is not intended to be validated for the Gold Level of this section.
4.5.1 Exceptional Community Criteria (GL2.1)
Does not apply.
4.5.2 Short-term and Long-term Community Benefits (GL2.2)
Does not apply.
4.5.3 Community Participation Risks (GL2.3)
Does not apply.
4.5.4 Marginalized and/or Vulnerable Community Groups (GL2.4)
Does not apply.
4.5.5 Net Impacts on Women (GL2.5)
Does not apply.
4.5.6 Benefit Sharing Mechanisms (GL2.6)
Does not apply.
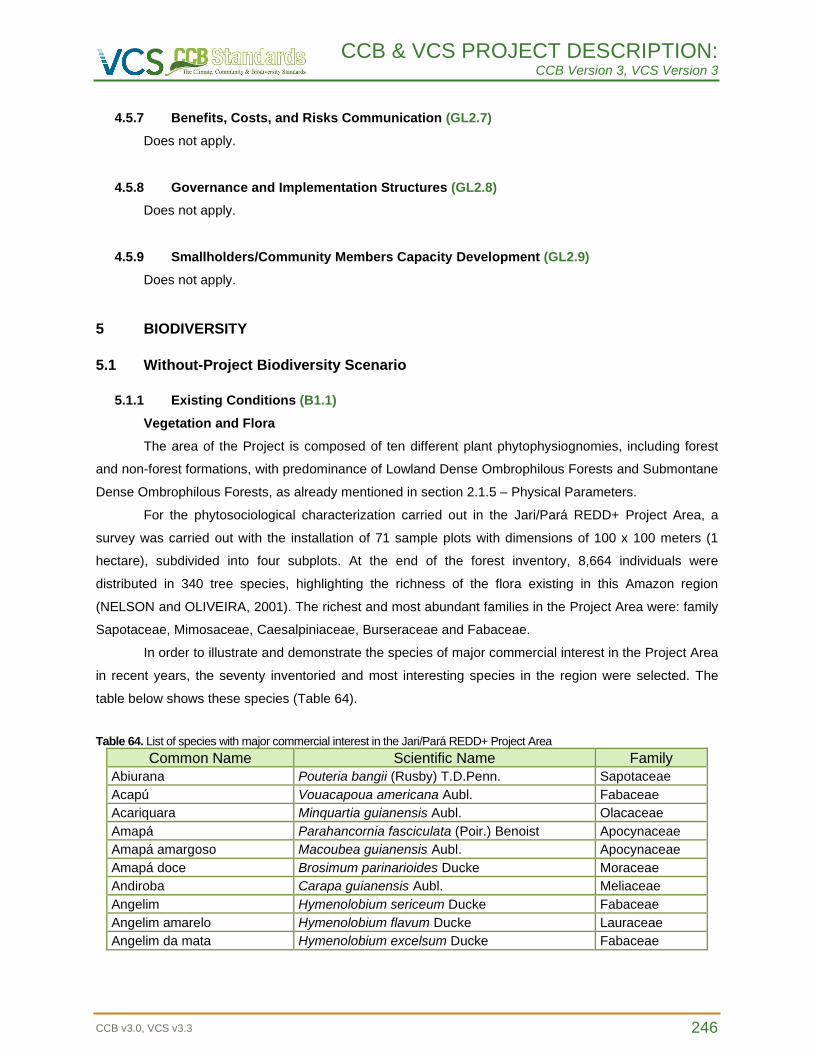
CCB & VCS PROJECT DESCRIPTION: CCB Version 3, VCS Version 3
CCB v3.0, VCS v3.3 246
4.5.7 Benefits, Costs, and Risks Communication (GL2.7)
Does not apply.
4.5.8 Governance and Implementation Structures (GL2.8)
Does not apply.
4.5.9 Smallholders/Community Members Capacity Development (GL2.9)
Does not apply.
5 BIODIVERSITY
5.1 Without-Project Biodiversity Scenario
5.1.1 Existing Conditions (B1.1)
Vegetation and Flora
The area of the Project is composed of ten different plant phytophysiognomies, including forest
and non-forest formations, with predominance of Lowland Dense Ombrophilous Forests and Submontane
Dense Ombrophilous Forests, as already mentioned in section 2.1.5 – Physical Parameters.
For the phytosociological characterization carried out in the Jari/Pará REDD+ Project Area, a
survey was carried out with the installation of 71 sample plots with dimensions of 100 x 100 meters (1
hectare), subdivided into four subplots. At the end of the forest inventory, 8,664 individuals were
distributed in 340 tree species, highlighting the richness of the flora existing in this Amazon region
(NELSON and OLIVEIRA, 2001). The richest and most abundant families in the Project Area were: family
Sapotaceae, Mimosaceae, Caesalpiniaceae, Burseraceae and Fabaceae.
In order to illustrate and demonstrate the species of major commercial interest in the Project Area
in recent years, the seventy inventoried and most interesting species in the region were selected. The
table below shows these species (Table 64).
Table 64. List of species with major commercial interest in the Jari/Pará REDD+ Project Area
Common Name Scientific Name Family
Abiurana Pouteria bangii (Rusby) T.D.Penn. Sapotaceae
Acapú Vouacapoua americana Aubl. Fabaceae
Acariquara Minquartia guianensis Aubl. Olacaceae
Amapá Parahancornia fasciculata (Poir.) Benoist Apocynaceae
Amapá amargoso Macoubea guianensis Aubl. Apocynaceae
Amapá doce Brosimum parinarioides Ducke Moraceae
Andiroba Carapa guianensis Aubl. Meliaceae
Angelim Hymenolobium sericeum Ducke Fabaceae
Angelim amarelo Hymenolobium flavum Ducke Lauraceae
Angelim da mata Hymenolobium excelsum Ducke Fabaceae
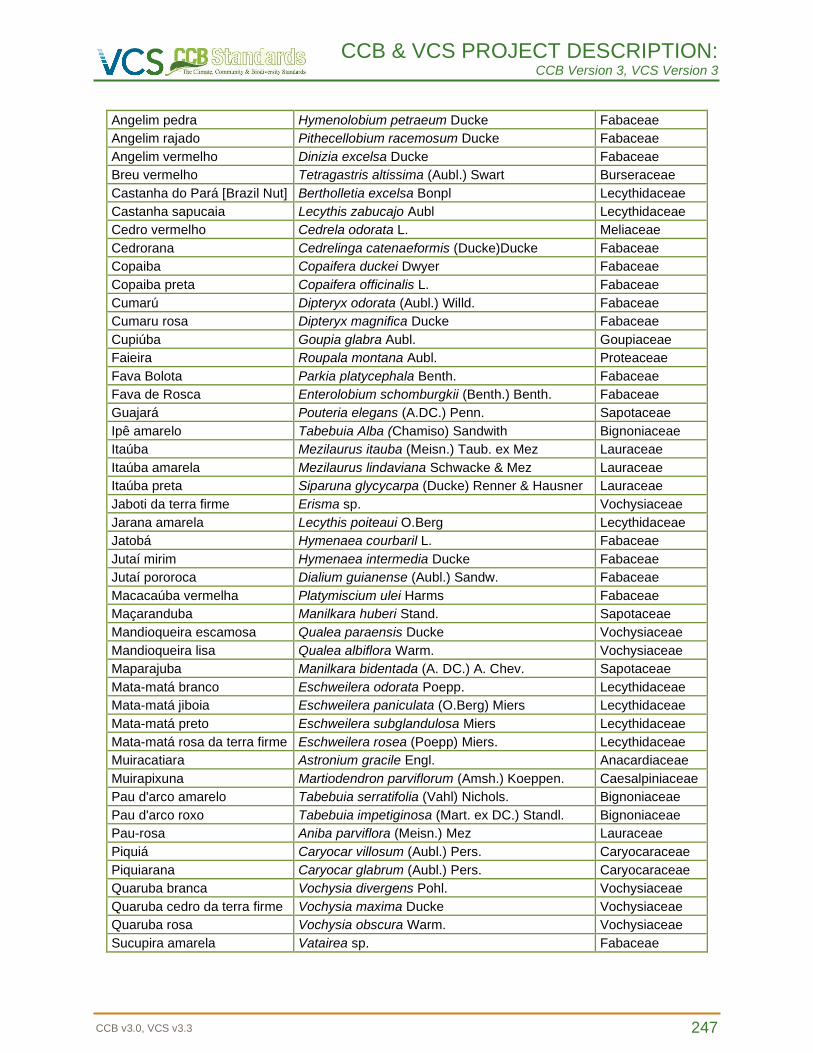
CCB & VCS PROJECT DESCRIPTION: CCB Version 3, VCS Version 3
CCB v3.0, VCS v3.3 247
Angelim pedra Hymenolobium petraeum Ducke Fabaceae
Angelim rajado Pithecellobium racemosum Ducke Fabaceae
Angelim vermelho Dinizia excelsa Ducke Fabaceae
Breu vermelho Tetragastris altissima (Aubl.) Swart Burseraceae
Castanha do Pará [Brazil Nut] Bertholletia excelsa Bonpl Lecythidaceae
Castanha sapucaia Lecythis zabucajo Aubl Lecythidaceae
Cedro vermelho Cedrela odorata L. Meliaceae
Cedrorana Cedrelinga catenaeformis (Ducke)Ducke Fabaceae
Copaiba Copaifera duckei Dwyer Fabaceae
Copaiba preta Copaifera officinalis L. Fabaceae
Cumarú Dipteryx odorata (Aubl.) Willd. Fabaceae
Cumaru rosa Dipteryx magnifica Ducke Fabaceae
Cupiúba Goupia glabra Aubl. Goupiaceae
Faieira Roupala montana Aubl. Proteaceae
Fava Bolota Parkia platycephala Benth. Fabaceae
Fava de Rosca Enterolobium schomburgkii (Benth.) Benth. Fabaceae
Guajará Pouteria elegans (A.DC.) Penn. Sapotaceae
Ipê amarelo Tabebuia Alba (Chamiso) Sandwith Bignoniaceae
Itaúba Mezilaurus itauba (Meisn.) Taub. ex Mez Lauraceae
Itaúba amarela Mezilaurus lindaviana Schwacke & Mez Lauraceae
Itaúba preta Siparuna glycycarpa (Ducke) Renner & Hausner Lauraceae
Jaboti da terra firme Erisma sp. Vochysiaceae
Jarana amarela Lecythis poiteaui O.Berg Lecythidaceae
Jatobá Hymenaea courbaril L. Fabaceae
Jutaí mirim Hymenaea intermedia Ducke Fabaceae
Jutaí pororoca Dialium guianense (Aubl.) Sandw. Fabaceae
Macacaúba vermelha Platymiscium ulei Harms Fabaceae
Maçaranduba Manilkara huberi Stand. Sapotaceae
Mandioqueira escamosa Qualea paraensis Ducke Vochysiaceae
Mandioqueira lisa Qualea albiflora Warm. Vochysiaceae
Maparajuba Manilkara bidentada (A. DC.) A. Chev. Sapotaceae
Mata-matá branco Eschweilera odorata Poepp. Lecythidaceae
Mata-matá jiboia Eschweilera paniculata (O.Berg) Miers Lecythidaceae
Mata-matá preto Eschweilera subglandulosa Miers Lecythidaceae
Mata-matá rosa da terra firme Eschweilera rosea (Poepp) Miers. Lecythidaceae
Muiracatiara Astronium gracile Engl. Anacardiaceae
Muirapixuna Martiodendron parviflorum (Amsh.) Koeppen. Caesalpiniaceae
Pau d'arco amarelo Tabebuia serratifolia (Vahl) Nichols. Bignoniaceae
Pau d'arco roxo Tabebuia impetiginosa (Mart. ex DC.) Standl. Bignoniaceae
Pau-rosa Aniba parviflora (Meisn.) Mez Lauraceae
Piquiá Caryocar villosum (Aubl.) Pers. Caryocaraceae
Piquiarana Caryocar glabrum (Aubl.) Pers. Caryocaraceae
Quaruba branca Vochysia divergens Pohl. Vochysiaceae
Quaruba cedro da terra firme Vochysia maxima Ducke Vochysiaceae
Quaruba rosa Vochysia obscura Warm. Vochysiaceae
Sucupira amarela Vatairea sp. Fabaceae
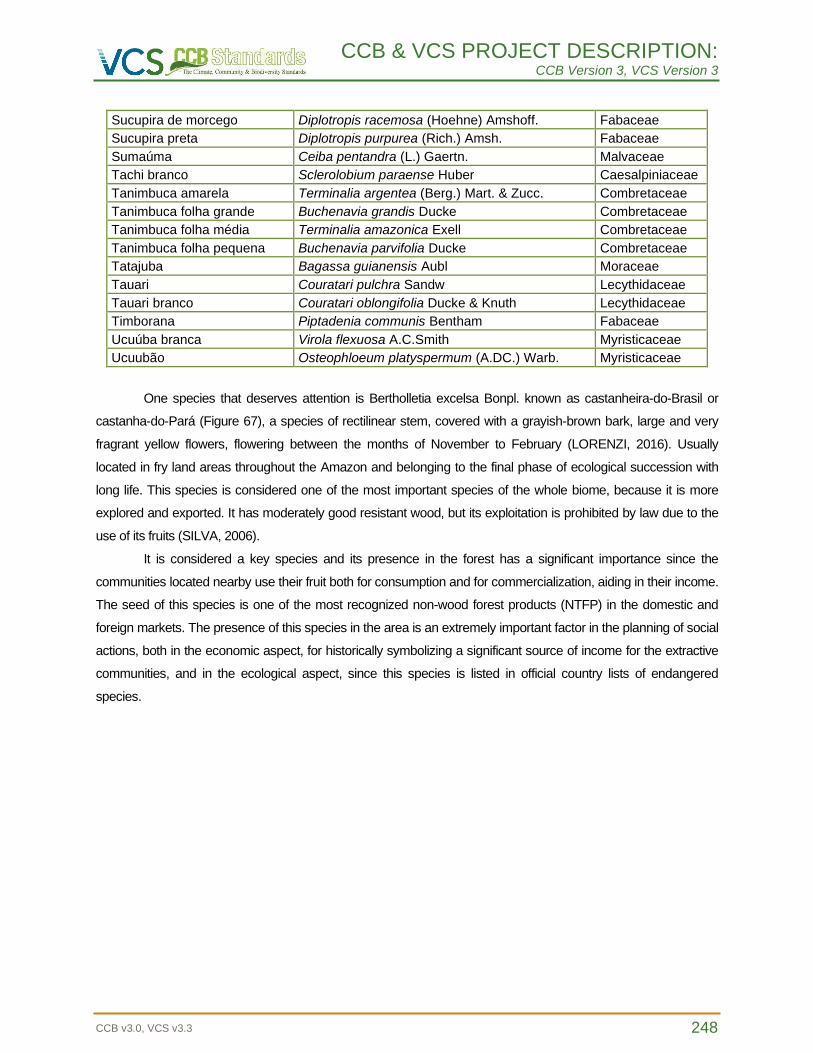
CCB & VCS PROJECT DESCRIPTION: CCB Version 3, VCS Version 3
CCB v3.0, VCS v3.3 248
Sucupira de morcego Diplotropis racemosa (Hoehne) Amshoff. Fabaceae
Sucupira preta Diplotropis purpurea (Rich.) Amsh. Fabaceae
Sumaúma Ceiba pentandra (L.) Gaertn. Malvaceae
Tachi branco Sclerolobium paraense Huber Caesalpiniaceae
Tanimbuca amarela Terminalia argentea (Berg.) Mart. & Zucc. Combretaceae
Tanimbuca folha grande Buchenavia grandis Ducke Combretaceae
Tanimbuca folha média Terminalia amazonica Exell Combretaceae
Tanimbuca folha pequena Buchenavia parvifolia Ducke Combretaceae
Tatajuba Bagassa guianensis Aubl Moraceae
Tauari Couratari pulchra Sandw Lecythidaceae
Tauari branco Couratari oblongifolia Ducke & Knuth Lecythidaceae
Timborana Piptadenia communis Bentham Fabaceae
Ucuúba branca Virola flexuosa A.C.Smith Myristicaceae
Ucuubão Osteophloeum platyspermum (A.DC.) Warb. Myristicaceae
One species that deserves attention is Bertholletia excelsa Bonpl. known as castanheira-do-Brasil or
castanha-do-Pará (Figure 67), a species of rectilinear stem, covered with a grayish-brown bark, large and very
fragrant yellow flowers, flowering between the months of November to February (LORENZI, 2016). Usually
located in fry land areas throughout the Amazon and belonging to the final phase of ecological succession with
long life. This species is considered one of the most important species of the whole biome, because it is more
explored and exported. It has moderately good resistant wood, but its exploitation is prohibited by law due to the
use of its fruits (SILVA, 2006).
It is considered a key species and its presence in the forest has a significant importance since the
communities located nearby use their fruit both for consumption and for commercialization, aiding in their income.
The seed of this species is one of the most recognized non-wood forest products (NTFP) in the domestic and
foreign markets. The presence of this species in the area is an extremely important factor in the planning of social
actions, both in the economic aspect, for historically symbolizing a significant source of income for the extractive
communities, and in the ecological aspect, since this species is listed in official country lists of endangered
species.
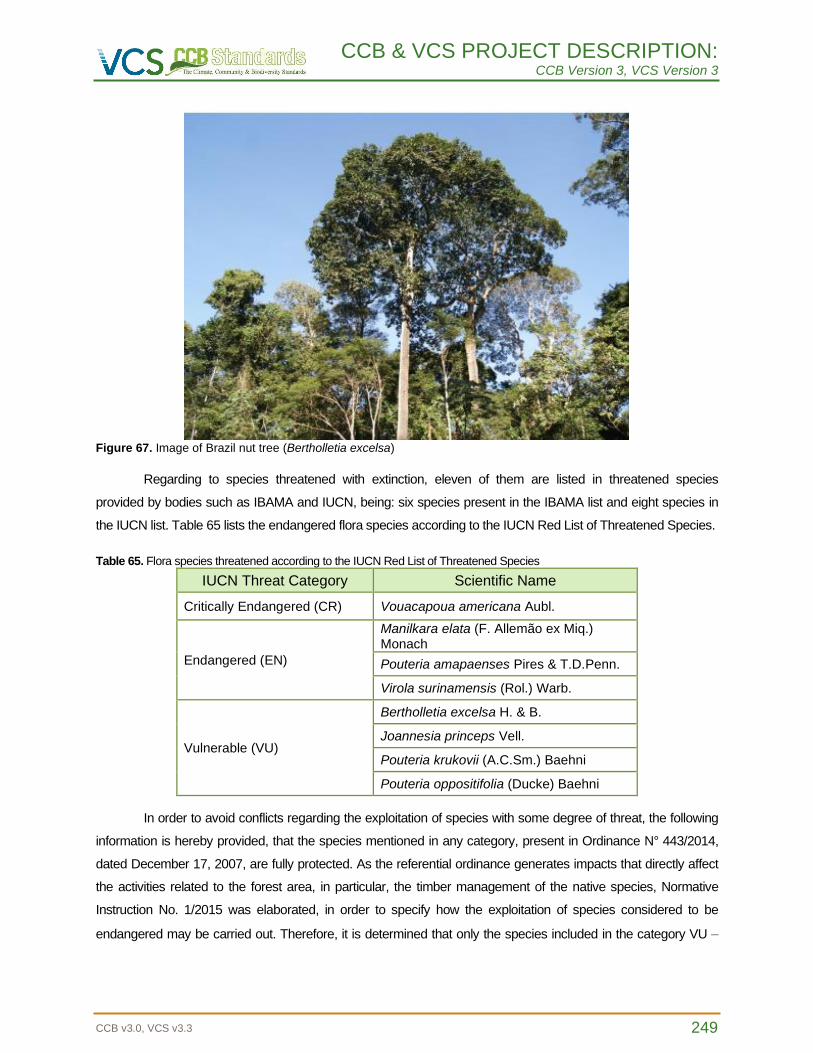
CCB & VCS PROJECT DESCRIPTION: CCB Version 3, VCS Version 3
CCB v3.0, VCS v3.3 249
Figure 67. Image of Brazil nut tree (Bertholletia excelsa)
Regarding to species threatened with extinction, eleven of them are listed in threatened species
provided by bodies such as IBAMA and IUCN, being: six species present in the IBAMA list and eight species in
the IUCN list. Table 65 lists the endangered flora species according to the IUCN Red List of Threatened Species.
Table 65. Flora species threatened according to the IUCN Red List of Threatened Species
IUCN Threat Category Scientific Name
Critically Endangered (CR) Vouacapoua americana Aubl.
Endangered (EN)
Manilkara elata (F. Allemão ex Miq.) Monach
Pouteria amapaenses Pires & T.D.Penn.
Virola surinamensis (Rol.) Warb.
Vulnerable (VU)
Bertholletia excelsa H. & B.
Joannesia princeps Vell.
Pouteria krukovii (A.C.Sm.) Baehni
Pouteria oppositifolia (Ducke) Baehni
In order to avoid conflicts regarding the exploitation of species with some degree of threat, the following
information is hereby provided, that the species mentioned in any category, present in Ordinance N° 443/2014,
dated December 17, 2007, are fully protected. As the referential ordinance generates impacts that directly affect
the activities related to the forest area, in particular, the timber management of the native species, Normative
Instruction No. 1/2015 was elaborated, in order to specify how the exploitation of species considered to be
endangered may be carried out. Therefore, it is determined that only the species included in the category VU –
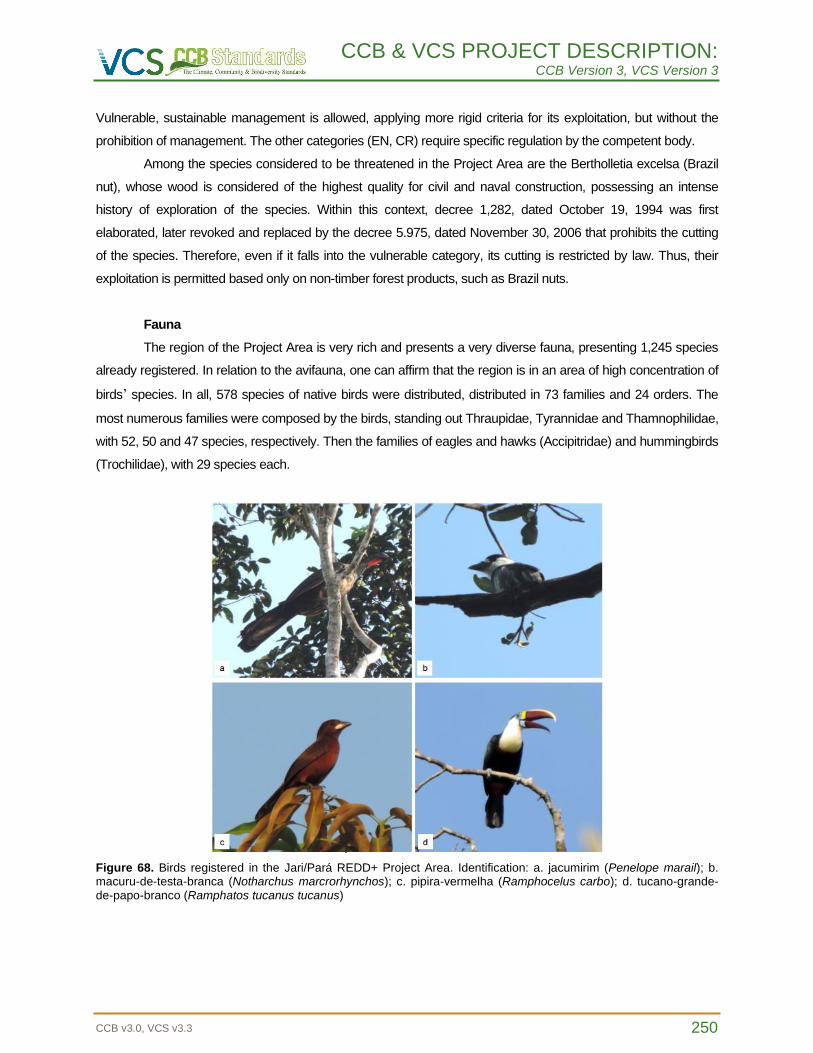
CCB & VCS PROJECT DESCRIPTION: CCB Version 3, VCS Version 3
CCB v3.0, VCS v3.3 250
Vulnerable, sustainable management is allowed, applying more rigid criteria for its exploitation, but without the
prohibition of management. The other categories (EN, CR) require specific regulation by the competent body.
Among the species considered to be threatened in the Project Area are the Bertholletia excelsa (Brazil
nut), whose wood is considered of the highest quality for civil and naval construction, possessing an intense
history of exploration of the species. Within this context, decree 1,282, dated October 19, 1994 was first
elaborated, later revoked and replaced by the decree 5.975, dated November 30, 2006 that prohibits the cutting
of the species. Therefore, even if it falls into the vulnerable category, its cutting is restricted by law. Thus, their
exploitation is permitted based only on non-timber forest products, such as Brazil nuts.
Fauna
The region of the Project Area is very rich and presents a very diverse fauna, presenting 1,245 species
already registered. In relation to the avifauna, one can affirm that the region is in an area of high concentration of
birds’ species. In all, 578 species of native birds were distributed, distributed in 73 families and 24 orders. The
most numerous families were composed by the birds, standing out Thraupidae, Tyrannidae and Thamnophilidae,
with 52, 50 and 47 species, respectively. Then the families of eagles and hawks (Accipitridae) and hummingbirds
(Trochilidae), with 29 species each.
Figure 68. Birds registered in the Jari/Pará REDD+ Project Area. Identification: a. jacumirim (Penelope marail); b. macuru-de-testa-branca (Notharchus marcrorhynchos); c. pipira-vermelha (Ramphocelus carbo); d. tucano-grande-de-papo-branco (Ramphatos tucanus tucanus)
CCB & VCS PROJECT DESCRIPTION: CCB Version 3, VCS Version 3
CCB v3.0, VCS v3.3 251
The Project Area also includes species considered endemic to the North Amazon, which
accounted for 7.6% of the wealth raised, that is, 44 species. A particular site is only considered an
Important Bird Area (IBA) for Conservation when it has at least 21 endemic species, once again extolling
the diversity of birds sheltered in the region, according to De Luca et al. (2009). There is also a record of
157 species with high sensitivity to disturbance, such as tovacuçu (Grallaria varia), vira-folha-de-peito-
vermelho (Sclerurus macconnelli), inhambu-anhangá (Crypturellus variegatus), and large predators, as
gavião-real (Harpia harpija) and uiraçu-falso (Morphnus guianensis). Medium-sensitive birds comprised
38.6% of the avifauna, or 223 species. It is observed that for both of these sensitivity categories, most are
dependent on forests, denoting the occurrence of a forest environment in good state of conservation, with
areas with significant environmental integrity.
The mammal community found in the Project Area is composed of 116 species, 54 of which are
bats, 30 large and medium sized mammals and 32 small ones. From the endemic species, 10 are
restricted to the Guiana Shield (LIM et al., 2005).
The region in which the Jari/Pará REDD+ Project is inserted has 86 species of amphibians and
85 species of reptiles, some of which still do not have their epithet identified or described. Amphibians are
represented by two orders: Anura (toads, frogs and tree frogs) with 83 species, and Gymnophiona (blind-
snakes), with only 3 species. As for the reptiles, there are three orders: Squamata (lizards, snakes and
amphisbaena), Testudines (turtles, tortoises and terrapins), Crocodylia (alligators), with 75, 7 and 3
species, respectively. As for Squamata, 41 snakes, 33 lizards and 1 amphisbaena have been recorded.
The ichthyofauna is composed of 356 species for the region, distributed in 46 families and 12
orders, according to the environmental impact study (EIA/RIMA) of HEP (Santo Antônio do Jari
Hydroelectric Plant) and also through the monitoring program of HEP Santo Antônio. Among the
inventoried orders, the richest were Characiformes, with 156 species, that is, 44% of the total richness,
followed by Siluriformes, with 113 species. Regarding the endemism of the Guiana Shield, the study area
has the potential to house 63 species of fish, of which 17 would be restricted, i.e., exclusive to the Jari
basin. Among the species confirmed for the locality, there are 21 endemic of this geological province,
composed basically by Characiformes and Siluriformes. Most registered endemic fish live in small inland
watercourses, for example, Bryconops affinis, B. melanurus and Lithosus bovallii.
From all the species registered in the Project Area, 135 are listed on the CITES (Convention on
International Trade in Endangered Species of Wild Fauna and Flora), being 114 species of birds, 7
species of amphibians and 14 species of reptiles. In the list issued by IBAMA there are a total of 14
species, classified as follows: a species of mammal considered to be endangered (category EN), three
species of birds and nine species of mammals fall within the category VU (vulnerable) and one species of
mammal is critically endangered (category CR).
In the IUCN list, there are a total of nineteen species in the three categories preached by the
organization, being a species of mammal in category EN (endangered), seventeen species of animals
(seven species of birds, six species of mammals, two species of amphibians and two reptile species) in
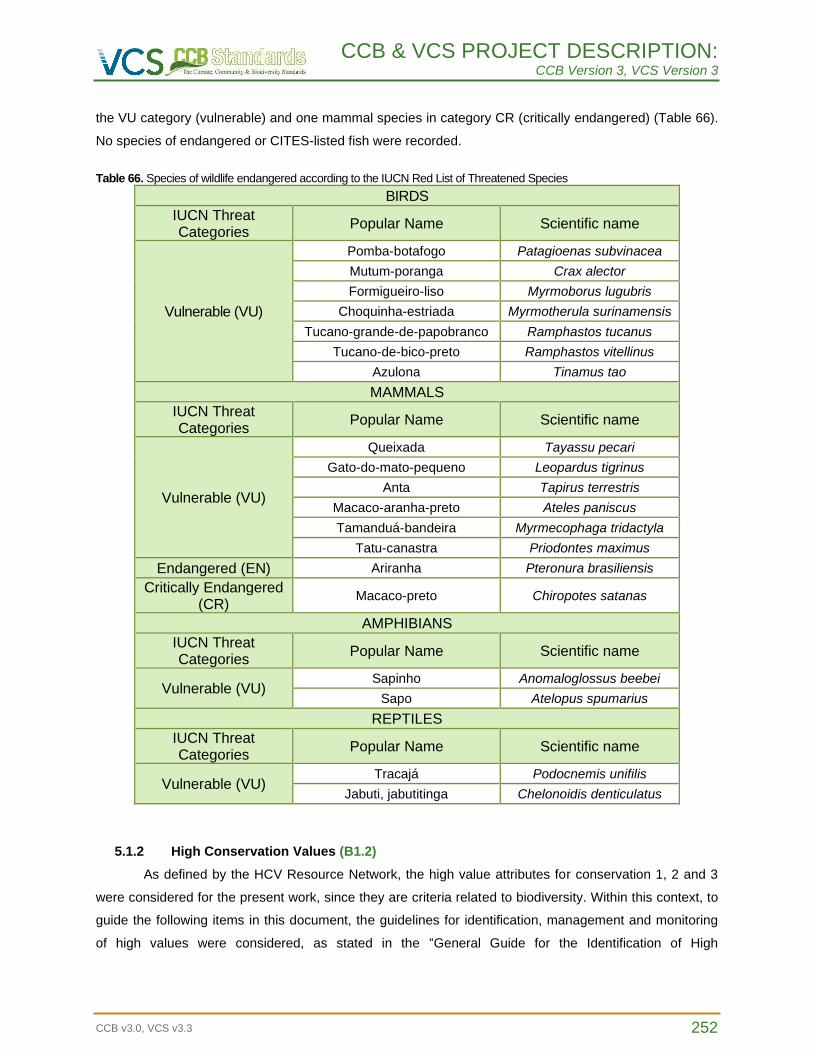
CCB & VCS PROJECT DESCRIPTION: CCB Version 3, VCS Version 3
CCB v3.0, VCS v3.3 252
the VU category (vulnerable) and one mammal species in category CR (critically endangered) (Table 66).
No species of endangered or CITES-listed fish were recorded.
Table 66. Species of wildlife endangered according to the IUCN Red List of Threatened Species
BIRDS
IUCN Threat Categories
Popular Name Scientific name
Vulnerable (VU)
Pomba-botafogo Patagioenas subvinacea
Mutum-poranga Crax alector
Formigueiro-liso Myrmoborus lugubris
Choquinha-estriada Myrmotherula surinamensis
Tucano-grande-de-papobranco Ramphastos tucanus
Tucano-de-bico-preto Ramphastos vitellinus
Azulona Tinamus tao
MAMMALS
IUCN Threat Categories
Popular Name Scientific name
Vulnerable (VU)
Queixada Tayassu pecari
Gato-do-mato-pequeno Leopardus tigrinus
Anta Tapirus terrestris
Macaco-aranha-preto Ateles paniscus
Tamanduá-bandeira Myrmecophaga tridactyla
Tatu-canastra Priodontes maximus
Endangered (EN) Ariranha Pteronura brasiliensis
Critically Endangered (CR)
Macaco-preto Chiropotes satanas
AMPHIBIANS
IUCN Threat Categories
Popular Name Scientific name
Vulnerable (VU) Sapinho Anomaloglossus beebei
Sapo Atelopus spumarius
REPTILES
IUCN Threat Categories
Popular Name Scientific name
Vulnerable (VU) Tracajá Podocnemis unifilis
Jabuti, jabutitinga Chelonoidis denticulatus
5.1.2 High Conservation Values (B1.2)
As defined by the HCV Resource Network, the high value attributes for conservation 1, 2 and 3
were considered for the present work, since they are criteria related to biodiversity. Within this context, to
guide the following items in this document, the guidelines for identification, management and monitoring
of high values were considered, as stated in the “General Guide for the Identification of High
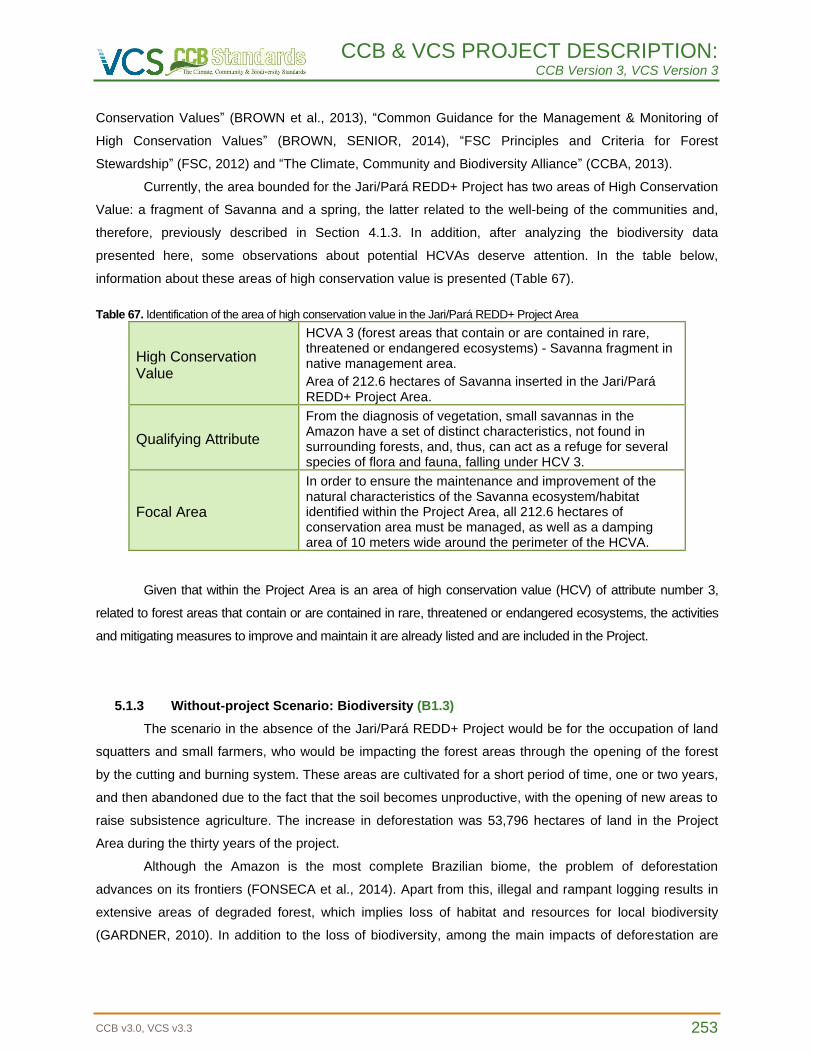
CCB & VCS PROJECT DESCRIPTION: CCB Version 3, VCS Version 3
CCB v3.0, VCS v3.3 253
Conservation Values” (BROWN et al., 2013), “Common Guidance for the Management & Monitoring of
High Conservation Values” (BROWN, SENIOR, 2014), “FSC Principles and Criteria for Forest
Stewardship” (FSC, 2012) and “The Climate, Community and Biodiversity Alliance” (CCBA, 2013).
Currently, the area bounded for the Jari/Pará REDD+ Project has two areas of High Conservation
Value: a fragment of Savanna and a spring, the latter related to the well-being of the communities and,
therefore, previously described in Section 4.1.3. In addition, after analyzing the biodiversity data
presented here, some observations about potential HCVAs deserve attention. In the table below,
information about these areas of high conservation value is presented (Table 67).
Table 67. Identification of the area of high conservation value in the Jari/Pará REDD+ Project Area
High Conservation Value
HCVA 3 (forest areas that contain or are contained in rare, threatened or endangered ecosystems) - Savanna fragment in native management area.
Area of 212.6 hectares of Savanna inserted in the Jari/Pará REDD+ Project Area.
Qualifying Attribute
From the diagnosis of vegetation, small savannas in the Amazon have a set of distinct characteristics, not found in surrounding forests, and, thus, can act as a refuge for several species of flora and fauna, falling under HCV 3.
Focal Area
In order to ensure the maintenance and improvement of the natural characteristics of the Savanna ecosystem/habitat identified within the Project Area, all 212.6 hectares of conservation area must be managed, as well as a damping area of 10 meters wide around the perimeter of the HCVA.
Given that within the Project Area is an area of high conservation value (HCV) of attribute number 3,
related to forest areas that contain or are contained in rare, threatened or endangered ecosystems, the activities
and mitigating measures to improve and maintain it are already listed and are included in the Project.
5.1.3 Without-project Scenario: Biodiversity (B1.3)
The scenario in the absence of the Jari/Pará REDD+ Project would be for the occupation of land
squatters and small farmers, who would be impacting the forest areas through the opening of the forest
by the cutting and burning system. These areas are cultivated for a short period of time, one or two years,
and then abandoned due to the fact that the soil becomes unproductive, with the opening of new areas to
raise subsistence agriculture. The increase in deforestation was 53,796 hectares of land in the Project
Area during the thirty years of the project.
Although the Amazon is the most complete Brazilian biome, the problem of deforestation
advances on its frontiers (FONSECA et al., 2014). Apart from this, illegal and rampant logging results in
extensive areas of degraded forest, which implies loss of habitat and resources for local biodiversity
(GARDNER, 2010). In addition to the loss of biodiversity, among the main impacts of deforestation are
CCB & VCS PROJECT DESCRIPTION: CCB Version 3, VCS Version 3
CCB v3.0, VCS v3.3 254
the reduction of productivity (erosion, soil compaction and nutrient exhaustion) and changes in the
hydrological regime, which highlights the need for measures to contain it, with loss of sustainable forest
use (FEARNSIDE, 2005). In the last two decades, several studies have estimated that changes in land
use, including deforestation and forest degradation, accounted for around 17-29% of greenhouse gas
emissions in tropical regions (FEARNSIDE, 2000; MYERS, 2007; VAN DER WERF et al., 2009).
Project initiatives such as REDD+ are one of the few alternatives for the conservation of the
biome and associated biodiversity (PAVAN, CENAMO, 2012). Therefore, measures to reduce
deforestation rates are urgent (LAURENCE; VASCONCELOS, 2009), and regional protected area
systems are fundamental to neutralize and buffer impacts in the Amazon region (SILVA et al., 2005). It
should be noted that the Jari/Pará REDD+ Project is located in a strategic conservation area - among
several Conservation Units (of Integral Protection and Sustainable Use), often composing the buffer zone
and establishing a forest connection between UCs. Thus, responsible forest management maximizes the
conservation potential of these UCs as well as enhances the enterprise as an important private sector
actor in mitigating climate change and conserving socio-biodiversity.
The survey of secondary data of the Jari Project about its biota showed a high number of species
occurring, some of which indicate the occurrence of intact environments. This fact is certainly related to
the maintenance of the standing forest due to the good management practices applied in the forest,
corroborating the one observed in other areas also managed in Amazon (GUILHERME; CINTRA, 2001;
WUNDERLE et al., 2006; HENRIQUES et al., 2008; CARDONA, 2012). In addition, the great territorial
extension of the Jari Project and its forest and savanna adjacencies have a great variety of
phytophysiognomies, which also contribute to the high biodiversity found.
The differences in the way the forests are managed, including the maximum number of trees
removed per hectare, the rotation and the latency period of the production units, allowing future
exploration (BARRETO et al., 1998) and good local sustainable management practices determine the
effects (positive or negative) and their extent on biodiversity (GARDNER, 2010). Thus, in view of the
results presented, biodiversity studies are encouraged in the two broadest typologies (Dense
Ombrophilous Forest and Open Ombrophilous Forest) and two with differentiated edaphic characteristics
(areas with fluvial and Savanna influence).
Generally, without the REDD+ Project and in a more pessimistic scenario, the deforestation
pressure in the project's area of expansion tends to increase and gradually move towards the boundaries
of the Project Area. With the REDD+ mechanism, resources for the sale of carbon credits will contribute
to the promotion of activities aimed at reducing the loss of forest habitat, which guarantees the standing
of the forest and the consequent conservation of the species of fauna and flora, maintaining their
populations viable, since, with the advancement of deforestation, the forest environment tends to be
replaced by anthropic areas over time (FEARNSIDE, 2006). The progress of deforestation leads to loss of
structural and functional connectivity among remnants of forest, which reduces gene flow among
populations, affecting fauna displacement and dispersion of propagules (Laurance, VASCONCELOS,
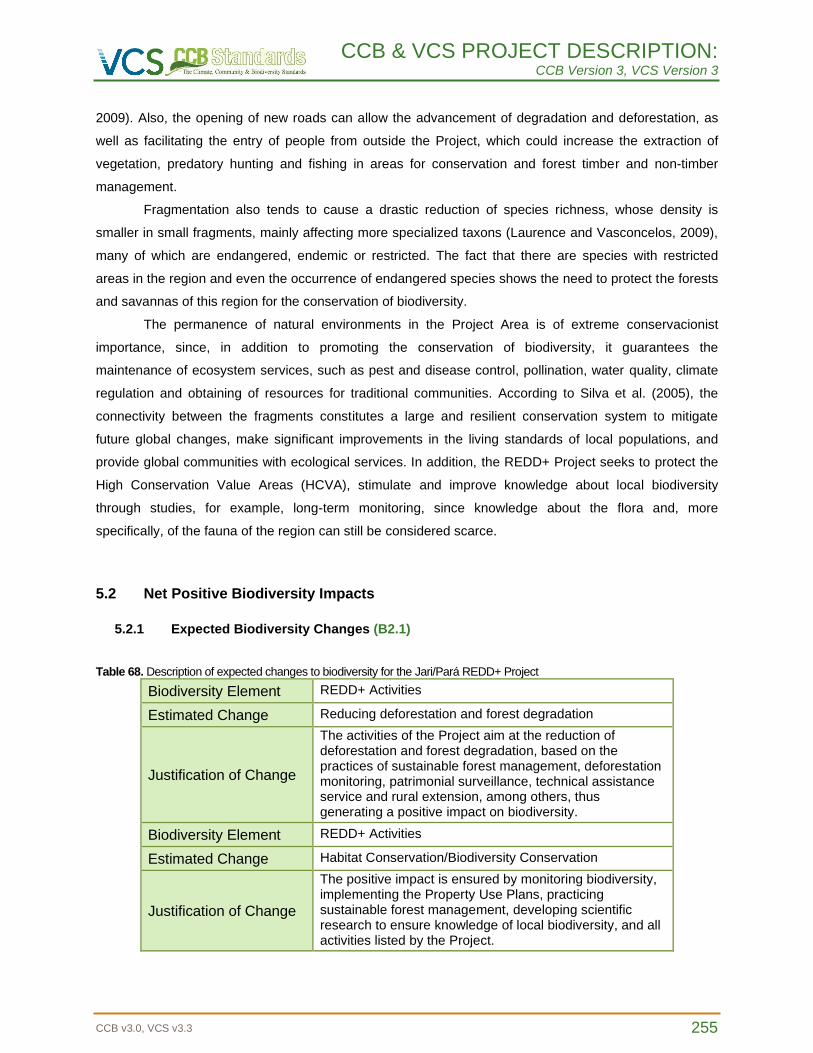
CCB & VCS PROJECT DESCRIPTION: CCB Version 3, VCS Version 3
CCB v3.0, VCS v3.3 255
2009). Also, the opening of new roads can allow the advancement of degradation and deforestation, as
well as facilitating the entry of people from outside the Project, which could increase the extraction of
vegetation, predatory hunting and fishing in areas for conservation and forest timber and non-timber
management.
Fragmentation also tends to cause a drastic reduction of species richness, whose density is
smaller in small fragments, mainly affecting more specialized taxons (Laurence and Vasconcelos, 2009),
many of which are endangered, endemic or restricted. The fact that there are species with restricted
areas in the region and even the occurrence of endangered species shows the need to protect the forests
and savannas of this region for the conservation of biodiversity.
The permanence of natural environments in the Project Area is of extreme conservacionist
importance, since, in addition to promoting the conservation of biodiversity, it guarantees the
maintenance of ecosystem services, such as pest and disease control, pollination, water quality, climate
regulation and obtaining of resources for traditional communities. According to Silva et al. (2005), the
connectivity between the fragments constitutes a large and resilient conservation system to mitigate
future global changes, make significant improvements in the living standards of local populations, and
provide global communities with ecological services. In addition, the REDD+ Project seeks to protect the
High Conservation Value Areas (HCVA), stimulate and improve knowledge about local biodiversity
through studies, for example, long-term monitoring, since knowledge about the flora and, more
specifically, of the fauna of the region can still be considered scarce.
5.2 Net Positive Biodiversity Impacts
5.2.1 Expected Biodiversity Changes (B2.1)
Table 68. Description of expected changes to biodiversity for the Jari/Pará REDD+ Project
Biodiversity Element REDD+ Activities
Estimated Change Reducing deforestation and forest degradation
Justification of Change
The activities of the Project aim at the reduction of deforestation and forest degradation, based on the practices of sustainable forest management, deforestation monitoring, patrimonial surveillance, technical assistance service and rural extension, among others, thus generating a positive impact on biodiversity.
Biodiversity Element REDD+ Activities
Estimated Change Habitat Conservation/Biodiversity Conservation
Justification of Change
The positive impact is ensured by monitoring biodiversity, implementing the Property Use Plans, practicing sustainable forest management, developing scientific research to ensure knowledge of local biodiversity, and all activities listed by the Project.
CCB & VCS PROJECT DESCRIPTION: CCB Version 3, VCS Version 3
CCB v3.0, VCS v3.3 256
5.2.2 Mitigation Measures (B2.3)
The Jari Pará REDD+ Project will mainly work on maintaining the habitat of the species present in
the project area, seeking to reduce and control the threats suffered by the biotic community present in the
area, through the described in item 2.1.11 Project Activities and Theory of Change.
The data collected for the studies related to biodiversity were satisfactory in order to evaluate the
current context of biodiversity conservation in the Project Zone, and with a focus on the Project Area,
however, longer studies are needed to elucidate the variations that occur in the biotic community during
forest modifications, whether due to the reduction of the forest area in the Project Zone and external to
the project area, climate change or management activities, in order to better understand its dynamics
(HENRIQUES et al. , 2003).
Therefore, in order to seek improvement in the population conditions of the species and mitigation
of the impacts caused by internal and external factors, the project proposes a plan to monitor the fauna
and flora, in order to deepen the knowledge of the biota of the region. In this way, it aims to provide
mitigation of the potential impacts caused to local biodiversity, key conservation species (triggers), and
high conservation value attributes (HCVs).
The potential impacts generated by the forest management activity in the project area, carried out
by the Grupo Jari or in partnership with local communities, will be monitored throughout the project
implementation period. It is believed that forest management is the main source of impact for biodiversity
in the project area. However, this activity has positive impacts that guarantee its viability, when applied in
a planned and well executed way, making the damages liable to mitigation. The forest management
implemented by the Grupo Jari is planned and performed according to a series of operating procedures,
work instructions and environmental procedures that are rigorously followed and monitored. In addition,
all employees are trained before the start of activities.
Any other forms of management to be implemented in the project area, that is, the exploitation of
multiple uses of the forest, will be practiced within the scope of the approved management plan and must
follow all the technical rigor required by law. The potential impacts generated on local Biodiversity by the
activities of responsible exploitation of forest resources will be identified, as well as the appropriate
mitigation measures will be implemented whenever possible.
5.2.3 Net Positive Biodiversity Impacts (B2.2, GL1.4)
The activities proposed by the Jari/Pará REDD+ Project seek to generate diverse benefits to the
climate, communities and biodiversity. The main benefits to biodiversity are linked to the reduction of
deforestation and forest degradation and the conservation of biodiversity and habitats.
The implementation of the Project activities, as described above, have a direct and positive
impact on biodiversity, such as the maintenance of vegetation cover and the conservation of biodiversity,
acting directly against the loss of habitats and also against the fragmentation of the local vegetation
CCB & VCS PROJECT DESCRIPTION: CCB Version 3, VCS Version 3
CCB v3.0, VCS v3.3 257
cover. These positive impacts are due to avoided deforestation, improvements in management practices,
monitoring of deforestation and biodiversity, technical assistance and rural extension, patrimonial
surveillance, and other activities carried out during the life of the Project.
The effectiveness of the Project's activities is intended to generate positive net impacts to the
climate, communities and biodiversity, but negative impacts may arise, and mitigation measures are
necessary to avoid and minimize these impacts. From all the activities listed for the Project (Table 10),
sustainable forest management may be the activity with the most negative impacts on biodiversity.
The sustainable forest management implemented by the Grupo Jari is well planned and
performed in a correct manner, following strict norms and well-established criteria, which guarantee the
abundance and biodiversity of the local species. In large part, the negative impacts of this activity are
ephemeral and not very severe, and do not endanger the conservation of the species. Negative impacts
may be related to disturbances due to increased vehicle and person traffic in the Project region and noise
production, local suppression of few species to open tracks and infrastructure, possible trampling of
animals, increased hunting, fishing, and extraction of wood and non-timber products, as a consequence
of the opening of tracks and bites.
In the scenario with the Project, we can see the generation of several positive impacts on
biodiversity, a result of the reduction of deforestation and forest degradation in the Project Area, thus
promoting biodiversity conservation and mitigating the risks of extinction, guaranteeing genetic diversity,
among others effects. The indirect impacts promoted by climate change on biodiversity will also be
attenuated.
5.2.4 High Conservation Values Protected (B2.4)
The Project Area has a High Conservation Value attribute related to biodiversity, which has
already been described in section 5.1.2 – High Conservation Values and is related to forest areas that
contain or are contained in rare ecosystems, threatened or endangered. The measures proposed to
ensure the integrity of this ecosystem and thus, maintain and improve this attribute are activities already
incorporated by the Project (Table 10). Therefore, the potential positive and negative impacts for this area
have already been described and the activities of the Project are already aimed at generating positive
impacts on this attribute.
5.2.5 Species Used (B2.5)
An important role in the region’s economy is filled by vegetable extraction and forestry, mainly as
a source of subsistence for families. The vegetal extraction of the municipalities mainly counts on the
management of non-timber forest products (NWFP) of native species of the region, such as brazil nuts
and açai berry.
CCB & VCS PROJECT DESCRIPTION: CCB Version 3, VCS Version 3
CCB v3.0, VCS v3.3 258
In addition, the rural communities living in the Project Area are mainly engaged in the production
of cassava, flour and cassava, according to the Family Diagnosis of the Jari/Pará REDD+ Project. Crops
of corn, banana, orange, cabbage, cupuaçu, eucalyptus and cacao are also employed by some local
communities but in smaller scales than the others already mentioned.
5.2.6 Invasive Species (B2.5)
The Jari/Pará REDD+ Project encourages the use of native species by local rural communities,
such as Brazil nut, açai berry, cassava, cupuaçu, among others. Nonetheless, some non-native species
are used by the communities because they have been introduced in the region for a long time, dating
back to historical period and are still part of the local culture, serving as a source of food and income for
these rural and urban communities in the region.
Widely cultivated in other regions of Brazil, these exotic species are not recognized for
threatening and/or harming native species. No invasive species will be introduced or their population will
increase due to the activities of the Project, noting that this Project promotes the use of native species by
local communities.
5.2.7 Impacts of Non-native Species (B2.6)
As specified above (section 5.2.6 – Invasive Species), the Jari/Pará REDD+ Project encourages
the use of native species by local communities. In addition, approximately 75% of the main crops and
sources of income of the producers assisted by the Project are based on the development and production
of native species (Brazil nut, açai berry, flour, cassava, cupuaçu, among others)
The few non-native species are however used by local communities, i.e., small-scale use and do
not have an adverse impact on the environment. Again, quoting the text above, these species have been
cultivated for years, being part of the cultural history of the region and serving as a source of subsistence
for these communities and not being encouraged their use by the Jari/Pará REDD+ Project.
5.2.8 Genetically Modified Organisms (GMO) Exclusion (B2.7)
Through the Jari/Pará REDD+ Project it is guaranteed that no genetically modified organisms
(GMOs) will be used. It is also ensured that the seeds and seedlings of forest and agricultural species
provided to communities are not GMOs. The reduction or removal of greenhouse gas emissions will be
achieved through reduction of deforestation and forest degradation.
5.2.9 Inputs Justification (B2.8)
Table 69. Description of the main fertilizer used in the Jari/Pará REDD+ Project
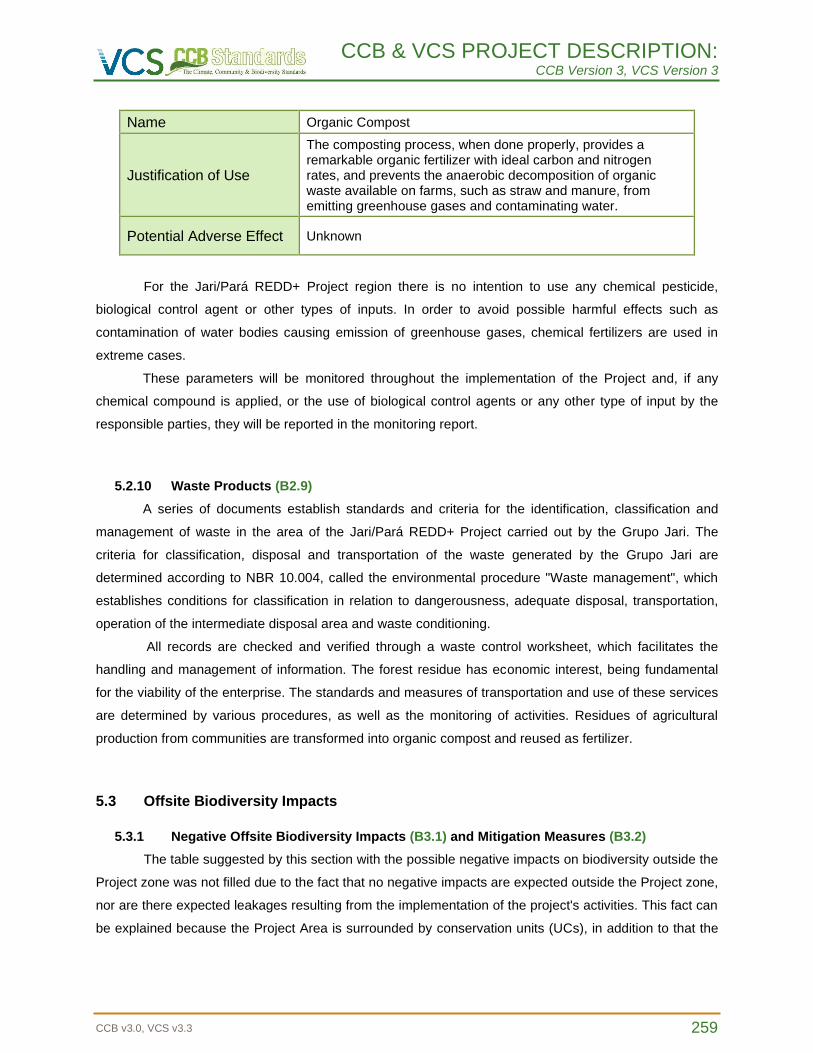
CCB & VCS PROJECT DESCRIPTION: CCB Version 3, VCS Version 3
CCB v3.0, VCS v3.3 259
Name Organic Compost
Justification of Use
The composting process, when done properly, provides a remarkable organic fertilizer with ideal carbon and nitrogen rates, and prevents the anaerobic decomposition of organic waste available on farms, such as straw and manure, from emitting greenhouse gases and contaminating water.
Potential Adverse Effect Unknown
For the Jari/Pará REDD+ Project region there is no intention to use any chemical pesticide,
biological control agent or other types of inputs. In order to avoid possible harmful effects such as
contamination of water bodies causing emission of greenhouse gases, chemical fertilizers are used in
extreme cases.
These parameters will be monitored throughout the implementation of the Project and, if any
chemical compound is applied, or the use of biological control agents or any other type of input by the
responsible parties, they will be reported in the monitoring report.
5.2.10 Waste Products (B2.9)
A series of documents establish standards and criteria for the identification, classification and
management of waste in the area of the Jari/Pará REDD+ Project carried out by the Grupo Jari. The
criteria for classification, disposal and transportation of the waste generated by the Grupo Jari are
determined according to NBR 10.004, called the environmental procedure "Waste management", which
establishes conditions for classification in relation to dangerousness, adequate disposal, transportation,
operation of the intermediate disposal area and waste conditioning.
All records are checked and verified through a waste control worksheet, which facilitates the
handling and management of information. The forest residue has economic interest, being fundamental
for the viability of the enterprise. The standards and measures of transportation and use of these services
are determined by various procedures, as well as the monitoring of activities. Residues of agricultural
production from communities are transformed into organic compost and reused as fertilizer.
5.3 Offsite Biodiversity Impacts
5.3.1 Negative Offsite Biodiversity Impacts (B3.1) and Mitigation Measures (B3.2)
The table suggested by this section with the possible negative impacts on biodiversity outside the
Project zone was not filled due to the fact that no negative impacts are expected outside the Project zone,
nor are there expected leakages resulting from the implementation of the project's activities. This fact can
be explained because the Project Area is surrounded by conservation units (UCs), in addition to that the
CCB & VCS PROJECT DESCRIPTION: CCB Version 3, VCS Version 3
CCB v3.0, VCS v3.3 260
social activities of the Jari/Pará REDD+ Project are already designed to mitigate any possible leakages,
thus providing harmony among man in the field and the forest.
5.3.2 Net Offsite Biodiversity Benefits (B3.3)
As mentioned in the section above (section 5.3.1), no negative impacts are expected outside the
Project Area, nor are leakages due to activities undertaken. Therefore, mitigating actions are not
necessary. In addition, the social activities carried out by this Project are already designed to mitigate
possible leakages that may occur.
As the Project Area is surrounded by conservation units (UCs), positive impacts on biodiversity
outside the Project Area are observed, with the main expected positive impacts being the maintenance of
an ecological corridor for biodiversity, which serves as a refuge and protection for endangered species
and ecosystems and are places where ecological processes can occur without any human intervention or
only with sustainable use, and the Project Area functions as a buffer zone for risks and threats to the
mosaic of protected areas of the North of the State of Pará.
5.4 Biodiversity Impact Monitoring
5.4.1 Biodiversity Monitoring Plan (B4.1, B4.2, GL1.4, GL3.4)
A fundamental tool, the monitoring of biodiversity makes it possible to measure the impacts of the
possible activities caused by the Project on biodiversity, providing adjustments and relevant repairs in the
pursuit of the desired goals.
For the Jari/Pará REDD+ Project, monitoring of the managed areas is systematically carried out
by the Grupo Jari team, evaluated through periodic forest inventories an following the criteria of
certification standards, aiming at the short- and long-term monitoring. The general monitoring of activities,
as well as the environmental, economic and social performance of forest management, is also carried
out.
It should be noted that the Jari/Pará REDD+ Project is located in a strategic conservation area -
among several Conservation Units (of Integral Protection and Sustainable Use), often composing the
buffer zone and establishing a forest connection between UCs. With this, responsible forest management
maximizes the conservation potential of these UCs as well as enhances the enterprise as an important
actor in the private sector in mitigating climate change and conserving socio-biodiversity.
The region where the Jari Project is located has a rich biodiversity and the occurrence of a
significant number of species, in addition to extending through various forest phytophysiognomies, which
contribute to the increase of local biodiversity. This diverse biota indicates the existence of good
management practices applied to the Amazon forest and, consequently, the maintenance of the forest
standing and the occurrence of intact environments (CARDONA, 2012).
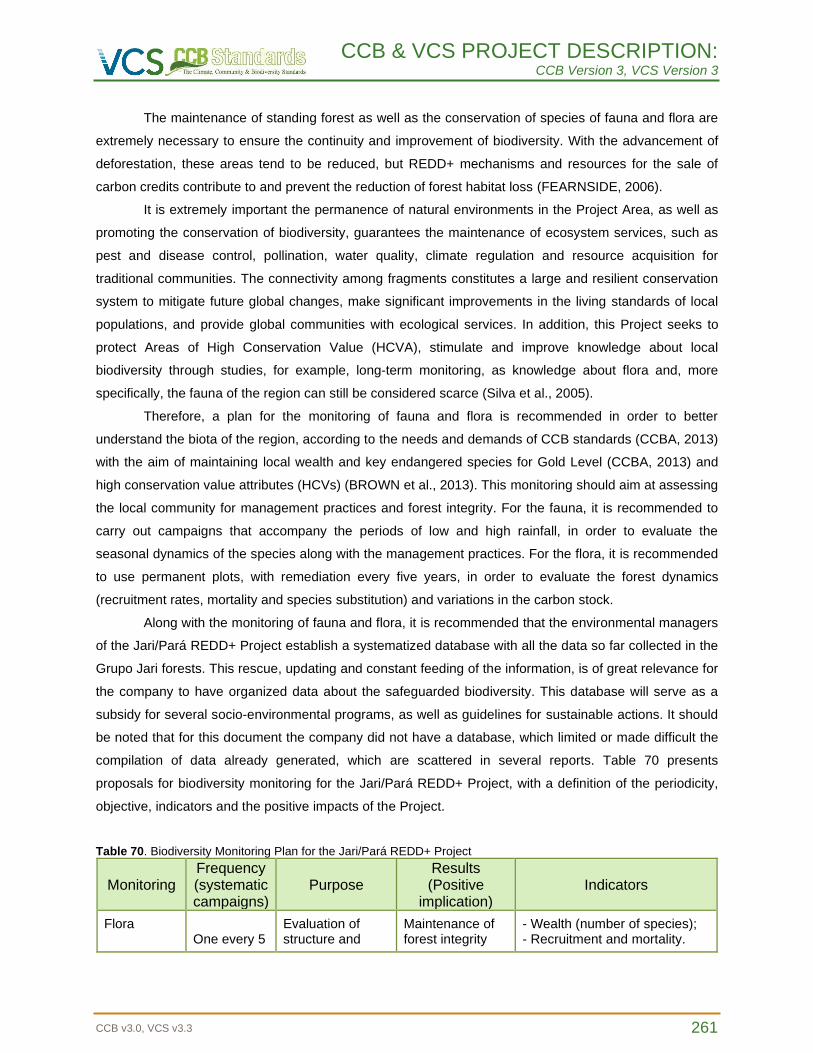
CCB & VCS PROJECT DESCRIPTION: CCB Version 3, VCS Version 3
CCB v3.0, VCS v3.3 261
The maintenance of standing forest as well as the conservation of species of fauna and flora are
extremely necessary to ensure the continuity and improvement of biodiversity. With the advancement of
deforestation, these areas tend to be reduced, but REDD+ mechanisms and resources for the sale of
carbon credits contribute to and prevent the reduction of forest habitat loss (FEARNSIDE, 2006).
It is extremely important the permanence of natural environments in the Project Area, as well as
promoting the conservation of biodiversity, guarantees the maintenance of ecosystem services, such as
pest and disease control, pollination, water quality, climate regulation and resource acquisition for
traditional communities. The connectivity among fragments constitutes a large and resilient conservation
system to mitigate future global changes, make significant improvements in the living standards of local
populations, and provide global communities with ecological services. In addition, this Project seeks to
protect Areas of High Conservation Value (HCVA), stimulate and improve knowledge about local
biodiversity through studies, for example, long-term monitoring, as knowledge about flora and, more
specifically, the fauna of the region can still be considered scarce (Silva et al., 2005).
Therefore, a plan for the monitoring of fauna and flora is recommended in order to better
understand the biota of the region, according to the needs and demands of CCB standards (CCBA, 2013)
with the aim of maintaining local wealth and key endangered species for Gold Level (CCBA, 2013) and
high conservation value attributes (HCVs) (BROWN et al., 2013). This monitoring should aim at assessing
the local community for management practices and forest integrity. For the fauna, it is recommended to
carry out campaigns that accompany the periods of low and high rainfall, in order to evaluate the
seasonal dynamics of the species along with the management practices. For the flora, it is recommended
to use permanent plots, with remediation every five years, in order to evaluate the forest dynamics
(recruitment rates, mortality and species substitution) and variations in the carbon stock.
Along with the monitoring of fauna and flora, it is recommended that the environmental managers
of the Jari/Pará REDD+ Project establish a systematized database with all the data so far collected in the
Grupo Jari forests. This rescue, updating and constant feeding of the information, is of great relevance for
the company to have organized data about the safeguarded biodiversity. This database will serve as a
subsidy for several socio-environmental programs, as well as guidelines for sustainable actions. It should
be noted that for this document the company did not have a database, which limited or made difficult the
compilation of data already generated, which are scattered in several reports. Table 70 presents
proposals for biodiversity monitoring for the Jari/Pará REDD+ Project, with a definition of the periodicity,
objective, indicators and the positive impacts of the Project.
Table 70. Biodiversity Monitoring Plan for the Jari/Pará REDD+ Project
Monitoring Frequency (systematic campaigns)
Purpose Results (Positive
implication) Indicators
Flora
One every 5
Evaluation of structure and
Maintenance of forest integrity
- Wealth (number of species); - Recruitment and mortality.
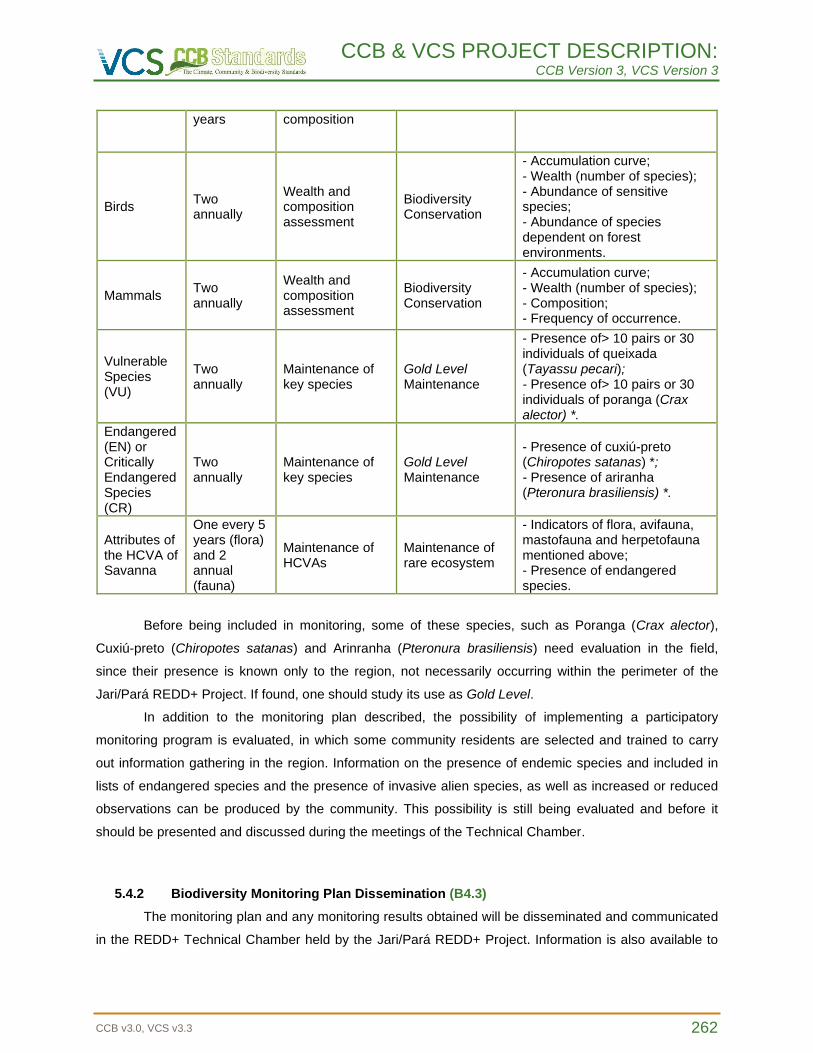
CCB & VCS PROJECT DESCRIPTION: CCB Version 3, VCS Version 3
CCB v3.0, VCS v3.3 262
years
composition
Birds Two annually
Wealth and composition assessment
Biodiversity Conservation
- Accumulation curve; - Wealth (number of species); - Abundance of sensitive species; - Abundance of species dependent on forest environments.
Mammals Two annually
Wealth and composition assessment
Biodiversity Conservation
- Accumulation curve; - Wealth (number of species); - Composition; - Frequency of occurrence.
Vulnerable Species (VU)
Two annually
Maintenance of key species
Gold Level Maintenance
- Presence of> 10 pairs or 30 individuals of queixada (Tayassu pecari); - Presence of> 10 pairs or 30 individuals of poranga (Crax alector) *.
Endangered (EN) or Critically Endangered Species (CR)
Two annually
Maintenance of key species
Gold Level Maintenance
- Presence of cuxiú-preto (Chiropotes satanas) *; - Presence of ariranha (Pteronura brasiliensis) *.
Attributes of the HCVA of Savanna
One every 5 years (flora) and 2 annual (fauna)
Maintenance of HCVAs
Maintenance of rare ecosystem
- Indicators of flora, avifauna, mastofauna and herpetofauna mentioned above; - Presence of endangered species.
Before being included in monitoring, some of these species, such as Poranga (Crax alector),
Cuxiú-preto (Chiropotes satanas) and Arinranha (Pteronura brasiliensis) need evaluation in the field,
since their presence is known only to the region, not necessarily occurring within the perimeter of the
Jari/Pará REDD+ Project. If found, one should study its use as Gold Level.
In addition to the monitoring plan described, the possibility of implementing a participatory
monitoring program is evaluated, in which some community residents are selected and trained to carry
out information gathering in the region. Information on the presence of endemic species and included in
lists of endangered species and the presence of invasive alien species, as well as increased or reduced
observations can be produced by the community. This possibility is still being evaluated and before it
should be presented and discussed during the meetings of the Technical Chamber.
5.4.2 Biodiversity Monitoring Plan Dissemination (B4.3)
The monitoring plan and any monitoring results obtained will be disseminated and communicated
in the REDD+ Technical Chamber held by the Jari/Pará REDD+ Project. Information is also available to
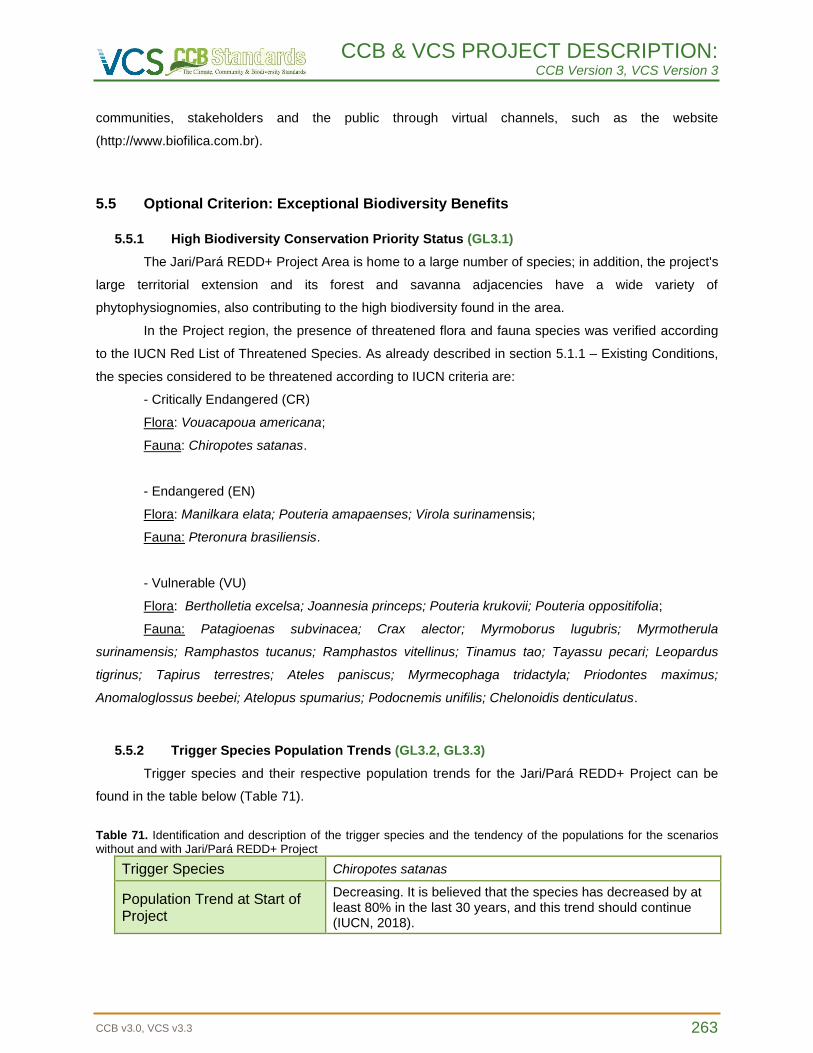
CCB & VCS PROJECT DESCRIPTION: CCB Version 3, VCS Version 3
CCB v3.0, VCS v3.3 263
communities, stakeholders and the public through virtual channels, such as the website
(http://www.biofilica.com.br).
5.5 Optional Criterion: Exceptional Biodiversity Benefits
5.5.1 High Biodiversity Conservation Priority Status (GL3.1)
The Jari/Pará REDD+ Project Area is home to a large number of species; in addition, the project's
large territorial extension and its forest and savanna adjacencies have a wide variety of
phytophysiognomies, also contributing to the high biodiversity found in the area.
In the Project region, the presence of threatened flora and fauna species was verified according
to the IUCN Red List of Threatened Species. As already described in section 5.1.1 – Existing Conditions,
the species considered to be threatened according to IUCN criteria are:
- Critically Endangered (CR)
Flora: Vouacapoua americana;
Fauna: Chiropotes satanas.
- Endangered (EN)
Flora: Manilkara elata; Pouteria amapaenses; Virola surinamensis;
Fauna: Pteronura brasiliensis.
- Vulnerable (VU)
Flora: Bertholletia excelsa; Joannesia princeps; Pouteria krukovii; Pouteria oppositifolia;
Fauna: Patagioenas subvinacea; Crax alector; Myrmoborus lugubris; Myrmotherula
surinamensis; Ramphastos tucanus; Ramphastos vitellinus; Tinamus tao; Tayassu pecari; Leopardus
tigrinus; Tapirus terrestres; Ateles paniscus; Myrmecophaga tridactyla; Priodontes maximus;
Anomaloglossus beebei; Atelopus spumarius; Podocnemis unifilis; Chelonoidis denticulatus.
5.5.2 Trigger Species Population Trends (GL3.2, GL3.3)
Trigger species and their respective population trends for the Jari/Pará REDD+ Project can be
found in the table below (Table 71).
Table 71. Identification and description of the trigger species and the tendency of the populations for the scenarios without and with Jari/Pará REDD+ Project
Trigger Species Chiropotes satanas
Population Trend at Start of Project
Decreasing. It is believed that the species has decreased by at least 80% in the last 30 years, and this trend should continue (IUCN, 2018).
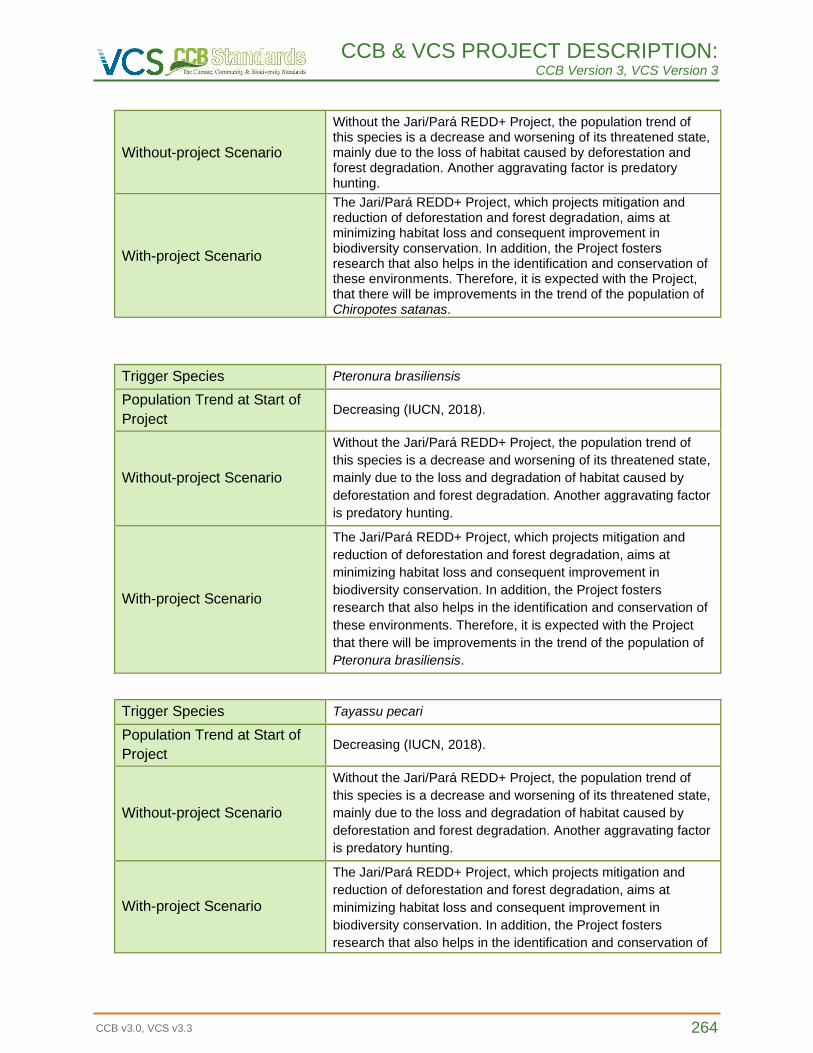
CCB & VCS PROJECT DESCRIPTION: CCB Version 3, VCS Version 3
CCB v3.0, VCS v3.3 264
Without-project Scenario
Without the Jari/Pará REDD+ Project, the population trend of this species is a decrease and worsening of its threatened state, mainly due to the loss of habitat caused by deforestation and forest degradation. Another aggravating factor is predatory hunting.
With-project Scenario
The Jari/Pará REDD+ Project, which projects mitigation and reduction of deforestation and forest degradation, aims at minimizing habitat loss and consequent improvement in biodiversity conservation. In addition, the Project fosters research that also helps in the identification and conservation of these environments. Therefore, it is expected with the Project, that there will be improvements in the trend of the population of Chiropotes satanas.
Trigger Species Pteronura brasiliensis
Population Trend at Start of
Project Decreasing (IUCN, 2018).
Without-project Scenario
Without the Jari/Pará REDD+ Project, the population trend of
this species is a decrease and worsening of its threatened state,
mainly due to the loss and degradation of habitat caused by
deforestation and forest degradation. Another aggravating factor
is predatory hunting.
With-project Scenario
The Jari/Pará REDD+ Project, which projects mitigation and
reduction of deforestation and forest degradation, aims at
minimizing habitat loss and consequent improvement in
biodiversity conservation. In addition, the Project fosters
research that also helps in the identification and conservation of
these environments. Therefore, it is expected with the Project
that there will be improvements in the trend of the population of
Pteronura brasiliensis.
Trigger Species Tayassu pecari
Population Trend at Start of
Project Decreasing (IUCN, 2018).
Without-project Scenario
Without the Jari/Pará REDD+ Project, the population trend of
this species is a decrease and worsening of its threatened state,
mainly due to the loss and degradation of habitat caused by
deforestation and forest degradation. Another aggravating factor
is predatory hunting.
With-project Scenario
The Jari/Pará REDD+ Project, which projects mitigation and
reduction of deforestation and forest degradation, aims at
minimizing habitat loss and consequent improvement in
biodiversity conservation. In addition, the Project fosters
research that also helps in the identification and conservation of
CCB & VCS PROJECT DESCRIPTION: CCB Version 3, VCS Version 3
CCB v3.0, VCS v3.3 265
these environments. Therefore, it is expected with the Project
that there will be improvements in the population trend of
Tayassu pecari.
Trigger Species Crax alector
Population Trend at Start of
Project
Decreasing. It is suspected that this species loses between 15%
and 24.4% of the adequate habitat within its distribution over
three generations (35 years) based on a model of deforestation
in the Amazon (IUCN, 2018).
Without-project Scenario
Without the Jari/Pará REDD+ Project, the population trend of
this species is a decrease and worsening of its threatened state,
mainly due to the loss and degradation of habitat caused by
deforestation and forest degradation. Another aggravating factor
is predatory hunting.
With-project Scenario
The Jari/Pará REDD+ Project, which projects mitigation and
reduction of deforestation and forest degradation, aims at
minimizing habitat loss and consequent improvement in
biodiversity conservation. In addition, the Project fosters
research that also helps in the identification and conservation of
these environments. Therefore, it is expected with the Project,
that there will be improvements in the trend of the population of
Crax alector.
CCB & VCS PROJECT DESCRIPTION: CCB Version 3, VCS Version 3
CCB v3.0, VCS v3.3 266
REFERENCES
ALVARES, C.A.; STAPE, J.L.; SENTELHAS, P.C.; GONÇALVES, J.L.M.; SPAROVEK, G. Köppen’s
climate classification map for Brazil. Meteorologische Zeitschrift, v. 22, n. 6, p. 711-728, 2013.
AMORIM, P.; MORGADO, R.; ESPADA, A.L.; BITTENCOURT, P.; LENTINI, M.; PALMIERI, R.
Diagnóstico econômico-ambiental no município de Almeirim, Pará. Belém, PA: Instituto Floresta
Tropical; Instituto de Manejo e Certificação Florestal e Agrícola (Imaflora), 2010.
ARAUJO et al. Comparison of formulae for biomass content determination in a tropical rain forest site in
the state of Pará, Brazil. Forest Ecology and Management, v. 117, p. 43 – 52, 1999.
ARIMA, BARRETO & BRITO, 2005. Pecuária na Amazônia: tendências e implicações para a
conservação ambiental. Belém, Instituto do Homem e Meio Ambiente da Amazônia, 2005.
ARVORAR; IPÊ. Diagnóstico ambiental da região do Projeto Jari/Amapá. Nazaré Paulista,
Dezembro, 2011.
ASNER, G. P.; KELLER, M.; LENTINI, M.; MERRY, F.; SOUZA, C. Selective logging and its relation to
deforestation. Amazônia and Global Change. Geophysical Monograph Series, v. 186, p.:25-42, 2009.
ATLAS DO DESENVOLVIMENTO HUMANO. O IDHM. 2013. Disponível em:
<http://www.atlasbrasil.org.br/2013/pt/o_atlas/idhm/>. Acesso em: 14 mai. 2018.
BARRETO, P. et al., 2011. Risco de desmatamento associado à hidrelétrica de Belo Monte, Belém:
s.n.
BARRETO, P.; AMARAL, P.; VIDAL, P.; UHL, C. Custos e benefícios do manejo florestal para redução
de madeira na Amazônia oriental. Belém: Imazon, Série Amazônia, v. 10, p. 46, 1998.
BARRETO, P; BRANDÃO JÚNIOR, A.; MARTINS, H.; SILVA, D.; SOUZA JÚNIOR, C.; SALES, M.;
FEITOSA, T. Risco de desmatamento associado à hidrelétrica de Belo Monte. Belém, PA: Instituto
do Homem e Meio Ambiente da Amazônia (IMAZON), 2011.
BEMERGUY, Lila. Extração tradicional de balata da Flota do Paru será preservada. Santarém, Pará,
Brasil, 19 dez. 2015. Disponível em: https://www.oestadonet.com.br/noticia/8682/extracao-tradicional-de-
balata-da-flota-do-paru-sera-preservada/. Acesso em: 1 jul. 2019.
BENSUSAN, N.; ARMSTRONG, G. (Coord.). O manejo da paisagem e a paisagem do manejo.
Brasília: Instituto Internacional de Educação do Brasil, 2008.
CCB & VCS PROJECT DESCRIPTION: CCB Version 3, VCS Version 3
CCB v3.0, VCS v3.3 267
BIOFÍLICA. Relatório de viabilidade econômica Fazenda Pacajá. 148 p. São Paulo, 2017.
BNDES – BANCO NACIONAL DE DESENVOLVIMENTO ECONÔMICO E SOCIAL. Fundo Amazônia.
Subprojeto: ASMACARU. Almeirim, Pará. 2018.
BRANDÃO JÚNIOR, A.; SOUZA JÚNIOR, C.M.; RIBEIRO, J.G.; SALES, M.H. Desmatamento e estradas
não-oficiais da Amazônia. XIII Simpósio Brasileiro de Sensoriamento Remoto. Florianópolis: INPE, 2007.
BRASIL. Ministério do Meio Ambiente. Contribuição Nacionalmente Determinada (NDC). MMA, 2015.
BROWN, E.; DUDLEY, N.; LINDHE, A.; MUHTAMAN, D.R.; STEWARD, C.; SYNNOTT, T. Guia geral
para identificação de Altos Valores de Conservação. Proforest. HCV Resource Network. 2013.
BROWN, E.; SENIOR, M.J.M. Common Guidance for the Management and Monitoring of High
Conservation Values. Proforest. HCV Resourse Network. 2014.
CÂMARA, G.; VALERIANO, D. M.; SOARES, J. V. Metodologia para o cálculo da taxa anual de
desmatamento na Amazônia Legal. INPE, São José dos Campos, 2006. 24p.
CARDONA, M.A.Q. Efeitos do manejo florestal na estrutura da avifauna na floresta Amazônica de
Paragominas (Pará). 107 p. Tese (Doutorado em Recursos Florestais), Escola Superior de Agricultura
Luiz de Queiroz. Piracicaba, 2012.
CASA DA FLORESTA. Contextualização Regional e Plano de Trabalho - Módulo Socioeconomia
Projeto REDD+ Jari/Pará. Piracicaba, 2016.
CASA DA FLORESTA. Relatório Final – Avaliação da Biodiversidade Projeto REDD+ Jari/Pará.
Piracicaba, 2016.
CASA DA FLORESTA. Relatório Final – Avaliação do Meio Físico Projeto REDD+ Jari/Pará.
Piracicaba, 2016.
CCBA - ALIANÇA PARA O CLIMA, COMUNIDADE E BIODIVERSIDADE. Padrões Clima, Comunidade
e Biodiversidade, Terceira Edição. Arlington, 2013.
CHAMBERS et al., 2001. Tree damage, allometric relationships, and above-groud net primary production
in central Amazon forest. Forest Ecology and Management, v. 152, p. 73 – 84, 2001.
CHAVE, J.; ANDALO, C.; BROWN, S.; CAIRNS, M.A; CHAMBERS, J.Q.; EAMUS, D.; FÖLSTER, H.;
FROMARD, F.; HIGUCHI, N.; KIRA, T.; LESCURE, J.P.; NELSON, B.W.; OGAWA, H.; PUIG, H.; RIERA,
CCB & VCS PROJECT DESCRIPTION: CCB Version 3, VCS Version 3
CCB v3.0, VCS v3.3 268
B.; YAMAKURA, T. Tree allometry and improved estimation of carbon stocks and balance in tropical
forests. Oecologia, v. 145, p. 87-99. 2005.
CHAVE, J.; REJOU-MECHAIN, M.; BURQUEZ, A.; CHIDUMAYO, E.; COLGAN, M.S.; DELITTI, W.B.C.;
DUQUE, A.; EID, T.; FEARNSIDE, P.M.; GOODMAN, R.C.; HENRY, M.; MARTINEZYRIZAR, A.;
MUGASHA, W.A.; MULLER-LANDAU, H.C.; MENCUCCINI, M.; NELSON, B.W.; NGOMANDA, A.;
NOGUEIRA, E.M.; ORTIZ-MALAVASSI, E.; PELISSIER, R.; PLOTON, P.; RYAN, C.M.; SALDARRIAGA,
J.G.. VIEILLEDENT, G. Improved allometric models to estimate the aboveground biomass of tropical
trees. Glob. Chang. Biol, p. 1-14, 2014.
CIKEL – BRASIL VERDE S/A. Plano de Manejo Florestal de Uso Múltiplo Empresarial da Fazenda
ABC, Agropecuária Brasil Norte S/A. 2003.
CONGALTON, R.G.; KASS GREEN. Assessing the accuracy of Remotely Sensed data: principles
and practices. New York – CRC Press, 1999.
COUTINHO, N. Produto 3 - Referente ao Relatório Final de Realização da Consulta Social Visando
a Complementação do Diagnóstico Socioeconômico e Ambiental do Projeto REDD+ Jari Pará.
Harmonia Consultoria Socioambiental, 2018
DANTAS, M.E.; TEIXEIRA, S.G. Origem das paisagens. In: JOÃO, X.S.J; TEIXEIRA, S.G.; FONSECA,
D.D.F (Organizadores). Geodiversidade do estado do Pará. Belém: CPRM, p.25-52, 2013.
DE CARVALHO, L. G.; SOUZA, B. R. G.; CUNHA, A. P. A. Passaporte para a floresta: a regulação do
extrativismo de balata na Floresta Estadual do Paru, estado do Pará, Brasil. Bol. Mus. Para. Emílio
Goeldi. Cienc. Hum. v. 13, n. 2, p. 261-291, maio-ago. 2018. Santarém, Pará, Brasil, 5 mar. 2018.
DE LUCA, A.C.; DEVELEY, P.F.; BENCKE, G.A.; GOERK, J.M. Áreas importantes para a
conservação das aves no Brasil: parte II – Amazônia, Cerrado e Pantanal. São Paulo: SAVE Brasil,
2009.
DE OLIVEIRA, M. M. S.; JARDIM, P. E. do V. A criação de valor compartilhado na Amazônia: uma
experiência de inovação social nas práticas organizacionais em zona remota do Vale do Jari. In:
OSVALDO, L.G et al. Transformação Organizacional para a Sustentabilidade. Rio de Janeiro: Benício
Biz, 2015. cap. 6, p. 74-87. Disponível em: <https://goo.gl/QQg2dY>. Acesso em: 06 set. 2018.
EASTMAN, J.R. 2006. IDRISI Manual. IDRISI Andes Guide to GIS and Image Processing. Manual
Version 15.00. Clark University, Worcester, MA-USA. p. 240-260.
CCB & VCS PROJECT DESCRIPTION: CCB Version 3, VCS Version 3
CCB v3.0, VCS v3.3 269
EMBRAPA. Brazilian Soil Classification System, 5th edition revised and expanded. Brazilian
Agricultural Research Corporation Embrapa Soils, Ministry of Agriculture, Livestock and Food Supply,
2018
EMPERAIRE, L. (Ed.). A Floresta em jogo: o extrativismo na Amazônia central. São Paulo: Editora
UNESP: Imprensa Oficial do Estado, 2000.
EPE - EMPRESA DE PESQUISA ENERGÉTICA. Bacia Hidrográfica do Rio Jari/PA-AP. Estudos de
Inventário Hidrelétrico. Relatório final. EPE. 2010. 202p.
FASE – Federação de Órgãos para Assistência Social e Educacional Programa Amazônia, et al.
Diagnóstico Socioeconômico e Ambiental das Comunidades Limítrofes da Fazenda ABC, Portel-Pará. 62
p. 2009.
FEARNSIDE, P.M. Amazonian deforestation and global warming: carbon stocks in vegetation replacing
Brazil’s Amazon forest. Forest Ecology and Management, v. 80, p. 21-34, 1994.
FEARNSIDE, P.M. Desmatamento na Amazônia brasileira: história, índices e consequências.
Megadiversidade. v. 1, n.1, p. 54-59, 2005.
FEARNSIDE, P.M. Desmatamento na Amazônia: dinâmica, impactos e controle. Acta Amazonica, v. 36,
n.3, p. 395-400, 2006.
FEARNSIDE, P.M. Global warming and tropical Land-Use change: Greenhouse gas emissions from
biomass burning, decomposition and soils in forest conversion, shifting cultivation and secondary
vegetation. Climatic Change, v. 46, p. 115-158, 2000.
FERREIRA, Rafael. Oportunidade: Floresta Estadual do Paru relança edital para concessão
florestal. [S. l.], 19 fev. 2018. Disponível em: https://www.wikiparques.org/oportunidade-floresta-
estadual-do-paru-relanca-edital-para-concessao-florestal/. Acesso em: 1 jul. 2019.
FOLEY, J. A. et al., 2007. Amazonia revealed: forest degradation and loss of ecosystem goods and
services in the Amazon Basin. Frontiers in Ecology and the Environment, Volume 5.
FONSECA, A.; SOUZA, J.R.; C.; VERÍSSIMO, A. Boletim do desmatamento da Amazônia Legal.
Imazon, Belém, out. 2014.
FRM. Relatório Final Diagnóstico Ambiental- Flora e Estimativa de Estoque de Carbono - Jari
Florestal. Belém, 2016
CCB & VCS PROJECT DESCRIPTION: CCB Version 3, VCS Version 3
CCB v3.0, VCS v3.3 270
FUNAI. Índios no Brasil, Terras Indígenas. Disponível em: <http://www.funai.gov.br/index.php/indios-
no-brasil/terras-indigenas>. Acesso em: 31 ago. 2015.
FUNAI. Índios no Brasil, Terras Indígenas. Disponível em: <http://www.funai.gov.br/index.php/indios-
no-brasil/terras-indigenas>. Acesso em: 26 abr. 2018.
FUNDAÇÃO ORSA. Vale do Jari: Plano de Desenvolvimento Humano e Sustentável. 2014
G1. FLOTA do Paru, em Monte Alegre, recebe Unidade de Manejo Florestal. Santarém, Pará, Brasil,
5 jul. 2018. Disponível em: https://g1.globo.com/pa/santarem-regiao/noticia/flota-do-paru-em-monte-
alegre-recebe-unidade-de-manejo-florestal.ghtml. Acesso em: 1 jul. 2019.
GARDNER, T. Monitoring Forest Biodiversity: improving conservation through ecologically responsible
management. London: New York: Earthscan, 2010. 360p.
GAVLAK, A.A. Padrões de mudança de cobertura da terra e dinâmica populacional no Distrito
Florestal Sustentável da BR-163: população, espaço e ambiente. 2011. 177 p. Dissertação (Mestrado
em Sensoriamento Remoto) - Instituto Nacional de Pesquisas Espaciais, São José dos Campos, 2011.
GERWING, J.J. Degradation of forests through logging and fire in the easterm Brazilian Amazon. Forest
ecology and management, v. 157, n. 1-3, p. 131-141, 2002.
Governo do Estado do Amapá - Secretaria de Estado do Meio Ambiente. Plano de Manejo Reserva de
Desenvolvimento Sustentável Rio Iratapuru – RDSI, Macapá, Amapá, Brasil, 2015
Governo do Estado Do Pará - Secretaria de Estado de Meio Ambiente. Plano de Manejo da Floresta
Estadual do Paru, Belém, Pará, Brasil, 2010.
Governo do Pará - IDEFLOR-BIO. O que é Concessão. [S. l.]. Disponível em:
https://ideflorbio.pa.gov.br/concessao-florestal/. Acesso em: 1 jul. 2019.
GRUPO ORSA. Diagnóstico Socioambiental das Comunidades Rurais do Vale do Jarí.
CEATS/POEMA/Grupo Orsa. 2006.
GRUPO ORSA. Diagnóstico Socioeconômico Ambiental. Grupo Orsa/ ICCO/ Bop Inovation. Vale do
Jarí, 2010.
GTPPCDAP – Grupo de Trabalho do Plano de Prevenção e Controle do Desmatamento e Queimadas do
Estado do Amapá. Plano de Prevenção e Controle do Desmatamento e Queimadas do Estado do
Amapá - PPCDA, 2009.
CCB & VCS PROJECT DESCRIPTION: CCB Version 3, VCS Version 3
CCB v3.0, VCS v3.3 271
GUILHERME, E.; CINTRA, R. Effects of intensity and age of selective logging and tree girdling on a
understory bird community composition in central Amazonia, Brazil. Ecotrópica. v. 7, p. 77-92, 2001.
HENRIQUES, L.M.P.; WUNDERLE JR., J.M.; OREN, D.C.; WILLIG, M.R. Efeitos da exploração
madeireira de baixo impacto sobre uma comunidade de aves de sub-bosque na Floresta Nacional do
Tapajós, Pará, Brasil. Acta Amazonica, v. 38, n. 2, p. 267-290, 2008.
HIGUCHI, N., DOS SANTOS, J., RIBEIRO, R. J., MINETTE, L., BIOT, Y. Biomassa da parte aérea da
vegetação da floresta tropical úmida de terra-firme da Amazônia brasileira. Acta Amazonica, v. 28, n. 2,
p. 153-166, 1998.
HIGUCHI, N., PEREIRA, H. S., DOS SANTOS, J., LIMA, A.J.N. Governos locais amazônicos e as
questões climáticas globais. Manaus: Edição dos Autores, 86 P. 2009.
IBAMA – INSTITUTO BRASILEIRO DO MEIO AMBIENTE E DOS RECURSOS NATURAIS
RENOVÁVEIS. Disponível em: <http://www.ibama.gov.br/>. Acesso em: 20 de abr. 2018.
IBGE – INSTITUTO BRASILEIRO DE GEOGRAFIA E ESTATÍSTICA. Censo Demográfico 2010.
Disponível em: <cidades.ibge.gov.br>. Acesso em: 12 mai. 2018.
IBGE – INSTITUTO BRASILEIRO DE GEOGRAFIA E ESTATÍSTICA. Estatísticas da Saúde:
Assistência Médico - Sanitária - 2009. Rio de Janeiro: IBGE, 2009. Disponível em:
<http://www.ibge.gov.br/home/estatistica/populacao/condicaodevida/ams/2009/ams2009.pdf>. Acesso
em: 17 mai. 2018.
IBGE – INSTITUTO BRASILEIRO DE GEOGRAFIA E ESTATÍSTICA. Histórico do Município de
Almeirim. Rio de Janeiro: IBGE, 2005. Disponível em:
<http://cidades.ibge.gov.br/painel/historico.php?lang=&codmun=150050&search=para|almeirim|infografic
os:-historico>. Acesso em 12 mar. 2018.
IBGE – INSTITUTO BRASILEIRO DE GEOGRAFIA E ESTATÍSTICA. IBGE Cidades 2010. Disponível
em: http://www.ibge.gov.br.
IBGE – INSTITUTO BRASILEIRO DE GEOGRAFIA E ESTATÍSTICA. Manual técnico da vegetação
brasileira sistema fitogeográfico: inventário das formações florestais e campestres: técnicas de
manejo de coleções botânicas: procedimentos para mapeamentos/IBGE, Coordenação de Recursos
Naturais e Estudos Ambientais. – 2°. ed. Rio de Janeiro, 2012.
IBGE – INSTITUTO BRASILEIRO DE GEOGRAFIA E ESTATÍSTICA. Órgãos Estaduais de Estatística,
Secretarias Estaduais de Governo e Superintendência da Zona Franca de Manaus – SUFRAMA.
CCB & VCS PROJECT DESCRIPTION: CCB Version 3, VCS Version 3
CCB v3.0, VCS v3.3 272
2012. PIB Municipal. Disponível em:
<http://www.cidades.ibge.gov.br/xtras/perfil.php?lang=&codmun=160027&search=||infogr%E1ficos:-
informa%E7%F5es-completas>. Acesso em: 18 abr. 2018.
IBGE - INSTITUTO BRASILEIRO DE GEOGRAFIA E ESTATÍSTICA. Produção Agrícola Municipal
2013. Rio de Janeiro: IBGE, 2014. Disponível em:
<http://cidades.ibge.gov.br/xtras/perfil.php?lang=&codmun=150050&search=||infogr%E1ficos:-
informa%E7%F5es-completas>. Acesso em: 24 abr. 2018.
IMAZON. Cartilha do Plano de Manejo da Flota do Paru. [S. l.], 24 jan. 2013. Disponível em:
https://imazon.org.br/cartilha-do-plano-de-manejo-da-flota-do-paru/. Acesso em: 1 jul. 2019.
INCRA - INSTITUTO NACIONAL DE COLONIZAÇÃO E REFORMA AGRÁRIA. Relação de Projetos de
Reforma Agrária, 2015. Disponível em:
<http://www.incra.gov.br/sites/default/files/uploads/reformaagraria/questaoagraria/reforma-
agraria/projetos_criados-geral.pdf>. Acesso em: 24 abr. 2018.
INPE – INSTITUTO NACIONAL DE PESQUISAS ESPACIAIS e EMBRAPA – Empresa Brasileira de
Pesquisa Agropecuária. Projeto TerraClass. 2014. Disponível em:
<http://www.inpe.br/cra/projetos_pesquisas/terraclass2014.php>. Acesso em: 27 mai. 2018
INPE – INSTITUTO NACIONAL DE PESQUISAS ESPACIAIS. Projeto de Monitoramento Florestal da
Amazônia por Satélite (PRODES). 2014. Disponível em: <http://www.ibge.gov.br>. Acesso em: 27 mai.
2018.
INSTITUTO SOCIOAMBIENTAL (ISA). Unidades de Conservação do Brasil - Reserva de
Desenvolvimento Sustentável do Rio Iratapuru. [S. l.]. Disponível em:
https://uc.socioambiental.org/arp/1350. Acesso em: 1 jul. 2019.
ISA - INSTITUTO SOCIOAMBIENTAL. Povos Indígenas do Brasil. Disponível em:
<http://ti.socioambiental.org/pt-br/#!/pt-br/regiao>. Acesso em 31 abr. 2018.
ISSLER, R.S.; ANDRADE, A.R.F.; MONTALVÃO, R.M.G.; GUIMARÃES, G.; SILVA, G.G.; LIMA, M.I.C.
Geologia da Folha SA. Departamento Nacional da Produção Mineral, Geologia da Folha SA. Belém, n.
5, p. 7-182, 1974.
IUCN – INTERNATIONAL UNION FOR CONSERVATION OF NATURE. Disponível em:
<http://www.iucnredlist.org/amazing-species.>. Acesso em: 20 abr. 2018.
CCB & VCS PROJECT DESCRIPTION: CCB Version 3, VCS Version 3
CCB v3.0, VCS v3.3 273
IUCN – INTERNATIONAL UNION FOR CONSERVATION OF NATURE. The IUCN Red List of
Threatened Species. Version 2017-3. Disponível em: <http://www.iucnredlist.org/>. Acesso em: 25 jun.
2018.
JENNINGS, S.B.; BROWN, N.D.; BOSSIER, D.H.; WHITMORE, D.C.; LOPES, J.C.A. Ecology provides a
pragmatic solution to the maintenance of genetic diversity in sustainably managed tropical rain forests.
Forest Ecology and Management, v. 154, p. 1-10, 2001.
JOÃO, X.S.J; TEIXEIRA, S.G.; FONSECA, D.D.F (Organizadores). Arcabouço geológico-tectônico e
implicações metalogenéticas. Geodiversidade do estado do Pará. Belém: CPRM, p. 15-23, 2013.
LAURANCE, W.F.; VASCONCELOS, H.L. Consequências ecológicas da fragmentação florestal na
Amazônia. Oecologia Brasiliensis. v.13, n. 3, p. 434-451, 2009.
LEMES JÚNIOR, A.B. Administração financeira: princípios, fundamentos e práticas brasileiras. 2.ed.
Rio de Janeiro: Elsevier, 2005. 568 p.
LESCURE, J. P. Algumas questões a respeito do extrativismo. In: EMPERAIRE, L. (Ed.). A Floresta em
Jogo: o Extrativismo na Amazônia central. São Paulo: Editora UNESP: Imprensa Oficial do Estado,
2000.
LIM, B.K.; ENGSTROM, M.D.; OCHOA, G.J.; MAMMA, L.S. In: HOLLOWELL, T.; REYNOLDS, R.P.
(eds.). Checklist of the Terrestrial Vertebrates of the Guiana Shield. Bulletin of the Biological Society
of Washington, n. 13, p. 77-81, 2005.
LIMA and POZZOBON. Amazônia socioambiental. Sustentabilidade ecológica e diversidade social.
Diversidade biológica e cultural da Amazônia, v. 19, p. 45 – 76, 2005.
LINS, C. Jari: 70 anos de história. Rio de Janeiro: DATAFORMA, 1994. 236 p.
LÓPES, C.; SHANLEY, P.; FANTINI, A. C. (Eds.). Riches of the forest: fruits, remedies and
handicrafts in Latin America. CIFOR. 2004.
LORENZI, H. Árvores brasileiras: manual de identificação e cultivo de plantas arbóreas nativas do
Brasil, vol. 1. 7.ed. São Paulo: Instituto Plantarum de Estudos da Flora, 2016. 384p.
MARTINS, C.O. et al. Flota do Paru: Reflexões Preliminares Sobre Extrativismo e Concessões
Florestais. Fragmentos de Cultura, Goiânia, v. 25, n. 2, p. 171-184, abr./jun. 2015.
CCB & VCS PROJECT DESCRIPTION: CCB Version 3, VCS Version 3
CCB v3.0, VCS v3.3 274
MEDJIBE, V.P.; PUTZ, F.E.; STARKEY, M.P.; NDOUNA, A.A.; MEMIAGHE, H.R. Impacts of selective
logging on above-ground forest biomass in the Monts de Cristal in Gabon. For. Ecol. Manage, v. 262, p.
1799-1806, 2011.
MINISTÉRIO DO MEIO AMBIENTE (MMA). Dados Georreferenciados. [S. l.]. Disponível em:
http://www.mma.gov.br/areas-protegidas/cadastro-nacional-de-ucs/dados-georreferenciados.html.
Acesso em: 1 jul. 2019.
MORAES, C.M.; COSTA, J.M.N.; COSTA, A.C.L.; COSTA, M.H. Variação espacial e temporal da
precipitação no estado do Pará. ACTA AMAZÔNIA. 2005
MORAIS, P.D.; MORAIS, J.D. O Amapá em Perspectiva: Uma abordagem históricogeográfica. Macapá:
Valcan, 2000.
MYERS, E.C. Policies to Reduce Emissions from Deforestation and Degradation (REDD) in Tropical
Forests. Resources Magazine, v. 7, 2007.
NELSON, B.W.; OLIVEIRA, A.A. Biodiversidade da Amazônia Brasileira: avaliação e ações
prioritárias para a conservação, uso sustentável e repartição de benefícios.
In: CAPOBIANCO, J.P.R.; VERÍSSIMO, A.; MOREIRA, A.; SAWYER, D.; SANTOS, I.; PINTO; L.P.
(Organizadores). São Paulo, Estação Liberdade: Instituto Socioambiental, p.32- 176, 2001.
NEPSATD, D. et al., 2009. The End of Deforestation in the Brazilian Amazon. Science, 4 December,
Volume 326, pp. 1350-1351.
NEPSATD, D., STICKLER, C.; ALMEIDA, O., 2006. Globalization of the Amazon soy and beef industries:
opportunities for conservation. Conservation Biology, 6 December, Volume 20, pp. 1595-603.
NOGUEIRA, E.M.; FEARNSIDE, P.M.; NELSON, B.W., BARBOSA, R.I.; KEIZER, E.W.H. Estimates of
forest biomass in the Brazilian Amazon: New allometric equations and biomass adjustments of wood
volume inventories. Forest Ecology and Management, v. 256, n. 11, p. 1853-1867, 2008.
PAVAN, M.N.; CENAMO, M.C. REDD+ nos estados da Amazônia: Mapeamento de iniciativas e
desafios para integração com a estratégia brasileira. Instituto de Conservação e Desenvolvimento
Sustentável do Amazonas (Idesam), 2 ed., 2012.
POEMA. Diagnóstico Sócioambiental das comunidades rurais do Vale do Jari. Belém - PA, 2005.
CCB & VCS PROJECT DESCRIPTION: CCB Version 3, VCS Version 3
CCB v3.0, VCS v3.3 275
PONTIUS, R.G.; SCHNEIDER. Land-Use change model validation by a ROC method for the Ipswich
watershed, Massachusetts, USA. Agriculture, Ecosystems & Environment, v. 85, n. 1-3, p. 239-248,
2001.
PUTZ, F.E.; ZUIDEMA, P.A.; PINARD, M.A.; BOOT, R.G.A.; SAYER, J.A.; et al. 2008. Improved tropical
forest management for carbon retention. PLoS Biol, 6 (7): e166. <doi:10.1371/journal.pbio.0060166>.
R G Pontius Jr, W Boersma, J-C Castella, K Clarke, T de Nijs, C Dietzel, Z Duan, E Fotsing, N Goldstein,
K Kok, E Koomen, C D Lippitt, W McConnell, A Mohd Sood, B Pijanowski, S Pithadia, S Sweeney, T N
Trung, A T Veldkamp, and P H Verburg. 2008. Comparing input, output, and validation maps for several
models of land change. Annals of Regional Science, 42(1): 11-47.
RICHARDS, M.; PANFIL, S.N. Social and Biodiversity Impact Assessment (SBIA). Manual for REDD+
Projects: Part 1 – Core Guidance for Project Proponents. Climate, Community & Biodiversity Alliance,
Forest Trends, Fauna & Flora International, and Rainforest Alliance. Washington, DC. 2011.
RODRIGUES, A.S.L. et al., 2009. Boom-and-Bust Development Patterns Across the Amazon
Deforestation Frontier. Science, Volume 324.
RUTISHAUSER, E.; HERAULT, B.; BARALOTO, C.; BLANC, L.; DESCROIX, L.; SOTTA, E.D.;
FERREIRA, J.; KANASHIRO, M.; MAZZEI, L.; D‟OLIVEIRA, M.V.N.; DE OLIVEIRA, L.C.; PEÑA-
CLAROS, M.; PUTZ, F.E.; RUSCHEL, A.R.; RODNEY, K.; ROOPSIND, A.; SHENKIN, A.; DA SILVA,
K.E.; DE SOUZA, C.R.; TOLEDO, M.; VIDAL, E.; WEST, T.A.P.; WORTEL, V.; SIST, P. Rapid tree
carbon stock recovery in managed Amazonian forests. Curr. Biol, v. 25, p. 787-788, 2015.
SABOGAL, C.; LENTINI, M.; POKORNY, B.; SILVA, J.N.; ZWEEDE, J.; VERÍSSIMO, A.; BOSCOLO, M.
Manejo florestal empresarial na Amazônia Brasileira: restrições e oportunidades – Relatório
síntese. Belém: CIFOR, Imazon, Embrapa, IFT, 2006. 74p.
SALES, M.H.; SOUZA Jr., C.M.; KYRIAKIDIS, P.C.; ROBERTS, D.A.; VIDA, E. 2007. Improving spatial
distribution estimation of forest biomass with geostatistics: A case study for Rondônia, Brazil.
Ecological Modelling, 207, 221-230.
SANGERMANO F.; EASTMAN, J. R.; ZHU, H. Similarity Weighted Instance-based Learning for the
Generation of Transition Potentials in Land Use Change Modeling. Transactions in GIS, v. 14, n. 5,
2010.
SCHROEDER, W. et al. The Spatial Distribution and Interannual Variability of Fire in Amazonia.
Amazonia and Global Change, v. 186, p. 43-60, 2013.
CCB & VCS PROJECT DESCRIPTION: CCB Version 3, VCS Version 3
CCB v3.0, VCS v3.3 276
SEBBENN, A. M. SEOANE, C. E. S; KAGEYAMA, P. Y.; VENCOVSKY, R. Efeito do manejo na estrutura
genética de populações de caixeta (Tabebuia cassinoides). Scientia Florestalis, n. 58, p.: 127-143,
2000.
SEPOF - SECRETARIA DE ESTADO DE PLANEJAMENTO, ORÇAMENTO E FINANÇAS. 2008.
Estatística Municipal de Almeirim. Disponível em <http://www.sepof.pa.gov.br/>. Acesso em 14 mar.
2018.
SIDRA/IBGE – Sistema IBGE de Recuperação Automática. Disponível em:
<https://sidra.ibge.gov.br/home/pnadct/brasil>. Acesso em: 24 abr. 2018.
SILLS, E.O.; ATMADJA, S.S.; DE SASSI, C.; DUCHELLE, A.E.; KWEKA, D.L.; RESOSUDARMO, I.A.P.;
SUNDERLIN, W.D. (Eds.). REDD+ on the ground: A casebook of subnational initiatives across the
globe. Bogor, Indonésia: Center for International Forestry Research - CIFOR, 2014.
SILVA , José Natalino Macedo; LOPES, José do Carmo Alves ; OLIVEIRA, Lia Cunha de; SILVA, Silvia
Maria Alves da; CARVALHO, João Olegário Pereira de ; COSTA, Dulce Helena Martins ; MELO, Marcelo
Santos ; TAVARES, Mário José Matos;. Diretrizes para instalação e medição de parcelas
permanentes em florestas naturais da Amazônia Brasileira. Empresa Brasileira de Pesquisa
Agropecuária - Embrapa Amazônia Oriental Ministério da Agricultura, Pecuária e Abastecimento. Belém.
2005.
SILVA, J.M.C.; RYLANDS, A.B.; FONSECA, G.A.B. The Fate of the Amazonian Areas of Endemism.
Conservation Biology, v. 19, n. 3, p. 689-694, 2005.
SILVA, J.N.M.; LOPES, J.C.A.; OLIVEIRA, L.C.; SILVA, S.M.A.; CARVALHO, J.O.P.; COSTA, D.H.M.;
MELO, M.S.; TAVARES, M.J.M. Diretrizes para instalação e medição de parcelas permanentes em
florestas naturais da Amazônia Brasileira. Empresa Brasileira de Pesquisa Agropecuária - Embrapa
Amazônia Oriental Ministério da Agricultura, Pecuária e Abastecimento. Belém. 2005
SILVA, R. P. 2007. Alometria, estoque e dinâmica da biomassa de florestas primárias e secundárias na
região de Manaus (AM). Tese de Doutorado, Curso de Ciências de florestas tropicais, Instituto Nacional
de Pesquisas da Amazônia. Manaus, AM, Brasil. 135p.
SILVA, S. Árvores da Amazônia. São Paulo: Empresa das artes, 2006.
SILVEIRA, J.S. Aspectos hidroclimatológicos da Bacia do Rio Jari no período de 1968 a 2012.
2014. 59p. Trabalho de conclusão de curso, Universidade Federal do Amapá - UFAP, Macapá, 2014.
CCB & VCS PROJECT DESCRIPTION: CCB Version 3, VCS Version 3
CCB v3.0, VCS v3.3 277
SISTEMA Integrado de Monitoramento e Licenciamento Ambiental - Modulo Publico (SIMLAM
Publico). [S. l.]. Disponível em: https://monitoramento.semas.pa.gov.br/simlam/index.htm. Acesso em: 1
jul. 2019.
SNIF – Sistema Nacional de Informações Florestais. Serviço Florestal Brasileiro. Definição de Floresta.
4 abr. 2018. Disponível em: http://snif.florestal.gov.br/pt-br/florestas-e-recursos-florestais/167-definicao-
de-floresta. Acesso em: 27 jun. 2019.
SOUZA, C.M., ROBERTS, D.A.; COCHRANE, M.A., 2005. Combining spectral and spatial
information to map canopy damage from selective logging and forest fires. Remote Sensing of
Environment, 98(2-3), pp.329–343.
SPATHELF, P.; MATTOS, P.P.; BOTOSSO, P.C. Certificação florestal no Brasil – Uma ferramenta eficaz
para a conservação das florestas naturais? Revista Floresta, 34 (3), 2004, p. 373-379.
THE CLIMATE, COMMUNITY & BIODIVERSITY ALLIANCE. Padrões Clima, Comunidade e
Biodiversidade. 3 ed., 2013. 61p.
VAN DER WERF, G.R.; MORTON, D.C.; DEFRIES, R.S.; OLIVIER, J.G.J.; KASIBHATLA, P.S.;
JACKSON, R.B.; COLLATZ, G.J.; RANDERSON, J.T. CO2 emissions from forest loss. Nature
Geoscience, v. 2, n. 11, p. 737-738, 2009.
VASQUEZ, L.V; ROSA-COSTA, L.R.; SILVA, C.G.; RICCI, P.F.; BARBOSA, J.O.; KLEIN, E.L.
Compartimentação tectônica. In: VASQUEZ, M.L., ROSA-COSTA, L.T. (Organizadores) Geologia e
Recursos Minerais do Estado do Pará: Sistema de Informações Geográficas-SIG: texto explicativo dos
mapas Geológico e Tectônico e de Recursos Minerais do Estado do Pará, v. 1, p. 39-112, 2008.
VELOSO, H. P., RANGEL FILHO, A. L. R.; LIMA, J. C. A. Classificação da Vegetação Brasileira
adaptada a um sistema universal. Fundação IBGE, Rio de Janeiro, 1991. 123p.
WANDERLLI, E.V.; FEARNSIDE, P.M. Secondary vegetation in central Amazonia: Land-use history
effects on aboveground biomass. Forest Ecology and Management, v. 347, n. 11, p. 140 – 148, 2015.
WEST, T.A.P.; VIDAL, E.; PUTZ, F.E. Forest biomass recovery after conventional and reduced-impact
logging in Amazonian Brazil. Forest Ecology Management, v. 314, p. 59-63, 2014.
WUNDERLE JR., J.M.; HENRIQUES, L.M.P.; WILLIG, M.R. Short-Term Responses of Birds to Forest
Gaps and Understory: An Assessment of Reduced-Impact Logging in a Lowland Amazon Forest.
Biotropica, v. 38, n. 2, p. 235-255, 2006.
CCB & VCS PROJECT DESCRIPTION: CCB Version 3, VCS Version 3
CCB v3.0, VCS v3.3 278
ZAKIA, M.J.; PINTO, L.F.G. Guia para aplicação da nova lei em propriedades rurais. Piracicaba, SP:
Imaflora, 2013. 32p.
ZANATA, J.M. Mudanças no uso e cobertura da terra na bacia hidrográfica do Ribeirão Bonito,
municípios de Avaré e Itatinga-SP. 2014. 122 p. Dissertação (Mestrado em Geografia) - UNESP,
Presidente Prudente, 2014.