Embed Size (px)
Citation preview

CCA and a Multi-way Extension forInvestigating Common Components between
Audio, Lyrics and Tags.
Matt McVicar1 and Tijl De Bie2 ?
Intelligent Systems Lab, University of [email protected], [email protected]
Abstract. In our previous work, we used canonical correlation analysis(CCA) to extract shared information between audio and lyrical featuresfor a set of songs. There, we discovered that what audio and lyrics sharecan be largely captured by two components that coincide with the di-mensions of the core affect space: valence and arousal. In the currentpaper, we extend this work significantly in three ways. Firstly, we exploitthe availability of the Million Song Dataset with the MusiXmatch lyricsdata to expand the data set size. Secondly, we now also include socialtags from Last.fm in our analysis, using CCA also between the tag spaceand the lyrics representations as well as between the tag and the audiorepresentations of a song. Thirdly, we demonstrate how a multi-way ex-tension of CCA can be used to study these three datasets simultaneouslyin an incorporated experiment. We find that 2-way CCA generally (butnot always) reveals certain mood aspects of the song, although the ex-act aspect varies depending on the pair of data types used. The 3-wayCCA extension identifies components that are somewhere in between the2-way results and, interestingly, appears to be less prone to overfitting.
Keywords: Canonical Correlation Analysis, Mood Detection, MillionSong Dataset, MusiXmatch, Last.fm.
1 Introduction
In this paper we ask what is shared between the audio, lyrics and social tagsof popular songs. We employ canonical correlation analysis (CCA) to find max-imally correlated projections of these three feature domains in an attempt todiscover commonalities and themes. In our previous work [16] we attempted tomaximise the correlation between audio and lyrical features and discovered thatthe optimal correlations related strongly to the mood of the piece.
We extend this work significantly in three ways. Firstly, we make use ofthe recently-available Million Song Dataset (MSD,[1]) to gather a large numberof audio and lyrical features, verifying our previous work on a larget dataset.Secondly, we incorporate a third feature space based on social tags from Last.fm1.
? This work was partially supported by the EPSRC grant number EP/E501214/11 www.last.fm
9th International Symposium on Computer Music Modelling and Retrieval (CMMR 2012) 19-22 June 2012, Queen Mary University of London All rights remain with the authors.
53

2 Matt McVicar and Tijl De Bie
On these three datasets we are able to conduct pairwise 2-dimensional CCA onthe largest public dataset of this type currently available. Lastly, we demonstratehow 3-dimensional CCA can be used to investigate these data simultaneously,leading to a multi-modal analysis of three aspects of music. Whilst it was intuitiveto us in our previous work that lyrics and audio would have mood in common,it is less clear to us what commonalities are shared between the other pairs ofdatasets. We therefore take a more serendipitous approach in this study, aimingto discover which features are most strongly related.
The rest of this paper is arranged as follows. In the remainder of this Sectionwe discuss the relevant literature and background to our work. We detail ourdata collection methods, feature extraction, and framework in Section 2. Section3 deals with the theory of CCA in 2 and 3 dimensions. In Section 4 we presentour findings, which are discussed and concluded in Section 5.
1.1 The Core Affect Space
Although it may be the case that our CCA analysis leads to components otherthan emotion, we suspect that many will relate to the mood of the piece. Wetherefore review the analysis of mood in this Subsection.
Russell [17] proposed a method for placing emotions onto a two-dimensionalvalence-arousal space, known in psychology as the core affect space [18]. Thevalence of a word describes its attractiveness/aversiveness, whilst the arousalrelates to the strength, energy or activation. An example of a high valence, higharousal word is ecstatic, whilst depressed would score low on both valence andarousal. A third dimension describing the dominance of an emotion has also beensuggested [6], but rarely used by researchers. A more detailed visualisation ofthe valence/arousal space with example words is shown in Figure 1.
1.2 Relevant Works
The valence/arousal space has been used extensively by researchers in the fieldof automatic mood detection from audio. Harmonic and spectral features wereused by [8], whilst in [5] they utilised low-level features such as the spectralcentroid, rolloff, flux, slope, skewness and kurtosis. Time-varying features in theaudio domain were employed by various authors [15, 20], which included MFCCsand short time Fourier transforms. For classification, many authors have utilisedSVMs, which have been shown to successfully discriminate between features [9].
In the lyrical domain, [7] used bag-of-words (BoW) models as well as n-gramsand term frequency-inverse document frequency (TFIDF) to classify mood basedon lyrics, whilst [10] made use of the experimentally deduced affective norms ofenglish words (ANEW) to assign valence and arousal scores to individual wordsin lyrics. Both of these studies were conducted on sets of 500-2,000 songs.
The first evidence of combining text and audio in mood classification canbe seen in [21]. They employed BoW text features and psychological featuresfor classification and demonstrated a correlation between the verbal emotionfeatures and the emotions experienced by the listeners on a small set of 145
54

Investigating Common Components between Audio, Lyrics and Tags 3
Valance
Arousal
Delighted
Pleased
Excited
Sa7sfied
At ease
Sleepy Tired
Miserable
Sad
Frustrated
Aroused
Angry
Fig. 1: The 2-dimensional valence/arousal space as proposed by Russell [17].Words with high valence are more positive, whilst low valence words are pes-simistic. High/low arousal words are energetic/restful respectively.
songs. A larger study was conducted in [13] where they classified 1,000 songsinto 4 mood categories and found that by combining audio and lyrical featuresan increase in recognition accuracy was observed.
In the tag domain, [14] used the social website Last.fm to create a semanticmood space using latent semantic analysis. Via the use of a self-organising map,they reduce this high-dimensional space to a 2-D representation and comparedthis to Russell’s valence/arousal space, with encouraging results.
In combining tag and audio data, [3] demonstrated that tag features weremore informative than audio, whilst the combination was more informative still.This was conducted on a set of 1,612 songs and up to 5 mood or theme categories.Finally, a recent study considered regression of musical mood in continuous di-mensional space using combinations of audio, lyrics and tags on a set of 2,648UK pop songs [19].
Whilst insightful in terms of features and classification techniques, all ofthe studies previously mentioned were conducted on small datasets by todaysstandards (all significantly less than 10,000 songs). In this paper we addressthis issue in a truly large-scale, multi-modal analysis. We discuss our featureextraction and framework for our analysis in the following Section.
55

4 Matt McVicar and Tijl De Bie
2 Data Collection & Framework
This section details our data collection methods and the motivation for our ap-proach. We found the overlap of the Million Song, MusiXmatch and Last.fmdatasets to be 223,815 songs in total, which was comprised of 197,436 trainingsongs and 26,379 test songs. After removing songs which contained empty fea-tures, no lyrics or no tags, as well as those not in English, we were left with101,235 (88%) training songs and 13,502 test songs (12%).
2.1 The Million Song Dataset
Devised as a way for researchers to conduct work on musical data without theneed to purchase a large number of audio files, the Million Song Dataset wasreleased on Feb 8th, 2011. We downloaded this dataset in its entirety and ex-tracted from it features relating to the audio qualities of the music. The featureswe specifically computed are shown in Table 1. We also give our interpretationof the features extracted, although there are some (e.g. danceability) where weare unsure of the feature extraction process.
Table 1: List of audio features extracted from the million song dataset, withinterpretations.
Feature Interpretation
Mean Bar Confidence Average bar stabilityStd Bar Confidence Variation in bar stability
Mean Beat Confidence Average beat stabilityStd Beat Confidence Variation in beat stability
Danceability Danceability of trackDuration Total track time in seconds
Key Track harmonic centre (major keys only)Key Confidence Confidence in Key
Loudness Loudness of trackMode Modality (major or minor) of track
Mode Confidence Confidence in ModeMean Sections Confidence Average confidence in section boundariesStd Sections Confidence Variation in section boundary confidences
Mean Seg. Conf. Average confidence in segment boundariesMean Timbres 1-12 12 features relating to average sound qualityStd Timbres 1-12 12 features related to variation in sound quality
Tempo Speed in Beats Per MinuteLoudness Max Total maximum of track loudnessLoudness Start Local max of loudness at the start of the track
Tatums Confidence Confidence in tatum predictionTime Signature Predicted number of beats in a bar
Time Signature Confidence Confidence in time signature
56

Investigating Common Components between Audio, Lyrics and Tags 5
2.2 MusiXmatch
An addition to the MSD, the MusiXmatch dataset contains lyrical informationfor a subset of the million songs. The features are stored in bag-of-words format(for copyright reasons), and are stemmed versions of the top 5,000 words in thedatabase. In order to ensure we had meaningful words, we restricted ourselves tothe words which were part of the ANEW dataset [4], which reduced our datasetto 603 words. We converted the BoW data to a term frequency-inverse documentfrequency (TFIDF) score [11] via the following transformation.
Let the term frequency of the ith feature from the jth song be simply theBoW feature normalised by the count of this lyric’s most frequent word:
TFi,j =|word i appears in lyric j|
maximum word count of lyric j
where | · | denotes ‘number of’. The inverse document frequency measures theimportance of a word in the database as a whole and is calculated as:
IDFi = logtotal number of lyrics
|lyrics containing word i|+ 1
(we include the +1 term to avoid potentially dividing by 0). The TFIDF scoreis then the product of these two values:
TFIDFi,j = TFi,j × IDFi
The TFIDF score gives an indication of the importance of a word within aparticular song and the entire database. Note that we used the ANEW databasesimply to construct a dictionary of words which contain some emotive content- no experimental valence/arousal or mood scores were incorporated into ourfeature matrix.
2.3 Last.fm Data
The Last.fm data contains information on user-generated tags and artist simi-larities, although we neglect the latter for the purpose of this study. The datasetcontains information on 943,347 tracks matched to the MSD and tag countsfor each song. We discovered 522,366 unique tags although only considered tagswhich appeared in at least 1,000 songs, which resulted in 829 features. The toptags from the dataset were Rock, Pop, Alternative, Indie and Electronic. Weconstructed a TF-IDF score for each tag in each song analogously to the previ-ous section. Although it would have been possible to filter the tags according tothe ANEW database as per the lyrics, we know that tags contain informationother than mood, such as genre data. We are optimistic that our algorithm maypick up such information, and so did not filter the Last.fm tags.
57

6 Matt McVicar and Tijl De Bie
2.4 Framework
In our previous work [16] we introduced an exploratory framework for the use ofCCA in correlating audio and lyrical features. We briefly recap this frameworkfor 2-way CCA before extending it to use in 3 datasets.
We are interested in what is consistent between the audio, lyrics and tags ofa song. In previous work, researchers have searched for a function f which mapsaudio to mood [f(audio) = mood], else from lyrics or tags [g(lyrics) = mood,h(tags) = mood]. In our 2-way CCA we seek functions which satisfy one of:
f(audio) ≈ g(lyrics)
f(audio) ≈ h(tags)
g(lyrics) ≈ h(tags)
to a good approximation and for a large number of songs. Previously, we assumedthat the first relationship in the above equations captured some aspect of mood,knowing of no other commonalities between the audio and lyrics of a song. Thiswas verified by using 2-way CCA to find such functions f and g. In this study,we take a more serendipitous approach. We will use 2-way CCA on each pairof datasets and see which kinds of commonalities are found. Perhaps they willrelate to mood, but we hope to discover other relationships and correlationswithin the data. The extension of this work to 3 dimensions follows a similarframework. We now seek functions f, g and h such that:
f(audio) ≈ g(lyrics) ≈ h(tags) (1)
simultaneously. Again, these functions will not hold true for every song, but wehope they are approximately true for a large number of songs. The next Sectiondeals with the theory of canonical correlation analysis.
3 Canonical Correlation Analysis and a 3-Way Extension
3.1 2-Way CCA
Given two datasets X ∈ Rn×dx and Y ∈ Rn×dy , canonical correlation analysisfinds what is consistent between them. This is realised by finding projections ofX and Y through the dataset which maximise their correlation. In other words,we seek weight vectors wx ∈ Rdx , wy ∈ Rdy such that the angle θ between Xwx
and Y wy is minimised:
{w∗x, w
∗y} = argmin
wx,wy
θ(Xwx, Y wy)
Conveniently, this can be realised as a generalised eigenvector problem (a fullderivation can be found in, for example, [2]):
(0 XTY
Y TX 0
)(wx
wy
)= λ
(XTX 0
0 Y TY
)(wx
wy
)(2)
58

Investigating Common Components between Audio, Lyrics and Tags 7
In our experiments, X and Y will represent data matrices formed from the MSD,MusiXmatch or Last.fm datasets. The eigenvalue λ is the achieved correlationbetween the two datasets and (wx, wy) are the importance of each vector in thecorresponding data space. The eigenvectors corresponding to λ can be sorted bymagnitude to give a rank of feature importance in each of the data spaces.
3.2 3-Way CCA
Whilst it will be insightful to see the pairwise 2-way correlations between thethree datasets, it would be more satisfying to investigate what is consistentbetween all 3 simultaneously. Various ways of exploring this have been exploredin [12] - a natural extension in our setting can be motived as follows. Considerthree datasets X ∈ Rn×dx , Y ∈ Rm×dy , X ∈ Rp×dz . We motivate the correlationof these three variables graphically. Consider 3 datasets and (for ease of plotting)3 songs within this set. A potential set of projections XwX , Y wY , and ZwZ isshown in Figure 2.
Song 2
Song 3
Song 2
Xwx
YwY
ZwZ
Fig. 2: Motivation for 3-way CCA on 3 example songs, showing the projectionsXwX , Y wY , ZwZ .
It is clear that the three projections are strongly correlated if the norm oftheir sum is large. However, this is easy to obtain if each of the projections isarbitrarily large. We therefore enforce the constraint that the individual lengths
59

8 Matt McVicar and Tijl De Bie
are bounded, and solve the following optimization problem:
maxwx,wy,wz
‖Xwx + Y wy + Zwz + 1‖2
s.t. ‖XwX‖2 + ‖Y wY ‖2 + ‖ZwZ‖2 = 1
Solving the above via the method of Lagrange multipliers, we obtain
1
2
∂
∂w∗
[‖XwX + Y wY + ZwZ‖2 − λ
(‖XwX‖2 + ‖Y wY ‖2 + ‖ZwZ‖2
)]= 0
where the asterix ∗ represents partial differentiation with respect to the appro-priate variable. This leads to the simultaneous equations
XTXwX +XTY wY +XTZwZ − λXTXwX = 0
Y TXwX + Y TY wY + Y TZwZ − λY TXwY = 0
ZTXwX + ZTY wY + ZTZwZ − λZTZwZ = 0
which, in matrix form, is
0 XTY XTZY TX 0 Y TZZTX ZTY 0
wX
wY
wZ
= (λ− 1)
XTX 0 0
0 Y TY 00 0 ZTZ
wX
wY
wZ
(3)
Substituting λ→ λ− 1, we see that 3-dimensional CCA is an obvious extensionof the 2-dimensional set-up seen in Equation 2. Note however that the λ is nowa generalisation of the notion of correlation, and is not necessarily boundedin absolute value by 1. In our setting, the datasets X,Y and Z represent theMSD, MusiXmatch and Last.fm datasets and our aim will be to maximise thecorrelation between them. Our experimental results using pairwise CCA and3-way CCA are presented in the next Section.
4 Experiments
4.1 Audio - Lyrical CCA
We begin with a reproduction of our previous work [16] which uses CCA onaudio and lyrical datasets. This will serve to verify our method scales to datasetsof realistic sizes. The projections of the Audio and Lyrical datasets, rankedby test correlation magnitude, are shown in Table 2. In each pairwise CCAexperiments we found the significance of the correlations under a χ2 distributionto be numerically 0, owing to the extremely large data sizes. It is thereforemore important to look at the magnitude of the correlations rather than theirsignificance in the following experiments.
These projections agree with our previous finding that mood is one of thecommon components between audio and lyrics. In the first component, words
60
Investigating Common Components between Audio, Lyrics and Tags 9
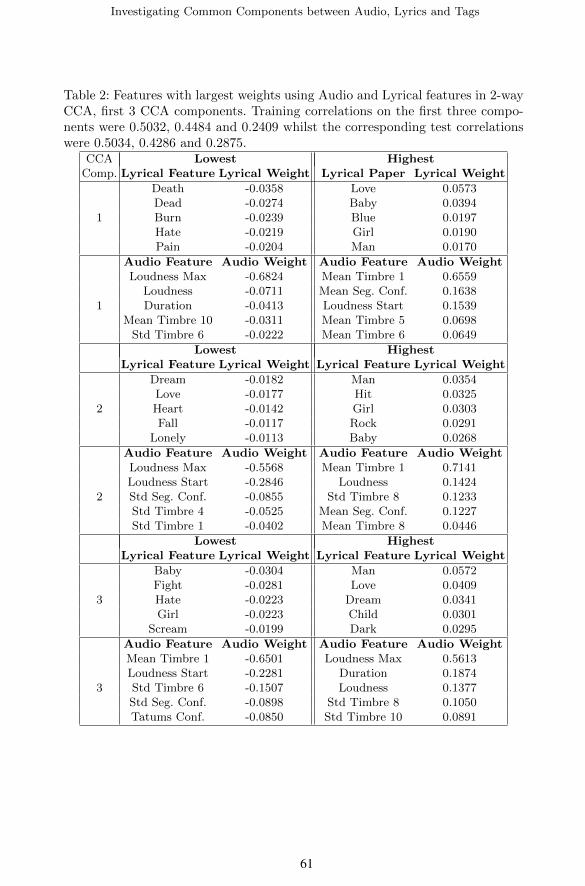
Table 2: Features with largest weights using Audio and Lyrical features in 2-wayCCA, first 3 CCA components. Training correlations on the first three compo-nents were 0.5032, 0.4484 and 0.2409 whilst the corresponding test correlationswere 0.5034, 0.4286 and 0.2875.
CCA Lowest HighestComp. Lyrical Feature Lyrical Weight Lyrical Paper Lyrical Weight
Death -0.0358 Love 0.0573Dead -0.0274 Baby 0.0394
1 Burn -0.0239 Blue 0.0197Hate -0.0219 Girl 0.0190Pain -0.0204 Man 0.0170
Audio Feature Audio Weight Audio Feature Audio WeightLoudness Max -0.6824 Mean Timbre 1 0.6559
Loudness -0.0711 Mean Seg. Conf. 0.16381 Duration -0.0413 Loudness Start 0.1539
Mean Timbre 10 -0.0311 Mean Timbre 5 0.0698Std Timbre 6 -0.0222 Mean Timbre 6 0.0649
Lowest HighestLyrical Feature Lyrical Weight Lyrical Feature Lyrical Weight
Dream -0.0182 Man 0.0354Love -0.0177 Hit 0.0325
2 Heart -0.0142 Girl 0.0303Fall -0.0117 Rock 0.0291
Lonely -0.0113 Baby 0.0268
Audio Feature Audio Weight Audio Feature Audio WeightLoudness Max -0.5568 Mean Timbre 1 0.7141Loudness Start -0.2846 Loudness 0.1424
2 Std Seg. Conf. -0.0855 Std Timbre 8 0.1233Std Timbre 4 -0.0525 Mean Seg. Conf. 0.1227Std Timbre 1 -0.0402 Mean Timbre 8 0.0446
Lowest HighestLyrical Feature Lyrical Weight Lyrical Feature Lyrical Weight
Baby -0.0304 Man 0.0572Fight -0.0281 Love 0.0409
3 Hate -0.0223 Dream 0.0341Girl -0.0223 Child 0.0301
Scream -0.0199 Dark 0.0295
Audio Feature Audio Weight Audio Feature Audio WeightMean Timbre 1 -0.6501 Loudness Max 0.5613Loudness Start -0.2281 Duration 0.1874
3 Std Timbre 6 -0.1507 Loudness 0.1377Std Seg. Conf. -0.0898 Std Timbre 8 0.1050Tatums Conf. -0.0850 Std Timbre 10 0.0891
61
10 Matt McVicar and Tijl De Bie
with low weights appear more aggressive, whilst more optimistic words have thehighest weights. This suggests that this CCA component has captured the notionof valence. Audio features in this domain show that high valence songs are loud,whilst low valence words have important timbre features.
The second CCA component appears to have identified relaxed lyrics at oneextreme and more active words at the other. We consider this to be a realisa-tion of the arousal dimension. In the audio domain, loudness and timbre againseems to play an important role. It is more difficult to interpret the third CCAcomponent, although the sharp decay of test correlation values show that thefirst two CCA components dominate the analysis.
4.2 Audio - Tag CCA
We now investigate 2-way CCA on audio/tag data, using Last.fm tags in placeof the lyrical data from Subsection 4.1. Components 1-3 are shown in Figure 3.
The first component of this CCA analysis seems to have found that themaximal correlation can be obtained by having tags associated with metal tagsat one extreme and more serene tags at the other. The audio features in thisCCA component seems to be well described by the later timbre features.
In the second component, we also see an obvious trend, with modern urbangenre tags receiving high weights and more traditional music at the other. In theaudio space, these genres seem to be associated with timbre and audio features.
The correlations between these two sets is so strong that we can even inter-pret the third CCA component, which has identified modern electronic musicand acoustic blues/country as strongly opposing tags in this dimension. Interest-ingly, components 2 and 3 appear to have identified two distinct types of ‘oldies’music (folk/blues respectively). In the audio domain these are accompanied bystructural stability (segment/tatum confidence) features.
4.3 Lyrical - Tag CCA
The first three CCA components of this experiment are shown in Figure 4.In the first component it seems we are distinguishing heavy metal genres from
less aggressive styles. In the lyrical domain we see that the words with low weightshold strongly negative valence; those with high weights are more optimistic. Theauthors find the notion of Melodic Black Metal somewhat oxymoronic.
The second component also has a clear trend - extremes in this dimensionappear to be hip-hop/rap vs. worship music. We postulate that this representsthe dominance dimension mentioned in the Introduction, with the lyrical weightscorroborating this. In the third component we see no particular trend, whichis supported by the low correlation of 0.1807. Comparison with the trainingcorrelation of 0.4826 suggests that this component is suffering from overfitting.
4.4 3-way Experiment
We display our results from 3-way CCA in Table 5.
62

Investigating Common Components between Audio, Lyrics and Tags 11
Table 3: Features with largest weights using Audio and Tag Features in 2-wayCCA, first 3 CCA components. Training correlations on the on these componentswere 0.7361, 0.6432 and 0.5725 whilst the corresponding test correlations were0.5685, 0.5237 and 0.3428 respectively.
CCA Lowest Highestcomp. Tag Feature Tag Weight Tag Feature Tag Weight
Female Vocalists -0.0352 Metal 0.0672Acoustic -0.0304 Death Metal 0.0542
1 Singer-Songwriter -0.0289 Brutal Death Metal 0.0425Classic country -0.0271 Punk rock 0.0378
Folk -0.0265 Metalcore 0.0371
Audio Feature Audio Weight Audio Feature Audio Weight
Mean Timbre 1 -0.5314 Loudness Max 0.7460Loudness Start -0.1700 Std Timbre 6 0.0988
1 Mean Timbre 6 -0.1558 Mean Timbre 2 0.0500Mean Seg. Conf. -0.1469 Mean Timbre 3 0.0491Mean Timbre 5 -0.1021 Std bar Conf. 0.0267
Lowest HighestTag Feature Tag Weight Tag Feature Tag Weight
Oldies -0.0153 Hip-Hop 0.0418Beautiful -0.0132 Dance 0.0355
2 60s -0.0126 Hip hop 0.0353Singer-Songwriter -0.0116 Rap 0.0351
Folk -0.0110 Rnb 0.0231
Audio Feature Audio Weight Audio Feature Audio WeightLoudness Start -0.5069 Mean Timbre 1 0.7522Loudness Max -0.3506 Loudness 0.1248
2 Mean Timbre 6 -0.0631 Std Timbre 8 0.0578Std Timbre 1 -0.0374 Mean Timbre 4 0.0497Std Seg. Conf. -0.0360 Mean Timbre 10 0.0415
Lowest HighestTag Feature Tag Weight Tag Feature Tag Weight
Electronic -0.0284 Oldies 0.0335Dance -0.0220 Classic Blues 0.0325
3 Vocal Trance -0.0198 Classic country 0.0290Epic -0.0186 50s 0.0279Pop -0.0181 Delta blues 0.0250
Audio Feature Audio Weight Audio Feature Audio Weight
Mean Timbre 1 -0.6988 Loudness Max 0.6416Mean Timbre 4 -0.1141 Mean Timbre 3 0.1404
3 Tatums Conf. -0.0649 Mean Seg. Conf. 0.0757Duration -0.0589 Mean Timbre 6 0.0732
Std Segs Conf. -0.0556 Loudness Start 0.0507
63

12 Matt McVicar and Tijl De Bie
Table 4: Features with largest weights using Lyrical and Tag Features in 2-wayCCA, first three CCA components. Training correlations on these componentswere 0.5828, 0.4990 and 0.4826 whilst test correlations were 0.3984, 0.3713 and0.1807 respectively.
CCA Lowest Highestcomp. Lyrical Feature Lyrical Weight Lyrical Feature Lyrical Weight
Death -0.1851 Love 0.2330Dead -0.1201 Baby 0.1807
Human -0.1049 Girl 0.07921 God -0.0993 Christmas 0.0726
Pain -0.0925 Blue 0.0679
Tag Feature Tag Weight Tag Feature Tag Weight
Brutal Death Metal -0.3029 Xmas 0.0785Death Metal -0.2470 Female Vocalists 0.0718
1 Metal -0.2449 Oldies 0.0688Melodic black metal -0.2029 Pop 0.0680
Black metal -0.1338 Rnb 0.0652
Lowest HighestLyrical Feature Lyrical Weight Lyrical Feature Lyrical Weight
Hit -0.1448 Christmas 0.4082Man -0.1267 Snow 0.0907
2 Rock -0.1180 Glory 0.0607Money -0.1073 Joy 0.0549Brother -0.0999 Angel 0.0530
Tag Feature Tag Weight Tag Feature Tag Weight
Hip hop -0.2312 Xmas 0.4111Rap -0.2014 Christmas 0.1679
2 Hip-Hop -0.1927 Christian 0.0662Gangsta Rap -0.1460 Female Vocalists 0.0501
Underground hip hop -0.1143 Worship 0.0480
Lowest HighestLyrical Feature Lyrical Weight Lyrical Feature Lyrical Weight
Love -0.0273 Christmas 0.6031Heart -0.0262 Snow 0.0992
3 Rain -0.0247 Man 0.0800Alone -0.0229 Rock 0.0716Dream -0.0224 Hit 0.0702
Tag Feature Tag Weight Tag Feature Tag Weight
Love -0.0399 Xmas 0.5932Female vocalists -0.0257 Christmas 0.2381
3 Alternative rock -0.0252 Hip hop 0.1265Rain -0.0237 Rap 0.0975
Oldies -0.0227 Hip-Hop 0.0906
64

Investigating Common Components between Audio, Lyrics and Tags 13
Tab
le5:
Sum
mary
of3-
way
CC
Aan
alysi
s.C
CA
com
pon
ents
are
show
nin
row
s,w
ith
the
hig
hes
tan
dlo
wes
t-w
eighte
dfe
atu
res
ofea
chdata
spac
e(a
udio
,ly
rica
l,ta
g)occ
upyin
gth
eco
lum
ns.
The
gen
eral
ised
trai
nin
gco
rrel
atio
ns
onth
efirs
tth
ree
com
ponen
tsw
ere
found
tob
e2.
1749
,2.0
005,
and
1.76
559
whilst
the
gener
alis
edte
stco
rrel
atio
ns
wer
efo
und
tob
e2.
1809
,2.0
036
and
1.7
595
(rec
all
that
thes
ege
ner
alis
edco
rrel
ati
ons
are
not
nec
essa
rily
bounded
inabso
lute
valu
eby
1).
Abbre
via
tions:
DM
=D
eath
Met
al,
BM
=B
lack
Met
al,
SS
=Sin
ger-
Son
gwri
ter,
FV
=F
emal
eV
oca
list
s,A
R=
Alt
ernat
ive
Rock
,U
HH
=U
nder
gro
und
hip
hop
.C
CA
Lowest
Highest
Lowest
Highest
Lowest
Highest
Com
p.
Audio
Fea
ture
Wei
ght
Audio
Fea
ture
Wei
ght
Word
Wei
ght
Word
Wei
ght
Tag
Fea
ture
Wei
ght
Tag
Fea
ture
Wei
ght
Loudnes
sM
ax
-0.7
008
Mea
nT
imbre
10.6
064
Dea
th-0
.0346
Lov
e0.0
572
Met
al
-0.0
581
FV
s0.0
242
Loudnes
s-0
.0442
Loudnes
sSta
rt0.1
906
Dea
d-0
. 0272
Baby
0.0
382
DM
-0.0
517
Pop
0.0
189
1Std
Tim
bre
6-0
.0426
Mea
nSeg
sC
onf.
0.1
553
Hate
-0.0
220
Blu
e0.0
179
Bru
tal
DM
-0.0
510
Cla
ssic
Countr
y0.0
183
Dura
tion
-0.0
305
Mea
nT
imbre
60.0
925
Burn
-0.0
216
Gir
l0.0
171
Mel
odic
BM
-0.0
348
Old
ies
0.0
176
Mea
nT
imbre
10
-0.0
255
Mea
nT
imbre
50.0
766
Pain
-0.0
191
Peo
ple
0.0
147
Met
alc
ore
-0.0
267
Soul
0.0
167
Loudnes
sM
ax
-0.4
676
Mea
nT
imbre
10.6
797
Dre
am
-0.0
161
Hit
0.0
372
Bea
uti
ful
-0.0
183
Hip
Hop
0.0
630
Loudnes
sSta
rt-0
.4107
Loudnes
s0.2
063
Lov
e-0
.0131
Man
0.0
343
FV
s-0
.0130
Hip
-Hop
0.0
625
2Std
Se g
sC
onf.
-0.0
899
Std
Tim
bre
80.1
238
Hea
rt-0
.0123
Roc k
0.0
320
Am
bie
nt
-0.0
113
Rap
0.0
596
Std
Tim
bre
1-0
.0568
Mea
nSeg
sC
onf.
0.1
031
Hom
e-0
.0114
Gir
l0.0
291
Chri
stia
n-0
.0112
Gangst
aR
ap
0.0
333
Std
Ti m
bre
4-0
.0469
Mea
nT
imbre
10
0.0
480
Sad
-0.0
111
Baby
0.0
283
Mel
low
-0.0
106
UH
H0.0
260
Mea
nT
imbre
1-0
.7004
Loudnes
sM
ax
0.6
402
Gir
l-0
.0124
Man
0.0
268
Dance
-0.0
266
Folk
0.0
239
Loudnes
sSta
rt-0
.1666
Loudnes
s0.0
756
Fig
ht
-0.0
124
Blu
e0.0
177
Roc k
-0.0
207
Bru
tal
DM
0.0
208
3M
ean
Tim
bre
4-0
.0797
Mea
nT
imbre
60.0
672
Cra
sh-0
.0107
Dea
th0.0
176
Pop
-0.0
183
Mel
odic
BM
0.0
195
Std
Tim
bre
6-0
.0683
Dura
tion
0.0
558
Alive
-0.0
104
Chri
stm
as
0.0
156
AR
-0.0
174
Aco
ust
ic0.0
176
Std
Se g
sC
onf.
-0.0
547
Mea
nT
imbre
30.0
472
Baby
-0.0
100
Dark
0.0
136
Ele
ctro
nic
-0.0
162
Cla
ssic
Countr
y0.0
171
65

14 Matt McVicar and Tijl De Bie
In this incorporated experiment, the most prevalent dimension appears torelate to arousal - highly weighted tags and features are gentle in nature, withaggressive tags, lyrics and audio features. The second component seems to rep-resent arousal. We struggle to find an explanation for the third component.
5 Discussion & Conclusions
In this Section, we discuss some of the findings from the previous Section, sum-marise the conclusions of our study and suggest areas for future work.
5.1 Discussion
It is clear there are similar components in this study across different experiments.For instance, the first component of the audio/lyrical 2-way CCA experimentin the lyrical domain (first few rows of Table 2 ) were very similar to the firstcomponent in the lyrical domain in the 3-way experiment (first rows of Table 5,second cell). It appears that both of these discovered dimensions are capturingthe valence of the lyrics. To verify that these projections were indeed similar,we computed the correlation between them (ie Y wY from Table 2 with Y wY
from Table 5), and found it to be 0.9979. The conclusion to be drawn is thatthe valence of lyrics is very easily captured, by comparing with audio and/or taginformation.
We now turn our attention to the second CCA component. Interested in what3-Way CCA analysis offered over pairwise CCA experiments, we investigatedthe correlations between each pair of lyrical and tag projections from all threeexperimental set-ups (2 pairwise and 3-Way). These are shown in Table 6.
Table 6: Comparison of Lyrical and Tag projections in pairwise and 3-way ex-periments.
(a) Lyrical Projections
CCA YWY
comp. 2 Lyrics/Tags 3-Way CCA
Lyrics/Audio 0.8679 0.9899Lyrics/Tags - 0.8886
(b) Tag Projections
CCA ZWZ
comp. 2 Tags/Lyrics 3-Way CCA
Tags/Audio 0.7534 0.8853Tags/Lyrics - 0.9434
The first of these tables can be interpreted as follows. Recall that in the lyrics-audio CCA experiment we found the second component to describe the arousalof the lyrics. In the lyrics-tag space we found the second lyrical componentrelated to the dominance of the lyrics. Recall that the correlations are equivalentto the angles between the projected datasets. Table 6(a) therefore shows thatthe cosines of the angles between these vectors and the third CCA componentare 0.9899 and 0.8886 respectively, but that the cosine of the angle between
66

Investigating Common Components between Audio, Lyrics and Tags 15
themselves is 0.8679. This shows that the 3-Way CCA component sits somewherebetween arousal and dominance, which can be verified by looking at the top andbottom-ranked words in Tables 2, 3 and 5.
A similar, and in fact stronger pattern can be observed in tag space by inves-tigating Table 6(b). Again, the 3-way CCA analysis seems to be an intermediatebetween the ‘old vs new’ dimension observed in the audio-tag space (Table 3,second component) and the dominance discovered in the lyrical-tag space (Table4, second component).
5.2 Conclusions & Further Work
In this paper, we have conducted a large-scale study of the correlations betweenaudio, lyrical and tag features based on the Million Song Dataset. By the use ofpairwise 2-dimensional CCA we demonstrated that the optimal correlations be-tween these datasets appear to have reconstructed the valence/arousal/dominancedimensions of the core affect space, even though this was in no way imposed bythe algorithm. In some cases, we discovered components which appeared to cap-ture some genre information, such as the third component of Table 3.
By using 3-dimensional CCA, we studied the 3 datasets simultaneously anddiscovered that valence and arousal were the most correlated features. The cor-relations beyond 2 or 3 components are difficult to interpret, which fits wellstudies which describe the core affect space as a 2 or 3 dimensional space.
In our future work we would like to investigate different multiway CCA ex-tensions such as those seen in [12], perhaps on new datasets as they are released.We also would like to more thoroughly investigate regularization techniques toavoid overfitting.
References
1. Thierry Bertin-Mahieux, Daniel P.W. Ellis, Brian Whitman, and Paul Lamere.The million song dataset. In Proceedings of the 12th International Conference onMusic Information Retrieval (ISMIR 2011), 2011.
2. T. De Bie, N. Cristianini, and R. Rosipal. Eigenproblems in pattern recogni-tion. In E. Bayro-Corrochano, editor, Handbook of Computational Geometry forPattern Recognition, Computer Vision, Neurocomputing and Robotics. Springer-Verlag, 2004.
3. K. Bischoff, C.S. Firan, R. Paiu, W. Nejdl, C. Laurier, and M. Sordo. Music moodand theme classification-a hybrid approach. In Proc. of the Intl. Society for MusicInformation Retrieval Conf., Kobe, Japan, 2009.
4. M.M. Bradley and P.J. Lang. Affective norms for english words (anew): Instructionmanual and affective ratings. University of Florida: The Center for Research inPsychophysiology, 1999.
5. J.J. Burred, M. Ramona, F. Cornu, and G. Peeters. Mirex-2010 single-label andmulti-label classification tasks: ircamclassification09 submission. MIREX 2010,2010.
67
16 Matt McVicar and Tijl De Bie
6. R. Cowie, E. Douglas-Cowie, B. Apolloni, J. Taylor, A. Romano, and W. Fellenz.What a neural net needs to know about emotion words. Computational intelligenceand applications, pages 109–114, 1999.
7. H. He, J. Jin, Y. Xiong, B. Chen, W. Sun, and L. Zhao. Language feature miningfor music emotion classification via supervised learning from lyrics. Advances inComputation and Intelligence, pages 426–435, 2008.
8. X. Hu and J.S. Downie. When lyrics outperform audio for music mood classifica-tion: a feature analysis. In Proceedings of ISMIR, pages 1–6, 2010.
9. X. Hu, J.S. Downie, C. Laurier, M. Bay, and A.F. Ehmann. The 2007 mirex audiomood classification task: Lessons learned. In Proceedings of the 9th InternationalConference on Music Information Retrieval, pages 462–467. Citeseer, 2008.
10. Y. Hu, X. Chen, and D. Yang. Lyric-based song emotion detection with affectivelexicon and fuzzy clustering method. In Proceedings of ISMIR, 2009.
11. K.S. Jones. A statistical interpretation of term specificity and its application inretrieval. Journal of documentation, 28(1):11–21, 1972.
12. J.R. Kettenring. Canonical analysis of several sets of variables. Biometrika,58(3):433–451, 1971.
13. C. Laurier, J. Grivolla, and P. Herrera. Multimodal music mood classificationusing audio and lyrics. In Machine Learning and Applications, 2008. ICMLA’08.Seventh International Conference on, pages 688–693. IEEE, 2008.
14. C. Laurier, M. Sordo, J. Serra, and P. Herrera. Music mood representations fromsocial tags. In Proceedings of the 10th International Society for Music InformationConference, Kobe, Japan. Citeseer, 2009.
15. M.I. Mandel. Svm-based audio classification, tagging, and similarity submissions.online Proc. of the 7th Annual Music Information Retrieval Evaluation eX-change(MIREX-2010), 2010.
16. M. McVicar, T. Freeman, and T. De Bie. Mining the correlation between lyrical andaudio features and the emergence of mood. In Proceedings of the 12th InternationalConference on Music Information Retrieval (ISMIR 2011), 2011.
17. J.A. Russell. A circumplex model of affect. Journal of personality and socialpsychology, 39(6):1161, 1980.
18. J.A. Russell. Core affect and the psychological construction of emotion. Psycho-logical review, 110(1):145, 2003.
19. B. Schuller, F. Weninger, and J. Dorfner. Multi-modal non-prototypical musicmood analysis in continous space: reliability and performances. In Proc. of the12th International Society for Music Information Retrieval (ISMIR) Conference,pages 759–764, 2011.
20. K. Seyerlehner, M. Schedl, T. Pohle, and P. Knees. Using block-level features forgenre classification, tag classification and music similarity estimation. Submissionto Audio Music Similarity and Retrieval Task of MIREX 2010, 2010.
21. D. Yang and W.S. Lee. Disambiguating music emotion using software agents. InProceedings of the 5th International Conference on Music Information Retrieval(ISMIR04), pages 52–58, 2004.
68


![The Visual SDIF interface in PWGL - CMMR 2012cmmr2012.eecs.qmul.ac.uk/sites/cmmr2012.eecs.qmul.ac.uk/files/p… · PWGL [9] is a Lisp-based music programming environment designed](https://img.pdfslide.us/doc/110x75/5e9d1922d95d5565da5dd626/the-visual-sdif-interface-in-pwgl-cmmr-pwgl-9-is-a-lisp-based-music-programming.jpg)