Embed Size (px)
DESCRIPTION
CBRED Economic Outlook Third Quarter 2012
Citation preview
Colle
ge o
f Bus
ines
sCENTER
3rd Quarter, 2012
UAFS.eduVol. 3, Num. 3
Fort SmithREGIONAL
Economic OutlookReport Sponsored by Arvest Bank
FOR BUSINESS RESEARCH AND ECONOMIC DEVELOPMENT
Sponsored by Arvest Bank Fort Smith Regional Economic Outlook, 3rd Quarter, 2012
UNIVERSITY OF ARKANSAS - FORT SMITH COLLEGE OF BUSINESS
The Fort Smith Regional Economic Outlook Report is published quarterly by the College of Business and the Center for Business Research and Economic Development (CBRED). Subscriptions are available for $25 per year.
For more information, please visit us on the web at uafs.edu/cob/cbre, or contact us at:
Center for Business Research and Economic DevelopmentUAFS College of Business5210 Grand Avenue, BI 218P.O. Box 3649Fort Smith, AR 72913-3649
Phone: 479-788-7938Fax: 479-424-6938E-mail: [email protected]
The Center for Business Research and Economic Development seeks to be the primary source of Fort Smith regional economic information; a catalyst for bold, innovative ideas and strategies for economic development in the area; and an active partner in the execution of sound, integrative solutions for regional prosperity and health.
Cover image: The Janet Huckabee Arkansas River Valley Nature Center located in Fort Smith, AR.
Vol. 3, Num. 3 3rd Quarter, 2012
From the Director ........................................ 1
Third Quarter Summary of Regional Economy ............................... 2-3
Consumer Sentiment in the Fort Smith Region .............................. 4-8
A Sector Analysis ofthe Fort Smith MSA ................................9-16
Sponsors .................................................. 17
uafs.edu/cob/cbred
Upcoming EventsFort Smith Regional Economic Outlook Forumsponsored by Arvest BankWednesday, June 19, 201311:30 a.m. - 1:00 p.m.Smith-Pendergraft Campus CenterReynolds Room
UAFS College of Business Sponsored by Arvest Bank 1
FOR BUSINESS RESEARCH AND ECONOMIC DEVELOPMENT
In this issue of the Fort Smith Regional Economic Outlook Report, we continue our discussion of Dr. Latisha Settlage’s analysis of the regional economy in terms of the contributions by individual sectors. Recall we began our discussion last time by comparing sectors in terms of employment, compensation, and output. We looked more deeply at the larger sectors - services, manufacturing, and retail trade - in order to compare their relative impacts on our economy.
In this report we extend that analysis by comparing sectors in terms of their relative value by creating
a value index. We also take a more careful look at a number of sectors and subsectors to better understand the underlying nature of their respective contributions. We briefly summarize sector contributions as they relate to each of the five MSA counties.
We think these kinds of analyses are important to understanding our economy and the shifts that are taking place within it. In future research, we anticipate drilling deeper into key sectors to determine the valuable subsectors that would seem to have growth potential going forward.
In order to do this, we want to better define these sectors in terms of clusters or related groupings of firms within our economy. In this process, some assistance with data from the business community may be needed to achieve the desired result – a model that best reflects our underlying economy.
Shifting gears now to the broader economy, markets have seemed to wake up from relative slumber to realize that not all is well in the U.S. economy. As I write this letter, the DOW has dropped 300-400 points since the election. While I felt like the president would be re-elected, not all apparently had the same view. Corporate reporting for the third quarter was anything but impressive, and the prospects going forward were not strong either. So it is not really a surprise to see the markets finally begin to rachet down some after a rather persistent optimism in recent weeks kept valuations up while the underlying metrics moved lower.
As has been the case for some time now, the economic news has been mixed. And that creates considerable confusion as to which way we’re headed. Employment data has been stable, if not improved slightly, depending on how you read the data. Housing has put out more “better” news than bad in recent months. And the most recent consumer sentiment numbers were up again, suggesting a decent holiday spending period might be in the offing. Manufacturing data also moved into the slow growth mode again, according to the most recent Institute of Supply Management monthly survey.
Then there are the post-election issues that await solution – call it fiscal cliff or whatever. Will a lame duck Congress really do much about these issues? I have my doubts. I suspect the most we can hope for is that they will vote to push off the implementation of this basket of tax increases and spending cuts into 2013, resulting in a few months of breathing space for the new congress to get settled in.
Spending our time and effort simply to avoid disaster is hardly a proactive way to address the significant challenges we face as a nation. All this doesn’t help the Fort Smith regional economy, though, that’s for sure. We have our own challenges and could use some stability from the broader context in order to keep our economy moving forward.
In this report, as is typical, we review the performance of the Fort Smith area economy. Housing permits and home sales were lower for the third quarter, while retail and auto sales were both higher again this quarter. The jobs picture continues to be difficult, but is showing some improvement. Our survey of Fort Smith consumer sentiment for September improved again from last quarter. And, as discussed earlier, the final section continues our discussion of key sector contributions in our economy.
As we move into the final weeks of 2012, I want to thank Arvest for another year of support of our work here in CBRED. Their commitment, along with our advertisers and subscribers, make our work possible. We are truly partners in a common cause of making the Fort Smith region the best it can possibly be.
To our future,
From
the
Dire
ctor
CENTER
Kermit W. Kuehn, Ph.D.Director, Center for Business Research and Economic Development
FR
Om
th
E D
iRE
Ct
OR
Sponsored by Arvest Bank Fort Smith Regional Economic Outlook, 3rd Quarter, 2012
UNIVERSITY OF ARKANSAS - FORT SMITH COLLEGE OF BUSINESS
2
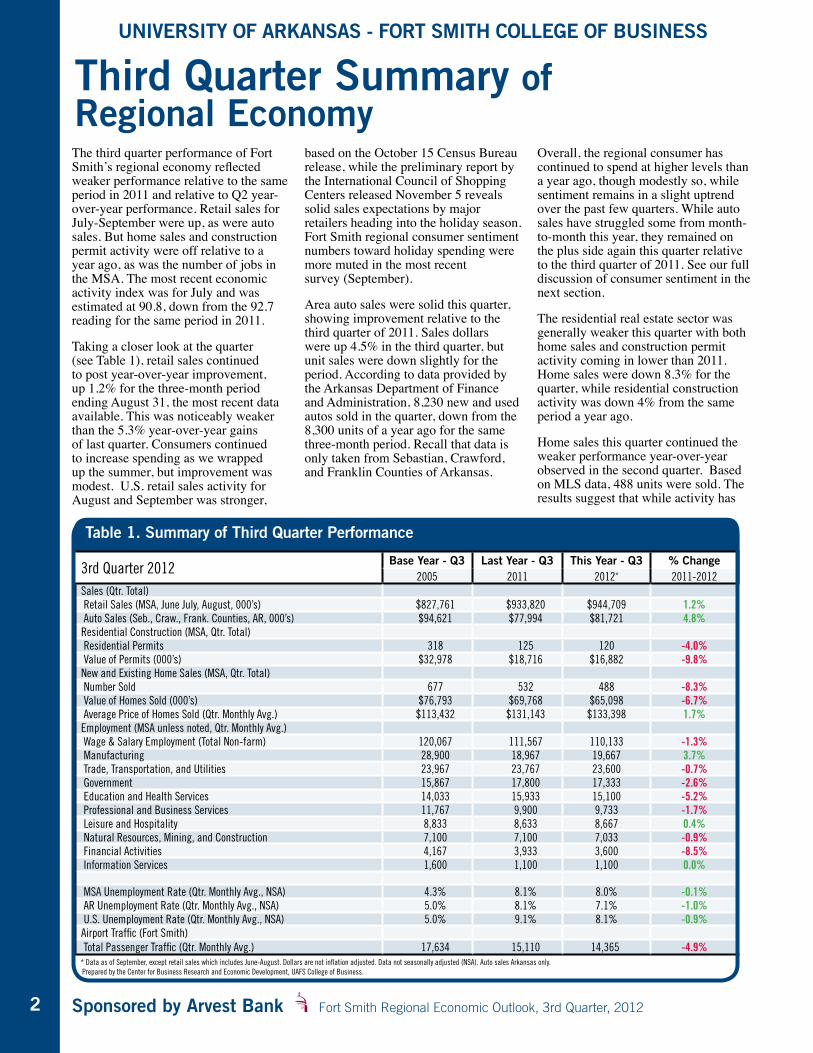
The third quarter performance of Fort Smith’s regional economy reflected weaker performance relative to the same period in 2011 and relative to Q2 year-over-year performance. Retail sales for July-September were up, as were auto sales. But home sales and construction permit activity were off relative to a year ago, as was the number of jobs in the MSA. The most recent economic activity index was for July and was estimated at 90.8, down from the 92.7 reading for the same period in 2011.
Taking a closer look at the quarter (see Table 1), retail sales continued to post year-over-year improvement, up 1.2% for the three-month period ending August 31, the most recent data available. This was noticeably weaker than the 5.3% year-over-year gains of last quarter. Consumers continued to increase spending as we wrapped up the summer, but improvement was modest. U.S. retail sales activity for August and September was stronger,
based on the October 15 Census Bureau release, while the preliminary report by the International Council of Shopping Centers released November 5 reveals solid sales expectations by major retailers heading into the holiday season. Fort Smith regional consumer sentiment numbers toward holiday spending were more muted in the most recent survey (September).
Area auto sales were solid this quarter, showing improvement relative to the third quarter of 2011. Sales dollars were up 4.5% in the third quarter, but unit sales were down slightly for the period. According to data provided by the Arkansas Department of Finance and Administration, 8,230 new and used autos sold in the quarter, down from the 8,300 units of a year ago for the same three-month period. Recall that data is only taken from Sebastian, Crawford, and Franklin Counties of Arkansas.
Overall, the regional consumer has continued to spend at higher levels than a year ago, though modestly so, while sentiment remains in a slight uptrend over the past few quarters. While auto sales have struggled some from month-to-month this year, they remained on the plus side again this quarter relative to the third quarter of 2011. See our full discussion of consumer sentiment in the next section.
The residential real estate sector was generally weaker this quarter with both home sales and construction permit activity coming in lower than 2011. Home sales were down 8.3% for the quarter, while residential construction activity was down 4% from the same period a year ago.
Home sales this quarter continued the weaker performance year-over-year observed in the second quarter. Based on MLS data, 488 units were sold. The results suggest that while activity has
Third Quarter Summary of Regional Economy
Table 1. Summary of Third Quarter Performance
3rd Quarter 2012 Base Year - Q3 Last Year - Q3 This Year - Q3 % Change2005 2011 2012* 2011-2012
Sales (Qtr. Total) Retail Sales (MSA, June July, August, 000’s) $827,761 $933,820 $944,709 1.2% Auto Sales (Seb., Craw., Frank. Counties, AR, 000’s) $94,621 $77,994 $81,721 4.8%Residential Construction (MSA, Qtr. Total) Residential Permits 318 125 120 -4.0% Value of Permits (000’s) $32,978 $18,716 $16,882 -9.8%New and Existing Home Sales (MSA, Qtr. Total) Number Sold 677 532 488 -8.3% Value of Homes Sold (000’s) $76,793 $69,768 $65,098 -6.7% Average Price of Homes Sold (Qtr. Monthly Avg.) $113,432 $131,143 $133,398 1.7%Employment (MSA unless noted, Qtr. Monthly Avg.) Wage & Salary Employment (Total Non-farm) 120,067 111,567 110,133 -1.3% Manufacturing 28,900 18,967 19,667 3.7% Trade, Transportation, and Utilities 23,967 23,767 23,600 -0.7% Government 15,867 17,800 17,333 -2.6% Education and Health Services 14,033 15,933 15,100 -5.2% Professional and Business Services 11,767 9,900 9,733 -1.7% Leisure and Hospitality 8,833 8,633 8,667 0.4% Natural Resources, Mining, and Construction 7,100 7,100 7,033 -0.9% Financial Activities 4,167 3,933 3,600 -8.5% Information Services 1,600 1,100 1,100 0.0%
MSA Unemployment Rate (Qtr. Monthly Avg., NSA) 4.3% 8.1% 8.0% -0.1% AR Unemployment Rate (Qtr. Monthly Avg., NSA) 5.0% 8.1% 7.1% -1.0% U.S. Unemployment Rate (Qtr. Monthly Avg., NSA) 5.0% 9.1% 8.1% -0.9%Airport Traffic (Fort Smith) Total Passenger Traffic (Qtr. Monthly Avg.) 17,634 15,110 14,365 -4.9%* Data as of September, except retail sales which includes June-August. Dollars are not inflation adjusted. Data not seasonally adjusted (NSA). Auto sales Arkansas only. Prepared by the Center for Business Research and Economic Development, UAFS College of Business.
UAFS College of Business Sponsored by Arvest Bank
CENTER FOR BUSINESS RESEARCH AND ECONOMIC DEVELOPMENT
3
SU
mm
AR
y O
F R
Eg
iOn
Al E
CO
nO
my
slowed, buyers exist. The sector has made significant progress since the recession, but sales are well below the 722 units sold during the high observed for the quarter in 2006.
The basic dynamics of the sector remain largely the same as they have been for the past couple of years. Interest rates continue to test record lows, inventories continue to be sufficient (at least in most price ranges), and home prices remain largely in the buyer’s favor. A large portion of mortgage activity remains refinancing versus new loans. Qualifying for mortgages is not easy, however.
The regional jobs picture continues its weaker performance, based on recent BLS data. Total non-farm employment declined 1.3% for the quarter. Based on the monthly average of total MSA employment for the third quarter, there are over 1,434 fewer jobs in the region than there were just a year ago. Taking a closer look at specific sectors, we find that the top three losers by headcount were in education and health services (-833), financial services (-333), and government (-167).
The Bureau of Labor Statistics’ (BLS) 2011 year-end revisions to their statistical model used to estimate employment continued to result in year-over-year declines in regional jobs overall. However, there are signs of improvement throughout the quarter, lead by manufacturing.
While the headcounts were down overall for the MSA for the third quarter, manufacturing (+700) and leisure and hospitality (+33) posted gains for the quarter. In fact, September data revealed that only two of nine sectors in the report lost jobs.
The unemployment rate improved slightly relative to a year ago. The 8.0% average unemployment rate for the MSA for the third quarter was a tenth lower than a year ago.
As is always the case, data are preliminary estimates and are likely to change month by month and then change again annually.
Finally, average monthly airport traffic counts for the quarter were down 4.9% relative to last year. This month-over-month decline has been more common in recent months. This suggests that corporate travel, a large segment of air travel in general, has been slowing of
late. This might reflect a similar cautious outlook in the region we see in the broader national data where corporate expectations of future activity have been weakening for a few months now.
Summary and analySiS At the writing of this report (first week of November), corporate reports have been decidedly more subdued for the third quarter and “guidance” given for the rest of the year is generally more negative. This was the same observation made in last quarter’s report. The expectation of slower growth in the fourth quarter is the dominant theme.
Markets have tended to drift lower in recent weeks with added uncertainty of the too-close-call U.S. elections weighing on decision makers. In the end, President Obama was re-elected.
Overall, the tone is more wait-and-see. Wait and see what happens with the U.S. election. Wait and see what happens in Europe... in China... in the lame-duck sessions of the U.S. Congress and the “fiscal cliff” we’re all tired of hearing about. Now, with the election behind us, we’ll wait and see what actually gets done.
Looking at some other indicators, national manufacturing and non-manufacturing numbers for October by the Institute for Supply Management were both higher than the July readings reported last quarter. The PMI (for manufacturers) rose above the important 50 level, recording a 51.7 for October, up from the 49.8 reported in July. This indicates the manufacturing sector has returned to an expansion mode in October. The NMI, which includes such sectors as professional services, information, wholesale and retail trade, came in higher at 54.2 in October. This compares with a July reading of 52.6. Index scores that trend above 50 are interpreted as a growth mode for the sector. ___________
Where does that leave us in the Fort Smith regional economy as we head into the final quarter of 2012? Not much has changed since last quarter. Some aspects of the economy have weakened from a year ago, namely residential real estate. The jobs data has begun to put together a string of improvements. So where is this going?
We’ll just have to wait and see.
“You’re kidding?I thought we were covered.”
BusinessInsuranceSOLUTIONS
PropertyGeneral Liability
Business AutoWorkers Comp
UmbrellaContractors Insurance
Surety Bonds
www.bhca.com5500 Euper Lane - Fort Smith
(479) 452-40001626 Empire Street - Lowell
(479) 878-1896
Sponsored by Arvest Bank Fort Smith Regional Economic Outlook, 3rd Quarter, 2012
UNIVERSITY OF ARKANSAS - FORT SMITH COLLEGE OF BUSINESS
4
introduction The Index of Consumer Sentiment (ICS) for the Fort Smith region edged higher again in the third quarter, continuing to register quarter-over-quarter improvements since the low of a year ago. The index for September, which measures consumer confidence for the Fort Smith MSA, was 61.2, an increase of 2.4% from the second quarter result of 59.8, and well above the 54.2 reported for the third quarter of a year ago. The rise was consistent with national results of 79.2 reported by the University of Michigan (UM) for September, which was up 8.2% from the previous quarter.
The two sub-indices for Fort Smith recorded mixed results for the quarter. The Index of Current Conditions (ICC) for the Fort Smith region, a measure of consumer attitudes toward their current economic situations, declined by 4.3% to 60.5, while the national
ICC increased by 8.3%. At the close of the third quarter, regional consumers revealed less positive views of their current financial situations than was the case last quarter but still well above the 54.7 of a year ago at this time.
The Index for Consumer Expectations (ICE), which measures consumer feelings about future economic conditions, was up 7.2% from last quarter, recording a 61.6 for the Fort Smith regional consumer. ICE scores were consistent with national scores in both direction and magnitude, reflecting more optimism as to expectations going forward than they do about their current financial situations.
National and Fort Smith consumers viewed current conditions quite differently, but held similar views expectations going forward. 1Overall, area consumers registered smaller improvements in sentiment than did
national respondents for the third quarter, but scores improved modestly.
taking a cloSer look As can be seen from Table 1, area consumer sentiment scores overall (ICS) improved in the third quarter relative to last quarter. A closer examination of results reveals that the national and regional respondents diverged significantly on their views of their own personal finances and the national economy going forward.
Two items comprise the ICC sub-index: people’s ratings of their current personal finances and whether the time is right to make major purchases (referring to durable goods). Area consumers did report less positive attitudes this quarter regarding their current personal finances, down 5.3% from last quarter. National numbers were 9.4% higher than the previous quarter.
Consumer Sentiment in the Fort Smith Region
Table 1. September 2012 Index and Component Scores
*UM= University of Michigan Survey; FS = Fort Smith Survey
INDICESQ3/2011 Q2/2012 Q3/2012 % Change Q2-Q3
UM* FS UM* FS UM* FS UM* FS
Index of Consumer Sentiment (ICS) 59.4 54.2 73.2 59.8 79.2 61.2 8.2 2.4
Index of Current Conditions (ICC) 74.9 54.7 81.5 63.2 88.3 60.5 8.3 -4.3
Index of Consumer Expectations (ICE) 49.4 53.9 67.8 57.5 73.4 61.6 8.3 7.2
INDEx COMPONENTS
Personal Finances – Current (ICC) 76 61 85 75 93 71 9.4 -5.3
Personal Finances – Expected (ICE) 104 79 110 82 111 90 0.9 9.8
Economic Outlook – 12 Months (ICE) 39 57 79 68 88 68 11.4 0.0
Economic Outlook – 5 Years (ICE) 52 77 81 78 94 87 16.0 11.5
Buying Conditions – Durables (ICC) 117 78 125 87 134 83 7.2 -4.6
CO
nS
Um
ER
SE
nt
imE
nt
1 Possible reasons for the relatively lower scores compared to the national results are discussed in detail in the first quarter 2010 report, which is available online under our Publications link: http://uafs.edu/cob/cbred.
UAFS College of Business Sponsored by Arvest Bank
CENTER FOR BUSINESS RESEARCH AND ECONOMIC DEVELOPMENT
5
The second item in the ICC, which asks whether this was a good time to purchase durable goods, was 4.6% lower than last quarter (87 to 83). National numbers were up from last quarter on this item, rising 7.2%.
Taking a closer look at the regional consumers shift in sentiment toward their personal finances, we find that 16% indicated they were financially better off than they were a year ago, unchanged from last quarter. However, 45% of current respondents indicated they were worse off than a year ago versus 41% who indicated this last quarter. The index is influenced most when the percentage of positive attitudes increases while the percentage of negative attitudes declines. In this case, the negative responses increased and pulled the score lower this quarter.
The same effect was observed in the second ICC item, where the percentage of respondents who indicated no intentions to make major purchases in the coming quarter rose more than those who did intend to make such purchases.
These differences in expectations accounted for the divergent ICC index scores observed in national and regional data, and significantly impacted the overall index (ICS) for the period.
The ICE consists of three items and seeks to measure consumer expectations going forward in areas of personal finances and national economic prospects. As to personal finances over the next twelve months, there
was increased optimism reported, with scores 9.8% higher than last quarter (82 to 90). National results were up a slim .9% for this item. In percentage terms, 19% (versus 17% last quarter) of respondents in the Fort Smith area felt their personal finances would be better off a year from now versus 29% (versus 35% last quarter) who expected them to be worse.
When asked about prospects for the general economy over the next 12 months and over the next five years, Fort Smith area respondents reported no change from last quarter in their views of the short-term prospects of the U.S. economy. National scores were up 11.4% from the June survey.
When looking at the five-year range, area respondents reported significantly more optimism than last quarter with scores rising 11.5% (78 to 87). National scores were up 16% from last quarter.
To summarize the results to this point, regional consumers reported less
optimism regarding their own current optimism towards their personal financial situations this quarter, but held more positive views about the prospects for the national economy going forward.
reSultS Specific to the fort Smith economy For each quarterly survey, we modify two items in the UM scale to focus participants on the Fort Smith regional economy as opposed to the national economy. These two items ask respondents to rate their expectations about business conditions in the Fort Smith economy over the next year and also five years from now. The overall FS ICS index and FS ICE sub-index are impacted by the change. As these items focus on future expectations as opposed to current conditions, the FS ICC scale is not affected (thus, is the same as ICC results in Table 1 for Fort Smith).
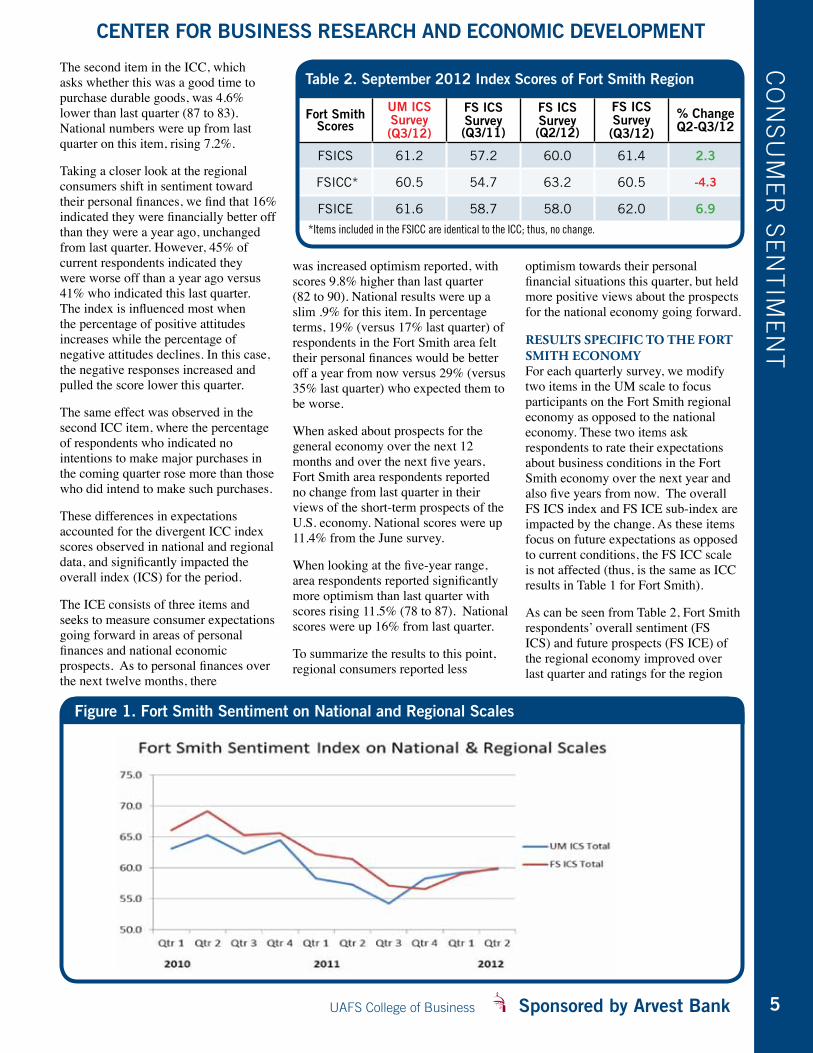
As can be seen from Table 2, Fort Smith respondents’ overall sentiment (FS ICS) and future prospects (FS ICE) of the regional economy improved over last quarter and ratings for the region
Fort Smith Scores
UM ICS Survey (Q3/12)
FS ICS Survey (Q3/11)
FS ICS Survey (Q2/12)
FS ICS Survey (Q3/12)
% Change Q2-Q3/12
FSICS 61.2 57.2 60.0 61.4 2.3
FSICC* 60.5 54.7 63.2 60.5 -4.3
FSICE 61.6 58.7 58.0 62.0 6.9
*Items included in the FSICC are identical to the ICC; thus, no change.
Table 2. September 2012 Index Scores of Fort Smith Region
Figure 1. Fort Smith Sentiment on National and Regional Scales
CO
nS
Um
ER
SE
nt
imE
nt
Sponsored by Arvest Bank Fort Smith Regional Economic Outlook, 3rd Quarter, 2012
UNIVERSITY OF ARKANSAS - FORT SMITH COLLEGE OF BUSINESS
6
CO
nS
Um
ER
SE
nt
imE
nt
were largely the same as were ratings for the U.S. economy on the same dimensions (UM ICS). Scores from the unmodified scale are restated from Table 1 and are presented in the column labeled UM ICS. Results for the third quarter reflected a 2.3% improvement in the overall index score (FS ICS) and recorded a 6.9% increase in the Index for Consumer Expectations (FS ICE) relative to last quarter. These improvements in optimism were consistent in direction and magnitude with the ratings Fort Smith consumers gave the national economy. The FS ICS score of 61.4 is essentially the same as the national score of 61.2.
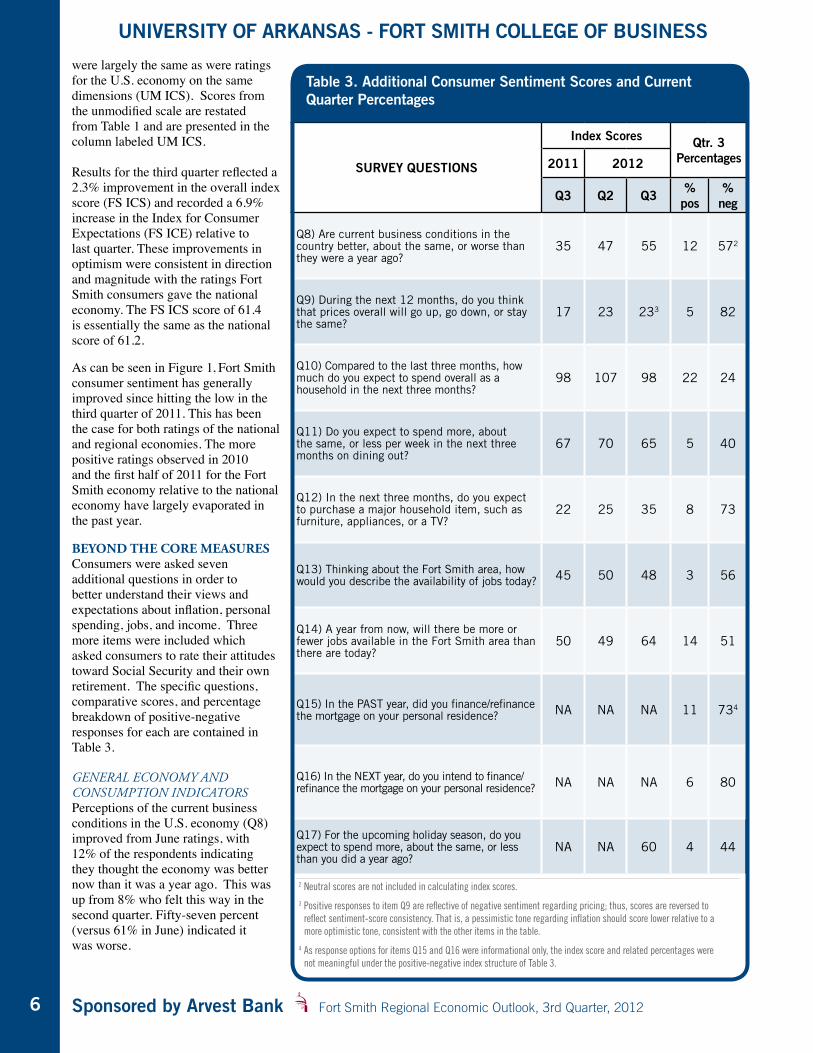
As can be seen in Figure 1, Fort Smith consumer sentiment has generally improved since hitting the low in the third quarter of 2011. This has been the case for both ratings of the national and regional economies. The more positive ratings observed in 2010 and the first half of 2011 for the Fort Smith economy relative to the national economy have largely evaporated in the past year.
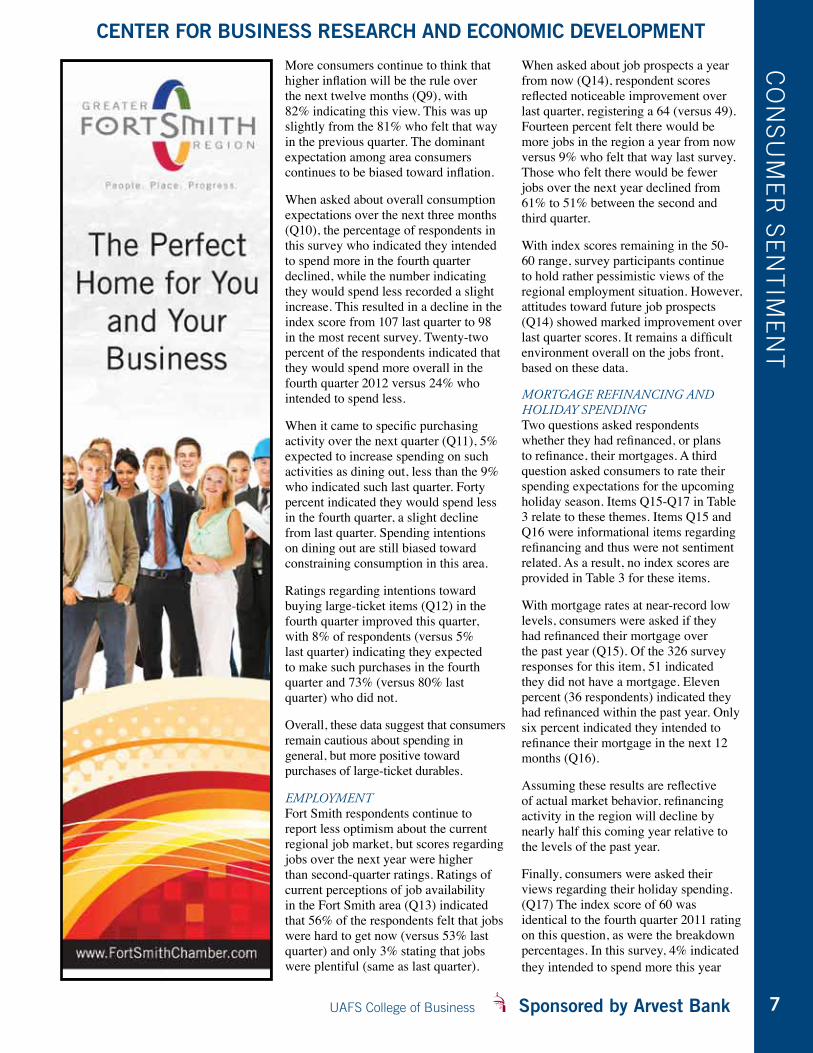
Beyond the core meaSureS Consumers were asked seven additional questions in order to better understand their views and expectations about inflation, personal spending, jobs, and income. Three more items were included which asked consumers to rate their attitudes toward Social Security and their own retirement. The specific questions, comparative scores, and percentage breakdown of positive-negative responses for each are contained in Table 3. General economy and consumption indicators Perceptions of the current business conditions in the U.S. economy (Q8) improved from June ratings, with 12% of the respondents indicating they thought the economy was better now than it was a year ago. This was up from 8% who felt this way in the second quarter. Fifty-seven percent (versus 61% in June) indicated it was worse.
2 Neutral scores are not included in calculating index scores.
3 Positive responses to item Q9 are reflective of negative sentiment regarding pricing; thus, scores are reversed to reflect sentiment-score consistency. That is, a pessimistic tone regarding inflation should score lower relative to a more optimistic tone, consistent with the other items in the table.
4 As response options for items Q15 and Q16 were informational only, the index score and related percentages were not meaningful under the positive-negative index structure of Table 3.
SURVEY QUESTIONS
Index Scores Qtr. 3Percentages2011 2012
Q3 Q2 Q3 % pos
% neg
Q8) Are current business conditions in the country better, about the same, or worse than they were a year ago?
35 47 55 12 572
Q9) During the next 12 months, do you think that prices overall will go up, go down, or stay the same?
17 23 233 5 82
Q10) Compared to the last three months, how much do you expect to spend overall as a household in the next three months?
98 107 98 22 24
Q11) Do you expect to spend more, about the same, or less per week in the next three months on dining out?
67 70 65 5 40
Q12) In the next three months, do you expect to purchase a major household item, such as furniture, appliances, or a TV?
22 25 35 8 73
Q13) Thinking about the Fort Smith area, how would you describe the availability of jobs today? 45 50 48 3 56
Q14) A year from now, will there be more or fewer jobs available in the Fort Smith area than there are today?
50 49 64 14 51
Q15) In the PAST year, did you finance/refinance the mortgage on your personal residence? NA NA NA 11 734
Q16) In the NEXT year, do you intend to finance/refinance the mortgage on your personal residence? NA NA NA 6 80
Q17) For the upcoming holiday season, do you expect to spend more, about the same, or less than you did a year ago?
NA NA 60 4 44
Table 3. Additional Consumer Sentiment Scores and Current Quarter Percentages
UAFS College of Business Sponsored by Arvest Bank
CENTER FOR BUSINESS RESEARCH AND ECONOMIC DEVELOPMENT
7
More consumers continue to think that higher inflation will be the rule over the next twelve months (Q9), with 82% indicating this view. This was up slightly from the 81% who felt that way in the previous quarter. The dominant expectation among area consumers continues to be biased toward inflation.
When asked about overall consumption expectations over the next three months (Q10), the percentage of respondents in this survey who indicated they intended to spend more in the fourth quarter declined, while the number indicating they would spend less recorded a slight increase. This resulted in a decline in the index score from 107 last quarter to 98 in the most recent survey. Twenty-two percent of the respondents indicated that they would spend more overall in the fourth quarter 2012 versus 24% who intended to spend less.
When it came to specific purchasing activity over the next quarter (Q11), 5% expected to increase spending on such activities as dining out, less than the 9% who indicated such last quarter. Forty percent indicated they would spend less in the fourth quarter, a slight decline from last quarter. Spending intentions on dining out are still biased toward constraining consumption in this area.
Ratings regarding intentions toward buying large-ticket items (Q12) in the fourth quarter improved this quarter, with 8% of respondents (versus 5% last quarter) indicating they expected to make such purchases in the fourth quarter and 73% (versus 80% last quarter) who did not.
Overall, these data suggest that consumers remain cautious about spending in general, but more positive toward purchases of large-ticket durables.
employment Fort Smith respondents continue to report less optimism about the current regional job market, but scores regarding jobs over the next year were higher than second-quarter ratings. Ratings of current perceptions of job availability in the Fort Smith area (Q13) indicated that 56% of the respondents felt that jobs were hard to get now (versus 53% last quarter) and only 3% stating that jobs were plentiful (same as last quarter).
When asked about job prospects a year from now (Q14), respondent scores reflected noticeable improvement over last quarter, registering a 64 (versus 49). Fourteen percent felt there would be more jobs in the region a year from now versus 9% who felt that way last survey. Those who felt there would be fewer jobs over the next year declined from 61% to 51% between the second and third quarter.
With index scores remaining in the 50-60 range, survey participants continue to hold rather pessimistic views of the regional employment situation. However, attitudes toward future job prospects (Q14) showed marked improvement over last quarter scores. It remains a difficult environment overall on the jobs front, based on these data.
mortGaGe refinancinG and Holiday spendinG Two questions asked respondents whether they had refinanced, or plans to refinance, their mortgages. A third question asked consumers to rate their spending expectations for the upcoming holiday season. Items Q15-Q17 in Table 3 relate to these themes. Items Q15 and Q16 were informational items regarding refinancing and thus were not sentiment related. As a result, no index scores are provided in Table 3 for these items.
With mortgage rates at near-record low levels, consumers were asked if they had refinanced their mortgage over the past year (Q15). Of the 326 survey responses for this item, 51 indicated they did not have a mortgage. Eleven percent (36 respondents) indicated they had refinanced within the past year. Only six percent indicated they intended to refinance their mortgage in the next 12 months (Q16).
Assuming these results are reflective of actual market behavior, refinancing activity in the region will decline by nearly half this coming year relative to the levels of the past year.
Finally, consumers were asked their views regarding their holiday spending. (Q17) The index score of 60 was identical to the fourth quarter 2011 rating on this question, as were the breakdown percentages. In this survey, 4% indicated they intended to spend more this year
CO
nS
Um
ER
SE
nt
imE
nt
Sponsored by Arvest Bank Fort Smith Regional Economic Outlook, 3rd Quarter, 2012
UNIVERSITY OF ARKANSAS - FORT SMITH COLLEGE OF BUSINESS
8
CO
nS
Um
ER
SE
nt
imE
nt
than they did last year and 44% reported that they would spend less. This item will be repeated in the fourth-quarter survey to be conducted in December.
While it is not possible to determine whether the rate of refinancing has peaked based on the results here, it does appear that many took advantage of record low rates of the past year to refinance. Further, it appears that going forward refinancing activity will decline.
Overall, third-quarter results suggest that area consumer attitudes were again mixed compared to the previous report. The overall index (ICS) was higher again this quarter with future expectation scores (ICE) contributing most to this positive trend. Current conditions were lower relative to the last quarter.
While the overall score continued to improve, sentiment was generally weak across items in the survey. Ratings of the current job context were largely unchanged from the last survey.However, ratings of prospects for jobs over the next year were noticeably more positive in this report.
On the consumption side, evidence from this survey suggests some weakening in consumer buying behavior going into the fourth quarter. Based on these results general consumption might be expected
to decline, while durables could see some improvement.
The most recent University of Michigan consumer sentiment survey for October reveals a consumer who is more upbeat than in previous months and retail sales estimates for retailers are expected to exceed last year’s activity. Regionally, consumers have continued to spend above last year’s levels. This suggests that a respectable holiday season could be in the making again this year.
about tHe survey Of the 3,200 surveys mailed to the five-county MSA, 374 were returned undeliverable and 328 usable surveys were returned, providing a return rate of 11.6%. As a result, the confidence level exceeds 90% for this survey.
The University of Michigan’s (UM) Index of Consumer Sentiment (ICS) survey is used to measure consumer attitudes on several economic themes. Collectively, these represent consumer optimism or confidence levels for any given period and can be used to compare any one period with another.
The overall ICS score includes five core questions and constitutes a general measure of consumer sentiment for the period. These questions cover three general areas of consumer sentiment: personal finances, business conditions, and buying conditions. Two sub-
indices within the ICS make up the Index of Consumer Expectations (ICE) and the Index of Current Economic Conditions, or more simply, Index of Current Conditions (ICC). The ICE “focuses on three areas: how consumers view prospects for their own financial situation, how they view prospects for the general economy over the near term, and their view of prospects for the economy over the long term” (University of Michigan). The ICC focuses on consumers’ views of their current financial condition and whether they feel secure enough about their financial situations to engage in major consumption activity.
For more information on the Consumer Sentiment Survey, methodology used, and discussion regarding results, a more extensive narrative is provided in the first quarter 2010 report that is available online under our Publications link at uafs.edu/cob/cbred.
UAFS College of Business Sponsored by Arvest Bank
CENTER FOR BUSINESS RESEARCH AND ECONOMIC DEVELOPMENT
9
In last quarter’s report1 we examined the key sector contributions to the Fort Smith regional economy in terms of jobs, compensation, and output or GDP. Using IMPLAN2 software and datasets we examined the structure of the regional economy in 2007 and 2010 (the most recent data available).
We first provided an overview of the economic sector-contributions and noted what had changed in the pre-recession (2007) and post-recession (2010) economies. We took a more in-depth look at manufacturing, retail trade, and services sectors, key components of our economy, and discussed the main
subsectors within these sectors, as well as the economic impacts of these on our economy. We concluded with a discussion of some the preliminary findings found in the report. We urge you to take a moment to re-read last quarter’s report to refresh your memory before proceeding.
In this issue, we wrap up our discussion of this special report. First, based on our discussions last time, we take a brief look at the per-employee output and compensation of each sector based on the headcounts reported in each. We then look more closely at other important sectors of our economy, such
as government, construction, and mining, as well as the health-care subsector. Finally, we break down the data further to take a brief look at the respective counties that comprise the Fort Smith Metropolitan Statistical Area (MSA). As was the case last time, we conclude with additional commentary on observations and implications noted from the analysis.
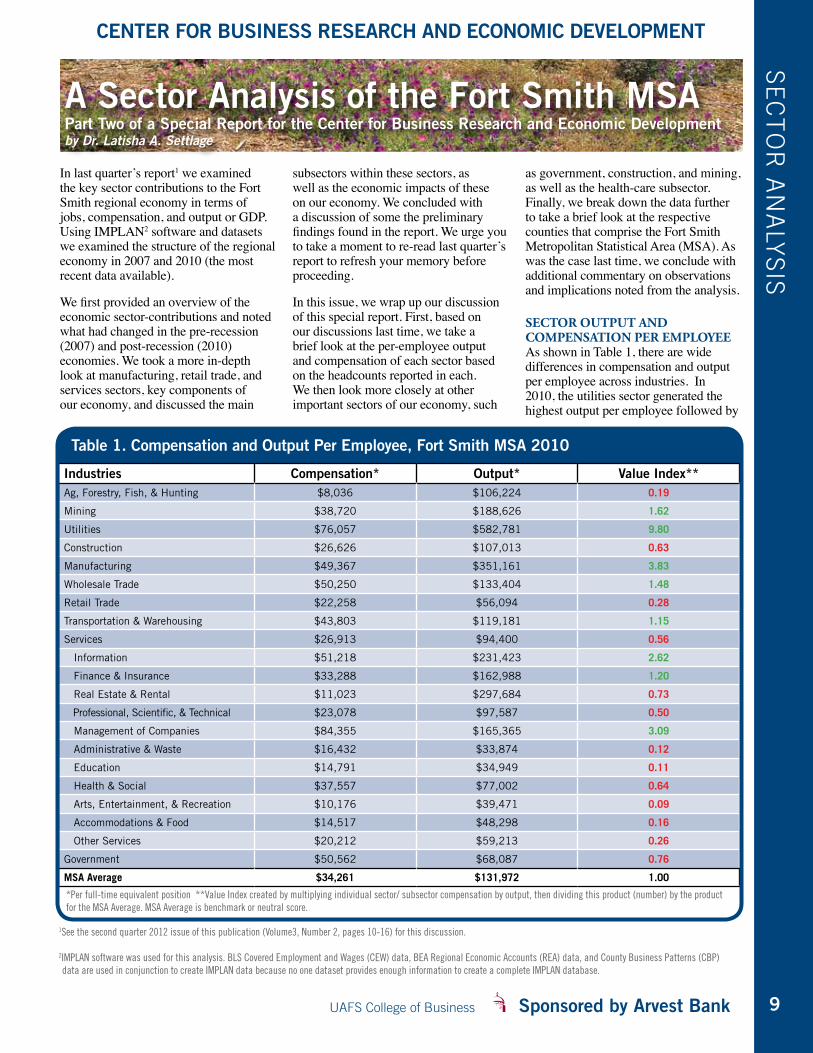
Sector output and compenSation per employeeAs shown in Table 1, there are wide differences in compensation and output per employee across industries. In 2010, the utilities sector generated the highest output per employee followed by
A Sector Analysis of the Fort Smith MSA Part Two of a Special Report for the Center for Business Research and Economic Developmentby Dr. Latisha A. Settlage
1See the second quarter 2012 issue of this publication (Volume3, Number 2, pages 10-16) for this discussion.
2IMPLAN software was used for this analysis. BLS Covered Employment and Wages (CEW) data, BEA Regional Economic Accounts (REA) data, and County Business Patterns (CBP) data are used in conjunction to create IMPLAN data because no one dataset provides enough information to create a complete IMPLAN database.
*Per full-time equivalent position **Value Index created by multiplying individual sector/ subsector compensation by output, then dividing this product (number) by the product for the MSA Average. MSA Average is benchmark or neutral score.
Table 1. Compensation and Output Per Employee, Fort Smith MSA 2010
Industries Compensation* Output* Value Index**Ag, Forestry, Fish, & Hunting $8,036 $106,224 0.19
Mining $38,720 $188,626 1.62
Utilities $76,057 $582,781 9.80
Construction $26,626 $107,013 0.63
Manufacturing $49,367 $351,161 3.83
Wholesale Trade $50,250 $133,404 1.48
Retail Trade $22,258 $56,094 0.28
Transportation & Warehousing $43,803 $119,181 1.15
Services $26,913 $94,400 0.56
Information $51,218 $231,423 2.62
Finance & Insurance $33,288 $162,988 1.20
Real Estate & Rental $11,023 $297,684 0.73
Professional, Scientific, & Technical $23,078 $97,587 0.50
Management of Companies $84,355 $165,365 3.09
Administrative & Waste $16,432 $33,874 0.12
Education $14,791 $34,949 0.11
Health & Social $37,557 $77,002 0.64
Arts, Entertainment, & Recreation $10,176 $39,471 0.09
Accommodations & Food $14,517 $48,298 0.16
Other Services $20,212 $59,213 0.26
Government $50,562 $68,087 0.76
MSA Average $34,261 $131,972 1.00
SE
Ct
OR
An
Aly
SiS
Sponsored by Arvest Bank Fort Smith Regional Economic Outlook, 3rd Quarter, 2012
UNIVERSITY OF ARKANSAS - FORT SMITH COLLEGE OF BUSINESS
10
manufacturing and mining. Output per employee can be regarded as a proxy for productivity of a sector – it measures the amount of production output attributable to one full-time equivalent employee. The retail trade, government, and service sectors had the smallest output-per-employee figures. This is due to the fact that these sectors do not generate high value output relative to the large numbers of individuals they employ. It is noted, however, that within the services sector, there is disparity in output per employee among the various services categories. For example, information, finance/insurance, real estate, and management all generate a much higher value of output per employee relative to their counterparts in the sector.
Compensation per employee was greatest in the utilities sector in 2010 followed by government and wholesale trade. Manufacturing ranked fourth. The sectors with lowest per-employee compensation were agriculture, retail trade, construction, and service. Compensation per employee is a proxy for annual salary. It should be noted that compensation is measured purely in terms of wages and does not include proprietor profit. This explains the extremely low value for agriculture as well as the low ranking for construction. As is the case with output per employee, there is wide variability in compensation per employee across the service sectors with management, information, and health ranking as the highest.
In order to evaluate the relative value of a particular sector or subsector to our economy, a Value Index was calculated. The index seeks to reveal the relative value of each sector by combining the value of the compensation and output per employee and comparing that new value with the MSA average value. Values above the MSA average (index score above 1.00) might be categorized as high-value sectors (in green). Those below the MSA average could be viewed as relatively less valuable in terms of the combined impact of compensation and output. Based on this metric, mining, utilities, manufacturing, wholesale trade, transportation and warehousing, information services, finance and insurance, and management of companies offer the strongest value in terms of joint value of compensation paid and estimated output for the sector.
a cloSer look at healthcare Previously, the sectors of manufacturing, services, and trade were identified as the most significant to the Fort Smith MSA in terms of employment and output. Altogether in 2010 they accounted for three-quarters of MSA output, 70% of jobs, and 65% of employee compensation. In addition to the direct amount of output they produce for the regional economy, they also generate significant additional output in the region through their supplier relationships as well as the spending that is carried out by their employees.
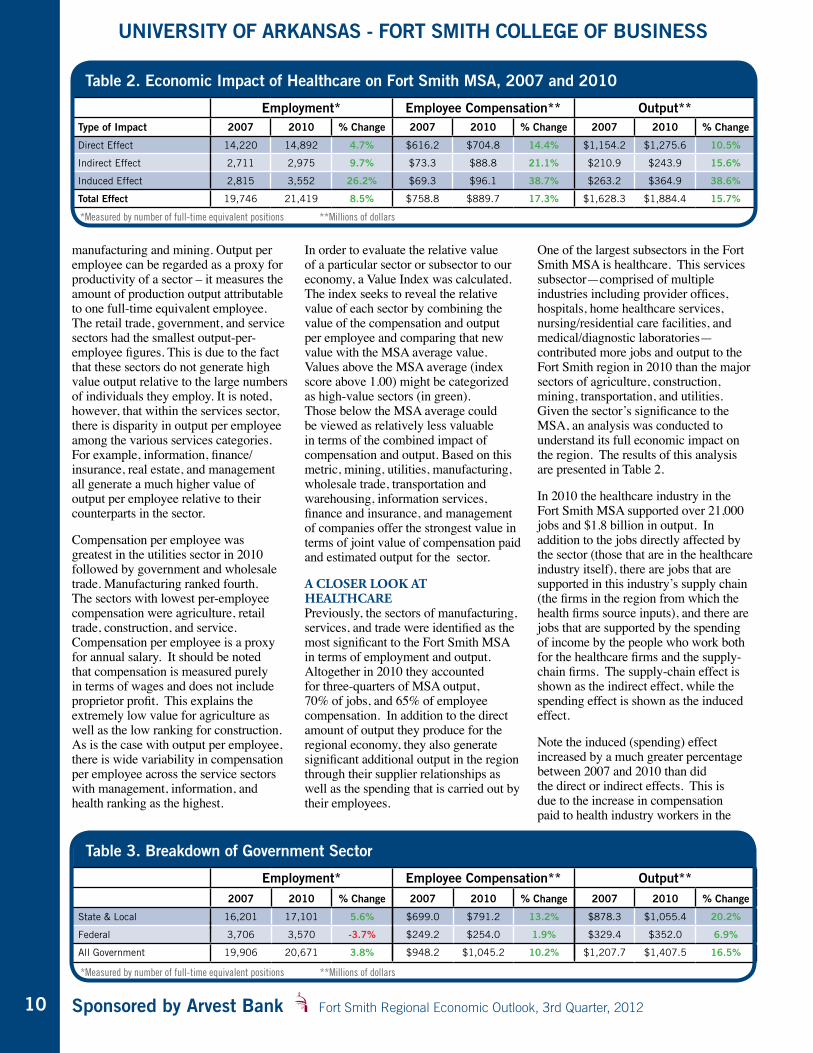
One of the largest subsectors in the Fort Smith MSA is healthcare. This services subsector—comprised of multiple industries including provider offices, hospitals, home healthcare services, nursing/residential care facilities, and medical/diagnostic laboratories—contributed more jobs and output to the Fort Smith region in 2010 than the major sectors of agriculture, construction, mining, transportation, and utilities. Given the sector’s significance to the MSA, an analysis was conducted to understand its full economic impact on the region. The results of this analysis are presented in Table 2.
In 2010 the healthcare industry in the Fort Smith MSA supported over 21,000 jobs and $1.8 billion in output. In addition to the jobs directly affected by the sector (those that are in the healthcare industry itself), there are jobs that are supported in this industry’s supply chain (the firms in the region from which the health firms source inputs), and there are jobs that are supported by the spending of income by the people who work both for the healthcare firms and the supply-chain firms. The supply-chain effect is shown as the indirect effect, while the spending effect is shown as the induced effect.
Note the induced (spending) effect increased by a much greater percentage between 2007 and 2010 than did the direct or indirect effects. This is due to the increase in compensation paid to health industry workers in the
Table 2. Economic Impact of Healthcare on Fort Smith MSA, 2007 and 2010
Employment* Employee Compensation** Output**Type of Impact 2007 2010 % Change 2007 2010 % Change 2007 2010 % Change
Direct Effect 14,220 14,892 4.7% $616.2 $704.8 14.4% $1,154.2 $1,275.6 10.5%
Indirect Effect 2,711 2,975 9.7% $73.3 $88.8 21.1% $210.9 $243.9 15.6%
Induced Effect 2,815 3,552 26.2% $69.3 $96.1 38.7% $263.2 $364.9 38.6%
Total Effect 19,746 21,419 8.5% $758.8 $889.7 17.3% $1,628.3 $1,884.4 15.7%
*Measured by number of full-time equivalent positions **Millions of dollars
Table 3. Breakdown of Government Sector
Employment* Employee Compensation** Output**2007 2010 % Change 2007 2010 % Change 2007 2010 % Change
State & Local 16,201 17,101 5.6% $699.0 $791.2 13.2% $878.3 $1,055.4 20.2%
Federal 3,706 3,570 -3.7% $249.2 $254.0 1.9% $329.4 $352.0 6.9%
All Government 19,906 20,671 3.8% $948.2 $1,045.2 10.2% $1,207.7 $1,407.5 16.5%
*Measured by number of full-time equivalent positions **Millions of dollars
UAFS College of Business Sponsored by Arvest Bank
CENTER FOR BUSINESS RESEARCH AND ECONOMIC DEVELOPMENT
11
MSA between 2007 and 2010. It is also important to note the significant percentage increase in indirect effects for employment, employee compensation, and output. This suggests that firms in health-related industries are increasing both the number and volume of input-supply transactions with firms located in the MSA. This may be an opportunity for future job growth in the region. Clearly, health represents a set of growing industries. By understanding both future labor as well as input needs, it will be possible to sustain and perhaps increase this job and output growth. Breakdown of government, conStruction, and mining into SuBSectorS In this section we break down key sectors into subsector detail in order to better understand the underlying contributions within each sector. We will look at government, construction, and mining sectors.
Government The government sector also experienced gains in employment, employee compensation, and output between 2007 and 2010. This is not surprising with spending on government programs on the rise during this period in hopes of stimulating consumer spending during the economic recovery from the recession. The government sector accounts for spending on federal as well as state and local programs.
As shown in Table 3, employment in the government sector rose by 3.8% between 2007 and 2010 in the Fort Smith MSA with employment in the state and local subsector accounting for the entire increase. Federal government employment actually fell during the period, perhaps due to cutbacks in programs such as defense. Employee compensation increased by 10.2% at the federal level, as well as state and local levels. Output also went up in both subsectors accounting for the 16.5% overall increase for the government sector.
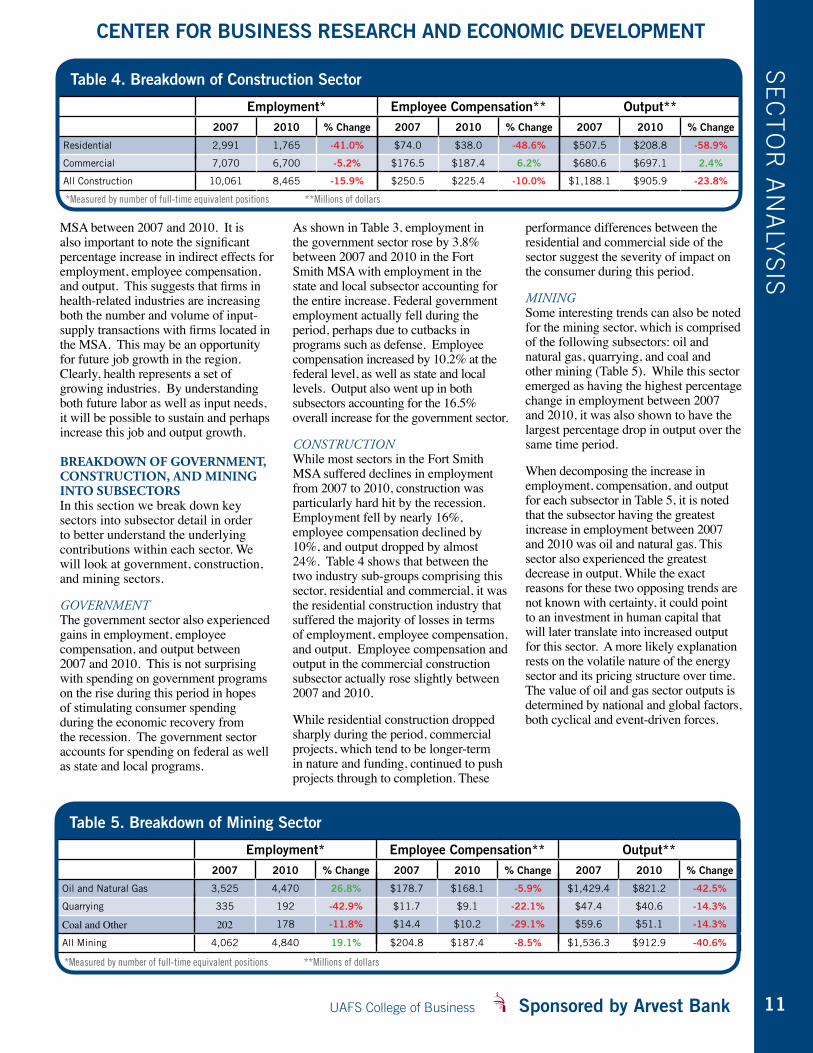
construction While most sectors in the Fort Smith MSA suffered declines in employment from 2007 to 2010, construction was particularly hard hit by the recession. Employment fell by nearly 16%, employee compensation declined by 10%, and output dropped by almost 24%. Table 4 shows that between the two industry sub-groups comprising this sector, residential and commercial, it was the residential construction industry that suffered the majority of losses in terms of employment, employee compensation, and output. Employee compensation and output in the commercial construction subsector actually rose slightly between 2007 and 2010.
While residential construction dropped sharply during the period, commercial projects, which tend to be longer-term in nature and funding, continued to push projects through to completion. These
performance differences between the residential and commercial side of the sector suggest the severity of impact on the consumer during this period.
mininG Some interesting trends can also be noted for the mining sector, which is comprised of the following subsectors: oil and natural gas, quarrying, and coal and other mining (Table 5). While this sector emerged as having the highest percentage change in employment between 2007 and 2010, it was also shown to have the largest percentage drop in output over the same time period.
When decomposing the increase in employment, compensation, and output for each subsector in Table 5, it is noted that the subsector having the greatest increase in employment between 2007 and 2010 was oil and natural gas. This sector also experienced the greatest decrease in output. While the exact reasons for these two opposing trends are not known with certainty, it could point to an investment in human capital that will later translate into increased output for this sector. A more likely explanation rests on the volatile nature of the energy sector and its pricing structure over time. The value of oil and gas sector outputs is determined by national and global factors, both cyclical and event-driven forces.
Table 5. Breakdown of Mining Sector
Employment* Employee Compensation** Output**2007 2010 % Change 2007 2010 % Change 2007 2010 % Change
Oil and Natural Gas 3,525 4,470 26.8% $178.7 $168.1 -5.9% $1,429.4 $821.2 -42.5%
Quarrying 335 192 -42.9% $11.7 $9.1 -22.1% $47.4 $40.6 -14.3%
Coal and Other 202 178 -11.8% $14.4 $10.2 -29.1% $59.6 $51.1 -14.3%
All Mining 4,062 4,840 19.1% $204.8 $187.4 -8.5% $1,536.3 $912.9 -40.6%
*Measured by number of full-time equivalent positions **Millions of dollars
SE
Ct
OR
An
Aly
SiS
Table 4. Breakdown of Construction Sector
Employment* Employee Compensation** Output**2007 2010 % Change 2007 2010 % Change 2007 2010 % Change
Residential 2,991 1,765 -41.0% $74.0 $38.0 -48.6% $507.5 $208.8 -58.9%
Commercial 7,070 6,700 -5.2% $176.5 $187.4 6.2% $680.6 $697.1 2.4%
All Construction 10,061 8,465 -15.9% $250.5 $225.4 -10.0% $1,188.1 $905.9 -23.8%
*Measured by number of full-time equivalent positions **Millions of dollars
Sponsored by Arvest Bank Fort Smith Regional Economic Outlook, 3rd Quarter, 2012
UNIVERSITY OF ARKANSAS - FORT SMITH COLLEGE OF BUSINESS
12
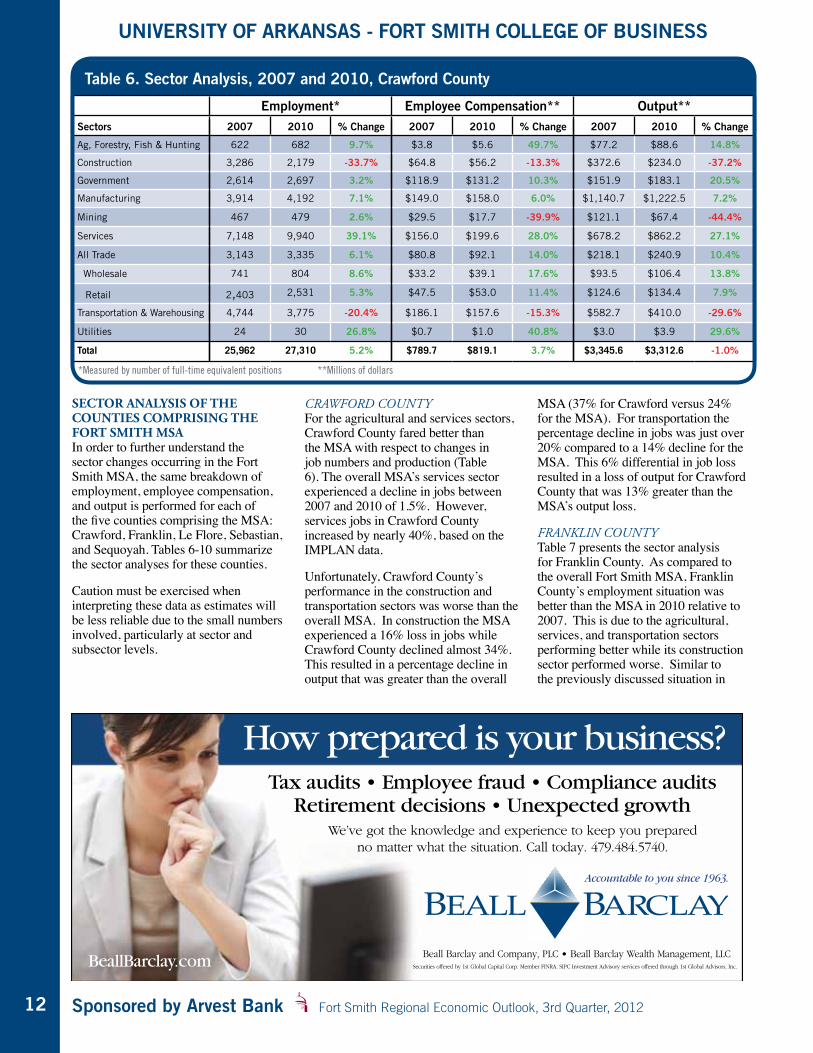
Table 6. Sector Analysis, 2007 and 2010, Crawford County
Employment* Employee Compensation** Output**Sectors 2007 2010 % Change 2007 2010 % Change 2007 2010 % Change
Ag, Forestry, Fish & Hunting 622 682 9.7% $3.8 $5.6 49.7% $77.2 $88.6 14.8%
Construction 3,286 2,179 -33.7% $64.8 $56.2 -13.3% $372.6 $234.0 -37.2%
Government 2,614 2,697 3.2% $118.9 $131.2 10.3% $151.9 $183.1 20.5%
Manufacturing 3,914 4,192 7.1% $149.0 $158.0 6.0% $1,140.7 $1,222.5 7.2%
Mining 467 479 2.6% $29.5 $17.7 -39.9% $121.1 $67.4 -44.4%
Services 7,148 9,940 39.1% $156.0 $199.6 28.0% $678.2 $862.2 27.1%
All Trade 3,143 3,335 6.1% $80.8 $92.1 14.0% $218.1 $240.9 10.4%
Wholesale 741 804 8.6% $33.2 $39.1 17.6% $93.5 $106.4 13.8%
Retail 2,403 2,531 5.3% $47.5 $53.0 11.4% $124.6 $134.4 7.9%
Transportation & Warehousing 4,744 3,775 -20.4% $186.1 $157.6 -15.3% $582.7 $410.0 -29.6%
Utilities 24 30 26.8% $0.7 $1.0 40.8% $3.0 $3.9 29.6%
Total 25,962 27,310 5.2% $789.7 $819.1 3.7% $3,345.6 $3,312.6 -1.0%
*Measured by number of full-time equivalent positions **Millions of dollars
Sector analySiS of the countieS compriSing the fort Smith mSa In order to further understand the sector changes occurring in the Fort Smith MSA, the same breakdown of employment, employee compensation, and output is performed for each of the five counties comprising the MSA: Crawford, Franklin, Le Flore, Sebastian, and Sequoyah. Tables 6-10 summarize the sector analyses for these counties.
Caution must be exercised when interpreting these data as estimates will be less reliable due to the small numbers involved, particularly at sector and subsector levels.
crawford county For the agricultural and services sectors, Crawford County fared better than the MSA with respect to changes in job numbers and production (Table 6). The overall MSA’s services sector experienced a decline in jobs between 2007 and 2010 of 1.5%. However, services jobs in Crawford County increased by nearly 40%, based on the IMPLAN data.
Unfortunately, Crawford County’s performance in the construction and transportation sectors was worse than the overall MSA. In construction the MSA experienced a 16% loss in jobs while Crawford County declined almost 34%. This resulted in a percentage decline in output that was greater than the overall
MSA (37% for Crawford versus 24% for the MSA). For transportation the percentage decline in jobs was just over 20% compared to a 14% decline for the MSA. This 6% differential in job loss resulted in a loss of output for Crawford County that was 13% greater than the MSA’s output loss.
franklin county Table 7 presents the sector analysis for Franklin County. As compared to the overall Fort Smith MSA, Franklin County’s employment situation was better than the MSA in 2010 relative to 2007. This is due to the agricultural, services, and transportation sectors performing better while its construction sector performed worse. Similar to the previously discussed situation in
How prepared is your business?Tax audits • Employee fraud • Compliance audits
Retirement decisions • Unexpected growth
Accountable to you since 1963.
We’ve got the knowledge and experience to keep you preparedno matter what the situation. Call today. 479.484.5740.
BeallBarclay.com Beall Barclay and Company, PLC • Beall Barclay Wealth Management, LLCSecurities offered by 1st Global Capital Corp. Member FINRA. SIPC Investment Advisory services offered through 1st Global Advisors, Inc.
UAFS College of Business Sponsored by Arvest Bank
CENTER FOR BUSINESS RESEARCH AND ECONOMIC DEVELOPMENT
13
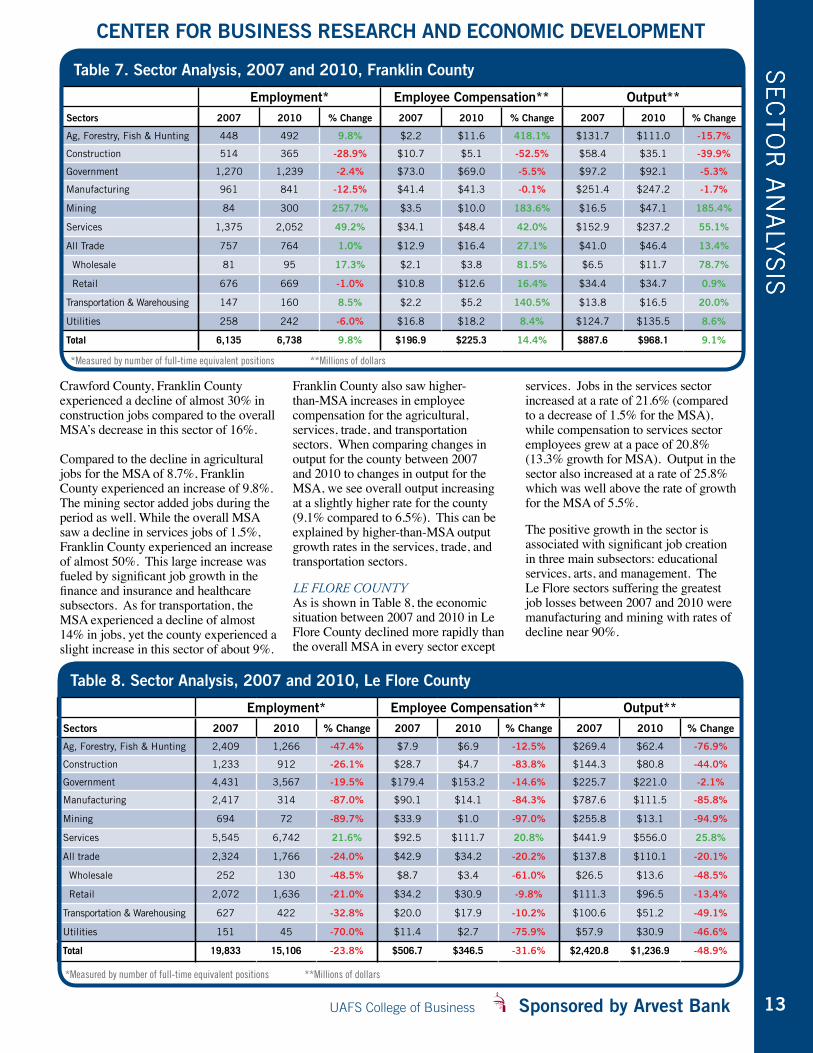
Crawford County, Franklin County experienced a decline of almost 30% in construction jobs compared to the overall MSA’s decrease in this sector of 16%. Compared to the decline in agricultural jobs for the MSA of 8.7%, Franklin County experienced an increase of 9.8%. The mining sector added jobs during the period as well. While the overall MSA saw a decline in services jobs of 1.5%, Franklin County experienced an increase of almost 50%. This large increase was fueled by significant job growth in the finance and insurance and healthcare subsectors. As for transportation, the MSA experienced a decline of almost 14% in jobs, yet the county experienced a slight increase in this sector of about 9%.
Franklin County also saw higher-than-MSA increases in employee compensation for the agricultural, services, trade, and transportation sectors. When comparing changes in output for the county between 2007 and 2010 to changes in output for the MSA, we see overall output increasing at a slightly higher rate for the county (9.1% compared to 6.5%). This can be explained by higher-than-MSA output growth rates in the services, trade, and transportation sectors.
le flore county As is shown in Table 8, the economic situation between 2007 and 2010 in Le Flore County declined more rapidly than the overall MSA in every sector except
services. Jobs in the services sector increased at a rate of 21.6% (compared to a decrease of 1.5% for the MSA), while compensation to services sector employees grew at a pace of 20.8% (13.3% growth for MSA). Output in the sector also increased at a rate of 25.8% which was well above the rate of growth for the MSA of 5.5%.
The positive growth in the sector is associated with significant job creation in three main subsectors: educational services, arts, and management. The Le Flore sectors suffering the greatest job losses between 2007 and 2010 were manufacturing and mining with rates of decline near 90%.
SE
Ct
OR
An
Aly
SiS
Table 7. Sector Analysis, 2007 and 2010, Franklin County
*Measured by number of full-time equivalent positions **Millions of dollars
Employment* Employee Compensation** Output**Sectors 2007 2010 % Change 2007 2010 % Change 2007 2010 % Change
Ag, Forestry, Fish & Hunting 448 492 9.8% $2.2 $11.6 418.1% $131.7 $111.0 -15.7%
Construction 514 365 -28.9% $10.7 $5.1 -52.5% $58.4 $35.1 -39.9%
Government 1,270 1,239 -2.4% $73.0 $69.0 -5.5% $97.2 $92.1 -5.3%
Manufacturing 961 841 -12.5% $41.4 $41.3 -0.1% $251.4 $247.2 -1.7%
Mining 84 300 257.7% $3.5 $10.0 183.6% $16.5 $47.1 185.4%
Services 1,375 2,052 49.2% $34.1 $48.4 42.0% $152.9 $237.2 55.1%
All Trade 757 764 1.0% $12.9 $16.4 27.1% $41.0 $46.4 13.4%
Wholesale 81 95 17.3% $2.1 $3.8 81.5% $6.5 $11.7 78.7%
Retail 676 669 -1.0% $10.8 $12.6 16.4% $34.4 $34.7 0.9%
Transportation & Warehousing 147 160 8.5% $2.2 $5.2 140.5% $13.8 $16.5 20.0%
Utilities 258 242 -6.0% $16.8 $18.2 8.4% $124.7 $135.5 8.6%
Total 6,135 6,738 9.8% $196.9 $225.3 14.4% $887.6 $968.1 9.1%
Table 8. Sector Analysis, 2007 and 2010, Le Flore County
Employment* Employee Compensation** Output**Sectors 2007 2010 % Change 2007 2010 % Change 2007 2010 % Change
Ag, Forestry, Fish & Hunting 2,409 1,266 -47.4% $7.9 $6.9 -12.5% $269.4 $62.4 -76.9%
Construction 1,233 912 -26.1% $28.7 $4.7 -83.8% $144.3 $80.8 -44.0%
Government 4,431 3,567 -19.5% $179.4 $153.2 -14.6% $225.7 $221.0 -2.1%
Manufacturing 2,417 314 -87.0% $90.1 $14.1 -84.3% $787.6 $111.5 -85.8%
Mining 694 72 -89.7% $33.9 $1.0 -97.0% $255.8 $13.1 -94.9%
Services 5,545 6,742 21.6% $92.5 $111.7 20.8% $441.9 $556.0 25.8%
All trade 2,324 1,766 -24.0% $42.9 $34.2 -20.2% $137.8 $110.1 -20.1%
Wholesale 252 130 -48.5% $8.7 $3.4 -61.0% $26.5 $13.6 -48.5%
Retail 2,072 1,636 -21.0% $34.2 $30.9 -9.8% $111.3 $96.5 -13.4%
Transportation & Warehousing 627 422 -32.8% $20.0 $17.9 -10.2% $100.6 $51.2 -49.1%
Utilities 151 45 -70.0% $11.4 $2.7 -75.9% $57.9 $30.9 -46.6%
Total 19,833 15,106 -23.8% $506.7 $346.5 -31.6% $2,420.8 $1,236.9 -48.9%
*Measured by number of full-time equivalent positions **Millions of dollars
SE
Ct
OR
An
Aly
SiS
Sponsored by Arvest Bank Fort Smith Regional Economic Outlook, 3rd Quarter, 2012
UNIVERSITY OF ARKANSAS - FORT SMITH COLLEGE OF BUSINESS
14
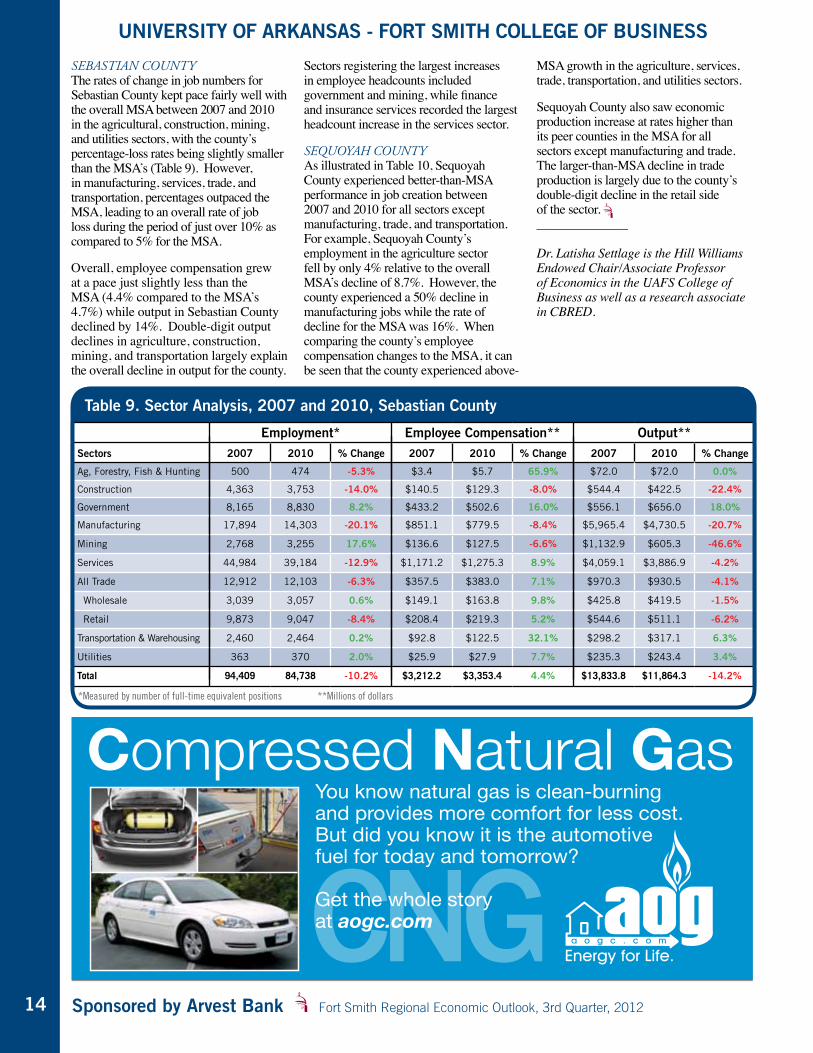
sebastian county The rates of change in job numbers for Sebastian County kept pace fairly well with the overall MSA between 2007 and 2010 in the agricultural, construction, mining, and utilities sectors, with the county’s percentage-loss rates being slightly smaller than the MSA’s (Table 9). However, in manufacturing, services, trade, and transportation, percentages outpaced the MSA, leading to an overall rate of job loss during the period of just over 10% as compared to 5% for the MSA.
Overall, employee compensation grew at a pace just slightly less than the MSA (4.4% compared to the MSA’s 4.7%) while output in Sebastian County declined by 14%. Double-digit output declines in agriculture, construction, mining, and transportation largely explain the overall decline in output for the county.
Sectors registering the largest increases in employee headcounts included government and mining, while finance and insurance services recorded the largest headcount increase in the services sector.
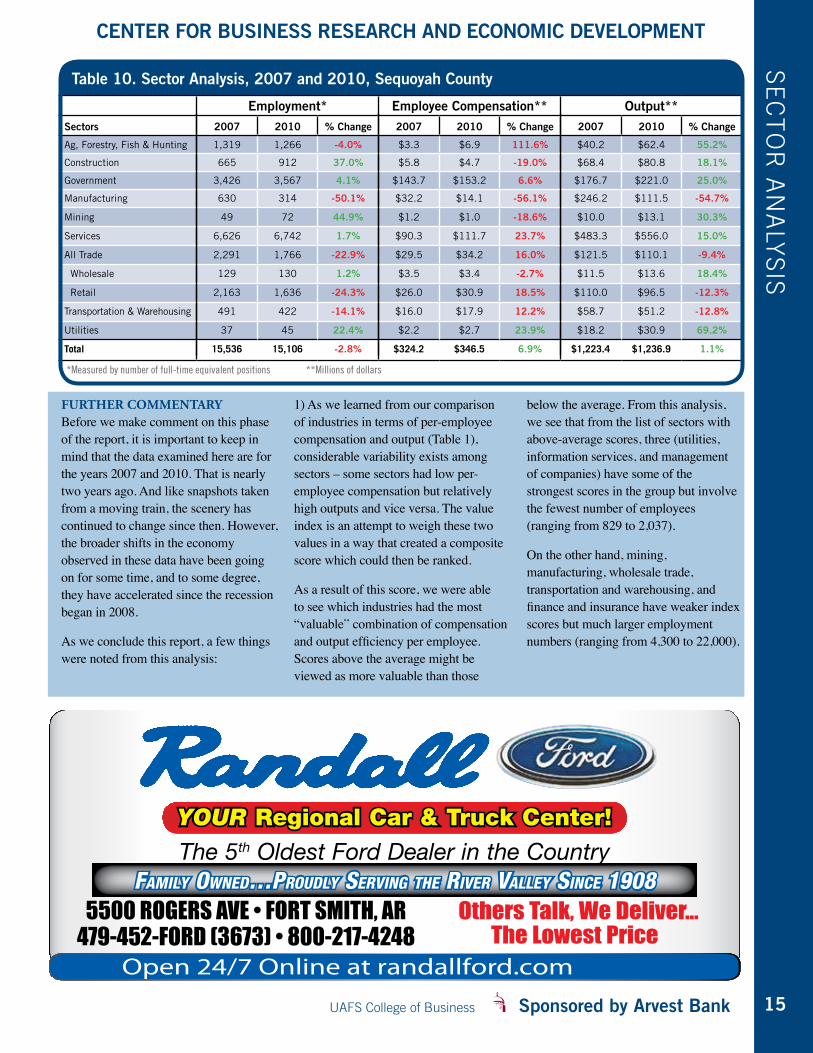
sequoyaH county As illustrated in Table 10, Sequoyah County experienced better-than-MSA performance in job creation between 2007 and 2010 for all sectors except manufacturing, trade, and transportation. For example, Sequoyah County’s employment in the agriculture sector fell by only 4% relative to the overall MSA’s decline of 8.7%. However, the county experienced a 50% decline in manufacturing jobs while the rate of decline for the MSA was 16%. When comparing the county’s employee compensation changes to the MSA, it can be seen that the county experienced above-
MSA growth in the agriculture, services, trade, transportation, and utilities sectors.
Sequoyah County also saw economic production increase at rates higher than its peer counties in the MSA for all sectors except manufacturing and trade. The larger-than-MSA decline in trade production is largely due to the county’s double-digit decline in the retail side of the sector. ______________ Dr. Latisha Settlage is the Hill Williams Endowed Chair/Associate Professor of Economics in the UAFS College of Business as well as a research associate in CBRED.
*Measured by number of full-time equivalent positions **Millions of dollars
Table 9. Sector Analysis, 2007 and 2010, Sebastian County
Employment* Employee Compensation** Output**Sectors 2007 2010 % Change 2007 2010 % Change 2007 2010 % Change
Ag, Forestry, Fish & Hunting 500 474 -5.3% $3.4 $5.7 65.9% $72.0 $72.0 0.0%
Construction 4,363 3,753 -14.0% $140.5 $129.3 -8.0% $544.4 $422.5 -22.4%
Government 8,165 8,830 8.2% $433.2 $502.6 16.0% $556.1 $656.0 18.0%
Manufacturing 17,894 14,303 -20.1% $851.1 $779.5 -8.4% $5,965.4 $4,730.5 -20.7%
Mining 2,768 3,255 17.6% $136.6 $127.5 -6.6% $1,132.9 $605.3 -46.6%
Services 44,984 39,184 -12.9% $1,171.2 $1,275.3 8.9% $4,059.1 $3,886.9 -4.2%
All Trade 12,912 12,103 -6.3% $357.5 $383.0 7.1% $970.3 $930.5 -4.1%
Wholesale 3,039 3,057 0.6% $149.1 $163.8 9.8% $425.8 $419.5 -1.5%
Retail 9,873 9,047 -8.4% $208.4 $219.3 5.2% $544.6 $511.1 -6.2%
Transportation & Warehousing 2,460 2,464 0.2% $92.8 $122.5 32.1% $298.2 $317.1 6.3%
Utilities 363 370 2.0% $25.9 $27.9 7.7% $235.3 $243.4 3.4%
Total 94,409 84,738 -10.2% $3,212.2 $3,353.4 4.4% $13,833.8 $11,864.3 -14.2%
UAFS College of Business Sponsored by Arvest Bank
CENTER FOR BUSINESS RESEARCH AND ECONOMIC DEVELOPMENT
15
Table 10. Sector Analysis, 2007 and 2010, Sequoyah County
Employment* Employee Compensation** Output**Sectors 2007 2010 % Change 2007 2010 % Change 2007 2010 % Change
Ag, Forestry, Fish & Hunting 1,319 1,266 -4.0% $3.3 $6.9 111.6% $40.2 $62.4 55.2%
Construction 665 912 37.0% $5.8 $4.7 -19.0% $68.4 $80.8 18.1%
Government 3,426 3,567 4.1% $143.7 $153.2 6.6% $176.7 $221.0 25.0%
Manufacturing 630 314 -50.1% $32.2 $14.1 -56.1% $246.2 $111.5 -54.7%
Mining 49 72 44.9% $1.2 $1.0 -18.6% $10.0 $13.1 30.3%
Services 6,626 6,742 1.7% $90.3 $111.7 23.7% $483.3 $556.0 15.0%
All Trade 2,291 1,766 -22.9% $29.5 $34.2 16.0% $121.5 $110.1 -9.4%
Wholesale 129 130 1.2% $3.5 $3.4 -2.7% $11.5 $13.6 18.4%
Retail 2,163 1,636 -24.3% $26.0 $30.9 18.5% $110.0 $96.5 -12.3%
Transportation & Warehousing 491 422 -14.1% $16.0 $17.9 12.2% $58.7 $51.2 -12.8%
Utilities 37 45 22.4% $2.2 $2.7 23.9% $18.2 $30.9 69.2%
Total 15,536 15,106 -2.8% $324.2 $346.5 6.9% $1,223.4 $1,236.9 1.1%
*Measured by number of full-time equivalent positions **Millions of dollars
further commentary Before we make comment on this phase of the report, it is important to keep in mind that the data examined here are for the years 2007 and 2010. That is nearly two years ago. And like snapshots taken from a moving train, the scenery has continued to change since then. However, the broader shifts in the economy observed in these data have been going on for some time, and to some degree, they have accelerated since the recession began in 2008.
As we conclude this report, a few things were noted from this analysis:
1) As we learned from our comparison of industries in terms of per-employee compensation and output (Table 1), considerable variability exists among sectors – some sectors had low per-employee compensation but relatively high outputs and vice versa. The value index is an attempt to weigh these two values in a way that created a composite score which could then be ranked.
As a result of this score, we were able to see which industries had the most “valuable” combination of compensation and output efficiency per employee. Scores above the average might be viewed as more valuable than those
below the average. From this analysis, we see that from the list of sectors with above-average scores, three (utilities, information services, and management of companies) have some of the strongest scores in the group but involve the fewest number of employees (ranging from 829 to 2,037).
On the other hand, mining, manufacturing, wholesale trade, transportation and warehousing, and finance and insurance have weaker index scores but much larger employment numbers (ranging from 4,300 to 22,000).
SE
Ct
OR
An
Aly
SiS
YOUR Regional Car & Truck Center!The 5th Oldest Ford Dealer in the Country
5500 ROGERS AVE • FORT SMITH, AR 479-452-FORD (3673) • 800-217-4248
Open 24/7 Online at randallford.com
Others Talk, We Deliver…The Lowest Price
FAMILY OWNED…PROUDLY SERVING THE RIVER VALLEY SINCE 1908
Sponsored by Arvest Bank Fort Smith Regional Economic Outlook, 3rd Quarter, 2012
UNIVERSITY OF ARKANSAS - FORT SMITH COLLEGE OF BUSINESS
16
In sum, a community must determine what defines a valuable job (or sector) and make investment decisions accordingly. If creating jobs is the goal, then generating small percentage improvements on larger sectors will have larger effects in terms of numbers of jobs than will small though attractive sectors. The sectors with this potential would have higher value to the economy. If efficiency, as measured by output per employee, is important, then GDP is relevant. Growth rate of sectors is another potential measure of value. Clearly any combination of these could be developed.
2) Health care saw considerable growth during the 2007-2010 period. We saw from Table 2 that the sector experienced this growth even with a recession thrown in the middle. The sector provides an interesting mix of employment opportunities in terms of skill requirements, education, and compensation. It is a growth industry in general, but prospects for long-term growth are largely dependent upon a growing community, and that is dependent upon a growing economy.
While the sector did not rate high in the value index, this is an example of the limitations of the current formulation of the index. Because the health care sector includes “social” subsector workers, which have generally lower compensation, for example, the whole sector is pulled down on per-employee compensation.
3) Government sector growth was positive during the period. Since government jobs are a reflection of income transfers from the private sector to the public sector, the source of these transfers are important to the local economy. What we found is that most growth came from local and state jobs, thus these are more likely based on local tax transfers. If federal jobs had been the source of growth in the government sector, then this would largely have been made up of “outside” (new) money flowing into the MSA. That wasn’t the case, however. In essence then, we robbed our local Peter to pay a local Paul.
4) The construction sector was not impacted equally by the recession. Residential construction bore the brunt of the recession effects, according to these data. This was expected, since bad
mortgage loans to consumers started the ball rolling in the first place. The relative impact of the recession on commercial and residential construction, however, was quite large.
5) As was the case in the construction sector, the mining sector revealed considerable variation in terms of subsector economic realities pre- and post-recession. The oil and gas subsector experienced solid growth in jobs during the period, unlike quarry and coal mining. The energy sector lives up to its boom-and-bust reputation, however, as the value of the outputs dropped significantly during the period. This subsector offers growth potential going forward, based on broader national trends in energy development.
6) As would be expected, counties varied considerably in terms of changes overall during the period and where and by how much the changes were felt. While these variations are expected, the differences are notable. For example, Crawford and Franklin Counties saw a net increase in employment during the period, while the remaining counties experienced declines. Overall, it appears that Le Flore and Sebastian Counties were most affected by the events between 2007 and 2010. _____________________
The goal of these types of analyses is to unearth the relative strengths and weaknesses of an economy. Ultimately, the objective is to identify pathways to a better future for a community – our community. This report is the first of a series of reports which will seek to refine preliminary findings in order to recommend sectors and subsectors which would seem to have the greatest potential for our community.
The full report will be available in digital format on the CBRED website under publications at uafs.edu/cob/publications.
Note: The analyses in this report were done using the IMPLAN software. This well-recognized economic analysis software is proprietary and uses a dataset created and managed by the vendor. The resultant output is an estimate and will not always compare easily with datasets from the Bureau of Labor Statistics or the Bureau of Economic Analysis, though they are incorporated into the IMPLAN dataset.
UAFS College of Business Sponsored by Arvest Bank
CENTER FOR BUSINESS RESEARCH AND ECONOMIC DEVELOPMENT
1717
SP
On
SO
RS
www.bhca.com1626 Empire Street - Lowell
(479) 878-18965500 Euper Lane - Fort Smith
(479) 452-4000
THE PERFECT BANK FOR YOUR CHANGING WORLD
arvest.com
Member FDIC
How prepared is your business?Tax audits • Employee fraud • Compliance audits
Retirement decisions • Unexpected growthWe’ve got the knowledge and experience to keep you prepared
no matter what the situation. Call today. 479.484.5740.
Beall Barclay and Company, PLCBeall Barclay Wealth Management, LLC
Securities offered by 1st Global Capital Corp. Member FINRA. SIPC Investment Advisory services offered through 1st Global Advisors, Inc.
BeallBarclay.com
Every year since 2005,UA Fort Smith business graduates have placed in thetop 25% or better in national testing. How do they do it? Their instructors are career business professionals, experts in their field.
HELLOmy name is
Be an expert. Be a graduate of the College of Business.
We would like to thank our sponsors for their
generous support.
horizontalad.indd 1 8/5/2010 4:28:52 PM
YOUR Regional Car & Truck Center!The 5th Oldest Ford Dealer in the Country
5500 ROGERS AVE • FORT SMITH, AR 479-452-FORD (3673) • 800-217-4248
Open 24/7 Online at randallford.com
Others Talk, We Deliver…The Lowest Price
FAMILY OWNED…PROUDLY SERVING THE RIVER VALLEY SINCE 1908

Member FDIC
Whether your business is construction, retail, manufacturing or pretty much anything else, Arvest is an
important part of your financial stability. Every day, we help businesses manage their money, improve their
cash flow and realize their growth potential. With over 200 locations in Oklahoma, Arkansas, Missouri
and Kansas, and convenient 7 to 7 hours, there are plenty of reasons that Arvest should be the foundation
for your success. See one of our experienced bankers today or visit arvest.com.
Arvest Bank. The perfect bank for your changing world.
THE FOUNDATION FORA SUCCESSFUL BUSINESS