Embed Size (px)
Citation preview
SECOND QUARTER 2021
RESULTS AND OUTLOOK
29 JULY 2021
STRONG PERFORMANCE AND
ACCELERATION OF SUSTAINABLE INNOVATION
3
Q2'19 Q2'20 Q2'21 31/12/20 30/06/21
EBITDA REBIT ADJ. NET INCOME
In €m In €m In €m
NET DEBT (incl. hybrid bonds)
20.0%MARGIN
286
478
€3.50ADJ. EPS
1,910
1,281
0.9xLTM EBITDA
In €m
Q2 2021 RESULTS AND OUTLOOK / 29 JULY 2021
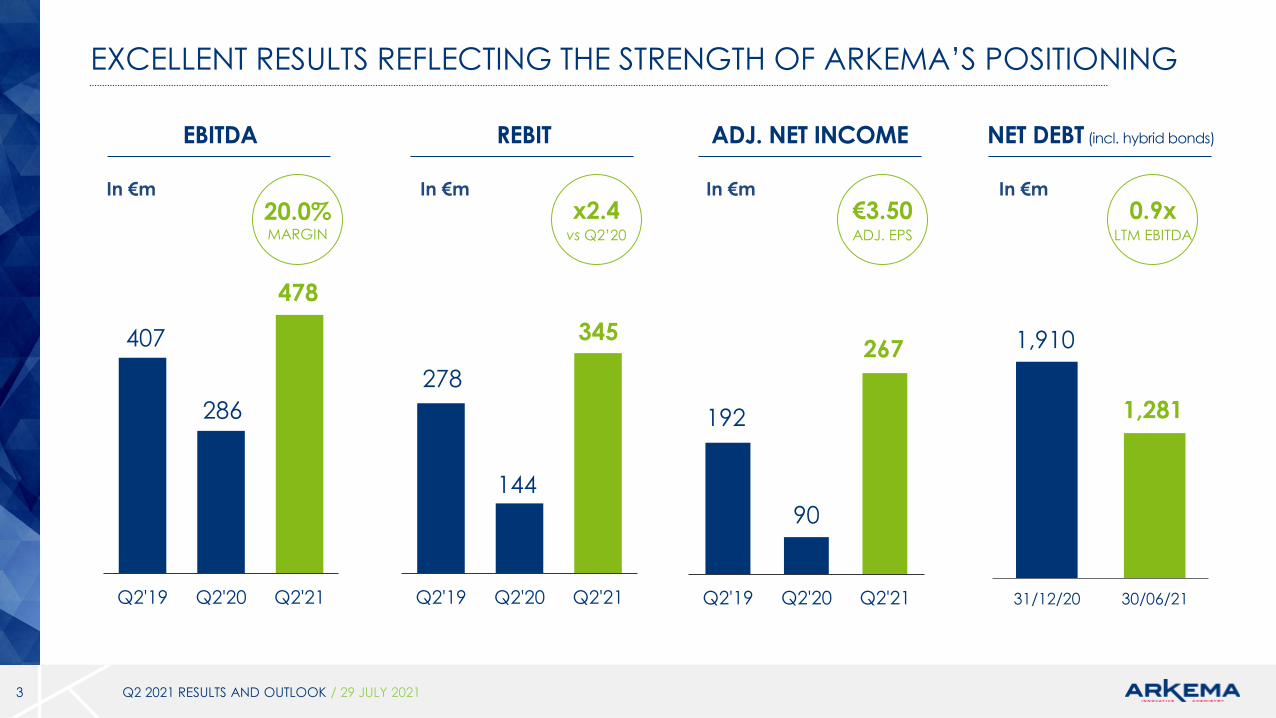
EXCELLENT RESULTS REFLECTING THE STRENGTH OF ARKEMA’S POSITIONING
407
Q2'19 Q2'20 Q2'21
144
345
278
Q2'19 Q2'20 Q2'21
90
267
192
x2.4vs Q2’20
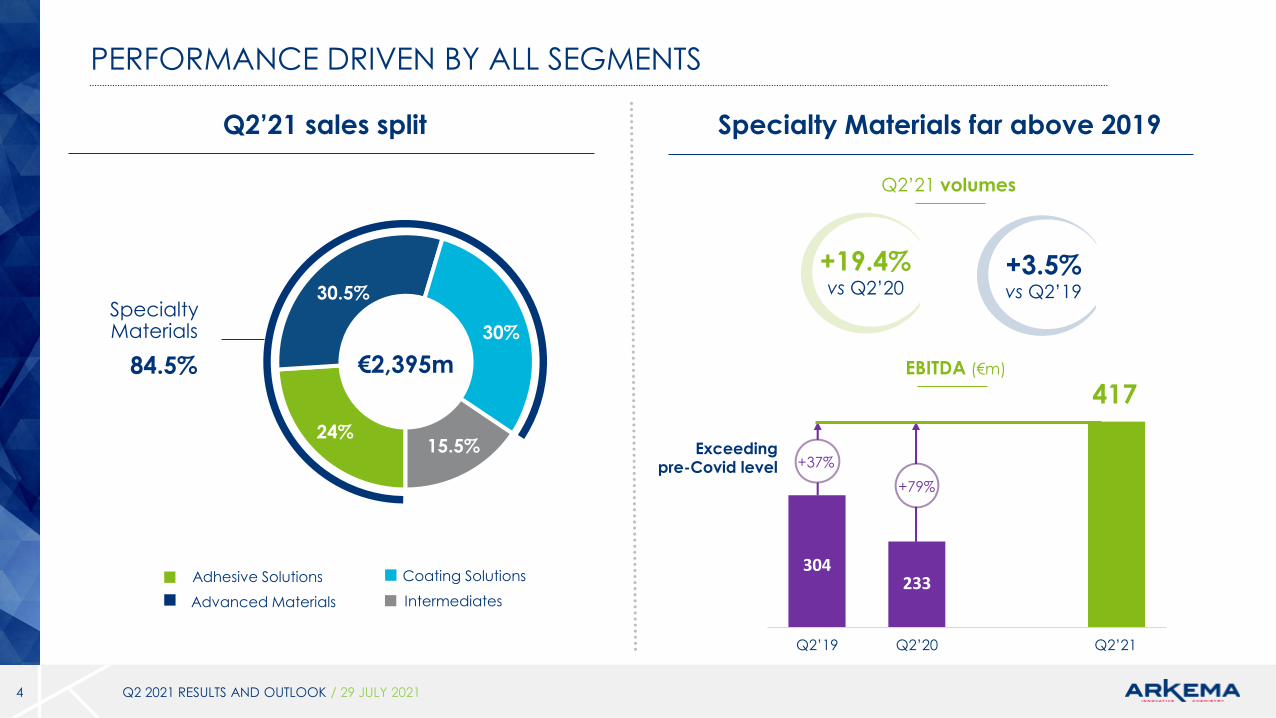
PERFORMANCE DRIVEN BY ALL SEGMENTS
4 Q2 2021 RESULTS AND OUTLOOK / 29 JULY 2021
Specialty Materials far above 2019
24%
30.5%
30%
15.5%
84.5%
SpecialtyMaterials
€2,395m
Adhesive Solutions
Advanced Materials
Coating Solutions
Intermediates
Q2’21 sales split
EBITDA (€m)
304233
417
Q2’19 Q2’20 Q2’21
Exceedingpre-Covid level
+79%
+37%
+19.4%vs Q2’20
+3.5%vs Q2’19
Q2’21 volumes
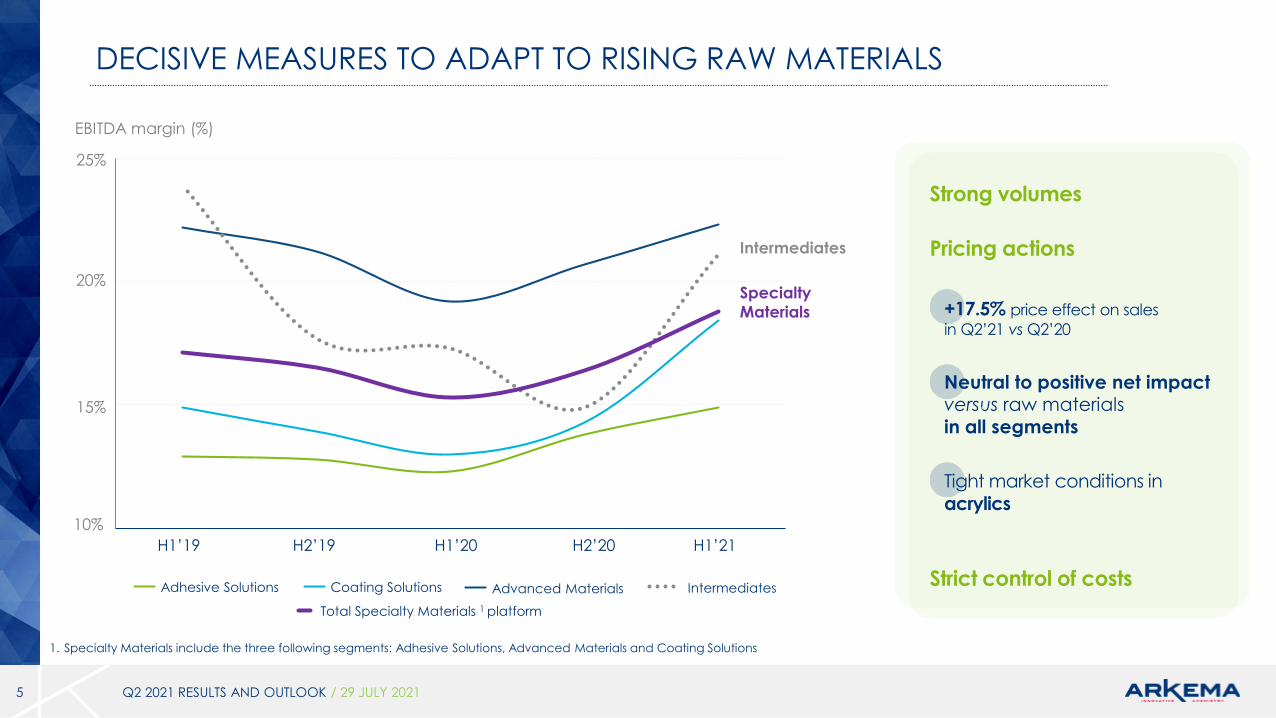
DECISIVE MEASURES TO ADAPT TO RISING RAW MATERIALS
5 Q2 2021 RESULTS AND OUTLOOK / 29 JULY 2021
10%
20%
15%
H1’19 H2’19 H1’20 H2’20 H1’21
Coating SolutionsAdhesive Solutions Advanced Materials Intermediates
Total Specialty Materials 1 platform
Intermediates
Specialty
Materials
1. Specialty Materials include the three following segments: Adhesive Solutions, Advanced Materials and Coating Solutions
25%
+17.5% price effect on sales
in Q2’21 vs Q2’20
Neutral to positive net impact versus raw materialsin all segments
Tight market conditions in
acrylics
Pricing actions
Strict control of costs
Strong volumes
EBITDA margin (%)
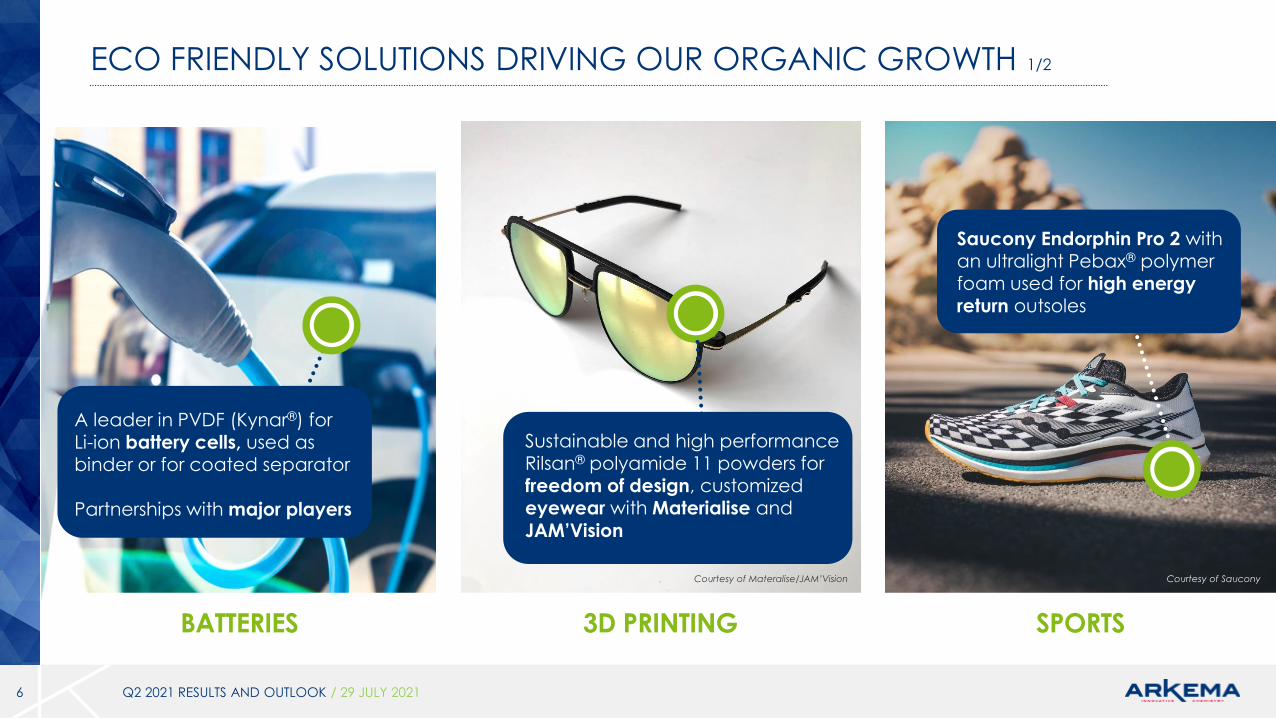
ECO FRIENDLY SOLUTIONS DRIVING OUR ORGANIC GROWTH 1/2
6
BATTERIES SPORTS
Sustainable and high performance Rilsan® polyamide 11 powders for freedom of design, customized eyewear with Materialise and
JAM’Vision
A leader in PVDF (Kynar®) for
Li-ion battery cells, used as binder or for coated separator
Partnerships with major players
Saucony Endorphin Pro 2 with an ultralight Pebax® polymer foam used for high energy return outsoles
3D PRINTING
Courtesy of Materalise/JAM’Vision Courtesy of Saucony
Q2 2021 RESULTS AND OUTLOOK / 29 JULY 2021
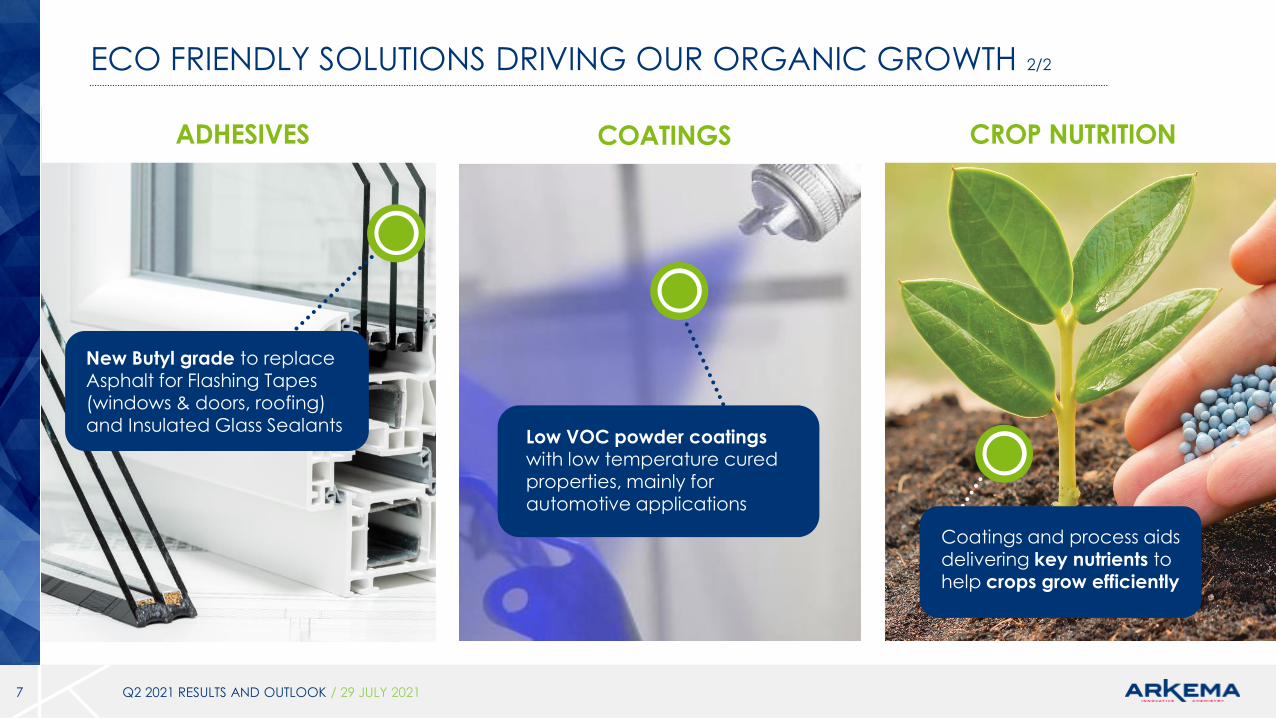
ECO FRIENDLY SOLUTIONS DRIVING OUR ORGANIC GROWTH 2/2
7
New Butyl grade to replace Asphalt for Flashing Tapes (windows & doors, roofing)
and Insulated Glass Sealants
ADHESIVES COATINGS CROP NUTRITION
Low VOC powder coatingswith low temperature cured properties, mainly for automotive applications
Coatings and process aids delivering key nutrients to help crops grow efficiently
Q2 2021 RESULTS AND OUTLOOK / 29 JULY 2021
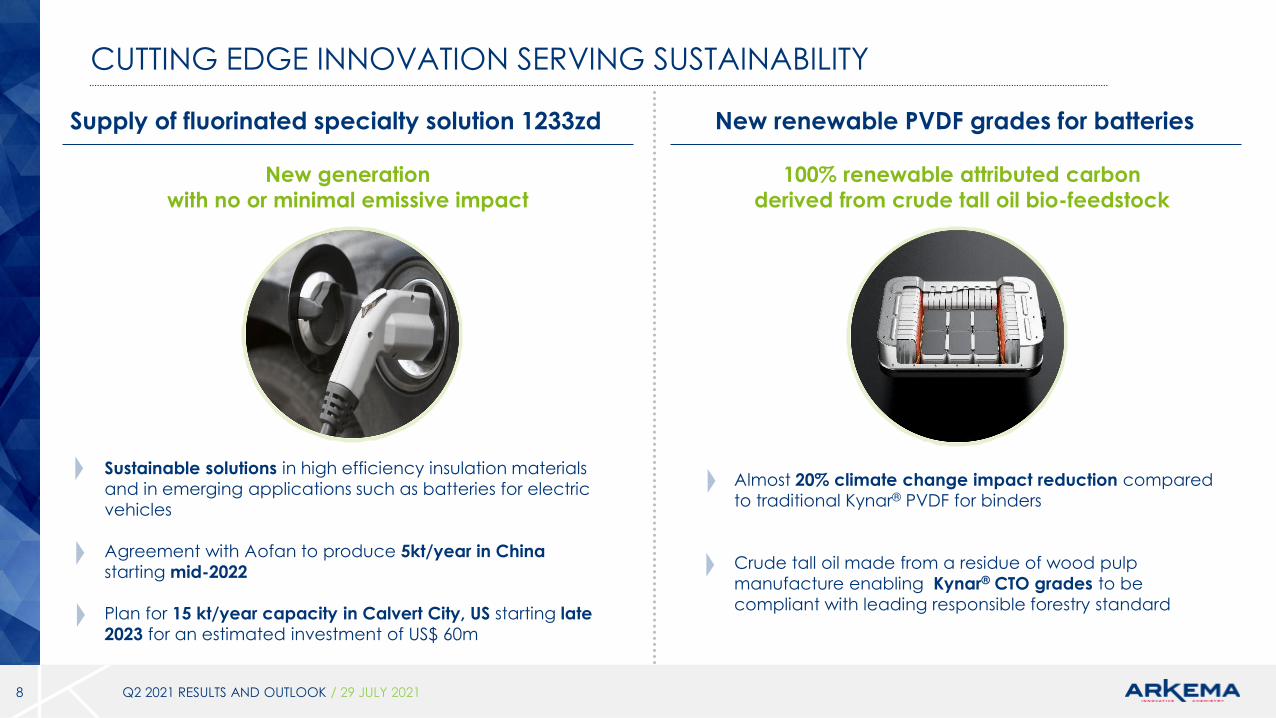
CUTTING EDGE INNOVATION SERVING SUSTAINABILITY
8 Q2 2021 RESULTS AND OUTLOOK / 29 JULY 2021
Supply of fluorinated specialty solution 1233zd New renewable PVDF grades for batteries
Sustainable solutions in high efficiency insulation materials
and in emerging applications such as batteries for electric
vehicles
Agreement with Aofan to produce 5kt/year in China
starting mid-2022
Plan for 15 kt/year capacity in Calvert City, US starting late
2023 for an estimated investment of US$ 60m
New generation
with no or minimal emissive impact
100% renewable attributed carbon
derived from crude tall oil bio-feedstock
Almost 20% climate change impact reduction compared
to traditional Kynar® PVDF for binders
Crude tall oil made from a residue of wood pulp
manufacture enabling Kynar® CTO grades to be
compliant with leading responsible forestry standard
9 Q2 2021 RESULTS AND OUTLOOK / 29 JULY 2021
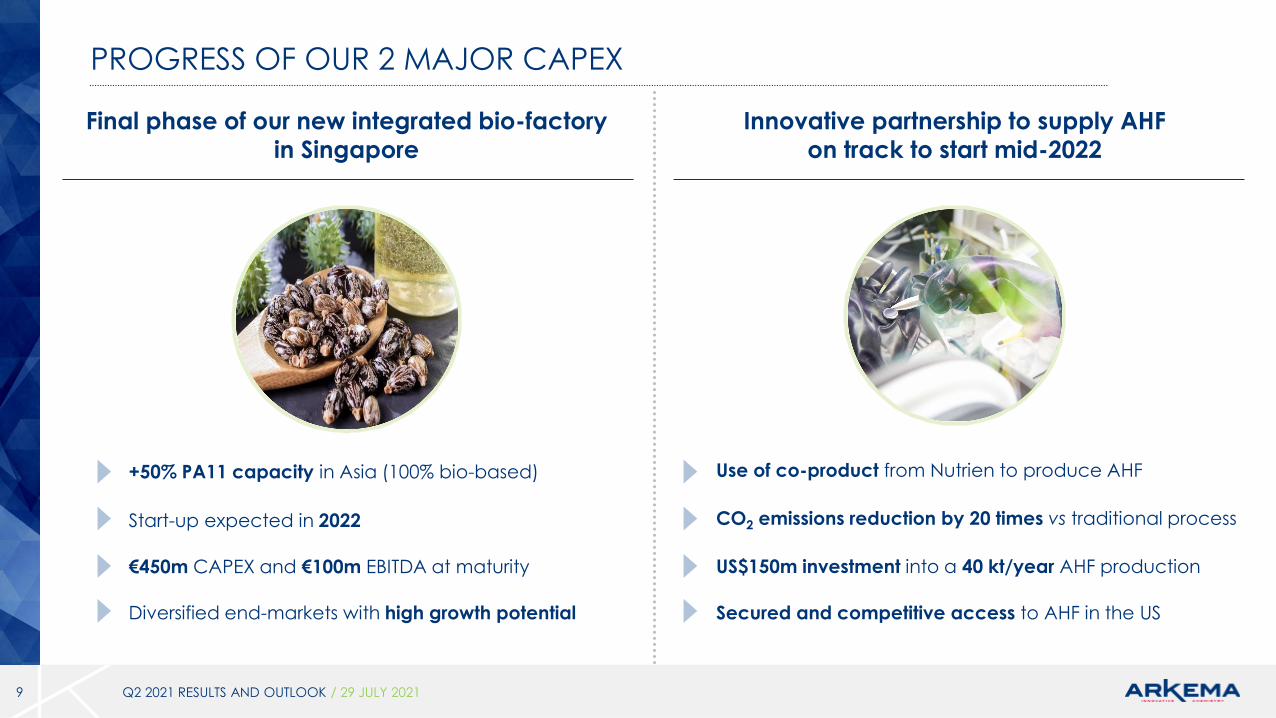
Use of co-product from Nutrien to produce AHF
Final phase of our new integrated bio-factory
in Singapore
+50% PA11 capacity in Asia (100% bio-based)
Start-up expected in 2022
€450m CAPEX and €100m EBITDA at maturity
Innovative partnership to supply AHF
on track to start mid-2022
Secured and competitive access to AHF in the US
US$150m investment into a 40 kt/year AHF production
CO2 emissions reduction by 20 times vs traditional process
Diversified end-markets with high growth potential
PROGRESS OF OUR 2 MAJOR CAPEX
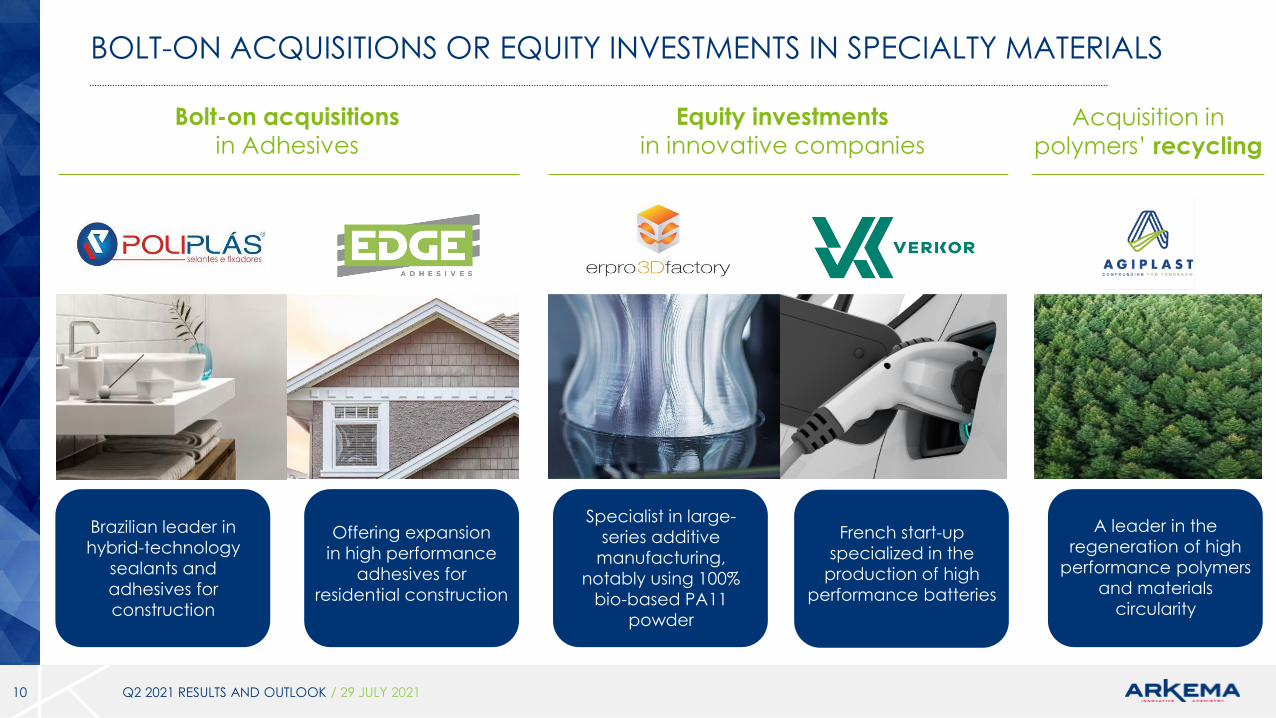
BOLT-ON ACQUISITIONS OR EQUITY INVESTMENTS IN SPECIALTY MATERIALS
10 Q2 2021 RESULTS AND OUTLOOK / 29 JULY 2021
Brazilian leader in
hybrid-technology
sealants and
adhesives for
construction
Offering expansion
in high performance
adhesives for
residential construction
Specialist in large-
series additive
manufacturing,
notably using 100%
bio-based PA11
powder
A leader in the
regeneration of high
performance polymers
and materials
circularity
French start-up
specialized in the
production of high
performance batteries
Bolt-on acquisitions
in Adhesives
Equity investments
in innovative companiesAcquisition in
polymers’ recycling

Q2 RESULTS AND OUTLOOK
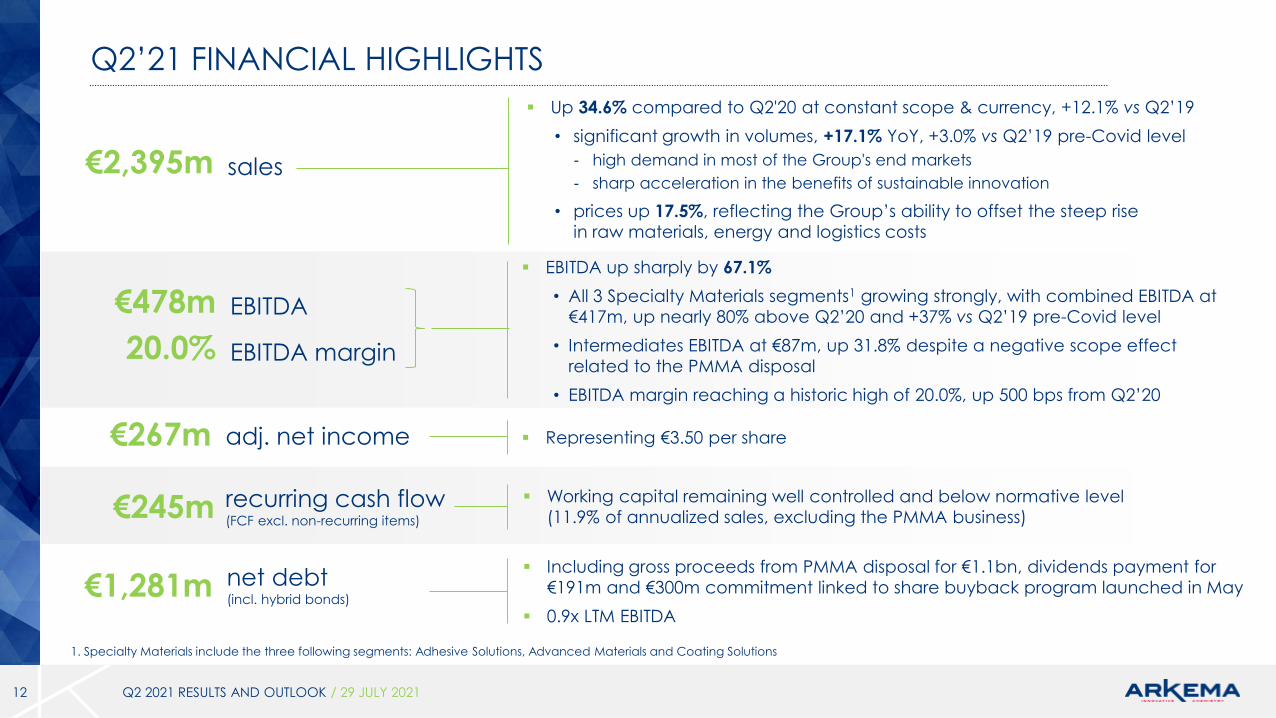
Q2’21 FINANCIAL HIGHLIGHTS
Q2 2021 RESULTS AND OUTLOOK / 29 JULY 202112
€478m EBITDA
20.0% EBITDA margin
€267m adj. net income
€1,281m net debt(incl. hybrid bonds)
Up 34.6% compared to Q2'20 at constant scope & currency, +12.1% vs Q2’19
• significant growth in volumes, +17.1% YoY, +3.0% vs Q2’19 pre-Covid level
- high demand in most of the Group's end markets
- sharp acceleration in the benefits of sustainable innovation
• prices up 17.5%, reflecting the Group’s ability to offset the steep rise
in raw materials, energy and logistics costs
EBITDA up sharply by 67.1%
• All 3 Specialty Materials segments1 growing strongly, with combined EBITDA at
€417m, up nearly 80% above Q2’20 and +37% vs Q2’19 pre-Covid level
• Intermediates EBITDA at €87m, up 31.8% despite a negative scope effect
related to the PMMA disposal
• EBITDA margin reaching a historic high of 20.0%, up 500 bps from Q2’20
Representing €3.50 per share
Including gross proceeds from PMMA disposal for €1.1bn, dividends payment for
€191m and €300m commitment linked to share buyback program launched in May
0.9x LTM EBITDA
€2,395m sales
€245m recurring cash flow(FCF excl. non-recurring items)
Working capital remaining well controlled and below normative level
(11.9% of annualized sales, excluding the PMMA business)
1. Specialty Materials include the three following segments: Adhesive Solutions, Advanced Materials and Coating Solutions
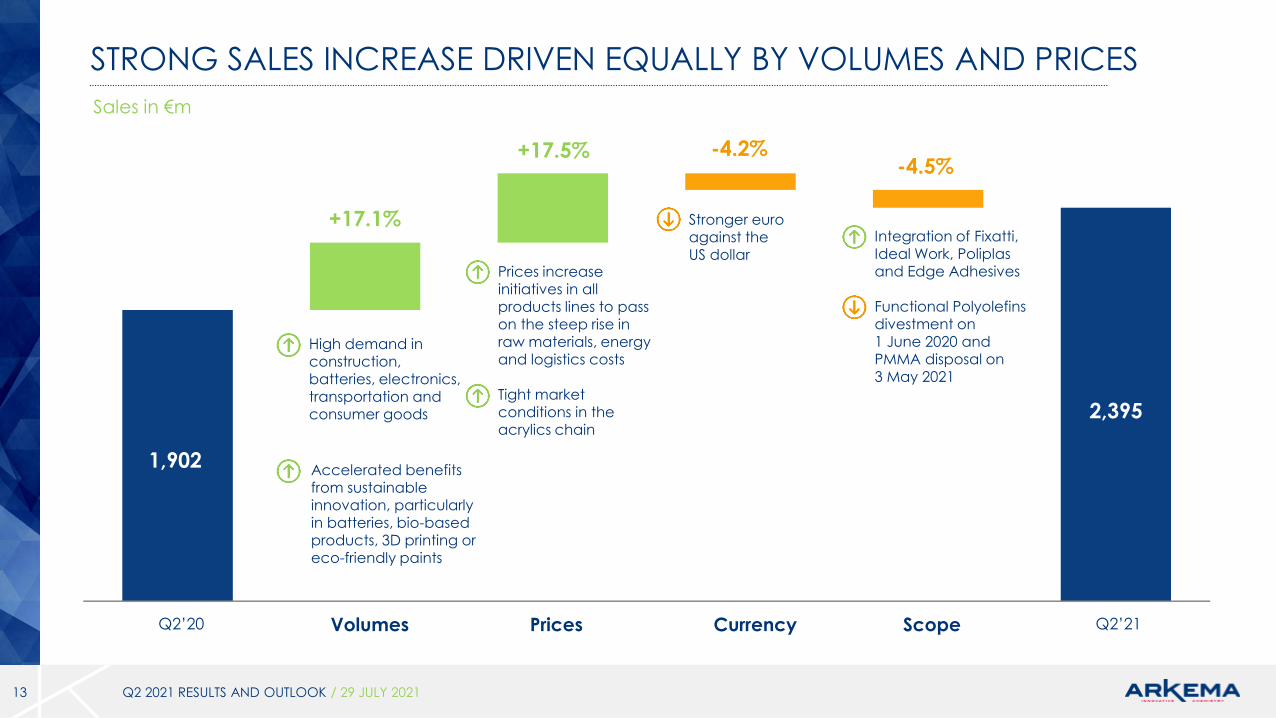
STRONG SALES INCREASE DRIVEN EQUALLY BY VOLUMES AND PRICES
13
Q2’20 Q2’21
-4.2%+17.5%
+17.1%
1,902
2,395
CurrencyVolumes Prices Scope
-4.5%
High demand in construction,
batteries, electronics, transportation and consumer goods
Integration of Fixatti, Ideal Work, Poliplasand Edge Adhesives
Functional Polyolefins divestment on 1 June 2020 and PMMA disposal on 3 May 2021
Sales in €m
Stronger euro against theUS dollar
Prices increase initiatives in all products lines to pass on the steep rise in raw materials, energy and logistics costs
Tight market conditions in the acrylics chain
Q2 2021 RESULTS AND OUTLOOK / 29 JULY 2021
Accelerated benefits from sustainable innovation, particularly in batteries, bio-based products, 3D printing or eco-friendly paints
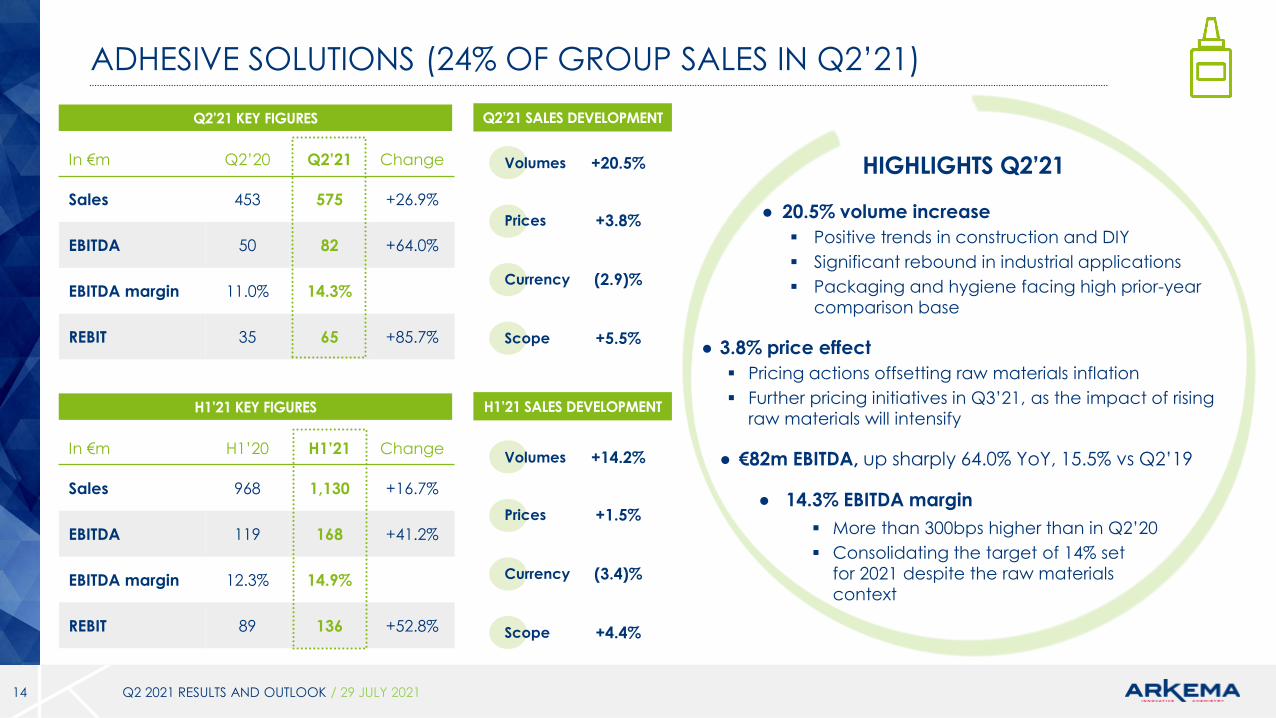
ADHESIVE SOLUTIONS (24% OF GROUP SALES IN Q2’21)
14
HIGHLIGHTS Q2’21
● 20.5% volume increase
Positive trends in construction and DIY
Significant rebound in industrial applications
Packaging and hygiene facing high prior-year
comparison base
● 3.8% price effect
Pricing actions offsetting raw materials inflation
Further pricing initiatives in Q3’21, as the impact of rising
raw materials will intensify
● €82m EBITDA, up sharply 64.0% YoY, 15.5% vs Q2’19
● 14.3% EBITDA margin
More than 300bps higher than in Q2’20
Consolidating the target of 14% set
for 2021 despite the raw materials
context
Q2 2021 RESULTS AND OUTLOOK / 29 JULY 2021
In €m Q2’20 Q2’21 Change
Sales 453 575 +26.9%
EBITDA 50 82 +64.0%
EBITDA margin 11.0% 14.3%
REBIT 35 65 +85.7%
Q2’21 KEY FIGURES
In €m H1’20 H1’21 Change
Sales 968 1,130 +16.7%
EBITDA 119 168 +41.2%
EBITDA margin 12.3% 14.9%
REBIT 89 136 +52.8%
H1’21 KEY FIGURES
Q2’21 SALES DEVELOPMENT
H1’21 SALES DEVELOPMENT
+20.5%Volumes
Prices
Currency
Scope
+3.8%
(2.9)%
+5.5%
+14.2%Volumes
Prices
Currency
Scope
+1.5%
(3.4)%
+4.4%
15
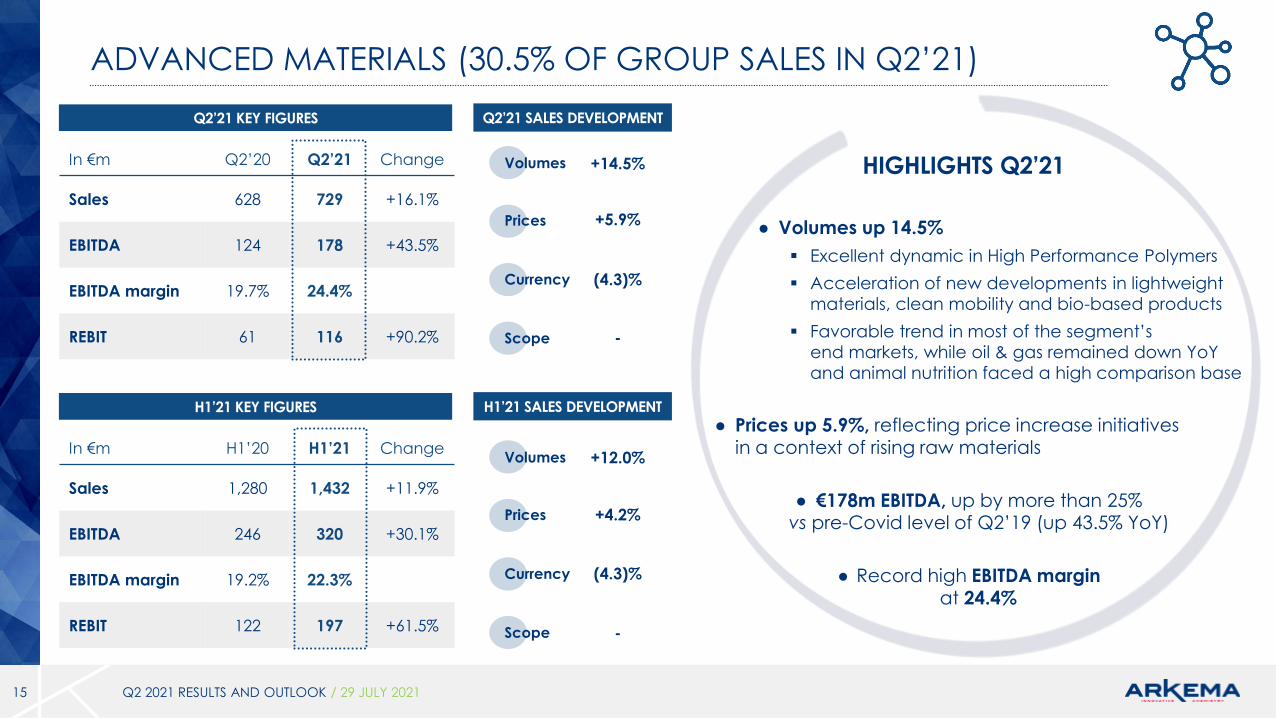
ADVANCED MATERIALS (30.5% OF GROUP SALES IN Q2’21)
● Volumes up 14.5%
Excellent dynamic in High Performance Polymers
Acceleration of new developments in lightweight
materials, clean mobility and bio-based products
Favorable trend in most of the segment’s
end markets, while oil & gas remained down YoY
and animal nutrition faced a high comparison base
● Prices up 5.9%, reflecting price increase initiativesin a context of rising raw materials
● €178m EBITDA, up by more than 25% vs pre-Covid level of Q2’19 (up 43.5% YoY)
● Record high EBITDA marginat 24.4%
HIGHLIGHTS Q2’21
Q2 2021 RESULTS AND OUTLOOK / 29 JULY 2021
Q2’21 SALES DEVELOPMENT
H1’21 SALES DEVELOPMENT
+14.5%
+5.9%
(4.3)%
-
+12.0%
+4.2%
(4.3)%
-
Volumes
Prices
Currency
Scope
Volumes
Prices
Currency
Scope
In €m Q2’20 Q2’21 Change
Sales 628 729 +16.1%
EBITDA 124 178 +43.5%
EBITDA margin 19.7% 24.4%
REBIT 61 116 +90.2%
Q2’21 KEY FIGURES
In €m H1’20 H1’21 Change
Sales 1,280 1,432 +11.9%
EBITDA 246 320 +30.1%
EBITDA margin 19.2% 22.3%
REBIT 122 197 +61.5%
H1’21 KEY FIGURES
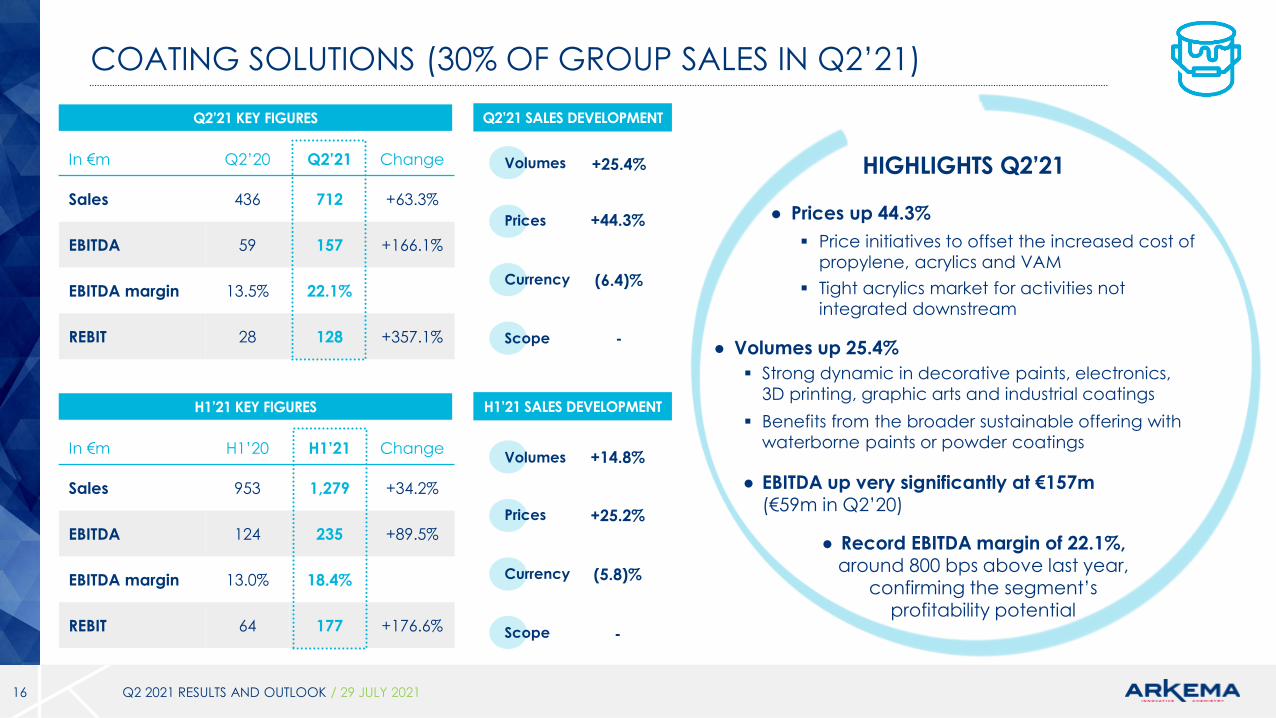
COATING SOLUTIONS (30% OF GROUP SALES IN Q2’21)
16
● Prices up 44.3%
Price initiatives to offset the increased cost of
propylene, acrylics and VAM
Tight acrylics market for activities not
integrated downstream
● Volumes up 25.4%
Strong dynamic in decorative paints, electronics,
3D printing, graphic arts and industrial coatings
Benefits from the broader sustainable offering with
waterborne paints or powder coatings
● EBITDA up very significantly at €157m(€59m in Q2’20)
● Record EBITDA margin of 22.1%,around 800 bps above last year,
confirming the segment’sprofitability potential
HIGHLIGHTS Q2’21
Q2 2021 RESULTS AND OUTLOOK / 29 JULY 2021
Q2’21 SALES DEVELOPMENT
H1’21 SALES DEVELOPMENT
+25.4%
+44.3%
(6.4)%
-
+14.8%
+25.2%
(5.8)%
-
Volumes
Prices
Currency
Scope
Volumes
Prices
Currency
Scope
In €m Q2’20 Q2’21 Change
Sales 436 712 +63.3%
EBITDA 59 157 +166.1%
EBITDA margin 13.5% 22.1%
REBIT 28 128 +357.1%
Q2’21 KEY FIGURES
In €m H1’20 H1’21 Change
Sales 953 1,279 +34.2%
EBITDA 124 235 +89.5%
EBITDA margin 13.0% 18.4%
REBIT 64 177 +176.6%
H1’21 KEY FIGURES
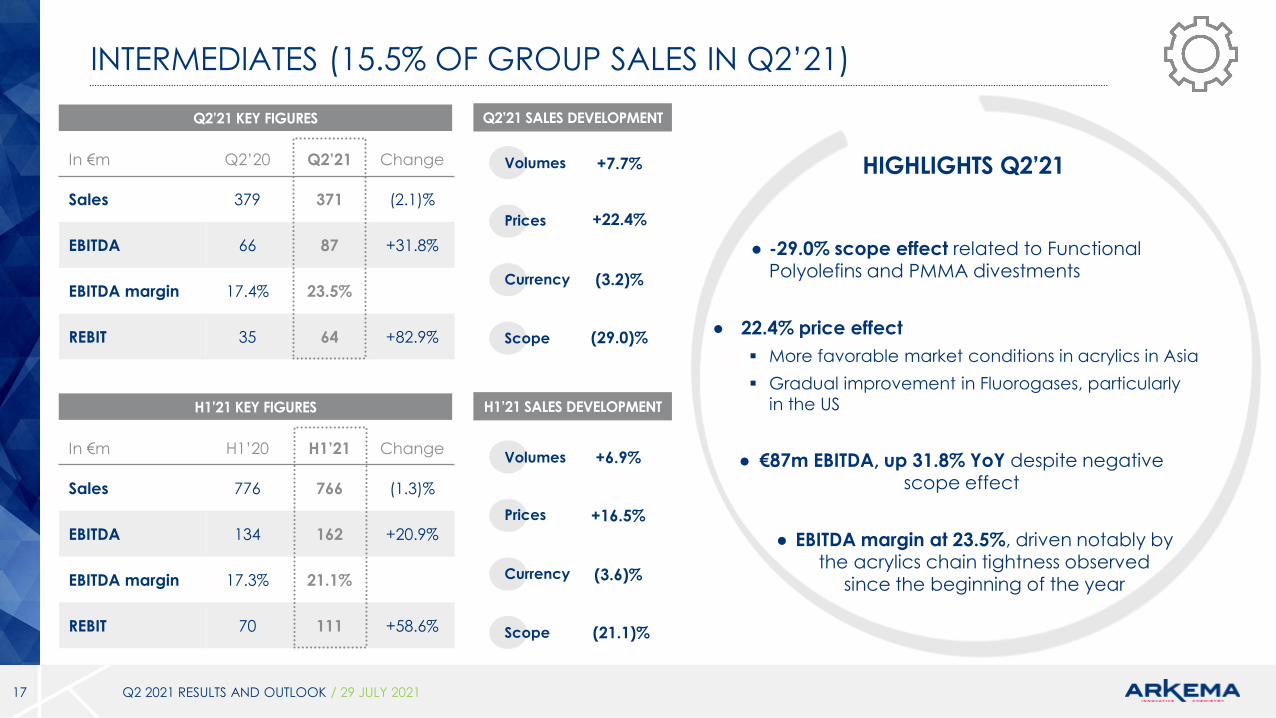
INTERMEDIATES (15.5% OF GROUP SALES IN Q2’21)
17
● -29.0% scope effect related to FunctionalPolyolefins and PMMA divestments
● 22.4% price effect
More favorable market conditions in acrylics in Asia
Gradual improvement in Fluorogases, particularly
in the US
● €87m EBITDA, up 31.8% YoY despite negativescope effect
● EBITDA margin at 23.5%, driven notably by the acrylics chain tightness observed
since the beginning of the year
HIGHLIGHTS Q2’21
Q2 2021 RESULTS AND OUTLOOK / 29 JULY 2021
In €m Q2’20 Q2’21 Change
Sales 379 371 (2.1)%
EBITDA 66 87 +31.8%
EBITDA margin 17.4% 23.5%
REBIT 35 64 +82.9%
Q2’21 KEY FIGURES Q2’21 SALES DEVELOPMENT
In €m H1’20 H1’21 Change
Sales 776 766 (1.3)%
EBITDA 134 162 +20.9%
EBITDA margin 17.3% 21.1%
REBIT 70 111 +58.6%
H1’21 KEY FIGURES H1’21 SALES DEVELOPMENT
+7.7%
+22.4%
(3.2)%
(29.0)%
+6.9%
+16.5%
(3.6)%
(21.1)%
Volumes
Prices
Currency
Scope
Volumes
Prices
Currency
Scope
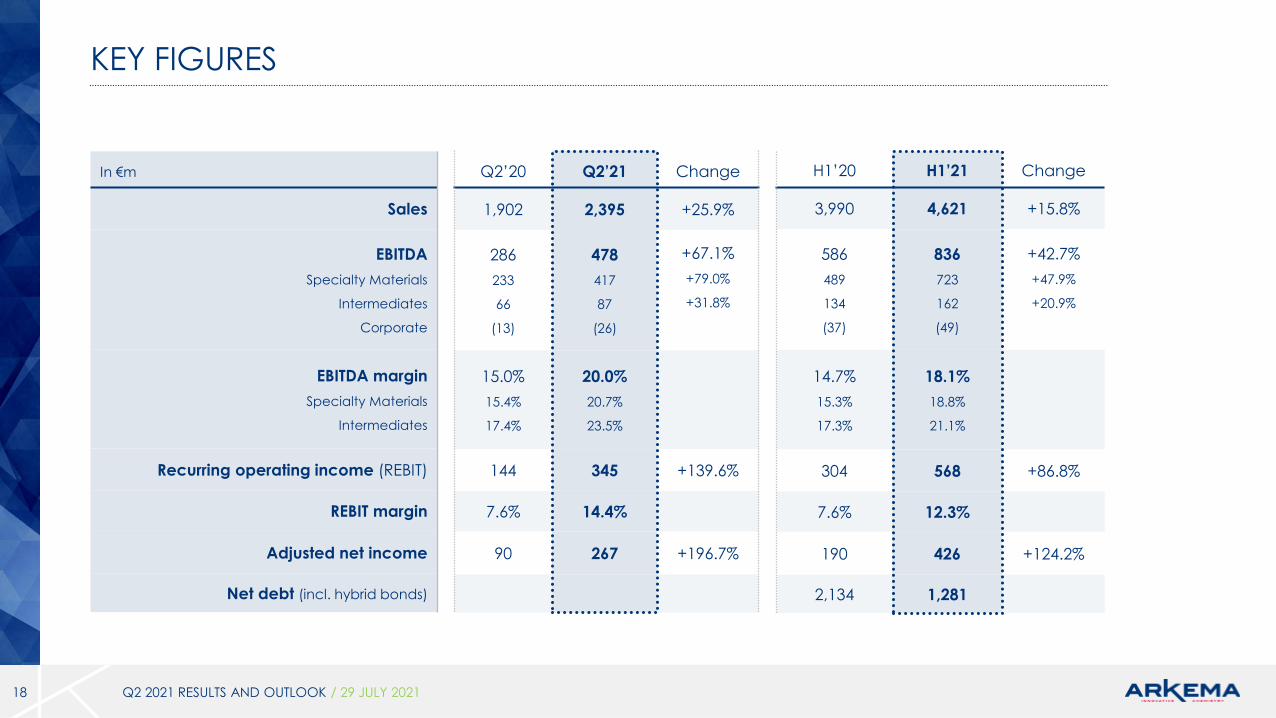
Q2’20 Q2’21 Change
1,902 2,395 +25.9%
286
233
66
(13)
478
417
87
(26)
+67.1%
+79.0%
+31.8%
15.0%
15.4%
17.4%
20.0%
20.7%
23.5%
144 345 +139.6%
7.6% 14.4%
90 267 +196.7%
KEY FIGURES
18 Q2 2021 RESULTS AND OUTLOOK / 29 JULY 2021
H1’20 H1’21 Change
3,990 4,621 +15.8%
586
489
134
(37)
836
723
162
(49)
+42.7%
+47.9%
+20.9%
14.7%
15.3%
17.3%
18.1%
18.8%
21.1%
304 568 +86.8%
7.6% 12.3%
190 426 +124.2%
2,134 1,281
In €m
Sales
EBITDA
Specialty Materials
Intermediates
Corporate
EBITDA margin
Specialty Materials
Intermediates
Recurring operating income (REBIT)
REBIT margin
Adjusted net income
Net debt (incl. hybrid bonds)
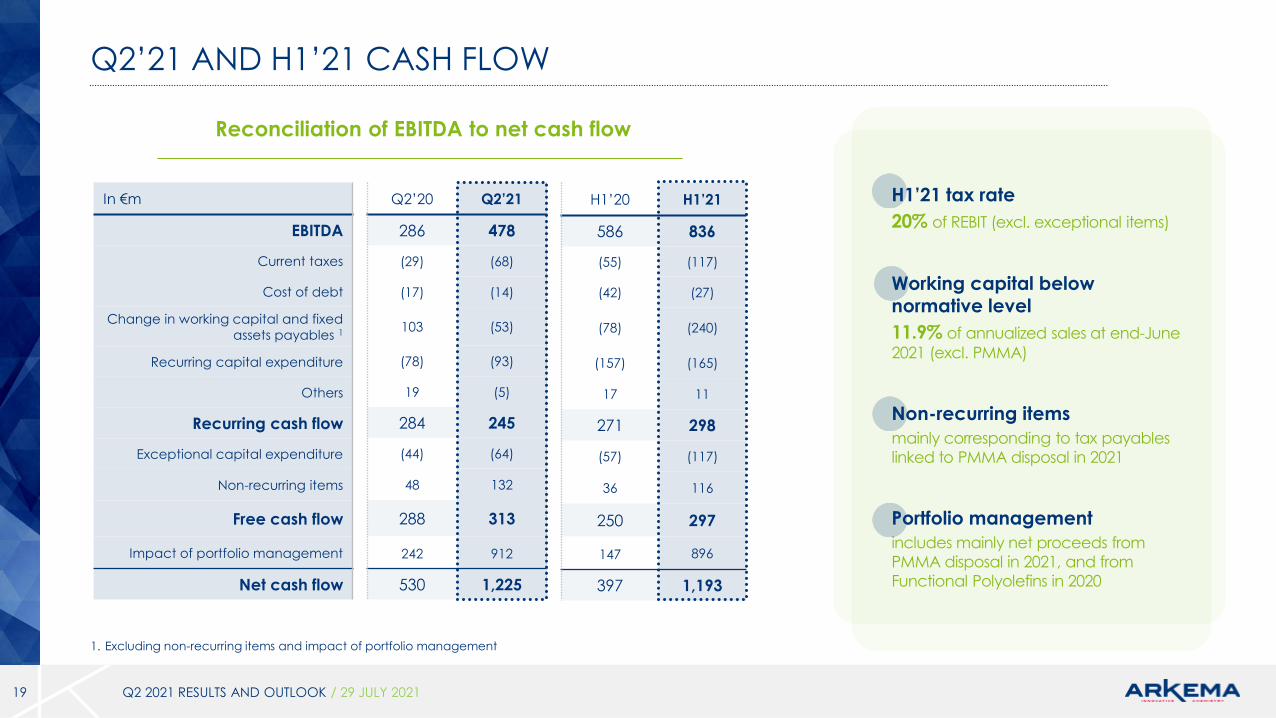
Q2’20 Q2’21
286 478
(29) (68)
(17) (14)
103 (53)
(78) (93)
19 (5)
284 245
(44) (64)
48 132
288 313
242 912
530 1,225
H1’20 H1’21
586 836
(55) (117)
(42) (27)
(78) (240)
(157) (165)
17 11
271 298
(57) (117)
36 116
250 297
147 896
397 1,193
Q2’21 AND H1’21 CASH FLOW
19
H1’21 tax rate
20% of REBIT (excl. exceptional items)
Working capital belownormative level
11.9% of annualized sales at end-June
2021 (excl. PMMA)
Non-recurring items
mainly corresponding to tax payables
linked to PMMA disposal in 2021
Portfolio management
includes mainly net proceeds from
PMMA disposal in 2021, and from
Functional Polyolefins in 2020
In €m
EBITDA
Current taxes
Cost of debt
Change in working capital and fixed
assets payables 1
Recurring capital expenditure
Others
Recurring cash flow
Exceptional capital expenditure
Non-recurring items
Free cash flow
Impact of portfolio management
Net cash flow
1. Excluding non-recurring items and impact of portfolio management
Q2 2021 RESULTS AND OUTLOOK / 29 JULY 2021
Reconciliation of EBITDA to net cash flow
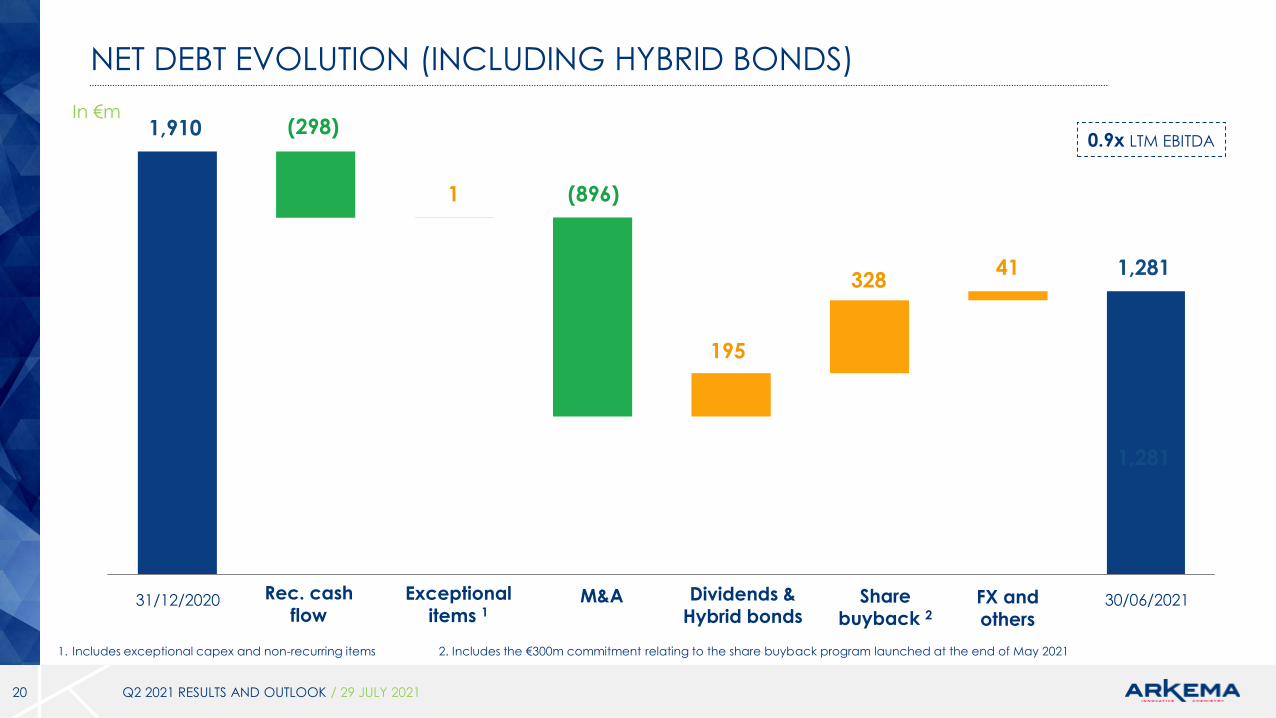
NET DEBT EVOLUTION (INCLUDING HYBRID BONDS)
20
31/12/2020 30/06/2021Rec. cash flow
M&A FX and others
1
(298)0.9x LTM EBITDA
1,910
1,281
Dividends & Hybrid bonds
Sharebuyback 2
41
In €m
Q2 2021 RESULTS AND OUTLOOK / 29 JULY 2021
Exceptional items 1
(896)
1,281
195
328
1. Includes exceptional capex and non-recurring items 2. Includes the €300m commitment relating to the share buyback program launched at the end of May 2021
OUTLOOK
21
The positive dynamic observed in the first half is continuing, benefiting from solid demand in most of the
Group’s end markets.
Arkema will nevertheless remain vigilant and ready to respond rapidly to the current evolution of the
health crisis and the rising raw materials context, and will pursue its price increase initiatives.
Moreover, Arkema will continue to leverage its strong sustainable innovation dynamic and its recent capacity expansions in order to capitalize on accelerating demand for sustainable, high-performance
solutions, driven by global megatrends.
In light of its first-half financial performance, and while remaining attentive to the macroeconomic
context which remains volatile, the Group has significantly raised its full-year guidance once again.
Excluding a systemic resumption of the health crisis, Arkema is now targeting for 2021, around 30% growth
in Specialty Materials’ EBITDA relative to 2020 at constant scope and currency (1), versus the 20%
previously announced. Group EBITDA should therefore reach around €1.4 billion for the full year.
Finally, Arkema will continue to deploy its strategic roadmap, in line with its ambition to become a pure
Specialty Materials player by 2024.
1. With the assumption of a €/$ exchange rate of 1.2 for 2021, the impact on 2020 EBITDA is estimated at a negative €30m for Specialty Materials and a negative €10m for Intermediates
Q2 2021 RESULTS AND OUTLOOK / 29 JULY 2021
DISCLAIMER
22
The information disclosed in this document may contain forward-looking statements with respect to the financial condition, results of operations, business
and strategy of Arkema.
In the current context, where the Covid-19 epidemic persists across the world, and the evolution of the situation as well as the magnitude of its impacts
on the global economy are highly uncertain, the retained assumptions and forward looking statements could ultimately prove inaccurate.
Such statements are based on management’s current views and assumptions that could ultimately prove inaccurate and are subject to material risk
factors such as among others, changes in raw material prices, currency fluctuations, implementation pace of cost-reduction projects, developments in
the Covid-19 situation, and changes in general economic and business conditions. These risk factors are further developed in the 2020 Universal
Registration Document.
Arkema does not assume any liability to update such forward-looking statements whether as a result of any new information or any unexpected event
or otherwise.
Further information on factors which could affect Arkema’s financial results is provided in the documents filed with the French Autorité des marchés
financiers.
Financial information since 2005 is extracted from the consolidated financial statements of Arkema. Quarterly financial information is not audited.
The business segment information is presented in accordance with Arkema’s internal reporting system used by the management.
The main performance indicators used by the Group are defined in the 2020 Universal Registration Document. As part of the analysis of its results or to
define its objectives, the Group uses in particular the following indicators:
EBITDA margin: corresponds to EBITDA as a percentage of sales, EBITDA equaling recurring operating income (REBIT) plus recurring depreciation and
amortization of tangible and intangible assets
REBIT margin: corresponds to the recurring operating income (REBIT) as a percentage of sales
Free cash flow: corresponds to cash flow from operations and investments excluding the impact of portfolio management
EBITDA to cash conversion rate: corresponds to the free cash flow excluding exceptional capital expenditure divided by EBITDA
Q2 2021 RESULTS AND OUTLOOK / 29 JULY 2021