Embed Size (px)
Citation preview

8/3/2019 cbo1
http://slidepdf.com/reader/full/cbo1 1/6
Coherent Change Detection for Multi-Polarization SAR
Leslie M. Novak
BAE SYSTEMS
6 New England Executive Park
Burlington, MA 01803
Abstract
This paper presents a solution to the coherent change detection (CCD) problem usingmulti-polarization synthetic aperture radar (SAR) imagery. The multi-polarization SAR
imagery (i.e., the day-1 reference and day-2 test images) are modeled as jointly correlated
complex Gaussian vectors with unknown correlation, je
. Maximum likelihood
estimates of the unknown phase and coherence parameters ( , ) are derived. Accuracy
of the MLE estimates is evaluated; and the benefit of using multi-polarization data versus
single-polarization data is quantified.
Introduction
We investigate the use of fully polarimetricsynthetic aperture radar (SAR) imagery in
a coherent change detection application.
The SAR is assumed to measure (for each
pixel in the SAR image) three complex
polarization returns: HH, HV, and VV;these three returns are elements of the
three-dimensional complex vector, X,which we model as a complex Gaussian
vector of dimension “p=3”:
HH
X HV
VV
(1)
The corresponding probability density
(PDF) of vector, X , is:
† 1
1 †
exp( )
exp
p
p
X C X f X
C
tr C XX
C
(2)
C is the determinant of the positive
definite covariance matrix †[ ]C E XX
and † X is the complex conjugate transpose
of the vector X .
In this change detection application weassume there are two data sets: (1) the
reference data 1 2( , ,..., ) N X X X , and (2) the
mission data 1 2( , ,..., ) N Y Y Y . These data
sets correspond to a reference image that
was gathered on a previous day (day-1)and a more recently gathered (day-2)
mission image. These two SAR images are
assumed to be accurately pixel aligned;therefore we model the data by an
augmented measurement vector, Z:
x y
x y
x y
X Z where
Y
HH HH
X HV and Y HV
VV VV
(3)
5681 4244 0132 1/05/$20.00 ©2005 IEEE

8/3/2019 cbo1
http://slidepdf.com/reader/full/cbo1 2/6
Thus, the dimension of vector Z is “2p”.
Under a jointly Gaussian assumption, thePDF of measurement vector Z is:
† 1
2
1 †
2
exp
( )
exp
p
p
Z Q Z
f Z Q
tr Q ZZ
Q
(4)
Q is the determinant of covariance
matrix:
†
* †[ ]
C C Q E ZZ
C C
(5)
As implied by the covariance matrix givenin Equation 5, the data in image-1 and
image-2 have the same covariance
structure denoted by the commoncovariance matrix, C; the correlation
parameter “ ” denotes the correlation
between the complex elements of the day-1and day-2 measurements. We have
observed in real SAR measurement data,
typical correlation values of 0.9
As we shall see in the following section, in
order to obtain this coherence estimate we
will also obtain the MLE estimate of the
phase parameter, , the relative phase
between the day-1 and day-2 images.
MLE estimates of the coherence and
phase parameters
To obtain the maximum likelihood
estimate of the coherence parameter, MLE ,
we write the conditional PDF (likelihood
function) of our data measurements
(conditioned on the unknown parameters
, ) as follows:
† 1
1
1 2 2
1 †
1
2
exp
( , ,..., , )
exp
N
k k
k
N N Np
N
k k
k
N Np
Z Q Z
f Z Z Z Q
tr Q Z Z
Q
In coherent change detection, the metricused to decide whether or not asignificant change has occurred between
the day-1 and day-2 images is the value
of the coherence parameter, .
When 1, the day-1 and day-2
images are very similar, implying no
change has occurred; when 0, the
day-1 and day-2 images are verydissimilar, implying a significant change
has occurred. Therefore, our goal in theanalysis that follows is to find the best
(MLE estimate) of the coherence
parameter, , from the observed day-1
and day-2 SAR images.
The covariance matrix inverse is given by the formula:
1 1
1 1
1
2(1 )
j
j
C e C
e C C Q
(7)
The determinant of the covariancematrix is given by the formula:
22(1 ) pQ C (8)
Evaluating the log-likelihood functiongives:
569

8/3/2019 cbo1
http://slidepdf.com/reader/full/cbo1 3/6
2
1 † † 1 † †
2 21 1 1 1
1 2 ) 2 ln
1 1
(1 ) (1 )
ln ( , ,..., , ) 2 ln ln(1
N N N N
j j
k k k k k k k k
k k k k
N N C
trC X X Y Y trC e Y X e X Y
f Z Z Z Np Np
(9)
To determine the MLE estimate of
unknown parameter, , we take the
derivative
1 2ln ( , ,..., , ) 0 N f Z Z Z
(10)
Taking the partial derivative and
simplifying, we obtain the followingexpression (11):
2
1 † †
1 1
21 † †
1 1
0 (1 )
2
2
(1 )
2
N N
k k k k
k k
N N j j
k k k k
k k
trC X X Y Y Np
trC e Y X e X Y Np
Using the following reasonable
approximations:
† †
1 1
1 1 N N
k k k k
k k
X X C and Y Y C N N
we obtain the result:
1 † †
1 1
1(2 ) 2
N N
k k k k
k k
tr X X Y Y
tr N Np
C
C C
(13)
Substituting the above approximation
into Equation 11, we obtain:
2 20 (1 ) 2 (1 ) (14)
where the factor
1 † †
1 1
1 † †
1 1
N N j j
k k k k
k k
N N
k k k k
k k
trC e Y X e X Y
trC X X Y Y
The MLE estimate of the coherence
parameter, MLE , is a solution of the
following cubic equation: 20 (1 )( ) (16)
Finally, taking the unique real root as the
solution gives expression (17):
1 † †
1 1
1 † †
1 1
† 1 † 1
1
† 1 † 1
1
N N j j
k k k k
k k
MLE N N
k k k k
k k
N j j
k k k k
k N
k k k k
k
trC e Y X e X Y
trC X X Y Y
X C Y e Y C X e
X C X Y C Y
Next we apply polarization “whitening”
to the SAR measurement data asfollows:
1 12 2
k k k k X C X and Y C Y (18)
In the “whitened” measurement space,the MLE estimate of the coherence is
given as follows:
570
8/3/2019 cbo1
http://slidepdf.com/reader/full/cbo1 4/6
† †
1
2 2
1 1
N j j
k k k k
k MLE N N
k k
k k
X Y e Y X e
X Y
(19)
The above expression may be written ina more useful way by using the
following:
† † †
1 1 1
N N N
k k k k k k k k
k k k
X Y X Y X Y
(20)
Using the above result, the coherence
estimate becomes:
† †
1 1
2 2
1 1
2 cos N N
k k k k
k k
MLE N N
k k
k k
X Y X Y
X Y
The above expression is maximized with
respect to the unknown phase parameter,
, by taking as the MLE estimate:
†
1
N
MLE k k k X Y
(22)
Finally, the following MLE estimate of
the coherence parameter is obtained:
†
1
2 2
1 1
2 N
k k
k
MLE N N
k k
k k
X Y
X Y
(23)
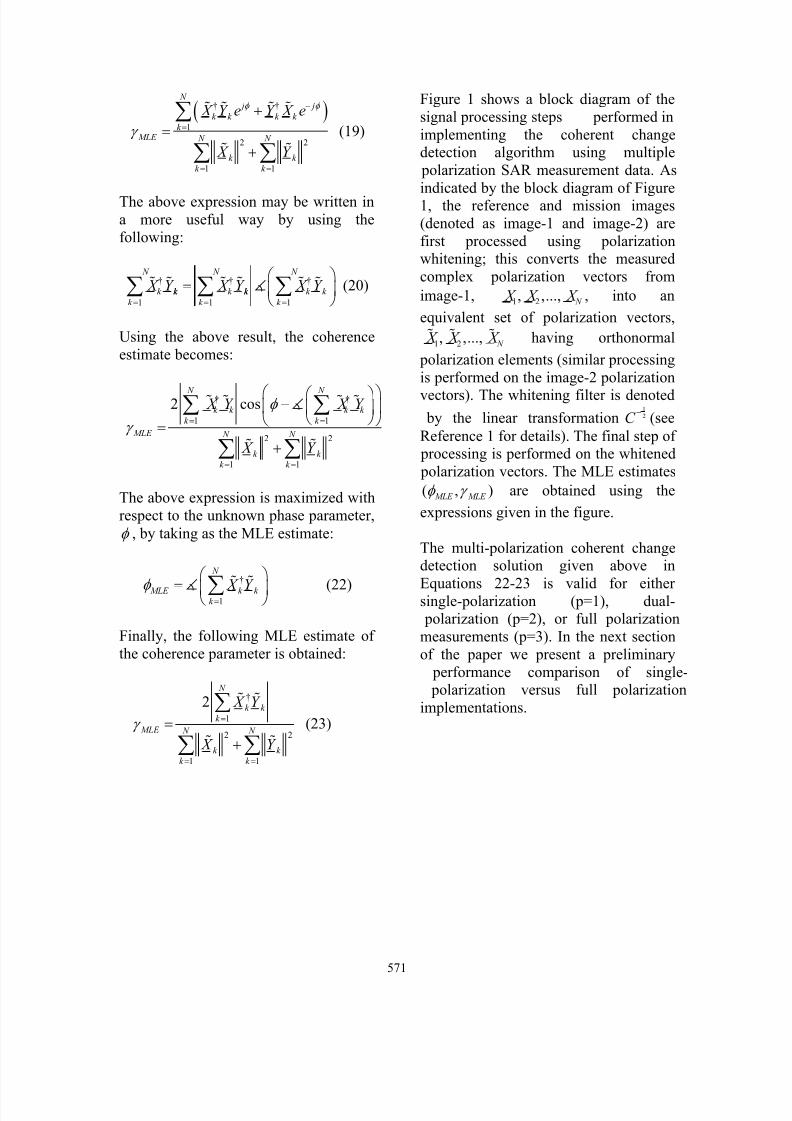
Figure 1 shows a block diagram of the
signal processing steps performed in
implementing the coherent changedetection algorithm using multiple
polarization SAR measurement data. As
indicated by the block diagram of Figure1, the reference and mission images
(denoted as image-1 and image-2) are
first processed using polarizationwhitening; this converts the measured
complex polarization vectors from
image-1, 1 2, ,..., N X X X , into an
equivalent set of polarization vectors,
1 2, ,..., N X X X having orthonormal
polarization elements (similar processing
is performed on the image-2 polarization
vectors). The whitening filter is denoted
by the linear transformation12C
(see
Reference 1 for details). The final step of processing is performed on the whitened
polarization vectors. The MLE estimates
( , )MLE MLE are obtained using the
expressions given in the figure.
The multi-polarization coherent changedetection solution given above in
Equations 22-23 is valid for either single-polarization (p=1), dual- polarization (p=2), or full polarization
measurements (p=3). In the next section
of the paper we present a preliminary
performance comparison of single- polarization versus full polarization
implementations.
571

8/3/2019 cbo1
http://slidepdf.com/reader/full/cbo1 5/6
Figure 1: Block diagram showing the signal processing steps performed in coherent
change detection using multiple polarization SAR measurement data.
Simulated coherent change detection
results
This section of the paper presents
simulated coherent change detection
performance results using computer generated multi-polarization data. The
performance results presented here wereobtained using a Monte Carlo simulation
of the MLE estimators derived in the
previous section of this paper (Equations
22 and 23). In the simulation we used a 5 by 5 “box” of pixels (N=25) and we
simulated two sets of 25 independent, 3-
dimensional complex Gaussian vectorsrepresenting the day-1, day-2 data
vectors. We simulated day-1 and day-2data vectors having true correlation
parameter values = 60 degrees and =
0.8. These data sets were obtained using
a Matlab code that generated 6-
dimensional complex Gaussian vectorshaving the following polarization
covariance matrix:
60
60
1 0 0.5 1 0 0.5
0 0.2 0 0.8 0 0.2 0
0.5 0 1 0.5 0 1
1 0 0.5 1 0 0.50.8 0 0.2 0 0 0.2 0
0.5 0 1 0.5 0 1
j
j
e
Q
e
The estimated phase and coherence
parameters obtained from our Monte
Carlo simulations are shown in Figures 2and 3; the histograms show the accuracy
of the MLE algorithms in estimating the
phase and coherence parameters from
the day-1 and day-2 data vectors for true parameter values of 60 deg and
0.8, respectively. Using full
polarization data, the standard deviations
of the single-polarization estimationerrors were found to be reduced by a
factor of 3 .
572

8/3/2019 cbo1
http://slidepdf.com/reader/full/cbo1 6/6
Figure 2: Histogram of the MLE phase
parameter estimates using N=25 pixels.
True phase angle = 60 degrees; std.
dev. of single-POL phase estimates is
6.1 deg ; std. dev. of three-POL phaseestimates is 3.7 deg. The histogram was
obtained from 1000 independent Monte
Carlo trials.
Figure 3: Histogram of the MLE
coherence parameter estimates using N=25 pixels. True coherence = 0.8 ; std.
dev. of single-POL coherence estimatesis 0.055; std. dev. of three-POLcoherence estimates is 0.033. The
histogram was obtained from 1000
independent Monte Carlo trials.
Summary
This paper investigated the use of multi-
polarization synthetic aperture radar
imagery in a coherent change detectionapplication. The multi-polarization
reference and test images were modeledas jointly correlated Gaussian data with
unknown complex correlation
( ) je . Maximum likelihood
estimates of the unknown parameters
( , ) were derived and the accuracy of
these MLE estimates was determinedusing a Monte Carlo simulation.
Parameter estimation errors were
compared using single-polarization (HH)data versus multi-polarization (HH, HV,
VV) data. The standard deviation of the
errors of the MLE estimates usingsingle-polarization data was reduced by
approximately 3 when multi-
polarization (HH, HV, VV) data wereused.
References
[1] L. Novak, et. al, “Optimal
Polarimetric Processing for EnhancedTarget Detection,” IEEE Transactions
AES, Jan. 1993
[2] C.V. Jackowatz, et. al, “Spotlight-
Mode Synthetic Aperture Radar: A
Signal Processing Approach,” Chapter 5,Kluwer Academic Publishers, 1996
[3] L. Novak, “Change Detection for
Multi-polarization, Multi-pass SAR,”SPIE Conference on Algorithms for
Synthetic Aperture Radar Imagery, 26-
30 March 2005, Orlando, FL.
573


