Embed Size (px)
Citation preview

March
2006
CE
NT
RA
LB
AN
KO
FN
IGE
RIA
EC
ON
OM
ICA
ND
FIN
AN
CIA
LR
EV
IEW
Vo
lum
e4
4N
um
be
r1
June 2006 Volume 44 Number 2
CENTRAL BANK OF NIGERIA
Economic and Financial ReviewMarch 2006Volume 44 Number 1
ISSN 1957-2968
ISSN 1957-2968
Tax Assignment and Revenue Sharing in Nigeria: Challenges and Options
Perspectives on the European Monetary Union: Lessons for the Economic
Community of West African States (ECOWAS)
External Debt, Investment and Economic Growth: Evidence from Nigeria
Matters Arising from the Introduction of the Defined Contributory
Pension Scheme in Nigeria
Broad Money Demand and Financial Liberalization in South Africa by G. R.
Wesso, Occasional Paper No. 18 (November 2002) of the South African
Reserve Bank
S.C. Rapu
J. E. L. Sagbamah
J.S. Akuns
Abdurrahman Abdullahi
Aloysius Ajab Amin & Isa Audu
REVIEW/COMMUNICATIONS

Central Bank of Nigeria Economic and Financial Review Volume 44/1 March 2006
Central Bank of Nigeria ECONOMIC AND FINANCIAL REVIEW Volume 44, No. 1, March 2006
EDITORIAL COMMITTEE
Editor-in-Chief Dr. O.J.Nnanna
Managing Editor
B.S. Adebusuyi
Editor
C.N.O.Mordi
Associate Editors
Dr. (Mrs.) S. Alade C.M.Anyanwu Dr.A. Englama Dr.S.I. Doguwa
E.A. Essien
AAiimmss aanndd SSccooppee
The Economic and Financial Review is published four times a year in March, June, September and December by the
Research and Statistics Department of the Central Bank of Nigeria. The Review contains articles on research
undertaken at the Bank, in particular, and Nigeria, in general, mainly on policy issues both at the macroeconomic and
sectoral levels in the hope that the research would improve and enhance policy choices. Its main thrust is to promote
studies and disseminate research findings, which could facilitate achievement of these objectives. Comments on or
objective critiques of published articles are also featured in the review. The views and interpretation contained in the
articles published in the Review are those of the authors and do not necessarily represent the views and policies of
the Central Bank of Nigeria.
CCoorrrreessppoonnddeennccee
Correspondence regarding the journal and articles should be addressed to the Director of Research and Statistics
Department, Editor-in-Chief, CBN Economic and Financial Review, Central Bank of Nigeria, P.M.B.0187, Garki,
Abuja.
SSuubbssccrriippttiioonn RRaatteess
Subscription to the Central Bank of Nigeria Economic and Financial Review is available without charge to
institutions, corporations, embassies, and development agencies. Individuals can send written request for any
particular edition of interest also without charge. Articles may be reprinted, reproduced, published, abstracted, and
distributed in their entirety on condition that the author and source—the Central Bank of Nigeria as well as the
Economic and Financial Review—are duly credited.
NNootteess ttoo CCoonnttrriibbuuttoorrss
Information on manuscript submission is provided on the last and inside back cover of the Review.
© 2006, Central Bank of Nigeria
ISSN 1957-2968

Central Bank of Nigeria Economic and Financial Review Volume 44/1 March 2006
CONTENTS
Tax Assignment and Revenue Sharing in Nigeria: Challenges and Options 1 - 36 S.C. Rapu
Perspectives on the European Monetary Union: Lessons for the Economic Community of West African States (ECOWAS) 37 - 80 J. E. L. Sagbamah
External Debt, Investment and Economic Growth: Evidence from Nigeria 81 - 113 Aloysius Ajab Amin & Isa Audu
REVIEW/COMMUNICATIONS
Matters Arising from the Introduction of the Defined Contributory Pension Scheme in Nigeria 114 - 123 J.S. Akuns Broad Money Demand and Financial Liberalization in South Africa by G. R. Wesso, Occasional Paper No. 18 (November 2002) of the South African Reserve Bank 124 - 127 Abdurrahman Abdullahi
CCCEEENNNTTTRRRAAALLL BBBAAANNNKKK OOOFFF NNNIIIGGGEEERRRIIIAAA
EEEcccooonnnooommmiiiccc aaannnddd FFFiiinnnaaannnccciiiaaalll RRReeevvviiieeewww VVVooollluuummmeee 444444 MMMaaarrrccchhh 222000000666 NNNuuummmbbbeeerrr 111

Central Bank of Nigeria Economic and Financial Review Volume 44/1 March 2006 1
Tax Assignment and Revenue Sharing in Nigeria: Challenges and Options
S.C. Rapu∗
Assignment of taxes and revenue-sharing to different levels of government are politically divisive
issues in Nigeria. Although these are not peculiar to the country, but they are unique because the
federation has not been able to establish a widely acceptable system, despite the various fiscal
commissions since 1946. The debate is the devolution of more taxes with high revenue yields to the
state and local governments. The sub-national governments contend that, the currently assigned taxes
are poor in terms of their bases and, therefore, revenues are not able to meet their expenditure
expectations. Typical policy responses to these agitations by the Federal Government are minor
adjustments in the revenue-sharing arrangements and the introduction of non-statutory transfers.
Such measures have, however not assuaged the aspirations of the sub-national governments. Rather,
the demand is a complete review of the sharing formula of the federally-collected revenue that could
reduce to reasonable levels the existing vertical and horizontal fiscal imbalances. Similarly, some state
governments are demanding for an increase in their shares of revenues derived from their
jurisdictions. Specifically, the entrenchment of reasonable weights on derivation principle in the
sharing of all revenue items is the most critical issue today. This paper build on the history as well as
the current legal framework of tax assignment and revenue-sharing in Nigeria to identify the
challenges while also drawing from the theoretical framework for policy options which will provide
for a stable federal system in Nigeria. The paper recommended among others the strengthening of
states internal revenue bases, adjustments on the vertical and horizontal revenue-sharing formula,
effective compliance with the allocation of the mandatory 10% of states’ internally generated revenue.
The paper concludes that changes to the existing tax assignment and revenue-sharing arrangements
will go a long way in protecting our nascent democracy.
Keywords: Federalism, Constitution, Inter-Governmental Fiscal Relations, Tax
Assignments, Revenue-Sharing, Fiscal Imbalances
JEL Classification Numbers: E62, H2, H71, H77
Author’s e-mail: [email protected]
∗ Rapu is a Deputy Director in the Research and Statistics Department, Central Bank of Nigeria, Minna. The views expressed in this paper are personal and should not be regarded as the views of the Central Bank of Nigeria. The author is grateful to the several reviewers and to the Management of the Research and Statistics Department for its financial support for the final review of this paper. All remaining errors are the author’s responsibility.

2 Central Bank of Nigeria Economic and Financial Review March 2006
I. Introduction
he federal system in Nigeria has evolved since 1946 and it is recognized by
the constitutional division of administrative responsibilities and expenditure
assignments to different levels of government. Each government is
empowered by assignment of own taxes while that of the sub-national
governments are complemented with statutory and non-statutory transfers from the
federally- collected revenues by the Federal Government. However, tax assignment
and revenue-sharing in the Federal Republic of Nigeria have witnessed periodic
changes, following the recommendations of the different fiscal commissions
established by the various regimes. For example, under the military governments,
frequent changes of assignment of taxes and revenue-sharing formula through
changes in decrees was a notable feature of the federal system in Nigeria. It is
important to note that debates about tax assignment and revenue-sharing are not
peculiar to Nigeria. Nonetheless, Nigeria’s case is unique because the criteria for
vertical and horizontal distribution of revenue so far used have not enjoyed wide
acceptability.
Recently, agitations for a complete review of the assigned taxes to each level of
government and the revenue-sharing criteria have become the main politically
divisive issues. Specifically, some state governments are asking for the control of
revenues of natural resources found in their domains. This has also, generated
further debates that all non-oil revenue sources of the Federation Account should be
shared on the basis of derivation. However, because of the wide gap in tax bases
among the sub-governments and the need to achieve equal development across the
country, the political actors at the centre are not pre-disposed to accede to some of
these demands.
In this context, the debates suggest the need to review upwards the shares of the sub-
national governments in terms of statutory transfers from the federally-collected
revenue. Equally, the oil-rich states particularly and, the economically advantage
states, are asking for an upward review of the weights attached to the sharing of not
only revenues from natural resources but all non-oil revenue items. Similarly, current
debates emphasize the need to review the horizontal–sharing indices which tend to
favour the well established states (older states) and local governments to the
disadvantage of the states and local governments with low per capita income. These
debates are not limited to the fiscal relationships between the federal, state and local
governments but also extend to the relationships between the states and their local
T

Rapu: Tax Assignment and Revenue Sharing 3
governments. The local governments in view of their fiscally-disadvantage positions
in the federal system are also, demanding for a favourable revenue-sharing system
from the revenues of state governments from assigned taxes and fees known as ‘State
Allocations’ to complement transfers from the Federation Account and the VAT Pool
Account, including assigned taxes and fees.
The objective of this paper, therefore, is to identify the challenges of tax assignment
and revenue-sharing arrangements in Nigeria and proffer solutions. These policy
options are aimed first, to accommodate the growing desires of some state
governments wishing to acquire greater tax autonomy. Second, is to provide an
overall transfer system that will ensure more funds to the sub-national governments
to meet the Millennium Development Goals (MDGs) as well as achieve equalization
effect across the state and local governments in the country. With this background,
the rest of the paper is organized in four parts. Part two focuses on the theoretical
framework on tax assignment and revenue-sharing in a federal system. Part three
traces the evolution of tax assignment and revenue-sharing in Nigeria and evaluates
the outcomes. Part four identifies the challenges and makes suggestions for new
options. Part five summarizes and concludes the paper.
II Theoretical Expositions
II.1 Federalism and Assignment of Responsibilities
Federalism is defined as the amalgam of sub-units of national sovereign governments
that operate independently under a constitutionally defined sphere of functional
competence (Oates, 1972). It is a decentralization of responsibilities for expenditure
and revenue to different levels of government that ensures that each government
makes decisions and allocates resources according to its own priorities.
A number of economic arguments have been put forward to explain the adoption of
fiscal federalism. One strand of the literature emphasized economies of scale in the
provision of public goods, allocation and market efficiencies1. The other strand rests
mainly on the idea that ‘federal transfer system’ could be seen as a risk-sharing
mechanism against regional government’s revenue shocks2. On the contrary, political
arguments far enjoy higher considerations in the adoption of federalism. Thus,
federalism is favoured when a country’s population is not homogenous in terms of
ethnic, linguistic, cultural, racial or other important national characteristics. It is
1 Casella et all, 1990; Weber et all, 2001, Cremer, et all 1994, and Tanzi, 1995 2 See Persson et.all 1996; IKein et all, 1998, and Ahmad E, et all; 2003.

4 Central Bank of Nigeria Economic and Financial Review March 2006
used to induce the sub-units to remain in the federation while maintaining their
different individual characteristics. In sum, it is generally believed that fiscal
decentralization strengthens democracy by increasing interest in local politics.
II.2 Tax Assignment and Revenue Sharing in a Federal System
II.2.1 Tax Assignment
Tax assignment indicates the level of government that should be in control of a
particular tax and how this should be administered. In public finance theory, there is
no ideal system of tax assignment rather it varies from jurisdiction to jurisdiction,
under three options namely: the assignment of all tax bases to sub-national
governments only; the assignment of all tax bases to the central government only;
and the assignment of tax bases to each level of government (Martinez-Vasquez et al,
1995).
It is generally recognized that both distributional and macroeconomic management
considerations argue against the type of arrangement where all tax bases are assigned
to the sub-national governments only (such as practiced in the former Yugoslavia).
Under this system, the centre imposes surcharges on taxes collected by the sub-
national governments. Nonetheless, this arrangement cannot facilitate income re-
distribution through the tax system while it also deprives the central government any
tax tool as fiscal policy instrument for macroeconomic management. The major
advantage is that spending decisions are compatible with tax decisions and,
therefore, it encourages tax competitions among the sub-national governments (Ter
Minassian, 1997).
The assignment of all tax bases to the central government only is consistent with the
pursuit of macroeconomic objectives, while it generates more revenues owing to
economies of scale and prevents revenue losses and high costs of administration. This
presupposes that the central government is obliged to transfer some of the revenue
collected to the sub-national governments. However, this is most often critiqued
because it separates spending authorities from revenue–raising responsibilities.
Thus, the arrangement removes the links between the benefits derived from public
expenditures and their prices (taxes). The third option, which is the most frequently
observed, is the one which assigns own sources of revenue to each level of
government with a combination of inter/intra-governmental transfers. However, the
major problem with this system is the issue of overlapping of tax bases which means
likely increase in the burden of the tax payers (Tanzi, 1995).

Rapu: Tax Assignment and Revenue Sharing 5
Generally, the implementation of assigned taxes to any level of government follows
four methods, namely: independent legislation and administration, dual
administration, surcharges on federal taxes and tax-sharing. Independent legislation
and administration guarantees tax sovereignty, but sometimes inconsistent laws and
administrative bottlenecks could create problems and increase the cost of
administration. Dual administration means that both the centre and the units have
legislative and administrative responsibilities. Tax sharing implies that the central
government gives a fraction of revenue from some selected taxes collected from a
sub-national government to the same government e.g. automobile taxes. Under this
system, each sub-unit has latitude to choose their own rates. Surcharge implies that
the lower levels of government may surcharge the central government for the taxes
collected in its jurisdiction or vice-versa (Diaz-Cayeros and Mclure, 2000).
Three basic considerations which determine the type of taxes allocated to each level
of government are: administrative efficiency; the objective of the tax and the mobility
of the tax base (Shar, 1998). Following these broad principles, there is a general
consensus in the public finance theory, on the types of taxes that should be assigned
to the different levels of government (May, 1996).
• progressive re-distributive taxes are centralized e.g. personal income tax,
corporate tax;
• taxes for economic stabilization are collected centrally e.g. import and export
taxes;
• taxes on mobile factors of production are centralized e.g. capital gain taxes;
• residence-based taxes such as sales, excise and retail taxes can be
decentralized;
• destination-based taxes are also subject to central collection -Value Added
Tax;
• benefits tax/user charges are assigned to the level of government that
provides the services such as toll fees, hospital and school fees, motor licenses
etc.;
• taxes distributed on unequal basis to jurisdictions are administered by the
central government e.g. taxes on natural resources; and
• tax on immobile factors of production such as land and buildings are assigned
to the local jurisdictions e.g. property taxes are assigned to municipal
councils.
6 Central Bank of Nigeria Economic and Financial Review March 2006
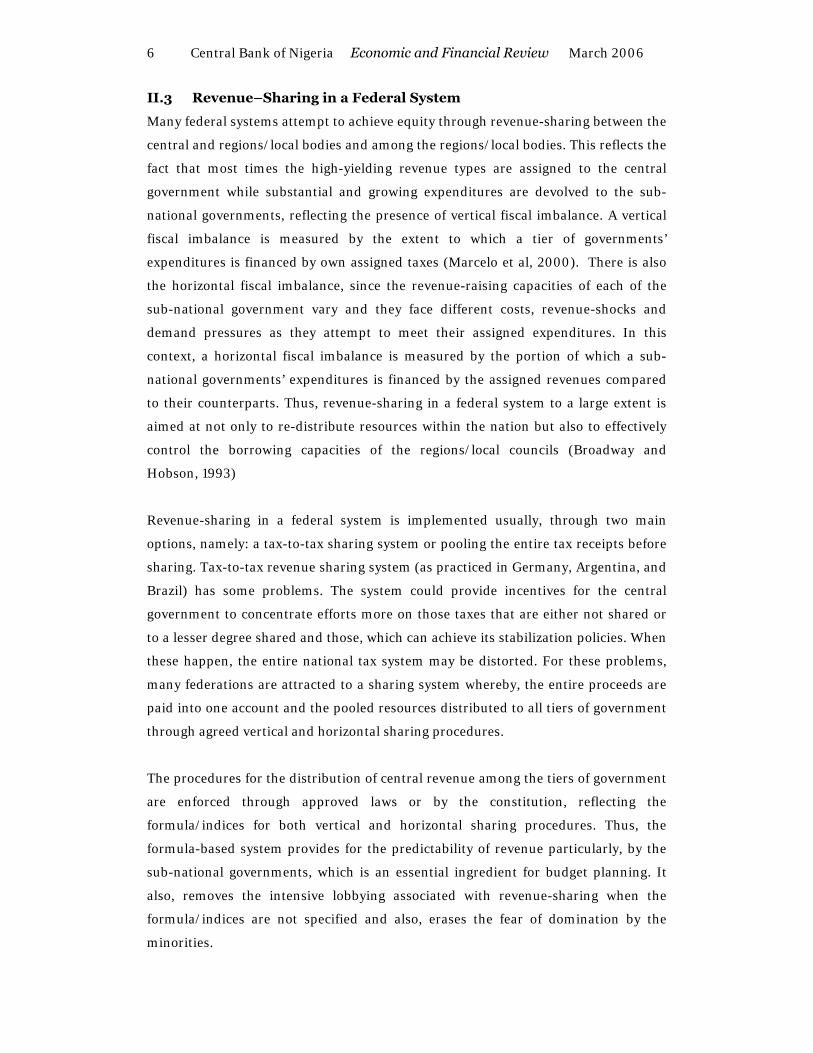
II.3 Revenue–Sharing in a Federal System
Many federal systems attempt to achieve equity through revenue-sharing between the
central and regions/local bodies and among the regions/local bodies. This reflects the
fact that most times the high-yielding revenue types are assigned to the central
government while substantial and growing expenditures are devolved to the sub-
national governments, reflecting the presence of vertical fiscal imbalance. A vertical
fiscal imbalance is measured by the extent to which a tier of governments’
expenditures is financed by own assigned taxes (Marcelo et al, 2000). There is also
the horizontal fiscal imbalance, since the revenue-raising capacities of each of the
sub-national government vary and they face different costs, revenue-shocks and
demand pressures as they attempt to meet their assigned expenditures. In this
context, a horizontal fiscal imbalance is measured by the portion of which a sub-
national governments’ expenditures is financed by the assigned revenues compared
to their counterparts. Thus, revenue-sharing in a federal system to a large extent is
aimed at not only to re-distribute resources within the nation but also to effectively
control the borrowing capacities of the regions/local councils (Broadway and
Hobson, 1993)
Revenue-sharing in a federal system is implemented usually, through two main
options, namely: a tax-to-tax sharing system or pooling the entire tax receipts before
sharing. Tax-to-tax revenue sharing system (as practiced in Germany, Argentina, and
Brazil) has some problems. The system could provide incentives for the central
government to concentrate efforts more on those taxes that are either not shared or
to a lesser degree shared and those, which can achieve its stabilization policies. When
these happen, the entire national tax system may be distorted. For these problems,
many federations are attracted to a sharing system whereby, the entire proceeds are
paid into one account and the pooled resources distributed to all tiers of government
through agreed vertical and horizontal sharing procedures.
The procedures for the distribution of central revenue among the tiers of government
are enforced through approved laws or by the constitution, reflecting the
formula/indices for both vertical and horizontal sharing procedures. Thus, the
formula-based system provides for the predictability of revenue particularly, by the
sub-national governments, which is an essential ingredient for budget planning. It
also, removes the intensive lobbying associated with revenue-sharing when the
formula/indices are not specified and also, erases the fear of domination by the
minorities.

Rapu: Tax Assignment and Revenue Sharing 7
III Historical Background
III.1 Evolution of Tax Assignment and Revenue-Sharing Formula in
Nigeria
Federalism was adopted in Nigeria in 1946, when the Richards Constitution came into
existence, thus, recognizing the regional governments (North, West and East). The
Phillipson Fiscal Commission (1946) assigned direct taxes (personal income tax),
licenses and mining rents to the regions while taxes such as import and export duties,
excise duties, company income taxes were assigned to the Federal Government. In
recognition of the need to give the regions the right incentives for revenue
mobilization, the principle of derivation was given high priority for the distribution of
federally-collected revenue (Ahmad and Singh, 2003).
The adoption of the Macpherson Constitution in 1951 offered another opportunity to
re-visit the issues of tax assignment and revenue–sharing in Nigeria. Thus, the Hicks-
Phillipson Fiscal Commission (1951) was set up to review the existing tax assignment
and revenue–sharing procedures. To broaden the revenue base of the regions, the
commission recommended additional taxes, namely: sales tax on motor spirits, excise
tax on tobacco, and entertainment tax. The recommended revenue-sharing formula
adopted three principles: derivation, population and needs. Also, special grants for
police and education were transferred to the regions. Each of the regions was satisfied
with the new fiscal arrangements- the west was satisfied with the principle of
derivation, the north with the principles of population and needs while the east liked
the special grants.
In 1953, the Louis Chicks Fiscal Commission was established to fashion out new fiscal
arrangements based on the Lyttleton Constitution of regional self-government. The
Commission made a strong case for an upward review of the financial strength of the
Federal Government. Against this backdrop, mining rents and royalties, and personal
income taxes were brought under the purview of the Federal Government. The
proceeds were shared between the federal and the regional governments. Derivation
principle was again applied in the sharing of these resources but the major
impediment was the difficulty experienced in establishing the statistical data for the
distribution of these resources among the regions, hence, there were several
complaints (Ashwe, 1986).
As the country approached independence, the Raisman Fiscal Commission (1958)
reviewed the existing tax assignment and revenue-distribution. The Commission

8 Central Bank of Nigeria Economic and Financial Review March 2006
expanded the regional tax base and subsequently, allowed them the full share of the
proceeds from export taxes as well as excise duties and the Federal Government
received the share attributable to consumption in Lagos. The marketing boards were,
however, regionalized while the regions were empowered to fix producer’s price,
impose sales tax on the export commodities and retain the operational surpluses of
the boards. In addition, the administration and retention of proceeds from personal
income tax were reverted to the regional governments. It established the Distributable
Pool Account (DPA) into which the shares of federally-collected revenue for the
regions were deposited. Thus, the federally-collected revenue was 70 percent shared to
the Federal Government while 30 percent was paid into the DPA. The proceeds of the
DPA were distributed to the regions on the principles of derivation, population and
needs using the formula of 40, 31, 24, and 5 percent for the Northern, Eastern,
Western regions, and the Southern Cameroon, respectively (CBN, 2000).
Nigeria became a sovereign state in 1960; subsequently, the revenue-sharing formula
of the proceeds of the DPA was adjusted in 1961, following the pulling out from the
federation by the Southern Cameroon. The new adjustment allocated 42, 32.6, and
25.6 percent to the Northern, Eastern, and Western regions, respectively. A further
adjustment was made in 1963, as a result of the creation of the Mid-Western region.
Thus, the share of the Western region was divided between it and the Mid-Western
region at a ratio of 18.9 and 6.3 percent for the Western and the Mid-Western regions,
respectively. The Federal Government in 1964 commissioned the Binns Fiscal
Commission with the mandate to recommend a widely acceptable tax assignment and
revenue–sharing systems. Following those recommendations, the share of DPA from
federally–collected revenue was increased to 35 percent while that of the Federal
Government was reduced to 65 percent. Soon after, tensions were generated as the
report of the Commission abandoned the principle of derivation and adopted internal
revenue generation efforts, and needs. The tensions generated by the report later
became a serious political crisis, culminating into a military intervention in 1966.
The military take-over laid to rest the confusion, as the Federal Military Government
suspended the constitution and other related political activities. With decrees, the
Federal Military Government made frequent adjustments to tax assignment and
revenue-sharing formula. Thus, it retained most of the taxes such as company income
tax, petroleum profit tax, and excise duties. Others were the sharing of excise duties on
sale of tobacco and petroleum products and import duties on motor spirits equally
between the federal and the DPA; export duties on the basis of 3:2 by the state of

Rapu: Tax Assignment and Revenue Sharing 9
origin and the DPA; and the introduction of uniform tax structure on personal income
and sales taxes in 1975. The Federal Government replaced the regional marketing
boards with commodity boards and, thus, assumed the control of the operations of the
boards. In 1971, with Decree No.9, it retained all the off-shore oil revenue while
Decree No. 6 (1975) channeled all revenues to be shared by the states through the
DPA, except for the 20 percent of on-shore mining rents and royalties due to the states
of origin on the principle of derivation ((Okunrounmu, 1996).
Following the transition program, the Aboyade Fiscal Committee (1977) was set up to
review the fiscal arrangements in Nigeria. The committee renamed the DPA as
‘Federation Account’; however, most of the recommendations were considered too
technical and radically different from the past and, therefore, were rejected. The
Okigbo Fiscal Commission (1980) was established by the new civilian administration.
It accepted the earlier recommendation that all federally-collected revenue should be
transferred into the Federation Account, except those classified as Federal
Government independent revenue (Nigeria FR, 1980).
Since then, the revenue–sharing procedure has followed generally, the provisions of
the 1981 Revenue Allocation Act, except for minor changes in the shares of the
different tiers of government, including additional beneficiaries. Thus, between 1980
and1986, the share of the Federal Government was 55 percent, the state governments,
34.5 percent while that of the local governments increased from 8.0 percent in 1980 to
10.0 percent in 1986. In 1987, further amendments were made in the shares of the
state governments from 34.5 percent in 1986 to 32.5 percent. This boosted the share
of special funds, specifically, the Oil Mineral Producing Areas Development
Commission (OMPADEC) and general ecology (Table 1).
Another amendment to the revenue-sharing formula was made by the Federal Military
Government in 1990. Consequently, the federal and the state governments lost some
percentages in their shares in favour of the local councils and special funds. The shares
of the local councils and the special funds were raised to 15 and 5 percent, respectively.
Further amendments in 1993, increased the shares of the local councils and special
funds to 20 and 7.5 percent, respectively while that of the federal and state
governments declined to 48.5 and 24.0 percent, respectively. These amendments
came through the recommendations of a central finance commission established in
1989 namely: National Revenue Mobilization, Allocation and Fiscal Commission
(NRMAFC). While the previous fiscal commissions were ad-hoc, the NRMAFC is a

10 Central Bank of Nigeria Economic and Financial Review March 2006
permanent central fiscal commission of government. The 1993 amendment remained
in force until 2002 when the Supreme Court judgment of April 2002 made some
fundamental changes (Nigeria FR, 2002).
Transfers to states and local governments from the Federation Account used the
following indices: population (30 %); land mass/terrain (10 %); equality of states (40
%); internal revenue generation efforts (10 %); and social development indicators
(10%). The social development indices uses six factors namely: primary school
enrollment (24% of 10 %); direct number of students enrolled in secondary schools
(8% of 10%); and inverse number of students enrolled in secondary schools (8% of
10%); number of hospital beds (30% of 10 %); index of access to clean water (15% of
10%); and the quantity of rainfall (15% of 10%). However, there have been several
complaints on the statistical data for the revenue transfers.
An assessment of the inter-governmental fiscal relationship at the state governments
level showed that sharing of the state internally-generated between each state
government and the local governments was also, institutionalized. Each state
government was required by law to allocate 10.0 percent of its own internally-
generated revenue from assigned taxes to the local governments in that state. The
formula for the distribution of the allocation across the local governments varies from
jurisdiction to jurisdiction.
An important change in tax assignment during the military interregnum was the
replacement of states’ sales tax with value-added tax (VAT) in 1994, while the Federal
Government assumed the administrative responsibility. VAT proceeds are kept in the
VAT Pool Account and shared among the three tiers of government. Initially, the
Federal Government received only 20 percent of the VAT proceeds to cover
administrative costs while state and local governments received 50 and 30 percent,
respectively. In 1995, the Federal Government’s share was increased to 50 percent
while state and local governments received 30 and 20 percent, respectively. Again, the
vertical distribution was adjusted in 1996 to 35, 40, and 25 percent to the Federal,
State and Local Governments and later amended to 15, 50, and 35 percent to the
Federal, State and Local Governments, respectively, in 2000. Transfers to states and
local governments used the following indices: derivation (20%), Equity (50%) and
Population (30%). Similarly, in 1995, the Federal Government through Decree No.7
introduced the education tax. It stipulates the purpose and the distribution procedure
and established a National Trust Fund Board. The Board is entrusted with the

Rapu: Tax Assignment and Revenue Sharing 11
administration and disbursement of the proceeds while the Federal Inland Revenue
Service (FIRS) is charged with the collection (Table 2).
Table 1: Federation Account’s Revenue Allocation Formula (Per cent) Years Federal
Govt. Region/State Govt.
Local Govt.
Special Funds
FCT Derivation OMPADEC Gen. Statutory
Ecology 1960 70.0 30.0 - - - - 1963-67
65.0 35.0 - - - -
1980 55.0 34.5 8.0 2.5 - - 1982 55.0 34.5 10.0 - - - 0.51987 55.0 32.5 10.0 - - 1.5 1.0 -1990 50.0 30.0 15.0 1.0 1.0 1.5 1.0 0.51993 48.5 24.0 20.0 1.0 1.0 3.0 2.0 0.51995-98
48.5 24.0 20.0 1.0 1.0 3.0 2.0 0.5
1999 48.5 24.0 20.0 1.0 1.0 3.0 2.0 0.52000-02
48.5 24.0 20.0 1.0 13.0 0.0 2.0 0.5
Notes: 1. 1960 to 1976 Local Governments were funded through the Regional Governments. 2. The 13 percent derivation is on mineral oil revenue only Sources: Approved Budgets of the Government of the Federal Republic of Nigeria.
TABLE 2: VAT Revenue Allocation Formula (Percent)
1994 1995 1996 1997 1998 1999-2004
Federal Government 20 50 35 35 25 15
State Governments & FCT 50 30 40 40 45 50
Local Governments 30 20 25 25 30 35
Total 100 100 100 100 100 100
Sources: Approved Budgets of the Government of the Federal Republic of Nigeria
III.2 Evaluation of Tax Assignment and Revenue–Sharing
Performances in Nigeria
III.2.1 Tax Assignment Performance in Nigeria
Between 1948/49 and 1966/67 fiscal years, owing largely, to the favorable
decentralization of taxes, particularly with those taxes having high revenue-yielding
qualities to the regions, such as excise, export duties, etc., the regional governments
generated more of their revenues that covered own expenditures from internal

12 Central Bank of Nigeria Economic and Financial Review March 2006
sources. For instance, the share of internally-generated revenue by the regions in
total income of the government sector increased from an average of 15.9 percent in
1948/49 to 41.0 percent in 1966/67 fiscal years. On the contrary, the share of the
Federal Government revenue generated declined persistently, from an average of
84.2 to 59.0 percent during the same period.
Beginning from 1967/68 financial year, as a result of the military intervention and
the subsequent adjustments in tax assignment, which concentrated all the high-
yielding government revenue sources in the hands of the Federal Government, there
was a general decline in the sub-national government shares of the total government
income. Thus, the shares of the state and local governments’ internally-generated
revenue in total government income declined consistently from an average of 12.3
percent between 1967/68 and 1979/90 fiscal years to an average of 3.9 percent
between 2000 and 2004. This was contrary to the extensive list of taxes and fees
assigned to them but with generally small value of bases and relatively high
administrative costs. Conversely, the shares of revenue generated by the Federal
Government increased substantially to an average of 96.1 percent by 2000-2004
periods. Contrary to the proportion of the regional governments’ revenues before the
military intervention, from 1967/68 fiscal year, the sub-national governments
became heavily reliant on the statutory transfers from the Federal Government
(Table 3).
TABLE 3: Tax Decentralization in Nigeria
Commissions Years Federal Regions/ States Local Govts.
Phiiipson 1948/49-1951/52 84.2 15.9 n.a
Hicks-Phillipson' 1952/53-1953/54 72.5 27.5 n.a
Chicks 1954/55-1958/59 57.7 41.9 n.a
Raisman 1959/60-1963/64 62.1 38.1 n.a
Binns 1964/65-1966/67 59 41 n.a
Military Govts. 1967/68-1979/80 87.7 12.3 n.a
Civilian Govt. 1980-1983 99.2 0.8 n.a
Military Govts. 1984-1999 94.5 5.1 0.4
Civillian Govt. 2000-2004 96.1 3.4 0.5
Source: Derived from Government Budget Estimates and CBN Annual Reports III.2.2. Revenue -Sharing Performances in Nigeria
Revenue-sharing from the Federation Account was financed mainly by oil revenues,

Rapu: Tax Assignment and Revenue Sharing 13
proceeds from company income tax, and customs and excise duties. Specifically, the
oil revenue accounted for 78.5 percent of total federally-collected revenues between
1990 and 2004 while its share in total revenue by 2004 was 86.9 percent (Chart 1).
Chart 1: Composition of Federally-Collected Revenue
0.0
10.0
20.0
30.0
40.0
50.0
60.0
70.0
80.0
90.0
100.0
1990 1991 1992 1993 1994 1995 1996 1997 1998 1999 2000 2001 2002 2003 2004Years
Perc
ent
Oil Revenue (Gross)Non- Oil Revenue
Source: Derived from CBN Annual Reports.
In contrast to the previous procedures in revenue-sharing, from 1989, first line
charges were introduced by the Federal Government in the transfer of revenue from
natural resources to the Federation Account. The composition of these special
charges depended on the economic priorities of the Federal Government. First it was
named ‘stabilization fund’ which was meant to cushion the negative impact of oil
price variations in the international oil market. In other words, it served as national
savings against likely revenue drought and was intended to maintain stability in
government expenditures when oil price falls.
Beginning from 1990, several other charges were introduced against oil receipts (such
as NNPC Priority Projects3; National Priority Projects; PTF4, and External Debt
Service Funds). These first line charges were deductions which serviced specific
expenditures of the Federal Government. Ordinarily, these expenditures were
supposed to be financed from the Federal Government shares of the national income.
Subsequently, in addition to the stabilization fund, ‘excess oil revenue’ was
introduced. This was charged against oil exports earnings, petroleum profit tax and
oil royalty revenue while the modality for the charges was the difference between the
budget price and the realized price. Like the stabilization fund, it was a compulsory
3 NNPC refers to the Nigeria National Petroleum Corporation. 4 PTF refers to the Petroleum Trust Fund which was created to handle infrastructural development arising from the gains associated with the increase in domestic pump prices of petroleum products.

14 Central Bank of Nigeria Economic and Financial Review March 2006
savings designed for macroeconomic management and was usually drawdown at
regular intervals and shared among the tiers of government according to the existing
revenue-sharing formula.
Thus, between 1989 and 2004, an average of 65.7 per cent of the federation account
revenues was distributed while the balance of 34.3 percent was deductions to satisfy
some specific Federal Government expenditures and/or served as national savings.
Of this balance, deductions in respect of some Federal Government dedicated
expenditures accounted for 21.0 percent while deductions as national savings were
13.2 percent of the total federation account revenues. The relative share of the
Federal Government in the amount distributed (including special funds and other
transfers unspecified) averaged 54.5 percent while allocations to the sub-national
governments (state and local governments and allocations in respect of 13%
derivation principle) accounted for 45.5 percent in the same periods.
A breakdown of the financial statement showed that between 1989 and 1993, the
share of the proceeds of the revenue actually distributed was 58.8 percent. This
increased to 59.9 percent during 1994 to 1999 periods and since 2000 it has
increased further to 79.5 percent. This was attributed to the improved transparency
in revenue-sharing by the civilian administration; implementation of the 13.0 %
derivation and the landmark judgment of the Supreme Court in April 2002.
Subsequently, the shares of the Federal Government in the amount distributed from
the Federation Account declined from an average of 57.5 percent in 1989-1993 fiscal
years to 56.4 and 49.3 percent in 1994-1999, and 2000-2004 periods, respectively.
Conversely, the shares of the sub-national governments increased from 36.6 percent
in 1989 to 52.6 percent in 2004. On the other hand, since the inception of VAT in
1994, the sub-national governments have enjoyed higher shares and accounted for
69.1 percent of the total proceeds in the VAT Pool Account (Table 4).
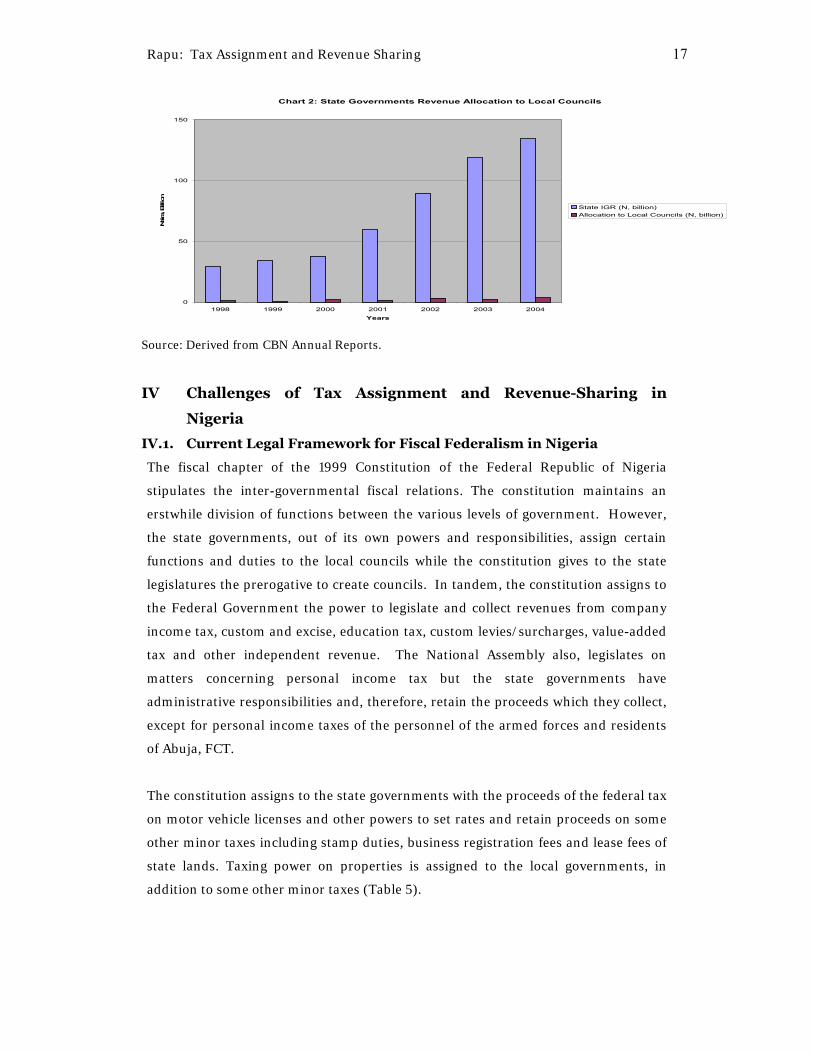
Another important assessment of the performance of revenue-sharing is the
evaluation of the rate of compliance to the mandatory 10 % allocation by the state
governments to the local governments. For example, between 1998 and 2004, an
average of 2.9 percent of total internally-generated revenue by the state governments
was allocated to the local councils across the country, indicating a shortfall of 7.3
percent. This showed that consistently, the state governments have not honored the
required lawful obligations to the local councils (Chart 2).

Rapu: Tax Assignment and Revenue Sharing 15
However, there are variations of compliance across the state governments. The long-
term implication of these variations is that the achievement of decentralization in
different states will occur at different times and nationally, could be delayed.
Nonetheless, recent actions of the Federal Government over withholding of local
councils allocations from the distributable revenue in some states is another landmark
in the fiscal relationships between the federal and state/local governments in Nigeria.

16 Central Bank of Nigeria Economic and Financial Review March 2006
1989 1990 1991 1992 1993 1994 1995 1996 1997 1998 1999 2000 2001 2002 2003 2004 In Billion Naira
Federal Account Revenue 49.3 83.5 98 185.6 187.2 190.7 294.2 343.6 364.7 347.3 712.4 1478 1703 1478 1964 3249Less:First Charge 2/ 10.2 38 44 96.2 80.3 76.6 123.6 165 157.5 103 265.9 489 568.2 58.6 143 808.3 of which Stabilization/Excess Funds 10.2 21.3 21.6 47.5 24.4 5.1 18.6 35 35 0 93 291.5 179.5 12.4 143 808.3 Others 0 16.7 22.4 48.7 55.9 71.5 105 130 122.5 103 172.9 197.5 388.7 46.2 0 0Federal Account: 3/ 39.1 45.5 54 89.4 106.9 114.1 170.6 178.6 207.2 244.3 446.5 989.3 1135 1419 1821 2441
Federally -Collected Rev.(net) 1/ 100 100 100 100 100 100 100 100 100 100 100 100 100 100 100 100Less:First Charge 2/ 20.7 45.5 44.9 51.8 42.9 40.2 42 48 43.2 29.7 37.3 33.1 33.4 4 7.3 24.9 of which Stabilization/Excess Funds 20.7 25.5 22 25.6 13 2.7 6.3 10.2 9.6 0 13.1 19.7 10.5 0.8 7.3 24.9 Others 0 20 22.9 26.2 29.9 37.5 35.7 37.8 33.6 29.7 24.3 13.4 22.8 3.1 0 0Federal Account: 3/ 79.3 54.5 55.1 48.2 57.1 59.8 58 52 56.8 70.3 62.7 66.9 66.6 96 92.7 75.1 of whichFederal Government 4/ 63.4 56.7 56.7 55.9 54.9 57.7 56 56 56 56.9 55.6 51.8 44.7 52 50.4 47.4State,Local Govts.&Derivation 5/ 36.6 43.3 43.3 44.1 45.1 42.3 44 44 44 43.1 44.4 48.2 55.3 48 49.6 52.6
VAT Pool Account 7/ (Naira Billion) 0 0 0 0 0 7.3 20.8 31 34 36.9 47.1 58.5 91.8 1.8.6 136.4 159.5Distribution:Federal 8/ 0 0 0 0 0 2 7.4 10.8 12.3 9.6 7.6 8.3 13.4 15.5 20 23.8State 0 0 0 0 0 5 6.3 11.2 13.8 16 28.7 30.6 44.9 52.6 65.9 96.2Local 0 0 0 0 0 0.3 3.6 4.6 6.8 9.2 9.6 13.9 20.1 18.7 39.6 46
Distribution:Federal 8/ 0 0 0 0 0 27.4 35.6 34.8 36.2 26 16.1 14.2 14.6 14.3 14.7 14.9State 0 0 0 0 0 68.5 30.3 36.1 40.6 43.4 60.9 52.3 48.9 48.4 48.3 60.3Local 0 0 0 0 0 4.1 17.3 14.8 20 24.9 20.4 23.8 21.9 17.2 29 28.8Source: Derived from CBN Annual Reports.
In Billion Naira
In Percent
Table 4: Composition of the Distribution of Centrally-Collected Revenue
In Percent
Rapu: Tax Assignment and Revenue Sharing 17
Chart 2: State Governments Revenue Allocation to Local Councils
0
50
100
150
1998 1999 2000 2001 2002 2003 2004Years
Naira
, Billion
State IGR (N, billion)Allocation to Local Councils (N, billion)
Source: Derived from CBN Annual Reports.
IV Challenges of Tax Assignment and Revenue-Sharing in
Nigeria
IV.1. Current Legal Framework for Fiscal Federalism in Nigeria
The fiscal chapter of the 1999 Constitution of the Federal Republic of Nigeria
stipulates the inter-governmental fiscal relations. The constitution maintains an
erstwhile division of functions between the various levels of government. However,
the state governments, out of its own powers and responsibilities, assign certain
functions and duties to the local councils while the constitution gives to the state
legislatures the prerogative to create councils. In tandem, the constitution assigns to
the Federal Government the power to legislate and collect revenues from company
income tax, custom and excise, education tax, custom levies/surcharges, value-added
tax and other independent revenue. The National Assembly also, legislates on
matters concerning personal income tax but the state governments have
administrative responsibilities and, therefore, retain the proceeds which they collect,
except for personal income taxes of the personnel of the armed forces and residents
of Abuja, FCT.
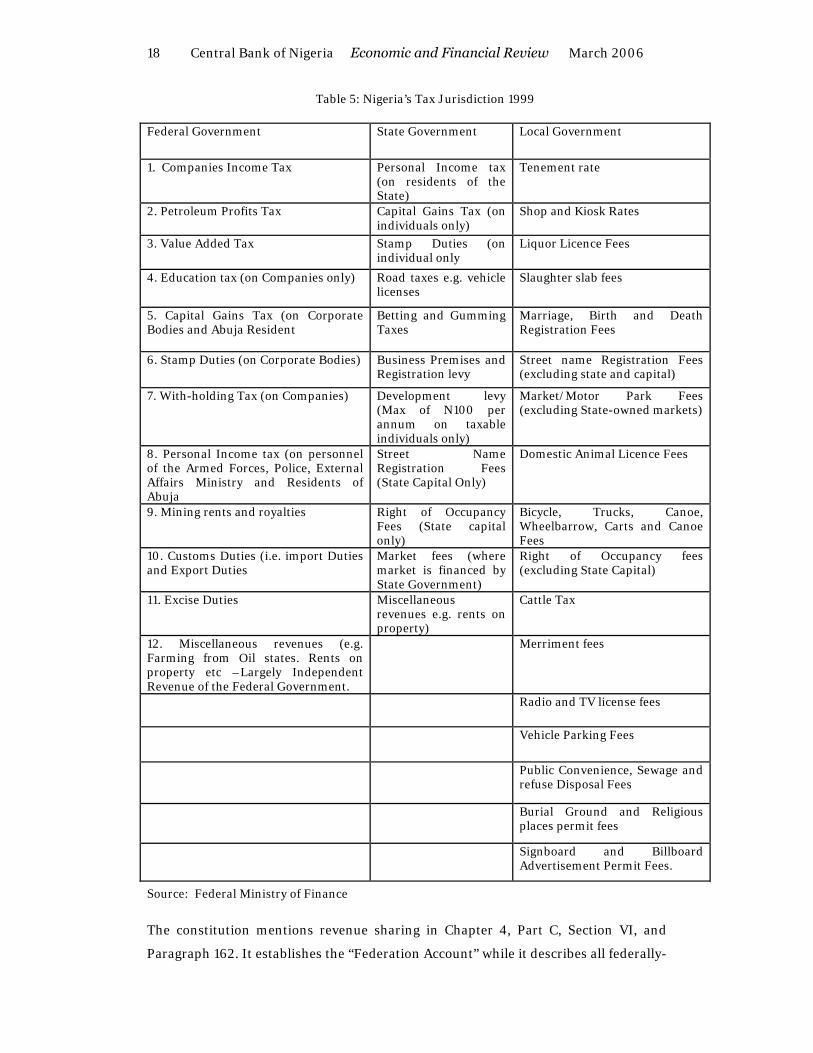
The constitution assigns to the state governments with the proceeds of the federal tax
on motor vehicle licenses and other powers to set rates and retain proceeds on some
other minor taxes including stamp duties, business registration fees and lease fees of
state lands. Taxing power on properties is assigned to the local governments, in
addition to some other minor taxes (Table 5).
18 Central Bank of Nigeria Economic and Financial Review March 2006
Table 5: Nigeria’s Tax Jurisdiction 1999 Federal Government State Government Local Government
1. Companies Income Tax Personal Income tax (on residents of the State)
Tenement rate
2. Petroleum Profits Tax Capital Gains Tax (on individuals only)
Shop and Kiosk Rates
3. Value Added Tax Stamp Duties (on individual only
Liquor Licence Fees
4. Education tax (on Companies only) Road taxes e.g. vehicle licenses
Slaughter slab fees
5. Capital Gains Tax (on Corporate Bodies and Abuja Resident
Betting and Gumming Taxes
Marriage, Birth and Death Registration Fees
6. Stamp Duties (on Corporate Bodies) Business Premises and Registration levy
Street name Registration Fees (excluding state and capital)
7. With-holding Tax (on Companies) Development levy (Max of N100 per annum on taxable individuals only)
Market/Motor Park Fees (excluding State-owned markets)
8. Personal Income tax (on personnel of the Armed Forces, Police, External Affairs Ministry and Residents of Abuja
Street Name Registration Fees (State Capital Only)
Domestic Animal Licence Fees
9. Mining rents and royalties Right of Occupancy Fees (State capital only)
Bicycle, Trucks, Canoe, Wheelbarrow, Carts and Canoe Fees
10. Customs Duties (i.e. import Duties and Export Duties
Market fees (where market is financed by State Government)
Right of Occupancy fees (excluding State Capital)
11. Excise Duties Miscellaneous revenues e.g. rents on property)
Cattle Tax
12. Miscellaneous revenues (e.g. Farming from Oil states. Rents on property etc –Largely Independent Revenue of the Federal Government.
Merriment fees
Radio and TV license fees
Vehicle Parking Fees
Public Convenience, Sewage and refuse Disposal Fees
Burial Ground and Religious places permit fees
Signboard and Billboard Advertisement Permit Fees.
Source: Federal Ministry of Finance
The constitution mentions revenue sharing in Chapter 4, Part C, Section VI, and
Paragraph 162. It establishes the “Federation Account” while it describes all federally-

Rapu: Tax Assignment and Revenue Sharing 19
collectible revenue except those classified as ‘independent revenue’ of the Federal
Government as Federation Account revenues. The National Assembly makes laws for
the distribution of the proceeds from that account. In addition, the 1999 Constitution
maintains that not less than 13 percent of mineral revenues should be transferred to
the states on the basis of derivation.
Third Schedule, Part N establishes the central finance commission - Revenue
Mobilization, Allocation and Fiscal Commission (RMAFC), with a major change in
the scope of the tasks compared with the past. Therefore, the commission is not only
to concern itself with the distribution of the divisible revenue but to suggest ways of
augmenting the revenue from other sources. In summary, it will examine the entire
gamut of issues concerning tax assignment and revenue- sharing in the country.
The constitution provides for the establishment of the state finance commission
known as the ‘State Joint Local Government Accounts Committee’. It requires that
allocations to the local councils from the Federation Account are to be paid in that
same account while the States’ Houses of Assembly make laws for the distribution
across local councils. The constitution stipulates that each state government pays a
specified percentage of its internally-generated revenue into the Joint Account. The
National Assembly is assigned with the power to specify the percentage of the state
allocation to the councils from own internal taxes and fees. However, the state
legislatures make laws for the sharing of the state allocation among the local councils.
Current allocations from the Federation Account are: Federal Government (52.68 %);
state governments (26.72%) and the local governments (20.60%). Indices for
transfers to the states and local governments have remained the same as in the 1981
Revenue Allocation Act. It is important to note that the constitution made no
mention of the VAT Pool Account and the Education Trust Fund. Rather it assumes
that proceeds from the two sources form part of the Federation Account. In addition,
the law makes it mandatory for the state governments to allocate 10% of its
internally-generated revenue to the local councils. The sharing formula varies from
state to state depending on the laws of the state legislatures (Nigeria, FR,2005).

20 Central Bank of Nigeria Economic and Financial Review March 2006
IV.2 Challenges of Tax Assignment and Revenue Sharing in
Nigeria
IV.2.1 Fiscal Imbalances- Vertical and Horizontal Fiscal Imbalances
Assessment of Vertical Fiscal Imbalance in Nigeria
The Federal Government initially generates roughly about 96.1 percent of the total
general government income. As a result a large vertical fiscal imbalance exists among
the tiers of government. For instance, in 1980- 2004 periods, the state and local
governments’ internal revenues only financed 12.1 percent of their expenditures. In
other words, about 87.9 percent of expenditures on the average were financed from
statutory and non-statutory transfers from the Federal Government. However, a
steady improvement was recorded between 2000 and 2004 periods. Thus, the sub-
national government’s total expenditure was financed to the tune of 9.9 percent from
its own internal revenue sources compared with 1.5 percent during 1993-1999
financial years (Table 6).
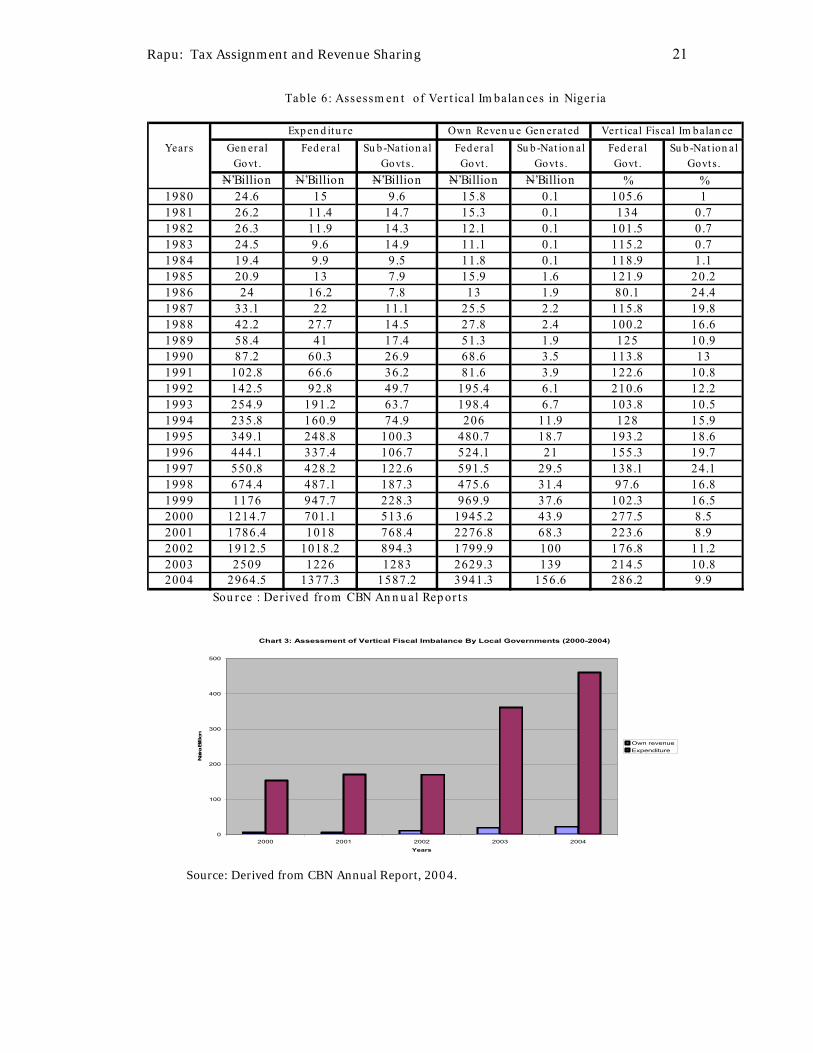
Similarly, studies on local government finance point out that that level of
government’s internally-generated revenues are able to meet minuscule portion of
the total expenditures, which is anywhere between 0.4 and 0.6 percent. In other
words, the administration of local taxes is unsatisfactory, reflected in low collections
of taxes and fees, and the inability of the local councils to periodically adjust the
property values, tax rates, and user charges. The implication is a wide gap between
revenue generated and expenditure, which explains a large vertical fiscal imbalance
when compared with other levels of government (Chart 3).
Rapu: Tax Assignment and Revenue Sharing 21
Exp en d itu reYears Gen eral Fed eral Su b -Nat ion al Fed eral Su b -Nat ion al Fed eral Su b -Nat ion al
Govt . Govt s . Govt . Govt s . Govt . Govt s .N’Billion N’Billion N’Billion N’Billion N’Billion % %
1980 24.6 15 9.6 15.8 0.1 105.6 11981 26.2 11.4 14.7 15.3 0.1 134 0.71982 26.3 11.9 14.3 12.1 0.1 101.5 0.71983 24.5 9.6 14.9 11.1 0.1 115.2 0.71984 19.4 9.9 9.5 11.8 0.1 118.9 1.11985 20.9 13 7.9 15.9 1.6 121.9 20.21986 24 16.2 7.8 13 1.9 80.1 24.41987 33.1 22 11.1 25.5 2.2 115.8 19.81988 42.2 27.7 14.5 27.8 2.4 100.2 16.61989 58.4 41 17.4 51.3 1.9 125 10.91990 87.2 60.3 26.9 68.6 3.5 113.8 131991 102.8 66.6 36.2 81.6 3.9 122.6 10.81992 142.5 92.8 49.7 195.4 6.1 210.6 12.21993 254.9 191.2 63.7 198.4 6.7 103.8 10.51994 235.8 160.9 74.9 206 11.9 128 15.91995 349.1 248.8 100.3 480.7 18.7 193.2 18.61996 444.1 337.4 106.7 524.1 21 155.3 19.71997 550.8 428.2 122.6 591.5 29.5 138.1 24.11998 674.4 487.1 187.3 475.6 31.4 97.6 16.81999 1176 947.7 228.3 969.9 37.6 102.3 16.52000 1214.7 701.1 513.6 1945.2 43.9 277.5 8.52001 1786.4 1018 768.4 2276.8 68.3 223.6 8.92002 1912.5 1018.2 894.3 1799.9 100 176.8 11.22003 2509 1226 1283 2629.3 139 214.5 10.82004 2964.5 1377.3 1587.2 3941.3 156.6 286.2 9.9
Own Reven u e Gen erat ed Ver t ical Fiscal Im balan ce
Sou r ce : Der ived from CBN An n u al Rep or t s
Table 6: Assessm en t of Ver t ical Im balan ces in Niger ia
Chart 3: Assessment of Vertical Fiscal Imbalance By Local Governments (2000-2004)
0
100
200
300
400
500
2000 2001 2002 2003 2004Years
Nai
ra B
illio
n
Own revenueExpenditure
Source: Derived from CBN Annual Report, 2004.

22 Central Bank of Nigeria Economic and Financial Review March 2006
Assessment of Horizontal Fiscal Imbalance in Nigeria
The wide disparities in tax bases available to each state produce large differences in
internal revenue efforts across the state governments. This is attributed to the
differences in resource endowments, expenditures, infrastructures and efficiency of
tax administration among the states. Thus, it accounts for the large horizontal fiscal
imbalance observed in the federation. The financial statements of the state
governments showed that only Lagos State generated internal revenue that was able
to cover an average of 48.4 percent of its expenditure (recurrent and capital
expenditures) in 2001-2004. Of the remaining 35 states, only 9 had internal
resources that covered 10 percent of total expenditures on the average in the same
period while the rest had revenues that were only able to cover less than 10 percent of
expenditures (Table 7).
The major challenge, therefore, is how to design a good inter-governmental transfer
system that can reduce the vertical and horizontal fiscal disparities without a threat
to secession or break-up being considered. A review of the constitutional
responsibilities of the different levels of government with taxes assigned shows a
great divergence. The assigned responsibilities to the state and local governments
were mainly social services in nature requiring huge financial outlays (Table 8).
Analysis of the consolidated general government social sector expenditure showed
that, on the average, the sub-national governments accounted for 61.3 percent of the
total in 1998-2004. Apart from 1998 and 2002 fiscal years, the shares of the Federal
Government expenditure on social services were lower than that of the sub-national
governments in all other years under review (Table 9).
This reflects a huge burden on the sub-national governments if the country is to
achieve the Millennium Development Goals (MDGs) by the year 2015. In summary,
they will require additional resources either as statutory transfers from the federally-
collectible revenue or they should be assigned with some of the high-yielding taxes.

Rapu: Tax Assignment and Revenue Sharing 23
Table 7: Assessment of Horizontal Fiscal Imbalance in Nigeria
Internal Revenue (N'Billion) Total Expenditure (N'Billion) Horizontal Fiscal Imbalance (Percent)
State 2001 2002 2003 2001 2002 2003 2001 2002 2003 Average
Abia 2.2 0.8 0.8 16.1 14.6 17.0 13.7 5.5 4.7 7.9
Adamawa 0.5 0.4 0.7 11.9 7.1 23.7 4.2 5.6 3.0 4.3
Akwa-Ibom 0.6 2.6 3.9 28.2 32.5 56.7 2.1 8.0 6.9 5.7
Anambra 0.6 1.6 2.4 10.8 26.2 23.7 5.6 6.1 10.1 7.3
Bauchi 0.9 0.7 0.7 13.3 11.9 13.4 6.8 5.9 5.2 6.0
Bayelsa 0.3 0.5 0.5 22.6 34.1 28.0 1.3 1.5 1.8 1.5
Benue 1.6 0.7 0.7 12.6 14.4 16.4 12.7 4.9 4.3 7.3
Borno 0.8 0.7 0.9 15.5 20.6 23.1 5.2 3.4 3.9 4.2
Cross River 0.8 2.2 1.2 14.0 21.6 14.5 5.7 10.2 8.3 8.1
Delta 8.2 6.0 6.3 57.2 63.0 67.2 14.3 9.5 9.4 11.1
Ebonyi 0.2 0.2 0.3 12.0 16.9 15.5 1.7 1.2 1.9 1.6
Edo 0.2 - 1.5 10.5 - 17.3 1.9 - 8.7 3.5
Ekiti 0.2 1.4 0.4 8.1 18.3 10.4 2.5 7.7 3.8 4.7
Enugu 2.2 1.4 1.9 11.8 12.3 17.7 18.6 11.4 10.7 13.3
Gombe 0.5 0.7 1.6 11.7 8.6 17.9 4.3 8.1 8.9 7.1
Imo 1.2 1.2 1.9 16.9 22.4 31.2 7.1 5.4 6.1 6.2
Jigawa 1.1 1.1 0.4 11.5 24.3 16.1 9.6 4.5 2.5 5.5
Kaduna 1.7 1.3 7.1 15.7 24.6 39.9 10.8 5.3 17.8 11.3
Kano 4.3 7.4 2.9 25.3 39.7 44.4 17.0 18.6 6.5 14.1
Katsina 1.1 2.4 1.1 13.6 18.6 12.4 8.1 12.9 8.9 10.0
Kebbi 0.2 0.7 0.5 9.8 14.7 7.6 2.0 4.8 6.6 4.5
Kogi 0.6 1.2 2.0 11.0 19.5 26.0 5.5 6.2 7.7 6.4
Kwara 1.5 0.6 2.2 13.3 16.5 17.7 11.3 3.6 12.4 9.1
Lagos 12.5 29.4 48.4 35.4 58.2 81.5 35.3 50.5 59.4 48.4
Nassarawa 0.9 0.3 0.8 11.3 9.8 13.2 8.0 3.1 6.1 5.7
Niger 0.5 - 0.6 10.7 - 14.8 4.7 - 4.1 2.9
Ogun 2.2 2.6 2.7 17.4 15.6 17.6 12.6 16.7 15.3 14.9
Ondo 1.1 1.1 3.1 21.2 20.1 38.8 5.2 5.2 8.0 6.2
Osun 1.8 2.3 2.0 11.5 18.9 14.2 15.7 12.2 14.1 14.0
Oyo 1.5 1.9 3.5 12.7 10.1 18.9 11.8 18.8 18.5 16.4
Plateau 0.7 1.8 3.2 13.1 19.9 24.4 5.3 4.0 13.1 7.5
Rivers 3.3 12.6 8.8 29.2 37.9 70.2 11.3 33.2 12.5 19.0
Sokoto 0.5 0.8 1.4 11.0 13.1 15.5 8.2 6.1 9.0 7.8
Traba 0.4 0.4 0.5 12.4 10.7 13.8 3.2 3.7 3.6 3.5
Yobe 0.3 0.5 0.5 12.9 11.5 16.0 2.3 4.3 3.1 3.3
Zamfara 0.9 1.2 1.4 10.1 12.2 15.1 8.9 9.8 9.3 9.3

24 Central Bank of Nigeria Economic and Financial Review March 2006
For one thing, the current horizontal revenue–sharing formula favors those states
that already have economic and social infrastructures in place. For example, the
number of hospital beds and school enrolments are positively related to individual
state’s stage of development. Certainly, there is no basis for comparison in terms of
the number of hospital beds and schools enrolment in Jigawa State with that of Kano
State, from where the former was carved out. The revenue-sharing based on
internally-generated revenue, population and land mass, again, tend to also favor the
well-established states with good economic infrastructure, higher population, and
bigger land areas.
Thus, apart from those state governments’ allocations influenced by allocations under
derivation principle on natural resources revenue, allocations to the well-established
states are much higher than the fiscally–disadvantaged state governments. In a
nutshell, the existing horizontal revenue-sharing indices cannot achieve the
equalization effect across states and local governments as anticipated by the Federal
Government. The overall effect is the increasing disparities and uneven development
across states and local governments in the country (Chart 4).

Rapu: Tax Assignment and Revenue Sharing 25
Table 8: Assignments of Responsibilities in the 1999 Constitution
EXCLUSIVE LEGISLATIVE LIST CONCURRENT LIST RESIDUAL LIST* Federal Government State Governments Local Governments Accounts of the Federation Allocation of revenue Sewage Disposal
Arms, Ammunition, Defence and National Security
Antiquities and monuments Environmental Sanitation
Aviation, Railways, Federal Trunk Roads and Maritime matters
Archives Maintenance of Feeder Earth Roads
Immigration & Internal Affairs Collection of taxes Primary Education
Financial laws, and currency Issue & Exchange Control
Electoral Law Payment of Salaries
Census, National Honour & Citizenship Electric power Market Stalls
Foreign Affairs and International Treaties Exhibition of cinematograph films
Rural Health
Creation of States & regulation of political parties National and State elections
Industrial, commercial Crafts and Small Scale Industries.
Mining & National Parks Or agricultural development
Labour, and Public service of the federation Scientific and Technological Research Statistics
Patents & trademarks Trigonometrical, cadastral and topographical surveys
Legal Proceeding between governments in the federation
University, Technological and Post Primary Education
Establishment of federal agencies
Telecommunications
Public debt of the Federation
Management of territorial waters
Weights and Measures
International trade and commerce
Formulation, annulment and dissolution of manage
Nuclear Energy
Stamp Duties
*Derived from the residual list for states.
Table 9: Social Sector Expenditure Profile in Nigeria 1998 1999 2000 2001 2002 2003 2004
Capital Exp. On Soc. Service (N Billion)
44.7 51.2 77.7 176.3 416.1 491 497.6
Share of Federal Govt. (percent) 52.3 33.8 36 30.2 53.3 32.2 33.1
Share of State/Local Govt. (percent)
47.7 66.2 64 69.8 46.7 67.8 66.9
Sources: CBN Annual Reports

26 Central Bank of Nigeria Economic and Financial Review March 2006
Source: Federation Account Files January-December, 2005.
Against this backdrop, several agitations have emerged that must be addressed by the
Federal Government for a stable federal system. These include:
¬ agitations on the control of exploitation of natural resources by the state
governments as obtained before independence;
¬ agitations on the increase of the percentage share of the principle of derivation
in the distribution of VAT proceeds;
¬ agitations against the use of number of local governments under the equality
principle in the distribution of the shares of that tier of government from the
proceeds of the Federation and VAT Pool Accounts. The arguments have been
that there are wide gaps in revenue receipts among local councils by states.
Thus, state governments with larger number of councils (mostly old states)
receive more under the above mentioned principle compared with those states
with smaller numbers of councils (new states);
¬ agitations on the non-distribution of other non-oil revenue sources of the
Federation Account on the basis of derivation. The most important non-oil
taxes except VAT include company income and customs and excise taxes. The
formula for allocation of custom and excise duties, and company income tax
did not give any weights to derivation;
Chart 4: Total Statutory Allocations To State Govets. in 2005
0.0
10.0
20.0
30.0
40.0
50.0
60.0
70.0
80.0
90.0
100.0
110.0
ABIA
ADAMAW
A
AKW
A IB
OM
ANAMBR
A
BAUCHI
BAYE
LSA
BENUE
BORNO
CROSS RIV
ER
DELTA
EBONYI
EDOEK
ITI
ENUGU
GOMBEIM
O
JIGAW
A
KADUNA
KANO
KATS
INA
KEBB
I
KOGI
KWAR
A
LAGOS
NASAR
AWA
NIGER
OGUN
ONDOOSU
NOYO
PLAT
EAU
RIVER
S
SOKO
TO
TARAB
A
YOBE
ZAMFA
RA
State Governments
Nai
ra B
illio
n
Statutory Allocation

Rapu: Tax Assignment and Revenue Sharing 27
¬ agitations for the inclusion of receipts of education and value–added taxes
proceeds as part of the Federation Account, according to the intentions of the
1999 Constitution;
¬ suggestions that personal income tax administration and collection should be
transferred to the Federal Government for better compliance and enhanced
revenue;
¬ agitations by the state governments on the reviews of the vertical and
horizontal revenue-sharing systems.
IV.2.2. Enforcing Compliance with the Law on Allocation of 10 percent
Internally-Generated Revenue to the Councils by the State Governments.
Another major challenge of tax assignment and revenue-sharing in Nigeria is the
enforcement of compliance by the state governments to allocate 10 percent of their
internally-generated revenue to their local councils. The existence of vertical fiscal
imbalance in respect of state governments and local governments, and horizontal
imbalance across local governments has necessitated this constitutional requirement.
The local governments serve as the grassroots governments and, therefore, a lot of
social services expenditure burden is placed on them. This will, therefore, require a
substantial transfer of funds from the state governments to the local councils in
addition to the statutory and non-statutory transfers from the Federal Government to
enable them meet their expenditure expectations on the MDGs. Evidence has shown
that the state governments over the years have continued to flout this requirement.
Hence, the task before the Federal Government is on how to ensure compliance with
the constitutional provision and the law
IV.2.3. Modality for the Sharing of Transfers from Federation Account to
Local Councils by the State Governments
Recent developments point to the confusion emanating from the constitution in
terms of the sharing of the allocations from the statutory accounts among the local
governments in the states. Whereas the constitution grants the state legislatures the
powers to make laws for the distribution of these transfers, the Federal Government
is insisting that the transfers are exclusively, meant for those local councils created
before the 1999 Constitution. This controversy emerged as a result of the
unprecedented creation of local governments by the state governments. Meanwhile,
the state governments are invoking their powers in the constitution to create local
councils.

28 Central Bank of Nigeria Economic and Financial Review March 2006
This impasse has resulted in most of the cases, the withholding of the shares of the
councils from the centrally-distributable revenue in some of the states. The
development, therefore, does not augur well for the good governance at the level of
the councils and could delay the decentralization process. In this regard, the major
challenge for the Federal Government is to find a permanent solution to this problem
in the interest of the local government administration and finances.
IV.2.4. Establishment of a Good Statistical Base for the Horizontal
Revenue-Sharing Across State and Local Governments
Good revenue-sharing arrangements without an acceptable statistical base for
calculating the indices for each sub-national government, for the purpose of
determining each government share, could also generate tension and confusion. This
was a major impediment in the implementation of the fine recommendations of Louis
Chicks Fiscal Commission of 1953. Thus, the current task before the Federal
Government is on how to generate a good data for the horizontal distribution of
federally-collectible revenue to the sub-national governments.
IV.3 Policy Options for Reforms of Tax Assignment and Revenue-
Sharing Arrangements in Nigeria
IV.3.1. Increasing the Fiscal Capacities of the States and Local
Governments
The current debate is that, sub-national governments in Nigeria, lack the financial
capacities to carry out some of the assigned responsibilities and, therefore, the
suggestion is to trim down these responsibilities. However, this will move Nigeria
towards a unitary system of government. With this regard, the option is to improve
the sub-national governments’ fiscal capacities through partly, modifications of
assigned taxes and introduction of other more reliable taxes as follows.
The introduction of state excise taxes on alcoholic beverages and tobacco products is
a good example for new tax assignment to the state governments. This form of tax
would be politically acceptable as a means of financing state governments’
expenditures on health care services. The new tax system is expected to be a
residence-based tax and does not eliminate excise tax by the Federal Government
(such as practiced in Mexico)5.
In particular, personal income taxes form a major component of tax assignment to
5 See Walsh C., 1996 pg 115

Rapu: Tax Assignment and Revenue Sharing 29
the state governments. Evidence over the years has shown that yields from the
personal income have been low. Consequently, in view of the performance of VAT
compared with the former sales tax, there are new suggestions that the Federal
Government should be encouraged to takeover the administration of personal income
tax. However, we differ with this suggestion, rather we proffer that the powers to set
rates, in addition to the existing administrative responsibilities should be transferred
to the state governments. This will enable them to adjust rates, depending on their
economic circumstances and revenue needs.
The constitution has recognized that property rate is intrinsically local in character
and assigns it to the local governments. However, concerned with the stagnation in
yields from the tax, we suggest a reform in this regard on the grounds of cost
efficiency and higher compliance rate. Thus, the administration of property tax
should be placed under the purview of the state governments while the proceeds
should be given to the local councils, with a surcharge of not more than 10.0 percent
to cover administrative costs. Thus, besides increasing revenue, it will also reduce tax
evasion and avoidance. Another area in which the councils could increase their tax
revenue is through entertainment tax on birthdays and burial ceremonies, taxes on
advertisement in their localities, and cost recovery charges, such as tolls for use of
local roads and other user charges. Again, more substantial taxes on fairs and
markets or a local business license tax (as practiced in Germany) based on actual
turnover could be pursued by the local councils to enhance their internal revenue
base.
IV.3.2 Inclusion of the Education Tax and VAT in the Federation Account
One thing that has emerged clear with the coming into force of the 1999 Constitution
is that the fate of the Education Trust Fund cannot be different from that of the
Petroleum (special) Trust Fund. By extension education tax revenue is now part of
the Federation Account Revenue and should be paid into that account. The VAT Pool
Account should be abolished and merged with the Federation Account for simplicity
and transparency as well as in conformity with the constitutional provisions.
IV.3.3 Review of the Vertical Distribution Formula
To further boost statutory transfers to the sub-national governments, the revenue-
sharing formula should be reviewed. A notable feature of Nigeria’s federal fiscal
arrangements is the multiple channels of transfers from the Federal Government to
the sub-national governments. Some are statutory transfers such as the Federation

30 Central Bank of Nigeria Economic and Financial Review March 2006
Account and VAT revenues while others are plan transfers in the form of grants-in-aid.
Plan transfers include transfers from education tax revenue and transfers in respect of
Universal Basic Education (UBE), Basic Primary Healthcare and others. Therefore,
considering the needs of the states and local councils to meet their different
expenditure outlays, this paper considers a consolidated revenue transfers that is
based on a tax-by-tax sharing system. However, the percentage allocation to each tier
of government can be determined by proper bargaining, depending largely on the
expenditure needs of each tier of government on social services, internal security and
defense. We, therefore, suggest a sharing formula below:
Table 10: Suggested Vertical Distribution of Revenue in the Nigerian Federation (in percent)
Federal State Local Councils Derivation Total Oil Taxes & Revenue 52.5 32.5 15.0 20.0 100.0
Company Income Tax 50.0 50.0 - 5.0 100.0
Customs & Excise 50.5 30.0 19.5 5.0 100.0
Value -Added Tax 30.0 40.0 30.0 20.0 100.0
Education Tax 30.0 70.0 - - 100.0
Average 42.6 44.5 12.9 - 100.0
The suggested vertical distribution in Table 10 is based on the following assumptions:
• that the funding of primary education should revert to the states while the
federal and local councils participations are restricted to design and
implementation, respectively. Basically, from experience over the years, the
local councils lack the capacities to have this function assigned to them not
only in terms of funding, but also administration;
• that the state governments’ expenditure on social infrastructures will continue
to rise and remain higher than that of the Federal Government;
• derivation should apply on a tax-by-tax basis and directly on the outstanding
receipts before distribution. In view of this, derivation becomes a first charge
on all revenue items except for education tax. This is mainly to serve as an
incentive to state governments;
• this formula assumes the exclusion of special funds;
• the inclusion of education tax and VAT revenues in the federation account and
the abolition of the individual taxes disbursement mechanisms;
• education tax should strictly be earmarked for the purpose except if abolished
under the new tax reforms; and
• that the state governments should adjust regularly, the amount of state
allocation to the councils.

Rapu: Tax Assignment and Revenue Sharing 31
The new options allocates to the Federal Government (42.6%), state governments
(44.5 %), and local governments (12.9%) of total federally-collectible revenue. The
objective here is to increase statutory transfers and decrease grants. This
generally will remove the political-influence factors associated with federal grants
in the inter-governmental transfers. Thus, the consolidation of all transfers as
statutory revenue-sharing makes these transfers explicit and predictable.
IV.3.4 Review of the Horizontal Revenue-Sharing Formula
Revenue-sharing across the sub-national governments can be shared on a tax-by-tax
basis, applying different weights and principles. The table below attempts to play
down on most of the objections facilitating agitations in the horizontal revenue-
sharing system. The suggested distribution profile did not recognize the principle of
tax efforts while it de-emphasized the principle of geographic area
(landmass/terrain). For instance, emphasis on equality principle is to help those
disadvantaged sub-national governments with low per capita income compared with
national standard to have more fund for infrastructural development, thereby,
encouraging private investment to boost economic activities in their respective states
and local councils. If the emphasis placed on the principles of equity is adopted it will
achieve the equalization effect across the sub-national governments and reduce
considerably the unintended advantages to the well-established states and local
councils in the current distribution system.
Under the principle of social development factors, there is a recognition of the inverse
of all the sub-factors and considerable weight given to them. It is believed that the
implementation of this will encourage an even social development across the sub-
national governments. These principles and the associated percentages are also,
recommended for revenue distribution to local governments. However, the use of the
number of local governments under equality of states should be abrogated since the
power to create local governments has been reverted to the state governments.
Table 11: Suggested Horizontal Distribution of Revenue in Nigeria
Revenue Sources Population Landmass/ Terrain
Equality Social Factor
Inverse of Social factor
Total
Oil Taxes & Revenue
20 5 60 5.5 9.5 100
Company Income Tax
10 10 60 10 10 100
Customs & Excise 30 0 60 5 5 100
Value Added Tax 25 0 60 7.5 7.5 100
Education Tax 0 0 40 30 30 100

32 Central Bank of Nigeria Economic and Financial Review March 2006
IV.3.5 Compelling the State Governments to Allocate the Mandatory 10
% of their Internal Revenue to the Local Councils
The Federal Government should establish a standard format to enable it monitor this
aspect of the constitution and stiff penalty stipulated in the law. For instance, it could
be recommended that failure to comply, the fiscal commission should deduct the
outstanding amounts from individual state government’s share from the Federation
Account. Thus, the States House of Assembly should endeavor to monitor the
compliance of the law. In addition, the state finance commission should be properly
constituted. Rather than allow the officials of the state’s ministry of finance to
dominate the committee, it should be made an independent body like the RMFAC.
The objective of these reforms is to make the transfer system predictable, measurable
and transparent. The proportion for distribution should be automatically adjustable
to inflation. Although the criteria for distribution among the local councils need to
vary from state to state because of differences in local situations, this should not be
an impediment to the earlier achievement of decentralization in the country.
Consequently, we suggest this framework below for adoption according to local
conditions.
Table 12: Framework for Revenue-Sharing to LGs. Criteria Weights Derivation 10% Population 30% Equality 30% Own revenue efforts 10% Geographic Area: 10% Rural Area -4% Urban Area -6% Social Factors: 10% Direct -5% Inverse -5%
The principles underlying this framework, is that apart from the size of local
governments represented by the population and geographical area (which are major
determinants of the financial needs of the councils), revenue-sharing should be
complemented by set of criteria, which measure efficiency by the revenue-generating
efforts of local councils, and equity by the level of local income per capita. Thus, the
equity principle favors the fiscally-disadvantaged councils while the former is an
encouragement to those high revenue-generating councils for their efforts.

Rapu: Tax Assignment and Revenue Sharing 33
IV.3.6 Constitutional Amendment on the Distribution of Proceeds from
the Federation Account
The Federal Government should pursue vigorously the amendment of the
constitution in the area of the power of the state legislatures to create local councils.
Thus, the National Assembly can be given the confirmation authority based on the
available resources. The main implication of the excessive creation of councils is that,
the available funds will be spent on mere administration rather than on economic
and social infrastructures. Thus, there is the need to amend the chapter of the
constitution dealing with the creation of local councils for a proper decentralization
in Nigeria.
The Federal Government through the RMFAC should establish a good and acceptable
statistical base for the purpose of revenue-sharing across the sub-national
governments. This is in terms of derivation, population, and geographic area. This
should also, be reviewed at regular intervals through independent surveys.
V Summary and Conclusion
The paper described the basis of tax assignment and revenue sharing in a federal
system. The evolution of tax assignment and revenue-sharing arrangements in
Nigeria were also discussed. The result of the review indicates that in the earlier
periods of the Federation, fiscal decentralization was encouraged by granting high
revenue-yielding taxes to the regions. However, with the coming of military rule in
1966 marked the beginning of the erosion of the taxing powers of the sub-national
governments and the concentration of national financial resources in the hands of the
Federal Government. Consequently, from 1967/68 fiscal year, a notable feature has
been the growing vertical and horizontal fiscal imbalances in the Federation in terms
of fiscal capacities of the various levels of government and across the federating units.
These have generated debates threatening the existence of the nation and suggesting
a likely break-up.
The introduction of democratic rule in 1999 has generated new issues namely:
inadequate fiscal autonomy for the states and local governments, poor federation
account distribution formula, lack of fairness in the distribution of non-oil federal
taxes, the control of the exploitation of natural resources, etc. Options were proffered
for reforms in the financial transactions and the fiscal relationships in the Federation.
These suggestions include: the strengthening of state internal revenue bases through
the introduction of state excise taxes on alcoholic beverages and tobacco products,

34 Central Bank of Nigeria Economic and Financial Review March 2006
etc; adjustments on the vertical and horizontal revenue-sharing formula; adoption of
a tax-by-tax sharing system; entrenchment of the derivation principle in the
distribution of all revenues collected centrally; the transfer of education tax to the
federation account and the merging of VAT revenue with the same account; effective
compliance with the allocation of the mandatory 10 % of state governments’
internally-generated revenue; the amendment of the constitution to reduce the
powers of the state legislatures to create local governments; and the establishment of
an acceptable statistical base for revenue distribution across state and local
governments.
The paper concludes that changes to the existing tax assignment and revenue-sharing
arrangements will go a long way in protecting our nascent democracy. It will also
reduce agitations and tensions in the system while it will facilitate the stable
provisions of public services across the sub-national governments.

Rapu: Tax Assignment and Revenue Sharing 35
References
Ahmad E. and Raju Singh (2003): Political Economy of Oil-Revenue Sharing in a Developing Country: Illustrations from Nigeria, IMF Working Paper No. 03/16, January 2003.
Alberto Diaz – Cayeros and Charles E. Mclure, Jr(2000): Tax Assignment: In Achievements and Challenges of Fiscal Decentralization; Lessons from Mexico edited by Marcelo M. Giugale and Steven B. Webb The World Bank Washington D.C. May 2000.
Ashwe Chiichii (1986): Fiscal Federalism in Nigeria: Research Monograph No. 46 Canberra Centre for Research on Federal Financial Relations, Australian National University.
Bird, Richard M., (1990): Federal-Provincial Fiscal Arrangement: Is there an agenda for the 1990s? ‘In Canada: ‘The state of the Federation. 1990, edited by Ronald L. Walt and Dunglas M. Brown (Kengitus,Ontario: Institute of Inter-governmental Relations, Queen’s University.
Broadway, Robin and Paul Hobson, (1993): Intergovernmental Fiscal Relations in Canada: Canadian Tax Foundation, Toronto.
Casella, Alessandra & J Feinstein (1990): Public Good in Trade: On the Formation of Markets and Political Jurisdiction:’ NBER Working Paper No.3554 (Cambridge, Massachusetts: National Bureau of Economic Research).
Central Bank of Nigeria (2000): Changing Structure of Nigeria Economy; 2000.
Cremer, Jacque, Antom Estach and Paul Seabright (1994): The Decentralization of Public Services: Lessons from the Theory of the Firm: Policy Research Working Paper 1345, Office of the Vice President, Development Economics, World Bank,Washington D.C
Ikein, Augustine and Comfort Briggs-Anigboh (1998): Oil and Fiscal Federalism in Nigeria: The Political Economy of Resources Allocation in a Developing Country (Aldershot, United Kingdom; Ashgate).
Le Breton, Michel and Shlomo Weber (2001): The Art of Making Everybody Happy: ‘How to Prevent Secession’ Working Paper No. 01/176, November, 2001.
Marcelo Giugale, et al (2000): Overview of Fiscal Decentralization in Mexico: In Achievements and Challenges of Fiscal Decentralization; Lessons from Mexico edited by Marcelo M. Giugale and Steven B. Webb, The World Bank Washington D.C. May 2000.
Martinez- Vasquez, Jorge, Charles E. Mclure, Jr and Sally Wallance (1995): Sub-national Fiscal Decentralization in Ukraine: ‘In Richard M. Bird, Robal Ebel and Christine I. Wallich, edited. Decentralization of the Socialist States; Inter-governmental Finance in Transition Economics, Washington, DC; World Bank, pp 281-319.

36 Central Bank of Nigeria Economic and Financial Review March 2006
May R. J. (1996): Federalism and Fiscal Adjustment’: Glanenton Press, Oxford pp 55-99
Nigeria, Federal Republic (1980): Report of the Presidential Commission on Revenue Allocation: Main Report (Apapa, Federal Government Press)
Nigeria, Federal Republic (2002): Report of the Supreme Court Judgment on Revenue Allocation April 2002.
Nigeria, Federal Republic (2005): Federation Account Allocation Committee Files: January- December, 2005.
Oates W.C (1972). Fiscal Federalism: New York, Harcourt, Brace,Jovanuricts.
Okunrounmu, T.O. (1996): Fiscal Federalism: In Nigeria’s Prospects for Development a.k.a. Vision 2020: Proceedings of the Workshop organized by the CBN/World Bank Collaborative Study, April15-17, 1996.
Shar, Anwar (1998): Fiscal Decentralization an Elusive Goal? A case study of Indonesia and Pakistan Experiences: Presented at the International Conference on Fiscal Decentralization on developing Countries.
Tabellini, Guido and Torstein Persson (1996): Federal Fiscal Constitutions: Risk –Sharing and Redistribution: Journal of Political Economy Vol. 104 pp979-1009.
Tanzi Vito (1995): Fiscal Federalism and Decentralization and Macroeconomic Aspects: Annual World Bank Conference ed. Micheal Bren and Book Plaskovic: The World Bank Washington DC 1995.
Ter Minassian, Teresa (1997): Fiscal Federalism in Theory and Practice: IMF, Washington
Walsh, Cliff (1996): Making a Mess of Tax Allocation: Australia: A case study ‘In Paul Boothe, ed., Reforming Fiscal Federalism for Global Competition: A Canada - Australian Comparison, Calgary Western Center for Study in Economics Policy.
Central Bank of Nigeria Economic and Financial Review Volume 44/1 March 2006 37
Perspectives on the European Monetary Union: Lessons for the Economic Community of West African States (ECOWAS)
J. E. L Sagbamah∗
The attainment of the European Monetary Union (EMU) under the auspices of the European Union
(EU) was a product of effective planning and sequencing of programmes. The establishment of
political institutions such as the European Council, Assembly, Court of Justice and, particularly, the
European Commission provided the general framework and direction for the achievement of the EMU.
In addition, specialized institutions such as the Sectoral Commissions, European Monetary Institute
(which was later transformed into the European Central Bank) and the European System of Central
Banks provided technical support for driving the EMU project. These institutions nurtured and
fostered the political, social, market, financial, infrastructural, production, economic and monetary
sectors of integration. The EU experience had significant integration implications for currency, money
market, capital market, foreign exchange market, reserves management and economic policy. It also
had implications for the non-EMU members referred to as the derogation countries. The overall EU
experience has profound and important lessons for the Economic Community of West African States
(ECOWAS) in its drive to provide the needed political will, social enlightenment campaign and
mobilization for the acceptance of integration, as well as the provision of standardized products and
financial markets. It also reveals the levels of basic infrastructure, production and overall economic
structure that are needed to be in place, before transiting into a monetary union.
Keywords: European Monetary Union, ECOWAS, Integration JEL Classification Numbers: FO, F59 Author’s e-mail: [email protected]
I. Introduction
or about 30 years of its existence, the Economic Community of West African
States (ECOWAS) has been saddled with the task of integrating the
economies of member countries. The initial programme envisioned for
ECOWAS integration was to achieve a common market, a much higher level
of integration than a free trade area or a customs union.
∗ The author is a Senior Economist with the Monetary Policy Department, Central Bank of Nigeria. The views expressed herein do not represent the views of the institution to which the author is affiliated. The author acknowledges the comments and suggestions of anonymous reviewers. All remaining errors are the author’s responsibility
F

38 Central Bank of Nigeria Economic and Financial Review March 2006
However, the ultimate ambition of the founding fathers was to transit further from a
common market to an economic and monetary union, the highest level of integration.
At the level of a common market, ECOWAS members were expected to dismantle
tariffs, ensure free movement of goods and services, free mobility of labour and
capital. These would foster the exchange of ideas, improve financial intermediation,
promote technological advancement, ensure efficient resources allocation and
engender higher level of production of goods and services for a larger market that will
emerge in the sub-region. Such an enlarged market will provide the benefits of
comparative advantage and economies of scale. These were the ideals and other basic
architecture which the European Union (EU) provided before implementing the
monetary union.
In the case of the ECOWAS, the progress made since its establishment through the
Treaty of Lagos on May 28, 1975, has been unimpressive. For instance, the ECOWAS
trade liberalization scheme intended to free trade, facilitate human and capital
mobility has met with limited success. Tariffs have not been dismantled by members
who have continued to administer different customs declarations and valuation
methods. As such, few countries that have complied with the tariffs and customs
harmonization are losing revenue. In deed, those losing revenue are not being
compensated to encourage them in implementing the scheme further. Numerous
check points exist on roads and ports where taxes of various descriptions are extorted
from commuters. Also, the lack of transportation and telecommunications networks,
linking member states, have not only impeded trade but also increased the cost of
doing business. Furthermore, the non-harmonization of trade and investment
policies in the sub-region has discouraged investors in establishing businesses in
member states. Some member countries still pay allegiances to their colonial masters
and thus, maintaining strong trade links with Europe rather than with regional
members. Consequently, intra-regional trade has been limited in scope. The
inefficiency of the existing clearing system, the lack of political will on the part of
ECOWAS member states and the existence of other sub-regional monetary unions
within the ECOWAS, have all contributed to the poor performance recorded thus far.
In the light of the above constraints to the integration process in the West African
sub-region, this study provides a comprehensive review of developments in the EU
and more importantly, the various landmarks on the roadmap for achieving the
European Monetary Union (EMU). It also provides a comparative analysis from

Sagbamah: Perspectives on the European Monetary Union 39
which to draw lessons of experience to guide and also to inspire ECOWAS member
states to attain a monetary union in the sub-region.
To achieve the objectives of this study, the paper is organized into seven parts, with
this introduction as Part I. It is followed by Part 2 which provides a theoretical
framework for regional integration, while Part 3 traces and highlights the evolution
and institutional developments of the EU. Part 4 discusses in details the major
programmes, projects and polices which led to the attainment of the EMU; Part 5
undertakes a comprehensive review of ECOWAS integration efforts, thus highlighting
the historical evolution, institutional development and drawing a comparative
analysis of EU’s lessons of experience for the ECOWAS and also indicating the
sequencing of integration. Part 6 highlights policy recommendations for the
ECOWAS sub-region, while Part 7 summarizes and concludes the study.
II. Theoretical Framework for Regional Integration
The term “regional integration” is an aspect of international economics, but its usage
according to El-Agraa (1999), quoting Machlup (1977), was relatively unknown until
1942. Schiff and Winters (2003) however note that the practice of regional
integration has been in existence for hundreds of years. For instance, in 1664, France
proposed a customs union, while Austria signed free trade agreements with five
neigbouring countries in the 18th and 19th centuries. Indeed, the authors asserted that
preferential trade agreements were the basis for colonial empires, while customs
union arrangements led to the creation of the states of Germany, Italy and the United
States.
By the 1950s, the term became widely used and defined by economists as “a state of
affairs or process which involves the amalgamation of separate economies into larger
free trading regions” (El-Agraa, 1999). More specifically, El-Agraa defines regional
integration as the “discriminatory removal of all trade impediments between at least
two participating nations and with the establishment of certain elements of
cooperation and coordination between them”.
II.1 Reasons for Regional Integration
Countries forming regional integration agreements are usually persuaded by a
number of reasons which can be broadly classified under political and economic
reasons.

40 Central Bank of Nigeria Economic and Financial Review March 2006
II.1.1 Political Reasons for Regional Integration
The amalgamation of countries to form a monolithic entity through a regional
integration agreement creates a formidable political group governed by regional laws,
rules and regulations. As a group with a large territorial boundary, market, economic
opportunities and pooling of sovereignty, it commands respect between and among
other nations. It could use its bloc power for negotiations and achieve better bargains
than if such negotiations are undertaken by individual countries. Therefore, small
countries under the regional bloc stand to benefit. This was one of the major
considerations when the idea of the EU was conceived by the founding fathers.
Indeed, the political unity of Europe was very paramount in the EU architecture in
order to foster peace and security, strengthen their ideological perspective and also
compare favourably with other large nations such as the United States of America.
Furthermore, under a cover of regional integration block, smaller countries are
strengthened against any external threat or aggression. Also, following the
application of common regional rules and regulations, these countries adopt
democratic best practices in governance which facilitate and sustain internal peace
and security. The benefits of these political factors are given higher weights when
some countries enter into regional integration agreements.
II.1.2. Economic Reasons for Regional Integration
For other countries, the raison d’etre for entering into a regional integration
agreement is largely economic. As a group, the region provides a large market with
lots of potentials for member states than the small markets of individual countries.
Apart from the large market size with inherent potentials, the security of market and
access following the removal of trade barriers for member states are relative
advantages they have over other countries in the rest of the world. The market size
will encourage increased production, competition, enhance efficiency and thus
promote trade – these, according to Schiff and Winters, are the explicit objectives in
the treaties establishing some regional integration agreements. As countries increase
production to meet market demands or requirements, this promotes economies of
scale which leads to lowering of prices and cost of production. Other economic
benefits that could arise following market competition are application of
technological advances and promotion of factor mobility. The combined effects are
the production of cheaper products for member states which enhance intra-regional
trade and also secure improved terms of trade with third countries. Furthermore, as
competition improves to take advantage of market potentials, coupled with regional

Sagbamah: Perspectives on the European Monetary Union 41
common policies and complemented by domestic policies to provide an enabling
investment-friendly environment that attracts foreign investment and technology,
particularly foreign direct investment (FDI), these will boost the productive capacity
of countries in the region.
Under the cover of a regional group, this provides member countries the opportunity
to act in concert to undertake domestic economic reforms and implement sound
policies to achieve better economic management. Overall, countries will benefit from
high economic growth and development, increased employment opportunities, high
incomes and better standard of living for their citizens.
El-Agraa (1999), however, warns that there is no guarantee that these economic gains
could be achieved; much will depend on the choice of regional integration and the
competitive behaviour existing prior to regional integration; otherwise, regional
integration could worsen the situation.
II.2 Types of Regional Integration
Regional integration agreements vary in type, structure and scope. These include free
trade area, customs union, common market, economic union and monetary union.
Each of these, in terms of structure and scope, is an improvement and of a higher
level than the other.
II.2.1 Free Trade Area
In Free Trade Areas (FTAs), member states agree to abolish internal tariffs and other
quantitative restrictions within the group. However, each participating state is
allowed to maintain its tariff against third countries. Essentially, the sole objective of
FTAs is to promote trade. Examples of FTAs are the European Free Trade Association
(EFTA), the Preferential Trade Area (PTA) for Eastern and Southern Africa, the
North American Free Trade Agreement (NAFTA), Association of Southeast Asian
Nations (ASEAN), etc.
II.2.2. Customs Union
Customs Unions (CUs) share similar characteristics as FTAs, these involve the
removal of internal tariffs and other discriminatory measures against trade; but in
addition, member states erect common external tariff (CET) against the rest of the
world. The dissimilarity between FTAs and CUs are the application of CET and rules
of origin if a member in FTA indulges in trade deflection. Trade deflection takes place

42 Central Bank of Nigeria Economic and Financial Review March 2006
when a member in FTA with the least external tariff imports goods from a third
country and re-exports them to member states. Customs unions, therefore, guarantee
free trade for members and also erect protective barriers through CETs. The CETs
give rise to the incidence of trade creation and trade diversion. Trade deflection
differs significantly from trade creation (TC) which is the import of cheaper products
from a partner country than expensive ones from a third country. The inverse of TC is
trade diversion (TD) which represents the import of expensive products from a
partner country than cheaper ones initially imported from a third country. Examples
of CUs are the Mano River Union (MRU), the Southern African Customs Union
(SACU), Arab Common Market, Caribbean Community and Common Market
(CARICOM), etc.
II.2.3 Common Market In addition to the complete removal of internal tariffs and erection of CETs, common
markets (CMs) include factor mobility of labour (persons), capital, investment,
technology, industry, etc, and the introduction of common rules to ensure fair
competition and standards. Thus, CMs are higher levels of regional integration than
FTAs and CUs. Examples are European Union (EU), Arab Magreb Union (AMU), etc.
II.2.4. Economic Union
Economic Unions (EUs) add to the features of CMs, the harmonization of social and
economic policies. In other words, economic policy harmonization involves the
setting of targets on fiscal, monetary, exchange rate policies for member states. In
effect, member states apply the same policies across. EUs are much higher level of
regional integration than FTAs, CUs and CMs. Before the introduction of the euro on
January 1, 1999, the EMU was indeed an economic union. Also, the West African
Monetary Zone (WAMZ) and ECOWAS are still implementing FTA, CU, CM and EU
in pari passu.
II.2.5. Monetary Union
Monetary Unions (MUs) possess all the characteristics of EUs but the distinguishing
feature are the phasing away of all members’ national currencies, adoption of a single
currency (which El-Algraa (1999) referred to as exchange rate union) and the
establishment of a common central bank to conduct a common monetary policy.
Examples of monetary integration or union are the West African Economic and
Monetary Union or Union Economique El Monetaire Ouest Africaine (UEMOA) and
the most prominent and influential among all regional integration is the European
Monetary Union (EMU).

Sagbamah: Perspectives on the European Monetary Union 43
III. The Historical Evolution and Institutional Development of
the European Union III.1 Historical Evolution of the European Union and European
Monetary Union
The journey to the formation of the EMU commenced in 1951, when the governments
of six European nations, namely Germany, Belgium, France, Italy, Luxembourg and
the Netherlands signed the Treaty of Paris for the establishment of the European Coal
and Steel Community. By 1957, the same countries signed the Treaty of Rome which
founded the European Economic Community (EEC). The EEC which was later re-
named the European Union (EU), however, commenced effectively in 1958. The
objectives of the EEC included the integration of European economies into a common
market to promote higher economic growth and development, ensure regional
stability, increase the standard of living of its people and develop closer relations
among member states. To actualize these lofty objectives of the EEC, four major
institutions were established, these are the Assembly, Council, Commission and
Court of Justice. Of these institutions, the Commission and the Council had and still
have the responsibility for the development of economic and political ideals of the
EEC. The Commission makes all proposals for the ratification of the Council
(Adedeji, 1990 and Dolan 1990).
Among the early proposals, was the removal of tariff barriers to pave way for the
transition to a common market. Though tariffs were removed in the 1960s, the 1970s
and early 1980s, not much progress was made to achieve the goal of a common
market. Indeed, other than some relative growth in intra-European trade, European
markets were still subdivided along national configurations. In spite of these
problems which militated against the smooth transition to a common market, the
political ambition of the founding fathers of the EEC was to transform Europe into a
gigantic economic power, a United State of Europe (USE), an equivalent of the
United States of America (USA). The move for the realization of this dream was
imitated in 1970. Popularly known as the Werner’s Plan, named after the then Prime
Minister of Luxembourg, the plan was conceptualized and designed for Europe to
attain a monetary union in that decade. The plan included the establishment of an
European Community Central Bank which would foster and nurture a European
monetary Union. On the basis of this plan, the European Commission on October 30,
1970, submitted a memorandum which proposed the establishment of an European
Economic and Monetary Union. Though, a monetary union could not be realized in

44 Central Bank of Nigeria Economic and Financial Review March 2006
that decade, it led to the establishment of the European Monetary System (EMS) in
March 1979. The EMS comprised three major parts, namely an Exchange Rate
Mechanism (ERM), European Currency Unit (ECU) and European Monetary
Cooperation Fund (EMCF). They were established to ensure monetary stability and
close monetary cooperation amongst member countries. Furthermore, in 1986, the
introduction of the Single European Act, which specified the removal of physical,
technical and fiscal barriers to ensure complete realization of a common market,
brightened the prospects of EMU, and by 1990, the Schengen Agreement eliminated
border checks.
In 1992, the Maastricht Treaty set the conditions necessary for the formation of an
economic union, a major foundation preceding the introduction of EMU. It was in
this same year, specifically February 7, 1992, that the EEC adopted the name
European Union. The treaty specified criteria which member countries should
achieve in order to participate in the EMU. These criteria referred to as the
convergence criteria, included low inflation, long-term interest rate, budget deficit to
gross domestic product (GDP) ratio, national debt to GDP ratio and adherence to the
existing ERM arrangement. The reference ratios for inflation and long-term interest
rates, budget deficit and national debt to GDP set for 1996 were 2.3, 9.1, 3.0 and 60.0
per cent, respectively. The performances of member countries in 1997 were used to
set the figures for interest and inflation rates in 1998; and by May 1998, on the basis
of each country’s performance, the European Council decided which of the countries
qualified to join EMU on January 1, 1999. At the level of the EMU, participating
countries lost their national powers over some economic policies, especially monetary
policies, for adopting a single currency. These powers were transferred to a
supranational body (the European Central Bank (ECB)) to formulate and coordinate
such policies for the entire region. Consequently, the European Monetary Institute
(EMI) which was established on January 1, 1994, to serve as the forerunner
transformed into the ECB with the responsibility of conducting monetary policy.
Of the 15 member countries of the EU in 1998, 11 of them (Germany, France,
Belgium, Luxembourg, Italy, Netherlands, Spain, Ireland, Austria, Portugal and
Finland) were adjudged by the European Council to have met the convergence
criteria set for the formation of the EMU. Britain has since opted out of the EMU
project owing to the arrangement to adopt a single currency other than the Pound
Sterling. The other three countries that could not meet the criteria for joining the
EMU were Denmark, Sweden and Greece. Greece subsequently qualified. The EMI

Sagbamah: Perspectives on the European Monetary Union 45
which was transformed into the ECB in 1998, made all the necessary preparations for
the historic launching of the single currency called the Euro on January 1, 1999, to
signal the commencement of EMU. On this day, the German mark, French franc,
Italian lira, Austrian shilling, Belgium franc, Luxembourg franc, Dutch guilder,
Spanish peseta, Portuguese escudo, Irish punt and Finish markka were determined at
1.95, 6.56, 193, 6.27, 13.76, 40.34, 2.20, 166.39, 200.48, 0.79 and 5.95 to one euro,
respectively. However, the euro did not go into physical circulation until the year
2002. It was only used for non-cash transactions, such as payments by cheques,
credit cards and bank transfers. In 2002, eight euro coins and seven euro notes were
introduced and circulated side-by-side with the national currencies (Guardian,
2002). The transition period was from January to June, 2002, after which, all
national currencies were withdrawn from circulation. In effect, on July 1, 2002, the
euro became the only legal tender among the participating countries.
Ten new countries were admitted into the EU in May, 2004, thus raising the total
membership to 25. These countries, comprising Cyprus, Czech Republic, Estonia,
Hungary, Latvia, Lithuania, Malta, Poland, Slovakia and Slovenia are, however, not
in the euro zone area, bringing to 14 the total number of countries outside the euro
area. On January 1, 2005, Greece was admitted to join the EMU; consequently the
non-EMU members outside the euro zone have reduced to 13.
III.2 Institutional Development of the European Union and European Monetary Union The EU march towards the realization of the EMU, progressed successfully through
the establishment of necessary institutions which served as the pivots for rapid
integration. These institutions designed, formulated and provided logistic support for
the implementation of policies, programmes and projects.
III.2.2 Political Institutions
These are the Council, Assembly, Court of Justice and Commission.
The Council: The executive arm comprising Presidents/Heads of State and
Government that make decisions for the smooth operations of the EU and EMU.
The Assembly: The legislative arm that enact laws for governing the region
The Court of Justice: The judicial arm that interprets laws and adjudicates
between and among participating states.
The Commission: This is the think-tank for major policies, programmes and
projects proposals and implementation.

46 Central Bank of Nigeria Economic and Financial Review March 2006
III. .2.3. Specialized institutions
These include Sectoral Commissions, European Monetary Institute (EMI), European
Central Bank (ECB) and the European System of Central Banks (ESCB).
Sectoral Commissions
Under the Commission, there are nineteen (19) sectoral commissions headed by
commissioners (Financial Times, July 10, 2000) who oversee the development of the
following sectors: (a) Commission Reform; (b) Parliament/Energy/Transport; (c)
Competition; (d) Agriculture; (e) Information/Society; (f) Internal Markets; (g)
Research; (h) Monetary Affairs; (i) Development; (j) Enlargement; (k) External
Affairs; (l) Trade; (m) Consumer/Food Safety; (n) Regions; (o) Budget; (p)
Environment; (q) Justice/Home Affairs; (r) Employment/Social; and (s)
Education/Culture
The European Monetary Institute (EMI)
The EMI was established on January 1, 1994. It was based in Frankfurt, Germany. It
served as the forerunner to the emergence of the ECB and the formation of the ESCB.
The EMI was therefore charged with the responsibilities of developing a set of
monetary instruments for the ESCB, the setting-up of a statistical databank and the
preparation of euro bank notes. Also, the EMI served as the coordinating central
bank among national central banks until it was succeeded by the ECB in May 1998.
The European Central Bank (ECB)
As discussed above, the EMI was in May 1998, transformed into the ECB.
Statutorily, the ECB’s main function is to design, formulate and implement
European-wide monetary policy, using policy instruments, particularly the money
market interest rate. The ECB is an independent central bank. The Maastricht
Treaty forbids it to be accountable to any European government or politicians. It is
designed specifically to target inflation and ensure price stability.
The European System of Central Banks (ESCB)
The ESCB is made up of members of the ECB and the central banks of EMU member
states. The ESCB functions, among others, include issues on the operational aspects
of central banking, such as the regular money market operations, funds transfer,
management of international reserves of member states, issuance of euro bank-notes,
lender-of-last resort and prudential supervision, etc. The ESCB members guide these

Sagbamah: Perspectives on the European Monetary Union 47
roles, particularly, the right to conduct money market operations in order to
safeguard their respective local financial markets.
Other Specialized Agencies
These include the European Regional Development Fund (ERDF) which provides
financial and technical assistance to its overseas dependencies such as the Yaoundé
and Lome Conventions; the European Investment Bank (EIB) provides funds for the
development of projects in the backward areas of the union; European Social Fund
(ESF) financial support to workers displaced in the integration process; member
states financed the development of infrastructures such as roads, rails, air and water
transportation as well as telecommunications to link Europe; European research and
development (R&D) activities led to the successful development of ESPRIT
(aeronautics), RACE (satellite), BRITE (computer), ARAINE (satellite), EUROPE
AIRBUS, European Atomic Energy Community (EURATOM) (Adedeji, 1990).
IV. Major Programmes, Projects, Policies and the Implications
for the Achievement of the European Monetary Union Under this section, major programmes, projects, policies and their implications
which contributed significantly to the achievement of the EMU would be discussed
and analyzed in details.
IV.1. European Monetary System (EMS)
It was not until March, 1979, that the drive towards a monetary union was firmly
initiated through the introduction of the EMS. The EMS was the first practical step
towards ensuring some degree of monetary cooperation and stability among member
states. The EMS was structured into three major units, namely, the European
Currency Unit (ECU); the European Exchange Rate Mechanism I (ERM I); and the
European Monetary Cooperation Fund (EMCF) (Bundus, 1990).
The ECU was an artificial currency that linked member states’ currencies and played
very important role in exchange rate management, and also ensured monetary
stability. Each member state had defined units of its currency in relation to the ECU.
Thus, the ECU served as a common denominator for the conversion of members’
currencies to settle transactions. The ERM I on the other hand provided the
mechanism for ensuring exchange rate stability among currencies of member
countries to guide against currency volatility. In this regard, the specified band which
defined the margins of fluctuation was a plus or minus 2.25 per cent; though Italy

48 Central Bank of Nigeria Economic and Financial Review March 2006
opted for a wider 6 per cent band. The band was revised upwards in 1993 to a plus or
minus 15 per cent. The methods of intervention varied from the application of
various domestic policies to outright buying and selling of national currencies which
was supported through the provision of credit facilities.
Bundus (1990) and Phillips (1990) highlighted the credit facilities which were
classified into three categories, namely the very short-term facility, the short-
term monetary support facility and the medium term financing facility.
While the very short term facility required the participating states’ central banks to
provide unlimited and automatic credit to a member whose exchange rate required
immediate intervention, the short term monetary support credit facility, on the other
hand, was based on the value of an assigned creditor quota or debtor quota when
faced with temporary balance of payments deficit or a sudden short-fall in external
reserves. The medium term financial assistance also provided loans for supporting a
more serious balance of payments problem. The credit fund provided was ECU 25
billion, comprising ECU 14 and ECU 11 billion short-term monetary support and
medium term financing facilities, respectively. The EMCF was an ECU fund
established to facilitate the settlement of transactions. In other words, the fund was
used for providing ECUs for gold and dollar deposits. According to Lopex-Claros
(1987), average inflation rate for all members of the ERM fell steadily from 11.3 per
cent in 1980 to 2.5 per cent in 1986. Phillips (1990) concluded that, the EMS
facilitated increased convergence in areas of prices, real output and money supply.
Therefore, the EMS enhanced exchange rate management, stability and greater
monetary cooperation among member states.
IV.2 Introduction of the Single Act
The Single Act which was ratified in 1985 was aimed at eliminating all factors capable
of inhibiting the realization of a common market. The act targeted the removal of
fiscal, technical and physical barriers that lingered on after tariff barriers had been
dismantled in the 1960s. The Single Act also amended portions of the European
treaties, of which the most significant was the scrapping of the use of veto power or
obtaining unanimity of members on any issue. This was replaced with a single
majority voting to accelerate the speed of decision-making (Dolan, 1990). Also,
sanctions were swiftly imposed to accelerate the speed of implementation all over. It
is important to note here that, prior to the Single Act (and in spite of the success
achieved in the removal of tariff barriers), most of Europe still retained the identities
of their national markets. Thus, the Single Act was crucial for the development of an

Sagbamah: Perspectives on the European Monetary Union 49
Europe-wide market that fostered and deepened financial intermediation across
boundaries. It was also designed to promote Europe-wide money and capital
markets that are necessary requirements for the effective conduct of monetary policy
and overall policy coordination.
IV.3. The Strategic Plans of the Delors’ Committee
In 1988, the Heads of Government constituted a technical committee of central
banks’ governors which was headed by the then President of the European
Commission, Mr. Jacques Delors, to draw up concrete plans that could lead to the
attainment of the EMU (Bundus, 1990). The Delors’ Committee proposed a three-
prong approach to an EMU. First, the Committee proposed a plan for the EEC
members (now EU) who were not in the ERM (e.g. United Kingdom, Portugal, Spain
and Greece) to join. France, Italy and Belgium; Spain and Ireland; and Portugal
which had not completed the requirements of the Single Act in 1986 were requested
to abolish completely vestiges of exchange and capital controls by 1990, 1992 and
1994, respectively.
The second plan of the Delors’ Committee was the development of an European
System of Central Banks (ESCB) fashioned like the Federal Reserve System of the
United States (US). It also included the strengthening of policy coordination, as
inspired by the EMS scheme, through the setting of economic targets and rules on
budget deficit for member states.
The third plan required the establishment of a common central bank that would be
charged with the responsibility for the design, formulation and implementation of
monetary policy on behalf of member states. The plan also included the introduction
of a single currency which would symbolize the attainment of a complete monetary
union. Given the necessary approval for the plans, the Delors’ Committee published
the planned strategies in 1989 and commenced the implementation of the plans in
stages from 1990. Consequently, in 1992, a major step taken by the European
Commission, which was supported by Mr. Helmut Kohl of Germany and Francois
Mitterrand of France who provided the political will to spearhead the integration
efforts, was the introduction of the Maastricht Treaty.
IV.4. The Maastricht Treaty of 1992
The Maastricht Treaty was an important landmark in the build-up towards the
attainment of the EMU. Elements of the Maastricht Treaty referred to as the

50 Central Bank of Nigeria Economic and Financial Review March 2006
“convergence criteria”, included targets for inflation, long-term interest rate; budget
deficit, national debt and exchange rate which partly represented details of the Delors
Committee’s second stage plan. Member states willing to form EMU must pursue
macroeconomic policies that would meet the target of 2.3 and 9.1 per cent for
inflation rate and long-term interest rate, respectively, by 1996. The long term
interest rate should not be more than 2 percentage points more than the average for
the states. Also, participating countries must trim budget deficits to 3 per cent of
their GDPs; and the ratio of gross national debt to GDP should not be higher than 60
per cent. Finally, the exchange rates of participating states must conform with the
requirements of the EMS, particularly the ERMI in 1996.
The Maastricht Treaty requirements were directed at ensuring that countries
embarked on economic reforms or restructuring exercises which would harmonize
the economic indicators of member states to the same base level. In other words,
macroeconomic aggregates of member countries must on the average be homogenous
to facilitate a healthy commencement of a monetary union. The convergence criteria,
therefore, served as a leveler and provided a level playing field for the economies of
member countries, such that the effects of the application of common monetary and
exchange rate policies would be measured and evaluated based on the same
macroeconomic fundamentals. If such economic cleansings were not done in order
to smoothen out the existence of divergent macroeconomic aggregates of member
countries, the application of the same policy measures across would have varying
degrees of impact. Those that had bad economies in place would be worse hit by
common policies than those with relatively healthier ones. The possibility of wide
variation of policy impacts could therefore trigger problems of incompatibility among
the participating states. While some will be growing and progressing faster, others
could be lagging behind or retrogressing as the case may be.
IV.5. The Drive to The Attainment of The European Monetary Union
(EMU)
The basis for participating in EMU was the achievement of the convergence criteria.
The most controversial aspect of the convergence criteria was the requirement for
governments to reduce considerably their budget deficits. To reinforce the blue-print
of the Maastricht Treaty’s budget deficit requirement of not more than 3 per cent of
GDP, unless a country was under an exceptional circumstance when its GDP was
falling at an annual rate of 2 per cent, the EU introduced the “Growth and Stability
Pact”.

Sagbamah: Perspectives on the European Monetary Union 51
The Growth and Stability Pact
The Growth and Stability Pact, which was agreed upon in December 1996, was
ratified by the European Council in June 1997. The pact provides that any country
that circumvented the rule faces a heavy fine through a majority vote of member
governments. The limit placed on public borrowing was to ensure policy
complementarity between fiscal and monetary policies. Specifically, it was designed
to curb governments easing of fiscal policy through budget deficits capable of
undermining the effectiveness of monetary and exchange rate policies. However, in
the face of rising levels of unemployment, declining capacity utilization and growth,
some of the participating governments were unhappy with the rigidity or strictness of
the stability pact. Facing such economic circumstance, they require budget as a
means of stabilizing their economies through deficit financing. Since they had no
control over monetary policy, the Stability Pact rather constrained the flexibility with
which they could use fiscal policy to address a number of domestic problems. This
led to various complaints, for instance, Germany’s former Finance Minister, Mr.
Oskar Lafontaine resigned his appointment after he had challenged the ECB openly
on this matter. Most of the governments have chosen to raise taxes in order to escape
the stability pact penalty.
On November 25, 2003, the penalty for violating the Growth and Stability Pact failed
to pass the acid test, as France and Germany, which had exceeded the 3 per cent
minimum deficit requirement, lobbied other member states to overturn the punitive
measures recommended by the European Commission. This dimension established a
dangerous precedence for which the embattled Commission has decided to take a
legal action in order to upturn that political decision.
EMU Convergence Criteria Test and the Cessation of the EMI
In spite of the controversy generated by the Growth and Stability Pact, participating
countries strove hard to meet the convergence criteria by 1996, the reference year.
However, the test to determine which countries qualified to participate in EMU was
fixed for May, 1998, using the performance of 1997(see Table 1). The European
Commission and the EMI in March 1998 submitted their recommendations to the
European Council which selected 11 out of the 15 members of the EU that met the test
requirements.

52 Central Bank of Nigeria Economic and Financial Review March 2006
The Position of Non-EMU Countries
As discussed in part 2, only three countries, namely Britain, Denmark and Sweden
were outside the EMU construct before the admission of the 10 new members to the
EU. As for Denmark and Sweden, they opted for EMU but failed the eligibility test as
indicated by the outcome of their convergence criteria performance. Consequently,
they needed to improve on their performances in order to gain admission into the
EMU. Greece in 2005, formally scaled through the hurdle and was admitted into the
EMU. Britain, on the other hand, opted out of EMU arrangement largely on account
of being unable to reach a political consensus on EMU. Among the reasons adduced
is the loss of its national sovereignty and identity, as well as the nationalistic
sentiments attached to the British pound sterling. If the pound sterling would not be
adopted as the single currency and will be phased out, Britons find it hard to admit
the reality of parting way with the sterling regarded, not only as a symbol of unity and
economic strength, but also the pride of losing one of the foremost reputable
currencies of the world. Besides, there is still an on-going controversy on the merits
and demerits of joining the EMU (Wall Street Journal Europe and The Economist,
1999). Those opposing Britain’s entry into the EMU often argue that the application
of a common monetary policy for economies of varying conditions of boom and
slump, limitation of the stability pact and the inflexibility of labour and product
markets in Europe, will create more strains on these economies.
According to the group in favour of Britain joining the EMU, the sterling will be
opened to speculative attacks as long as it remains pegged to the euro; Britain will
lose about 40 per cent of direct investment (The Economist, April 1999), companies
in Britain will face exchange rate risks and high transaction costs. Britain will lose
out in the proposed merger of the London and Frankfurt stock exchanges with the
head office in London, and its influence will dwindle in the continent it if fails to join
the EMU. The result of an opinion pool reported in the Economist (April 1999),
indicated that 65 per cent of Britons favoured joining the EMU; and by late 2001 or
in 2002, it was expected that Britons would go to the poll to decide whether or not
Britain should join the EMU. This has not happened. The ten new states which
joined the EU in May 2004, will also have to pass the convergence criteria test to be
admitted into the EMU.
The Exchange Rate Mechanism II (ERM II)
The importance of exchange rate stability for promoting intra-European trade and
investment cannot be over-emphasized as evidenced in the EMS arrangements.

Sagbamah: Perspectives on the European Monetary Union 53
However, with the introduction of the euro, the ECU and ERMI arrangements
ceased; but the exchange rates of the non-EMU countries could be volatile,
transmitting negatively on the EMU zone. Consequently, the ERM I arrangement was
transformed into ERM II for the non-EMU countries, referred to as the derogation
countries (countries that are outside the EMU zone). The necessity for the ERM II
arrangement stems from the fact that, it would discourage the derogation countries
from embarking on deliberate devaluation with a view to securing competitive
advantage over the EMU members. Such actions would not only undermine the
competitiveness of the EMU countries, but will also create undue tension in the EU.
Consequently, the ERM II, which was ratified by the European Council in December
1996 for the derogation countries, commenced effectively in January 1999 after the
introduction of the euro. The euro, therefore, became the anchor currency which the
currencies of the derogation countries are fixed to with margins of plus or minus 15
per cent. Fluctuation outside the margins would require intervention by the central
banks of the non-EMU countries and serves as a condition for joining the EMU by the
derogation countries.
The Design and Introduction of the Euro
A major hallmark of a complete monetary integration is the introduction and use of a
single currency by all participating countries. There are two options to this. The
countries either agree to adopt a strong currency of a member country or design a
new currency for member countries. In the case of the EMU, member countries
opted for a new currency and in 1995, the European Council in conjunction with the
EMI and the European Commission selected the name euro among other names. By
December 1996 and June 1997, the designs of the euro bank notes and coins by the
EMI in conjunction with the European Commission were ratified by the European
Council. Consequently, seven bank notes and eight coins of various denominations
were approved for circulation. The coins are 1, 2, 5, 10, 20, 50 euro cents, 1 and 2
euros, while the notes are 5, 10, 20, 50, 100, 200 and 500 euros. Thereafter, the
official ECU ceased to exist, the ERM II became operational, and the ECB
commenced operations to discharge its mandate, the conduct of a common monetary
policy in the euro zone.
IV.6. The Implications of the Introduction of The Euro
The withdrawal of national currencies for the euro, which remains the only currency
for the union, had some implications. These are discussed below:

54 Central Bank of Nigeria Economic and Financial Review March 2006
Currency Implications
On January 1, 2002, the formal exchange of the national currencies of the 11
participating countries for the euro had serious currency implications. All national
currencies were on July 1, 2002, withdrawn from circulation, leaving the euro as the
only currency of transactions and, thus, the legal tender of a population of over 304
million people, comparable to the 260 and 125 million people for the United States
dollar and Japanese yen, respectively. The amount of euro that was received by
individuals and corporate bodies depended on the balances of national currencies
outstanding to their credit and the relative strength of these currencies’ exchange
rates to the euro. The EMU countries bore the costs of introducing the euro which
included legal, administrative, old notes withdrawal, automatic teller machines
replacement, retraining of staff and publicity campaigns. The transactions cost of
contracts or projects were redenominated in euro according to the worth of the
former national currencies, while prices of goods and services declined after the
change in currencies to levels where similar products and services were offered at
competitive cheaper rates. Also, the payments system remained unchanged, using
existing facilities, particularly the SWIFT technology, and was further enhanced by
the Trans-European Automated Real-Time Gross Settlement Express Transfer
(TARGET) introduced to achieve settlement of same day payment under any
circumstance. These were expected to increase the efficiency of intra-European
cross-border payments and ensure the smooth conduct of monetary policy in the
EMU.
Implications for the Money Market
The introduction of the euro integrated the inter-bank markets, increased the size
and reduced costs associated with different inter-bank markets. Under the same
monetary policy for all institutions, the money market in Europe became the second
largest market following that of the United States. Furthermore, the variety of money
market securities and products that now exist further deepened the EMU money
market. These products and securities were reconciled among banks through the
instrumentality of the ECU Banking Association (EBA), renamed Euro Banking
Association, which represents the institution for banks’ clearing system. The existing
interest rates were realigned as the strong economies with low interest rates exerted
considerable influence on the interest rates structure, thus reducing interest rates to
converge on Euribor (European Inter-bank Offer Rate).

Sagbamah: Perspectives on the European Monetary Union 55
Implications for the Capital Market
The immediate implication for the capital market was the conversion of the existing
share prices into euro, while new shares are being quoted in euro. In effect, the
existing stock exchanges maintained their identities within the European capital
market. However, an European-wide capital market competition certainly brought
about the harmonization of market conventions, which not only ensured efficiency
and market deepening, but also led to the consolidation or mergers of some of the 39
existing stock exchanges. Besides, the elimination of exchange rate risks, declining
costs of trading and settlement, as well as low inflation rate, attracted capital inflow,
thus, enlarging the European capital market which competes favourably with the
New York and Tokyo stock exchanges.
Implications for the Foreign Exchange Market
The introduction of the euro and the withdrawal of the old national currencies had
significant impact on the foreign exchange market. First, costs associated with
differences in exchange rates were eliminated; second, exchange rate risks which
were associated with the fluctuations in exchange rates of national currencies were
also removed. These savings influenced the reduction of prices in member countries.
Foreign exchange transactions and record-keeping are more simplified in the euro
zone as all member countries are dealing with a single currency, the euro. The
prospects of well developed and competitive money and foreign exchange markets
further promoted and deepened the activities of the derivatives market.
Implications for Reserves Management
The euro is not only floating against other international currencies (dollar, Yen, etc),
but also pegged against the currencies of the derogation countries (non-EMU
members). In the light of these, the ECB needs foreign reserves backing for the
effective management of the euro in the foreign exchange market to achieve the
objectives of monetary policy. Consequently, national central banks had to transfer
some of their reserves holdings to the ECB to facilitate the discharge of its mandates.
The percentage contribution by member countries was arrived at through the
estimation of their respective reserves/imports ratios. This estimation provided the
initial required reserves needed for the EMU project, which was proportional to each
member’s national reserves.

56 Central Bank of Nigeria Economic and Financial Review March 2006
Implications for Policy Formulation and Implementation
In order to lay a solid economic foundation, the EMU countries strengthened their
economic base through a package of convergence criteria implemented by all
countries. These were stringent economic measures designed to smoothen all
countries’ economies across board, preparatory for the introduction of the euro and,
thus, the conduct of monetary policy. To achieve them, the countries had to
undertake a number of economic reforms, which included government budget
rationalization. Also, they had to surrender their national powers to the ECB in the
design and implementation of monetary and exchange rate policies. These portend
serious policy implications to national governments in some respects. For instance, if
a government has every justifiable reason to run a budget deficit, it does not control
the monetary instruments to complement its efforts. Besides, attempt at borrowing
could lead to higher interest rate for other countries.
Implications for the CFA Franc Countries
France and its colonies had since the 1930s maintained a monetary cooperation
arrangement which metamorphosed into the introduction of a common currency, the
CFA franc in 1948. The CFA franc which is issued separately by both the Western
African Economic Monetary Union (UEMOA) and Central African Economic and
Monetary Union (CEMAC) was pegged at a fixed parity against the French franc; this
implicitly indicated a fixed exchange rate regime for the two monetary unions
existing in the CFA zone. The agreed fixed exchange rate can be adjusted only if some
adverse economic conditions exist and a mutual agreement for an adjustment is
reached between the colonies and France. France also provides a guarantee for the
CFA franc, thus, conferring on it the status of a convertible currency (Hadjimichael
and Galy, 1977). However, the replacement of the French franc for the euro to which
the CFA franc was pegged, has some important implications for France and its
colonies. Specifically, what happens to the peg and the guarantee of France? Will the
EMU countries accept these arrangements between France and its colonies? The
ERM II arrangement is designed to facilitate currency cooperation between the EMU
and the derogation countries. Besides, the EMU provisions allow for the negotiation
of any currency arrangement with a country or group of countries. In these regards,
the EMU can accommodate the CFA countries on terms and conditions agreed by
both parties. Indeed, the CFA zone countries are willing to maintain the peg and
France guarantee of the convertibility status of the CFA franc. Maintaining the peg to
the euro does not constitute any problem as any adjustment in the fixed rate was
based on the rate at which the French franc had been converted into the euro.

Sagbamah: Perspectives on the European Monetary Union 57
However, the area of problem is guaranteeing the convertibility of the CFA franc, as
this may have some implications on France and the EMU countries. The guarantee
arrangement is supported by France’s Treasury rather than its Central Bank. In other
words, under a tight budgetary condition, France may have to borrow from the
domestic economy to meet euro obligations of its colonies. This could have adverse
effect on domestic interest rate and, thus, interest rate management by the ECB.
However, as long as the above condition does not exist and France meets the
financial requirements of its colonies, the replacement of French franc with euro has
little or no implications on the EMU.
In summary, so long as EMU supports currency cooperation arrangement, and the
replacement of French franc with euro has no adverse implications, coupled with the
fact that the monetary unions in the CFA zone maintain 65 per cent of their reserves
in the French Treasury, France and her colonies have continued to wax stronger in
sustaining the currency cooperation agreements.
V Ecowas Monetary Integration Efforts and the Lessons from the EU Experience
V.1 Historical Evolution of the Economic Community of West African
States
The processes that were undertaken to achieve the EMU are indeed very instructive.
It is worthy of note that it took the European countries 13 years (1957-1970) to
initiate the need to advance further into a monetary union following the
implementation of a common market. Thereafter, Europe attained the EMU in 29
years (1970-1999); however, if we count from 1957 when the idea was mooted and the
processes commenced, then it took Europe 42 years (1957-1999) to achieve the EMU.
In the West African sub-region, the Economic Community of West African States
(ECOWAS) was established on May 28, 1975. Sixteen (16) countries, namely, Benin,
Burkina Faso, Cape Verde, Cote d’Ivoire, The Gambia, Liberia, Guinea Bissau,
Guinea, Ghana, Mali, Mauritania, Niger, Nigeria, Senegal, Sierra Leone and Togo
signed the membership of ECOWAS. Following the withdrawal of Mauritania in
December 2000, the membership dropped to fifteen (15). The major objective of
ECOWAS is to establish a common market and create a monetary union.
Both the common market and the need for a monetary union commenced
concurrently in 1975. The establishment of the West African Clearing House
(WACH) in 1975 was aimed at promoting some degree of monetary co-operation. In
58 Central Bank of Nigeria Economic and Financial Review March 2006
other words, it has taken ECOWAS 30 years in pursuing the ideals of a monetary
union. As against the EU experience, the ECOWAS integration process inadvertently
commenced simultaneously with a limited degree of monetary union (monetary co-
operation programme). However, the formal move for the formation of a monetary
union was agreed in May 1983, which led to the reinforcement of the existing
monetary co-operation programme into a comprehensive ECOWAS Monetary Co-
operation Programme (EMCP) in July, 1987. The formation of the EMCP was
preceded by the works of a study group, commissioned by the Committee of
Governors of Central Banks, aimed at proposing in concrete terms, the methodology
for achieving a monetary union. The report of the study group and the implications
thereof, which were submitted in 1984, proposed a number of measures for the
establishment of a common currency and, hence, a monetary union. Thereafter, a
supplementary study aimed at articulating the various adjustment issues, such as
fiscal, monetary, reserves and currency convertibility, which should be undertaken by
member states, was also commissioned. This report which was submitted in 1986,
proposed a five-year transitional period for the attainment of a single monetary zone
by 1992.
In 1987, the ECOWAS Heads of State approved the EMCP, but opted for a gradual
and phased approach to a monetary union. Consequently, the EMCP was phased into
short, medium and long term programmes for the implementation of reforms and
adjustment issues towards achieving a single currency by 2000. The short term
programme which had a time frame of 1991-1994, was aimed at strengthening and
improving the operational efficiency of the WACH through measures which included,
the settlement of WACH trade arrears, introduction of new payment instruments
(ECOWAS Traveller’s cheque and Bills of Exchange), establishment of a credit
guarantee fund, the transformation of WACH into a specialized monetary agency
(which is now known as the West African Monetary Agency (WAMA) and the removal
of non-tariff barriers(Obaseki 2001). These measures were introduced to boost the
capacity and thus the operational capabilities of the WACH.
Furthermore, the medium term programme which had a time frame of 1994-1997,
was intended to achieve regional currency convertibility and market-based exchange
rates. This also included the intensification of the complete implementation of the
trade liberalization measures, and the implementation of the monetary, fiscal and
external adjustment measures. The long term programme envisaged that, between
1997-2000 time frame, all the adjustment issues for meeting the convergence criteria,

Sagbamah: Perspectives on the European Monetary Union 59
which were necessary for the introduction of a single currency for the sub-region,
would have been completed. However, unfortunately, the EMCP programme of
actions was not realized by the terminal date of 2000. Thus, the terminal date was
revised to 2005, while members were expected to expedite actions and implement
speedily, all outstanding measures for the establishment of a common bank (West
African Central Bank) and the introduction of a common currency to facilitate intra-
regional trade and the conduct of a common monetary policy.
V.2 Institutional Developments of the ECOWAS
The institutions to achieve the objective of ECOWAS are the Authority of Heads of
State and Government, the Council of Ministers; the Parliament; the Court of Justice;
the Convergence Council; the Committee of Governors of Central Banks; the
Technical Monitoring Committee, the Joint Secretariat of WAMA and the ECOWAS
Executive Secretariat; National Coordinating Committees (NCC); the Executive
Secretariat; and specialized institutions such as the West African Clearing House
(WACH), transformed into the West African Monetary Agency (WAMA). Other
specialized institutions are the ECOWAS Bank for Investment and Development
Group and the West African Health Organisation; the West African Institute for
Financial and Economic Management (WAIFEM) and the West African Bankers’
Association (WABA).
V.2.1 Political Institutions
The Authority of Heads of State and Government
The highest ruling body that makes decisions on policies, programmes, projects and
critical issues affecting the development of ECOWAS regional integration.
The Council of Ministers
Deliberates to fine-tune and presents policies, programmes and projects for the
approval of the Authority of Heads of State and Government and also takes
responsibility for ensuring that policies, programmes and projects are developed to
achieve the objectives of ECOWAS.
ECOWAS Parliament: Enacts laws for governing the operations of the
Community.
ECOWAS Court of Justice: It adjudicates cases between and among member
states.

60 Central Bank of Nigeria Economic and Financial Review March 2006
ECOWAS Executive Secretariat: Prepares and implements the decisions of the
Authority of Heads of States and Government, and also the regulations of the Council
of Ministers.
V.2.2 Technical Institutions
The Convergence Council
The Council comprises Ministers of Finance and Governors of Central Banks of
member state and is empowered to conduct multilateral surveillance of the
convergence criteria of member states. The Convergence Council reports to the
Authority of Heads of State and Government.
Committee of Governors of Central Banks
They direct the technical committee of experts on issues to facilitate the
implementation of decisions and overall development of monetary integration. They
are directly responsible to the Convergence Council and the Council of Ministers.
Technical Monitoring Committee
The Committee, which consist of representatives of the Ministers of Finance and
Directors of Research of central banks of member states, shall monitor the
convergence process of member states and supervise the work carried out by WAMA,
ECOWAS Executive Secretariat and the National Coordinating Committees on the
implementation of the convergence programme. The Committee shall prepare
progress reports for the Convergence Council.
Joint Secretariat (WAMA and ECOWAS Executive Secretariat)
The Joint Secretariat prepares meetings of the Technical Monitoring Committee and
the Convergence Council on multilateral surveillance mechanism database and
prepares half yearly progress reports to the Technical Monitoring Committee and the
Convergence Council.
National Coordinating Committees (NCC)
The NCC shall assist WAMA and the ECOWAS Executive Secretariat in the collection,
processing and analysis of data on economic policies and the performance of the
convergence criteria. The NCC shall forward the report of its activities to the
Executive Secretariat on quarterly basis. Indeed, the Convergence Council, the
Committee of Governors of Central Banks, Technical Monitoring Committee and the

Sagbamah: Perspectives on the European Monetary Union 61
NCC Constitute the institutions for regional surveillance mechanism for the purpose
of coordinating national economic policies to achieve the convergence of national
economies.
V.2.3 Specialized institutions
The West African Clearing House (WACH)
This was established on June 25, 1975 to serve as a clearing house for the settlement
of payments made for goods and services, using local currencies of member states. It
commenced operations in July 1976 in Freetown Sierra Leone, but inability to
promote and also achieve the major objective of monetary cooperation resulted in its
transformation into the West African Monetary Agency (WAMA) on August 8, 1996.
The West African Monetary Agency (WAMA)
To achieve the mandate of promoting monetary cooperation, WAMA has the
expanded responsibility or objective of promoting trade liberalization, harmonizing
fiscal and monetary policies, managing exchange rate system and ECOWAS
Travellers’ Cheque system, and providing multilateral surveillance mechanism to
achieve monetary cooperation and, thus, monetary union.
ECOWAS Bank for Investment and Development Group (EBID)
The EBID which comprises two subsidiaries, namely the ECOWAS Regional
Investment Bank (ERIB) for private sector financing and the ECOWAS
Regional Development Fund (ERDF) for public sector financing,
metamorphosed from ECOWAS Fund for Cooperation, Compensation and
Development (ECOWAS Fund). The failure of ECOWAS Fund to achieve the
objectives of financing the execution of development projects, providing grants for
feasibility studies and guarantees for foreign investments, facilitating the
mobilization of internal and external resources for member states and providing
compensation to member states which suffer losses as a result of the implementation
of the integration policy, contributed to the transformation into EBID. However, the
Fund’s problems were attributed largely to the inability to function as a international
financial institution to cope with the volume of activities in the ECOWAS sub-region,
poor institutional capacity owing to staff quota system, lack of corporate culture and
managerial expertise, low financial resource mobilization and limited project
execution (EBID Group, 2005). Thus, the two subsidiaries would therefore mobilize
for the Community both internal and external financial resources for financing both
private and public sectors’ projects and promote the development of the sub-region.

62 Central Bank of Nigeria Economic and Financial Review March 2006
West African Institute for Financial and Economic Management
(WAIFEM): It is set up to build capacity on economic and financial management for
member states.
West African Bankers’ Association (WABA): An umbrella association for
bankers in the subregion to promote their activities.
West African Health Organisation (WAHO): The organization promotes
matters on health, especially HIV/AIDS, malaria, etc.
Special Technical Commissions
There are eight commissions which prepare Community programmes and projects
and coordinate their implementation after approval. These are Food; Industry,
Science & Technology and Energy; Environment and National Resources; Transport,
Communication and Tourism; Trade, Customs, Taxation, Statistics, Money and
Payments; Political, Judicial & Legal, Regional Security and Immigration Affairs;
Human Resources, Information, Social and Cultural Affairs; and Administration and
Finance (EBID) Group, 2005).
V.3 ECOWAS’ Programmes and Projects
ECOWAS Trade Liberalization Programme
The ECOWAS trade liberalization Scheme (ETLS) commenced on January 1, 1990.
The Scheme aims at developing a customs union for a period of 15 years (Owolabi,
2004). Thus, the ETLS seeks to eliminate customs duties, taxies and other non-tariff
barriers to facilitate the free flow of trade in the subregion. The continued existence
of different customs declarations and valuation methods, numerous check points on
roads and sea ports, lack of transportation and telecommunication networks and
non-harmonisation of trade and investment policies have impeded trade in goods
and services as well as human and capital mobility. These inadequacies are a
reflection of countries unwillingness to implement the ETLS faithfully.
ECOWAS Travellers’ Cheque Scheme
To enhance payment mechanism in the sub-region and promote trade, the ECOWAS
Travellers’ Cheque (ETC) was introduced in 1998 as a settlement instrument. The
operations of the ETC have been suspended and efforts are being made to transfer its
operations to the private sector. The ETC was denominated in the West African Unit

Sagbamah: Perspectives on the European Monetary Union 63
of Account (WAUA) which facilitated the conversion between and among local
currencies through cross rates.
ECOWAS Energy and Highway Projects
Two major energy projects are being implemented in the sub-region. These are the
West African Gas Pipeline and the Energy Power Pool projects. The West
African Gas Pipeline project (WAGP) is being constructed by Nigeria and its joint
venture partners (Chevron, Texaco and Shell Petroleum Development Company); the
Volta River Authority of Ghana; the Sobe Gas of Benin; and the Soto Gas of Togo. The
project which is estimated to cost about US$530 million will supply gas from Nigeria
to the Republics of Benin, Togo and Ghana (Nwachukwu and Etentuk, 2004). It is
envisaged that the West African Gas Pipeline Company (WAGPCO) will in the future
extend the pipeline to other West African Countries, thus reducing the cost of energy
to consumers in the sub-region. Similarly, arrangements are on-going under the
energy power pool to construct and interconnect electricity grid lines throughout the
West African sub-region. Another major project that has reached an advanced stage
is the construction of the West African Highway Project from Nigeria to Senegal.
These are intended to provide infrastructural development for the promotion of
productive activities in the sub-region.
ECOWAS Common Policies
The Community has approved Common Agricultural Policy (CAP) and Common
Industrial Policy (CIP) to provide level playing fields for agricultural and industrial
activities across the sub-region.
Regional Security
The Community has implemented a number of peace initiatives, including the peace
keeping force called ECOWAS Monitoring Group (ECOMOG). In this regard, the
Community has successfully intervened in the wars and crises in Liberia, Sierra
Leone, Cote d’Ivoire, Guinea, etc.
V.4 The Fast Track Approach to Integration and the Birth of The West
African Monetary Zone (WAMZ)
The difficulties in achieving the ECOWAS monetary integration owed partly to the
entrenched dichotomies among the Francophone, Anglophone and Portugese
colonies in the sub-region. The Francophone countries have a West African
Economic and Monetary Union known as UEMOA, which is regarded as more viable

64 Central Bank of Nigeria Economic and Financial Review March 2006
than any other integration arrangement involving other countries in the sub-region.
Therefore, its members undermine efforts at achieving the ECOWAS integration. To
meet the challenges posed by the Francophone UEMOA, the Anglophone countries
and Guinea, which though a Francophone colony but not a member of UEMOA,
thought it fit to have their own parallel umbrella union not only to serve as a basis for
comparison, but a necessary antidote that would foster an early convergence, fusion
and attainment of an ECOWAS-wide monetary union. Consequently, in its meeting
held from 20th - 21st December, 1999, popularly known as the Accra declaration,
Nigeria and Ghana initiated the Fast Track approach to integration. Since then, the
participating countries have risen to six, which include the Gambia, Guinea, Liberia
and Sierra Leone; and in December 2000, the West African Monetary Zone (WAMZ)
was established as the second monetary zone.
The objective is to facilitate rapid integration of the non-UEMOA countries into a
monetary union. The convergence criteria which the six countries must satisfy to
form the second monetary union include a single digit inflation rate of 5 per cent, a
budget deficit/GDP ratio of 4 per cent, reduction of Central Bank deficit financing to
10 per cent of the previous year’s tax revenue and a healthy reserves to imports ratio
of 3 to 6 months. These were to be achieved by 2002 and a common currency was to
be introduced in 2003 to commence the monetary union. However, the failure to
achieve the convergence criteria has led to series of postponements from 2003 to
2004, 2005 and now to December 1, 2009. According to Ashante (2001), the Fast
Track group commands about 69 per cent (152 million people) of the population, 66
per cent of the gross domestic product ($52,475 million), 68 per cent of total trade
($29,534 million) and 65 per cent of reserves within the ECOWAS group. Thus, the
Fast Track group now represents a formidable arm of the ECOWAS group.
V.4.1 Institutional Developments for the WAMZ
V.4.1.1 Political and Technical Institutions
In the WAMZ group, some of the institutional arrangements discussed under the
ECOWAS group are also replicated. These are the Authority of Heads of State
and Government, the Council of Ministers or Forum of Finance
Ministers, the Convergence Council, the Committee of Governors of
Central Banks, the Technical Committee, Joint Secretariat (WAMI and
WAMZ Secretariat) and the National Sensitization Committee (NSC). The
NSC is the equivalent of the ECOWAS NCC, but it is also mandated to carry out
sensitization campaigns in each member state.

Sagbamah: Perspectives on the European Monetary Union 65
Under the WMAZ group, they constituted Expert Working Groups to tackle
specific technical issues. The meetings of the three Expert Working Groups
deliberated on the WAMZ Work Programme and proposed action plans for the
successful implementation of the Work Programme before December 1, 2009, date
for monetary union.
Expert Working Group 1: It worked on macroeconomic convergence, statistical
harmonization and database development, financial integration, creation of customs
union and programmes for promoting regional development and integration.
Expert Working Group 2: It examined the development of zonal payments and
settlements systems for cross border transactions, preparation towards the
introduction of ECO and the national sensitization programmes.
Expert Working Group 3: It discussed the action plans for the ratification of the
WAMZ legal instrument and the activation of the WAMZ institutions such as the
West African Central Bank (WACB), the West African Financial and Supervisory
Authority (WAFSA), the Stabilization Cooperation Fund (SCF) and the WAMZ
Secretariat.
The implementation of these action plans would lead to the achievements of the Real
time Gross Settlement (RTGS) System as a payments mechanism, common
macroeconomic database, capital account liberalization, regional currency
convertibility, harmonization of financial and banking laws, common external tariff,
ECOWAS trade liberalization scheme, harmonization of customs and ports
procedures, sensitization, currency design and introduction of currency on December
1, 2009. Each policy, programme and project initiated by the expert working group
passes through the hierarchy from the Technical Committee, Committee of
Governors, and Council of Ministers for fine-turning before presentation to the
Authority of Heads of States and Government for approval.
V .4.1.2 Specialized Institutions of the WAMZ
West African Monetary Institute (WAMI)
The Institute which was established in 2001, is saddled with the responsibility of
preparing the grounds for and expected to metamorphose into the West African
Central Bank (WACB) to conduct monetary and exchange rate policies, manage
reserves, provide banking statistics and ensure an efficient payments system when

66 Central Bank of Nigeria Economic and Financial Review March 2006
the second monetary zone would have commenced operations. By 2009, the existing
monetary unions (UEMOA and WAMZ) are expected to decide on a formal date for a
merger to form a single monetary zone with a common currency and central bank for
the ECOWAS.
West African Central Bank (WACB)
The Bank with proposal to locate its headquarters in Ghana is expected to commence
operations on December 1, 2009. It will be responsible for the conduct of monetary
policy for the WAMZ group.
West African Financial Supervisory Authority (WAFSA)
The WAFSA is to be located in Nigeria and will coordinate other activities of central
banking such as banking operations, supervision, etc.
Stabilization and Cooperation Fund: The Fund will be used to provide credit
facilities for countries in temporary balance of payments crisis.
WAMZ Secretariat: The Secretariat which is being proposed for Guinea will
provide administrative functions to facilitate effective implementation and
coordination of the WAMZ programmes.
V.5 Comparative Analysis and the EU’S Lessons of Experience for the
ECOWAS
The foregoing analysis provides a brief historical background of the ECOWAS efforts
at integrating its economies into a monetary union. What follows is a comparative
analysis of the EU and ECOWAS integration processes to monetary unions in which
the lessons of experience from the EU success story would be drawn to guide the
ECOWAS integration. To do these, the analysis would be segmented into different
levels of integration.
Political Integration
The integration of nations into a political and economic entity requires enormous
political will on the part of the leadership. The will to carry the people along,
implement common decisions, open territorial boundaries for citizens of other
countries to undertake socio-economic activities and surrender some aspects of their
national sovereignty is critical and important if any integration must succeed. This is
indeed challenging, as the implementation of common policy measures could

Sagbamah: Perspectives on the European Monetary Union 67
contradict a nation’s internal political and economic interests. Political integration
provides the force which unites, facilitates and generates interest in implementing
common policy measures. In the EU experience, France and Germany spearheaded
and provided the leadership drive that galvanized and encouraged the leaders of
others countries to embrace and promote the ideals of the EU integration. Even
when Britain opted out, the leaders of these two countries sacrificed themselves to
provide needed political leadership for others to follow and achieve political
integration at both national and intra-regional levels.
In the ECOWAS sub-region, most leaders lack the political will and competence to
implement their own national economic policy reforms let alone those prescribed at
regional level. These are the direct results of poor leadership selection methods that
breed frequent crises which are common phenomena in the sub-region. The
consequence being the emergence of leaders who lack the political will and
commitment, fail to provide the basic needs of the people, but in perpetual conflict
and crises with the followership and pay lip service rhetorically to the ideals of a
monetary union. Furthermore, the strong tie of countries in the sub-region to their
colonial roots (Francophone, Anglophone and Portuguese territories) has tended to
fractionalize countries into these dichotomies, leaving behind a political vacuum that
is inimical to political integration.
Social Integration
Even if the integrating countries have the political will and provide the leadership
required for a well-focused integration process, their ability or inability to carry the
people along would have profound effect on the success of the integration
programmes. In this regard, the enlightenment and full participation of citizens of
the integrating countries are basic requirements for eliciting their support, and gain
their confidence in the integration process. Thus, social integration of the people
involves massive media enlightenment campaigns designed not only for sensitizing
people on the programmes of integration, but also for drawing attention on the need
for integration and the various benefits derivable in order to gain their total support
for the programmes. This is extremely weak in ECOWAS countries, particularly the
WAMZ countries. The mobilization exercise should embrace people of all professions,
including market women, trade unions, business associations and the academia. The
EMU countries had this experience which fostered support for the integration
process and provided the basis for articulating and resolving some fears and social
concerns. To allay the fears of minorities, the EU distributed institutions,

68 Central Bank of Nigeria Economic and Financial Review March 2006
infrastructural facilities, projects and development programmes in an even and
equitable manner. Also, the location and staffing of the institutions and sectoral
commissions were fairly distributed to encouraged relatively weaker nations. For
instance, the European Investment Bank is cited in Italy, the structural funds
(consisting of regional, social and agricultural guidance funds) are located in Spain
and the Integrated Mediterranean Programmes which were aimed at galvanizing
support for integration were directed at depressed areas of Europe, including
Southern France, Greece, Spain and Portugal.
Institutional Integration
The importance of institutional support for a successful implementation of any
programme cannot be over-emphasized. Indeed, institutions are the veritable
medium for decision-making, policy and programme implementation, monitoring,
evaluation and coordination. The significance of institutions and programmes for
achieving the lofty objectives of the EU and EMU informed the need for the
systematic discussions on the various institutions and programmes in parts 2 and 3
of this paper, respectively. Besides, the creation of an enabling environment for
facilitating programmes implementation within and among countries are also
products of institutions.
In the ECOWAS sub-region, and particularly the WAMZ zone, institutional
requirements and capacity for a monetary union are being established, while existing
ones are also undergoing reforms. The major political institutions for overall
integration coordination in ECOWAS are, Authority of Heads of State and
Government (the Council in EU), ECOWAS Parliament (the Assembly in EU),
Council of Ministers, Convergence Council, Committee of Governors and ECOWAS
Secretariat (play the role of Commission in EU) and ECOWAS Court of Justice (Court
of Justice in EU). In the EU, the Commission through Sectoral Commissioners
propose policies, programmes and projects for the ratification of the Council, they
are, therefore, the heart beat of the integration process. In ECOWAS, the Technical
Committee, Special Technical Commission, export working groups play the role of
Sectoral Commission in the EU. However, if the Authority of Heads of State and
Government/ Council of Ministers in ECOWAS lack the political will, commitment
and drive, which their EU counterparts had and still have, then the integration
process in ECOWAS will remain illusive. Furthermore, other important specialized
institutions such as EMI, ESCB, ECB and EBA provided technical or specialized
functions to facilitate the integration process. The counterparts of these specialized

Sagbamah: Perspectives on the European Monetary Union 69
institutions in ECOWAS are WAMI/WAMA (EMI in EU), the West African Financial
Supervisory Authority (WAFSA) which is ESCB in EU) proposed for Nigeria and the
West African Central Bank (WACB, which is ECB in EU) proposed for Ghana are still
in the process of being established. Apart from WAMI which is already functional, the
WAFSA and WACB will commence operations only at the threshold of
WAMZ/ECOWAS becoming a monetary union. The basic differences between the EU
institutions and their counterparts in ECOWAS are that ECOWAS institutions suffer
from lack of commitment, inadequate funding and staffing, thus becoming glorified
institutions. Nevertheless, it would be merely wishful to think that WAMI alone can
bring about a monetary union. Indeed, WAMI only provides technical guides and
relies entirely on sovereign governments on which it has no statutory powers to
enforce compliance to perform. Furthermore, as in the EU arrangement, each
national central bank retains its independence to perform other operational aspects
of central banking such as money market operations, funds transfer, issuance of
banknotes, management of reserves, lender of last resort, prudential supervision, etc,
which are distinct from the conduct of monetary policy that would be ceded to the
WACB when it commences operations in December 2009. Furthermore, the national
central banks will form the WAFSA as the central body for the coordination of their
operational functions which will provide inputs for feeding the WACB. Therefore, as
the EU model indicates, the existence of the proposed WACB does not extinguish or
eliminate the role of national central banks, rather the arrangement still retains a
decentralized central banking structure.
It is worthy of note to mention here that the system of appointing adhoc committees
or expert working groups to tackle or handle policies, programmes and projects for
regional development in the WAMZ should be replaced with permanent Sectoral
Commissions or Sectoral Departments that could be held accountable for
developments in their respective sectors. In this regard, such Sectoral Commissioners
or departments will handle matters on common banking supervision, payments and
settlement system, transportation, communications, trade, agriculture, industry, etc.
Market Integration
One of the fundamental objectives of every economic integration is the achievement
of a single large market. National markets, which are usually inaccessible, owing to
the existence of many barriers which are created to meet the economic, social and
political interests and other exigencies of countries, are opened up through market
integration. The process requires the removal of all barriers that are both tariff and

70 Central Bank of Nigeria Economic and Financial Review March 2006
non-tariff in nature, to facilitate trade in goods and services, capital and labour
mobility, as well as promote investment and production. The larger the size of the
market, the greater the level of competition and industrial output resulting from large
scale production. The EU achieved the removal of tariffs in the 1960s, but non-tariff
barriers were eliminated in the late 1980s when the “Single European Act” was
introduced in 1986. The Schengen Agreement of 1990 was a follow-up for the
elimination of any form of border check. In the ECOWAS, the trade liberalization
scheme has not been fully implemented by many countries. There are still many
trade restrictions, border and road checks, and other corrupt practices by
immigration, customs and other security personnel which militate against market
integration.
Financial Integration
A well-developed financial market, consisting of vibrant money and capital markets,
is essential for the promotion of trade, output growth and overall economic
development. Fortunately, the European financial markets in London, Frankfurt,
Paris, Brussels, etc are highly developed and competitive, with currencies that were
internationally and regionally convertible before the introduction of the euro. The
computerization of financial services and the introduction of a variety of financial
products, internet and e-mail have improved efficiency and service delivery. With the
introduction of the euro, cross-border funds transfer is facilitated through the use of
the Trans-European Automated Real-Time Gross Settlement Express Transfer
(TARGET) which automatically debits and credits parties to all transactions across
Europe on real time basis.
In this area, the ECOWAS countries have poor money and capital markets, which are
limited by non-convertible currencies, inefficient and outdated payments and
settlement system, weak and absence of uniform banking supervision and capital
market conventions. These are further constrained by poor power supply,
telecommunications and computer facilities, all of which constitute barriers to trade.
Infrastructural Integration
Infrastructure play important role in promoting intra-regional trade and
development. The conscious and collective efforts aimed at standardizing the
development of roads, rail, air and water transportation, energy, water supply and
telecommunications across Europe have aided trade and economic development.
They are indeed critical for rapid trade, financial and production integration in

Sagbamah: Perspectives on the European Monetary Union 71
Europe. On the other hand, poor power supply, bad roads, poor telecommunications,
lack of ships and planes for water and air transportation, lack of trains for rail
transportation among the ECOWAS countries are serious impediments to effective
integration.
Production Integration
This involves the harmonization and standardization of all production activities in a
region. This led to the rationalization of industries in Europe and the introduction of
common sectoral policies such as Common Agricultural Policy (CAP), Common
Industrial Policy (CIP), Common Iron and Steel Policy under the European Coal and
Steel Community, etc and supported by research and development institutions and
programmes such as RACE, and ARAINE, BRITE, EURATOM, etc, for satellite,
computer and energy, respectfully. The rationalization and standardization of
production through common sectoral policies and supported by research and
development institutions and programmes are issues which have not been sufficiently
addressed in the ECOWAS.
Economic Integration
The processes of institutional, market, financial, infrastructural and production
integrations are the forerunners which lay a solid bedrock of economic integration.
In the case of the EU, these are further supported by specialized funds such as the
European Regional Development Fund, European Agricultural Guidance and
Guarantee Fund, European Investment Bank, European Social Fund, etc, all of which
promote economic growth and development, thus, facilitating economic integration.
However, the transformation into an economic integration takes place when the
economies of member countries are further harmonized into a large economy
through a set of convergence criteria. The criteria which were contained in the
Maastricht treaty of 1992 were implemented by member countries. The failure in
achieving institutional, social, market, financial and production integration, which
serve as basic foundations, has constituted a serious constraint to economic
integration in the ECOWAS. Consequently, meeting the set convergence criteria by
member countries has been a herculean task. Indeed, there have been no consistent
efforts toward realizing the convergence criteria. The performances of countries have
fluctuated remarkably from one year to another; even to the extent that the record of
achievement of two criteria in a country for a particular year may be reversed in the
following year, indicating worsening conditions.

72 Central Bank of Nigeria Economic and Financial Review March 2006
Monetary Integration
In addition to the requirements for economic integration, the introduction of a
common currency which would necessitate the withdrawal of national currencies
constitutes a monetary integration or monetary union. At this level of integration, the
conduct of monetary policy, in which the direction of inflation, interest and exchange
rates are critical performance indicators, is vested in a supranational central bank,
while the national central banks perform the functions of banking operations,
supervision, etc. In the case of the European Union, the introduction of the euro and
the establishment of the European Central Bank marked the commencement of the
European Monetary Union. In the ECOWAS sub-region, the planned introduction of
a single currency and, thus, a single monetary zone in 2005 was evidently not
feasible, largely because of the poor foundation of economic parameters on which to
advance to monetary integration.
Sequencing of Integration Process
The various layers or structure of integration discussed above is a deliberate effort to
show generally a sequence which a monetary integration process should take. The
political decision of governments to form a monetary union can only be realized when
the people are mobilized and the right institutions created to drive the integration
process. Thus, political, social and institutional integration provide adequate
capacity for integration.
Following the provision of adequate capacity, we can then proceed to lay the critical
foundation for success. First and foremost, is to achieve market integration. The EU
spent about three decades to achieve a common market. A common market is the
bedrock which inevitably stimulates and encourages financial and infrastructure
integration. The combined effects of these accelerate production integration;
because, the size or extent of market determines the overall level of production. If
these which collectively provide a critical foundation for a successful monetary
integration are non-existent, then calling for convergence criteria and introduction of
a single currency are like placing the cart before the horse; and certainly as this
proverb goes, a house that is built on a sandy or shaky foundation does not stand.
The poor countries’ performances with respect to the convergence criteria reveal or
reflect the weak foundation on which ECOWAS or WAMZ integration process stands.
ECOWAS or WAMZ member countries dissipate energy integrating in all fronts
without a clear focus or a direction of integration.

Sagbamah: Perspectives on the European Monetary Union 73
It is only when a solid foundation has been laid that we can commence the
application of harmonization of policies. These include the implementation of
convergence criteria policy for economic integration and introduction of a common
currency to commence monetary policy.
VI Policy Recommendations for the Ecowas Subregion
Arising from the foregoing analysis are policy recommendations to address the
problems undermining the achievement of ECOWAS monetary union.
A major policy thrust emerging from the analysis above is the need for the leadership
of every member country to provide the political will and commitment needed for the
implementation of ECOWAS policies and programmes for integrating the subregion.
Furthermore, the expected merger of the two unions will require the concerted efforts
of countries such as Nigeria, Senegal, Ghana and Benin Republic to provide the
needed leadership and total political commitment for other countries to follow.
An appropriate framework for mobilizing the people who are the agents for achieving
economic reforms and integration is absolutely necessary. It may be difficult to
mobilize hungry people. Therefore, the ECOWAS governments should provide jobs,
affordable housing, improved healthcare services, education and water supply under
various policies and programmes in order to form the basis for effective social
integration to attract the people’s support, confidence and participation. The
sensitization programme should include seminars/workshops, rallies, posters, bill
boards, banners, radio/television jingles, and radio/television discussions.
The right institutions should not only be created but should be empowered in order
to make them effective in driving the integration efforts. Therefore, WAMA/WAMI,
WACB, WAFSA, WABA should be well-funded and staffed to provide the technical
support for nurturing the ECOWAS integration. The setting up of permanent sectoral
commissions or departments to facilitate the speed of policy proposal,
implementation and supervision, evaluation and reviews is extremely important for
the WAMZ group, rather than addressing sectoral issues on an adhoc expert
committee basis.
To make the sub-region market accessible as the bedrock of integration, ECOWAS
needs to review the trade liberalization policy as was the case with the EU’s Single
Act. It should effectively eliminate all tariff and non-tariff barriers, enforce the

74 Central Bank of Nigeria Economic and Financial Review March 2006
protocol of free movement of goods, capital and persons across countries. It should
stipulate appropriate penalties or sanctions for non-compliance through a simple
majority voting.
There is need for the harmonization of financial market (money and capital)
conventions and best practices including banking consolidation and supervision,
efficient payments system, computerization, standard telecommunications facilities
such as the Real Time Gross Settlement (RTGS) System that is being implemented by
some ECOWAS countries and should be complemented by internet, e-mail, telex and
fax machines services to facilitate same time cross border transactions and
settlements.
The provision of adequate infrastructure promotes trade and rapid integration.
Therefore, member countries should place priority in the provision of standardized
strategic roads, rail, air and water transportation; general telecommunication
facilities as well as energy and water supplies, all of which are basic requirements for
successful integration. In this connection, a major ECOWAS road being constructed
from Nigeria through the sub-region to Senegal for the free flow of vehicular
movement and the West African Gas Pipeline/West African Energy Power Pool
projects to provide energy are indeed commendable. Similar steps should be taken to
provide water, air and rail transportation.
To facilitate production integration, ECOWAS should promote common agricultural,
industrial, research and development policies as well as regional development
programmes and projects. In these contexts, the Common Agricultural Policy (CAP)
and Common Industrial Policy (CIP) already approved should be seen to be
implemented by all countries to ensure standards for the sub-region.
The effective application of appropriate mix of internal monetary, fiscal,
exchange rate and debt management policies by member countries to promote
economic development and achieve the convergence criteria set for the WAMZ area is
crucial for attaining economic integration of member states.
The existing economic structure and macroeconomic indicators in ECOWAS are still
weak, and should be strengthened to provide a basis for the introduction of a single
currency for the commencement of a monetary union. Indeed, these limitations

Sagbamah: Perspectives on the European Monetary Union 75
informed the postponement of the introduction of the ECO currency in the WAMZ
area to 2009.
With respect to the sequencing of integration, ECOWAS/WAMZ should place more
emphasis on achieving the requirements of a common market as recommended in
(iv). This is a prerequisite and necessary foundation which determines the success of
other higher levels of integration.
VII Summary and Conclusion
The paper discussed the historical evolution of the EEC, now known as the EU, which
progressed from a free trade area, customs union and to a common market. At this
stage, the vision of the founding fathers was to transit into a monetary union,
comprising a conglomeration of the national economies of Europe into a monolithic
entity (the EU) which was earlier suggested as the United States of Europe. By the
mid 1980s, the Single Act agreement removed all the barriers militating against the
attainment of a common market, and prepared the stage for advancement into an
economic union. Thus, the 1992 Maastricht Treaty, which specified the convergence
criteria for all participating countries, was a remarkable advancement into an
economic union. By 1998, when the economies of most of the participating countries
were adjudged to have met all the convergence criteria and certified as an economic
union, the stage was set for the most memorable event of the march towards
attaining a monetary union. Following the design and adoption of a single currency
and the necessary preparations, the EU launched the European Monetary Union on
January 1, 1999 when the single currency, the euro, was introduced.
The introduction of the euro had some significant implications for the entire region,
these included currency, money market, capital market, foreign exchange market and
reserves management as well as implications for the UEMOA Francophone countries.
These countries’ monetary union is anchored on the CFA franc with a fixed parity to
the former French franc, and now the euro. The relevance of these implications in
the context of an ECOWAS monetary union cannot be overemphasized; adequate
preparations should, therefore, be made to provide a basis for ECOWAS effective
integration. The EU’s lessons of experience indicated that the integration processes
leading to the achievement of the EMU, was a great feat that was well planned and
implemented progressively from one level to the other. Political integration was
necessary to provide the leadership will and drive, which was reinforced by the
appropriate social integration aimed at sensitizing and mobilizing the people to

76 Central Bank of Nigeria Economic and Financial Review March 2006
realize the desired objectives. Institutional integration was the pivot for directing the
course of integration and also for realizing market, financial, infrastructural,
production, economic and monetary integration.
These processes must be given adequate consideration, articulated properly, well
sequenced and focused to achieve the ECOWAS’ objectives if it desires to spend fewer
years to attain its monetary union.

Sagbamah: Perspectives on the European Monetary Union 77
Appendix
Table 1: EMU Convergence Criteria
Inflation (%) Long Term Interest Rate (%) Government Balance (% GDP)
1996* 1995 1996 1997 1998 1995 1996 1997 1998 1995 1996 1997 1998
EMU Reference Value 2.6 3 2.3 2.8 3.3 9.7 9.1 8.4 7.9 -3.0 -3.0 -3.0 -3.0
Belgium 1.8 1.6 2.5 2.3 2.2 7.5 6.5 6.0 5.9 -4.1 -3.3 -3.0 -3.0
Denmark 1.9 2.1 2.1 2.2 2.5 8.3 7.2 6.3 6.4 -1.6 -1.5 0.7 0.5
Germany 1.2 1.8 1.4 1.6 1.8 6.8 6.2 5.9 5.9 -3.5 -3.9 -3.2 -3.2
Greece 7.9 9.0 8.2 5.0 4.0 17.4 14.8 11.3 10.0 -9.1 -7.6 -5.7 -5.0
Spain 3.6 4.7 3.6 2.3 2.5 11.3 8.7 6.8 6.3 -6.6 -4.4 -3.3 -2.9
France 2.1 1.8 2.0 1.7 1.9 7.5 6.3 5.8 5.9 -4.8 -4.1 -3.2 -3.0
Ireland na 2.5 1.7 1.7 2.0 8.3 7.3 6.4 5.9 -2.4 -1.5 -1.1 -0.5
Italy 4.0 5.4 3.8 2.0 2.4 12.2 9.4 7.3 6.6 -7.1 -6.8 -3.8 -3.5
Luxembourg 1.2 1.9 1.4 1.8 2.0 7.6 6.5 6.0 5.9 1.5 1.5 0.8 0.5
Netherlands 1.5 2.0 2.1 2.3 2.2 6.9 6.1 5.9 5.9 -4.0 -2.2 -2 -1.7
Austria 1.8 2.2 1.9 1.7 1.9 7.1 6.3 5.9 5.9 -5.9 -3.9 -3.0 -3.0
Portugal 2.9 4.1 3.1 2.7 2.7 11.4 8.6 6.8 6.4 -5.1 -4.0 -3.1 -2.9
Finland 1.5 1.0 0.6 1.2 1.8 8.8 7.0 6.3 6 -5.6 -2.9 -1.7 -0.7
Sweden 0.8 2.5 0.5 1.0 2.0 10.3 8.0 6.9 6.9 -8.1 -3.5 -2.5 -1.0
United Kingdom na 2.8 3.0 2.7 3.0 8.2 7.8 7.3 7.0 -5.6 -4.4 -2.8 -2.7

78 Central Bank of Nigeria Economic and Financial Review March 2006
Government Debt (%of GDP) E M S Criteria Met
1995 1996 1997 1998 1995 1996 1997 1998
EMU Reference Value 60 60 60 60 E M S
Belgium 134 131 128 125 YES 2 1 3 3
Denmark 72 71 67 65 YES 3 4 4 4
Germany 58 60 61 62 YES 3 3 2 2
Greece 112 109 105 102 NO 0 0 0 0
Spain 66 68 68 67 YES 0 1 2 3
France 53 55 57 58 YES 3 3 3 4
Ireland 86 80 76 71 YES 4 4 4 4
Italy 124 123 121 121 NO 0 0 2 2
Luxembourg 6 5 4 4 YES 4 4 4 4
Netherlands 80 78 75 72 YES 2 4 4 4
Austria 69 71 69 69 YES 2 4 4 4
Portugal 72 70 68 67 YES 2 2 3 3
Finland 60 61 61 60 YES 0 1 2 3
Sweden 79 78 77 76 NO 1 2 3 3
United Kingdom 54 56 57 57 NO 3 2 4 4 *Harmonized indices of consumer prices. Source: ING Eurovied

Sagbamah: Perspectives on the European Monetary Union 79
References
Adedeji A. (1990) “The European Integration Process: Lessons for Africa”, Bullion CBN.
Annual Report & Statement of Account,(1998) Published by Central Bank of Nigeria,.
Asante, R.D. (2001),”The Rationale and Feasibility of a Second Monetary Zone in ECOWAS”, Bullion Publication of Central Bank of Nigeria, Volume 25, no. 2.
Augusto Lopez - Clur, (1987) “The European Community: On the Road to integration”.
Bundus A., (1990)“European Monetary System; Lesson For ECOWAS”, Bullion CBN.
Dolan M. B, (1990) “The Single European Act, Origin and Implications’, Bullion, CBN.
ECOWAS Bank for Investment and Development Group Business Plan Publication, August, 2005.
EL-Agraa, A. M, (1999)“Regional Integration, Experience, Theory and Measurement, Palgrave Macmilliam, second edition.
Financial Times (1998),”ECB’s Votes System Gives A Big Stick to the Outsiders”, December 22, 1998.10.
Financial Times, (2000.) Prodi’s Commission Fails to Live-up to Early Hopes”, July 10,
Hadjimichael, M.T. and Galy, M. (1977) “The CFA Franc Zone and the EMU”, International Monetary Fund, African Department.
ING Bank News (1997) Financial Institutions, May,
ING Barings (1998). Financial Institutions, CFA Franc and the Euro, June
ING Euro Desk (1997), “Euroview 2, Economics Department/ ING Euro Desk”, Amsterdam,.
Machlup, F (1977) A History Thought on Economic Integration (London, Macmillan)
National Planning Commission, (2004) NEEDS, NIGERIA, National Economic Empowerment and Development Strategy,
Nwachukwu, N. E. and Etentuk, M. E. (2004) “The West African Gas Pipeline Project: A Vehicle for Economic Integration in The West African Sub-region” Bullion, CBN.
Obaseki, P.J. (2001), Monetary Cooperation under the ECOWAS: Issues, Progress and Prospects’’, Bullion Publication of Central Bank of Nigeria, Volume 25, no. 2.

80 Central Bank of Nigeria Economic and Financial Review March 2006
Philips A. O. (1990) “The European Monetary System: Any Lessons For ECOWAS”, Bullion CBN.
Schiff.M. and Winters.L.A (2003) “Regional Integration and Development,” Published by World Bank and Exford University Press.
The Economist International Magazine (1999) “Will Europe Fiscal Straight jacket Prove the Euro’s Undoing?” January 9-15.
The Economist International Magazine (1999) “Gambling on the Euro” January 2nd -
8th
The Economist International Magazine (1999), “Britain’s Economists Favour Joining European Monetary Union”, April 17-23.
The Guardian, (2002) Pages 1 and 2 devoted on the circulation of the euro. January 1
The Wall Street Journal Europe, (1999) “Should Britain Join EMU?” June 11-12.
The Wall Street Journal Europe, (1999) “The European Union Deficit Bugaboo”, February 19-20.
The Wall Street Journal Europe, (1999) “The Road to European Unity”, p5, January 4
The Wall Street Journal Europe, (1999)“The Need for A New Stability Pact”, May 28-29.

Central Bank of Nigeria Economic and Financial Review Volume 44/1 March 2006 81
External Debt, Investment and Economic Growth: Evidence from Nigeria
Aloysius Ajab Amin & Isa Audu∗
This paper studies the impact of external indebtedness on Nigeria’s economic performance. We find
supportive evidence for the crowding out and debt overhang hypotheses in Nigeria. Based on these results,
the paper concludes that the prospects of resolving the debt crisis in Nigeria will depend on deeper debt
relief, diversification of export base and substantial direct foreign investment. Debt relief will enable the
country to use the lean foreign exchange earnings to procure the badly needed inputs for the industrial
sector and upgrading of infrastructures. However, without a stable political and macroeconomic
environment, efforts at reducing the external debt burden may not be very successful.
Keywords: External Debt, Economic Growth, Public Investment, Nigeria
JEL Classification Numbers: F34, F43, H54, H63
Authors’ e-mail: [email protected]; [email protected]
I. Introduction
here is a widespread recognition in the international community that excessive
foreign indebtedness of many developing countries remains a major
impediment to their stability and growth. Developing countries have contracted
large amount of debts, often at highly concessional interest rates particularly in
the 1970s. The hope was that these loans would put them on faster development path
through higher investment and faster growth. But as debt service ratios reached very
high levels in the 1980s, it became clear that for many of these countries, debt repayment
would constrain economic performance in their countries. More importantly, it would
be virtually impossible to repay back these loans and leave reasonable resources to
support the domestic economy.
∗ This paper was written before Nigeria secured the substantial debt cancellation from the Paris Club of Creditors in 2005 under the Policy Support Instrument (PSI). The views expressed herein do not represent the views of the institution to which the authors are affiliated. The authors acknowledge the comments and suggestions of anonymous reviewers. All remaining errors are the authors’ responsibility
T

82 Central Bank of Nigeria Economic and Financial Review March 2006
Attempts to cope with the debt crisis through the adoption of IMF-supported
programmes proved unsuccessful in alleviating the excruciating debt problem. The
Although, Structural Adjustment Programme (SAP) had some benefits like for instance
easier access to foreign exchange, significant improvement in non-oil exports as a result
of export incentives and improvement in Government revenue. However, SAP have
invariably resulted in increasing unemployment, low capacity utilisation, galloping
inflation, high incidence of poverty, unsustainable fiscal deficit and further escalation of
debt, among others. The Highly Indebted Poor Countries (HIPC) Initiative formulated
by the IMF/World Bank has also fallen short of what is required to re-establish the
conditions for sustained economic growth. The fiscal burden of debt servicing is inimical
to economic growth and, is, in fact, an important reason for the failure of SAP to restore
economic growth in many of the debt distressed countries.
The international community reacted to this development by coming up with plans to
ensure that these indebted countries secure some relief. Such efforts as the Brady Plan,
the Trinidad/Naples Terms, the Mauritius Mandate and the HIPC Initiative were all put
forward to address what has now become the debt crisis. It is a global crisis because any
massive default will rock the international financial system to its very foundations and,
possibly, lead to a worldwide depression.
Several factors, both domestic and external, were advanced as reasons for the
deteriorating African debt crisis. High among them was excessive borrowing by LDCs in
the 1970s, the oil price shocks of 1973/74 and 1979/80 and worsening terms of trade.
Other factors affecting the debt burden include rising world interest rates resulting from
monetary contractions in some advanced countries and exchange rates fluctuation.
Inappropriate domestic macroeconomic policies and political instability also played a
major role in retarding the debtor nations’ ability to grow out of debt burden, creating
uncertainty, which compounds the problem of business planning and production (Iyoha,
1999). Ever since, the issue of external debt and its servicing has remained a topical
subject dominating discourse on the international political economy.
The main objective of this study is to examine the impact of Nigeria’s external
indebtedness on public investment and economic growth from 1970-2004. This study
is encouraged by the fact that no known study has explicitly modeled the interaction
between external debt, public investment and economic growth in Nigeria by employing
Ajab and Audu: External Debt, Investment and Economic Growth 83
the cointegrating modeling techniques. Previous studies in Nigeria generally analyzed
the impact of external indebtedness by particularly concentrating on total/private
investment or savings level rather than assessing the impact of debt overhang on
economic growth and public investment.
The paper is divided into six sections. After the introduction, section 2 examines
Nigeria’s macroeconomic performance in the last 34 years (1970-2004); section 3
examines the genesis, trend, magnitude and structure of Nigeria’s external debt. Section
4 reviews relevant literature. Section 5 provides models specification, empirical analysis
and interpretation of results. Finally, section 6 gives the policy implications,
recommendations and conclusion.
II. Macroeconomic Performance
The Nigerian economy has passed through various phases of development in the last 34
years (1970 – 2004). The analysis of the performance of the economy would, therefore,
be divided into three distinct periods: (i) 1970-1980, (ii) 1981-1994 and (iii) 1995-2004.
In the period 1970-1980, the Nigerian economy enjoyed remarkable growth. This period
was characterized by massive inflow of foreign exchange earnings mainly from crude oil
exports. Nigeria’s financial credibility in the international markets was not in doubt.
For the greater part of the 1970s, domestic and direct foreign investment was at an
impressive level. These helped to sustain real GDP growth at reasonably high levels.
The economy recorded an average growth rate of 5.0 per cent per annum during the
period. On the external sector, the country enjoyed favorable balance of payments
position owing to the significant boost from oil exports even though non-oil exports
became virtually extinct. The sector sustained an average current account surplus of 1.5
per cent of GDP during the period, while gross international reserves averaged the
equivalent of about seven months of imports. By 1980, the country’s external debt was
only US$8.9 billion or 13.9 per cent of GDP, and the debt service ratio was a modest 0.7
per cent.
The inflation rate during this period average 14.6 per cent, although, there were three
periods in which the inflation rate was over 20 per cent. The exchange rate as shown by
the index of the market rate (1995=100) was generally over-valued, with the resulting

84 Central Bank of Nigeria Economic and Financial Review March 2006
cheapening of imports while penalizing domestic production and exports. In other
words, overvaluation of the naira enhanced its purchasing power vis-à-vis other
international currencies.
In the period 1981-1994 Nigeria witnessed serious economic downturn and
macroeconomic aggregates showed unsatisfactory performance. Specifically, between
the period 1981 and 1984 the rate of economic growth measured by the rate of growth of
real GDP, recorded negative growth rates. The GDP achieved its best performance in
1988, but declined thereafter. It should be pointed out that the real GDP has been
growing at a decreasing rate since 1988 when it grew at 10.0 per cent; thereafter, the
figures continued to declined with the exception of 2003 when the economy achieved
another 9.6 per cent GDP growth rate (see table 1). The sharp drop in the real GDP
growth rate in the period 1989 to 1994 indicated quite clearly that the GDP growth rate
was not self-sustaining (see figure 1).
The economy also witnessed double-digit inflation during the period under review, with
the exception of 1990 when the composite consumer price index grew by 7.5 per cent.
Specifically, the inflation rate was 57 per cent in 1994 (see table 1).
Figure 1: Real GDP Growth Rate
Real GDP Growth Rate 1970-2004
-15
-10
-5
0
5
10
15
1970 1972 1974 1976 1978 1980 1982 1984 1986 1988 1990 1992 1994 1996 1998 2000 2002 2004
Year
Gro
wth
Rat
e
Real GDP
Source: Central Bank of Nigeria (CBN) Annual Report (various issues), World Bank (2002) African Data
Base, CD-ROM, Washington D. C.

Ajab and Audu: External Debt, Investment and Economic Growth 85
Thus, the objective of securing a non-inflationary growth was not reasonably attained.
The crisis in the oil market, which in turn adversely affected industrial performance, and
the long-standing neglect of agriculture accounted for the decline. The fiscal operations
of the government were consistently in deficit while the balance of payments remained
under intense pressure. The external reserves fell to US$1,041.4 million in 1983-the
lowest level in ten years. At this level, external reserves could only support 1.05 months
of imports, a situation which improved only marginally to 2.8 months of imports in 1985.
The improvement in the reserves position in 1985 was very artificial, as there was an
ample evidence to show that external trade arrears had accumulated. There was a
dramatic jump in external debt from US$10,667.7 million in 1981 to US$29,428.8 in
1994 or 175 per cent increase in just 13 years. The debt service ratio rose
correspondingly from 4.8 per cent in 1981 to 19.5 per cent in 1994. To reverse the
worsening economic fortunes in terms of declining growth rate, galloping inflation,
worsening balance of payments, escalating debt burden and increasing/unsustainable
fiscal deficits, among others, government introduced austerity measures in 1982. Due to
the unimpressive impact of these measures, an extensive structural adjustment
programme was put in place with emphasis on demand management to address the
issues of expansionary and inflationary policies in August 1986.
During the period 1995 to 2004, the performance of the Nigerian economy was rather
mixed. In the sub-period 1995 to 1998 the various macroeconomic aggregates moved in
the right direction. GDP growth rose from 2.4 per cent in 1995 to 3.4 percent in 1996.
The fiscal deficit/GDP ratio which was negative for most of the years, showed a positive
rate of 0.1 per cent in 1995. The rate of inflation which was about 72.8 per cent in 1995,
declined to about 29.3 per cent in December 1996. The exchange rate remained stable
for over twenty months, interest rates had been decapped and the external sector
experienced less pressure. However, debt stock trended upward to US$32,584.8 million
in 1995 before it dropped to US$28,060.0 and US$27,087.8 million in 1996 and 1997,
respectively. The external reserves increased from US$1,410.0 million in 1995 to
US$4,080.0 million in 1996. These favorable economic fundamentals resulted from the
curtailment of wasteful expenditure, attainment of relative stability in the foreign
exchange market and the re-establishment of a favourable macroeconomic environment.
Nonetheless, the economy witnessed unprecedented corruption, mismanagement and

86 Central Bank of Nigeria Economic and Financial Review March 2006
international isolation due to alleged human right abuses (CBN, 1993 Perspective of
Economic Policy Reforms).
However, after six years under the democratic experiment, the economy is still groaning
under the strains of past events. GDP per capita has been on the decline. In 2004, it was
estimated at US$300 compared to US$316 in 1996 and far below its peak of over
US$1000 achieved in the 1980s. The fiscal deficit/GDP ratio, which showed a positive
rate of 6.3 per cent in 2000, recorded a negative rate of 8.9, 2.8 and 3.0 per cent in
2002, 2003 and 2004 respectively. The GDP growth, which averaged below 3.0 per cent
between 1995 and 1999, took an upward turn in 2000 to 2004 increasing from 3.9 per
cent in 2000 to 4.7, 4.6, 9.6 and 6.6 per cent in 2001, 2002, 2003 and 2004,
respectively. However, on the average this is slightly short of the government target of
6.0 per cent. It is important to stress that because Nigeria's population is growing at
about 3.0 per cent per annum, this improvement in GDP growth made little impact on
the overall standard of living in the country (CBN Annual Reports and World Bank
African Data Base 2003).
Average inflation rate more than doubled to 18.9 per cent in 2001, from about 7.0 per
cent in 2000, but declined to 15.0 per cent in 2004. In addition, the naira depreciated
against the US dollar, from an average of =N=80/US$1 in 1996 to =N=133.5 in 2004 at
the official foreign exchange market. Similarly, the average parallel market rate and
bureaux de change rates depreciated from =N=85/US$1 in 1995 to =N=140.8/US$1 in
2004 (CBN Annual Report 2004).
III. Genesis, Trends, Magnitude and Structure of Nigeria’s External
Debt
Genesis of Nigeria’s External Debt
The origin of Nigeria’s external debt dates back to 1958 when a sum of US$28 million
was contracted for railway construction. Between 1958 and 1977 the resort to foreign
borrowing was minimal, as debts contracted during the period were the concessional
loans from official sources such as the World Bank and Nigeria’s major trading partners
(i.e. bilateral and multilateral sources). These debts did not exert much pressure on the
economy because the interest charged on them was generally low, with longer repayment

Ajab and Audu: External Debt, Investment and Economic Growth 87
period from ten to forty years and this constituted about 78.5 per cent of the total debt
stock. Moreover, the country had a comfortable external reserve as a result of the
unprecedented inflow of foreign exchange receipts from crude oil exports. Nigeria was
then able to lend to the International Monetary Fund (IMF) in 1974 under the oil facility.
In fact, Nigeria was regarded as “under-borrowed” in relations to the absorptive capacity
of the economy.
With the emergence of oil glut in 1978, however, Nigeria’s revenue from the oil sector
declined and it become expedient to borrow to support the balance of payments and to
finance projects. This led to the promulgation of Decree No. 30 of 1978, limiting the
external loans the federal government could raise to =N= 5.0 billion (US$7.7 billion).
Faced with serious deterioration in the foreign exchange position, the Nigerian
authorities were forced to raise the first “jumbo loans” of US$1 billion from the
International Capital Market (ICM) in 1978. It was probably the largest Euro loan ever
obtained by an African country. The loan had a repayment period of eight years,
including a grace period of three years. The loan was used to finance various medium -
long- term projects most of which did not yield any revenue many years after repayment
on the project had commenced. The importance of these loans was that the profile of
Nigeria’s foreign debt was completely altered. Before this time, the bulk of Nigeria’s
loans was sourced from bilateral and multilateral institutions, which by their nature,
were development oriented with generous conditions in terms of maturities, low and
fixed interest rate and long grace period. In contrast, ICM loans are generally of less
favorable terms.
Another characteristic of the "jumbo loan'' was that it attracted a floating interest rate,
which was linked to the London Inter Bank Offered Rate (LIBOR). The effect of this was
that it made planning more difficult since the expected stream of debt service payments
could not be calculated with certainty. Thus, at the end of 1979, the level of total debt
drawn and outstanding had increased two-fold from the level of US$3.1 billion in 1977 to
US$6.2 billion in 1979. But this was comfortable at 37.1 per cent of exports and 8.1 per
cent of GDP. It is important to stress that the single act of borrowing from Euro markets
by the Obasanjo-led military administration opened the floodgates for the imprudent
borrowing by state governments. Consequently, the share of loans from bilateral and

88 Central Bank of Nigeria Economic and Financial Review March 2006
multilateral sources declined substantially while borrowing from private sources at
higher interest rates and stiffer conditions increased considerably.
The recovery of the oil market in 1979, with oil prices rising to an all-time high of
US$40.00 a barrel in 1980/81, gave a notion of a buoyant economy. Consequently, some
deflationary measures put in place in 1978 were relaxed by the second republic
administration. But a new consumption pattern that favored imported goods emerged.
The import substitution industrialization strategy that was being pursued then also
depended heavily on imported raw materials and appreciated exchange rates. Besides
indiscriminate and excessive importation, there were also cases of over-invoicing and
non-shipment of actual goods for which letters of credit had been established (Africa’s
Debt Crisis, NES Selected Paper for the 1994 Annual Conference).
However, the oil boom was short-lived and when it collapsed in the early 1980s the
economy immediately suffered considerable strains. The production and consumption
pattern that emerged in the era of oil boom could not be sustained in the face of
declining foreign exchange earnings in the 1980s. Rather than address the problem of
declining foreign exchange revenue, both the federal and state governments embarked
on massive external borrowing from the International Capital Market (ICM). Thus,
pressure mounted on the various sectors of the economy resulting in huge imbalance in
government finances, low external reserves, deficits in the balance of payments and
accumulation of trade arrears in respect to both insured and uninsured trade credit.
Today, the country is under the burden of an unprecedented debt crisis. Thus, during
the period 1980-1983, the debt position almost doubled from US$8.9 to US$17.7 billion,
an increase of almost US$9 billion or 98.8 per cent in only three years.
The reality and magnitude of Nigeria’s debt problem did not dawn on her until 1982
when foreign creditors refused to open new lines of credit due to the country’s inability
to settle her import bills. This resulted in the accumulation of trade arrears amounting
to US$9.8 billion between 1983 and 1988. It then became necessary for Nigeria to seek
relief by refinancing the trade arrears. The first refinancing exercise, which was in 1983,
converted outstanding letters of credits worth US$2.1 billion. In 1984, the government
refinanced the remaining trade arrears especially those contracted through open account
and bills for collection by the issuance of promissory notes worth US$4.8 billion. Since

Ajab and Audu: External Debt, Investment and Economic Growth 89
then, Nigeria has signed six other restructuring agreements; three with the London Club
in 1987, 1989, and 1991. Apart from the promissory notes agreement, which has a
repayment period of 22 years, the various rescheduling arrangements provided
temporary debt relief. Indeed, the debt stock increases with every Paris Club
rescheduling. With some agreements running concurrently, there was a bunching of
maturities. While the London Club deal, which was closed in 1992, reduced the stock of
debt by US$3.8 billion, the Paris Club rescheduling increased the debt stock with
capitalization of amounts rescheduled. Consequently, the dual problem of external debt
service burden and debt overhang emerged.
Trends, Magnitude and Structure of Nigeria’s External Debt
In absolute terms, the total external debt stock rose from a meagre US$567 million in
1970 to US$5,091 million in 1978. Between 1979 and 1985, it increased further from
US$6,216 million to US$18,904.0 million. It stood at US$25,574.0 million in 1986, and
peaked at US$33,730.0 million in 1991. Thus, between 1985 and 1991, the debt stock
increased by US$14,826.0 million or 78.4 per cent in just six years. During this period,
the increase has been astronomical due to the indiscriminate resort to external
borrowing ostensibly to finance projects coupled with the crash in international oil price
in 1982 ( World Bank African Data Base, 2003).
With the debt buy- back arrangement and the issuance of collateralized par bonds to the
London Club of creditors in 1992, the debt stock dropped from US$33,730.0 million in
1991 to US$27,564.0 million in 1992. This changed in a significant way the structure of
Nigeria's external debt. However, by 1993, 1994 and 1995 the debt stock trended upward
to US$28,718.2, US$29,428.9 and US$32,584.8 million, respectively. The debt stock
then dropped to US$28,060.0 and US$27,087.8 million in 1996 and 1997, respectively.
This was mainly because new loans were not contracted after the reconciliation exercise
conducted in 1995 to ascertain the genuineness of some external claims. However, by
2003 and 2004, it had moved upward again, recording a total outstanding balance of
US$32,916.8 and US$35,944.6 million, respectively (see figure 2 below).
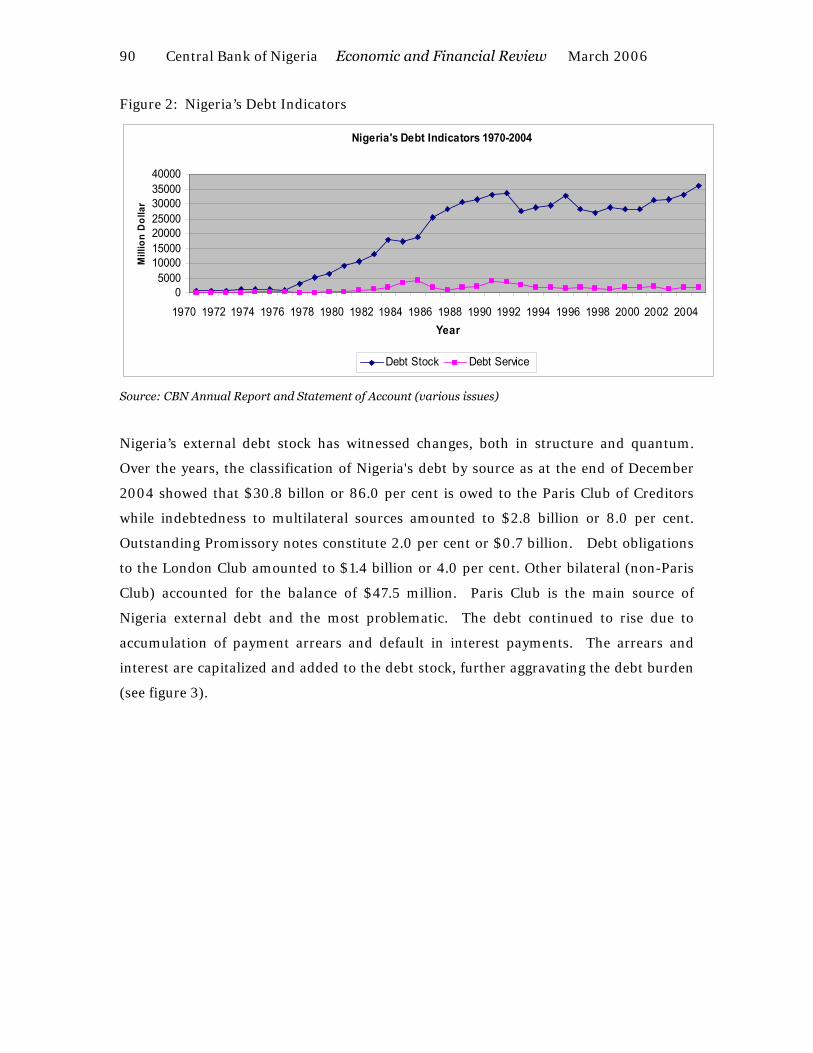
90 Central Bank of Nigeria Economic and Financial Review March 2006
Figure 2: Nigeria’s Debt Indicators
Nigeria's Debt Indicators 1970-2004
05000
10000150002000025000300003500040000
1970 1972 1974 1976 1978 1980 1982 1984 1986 1988 1990 1992 1994 1996 1998 2000 2002 2004Year
Mill
ion
Dol
lar
Debt Stock Debt Service
Source: CBN Annual Report and Statement of Account (various issues)
Nigeria’s external debt stock has witnessed changes, both in structure and quantum.
Over the years, the classification of Nigeria's debt by source as at the end of December
2004 showed that $30.8 billon or 86.0 per cent is owed to the Paris Club of Creditors
while indebtedness to multilateral sources amounted to $2.8 billion or 8.0 per cent.
Outstanding Promissory notes constitute 2.0 per cent or $0.7 billion. Debt obligations
to the London Club amounted to $1.4 billion or 4.0 per cent. Other bilateral (non-Paris
Club) accounted for the balance of $47.5 million. Paris Club is the main source of
Nigeria external debt and the most problematic. The debt continued to rise due to
accumulation of payment arrears and default in interest payments. The arrears and
interest are capitalized and added to the debt stock, further aggravating the debt burden
(see figure 3).

Ajab and Audu: External Debt, Investment and Economic Growth 91
Figure 3: Nigeria’s Debt Structure
Nigeria's Debt Structure as at 2004
Multilateral8%
Paris club86%
London Club4%
Promissory Notes2%
Others0%
Multilateral Paris club London Club Promissory Notes Others
Source: CBN Annual Report and Statement of Account (various issues), Federal Ministry of Finance-
Nigeria
IV. Literature Review
Several studies have critically examined the problem of debt burden. The theoretical and
empirical literature include the two-gap model by McKinnon (1964) and Green and
Khan, (1990) . “Liquidity trap, weak and strong debt overhang hypothesis” postulated by
Claessen and Diwan (1990), and the concept of “debt Laffer curve” used by Krugman
(1989), etc.
Theoretical Literature
The dual-gap analysis illustrates the role of foreign capital in the development process.
The role of capital here is that it permits developing countries to invest more than they
can save domestically. This proposition is made by the two- gap model (McKinnon, 1964
and Green and Khan, 1990). They noted that the volume of savings in developing
countries was too low on account of the low income and, therefore, domestic saving
should be supplemented by foreign resources to boost investment and increase the rate
of economic growth. Provided that such funds are effectively utilised, then the country
may succeed in boosting the rate of growth of its GDP and will be able to service debt
conveniently. Foreign borrowing can contribute significantly to economic growth if the
main constraint to growth is the foreign exchange.

92 Central Bank of Nigeria Economic and Financial Review March 2006
Krugman (1989) and Froot and Krugman (1989) conceptualized the model of debt
overhang of developing countries by applying the theory of ”Laffer Curve”6 to obtain a
relationship between debt stock and the levels of expected repayment (i.e., debt Laffer
Curve). The theory presupposes that larger debt stocks tend to be associated with lower
probabilities of debt repayment. The curve sloped like an inverted U-shaped, graphs
expected repayment as a function of the face value of the outstanding debt (Figure 4).
Source Author: Krugman (1989)
On the upward-sloping or “good” side of the curve, an increase in the face value of the
debt service leads to an increase in repayment up to the “threshold” level, while along the
“wrong side” of the curve ( i.e. down-ward sloping) an increase in the face value of the
debt reduces expected repayment. In a sense, debt relief, through debt service or debt
stock reduction, becomes a rational choice for both creditors and debtors, when a debtor
is said to be on the “wrong side” of the laffer curve.
When a country opens up to foreign capital and starts borrowing, the impact of debt on
growth is likely to be positive (moving from zero indebtedness to point A in figure 4),
but as debt ratio increases beyond point A, additional debt eventually slows growth.
Thus, point A can be considered as the growth-maximizing level of debt. When debt
reaches point B, however, the overall contribution of debt to growth turns negative. The
6 Laffer curve is an illustration of the thesis of an American Economist, Arthur Laffer, who postulated that there exists some tax rate, which maximizes government tax revenues. In this case, it was proposed that taxes above the optimal rate discourage production and, hence, result in lower revenue.

Ajab and Audu: External Debt, Investment and Economic Growth 93
concept of debt Laffer curve is essentially an approach used in debt reduction
mechanism.
Claessens and Diwan (1990) classified debt overhang into three different degrees:
“liquidity trap, weak debt overhang, and strong debt overhang”. A “weak” debt overhang
exists where the outstanding debt is so large that the situation cannot be resolved simply
by issuing further financing or new money for the country. The situation can only be
improved by using commitment mechanism to ensure allocation of loans for investment.
In the case of a “strong” debt overhang, the debtor postpones the implementation of
profitable investment projects until at least part of the debt is forgiven. The leaders of
the debtor country have no incentives to participate in extensive structural adjustment
program because the benefits of increased growth would end up in creditor’s pocket
while the short-term cost would rest solely on the debtor’s shoulders. Provision of large
amount of liquidity cannot improve the debt overhang problem. Thus, the resolution of
a strong debt service overhang calls for debt and debt service reduction, commitment to
large investment program, commitment to structural economic adjustment and
provision of new money in that order.
Lastly, debt overhang is considered as liquidity trap, if external debt accumulation is not
too large, but the indebted country has to struggle with having to allocate scarce financial
resources between consumption, investment and external transfer to service existing
debt. Since extensive cut-down in funds used for consumption are politically hard to
make, then consumption expenditure takes a larger share of the debtor country’s
income, driving down investment and discouraging future output. Thus, the resolution
of illiquidity effect of a debt overhang calls for injections of substantial new money
facilities. It also calls for commitment to structural economic adjustment. Overall, the
review of the theoretical literature on external debt and growth suggests that there are
several channels through which heavy debt burden impedes growth.
Empirical Literature
Much empirical literature exists on the interactions between external debt, investment
and economic growth in cross-sectional analysis. The economic growth-debt
relationship in developing countries is studied mainly by using OLS estimation methods

94 Central Bank of Nigeria Economic and Financial Review March 2006
(e.g. Borensztein, 1990; Iyoha, 1999; Chowdhury (1994). However, most of the empirical
evidence on debt overhang has been rather mixed, but many of the studies find debt
variables to be significantly and negatively correlated with investment or growth.
Borensztein (1990) using data for the Philippines found that the debt overhang
hypothesis was largely valid. Deshpande (1997) also came out with similar result from
his study of the experience of 13 severely indebted countries. Greene and Villanueva
(1991) also found evidence of the debt overhang hypothesis for 23 developing countries.
Elbadawi (1996) confirmed the debt overhang hypothesis for 99 developing countries.
Furthermore, Iyoha (1999) provides empirical support for the debt overhang hypothesis
for Sub-Saharan Africa (SSA).
In contrast, Cohen (1993) rejected the debt overhang theory, arguing instead, that the
important debt problem is crowding out of investment caused by debt service payments.
Warner (1992) also arrived at a similar conclusion as Cohen in his study of 13 heavily
indebted countries. Similar results were corroborated by Degefe (1992) in Ethiopia.
Generally, empirical studies on the subject are not conclusive.
Most of the empirical literature on the relationship between external debt overhang and
economic growth and investment show negative effects. The studies that have shown
favorable effects of external debt are rare. They include World Bank (1988) study for the
period 1980-86 and Chowdbury (1994) for Bangladesh, Indonesia and South America.
V. Model Specification, Empirical Analysis and Interpretation of
Results
The specification of the models are based on the empirical work of Elbadawi (1996) and
Were (2001) which are largely derived from the neoclassical framework. The work of
Elbadawi and Were are some of the recent studies that captures the effect of both current
debt flows and the effect of past debt accumulation (known as debt overhang) as well as
liquidity effect of annual debt service payments on economic growth and investment.
Similarly, their works are some of the few studies that largely focused on a cross section
of low income countries. However, our models are augmented with some debt overhang
variables to the equations to determine the significance of the direct impact of debt
overhang on economic growth and investment. Besides these variables, the models also
incorporate policy fundamental and shock variables since there are so many channels

Ajab and Audu: External Debt, Investment and Economic Growth 95
through which indebtedness works against growth. The dependent variable is real GDP
growth rate (GDPGR). The explanatory variables have been identified as ratio of
external debt to GDP (LEDTGDPt), which should stimulate growth. This is because
reasonable levels of current debt inflow that help to finance productive investment are
expected to enhance growth. Past debt accumulation lagged one period (LEDTGDPt-1), as
a measure of debt overhang, debt service to export (LDSEt) captures the “crowding out”
effects. A dummy variable is also introduced as a proxy for political stability (GCRI), and
takes the value of 0 for stability and 1 for instability in the growth model. The
functional relationships are specified as follows:
Growth Equation
()ttt
ttttttttt
GCRIREERINFFISBALHCDFDIGDPGPUIVGPUIVDSEEDTGDPEDTGDPfGDPGR
,,
,1,,1,1,,,1, −−−−=
Where
GDPGRt = Real GDP growth rate.
EDTGDPt = Ratio of total external debt to GDP.
EDTGDPt-1 = Ratio of external debt to GDP lagged one period, as a measure of
debt overhang.
DSEt = Total debt service as ratio of export, is expected to capture
the crowding out of total investment.
FISBALt-1 = Lagged fiscal balance in percentage of GDP
GPUIVt = Public investment- GDP ratio.
GPUIVt-1 = Public investment - GDP ratio lagged one period to reflect
the effect of past investment.
FDIGDPt = Private foreign investment-GDP ratio.
HCDt = Gross secondary school enrolment rate (proxy for the
quality of Human capital)
INFt = Inflation rate (reflects macroeconomic instability).
REERt = Effective real exchange rate (reflects credibility of policies)
GCRIt = Dummy variable for political stability.
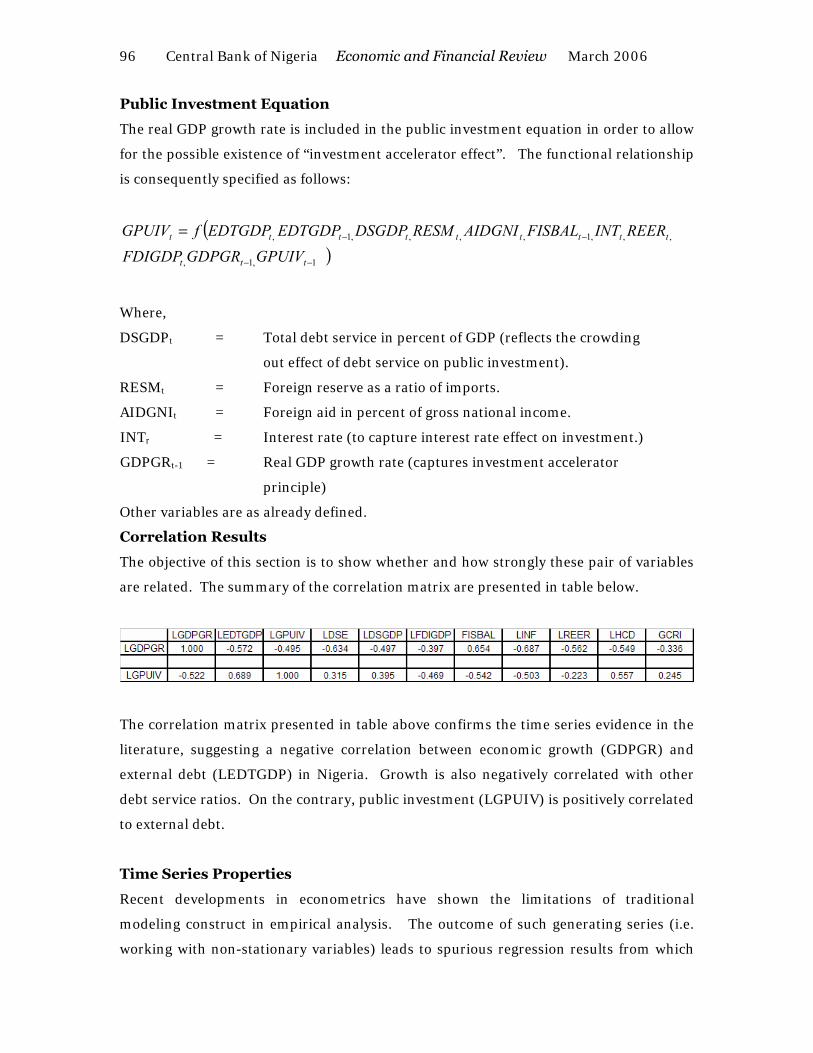
96 Central Bank of Nigeria Economic and Financial Review March 2006
Public Investment Equation
The real GDP growth rate is included in the public investment equation in order to allow
for the possible existence of “investment accelerator effect”. The functional relationship
is consequently specified as follows:
()1,1,
,,,1,,,,1,
−−
−−=
ttt
ttttttttt
GPUIVGDPGRFDIGDPREERINTFISBALAIDGNIRESMDSGDPEDTGDPEDTGDPfGPUIV
Where,
DSGDPt = Total debt service in percent of GDP (reflects the crowding
out effect of debt service on public investment).
RESMt = Foreign reserve as a ratio of imports.
AIDGNIt = Foreign aid in percent of gross national income.
INTr = Interest rate (to capture interest rate effect on investment.)
GDPGRt-1 = Real GDP growth rate (captures investment accelerator
principle)
Other variables are as already defined.
Correlation Results
The objective of this section is to show whether and how strongly these pair of variables
are related. The summary of the correlation matrix are presented in table below.
The correlation matrix presented in table above confirms the time series evidence in the
literature, suggesting a negative correlation between economic growth (GDPGR) and
external debt (LEDTGDP) in Nigeria. Growth is also negatively correlated with other
debt service ratios. On the contrary, public investment (LGPUIV) is positively correlated
to external debt.
Time Series Properties
Recent developments in econometrics have shown the limitations of traditional
modeling construct in empirical analysis. The outcome of such generating series (i.e.
working with non-stationary variables) leads to spurious regression results from which

Ajab and Audu: External Debt, Investment and Economic Growth 97
further inference may be meaningless. Unit root and cointegration tests are important
tests that are often used to circumvent the inherent limitations of traditional models. To
this effect, the Augmented Dickey-Fuller (ADF) tests are used to test for the stationarity
of the series so as to be sure that we are not analyzing inconsistent and spurious
relationships. The tests show that the variables Real GDP growth rate (GDPGR),
interest rates (INT), fiscal balance in percent of GDP (FISBAL) and private foreign
investment/GDP ratio (LFDIGDP) are stationary (integrated of order zero) at 5% level of
significance. The rest of the variables were found to be stationary after differencing
once. The variables are, therefore, integrated of order I (1).
ADF Unit Root Test Results
Variable
ADF Tests Statistics
5% Critical Value
Level
GDPGR 5.2834 3.5578 I(0) LEDTGDP 5.7823 3.5629 I(1) LDSE 6.1224 3.5629 I(1) LDSGDP 7.6963 3.5629 I(1) LGPUIV 6.4338 3.5629 I(1) LHCD 5.4012 3.5629 I(1) INT 4.1960 3.5578 I(0) LINF 11.9801 3.5629 I(1) LREER 4.5780 3.5629 I(1) FISBAL 4.3940 3.5629 I(0) LRESM 12.1002 3.5629 I(1) LAIDGNI 4.2703 3.5629 I(1) LFDIGDP 4.7398 3.5577 I 0)
The next step after finding out the order of integration of the variables was to establish
whether the non-stationary variables are cointegrated7. To establish this, the Johansen
test was used. The test indicates the presence of five and six cointegrating equations
(vectors) in the two models at 5% level of significance. This result confirms the
existence of a long run equilibrium relationship between the variables (see annexes 1a
and 1b).
7 The concept of cointegration implies that if there is a long-run relationship between two or more non-stationary variables, deviation from this long-run path are stationary. Variables may move apart in the short-run but be brought together by market forces, government policy or both. So variables are said to be cointegrated if they are affected by the same long-run influence.

98 Central Bank of Nigeria Economic and Financial Review March 2006
Having established cointegration in the two models, growth and public investment
equations were re-specified to include an Error Correction Term (ECM).
( ) ( ) ( ) ( ) ( )( ) ( ) ( ) ( ) ( )( ) ( ) (1) 1112111110
198765
43210
tttt
ttttt
ttttt
UECTFISBALDLGPUIVDLEDTGDPDGCRILREERDLINFDLHCDD
LFDIGDPDLGPUIVDLDSEDLEDTGDPDGDPGRD
++++++++
+++++=
−−−
−
αααααααα
ααααα
We have the following a priori signs:
0 and ,0 , 107,5,4,3,111,9,86,2 ≥≤ ααααααααααα andand
( ) ( ) ( ) ( ) ( )( ) ( ) ( ) ( ) ( )( ) ( ) (2) 2111110
198765
43210
ttt
ttttt
ttttt
UECTLEDTGDPDGDPGRDFISBALDLREERDINTDLFDIGDPD
LAIDGNIDLRESMDLDSGDPDLEDTGDPDLGPUIVD
+++++++
+++++=
−−
−
βββββββ
βββββ
We hypothesize the following signs:
0 ,0 and 9,7,5,4,31,10,8,6,2 ≥≤ ββββββββββ andand
Granger Causality Test
Granger proposed the causality concept in 1969: the variable Y2t is the cause of Y1t, if the
predictability of Y1t is improved when the information related to Y2t is incorporated in
the analysis. The basic principle of Granger causality analysis is to test whether past
value help to explain current value. Maddala (1998) indicates that if two variables are
cointegrated, there must be at least one direction of causality between investigated
variables. Our objective is to investigate whether observation of a variable like public
investment (LGPUIV) is potentially useful in anticipating future movements in GDP
growth rate (GDPGR), and to test Granger causality between LGDPUIV and LEDTGDP,
and between GDPGR and external debt (LEDTGDP).
Interpretation of Granger Causality Result
Test for causal relationship between public investment (LGPUIV), GDP growth rate
(GDPGR) and external debt for the period 1979-2004 is shown in annex 2. The results
indicate that we can reject the null hypothesis that public investment does not Granger
cause GDPGR and that LGPUIV does not Granger cause external debt (both at 5% level
of significance). With regard to the relationship between external debt and GDPGR, the
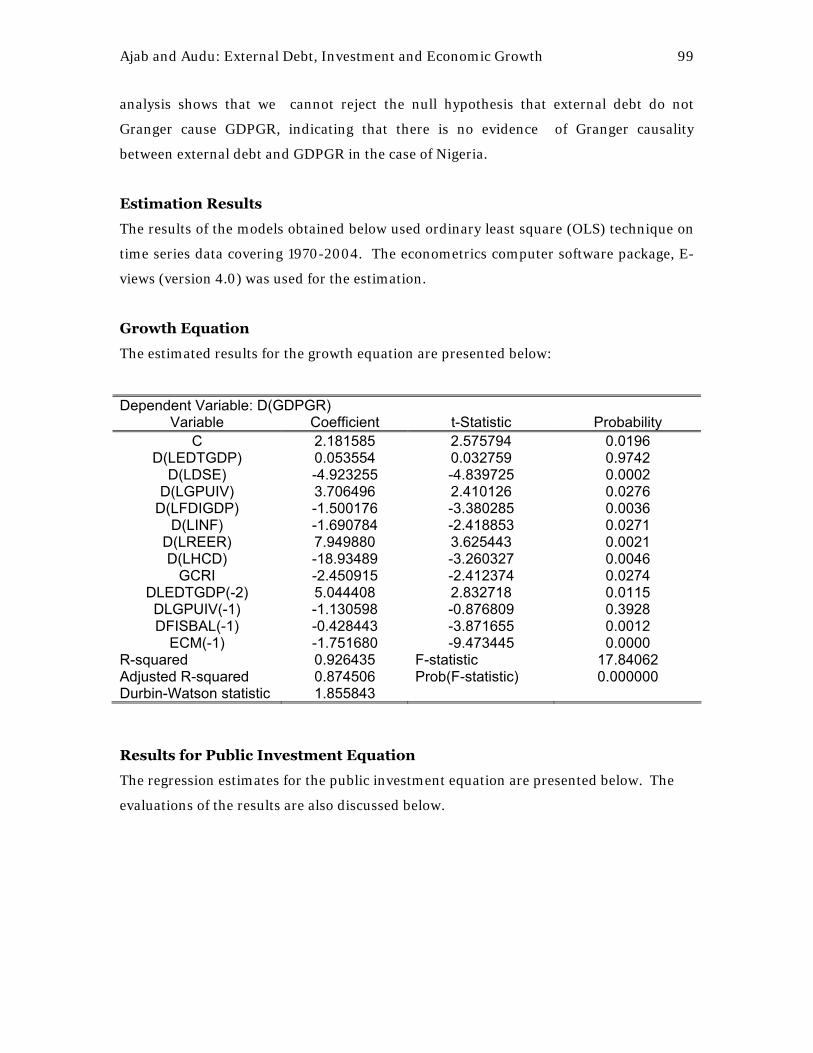
Ajab and Audu: External Debt, Investment and Economic Growth 99
analysis shows that we cannot reject the null hypothesis that external debt do not
Granger cause GDPGR, indicating that there is no evidence of Granger causality
between external debt and GDPGR in the case of Nigeria.
Estimation Results
The results of the models obtained below used ordinary least square (OLS) technique on
time series data covering 1970-2004. The econometrics computer software package, E-
views (version 4.0) was used for the estimation.
Growth Equation
The estimated results for the growth equation are presented below:
Dependent Variable: D(GDPGR) Variable Coefficient t-Statistic Probability
C 2.181585 2.575794 0.0196 D(LEDTGDP) 0.053554 0.032759 0.9742
D(LDSE) -4.923255 -4.839725 0.0002 D(LGPUIV) 3.706496 2.410126 0.0276
D(LFDIGDP) -1.500176 -3.380285 0.0036 D(LINF) -1.690784 -2.418853 0.0271
D(LREER) 7.949880 3.625443 0.0021 D(LHCD) -18.93489 -3.260327 0.0046
GCRI -2.450915 -2.412374 0.0274 DLEDTGDP(-2) 5.044408 2.832718 0.0115 DLGPUIV(-1) -1.130598 -0.876809 0.3928 DFISBAL(-1) -0.428443 -3.871655 0.0012
ECM(-1) -1.751680 -9.473445 0.0000 R-squared Adjusted R-squared Durbin-Watson statistic
0.926435 0.874506 1.855843
F-statistic Prob(F-statistic)
17.84062 0.000000
Results for Public Investment Equation
The regression estimates for the public investment equation are presented below. The
evaluations of the results are also discussed below.

100 Central Bank of Nigeria Economic and Financial Review March 2006
Dependent Variable: D(LGPUIV)
Variable Coefficient t-Statistic Probability C 0.018898 0.277232 0.7848
D(LEDTGDP) -0.302245 -1.294962 0.2117 D(LDSGDP) 0.193980 2.105787 0.0495 D(LRESM) 0.078930 0.847027 0.4081
D(LAIDGNI) -0.552004 -2.488590 0.0228 D(LFDIGDP) 0.129973 2.423560 0.0261
D(INT) 0.018063 1.173675 0.2558 D(LREER) -0.471518 -2.220070 0.0395 D(FISBAL) -0.024264 -2.223478 0.0392
DLEDTGDP(-1) -0.029510 -0.125300 0.9017 DGDPGR(-1) 0.028391 2.211118 0.0402 DLGPUIV(-1) 0.033130 0.205981 0.8391
ECM(-1) -0.733695 -2.587835 0.0186 R-squared Adjusted R-squared Durbin-Watson statistic
0.739206 0.565343 1.918196
F-statistic Prob(F-statistic)
4.251658 0.002962
Other Diagnostic Tests
The outcome of the diagnostic tests is satisfactory. A value with a corresponding
probability greater than 5% is an indication of good result. The results of the test further
suggest that the model is well specified and robust for policy analysis (see annex 3). In
addition to the above tests, the CUSUM and CUSUM of Squares stability tests were
performed in order to establish the reliability and stability of our model. The graphs
show that the parameter movements are within the critical lines at the 5% level of
significance, indicating stability of the model (see annex 4).
Interpretation of Results
Growth Equation
Several of the variables considered in the determination of the growth regression output
were found to be statistically significant and with t-statistics greater than two in
absolute terms, namely, LDSE, LGPUIVt, LFDIGDPt, LINFt, LREERt, LHCDt, GCRIt,
LEDTGDP(t-1), and FISBAL(t-1). The rest of the variables LEDTGDPt, and LGPUIV(t-1) are
not statistically significant. Similarly, all the variables have the hypothesized sign,
except LEDTGDP(t-2), LFDIGDPt , LHCDt and LGPUIV(t-1).
The regression results of the error correction model (ECM), in the growth equation
support our hypotheses by confirming the existence of crowding out and import

Ajab and Audu: External Debt, Investment and Economic Growth 101
compression hypotheses in Nigeria. This means that debt servicing pressure in the
country has had a significant adverse effect on the growth process. However, the
coefficient of past debt accumulation (LEDTGDPt-2) relates positively to economic
growth, thus contradicting the prescription of the debt overhang hypothesis in Nigeria.
This result was not expected. However, the explanation for the positive relationship
could be found in the structure of public finance in Nigeria. In the past the need for
foreign borrowing by Nigeria was minimal, as debt contracted by the country were
concessional debt from official sources such as the World Bank and Nigeria’s trading
partners. These debts did not exert much pressure on the economy because the interest
charged on the loans was generally low, with longer repayment period. Moreover, these
loans and grants financed a lot of consumption and investment expenditure in many
sectors of the economy, notably education, health, transport and communication etc.
Nonetheless, the country had comfortable external reserves as a result of the
unprecedented inflow of foreign exchange from oil exports.
The results further revealed some evidence in support of a positive relationship between
current capital inflow in Nigeria and economic growth (LEDTGDPt), but that support is
not robust. Perhaps the results could point to the impact of external resources in the
Nigerian growth process and suggest that Nigeria depends heavily on external resources.
These results are consistent with the findings from similar studies (e.g Elbadawi, 1996,
Were, 2001).
Fiscal balance as a per cent of GDP (lagged one period), inflation rate, and human capital
development negatively affects economic growth while the real effective exchange rate is
positively related to economic growth. Political instability negatively affects economic
growth, as the dummy variable introduced to capture political instability had a negative
sign.
The lagged error correction term (ECMt-1) has the expected negative sign (-1.75) and
highly significant. The negative value supports our earlier findings of the cointegrating
relationship between the variables. The coefficient indicates speed of adjustment of
around -1.75 which is relatively high. This implies that following short-run
disequilibrium, 175% of the adjustment to the long-run takes place within one period.
The coefficient of determination relating to the goodness of fit, measured by the R2

102 Central Bank of Nigeria Economic and Financial Review March 2006
indicates that 92% of the variations in GDP growth rate are explained by the
independent variables during the period of the study. The F-.statistics of 17.84 with a
corresponding low probability of 0.00000 is a clear indication that the model is well
specified. The Durbin-Watson statistics of 1.85 indicates that autocorrelation is not a
problem in our specification.
Public Investment Equation
The result shows that the variables LDSGDPt, LAIDGNIt, LFDIGDPt, LREERt, FISBALt,
and GDPGRt-1 are found to be statistically significant. The remaining variables are not
statistically significant. All the variables have their hypothesized sign, except
LEDTGDPt, LDSGDPt, LAIDGNIt, LINTt and LREERt
In the public investment equation, past debt accumulation (LEDTGDPt-1) negatively
affects public investment. This outcome is expected and revealed some evidence in
support of the debt overhang hypothesis in Nigeria. However, that support is not robust
in the model. On the other hand, debt service ratio (LDSGDP) is positively related to
investment, thus contradicting the prescription of crowding out hypothesis in Nigeria.
This result was unexpected. The sign of this variable is an aberration. However, the
structure of the economy might have accounted for the aberration. Crude oil dominated
the country’s export; and if a significant proportion of the debt service is linearly related
to oil exploration through the joint venture operations, and given that oil exports and
investment/economic growth are highly correlated, then the outcome is not surprising.
The more debt obligations the oil companies and the Nigerian National Petroleum
Corporation (NNPC) settled the more creditworthy the sector becomes, hence the more
vibrant the sector and the economy. It is also plausible to argue that debt service ratio
for Nigeria has been relatively small compared to other low-income highly - indebted
countries. This is because of the country’s determination not to spend beyond 30.0 per
cent of it earnings on debt service. The results further suggest that GDP growth rate is
positively related to public investment through the accelerator mechanism and this
supports the a priori expectation that the rate of growth of GDP should be positively
related to investment. The results also show that private foreign investment is a key
determinant of public investment confirming the complementarity’s hypothesis in
production.

Ajab and Audu: External Debt, Investment and Economic Growth 103
The lagged error correction term (ECMt-1) has the expected negative signed (-0.73) and
statistically significant at 1 level %. The result confirms the existence of long run
relationship between the dependent and explanatory variables. The coefficient of the
error term indicates a speed of adjustment of around -0.73. This suggests that following
short-run disequilibrium/deviation, 73% of the adjustment to the long-run take place
within one period either by market mechanism, government intervention or a
combination of both. The R-squared (R2) of 0.74, which measures goodness of fit,
indicates that 74% of the systematic variations of public investment in Nigeria is
explained by the explanatory variables during the period of the study. The overall F-
statistics of 4.25 with a low probability of less than 5%, gives clear evidence that the
equation is well fitted. The Durbin-Watson statistics of 1.91 indicates the absence of
autocorrelation in our specification.
VI. Policy Implications, Recommendations and Conclusion
Policy Implications
The heavy debt burden that confronts Nigeria has adversely affected the level of
economic performance. Though kept below 20.0 per cent, the level of debt service
payments still remains large. This means that the resources that would have been used
for investment are diverted to meeting debt service obligations. The debt servicing and
the adjustment policies required to address the debt burden have also worsened social
welfare in the area of education, health, communication, etc. The most serious
implication of debt overhang is that, it has reduced the amount of foreign exchange
available to finance the importation of raw materials and capital goods needed for rapid
economic development. This means that the debt burden has denied the industrial and
agricultural sectors the needed inputs, holding back new investments and even the
maintenance of capital stock. The import compression effect, which arose from the
decline in foreign exchange earnings from the levels in the 1970’s and early 1980’s, and
the need to meet debt service obligations, led to a reduction in commitments to
development projects. For most of the 1980’s and part of the early 1990’s, real GDP
growth was negative.
The pursuance of improved macroeconomic policies, which is an essential condition to
cope with the pressures of debt and debt service, has caused a decline in living standards
104 Central Bank of Nigeria Economic and Financial Review March 2006
because of debt build-up, arrears on debt, debt-service and external commercial
payments, thus stretching the supply of foreign exchange to the limit. The accumulation
of arrears arose over the years because of the inadequate financial provision of external
debt service. Such arrears on debt service obligations increased to about $19.0 billion at
the end of 2002 and accounted for about 60.3 per cent of the total indebtedness during
the period. These have impaired or worsened Nigeria’s credit ratings in the international
market as the country was classified as the third most risky country in terms of credit
rating in 1994. The country could no longer attract the needed foreign capital to
augment domestic savings. It also made the rescheduling of Nigeria’s debt difficult by
the Paris Club of Creditors. This is because the country is perceived by the creditors to
possess the capacity to service its debt beyond what is currently paying. This illusion has
eroded the confidence of both domestic and potential foreign investors.
Policy Recommendations
Based on the above policy implications, the study provides the following policy
recommendations for consideration.
¬ Nigeria must press for substantial debt reduction in the external debt stock, in
order to achieve sustainable growth and economic development. Debt forgiveness
or interest write-offs are recommended rather than temporary debt relief.
¬ The need to expand the country’s productive capacity base is also quite apparent.
In this regard, the promotion of non-oil exports in order to increase the exports
earnings of the country should be encouraged; specifically, the revitalization of
agriculture is recommended. This effort should be consolidated through
backward integration.
¬ Greater emphasis must be placed on maximizing the concessionary assistance
from multilateral institutions as well as encouraging foreign direct investment.
Borrowing, especially from commercial creditors, could be considered only after
detailed feasibility studies on the social and commercial viability of the project
have been undertaken and should not be guaranteed by government. As long as
investments maintain commercial net worth by paying interest and principal
regularly, borrowing will not constitute a problem.
Ajab and Audu: External Debt, Investment and Economic Growth 105
¬ Government should curtail its extra-budgetary activities and reduce its
expenditure. In other words, there should be fiscal discipline.
¬ The country should be stabilized politically in order to attract foreign direct
capital in the form of direct and portfolio investment. If there is no political
stability, private investors will relocate their enterprises or simply wait for the
instability to dissipate.
Conclusion
In conclusion, we have seen the interaction between external debt, investment and
economic growth. We also acknowledge the fact that Nigeria is a developing country
with great potential for rapid growth. However, we realize that this could not be possible
without adequate investment. Thus, given the capital inadequacy of the nation both in
terms of foreign exchange and domestic savings, one option is to obtain foreign financing
to bridge these gaps. But, if foreign borrowing is to be resorted to, such funds must be
invested in productive activities; that is the marginal efficiency of investment or internal
rate of return must be higher than the cost of capital.
Finally, Nigeria still has a chance of overcoming her external debt problems by
cultivating the right policies such as trade liberalization, tax reforms, favorable
investment climate, etc and, through deeper debt relief/debt cancellation. The debt
relief will enable the country to use the lean foreign exchange earnings to procure the
badly needed inputs for industries and infrastructures; this would help in restoring
investment, financial solvency and promoting economic growth.

106 Central Bank of Nigeria Economic and Financial Review March 2006
References
Ajayi, S. I. (1991), Macroeconomic Approach to External Debt: The Case of Nigeria. AERC Research Paper 8, Nairobi.
Amin, A. (1998), Cameroon’s Fiscal Policy and Economic Growth. AERC Research Paper100, Nairobi.
Borensztein, E. (1990), "Debt Overhang, Debt Reduction and Investment: The Case of the Philippines", International Monetary Fund Working Paper NO.WP/90/77, September.
Central Bank of Nigeria, (1993), Perspectives of Economic Policy Reforms in Nigeria: A Study Report by the Research Department of the CBN.
Chenery, H. B. and A. M. Strout (1966), “Foreign Assistance and Economic Development”, American Economic Review, 56 (4).
Chowdhury, K. A. (1994), “Structural Analysis of External Debt and Economic Growth: Some Evidence from Selected Countries in Asia and Pacific”, Applied Economics, Vol. 26.
Claessens, S. and I. Diwan (1990), "Investment Incentives: New Money, Debt Relief and the Critical Role of Conditionality in the Debt Crisis", World Bank Economic Review, Vol. 14, No. 1, pp. 17-41.
Clement, B, R. Bhattacharya, and Q. Nguyen (2003), External Debt, Public Investment, and Growth in Low-Income Countries, IMF Working paper, No.WP/03/249.
Cohen, D. (1993), "Low Investment and Large LDCs Debt in the 1980s”, The American Economic Review, Vol. 83, pp.437-449.
Degefe, B. (1992), Growth and Foreign Debt: The Ethiopian Experience: 1964-86. AERC Research Paper 13, Nairobi,
Desphande, A. (1997), “The Debt Overhang and the Disincentive to Invest”, Journal of Development Economics, 52, pp. 169-187.
Elbadawi, I. (1996), Debt Overhang and Economic Growth in Sub-Saharan Africa: AERC, Nairobi.
Froot, A. K. and P. Krugman (1989),” Domestic Taxes and External Debt Laffer Curve”, Economica, 64, pp. 519-525.
Green, J. and D. Villanueva (1991), “Private Investment in Developing Countries: An Empirical Analysis”, IMF Staff Papers Vol. 38, No. 1.
Green, J. E. and S. M. Khan (1990), The African Debt Crisis. AERC Special Paper 3, Nairobi.
Ajab and Audu: External Debt, Investment and Economic Growth 107
Iyoha, M. and S. Iyare (1994), Africa’s Debt Problems: The Nigeria Economic Society (NES). Selected Papers for the 1994 Annual Conference, pp.1-13.
Iyoha, M. A. (1999), “Impact of External Debt on Economic Growth in Africa”, in: M. A. Iyoha, Macroeconomic: Theories and Policies, ed., Nigeria, Mareh Publishers.
Krugman, P. (1989), “Financing vs. Forgiven a Debt Overhang: Some Analytical Notes”, Journal of Development Economics 29, Vol. 29. No.3, pp. 253-268.
Maddala, G. S. (1998), Introduction to Econometrics: Macmillan Publishing Company, New York.
McKinnon, R. I. (1964), “Foreign Exchange Constraints in Economic Development and Efficient Aid Allocation”, Economic Journal, 74, pp. 294.
NES (1994), Africa’s Debt Problem: Nigeria Economic Society (NES) Selected Papers for 1994 Annual Conference.
Warner, A. M. (1992), “Testing the Debt Overhang Hypothesis”, Mimeo, Harvard University, USA.
Were, M. (2001), "The Impact of External Debt on Economic Growth and Private Investment in Kenya: An Empirical Assessment”. Wider Conference Helsinki.
World Bank (1988), Adjustment Lending: and Evaluation of Ten years of Experience. Policy Research Series 1, World Bank Country Economics, Washington D. C.
World Bank (2003): African Database, CD-ROM, Washington D. C. World Bank.

108 Central Bank of Nigeria Economic and Financial Review March 2006
Appendix
Table 1: Selected Economic Indicators 1970-2004

Ajab and Audu: External Debt, Investment and Economic Growth 109
Annex 1(A): Johansen Cointegration Test for Growth Equation
Series: GDPGR LEDTGDP LDSE LGPUIV LFDIGDP LREER LINF FISBAL LHCD GCRI Lags interval (in first differences): 1 to 1
Hypothesized Trace 5 Percent 1 Percent
No. of CE(s)
Eigenvalue
Statistic
Critical Value
Critical Value
None ** 0.999877 655.7342 212.67 226.40
At most 1 **
0.967174
376.5775
175.77
187.31
At most 2 **
0.950274
270.6654
141.20
152.32
At most 3 **
0.910929
177.6272
109.99
119.80
At most 4 **
0.760024
102.6591
82.49
90.45
At most 5
0.596840
58.41544
59.46
66.52
At most 6
0.365367
30.25434
39.89
45.58
At most 7
0.297488
16.15839
24.31
29.75
At most 8
0.149695
5.212512
12.53
16.31
At most 9
0.005968
0.185564
3.84
6.51
*(**) denotes rejection of the hypothesis at the 5%(1%) level Trace test indicates 5 cointegrating equation(s) at both 5% and 1% levels

110 Central Bank of Nigeria Economic and Financial Review March 2006
Annex 1(B): Johansen Cointegration Test for Public Investment Equation Series: LGPUIV LEDTGDP LDSGDP GDPGR LRESM LAIDGNI LFDIGDP INT LREER FISBAL
Lags interval (in first differences): 1 to 1
Hypothesized Trace 5 Percent 1 Percent
No. of CE(s)
Eigenvalue Statistic
Critical Value
Critical Value
None ** 0.995198
448.5296
212.67
226.40
At most 1 **
0.903172
283.0282
175.77
187.31
At most 2 **
0.873241
210.6488
141.20
152.32
At most 3 **
0.842210
146.6193
109.99
119.80
At most 4 *
0.603888
89.37805
82.49
90.45
At most 5 *
0.534149
60.67025
59.46
66.52
At most 6
0.417013
36.98964
39.89
45.58
At most 7
0.346788
20.26235
24.31
29.75
At most 8
0.203683
7.060895
12.53
16.31
At most 9
1.28E-05
0.000397
3.84
6.51
*(**) denotes rejection of the hypothesis at the 5%(1%) level
Trace test indicates 6 cointegrating equation(s) at the 5% level
Trace test indicates 4 cointegrating equation(s) at the 1% level

Ajab and Audu: External Debt, Investment and Economic Growth 111
Annex 2: Result of Granger Causality Test
Pairwise Granger Causality Tests
Sample: 1970 2004
Lags: 1
Null Hypothesis: Obs F-Statistic Probability
LGPUIV does not Granger Cause GDPGR 32 4.46042 0.04342
GDPGR does not Granger Cause LGPUIV 2.89356 0.09964
LEDTGDP does not Granger Cause GDPGR
32 0.03614 0.85055
GDPGR does not Granger Cause LEDTGDP 0.10859 0.74413
LEDTGDP does not Granger Cause LGPUIV 32 1.00469 0.32447
LGPUIV does not Granger Cause LEDTGDP 4.77686 0.03707
Probability is the critical probability (acceptance probability)
The null hypothesis Ho is accepted as soon as probability is higher than 5%
Annex 3: Summary of Diagnostic Tests Summary of Diagnostic Tests for Growth Equation (1)
Test F-Statistics Probability
Jack-Bera Normality 0.51 0.77
Breuesch-Godfrey 0.11 0.73
White Heteroskedacity 0.23 0.99
RAMSEY Reset 0.05 0.82
Summary of Diagnostic Tests for Public Investment (2)
Test F-Statistics Probability
Jack-Bera Normality 0.86 0.65
Breuesch-Godfrey 0.03 0.85
White Heteroskedacity 0.40 0.94
RAMSEY Reset 0.26 0.61

112 Central Bank of Nigeria Economic and Financial Review March 2006
Annex 4: CUSUM and CUSUM of Square Stability Test
i) CUSUM and CUSUM of Squares stability for Growth Equation (1)
-15
-10
-5
0
5
10
15
86 88 90 92 94 96 98 00 02
CUSUM 5% Significance
We conclude that the ECM model is stable
CUSUM of Squares Test
-0.4
0.0
0.4
0.8
1.2
1.6
86 88 90 92 94 96 98 00 02
CUSUM of Squares 5% Significance
We conclude that the ECM is stable
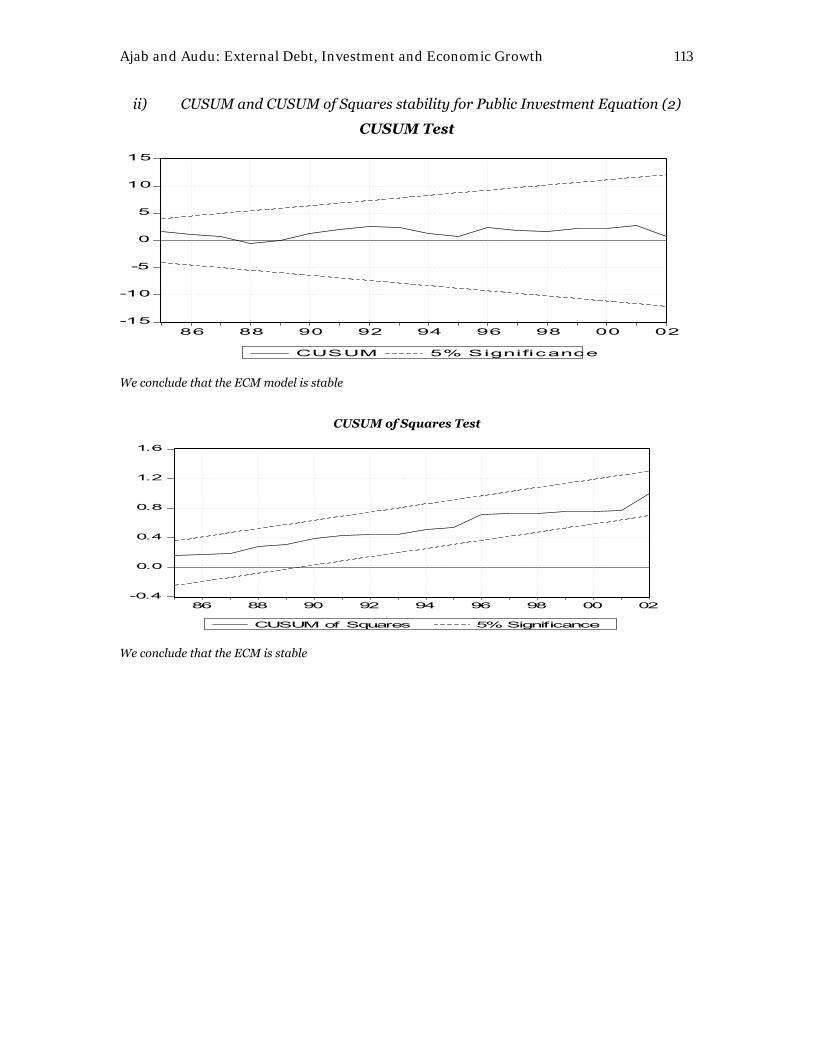
Ajab and Audu: External Debt, Investment and Economic Growth 113
ii) CUSUM and CUSUM of Squares stability for Public Investment Equation (2)
CUSUM Test
-15
-10
-5
0
5
10
15
86 88 90 92 94 96 98 00 02
CUSUM 5% Significance
We conclude that the ECM model is stable
CUSUM of Squares Test
-0.4
0.0
0.4
0.8
1.2
1.6
86 88 90 92 94 96 98 00 02
CUSUM of Squares 5% Significance
We conclude that the ECM is stable
Central Bank of Nigeria Economic and Financial Review Volume 44/1 March 2006 114
Matters arising from the Introduction of the Defined Contributory Pension Scheme in Nigeria— A Policy Proposal
J.S. Akuns∗
I. Introduction
he pristine pension system relied on children to provide the consumption
needs of their parents, when such parents became incapable of producing
goods and services due to old age or some other reasons. The system
served medieval societies efficiently well until the end of the Stone Age.
With the emergence of the industrial society, the administration of pension
assumed a formal dimension as an instrument of public policy for which
government and employers of labour became responsible for defining associated
benefits to beneficiaries and society at large. The catchword for the pension
system became the defined benefits (DB) pension scheme or pay-as-you-go
(PAYG). Thus, government, employers and employees became the core
stakeholders of the pension system unlike the aboriginal scheme that relied on
children and parents as the core stakeholders.
Either private or public sector, DB scheme could be funded or unfunded but
operationally, they are linked to employee terminal emoluments and years of
service. The earliest recorded DB scheme is that of Germany in 1889. The DB
scheme served their purpose very well until they recently became unsustainable
due to demographic changes and fiscal imbalance that imposed financing
difficulties. In some developing countries, the un-sustainability is largely as a
result of constraints of financing outstanding pension obligations. In Nigeria for
instance, the outstanding public sector pension obligations stood at N2 trillion in
2004. The figure represents 23% of Nigeria’s GDP at current market prices
compared to 14% for Italy in 2003.
∗ Akuns is an Assistant Director, Governor’s Office, Central Bank of Nigeria, Abuja. He acknowledges the comments of anonymous reviewers. All remaining errors are the author’s responsibility.
T

Akuns: Introduction of Defined Contributory Pension Scheme 115
The identified difficulties associated with the operations of the DB schemes
compelled the need for reforms of the pension system by tinkering with existing
schemes of DB pension or introducing entirely new ones such as the defined
contributory (DC) pension scheme pioneered by Chile. Although the body of
literature on pension system seems to be exclusively devoted to DB schemes, the
scant literature about the DC schemes and its resounding success in Chile paint a
picture of success and potentials that will relief the difficulties experienced with
the DB pension schemes. The synopsis of DC pension seems to have been inspired
by the philosophy of privatization/commercialization as well as the pristine
pension system that relied on children.
In line with global trends in pension reforms as well as stark domestic realities,
Nigeria introduced the operation of the DC pension scheme on 1st July 2004. The
pension reform is an integral part of an overall public policy reforms that seek to
achieve sustainable economic growth and social welfare in Nigeria. In this regard,
the main thrust of the paper is to examine some salient features of the defined
contributory pension scheme and their welfare implications to retirees. In welfare
terms, the key questions for public policy are thus ‘is the defined contributory
pension scheme Pareto optimal?’ ‘Who amongst the identified core stakeholders
of modern society pension system will be hurt most?’
In what follows, an overview of the defined contributory pension scheme is
carried out in section 2, while country-specific experiences with the defined
contributory pension scheme is reviewed in section 3. Issues of public policy on
the defined contributory pension scheme are explored in section 4. Finally,
section 5 contains the concluding remarks of the paper.
II. An Overview of the Defined Contributory Pension Scheme
The synopsis of pension is all about the need to smoothen the distribution of
consumption expenditure of a citizen over a life span. Pension systems, which
have been with mankind from creation, constitute the mechanism for the
smoothening of a citizen’s lifetime consumption and are, therefore, safeguards

116 Central Bank of Nigeria Economic and Financial Review March 2006
against destitution when a citizen is no longer capable of producing goods and
services to meet his/her needs due to either old age or some other reasons.
The defined contributory pension scheme requires both the employer and the
employee to jointly fund an account in the name of the employee towards fending
for the employee in retirement. Both parties base the funding on a fixed rate of
contribution. The funds so accumulated together with income generated thereon
during years of active labour service by the employee constitute his/her pension
assets. At retirement, such assets become an annuity over the lifespan of the
retiree.
A retiree may be entitled to withdraw a certain percentage of such assets lump
sum. Thereafter, the balance will continue to be invested while the employee
conterminously draws out of the fund based on some programmed schedule to
finance his consumption needs in retirement. Typically, pension assets under the
DC scheme are protected by law from any form of infringement, such as those
arising from court processes such as lien.
One of the tangible dividends of the defined contributory pension scheme is that it
allows pension asset owners to make decisive input in the growth of the value of
their pension asset and its eventual perpetuation. Furthermore, an intangible
benefit of the scheme lies in the portability of pension rights and their inherent
capacity to free the intrinsic feelings of labour from the often heard emotional
concerns of remaining “fixed” in the employment of an enterprise because of the
stability and certainty of payments of pension benefits during the lifespan of
retirement.
Another major benefit of the scheme is that it builds up a pool of resources that
foster individual and economy-wide prosperity within the paradigm of Franco
Modigliani’s life-cycle income hypothesis. Further more, pensions as a component
of transfer payments in aggregate government expenditure will cease. And within
the ambit of Say’s law productive active labour will bring forth its own retirement
income on a concurrent basis. This contrasts with the DB scheme where the
payment of pension income of retirees depended on the active labour force.

Akuns: Introduction of Defined Contributory Pension Scheme 117
Pension assets under the DC schemes are bequeathals to heirs. The existence of
mature capital markets with high fiduciary standards and transparency enhance
the effectiveness of DC pension schemes. The coverage and application of DC
pension schemes are versatile. The scheme may not necessarily be uniformly
applied by employers in either the public or private sector, but the coverage could
be extended to both employees and the self-employed in the formal and /or
informal jobs. Per se, the scheme imposes no retirement age on employees. The
DC pension scheme builds up long-term investment funds and their assets are
portable.
III. Country-Specific Experience
Generally, Chile pioneered the defined contributory pension scheme in 1980 to
salvage its DB pension schemes. The Chilean scheme was made compulsory for all
full time workers in the country. It requires workers to pay 10% of their annual
income into a retirement savings account, with full ownership and control. As at
2003, the scheme proved widely acceptable that 5.6 million Chileans, instead of
the targeted 3 million full time workers, were operating the scheme.
The widespread acceptance of the DC pension scheme in Chile spurred other Latin
American Countries to introduce it with varying degree of coverage. Mexico and
Bolivia introduced the scheme in 1997, while El Salvador followed suit in 1998.
Similarly USA, UK, Japan, Nigeria and other OECD countries experiencing fiscal
imbalance in sustaining their DB pension schemes have introduced DC pension
schemes tailored to their local peculiarities.
In the US, the participation rate of full time workers in the DC pension schemes
increased from 45% to 57% between 1988 and 1997. Amongst full time workers in
medium and large companies, the rate increased from 43% in 1993 to 55% in 1997.
In the UK, the DC pension schemes are very popular amongst younger generation
of workers. Overall, the buzzword in pension reforms in most countries is the
introduction of DC pension schemes to either replace existing DB pension
schemes or be juxtaposed with them.

118 Central Bank of Nigeria Economic and Financial Review March 2006
IV. Issues of Public Policy
For the purpose of analysis, pension system stakeholders are categorized into
three core groups as a basis for evaluating the policy thrust of DC pension scheme
against a Pareto optimal condition, viz: government, employers and employees
compared to the aboriginal family pension scheme that relied on children and
parents as stakeholders.
Conceptually, a Pareto optimal condition of welfare exists when a change in public
policy improves the welfare of target citizens without making anyone or group
worse off. The Pareto optimal condition was espoused in 1895 by Vilfredo Pareto,
an Italian Economist, as a yardstick for gauging the impact of public policy on
societal welfare.
Under the family and the DB pension schemes, an intergenerational symbiosis
exists between children and parents as well as between employees and
government-cum-employers. Parents work during their active labour years to
raise children, who will in turn work to provide sustenance for the parents when
such parents can no longer engage in labour service due to old age/infirmity.
Similarly, under the DB schemes, employees work to ‘raise’ and sustain a
corporation as a going-concern during their active labour years. In retirement, the
corporation sustains the retirees by paying pension, as is the case with DB
schemes. Thus, in operational terms, the DB pension scheme as an instrument of
public policy is a translation of the informal family pension scheme to a formal
level that reflects and accommodates the exigencies of an industrial society.
Hence, in Pareto terms, the DB pension scheme did not alter the welfare standard
of pensioners, either as parents or retirees. It could, therefore, be safely concluded
that DB pension scheme, as a replacement of the family pension scheme is Pareto
optimal.
It is worthy of note that the family pension schemes are still operational without
glitches. They offer comparable schemes akin to those of the DB and DC pensions.
The objective function of both schemes is to secure and adequately provide for the
welfare of citizens in retirement lifespan.

Akuns: Introduction of Defined Contributory Pension Scheme 119
On the contrary, under the DC pension scheme, a retiree shoulders the full burden
of the pension system. The identified symbiosis between employees and
government-cum-employers is shrugged off. The ability of a holder of pension
asset to exercise a decisive role in growing his pension asset carries with it an
embedded risk that could be termed the Achilles’ heel of the new scheme. The risk
could crystallize in the form of pension asset shrinkage and/or loss. The
likelihood constitutes a major burden associated with the DC pension schemes.
A pension asset can shrink when a component of a diversified portfolio is totally
lost to enterprise collapse or market failure. The former energy giant in the USA,
Enron, and Savannah Bank of Nigeria Plc in Nigeria are cases that typify the
possibility of shrinkage of even the most diversified pension asset portfolio. In the
extreme, a gullible pension asset holder who invests his asset in a single portfolio,
such as in any of the cases cited above, would suffer a total loss.
Either way, the incidence of pension asset shrinkage and/or loss is burdensome
and increases as the age of the holder advances. In very advanced age, such an
incidence will place enormous strains on a retiree, as the traditional fallback on
bonds of primordial family pension schemes may have been eroded and/or
weakened by the ruthlessness of the logic of market forces and the attendant
enthroning of individualism.
The objective function of pension schemes is to safeguard the economic welfare of
a citizen in retirement lifespan. The DB scheme, which defined fixed pension
benefits, guaranteed the certainty of fulfilling that objective, particularly for
adequatelt funded schemes. The fixed sum pension asset may loose transactional
value or purchasing power over time in the lifespan of a retiree, but its
instrumental utility to an aging retiree with a declining profile of needs is
enormous.
The loss of value inherent in the DB pension schemes is often ameliorated by
periodic upward reviews of the fixed sum pension benefit by government. For
instance, the DB pension of £3 per month in 1967 rose to N35,000 in 2005. A

120 Central Bank of Nigeria Economic and Financial Review March 2006
similar case exists for retirees that are reckoned to be collecting pension for over
30 years. Comparatively, the DC pension scheme obviously empowers the pension
asset holder to grow the value of the asset but has conterminously staked such
empowerment on the likelihood of shrinkage and/or loss of asset. Thus in
economic welfare terms, the DC pension scheme is not Pareto optimal, as a retiree
will continuously face the challenges of a likely slump in his welfare due to a
probable shrinkage and/or loss of pension asset.
One way to mitigate the likelihood of a shrinkage and/or loss of pension asset is
for public policy to institute a compensatory fund that will redeem proven cases of
pension asset shrinkage and/or loss. The objective is to ensure that the pension
assets of a retiree do not suffer debilitating leakages during retirement lifespan.
This will safeguard the assets and guarantee to the holder the certainty of the
asset as in the DB scheme. The whole essence of a compensatory scheme being
advocated by this paper is to put at bay, grief from retirement lifespan.
In both the US and UK, similar arrangement exists to safeguard and guarantee the
certainty of pension assets of retirees. In US, the Pension Benefit Guaranty
Corporation (PBGC) operates as a quasi-government enterprise to insure pension
assets under the DB scheme. In UK, the Pension Protection Fund (PPF) directly
provides compensation to retirees. The US arrangement is based on an insurance
scheme, while the UK arrangement is a government enterprise that deals directly
and based on compensatory payments to retirees.
The kernel of a pension asset compensatory fund is compassion and moral
underpinnings borne out of reparative inklings. This is quite unlike the case with
an insurance scheme, which as a commercial venture is primarily driven and
sustained by profit motives. Besides, an insurance scheme will require asset
holders to pay insurance premiums. Obviously, such payments would constitute
debilitating leakages of pension assets and, therefore, be an additional burden on
pensioners. The option to insure pension assets as a guarantee against the
likelihood of shrinkage and/or loss is not consistent with a Pareto optimal
condition.

Akuns: Introduction of Defined Contributory Pension Scheme 121
Another major policy issue that makes the DC pension scheme sub-optimal is that
its ‘sign-on’ effectively triggers a reduction in the welfare of an employee by
reducing the disposable income of an employee. The requirement that an
employee jointly contributes to the funding of his retirement savings account is
effected from employee payroll by check off. Yet, the employee still has to pay tax,
which was applied under DB scheme to finance pensions. Therefore, the check-off
from employee payroll for tax, in addition to retirement savings, constitutes the
magnitude of reduction from employee disposable income. The component of
deduction for retirement savings is new to the employee and, therefore,
constitutes a burden that reduces his current welfare. The component of
deduction for tax is not new per se, but was often the source of government
revenue for pension payments [or transfer payments]. Since the DC pension
scheme requires an employee to fend for his pension upfront, the continued
payment of PAYE tax by employees deserves review.
One option is to make contribution for retirement savings tax deductible. Another
is to convert the tax deductions to contributions for an increased level of
retirement savings. On the other hand, employees are allowed to enjoy a clean pay
by abrogating PAYE tax. In essence, the burden of tax as an instrument of fiscal
policy will be borne by employers alone who are the second pillar of the identified
pension system core stakeholders.
On the basis of the forgoing analysis, the introduction of DC pension scheme in
Nigeria will hurt employees the most out of the three identified core stakeholders
of a pension system. The symbiosis that exists between the stakeholders under the
DB pension scheme is stripped off. Under the DC pension scheme, the pensioner
alone as the third core stakeholder of the pension system bears the burden of the
likelihood of shrinkage and/or loss of his pension asset.
As a corollary, a DC pension asset is a bequeathal, and so is potentially encrusted
with transferable rights and can, thus, be held on a hereditable basis depending
on the extent of its perpetuation by successive holders. This dimension, though
latent, is apparent and does not seem to have been factored into the scheme
despite the fact that the scheme began 1st July 2004. The DB pension scheme

122 Central Bank of Nigeria Economic and Financial Review March 2006
operated with in-built mechanism that automatically extinguished the claim to
pension by heirs, and was, thus, clearly stripped of any form of transferability and
the possibility of bequeath. The hereditability of the DC pension scheme poses the
challenge of dealing with the rights and the attendant claims of heirs, especially
rancorous ones. The propensity of rancorous heirs to extinguish a pension asset
by immediate consumption may, in aggregate terms, trigger agitations that might
precipitate a possible loss of confidence in the system, and the attendant
undermining of its effectiveness.
The flip side of a pension asset transcending into a bequeathal is one in which the
retiree, due to longevity, outlives his asset. This possibility, which is non-existent
under the DB scheme, is eminently real because draw down of pension asset is
based on some planned profile at the time of retirement. Yet, neither the planner
nor the plan mechanism has the capability of factoring a retiree’s actual lifespan
with a limiting precision. In the long run, the idea that matters is that a retiree’s
actual lifespan is a crystallized position that is not amenable to planned draw
down of pension asset at the time of retirement. Thus, whether a pension asset
becomes a bequeathal or not is a threshold position that seems uncontrollable by
any logic.
A sound legal framework that is capable of striking a balance between cultural
cleavages and the exigencies of an industrial society need to be crafted to deal
decisively with issues relating to hereditability of pension assets. Beyond its
theoretical abstraction, the longevity of a pension asset holder poses no daunting
challenge. At such an advanced stage in life, age will necessarily impose on the
retiree a significantly small profile of needs. As a result, cases of longevity risk
that crystallized should be dealt with on merit and treated under a government
social security system designed for it and other deserving related cases.
V. Concluding Remarks
Overall, the benefits of DC pension scheme form the crux of the pension reforms
in Nigeria. As the economic manager and, indeed, the institutional capacity
builder of the economy, the CBN should once more rise to the challenge of paving
the way under the DC pension scheme. This will inspire confidence in the pension

Akuns: Introduction of Defined Contributory Pension Scheme 123
system and also smoothen out the identified issues that constitute one of the
reasons making employees apprehensive about the workable benefits of the DC
pension. Besides, it seems that the likelihood of pension asset shrinkage and/or
loss does not get adequate mention in public discussions. As a result, in groping
for a safe kerb, most employees that operated a funded scheme in the DB scheme
tend to unnecessarily clamor for a closed scheme under the new system.
Under the DC pension scheme, a closed pension scheme only vouches for the
institutional integrity of the pension asset custodian as well as the administrator,
but does not vitiate the identified likelihood of shrinkage and/or loss of pension
assets. Neither does it rouse a countervailing ameliorative measure such as the
proposed compensatory fund being advocated in this paper.
Since the holder of a pension asset would not know the precise length of a
retirement lifespan, it is not likely that asset drawn down will be structured to a
zero level such that it matches the limiting date of retirement lifespan. On a
priori, a net positive balance of a pension asset under the DB scheme will be a
bequeathal. The DC scheme is new in Nigeria but some countries have operated it
for a period that is reasonably long enough to lend itself to evaluation against the
welfare objective of public policy. The outcome of such evaluation will enrich the
operations of the scheme in Nigeria.

Central Bank of Nigeria Economic and Financial Review Volume 44/1 March 2006 124
Broad Money Demand and Financial Liberalization in South Africa— A Review
Abdurrahman Abdullahi∗
I Introduction
inancial liberalization encompass the following: the lifting or easing of interest
rate ceilings, lowering of compulsory reserve requirements and entry barriers, as
well as the reduction of government control in the allocation of credit. Financial
liberalization has been the hallmark of both developed and developing countries
in the face of globalization. The paper, therefore, tried to study the stability of money
demand using different estimation procedures under a financially liberalized economy.
II Summary of the Paper
According to the author, recent changes in international finance are posing serious
challenges to the conduct of monetary policy. The achievement of price stability was
made even more difficult by financial innovations and liberalization during the 1990s, as
well as the switch in policy emphasis from monetary targeting to inflation targeting. As a
result, a money demand function in the form of a single equation model is now the
center-piece in monetary policy design. It is used to forecast the path of the national
income and design money supply consistent with target paths in real economic growth.
The objective of the study was, therefore, to test the stability of money demand and the
performance of the money demand equation in South Africa, in the face of financial
liberalization and changes in the payments and settlement system. This was done by
developing a fixed-coefficient error-correction model for broad money demand function
for the period 1971 to 2000, after which quarterly forecasts were generated for 2001 and
2002, using a varying-parameter regression model.
The money demand function was specified in error-correction form in order to capture
the non-stationarity of the underlying time series. This methodology was appropriate for
∗ Abdullahi is an Economist in the Monetary Policy Department, Central Bank of Nigeria, Abuja. He acknowledges the comments of anonymous reviewers and colleagues of the Department.
F

Abdullahi: Broad Money Demand and Financial Liberalization 125
this work for two reasons. First, though money stocks, price and income levels are non-
stationary, they may well be co-integrated. Second, error-correction models allow for a
broad range of dynamic relationships between variables. The single equation error-
correction representation was estimated for M3 (nominal M3) using consumer price
index and real GDP, short-term market interest rate, long-term market interest rate and
own rate of M3. All variables except the interest rates were in natural logarithms.
The varying-parameter regression technique used for the forecasts, on the other hand,
uses the basic idea that the parameter vector in an econometric relationship may be
subject to the sequential variation over time due to the problems of structural change,
misspecification or aggregation. Thus, the essence of the approach is to formulate an
economic equation as a Kalman filter state-space model and to use a recursive algorithm
to maximize the log-likelihood function via a combination of the iterative estimation and
maximization and scoring technique. Thus, the model offers insight into improved
methods of analyzing time series data. Quarterly data from 1971 to 2000 were used to
estimate the model, while data for 2001 to 2002 was excluded for ex-post forecasting
evaluations.
Empirical results obtained from the study indicated that despite significant fluctuations
in the income parameter, the other long-run parameters of the estimated model were
remarkably stable. Also, a modeling strategy that allows parameters to vary over time
would better explain a money demand equation and, therefore, improve its forecasting
ability. Results also indicated that the switch to inflation targeting has not removed the
nexus between monetary policy and the stability of money demand in South Africa. Thus,
the debate about the stability of money demand is still relevant.
The author, thus, concluded that long-run causality from money growth to price inflation
may exist even in an inflation targeting regime or due to an accommodating monetary
policy, while the long-run stability of money demand may be affected by financial
liberalization and innovations, as well as the removal of capital controls.
III Comments
The study of monetary developments through the use of time-varying parameter
regression technique is an effective way of identifying the impact of financial innovations

126 Central Bank of Nigeria Economic and Financial Review March 2006
to money demand. The stability of the demand for money, for instance, could be affected
by innovations in the payments system, real time settlements, product diversification,
changes in monetary policy framework as well as the substitutability between holdings of
alternative assets. Thus, for a developing economy, such changes have useful
implications for monetary policy. This study, therefore, provided significant insights
into the behaviour of the money demand function, which is of utmost relevance for
Nigeria. The efforts at liberalizing the financial markets, reforming the payments and
settlement systems, changing the monetary policy framework as well as the automation
of banks’ and other financial institutions continue.
Specifically, the key lessons from the study for Nigeria could be summarized as follows:
An important area which would provide a basis for further investigation is the
incorporation of expectations and information asymmetry since it has become almost a
fact that anchoring expectations and uncertainties enables monetary authorities to
effectively control money growth and price level. This is because monetary signaling can
only be achieved with minimum dead-weight losses, if economic agents must interpret
and follow the desired course of monetary actions. It would, thus, be a lesson to begin to
publish forecasts which could signal and anchor economic agents’ behaviour. This can
precede the full implementation of the inflation targeting framework of monetary policy
First, regime shift in terms of a framework for the conduct of monetary policy require a
clear understanding of the dynamics that drive economic behaviour; otherwise, smooth
transition could be undermined. While the demand for money functions may not matter
so much in an inflation targeting regime, the relationship between volatility of monetary
aggregates and price determining indices implies that they are useful policy information.
So far, most of the conditions for moving to inflation targeting have been met. These
include:
• Goal Independence of the central bank;
• Coordination between monetary and fiscal authorities in order to address the
problems of fiscal surprises and dominance;
• The central bank is also developing a liquidity forecasting model;
• Enhanced revenue base of the government;

Abdullahi: Broad Money Demand and Financial Liberalization 127
• A strong external (reserve) position, which will ensure stability in the foreign
exchange market; and,
• Transparency in the conduct of monetary policy through various institutional
arrangements and fora such as the Bankers’ Committee, Monetary Policy Forum,
Annual Monetary Policy Conference, etc.
However, there is the need to intensify efforts at identifying the source of volatility of
demand for money function for Nigeria, which would provide a basis for streamlining
operations to conform to an inflation targeting regime, for instance, the use of reserve
management to influence the domestic money market operations.
In conclusion, therefore, implementing forecasts for key monetary indicators is a
credible way of enhancing monetary policy operations. It should be noted, therefore, that
there is the need for a stable forecasting regime that clearly brings out the trend,
transitory, irregular and permanent components of money demand in Nigeria. This
would provide useful information that would aid in the administration of monetary
policy, especially given the impacts of financial liberalization and changes in payments
and settlement systems on money demand.

SUBMISSION OF MANUSCRIPT TO CBN ECONOMIC AND FINANCIAL REVIEW
1. Three (3) hardcopies and a softcopy of the original manuscript should be addressed to the:
Editor-in-chief CBN Economic and Financial Review Research and Statistics Department Central Bank of Nigeria P.M.B.0187, Garki, Abuja
The softcopy of the papers can also be submitted via email as electronic document, preferably Microsoft
word document to either of the following email addresses: [email protected];
[email protected]; [email protected].
The article should not be more than 30 pages on A4 size paper and should be typed double-spaced with
a margin of 1.5 inches on all sides. The manuscript must be accompanied with a diskette copy and a
letter of submission written in English. Submission of a paper is assumed to imply that its contents
represent original and unpublished work and is not under consideration elsewhere for publication.
Normally, the review process is expected to take not more than three months. There is neither a
submission charge nor page fee. A return address (postal/email) should be indicated.
2. Papers may be accepted or returned for specified revisions. A paper is expected to be published
approximately six months from the date of acceptance.
3. Comments on published article/notes and reviews of up to 2,000 words will also be considered for
publication. Notes deal with relevant topics not meeting full length articles. Reviews may be about
articles published recently by this journal or elsewhere. A copy of the review/comments should be sent
to the articles’ author for clarification of any points or misunderstandings.
4. All submitted manuscripts are referred to an Editorial Board comprising of an in-house editorial
committee and external referees. All comments by the referees will be sent to the author(s) together
with a decision of the Editorial Board.
5. The purpose and scope of the article should be clearly stated in an abstract summarizing the article’s
essential points. The abstract should be typed on a separate page and should be between 80-100 words
in length. In addition, the JEL classification code (s) as well as keywords should be clearly indicated on
the abstract page.
6. The author’s institutional affiliation and necessary background information on the article should appear
at the foot of the first page. Footnote to the text should be listed at the end, followed by the list of
references

7. References for quotations or statements should be in parentheses in the text, not as notes. E.g. Hess
(1906:20) or Cagan (1958) or Majer (1975:35). Where more than three authors are involved, cite senior
author and use et al., E.G. Johnson et al. (1988).
8. Citations listed under the reference sections must begin on a new page. All entries must be typed
double-spaced, listed alphabetically by last name of senior author and chronologically for two or more
articles by the same author. The typed layout must conform to the following examples:
Nnanna, O.J. (2003). “Promoting Savings and Investment Culture for National Development.” CBN
Economic and Financial Review. Vol 41. No. 3 pp. 1-10
Oresotu, F.O. and Mordi, C.N.O. (1992). “The Demand for Money Function in Nigeria: An Empirical
Investigation.” CBN Economic and Financial Review. Vol.30.No.1 pp.32-69.
Croxton.,F.E.; Cowden,F.E.; and Klein, S. (1968). Applied General Statistics. London: Sir Isaac Pitman
and sons.
9. All tabular materials should be separated from the text in a series of tables numbered consecutively in
Arabic numerals preferably in Microsoft Excel. Each table should be typed double-spaced and identified
by a short descriptive at the top. Notes for table should be at the bottom of each table, before the source,
and marked by lower case superscript letters. Appropriately placed tables should be indicated in the
text.
10. Diagrams, graphs, charts, etc. must be separated from the text and clearly drawn in black ink on a white
paper with all axes clearly positioned. They should be submitted in a form suitable for reproduction
without redrawing, preferably in camera-ready artwork.
11. Where mathematical equations and formulae are used, they should be typed clearly. Notations,
exponents, etc, which are simple to reproduce should be used. The equations should be numbered
consecutively in Arabic numerals. The full mathematical workings necessary for justifying each step of
the argument should accompany all the articles of a mathematical nature. This is meant to assist the
reviewers and will not be published