Embed Size (px)
Citation preview

Cavitation in a metallic liquid: Homogeneous nucleation and growth of nanovoidsY. Cai, H. A. Wu, and S. N. Luo Citation: The Journal of Chemical Physics 140, 214317 (2014); doi: 10.1063/1.4880960 View online: http://dx.doi.org/10.1063/1.4880960 View Table of Contents: http://scitation.aip.org/content/aip/journal/jcp/140/21?ver=pdfcov Published by the AIP Publishing Articles you may be interested in Crystallization in supercooled liquid Cu: Homogeneous nucleation and growth J. Chem. Phys. 142, 064704 (2015); 10.1063/1.4907627 Spontaneous cavitation in a Lennard-Jones liquid at negative pressures J. Chem. Phys. 140, 184506 (2014); 10.1063/1.4874644 Cavitation and crystallization in a metastable Lennard-Jones liquid at negative pressures and low temperatures J. Chem. Phys. 135, 054512 (2011); 10.1063/1.3623587 Comment on “Evaluation of surface tension and Tolman length as a function of droplet radius from experimentalnucleation rate and supersaturation ratio: Metal vapor homogeneous nucleation” [J. Chem. Phys.124, 014506(2006)] J. Chem. Phys. 133, 047101 (2010); 10.1063/1.3420649 Kinetic details of the nucleation in supercooled liquid metals Appl. Phys. Lett. 89, 031903 (2006); 10.1063/1.2222335
This article is copyrighted as indicated in the article. Reuse of AIP content is subject to the terms at: http://scitation.aip.org/termsconditions. Downloaded to IP: 180.85.7.11
On: Sat, 09 Jan 2016 08:51:31
THE JOURNAL OF CHEMICAL PHYSICS 140, 214317 (2014)
Cavitation in a metallic liquid: Homogeneous nucleation and growthof nanovoids
Y. Cai,1,2 H. A. Wu,1,a) and S. N. Luo2,b)
1Department of Modern Mechanics, CAS Key Laboratory of Materials Behavior and Design,University of Science and Technology of China, Hefei, Anhui 230027, People’s Republic of China2The Peac Institute of Multiscale Sciences, Chengdu, Sichuan 610207, People’s Republic of China
(Received 15 March 2014; accepted 20 May 2014; published online 5 June 2014)
Large-scale molecular dynamics (MD) simulations are performed to investigate homogeneous nu-cleation and growth of nanovoids during cavitation in liquid Cu. We characterize in detail theatomistic cavitation processes by following the temporal evolution of cavities or voids, analyze thenucleation behavior with the mean first-passage time (MFPT) and survival probability (SP) meth-ods, and discuss the results against classical nucleation theory (CNT), the Tolman equation forsurface energy, independent calculation of surface tension via integrating the stress profiles, theJohnson-Mehl-Avrami (JMA) growth law, and the power law for nucleus size distributions. Cav-itation in this representative metallic liquid is a high energy barrier Poisson processes, and thesteady-state nucleation rates obtained from statistical runs with the MFPT and SP methods are inagreement. The MFPT method also yields the critical nucleus size and the Zeldovich factor. Fittingwith the Tolman’s equation to the MD simulations yields the surface energy of a planar interface(∼0.9 J m−2) and the Tolman length (0.4–0.5 Å), and those values are in accord with those fromintegrating the stress profiles of a planar interface. Independent CNT predictions of the nucleationrate (1033 − 34 s−1 m−3) and critical size (3–4 Å in radius) are in agreement with the MFPT andSP results. The JMA law can reasonably describe the nucleation and growth process. The size dis-tribution of subcritical nuclei appears to follow a power law with an exponent decreasing with in-creasing tension owing to coupled nucleation and growth, and that of the supercritical nuclei be-comes flattened during further stress relaxation due to void coalescence. © 2014 AIP PublishingLLC. [http://dx.doi.org/10.1063/1.4880960]
I. INTRODUCTION
Cavitation or the formation of bubbles in metastable liq-uids is of both scientific and applied interests.1–6 In order tounderstand cavitation in real liquids with preexisting bubblesor impurities, it would be helpful to understand homogeneousnucleation of cavities first. Liquids can be regarded as an ex-treme case of plastically deformed solids, and cavitation inliquids is analogous to void nucleation in solids with muchmore complicated phenomena and likely mechanisms. There-fore, studying liquid cavitation can also help us gain insightsinto damage in solids. Molecular dynamics (MD) simulationsare ideal for revealing the microscopic cavitation process andunderlying mechanisms since nucleation is largely initiated atsub-nm and sub-ns scales.
Cavitation is a special case of phase changes: liquid-vapor/vacuum transitions. In first-order phase transitions, spa-tial and temporal fluctuations in physical properties are re-quired to overcome the inherent energy barrier to form criticalnuclei of the daughter phase.7 As a result, it is extremely dif-ficult to directly observe critical nucleation and to determinerelated parameters including critical nucleus size and nucle-ation rate,8–10 because we define a critical nucleus at the lo-cal maximum where the probability of the forward transition
a)[email protected])[email protected]
equals to that of the backward transition. There are differentmethods to assess these parameters from atomistic simula-tions, and two important ones are the mean first-passage time(MFPT) method and the survival probability (SP) method forPoisson processes.11, 12 Despite their success in certain pro-cesses including condensation, it would be useful to apply andcompare these methods in cavitation.
Cavitation is a fluctuation-driven process and can be de-scribed with classical nucleation theory (CNT).7, 13–18 Molec-ular simulations and statistical theories have been attemptedwithin the context of CNT.19–27 However, direct applicationof CNT to cavitation is difficult due to the lack of reliableknowledge on such parameters as surface tension and pref-actor. For instance, assuming a constant value of surface ten-sion (equal to that for a planar surface) may underestimatenucleation rates with CNT.19, 20, 28 A recent work consideredthe Tolman length effect and found agreement in nucleationrate between CNT and MD simulations of cavitation in a bi-nary metallic liquid, but with inevitable assumptions on someparameters including critical size.29
To characterize nucleation parameters including criticalsize, the Tolman length and nucleation rate, and to connectsimulations to transition state and nucleation theories withminimum assumptions on certain parameters, we choose arepresentative metallic liquid (Cu), and perform MD simu-lations of cavitation under isotropic tension. We describe in
0021-9606/2014/140(21)/214317/7/$30.00 © 2014 AIP Publishing LLC140, 214317-1
This article is copyrighted as indicated in the article. Reuse of AIP content is subject to the terms at: http://scitation.aip.org/termsconditions. Downloaded to IP: 180.85.7.11
On: Sat, 09 Jan 2016 08:51:31
214317-2 Cai, Wu, and Luo J. Chem. Phys. 140, 214317 (2014)
detail the atomistic cavitation processes by following the tem-poral evolution of cavities or voids, analyze the nucleationbehavior with the MFPT and SP methods, and discuss the re-sults against CNT, the Tolman equation for surface energy,independent calculation of surface tension via integratingthe stress profiles, the Johnson-Mehl-Avrami (JMA) growthlaw,30–32 and the power law for nucleus size distributions.10
Our work shows agreement between the MFPT method, SPmethod, and CNT, and consistency in surface energy is foundfor different methods. Section II addresses the methodologyof MD simulations, void analysis, and the MFPT and SPmethods. We present the results and discussion in Sec. III andmain conclusions in Sec. IV.
II. METHODOLOGY
We use the embedded atom method (EAM) potential33
to describe the atomic interactions in Cu. This potential hasbeen fitted to reproduce physical properties such as stack-ing fault energy and elastic moduli,33 and widely used ina large number of simulations, including melting curve andequations of state.10, 34 Our MD simulations employ theLarge-scale Atomic/Molecular Massively Parallel Simulator(LAMMPS).35 We apply the constant pressure-temperature(NPT) ensemble for constructing the initial liquid configura-tions, and the constant volume-temperature ensemble (NVT)for cavitation simulations. All simulations are conducted un-der three-dimensional (3D) periodic boundary conditions.The time step for integrating the equation of motion is 1 fs.Temperature is controlled with a Hoover thermostat. The ini-tial liquid Cu configurations are obtained by melting singlecrystal Cu at zero pressure, and then equilibrated at 1400 Kfor cavitation simulations. The liquid configurations of a cu-bic shape are subjected to an incremental, isotropic, tensilestrain of 6 × 10⁻⁴ every 1000 steps. Two system sizes are at-tempted of 864 000 atoms and 2 916 000 atoms. Discussionsrefer to the smaller system size unless noted otherwise.
There are different methods in quantifying nucleation ofa daughter phase (nanovoids) from a parent phase (Cu liq-uid), and here we explore the survival probability method12
for Poisson processes, and the mean first-passage timemethod.10, 11 Nucleation rate can be obtained via the SPmethod, and nucleation rate, critical nucleus size, and the Zel-dovich factor, with the MFPT method. Both methods requirenumerous independent runs for sufficient statistics. For eachstatistic run, we change the random number seed for assigninginitial velocities in NVT simulations.
In the presence of a high cavitation energy barrier, theappearance of a supercritical cluster or nucleus becomes arandom event, whose probability is described by a Poissondistribution
Pk(t) = 1
k!
(t
τn
)k
exp
(− t
τn
). (1)
Here, Pk(t) denotes the probability for k clusters of size largerthan n to appear at time t, and τ−1
n is the average appearancerate of these clusters. Instead of calculating Pk(t) literally, itis equivalent but easier to characterize the random nucleationevents with the probability for a system not to have nucleated
any clusters of size n after a time t, i.e., the survival proba-bility (Ps) of the metastable parent phase (liquid). For a fullyrandom process, it is given by
Ps(t) = Pk=0(t) = exp
(− t
τn
). (2)
Monitoring the evolution of Ps can thus provide a straightfor-ward way to evaluate the nucleation rate. In our simulations,Ps is obtained as the ratio of the number of runs without anynuclei beyond size n to the total number of runs. τ n is essen-tially τ J in the MFPT method described below.
The steady-state nucleation or barrier-crossing rate J, thecritical nucleus size n∗, and the Zeldovich factor Z, can beevaluated with the MFPT method.11, 36, 37 Here, we followthe general MFPT methodology37 which has been presentedand applied to different physical processes by Wedekind andco-workers,11, 38, 39 Bartell and Wu,40 and Zheng et al.10 Formost activated processes such as nucleation of cavities/voids(daughter phase) from a liquid (parent phase), the dynamicscan be described by the Fockker-Planck equation11, 41
∂P (x, t)
∂t= ∂
∂x
{D0e
− U (x)kBT
∂
∂x
[P (x, t)e
U (x)kBT
]}. (3)
Here, x is the reaction coordinate, D0 represents the general-ized diffusion coefficient, kB is the Boltzmann constant, andU(x) denotes the excess Gibbs free energy. P(x, t) is the prob-ability for the system sitting at a specific x for a given time t.We define the mean-first passage time, τ (x0; a, b), as the aver-age time consumed for the system initially at state x0 to leavethe domain [a, b] for the first time. For reflecting boundarypoint a and absorbing boundary b, the MFPT is expressed asfollows:37
τ (x0; a, b) =∫ b
x0
1
D0e
U (y)kBT dy
∫ y
a
e− U (z)
kBT dz. (4)
With fixed x0, τ (x0; a, b) simplifies to τ (b). For an energybarrier of sufficient height, τ (b) adopts a sigmoidal shape,and a transition state appears at the inflection point x∗. Sincethe MFPTs are significantly longer than the characteristicdiffusion time 1/D0,
∂2τ (b)
∂b2
∣∣∣b=x∗
∼= 0. (5)
We then have
τ (b) = τJ
2[1 + erf((b − x∗)c)]. (6)
τ J is proportional to the inverse of the steady-state transitionrate (J−1), and c denotes the local curvature at the top of thebarrier
c =√
|U ′′(x∗)|2kBT
, (7)
and the Zeldovich factor Z = c/√
π .In the case of cavitation, b corresponds to the size of the
largest void nucleus (nmax), x∗ = n∗, and J = (τJ V )−1 (V≡ volume). We obtain τ (b) = τ (nmax) via averaging amongN independent runs. We calculate nmax(t) for each run with
This article is copyrighted as indicated in the article. Reuse of AIP content is subject to the terms at: http://scitation.aip.org/termsconditions. Downloaded to IP: 180.85.7.11
On: Sat, 09 Jan 2016 08:51:31
214317-3 Cai, Wu, and Luo J. Chem. Phys. 140, 214317 (2014)
the void analysis method (see below), and
τ (nmax) = 1
N
N∑i=1
ti(nmax). (8)
Here, ti(nmax) is the time when nmax reaches or exceeds a givenvalue for the first time in the ith run. Fitting to τ (b) = τ (nmax)with Eq. (6) yields n∗, J, and Z.
A void analysis method is used to characterize void(cavity) nucleation and growth at atomistic scales.29 In thismethod, we first divide the simulation supercell into numer-ous regularly spaced grids in three dimensions. For a givengrid point, if there is a Cu atom within a distance less thandcut from it, this grid point is excluded from the list of voidvoxels; otherwise, it is counted as a void voxel. dcut and thegrid width are about 0.2 nm in our simulations, and a voidvoxel is comparable to a vacancy in size. Two void voxels be-long to the same cluster (void nucleus) if they are within thenearest-neighbor distance of each other. The number of voidvoxels contained in a cluster is void size, n.
III. RESULTS AND DISCUSSION
Our main purpose is to characterize homogeneous voidnucleation and growth process in a representative metallicliquid at atomistic scales, and gain insights into nucleationand growth during cavitation and diffusive phase transitionsin general. In our MD simulations with 3D periodic bound-aries, the initial liquid Cu configurations are equilibrated at1400 K and 0 GPa, and homogeneous nucleation of nanovoidsoccurs during incremental, isotropic, tensile strain. The cavi-tation processes are analyzed with the SP and MFPT methodsfor nucleation, the growth is examined within the context ofthe JMA growth law and power law, and the results are com-pared to CNT, the Tolman’s equation for interface energy, andindependent methods when appropriate (Figs. 1–9).
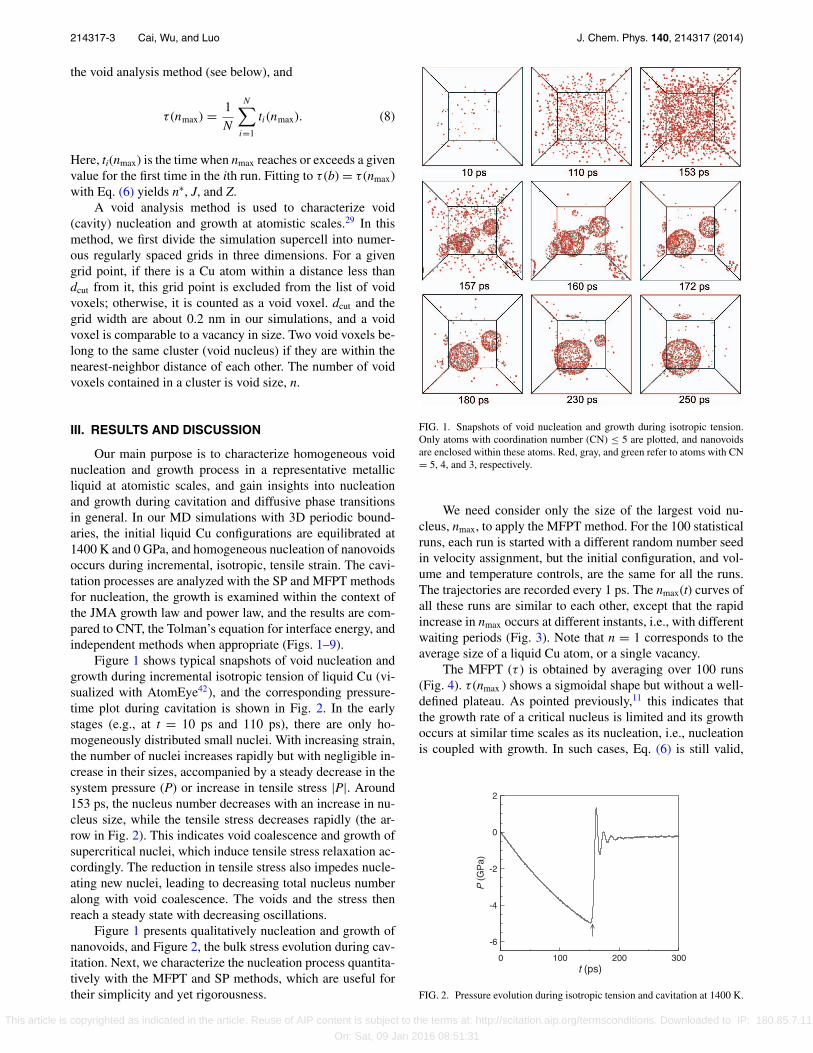
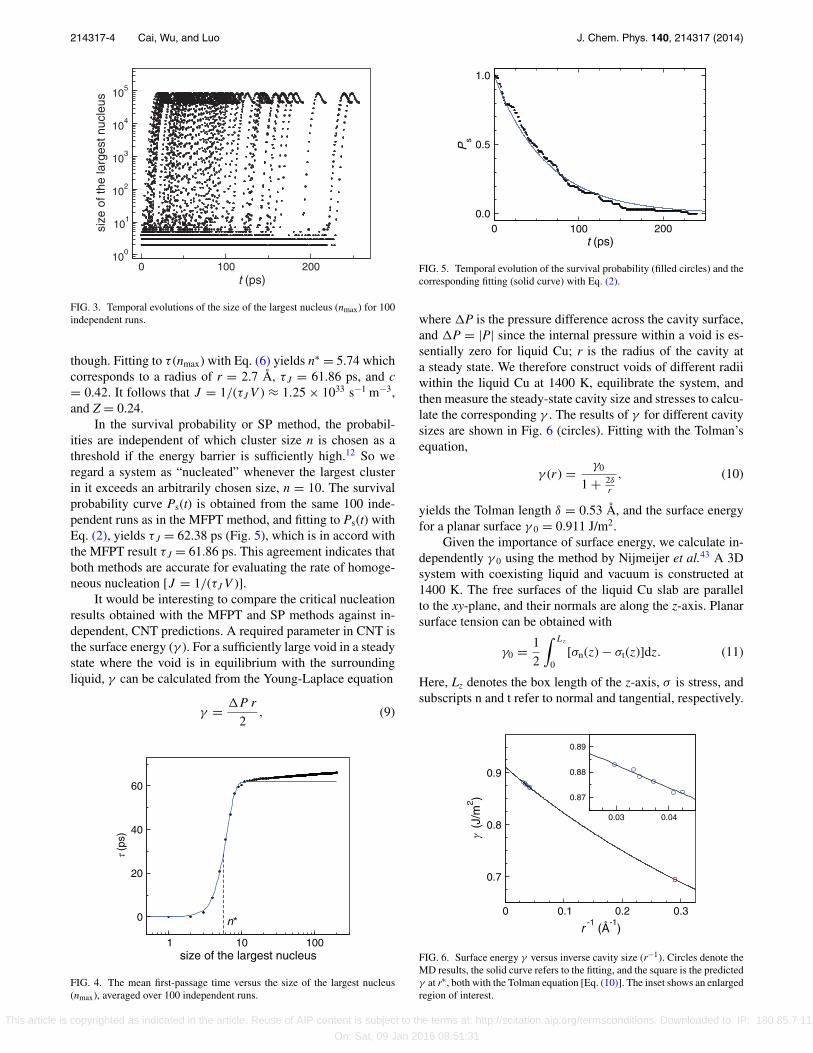
Figure 1 shows typical snapshots of void nucleation andgrowth during incremental isotropic tension of liquid Cu (vi-sualized with AtomEye42), and the corresponding pressure-time plot during cavitation is shown in Fig. 2. In the earlystages (e.g., at t = 10 ps and 110 ps), there are only ho-mogeneously distributed small nuclei. With increasing strain,the number of nuclei increases rapidly but with negligible in-crease in their sizes, accompanied by a steady decrease in thesystem pressure (P) or increase in tensile stress |P|. Around153 ps, the nucleus number decreases with an increase in nu-cleus size, while the tensile stress decreases rapidly (the ar-row in Fig. 2). This indicates void coalescence and growth ofsupercritical nuclei, which induce tensile stress relaxation ac-cordingly. The reduction in tensile stress also impedes nucle-ating new nuclei, leading to decreasing total nucleus numberalong with void coalescence. The voids and the stress thenreach a steady state with decreasing oscillations.
Figure 1 presents qualitatively nucleation and growth ofnanovoids, and Figure 2, the bulk stress evolution during cav-itation. Next, we characterize the nucleation process quantita-tively with the MFPT and SP methods, which are useful fortheir simplicity and yet rigorousness.
FIG. 1. Snapshots of void nucleation and growth during isotropic tension.Only atoms with coordination number (CN) ≤ 5 are plotted, and nanovoidsare enclosed within these atoms. Red, gray, and green refer to atoms with CN= 5, 4, and 3, respectively.
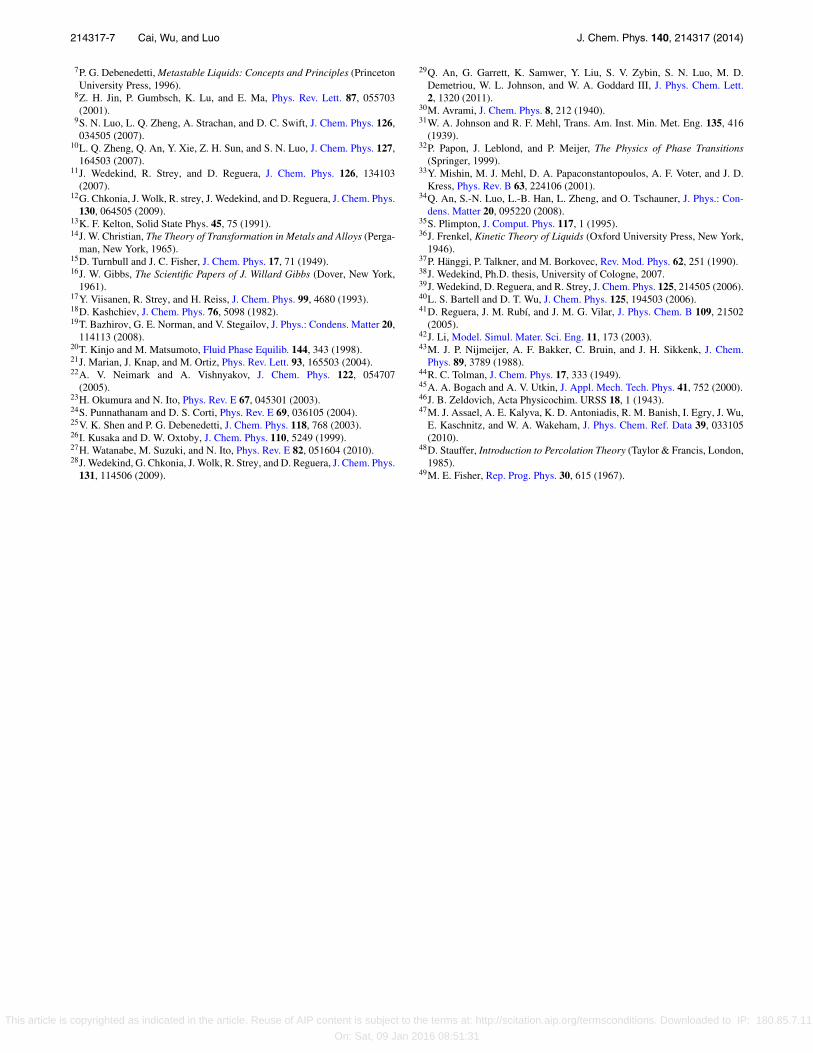
We need consider only the size of the largest void nu-cleus, nmax, to apply the MFPT method. For the 100 statisticalruns, each run is started with a different random number seedin velocity assignment, but the initial configuration, and vol-ume and temperature controls, are the same for all the runs.The trajectories are recorded every 1 ps. The nmax(t) curves ofall these runs are similar to each other, except that the rapidincrease in nmax occurs at different instants, i.e., with differentwaiting periods (Fig. 3). Note that n = 1 corresponds to theaverage size of a liquid Cu atom, or a single vacancy.
The MFPT (τ ) is obtained by averaging over 100 runs(Fig. 4). τ (nmax ) shows a sigmoidal shape but without a well-defined plateau. As pointed previously,11 this indicates thatthe growth rate of a critical nucleus is limited and its growthoccurs at similar time scales as its nucleation, i.e., nucleationis coupled with growth. In such cases, Eq. (6) is still valid,
0 100 200 300t (ps)
-6
-4
-2
0
2
P (
GP
a)
FIG. 2. Pressure evolution during isotropic tension and cavitation at 1400 K.
This article is copyrighted as indicated in the article. Reuse of AIP content is subject to the terms at: http://scitation.aip.org/termsconditions. Downloaded to IP: 180.85.7.11
On: Sat, 09 Jan 2016 08:51:31
214317-4 Cai, Wu, and Luo J. Chem. Phys. 140, 214317 (2014)
0 100 200t (ps)
100
101
102
103
104
105
size
of t
he la
rges
t nuc
leus
FIG. 3. Temporal evolutions of the size of the largest nucleus (nmax) for 100independent runs.
though. Fitting to τ (nmax) with Eq. (6) yields n∗ = 5.74 whichcorresponds to a radius of r = 2.7 Å, τ J = 61.86 ps, and c= 0.42. It follows that J = 1/(τJ V ) ≈ 1.25 × 1033 s−1 m−3,and Z = 0.24.
In the survival probability or SP method, the probabil-ities are independent of which cluster size n is chosen as athreshold if the energy barrier is sufficiently high.12 So weregard a system as “nucleated” whenever the largest clusterin it exceeds an arbitrarily chosen size, n = 10. The survivalprobability curve Ps(t) is obtained from the same 100 inde-pendent runs as in the MFPT method, and fitting to Ps(t) withEq. (2), yields τ J = 62.38 ps (Fig. 5), which is in accord withthe MFPT result τ J = 61.86 ps. This agreement indicates thatboth methods are accurate for evaluating the rate of homoge-neous nucleation [J = 1/(τJ V )].
It would be interesting to compare the critical nucleationresults obtained with the MFPT and SP methods against in-dependent, CNT predictions. A required parameter in CNT isthe surface energy (γ ). For a sufficiently large void in a steadystate where the void is in equilibrium with the surroundingliquid, γ can be calculated from the Young-Laplace equation
γ = �P r
2, (9)
1 10 100size of the largest nucleus
0
20
40
60
τ(p
s)
n*
FIG. 4. The mean first-passage time versus the size of the largest nucleus(nmax), averaged over 100 independent runs.
0 100 200t (ps)
0.0
0.5
1.0
Ps
FIG. 5. Temporal evolution of the survival probability (filled circles) and thecorresponding fitting (solid curve) with Eq. (2).
where �P is the pressure difference across the cavity surface,and �P = |P| since the internal pressure within a void is es-sentially zero for liquid Cu; r is the radius of the cavity ata steady state. We therefore construct voids of different radiiwithin the liquid Cu at 1400 K, equilibrate the system, andthen measure the steady-state cavity size and stresses to calcu-late the corresponding γ . The results of γ for different cavitysizes are shown in Fig. 6 (circles). Fitting with the Tolman’sequation,
γ (r) = γ0
1 + 2δr
, (10)
yields the Tolman length δ = 0.53 Å, and the surface energyfor a planar surface γ 0 = 0.911 J/m2.
Given the importance of surface energy, we calculate in-dependently γ 0 using the method by Nijmeijer et al.43 A 3Dsystem with coexisting liquid and vacuum is constructed at1400 K. The free surfaces of the liquid Cu slab are parallelto the xy-plane, and their normals are along the z-axis. Planarsurface tension can be obtained with
γ0 = 1
2
∫ Lz
0[σn(z) − σt(z)]dz. (11)
Here, Lz denotes the box length of the z-axis, σ is stress, andsubscripts n and t refer to normal and tangential, respectively.
0 0.1 0.2 0.3
r -1
(Å-1
)
0.7
0.8
0.9
γ(J
/m2 )
0.03 0.04
0.87
0.88
0.89
FIG. 6. Surface energy γ versus inverse cavity size (r−1). Circles denote theMD results, the solid curve refers to the fitting, and the square is the predictedγ at r∗, both with the Tolman equation [Eq. (10)]. The inset shows an enlargedregion of interest.
This article is copyrighted as indicated in the article. Reuse of AIP content is subject to the terms at: http://scitation.aip.org/termsconditions. Downloaded to IP: 180.85.7.11
On: Sat, 09 Jan 2016 08:51:31

214317-5 Cai, Wu, and Luo J. Chem. Phys. 140, 214317 (2014)
0
1
2
3
20 30
0
4
8
130 140
(a)
(b)
FIG. 7. Profiles of the differential stress (a) and density (b) of a liquid slabat T = 1400 K. The dashed curves refer to the fitting with Eqs. (18) and (19).
After equilibration, the density and stress profiles along thez-axis are measured [Fig. 7(a)]. If we divide the liquid slabalong the z-axis into Nb bins, Eq. (11) can be rewritten as
γ0 = 1
2
Nb∑k=1
γ (k), (12)
with
γ (k) = Lz
Nb
{σzz(k) − 1
2[σxx(k) + σyy(k)]
}. (13)
We thus obtain γ 0 = 0.903 J/m2, in excellent agreement with0.911 J/m2 from fitting with the Tolman’s equation. This lendssupport to the methodology of obtaining γ 0 and δ by fittingthe Tolman’s equation to simulations of voids with differentsizes.
In classical nucleation theory, the driving force for nucle-ation of a spherical void is
�G = 4πr2γ − 4
3πr3|P |, (14)
where the first (surface) term is the free energy gain due tosurface tension of a cavity and the second (bulk) term is the re-duction while creating the cavity. In CNT, one often assumesa step-function-like interface (δ = 0 or δ r). However, con-sidering the Tolman length is necessary.29, 44 The radius of thecritical nucleus r∗ satisfies10
1 + 3δr∗(
1 + 2δr∗
)2
r∗0
r∗ = 1, (15)
where r∗0 = 2γ0/|P | for δ = 0. Using values obtained above,
i.e., δ = 0.53 Å and γ 0 = 0.911 J/m2, we have r∗ = 3.44 Å.For the critical radius, the surface energy is 0.7 J/m2 accordingto Eq. (10).
�G peaks at the critical value (�G∗) with the criticalradius r∗. From Eq. (14), we have �G∗ = 1.71 eV for P= −4.52 GPa and T = 1400 K. Given �G∗, CNT allows us
to estimate the nucleation rate at the critical size with
J = J0 exp
(−�G∗
kBT
), (16)
where J0 is a prefactor depending on several parameters. InBogach and Utkin’s work,45, 46 J0 is expressed as
J0 = N
V
γ
η
√γ
kBT. (17)
Here, N denotes the total number of Cu atoms within a volumeV , and η is the viscosity. η is 3.74 mPa s for liquid Cu at T= 1400 K.47 We therefore obtain J0 ∼ 7 × 1040 s−1 m−3, andJ ∼ 4 × 1034 s−1 m−3 from Eq. (16). The nucleation rate ob-tained from CNT here is comparable to those from the MFPTand SP methods; the CNT result is slightly higher by approx-imately one order of magnitude, but such a discrepancy isreasonable as discussed below.
Given the functional form of nucleation rate in CNT[Eq. (16)], a slight variation in �G∗ may be amplified andpropagated into J. �G∗ is also sensitive to surface energy γ :�G∗∝γ 3. Thus, a small error in γ may cause a drastic dif-ference in the calculated nucleation rate. For example, assum-ing γ0 = 0.903 J/m2 as obtained from the stress profiles [Eq.(11)], we obtain δ = 0.42 Å and γ = 0.73 J/m2 near the tran-sition point (153 ps). The nucleation rate can then be calcu-lated from CNT as J ∼ 4 × 1033 s−1 m−3 from Eq. (16), whichis close to the MFPT and SP results (1.25 × 1033 s−1 m−3).
The critical nucleus r∗ is also an important parameterto be elaborated here. r∗ = 2.7 Å obtained from the MFPTmethod is smaller than that from CNT (3.44 Å). However,r∗ = 2.7 Å from MFPT only accounts for strict void spacewithout considering the diffuse interface or transition zone be-tween the void and the liquid. In order to find a characteristiclength of the transition zone, we analyze the liquid-cavity in-terface profiles for the planar interface (Fig. 7). The density(ρ) profile can be described by a sigmoidal function,
ρ(z) = ρmin + ρmax − ρmin
2
[1 − tanh
(z − z0
2w
)], (18)
where z0 is the center of the interface, z is the distance, andw denotes a characteristic interface length scale. Fitting to thesimulation results with Eq. (18) yields w = 0.65 Å for theplanar interface at 1400 K. If we simply add the characteristiclength scale w to r∗ = 2.7 Å from MFPT, r∗ becomes 3.35 Å,in excellent agreement with the CNT value (3.44 Å). If wetake the 10%–90% width of the interface (4.394w = 2.86 Å)as the interface thickness, then the corrected r∗ is ∼4 Å,with half the interface thickness (1.4 Å) considered. The crit-ical sizes as obtained from CNT and MFPT are in a reason-able agreement. We also fit the differential stress profile (σ n-t
= σ n − σ t) with the Gaussian function,
σn−t(z) = A exp
[− (z − z0)2
2μ2
], (19)
where A, z0, and μ are fitting parameters. μ is the stan-dard deviation representing the width of the Gaussian, andμ = 2w ∼= 1.35 Å (Fig. 7). The differential stress peaks whendensity nearly reaches its maximum value. Thus, either μ
from the stress profile or w from the density profile can be
This article is copyrighted as indicated in the article. Reuse of AIP content is subject to the terms at: http://scitation.aip.org/termsconditions. Downloaded to IP: 180.85.7.11
On: Sat, 09 Jan 2016 08:51:31

214317-6 Cai, Wu, and Luo J. Chem. Phys. 140, 214317 (2014)
150 160 170t (ps)
0
0.01
0.02
0.03
f V
FIG. 8. Temporal evolution of the void volume fraction during cavitation.The solid curve is the Johnson-Mehl-Avrami fitting to the simulation result.
used to characterize the interface thicknesses. Interestingly,w (0.65 Å) is close to the Tolman length δ, and may be usedto estimate the latter.
The phenomenological JMA law is often utilized to de-scribe the growth dynamics of a daughter phase (nanovoids)from its parent phase (liquid Cu). In our work, the JMA lawrelates the growth time to void volume fraction (fV ),
fV (t) = fm[1 − exp(−ktη)], (20)
where fm is the maximum volume fraction of cavity prescribedby the stress and temperature conditions, k is a prefactor, andη is the characteristic growth exponent. For 3D linear growthof noncontact and fixed-number spherical nuclei, we haveη = 3, while η = 4 and η > 4 for fixed-number sphericalnuclei, a constant, and an increasing nucleation rate, respec-tively. Fitting to the late stages of the simulations with theJMA law yields η ∼ 7 (Fig. 8).
To better understand the mechanism of critical nucle-ation, we examine the size distribution of subcritical nuclei aswell as its evolution at different stages of cavitation. We thusperform MD simulations of cavitation in a much larger sys-tem (2 916 000 atoms), and plot the size distribution of all thenuclei including isolated individual void voxels in logarithm-logarithm scales (Fig. 9). The distributions of small nuclei fol-lows a power law at different times of cavitation, i.e.,
F(n) = F0n−α, (21)
where F denotes the multiplicity or frequency of void nu-clei of size n. The exponent α is in the range of 3–6, greaterthan 2.2 predicted from 3D percolation model,48, 49 likely be-cause of homogeneous, independent nucleation events in theearly stages. α decreases with increasing time and tension.This implies that the driving force or tension affects the α
exponent directly. When the tension is relatively low, smallnuclei form via fluctuations, leading to larger α; increasingtension assists the growth of supercritical nuclei and theircoalescence, resulting in smaller α. The deviation from thepower law and flattening for supercritical nuclei at later stagescould be caused by finite size effect in MD simulations, or dueto coalescence-dominated growth with reduced nucleationunder stress relaxation.
1
10
100
1000
1
10
100
1000
nucl
ues
mul
tiplic
ity
1 10
nuclues size
1
10
100
1000
1 10
55 ps 56 ps
57 ps 58 ps
59 ps 60 ps
α = 5.33 α = 4.77
α = 4.84 α = 3.75
α = 3.47 α = 3.61
FIG. 9. Void size-multiplicity plots during cavitation. The solid curves de-note power-law fitting with an exponent α. The system size is 2 916 000atoms.
IV. CONCLUSION
MD simulations of homogeneous nucleation and growthof nanovoids during cavitation are conducted on liquid Cu.Cavitation in this metallic liquid is a high energy barrier Pois-son process, and the steady-state nucleation rates obtainedwith the MFPT and SP methods are in agreement. In addi-tion, the MFPT method yields the critical nucleus size andthe Zeldovich factor. Via fitting the Tolman’s equation to theMD simulations, we obtain the surface energy of a planar in-terface (∼0.9 J m−2) and the Tolman length (0.4–0.5 Å); thosevalues agree with those from integrating the stress profiles ofa planar interface. Independent CNT predictions of the nucle-ation rate (1033−34 s−1 m−3) and critical size (3–4 Å in radius)are in accord with those from the MFPT and SP methods. TheJMA law can reasonably describe the nucleation and growthprocess. The size distribution of subcritical and small nucleiappears to follow a power law with an exponent decreasingwith increasing tension due to coupled nucleation and growth,and that of the supercritical nuclei becomes flattened duringfurther stress relaxation owing to void coalescence.
ACKNOWLEDGMENTS
This work was supported in part by National ScienceFoundation of China (NSFC) (11172289) and by the Funda-mental Research Funds for the Central Universities of China.
1M. S. Plesset, Annu. Rev. Fluid Mech. 9, 145 (1977).2H. G. Flynn, J. Acoust. Soc. Am. 31, 1582 (1959).3M. Kornfeld and L. Suvorov, J. Appl. Phys. 15, 495 (1944).4D. H. Trevena, Cavitation and Tension in Liquids (Adam Hilger, Bristol,UK, 1987).
5K. S. Suslick, M. M. Mdleleni, and J. T. Ries, J. Am. Chem. Soc. 119, 9303(1997).
6J. Classen, C.-K. Su, and H. J. Maris, Phys. Rev. Lett. 77, 2006 (1996).
This article is copyrighted as indicated in the article. Reuse of AIP content is subject to the terms at: http://scitation.aip.org/termsconditions. Downloaded to IP: 180.85.7.11
On: Sat, 09 Jan 2016 08:51:31
214317-7 Cai, Wu, and Luo J. Chem. Phys. 140, 214317 (2014)
7P. G. Debenedetti, Metastable Liquids: Concepts and Principles (PrincetonUniversity Press, 1996).
8Z. H. Jin, P. Gumbsch, K. Lu, and E. Ma, Phys. Rev. Lett. 87, 055703(2001).
9S. N. Luo, L. Q. Zheng, A. Strachan, and D. C. Swift, J. Chem. Phys. 126,034505 (2007).
10L. Q. Zheng, Q. An, Y. Xie, Z. H. Sun, and S. N. Luo, J. Chem. Phys. 127,164503 (2007).
11J. Wedekind, R. Strey, and D. Reguera, J. Chem. Phys. 126, 134103(2007).
12G. Chkonia, J. Wolk, R. strey, J. Wedekind, and D. Reguera, J. Chem. Phys.130, 064505 (2009).
13K. F. Kelton, Solid State Phys. 45, 75 (1991).14J. W. Christian, The Theory of Transformation in Metals and Alloys (Perga-
man, New York, 1965).15D. Turnbull and J. C. Fisher, J. Chem. Phys. 17, 71 (1949).16J. W. Gibbs, The Scientific Papers of J. Willard Gibbs (Dover, New York,
1961).17Y. Viisanen, R. Strey, and H. Reiss, J. Chem. Phys. 99, 4680 (1993).18D. Kashchiev, J. Chem. Phys. 76, 5098 (1982).19T. Bazhirov, G. E. Norman, and V. Stegailov, J. Phys.: Condens. Matter 20,
114113 (2008).20T. Kinjo and M. Matsumoto, Fluid Phase Equilib. 144, 343 (1998).21J. Marian, J. Knap, and M. Ortiz, Phys. Rev. Lett. 93, 165503 (2004).22A. V. Neimark and A. Vishnyakov, J. Chem. Phys. 122, 054707
(2005).23H. Okumura and N. Ito, Phys. Rev. E 67, 045301 (2003).24S. Punnathanam and D. S. Corti, Phys. Rev. E 69, 036105 (2004).25V. K. Shen and P. G. Debenedetti, J. Chem. Phys. 118, 768 (2003).26I. Kusaka and D. W. Oxtoby, J. Chem. Phys. 110, 5249 (1999).27H. Watanabe, M. Suzuki, and N. Ito, Phys. Rev. E 82, 051604 (2010).28J. Wedekind, G. Chkonia, J. Wolk, R. Strey, and D. Reguera, J. Chem. Phys.
131, 114506 (2009).
29Q. An, G. Garrett, K. Samwer, Y. Liu, S. V. Zybin, S. N. Luo, M. D.Demetriou, W. L. Johnson, and W. A. Goddard III, J. Phys. Chem. Lett.2, 1320 (2011).
30M. Avrami, J. Chem. Phys. 8, 212 (1940).31W. A. Johnson and R. F. Mehl, Trans. Am. Inst. Min. Met. Eng. 135, 416
(1939).32P. Papon, J. Leblond, and P. Meijer, The Physics of Phase Transitions
(Springer, 1999).33Y. Mishin, M. J. Mehl, D. A. Papaconstantopoulos, A. F. Voter, and J. D.
Kress, Phys. Rev. B 63, 224106 (2001).34Q. An, S.-N. Luo, L.-B. Han, L. Zheng, and O. Tschauner, J. Phys.: Con-
dens. Matter 20, 095220 (2008).35S. Plimpton, J. Comput. Phys. 117, 1 (1995).36J. Frenkel, Kinetic Theory of Liquids (Oxford University Press, New York,
1946).37P. Hänggi, P. Talkner, and M. Borkovec, Rev. Mod. Phys. 62, 251 (1990).38J. Wedekind, Ph.D. thesis, University of Cologne, 2007.39J. Wedekind, D. Reguera, and R. Strey, J. Chem. Phys. 125, 214505 (2006).40L. S. Bartell and D. T. Wu, J. Chem. Phys. 125, 194503 (2006).41D. Reguera, J. M. Rubí, and J. M. G. Vilar, J. Phys. Chem. B 109, 21502
(2005).42J. Li, Model. Simul. Mater. Sci. Eng. 11, 173 (2003).43M. J. P. Nijmeijer, A. F. Bakker, C. Bruin, and J. H. Sikkenk, J. Chem.
Phys. 89, 3789 (1988).44R. C. Tolman, J. Chem. Phys. 17, 333 (1949).45A. A. Bogach and A. V. Utkin, J. Appl. Mech. Tech. Phys. 41, 752 (2000).46J. B. Zeldovich, Acta Physicochim. URSS 18, 1 (1943).47M. J. Assael, A. E. Kalyva, K. D. Antoniadis, R. M. Banish, I. Egry, J. Wu,
E. Kaschnitz, and W. A. Wakeham, J. Phys. Chem. Ref. Data 39, 033105(2010).
48D. Stauffer, Introduction to Percolation Theory (Taylor & Francis, London,1985).
49M. E. Fisher, Rep. Prog. Phys. 30, 615 (1967).
This article is copyrighted as indicated in the article. Reuse of AIP content is subject to the terms at: http://scitation.aip.org/termsconditions. Downloaded to IP: 180.85.7.11
On: Sat, 09 Jan 2016 08:51:31


![Visualization of Unsteady Behavior of Cavitation in ... · cavitation state, transition-cavitation state, and super-cavitation state in the orifice throat [5]. Under relative high](https://img.pdfslide.us/doc/110x75/5b4f673e7f8b9a166e8c4c74/visualization-of-unsteady-behavior-of-cavitation-in-cavitation-state-transition-cavitation.jpg)