Embed Size (px)
Citation preview
International Journal of Business and Economics Research 2015; 4(4): 180-191
Published online July 12, 2015 (http://www.sciencepublishinggroup.com/j/ijber)
doi: 10.11648/j.ijber.20150404.11
ISSN: 2328-7543 (Print); ISSN: 2328-756X (Online)
Causes of Contractor Cost Overrun in Construction Projects: The Case of Ethiopian Construction Sector
Zinabu Tebeje Zewdu1, *
, Getachew Teka Aregaw2
1Faculty of Business and Economics, Unity University and OVID Construction plc, Addis Ababa, Ethiopia 2Faculty of Business and Economics, Unity University and Financial Training and Consultancy Plc, Addis Ababa, Ethiopia
Email address: [email protected] (Zinabu T. Z.)
To cite this article: Zinabu Tebeje Zewdu, Getachew Teka. Causes of Contractor Cost Overrun in Construction Projects: The Case of Ethiopian Construction
Sector. International Journal of Business and Economics Research. Vol. 4, No. 4, 2015, pp. 180-191. doi: 10.11648/j.ijber.20150404.11
Abstract: Completion of a construction project with budget is frequently seen as a major criterion of project success by clients,
contractors, consultants and related stakeholders. It is here that project management becomes essential tool for the delivery of
effective projects than the traditional functional management. However, the construction industry is faced with challenges to
meet budget. This study is conducted to identify the top five cost over-run factors and survey is conducted on 140 respondents.
The samples were drawn using convenient sampling approach. Primary data is collected using the self-administered
questionnaires. While secondary data is collected through reviewing of related materials and the analysis is conducted using
SPSS version 20. As per the contractor’ response, the top five factors that causes cost overrun of construction projects were from
medium to high. On the other hand, the top five factors as per the response of consultants and clients ranged between high to very
high. The contractors outlined the top five factors that causes cost overrun in construction projects are poor planning, fluctuation
of price of materials, poor productivity, inflationary pressure and project financing in descending order.
Keywords: Cost Overrun, Project Management, Project Control and Project Success
1. Introduction
Ethiopia is the fastest-growing, non-oil driven economy
among African countries. The country has showed a
remarkable growth over the past ten years. The average annual
growth GDP is 10.9% (UNDP, 2014). This figure is double of
the Sub Sahara Africa and triple of the world average growths
indicating that Ethiopia is one of the fastest economic growths
in the world (ibid). As a result the contribution of the industry
against the GDP is only 3% and this is lower than the
sub-Saharan African average which is 6%. The construction
industry trend in the past 10 years shows a yearly growth rate
of 12.43 and this shows a share of 5.3% of the country’s GDP
(ECIDP, 2014).
Though the construction sector is given high prominence,
several defects are being noted in the sectors that need
immediate action. One significant problem is the fact that
current infrastructure and construction projects show
significant cost variation (ECIDP, 2014). This is occurring in
spite of the fact that the Ethiopian Government played
significant role in assisting contractors by providing training,
supplying machinery, and by developing supportive guidance
(ECIDP, 2014).
The cost overrun on projects results in poor investment
returns from the use of the project, delay in the utilization of
the public facilities and extended inconvenience for the public.
All of these problems exert a huge financial pressure on
government, and they can hold back or impair planned
economic development (Li-Yin, 2006). Hence, identification
of the root causes of the challenges and pointing the possible
way out in consultation with stakeholders are critical factor. In
doing so, it intends to identify underlying causes for cost
variation of construction projects. Moreover, it would serve as
a basis for further research in the area. Such an understanding
would further address the most pressing problems of human
lives.
1.1. Ethiopian Construction Sector
The fast growth of the construction industry resulted in
increasing number of contractors joining the industry. During
the period 2000 up to 2008, the number of contractors
increased by 1.9121. Consequently, there are 7259 numbers of
1www.mwud.gov.et accessed on March 2, 2014.
181 Zinabu Tebeje Zewdu and Getachew Teka: Causes of Contractor Cost Overrun in Construction Projects:
The Case of Ethiopian Construction Sector
BC/RC/GC registered contractors for 2014/15 budget year,
according to the Ministry of Urban Development, Housing
and Construction of Industry Development and Regulatory
Bureau. Where the numbers of larger contractors up to level
three are: 263 BC1/RC1/GC1; 73 BC2/RC2/GC2; 163
BC3/RC3/GC3 (Table 1).
Table 1. Number of Contractors and Their Trend2.
Category
Year of Registration
1994 E. C.
(2001/02 G. C.)
2000 E. C.
(2008 G. C.)
2006 E. C.
(2014/15 G. C.)
(BC-1, GC-1,
RC-1) 35 56 263
(BC-2, GC-2,
RC-2) 3 3 73
(BC-3, GC-3,
RC-3) 30 62 163
Total from
Grade 1 to 3 68 121 499
Total from
Grade 1 to 10 941 1799 7259
Where: BC = Building Contractor; GC = General Contractor and RC = Road
Contractor
Considering the high role of the construction sector in the
industry and the demand to participate more contractors in the
sector, the former Ministry of Urban Development and
Construction revised its guideline and developed the
“Amended Directives for the registration of Construction
Professionals and Contractors No. 23/2013”. This directive is
applied starting from July 8th
, 2013. This directive allows the
contractors to register in the same grade but with revised
project cost up to 18 times of the old legislation (Table 1).
Where, the legislation specifies that contractors of category 4
to 2 are not permitted to build above twelve floors including
basement and similarly categories of 6 and 5 are not permitted
to build above eight floors (Table 2).
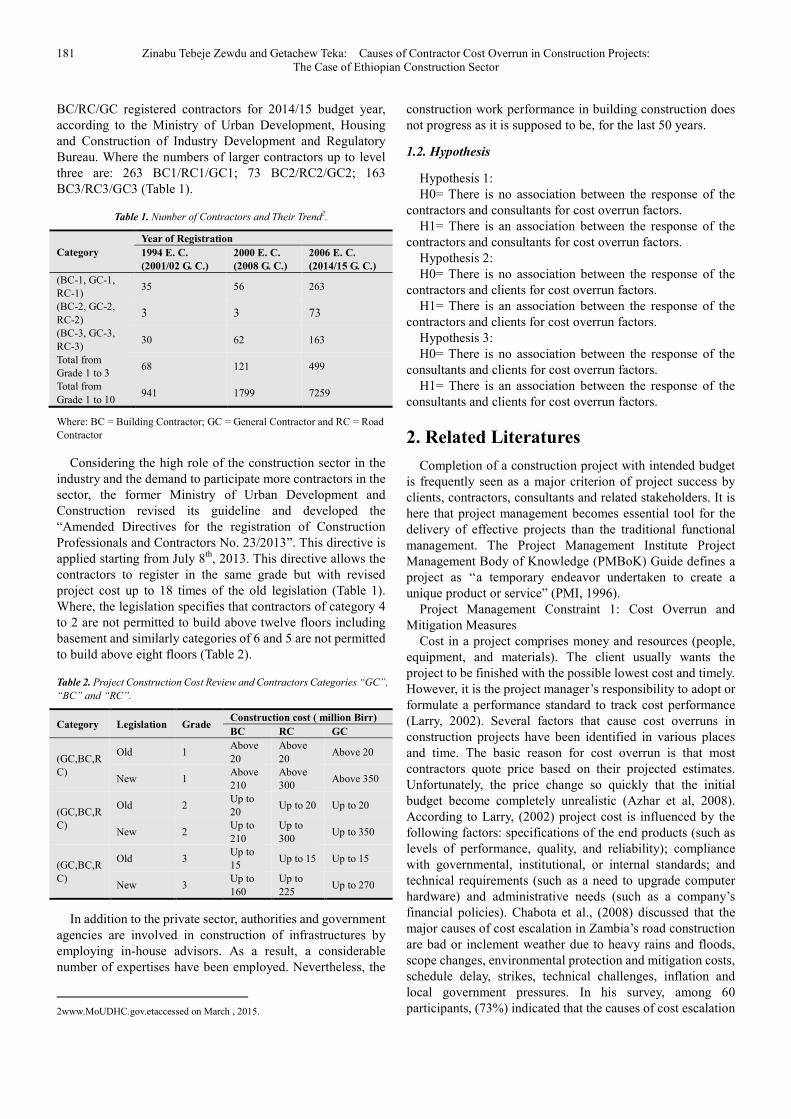
Table 2. Project Construction Cost Review and Contractors Categories “GC”,
“BC” and “RC”.
Category Legislation Grade Construction cost ( million Birr)
BC RC GC
(GC,BC,R
C)
Old 1 Above
20
Above
20 Above 20
New 1 Above
210
Above
300 Above 350
(GC,BC,R
C)
Old 2 Up to
20 Up to 20 Up to 20
New 2 Up to
210
Up to
300 Up to 350
(GC,BC,R
C)
Old 3 Up to
15 Up to 15 Up to 15
New 3 Up to
160
Up to
225 Up to 270
In addition to the private sector, authorities and government
agencies are involved in construction of infrastructures by
employing in-house advisors. As a result, a considerable
number of expertises have been employed. Nevertheless, the
2www.MoUDHC.gov.etaccessed on March , 2015.
construction work performance in building construction does
not progress as it is supposed to be, for the last 50 years.
1.2. Hypothesis
Hypothesis 1:
H0= There is no association between the response of the
contractors and consultants for cost overrun factors.
H1= There is an association between the response of the
contractors and consultants for cost overrun factors.
Hypothesis 2:
H0= There is no association between the response of the
contractors and clients for cost overrun factors.
H1= There is an association between the response of the
contractors and clients for cost overrun factors.
Hypothesis 3:
H0= There is no association between the response of the
consultants and clients for cost overrun factors.
H1= There is an association between the response of the
consultants and clients for cost overrun factors.
2. Related Literatures
Completion of a construction project with intended budget
is frequently seen as a major criterion of project success by
clients, contractors, consultants and related stakeholders. It is
here that project management becomes essential tool for the
delivery of effective projects than the traditional functional
management. The Project Management Institute Project
Management Body of Knowledge (PMBoK) Guide defines a
project as ‘‘a temporary endeavor undertaken to create a
unique product or service” (PMI, 1996).
Project Management Constraint 1: Cost Overrun and
Mitigation Measures
Cost in a project comprises money and resources (people,
equipment, and materials). The client usually wants the
project to be finished with the possible lowest cost and timely.
However, it is the project manager’s responsibility to adopt or
formulate a performance standard to track cost performance
(Larry, 2002). Several factors that cause cost overruns in
construction projects have been identified in various places
and time. The basic reason for cost overrun is that most
contractors quote price based on their projected estimates.
Unfortunately, the price change so quickly that the initial
budget become completely unrealistic (Azhar et al, 2008).
According to Larry, (2002) project cost is influenced by the
following factors: specifications of the end products (such as
levels of performance, quality, and reliability); compliance
with governmental, institutional, or internal standards; and
technical requirements (such as a need to upgrade computer
hardware) and administrative needs (such as a company’s
financial policies). Chabota et al., (2008) discussed that the
major causes of cost escalation in Zambia’s road construction
are bad or inclement weather due to heavy rains and floods,
scope changes, environmental protection and mitigation costs,
schedule delay, strikes, technical challenges, inflation and
local government pressures. In his survey, among 60
participants, (73%) indicated that the causes of cost escalation

International Journal of Business and Economics Research 2015; 4(4): 180-191 182
are bad weather, (63%) indicated the cause as scope changes,
(61%) indicated the cause as environmental protection and
mitigation cost, (54%) indicated the cause as schedule delay,
(52%) indicated the cause as strikes and the remaining 50%
indicated that the causes of cost escalation are local
government pressures, technical challenges and inflation.
Similar study by Luka, (2014) conducted in Nigeria with
fifty eight (58) respondents who are all construction
professionals, revealed that the average impact of cost related
risks with standard deviation are associated with the following
five factors: incomplete or inaccurate cost estimate
(0.5886±0.2948), inadequate program planning
(0.5257±0.1821), variation by client (0.4914±0.2077), design
variation (0.4743±0.2063), and price inflation
(0.4514±0.2241). The average impacts of these factors
represent the degree of potential loss on construction project
cost in the construction industry. Another study conducted in
Malaysia by Ali and Kamaruzzaman, (2010) on 30
respondents from construction firms, shows that cost overrun
becomes critical issue in Malaysia construction and ranked 13
factors contributed to cost overrun. These 13 factors in
descending order are the following: inaccurate/ poor
estimation of original cost, construction cost underestimation,
improper planning, poor project management, lack of
experience, poor contract management, inflation of project
costs, high cost of machineries, fluctuation in price of raw
materials, unforeseen site conditions, insufficient fund,
obsolete / unsuitable construction equipment and methods,
and mistake in design.
Based on their findings, Ali and Kamaruzzaman, (2010)
ranked the following 11 measures in descending order to
control construction cost: proper project costing and financing,
proper cost control competent personnel, efficient
management, risk management during project execution,
realistic cost estimation, appropriate scope definition,
appropriate contractual framework, establish training
programs, increase supply of materials, and establish a system
in design. A study made among 26 consultants using
questionnaire in Palestinian building construction projects by
Ibrahim and Nabil, (2013), revealed a 100% cost overrun. The
responses indicated average cost overrun between 10% and
30% of the project’s estimated cost. The study identified 41
cost overrun factors, of which 26 are critical ones. The top five
factors prioritized by the consultants affecting cost overrun in
building construction projects are: political situation,
fluctuation of materials price, level of competitors, currency
exchange, and economic instability. The researchers
suggested the following mitigation measures for the above
discussed cost overrun factors: Training courses and
workshops, provision of updated Material price and labor
rates, provision of sufficient time for tender submission, on
time payment, communication and coordination among
project staffs and top management reaction to political and
environmental issues. Similar study conducted in Palestine by
Mahamid and Amund, (2012) among a sample of 169 road
construction projects, 100% of the projects suffer from cost
deviation: 76% of the projects are under-estimated cost while
the rest 24% of the projects are over- estimated.
Olawale and Sun, (2010) performed a study on 150
construction companies, 100 consultants on construction
project organizations in the UK, which was also followed by
face-to-face interviews with 15 experienced practitioners. In
the study, a list of 20 factors were used for identifying project
cost and time control inhibiting factors: inflation of prices,
fluctuation of currency/exchange rate, unstable government
policies, weak regulation and control, unpredictable weather
conditions, dependency on imported materials, low skilled
manpower, risk and uncertainty associated with projects,
unstable interest rate, lack of proper training and experience of
pm, lack of appropriate software, inaccurate evaluation of
projects time/duration, non-performance of subcontractors
and nominated suppliers, project fraud and corruption, design
changes, financing and payment for completed works,
complexity of works, discrepancies in contract documentation,
contract and specification interpretation disagreement and
conflict between project parties. Accordingly, the top five
factors identified in inhibiting effective project cost control in
descending order are: Design changes, Risk and uncertainty
associated with projects, inaccurate evaluation of projects
time/duration, Nonperformance of subcontractors and
nominated suppliers and complexity of works. The first factor
of design change is very critical and needs carful management.
These top five factors were considered for suggesting
mitigating measure and accordingly 90 mitigating measures of
preventive, predictive, corrective and organizational natures
were derived by making intensive literature review and face to
face discussion with 15 participants (Olawale and Sun, 2010).
In Ethiopia, a study conducted by Nega, (2008) on
predominant factors for cost overrun in public building
construction projects in Ethiopia are identified the following
major cost overrun factors. These are inflation or increase in
the cost of construction materials, poor planning and
coordination, change orders due to enhancement required by
clients, and excess quantity during construction.
A study made on project management maturity in the
Ethiopian construction industry by Abadir, (2011) found out
that 22%, 22%, 22% and 28% of the contractors cost
management process maturity is incomplete, perform
informally, perform formally and managed well, respectively.
Whereas, the cost management practice maturity is 10%, 48%,
38% and 5% apply no practice, incomplete, basic and
intermediate, respectively. His study pointed out that 90% of
the contractors prepare detailed estimate of cost of labor,
material and machinery. However, only 75% prepare detailed
budget, about 70% track cost of labor, material and machinery
separately, and 67% collect and use company’s historical data
for preparation of cost estimate. His study further indicate that
only 1/3 of the contractors use computer tools for cost estimate
preparation and about 2/3 update their budget regularly at least
once in a month. The contractors perform formal financial
management process.
Harold, (2009) stated that in the 1980s the failure of a
project was largely a quantitative failure due to ineffective
planning, scheduling, estimating, and cost control. As a result
183 Zinabu Tebeje Zewdu and Getachew Teka: Causes of Contractor Cost Overrun in Construction Projects:
The Case of Ethiopian Construction Sector
project objectives had become a moving object. In effective
project management in small organizations (1 to 30 million
dollar projects), manual may be acceptable rather than
computerized cost control.
Cost management is among the very important dimension
of project management. The Earned Value Analysis (EVA) is a
cost management tool that is used to evaluate cost
performance of different types of projects.
3. Research Design and Methodology
3.1. Description of the Study Area
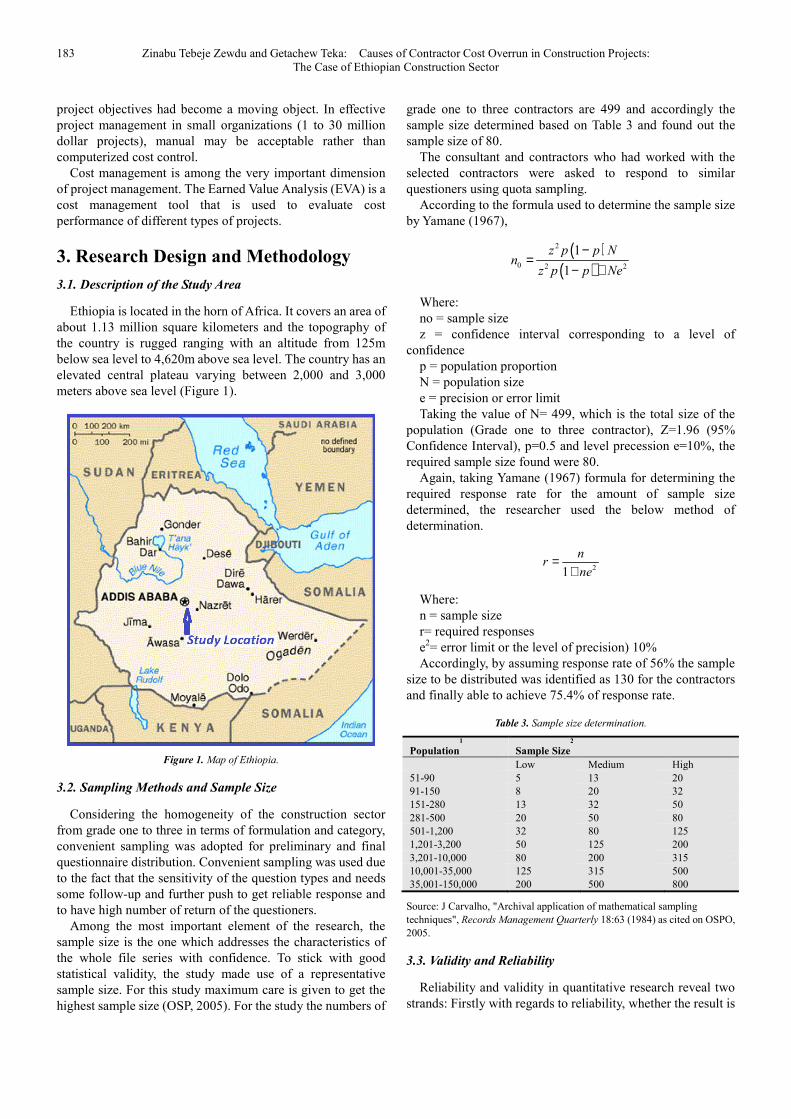
Ethiopia is located in the horn of Africa. It covers an area of
about 1.13 million square kilometers and the topography of
the country is rugged ranging with an altitude from 125m
below sea level to 4,620m above sea level. The country has an
elevated central plateau varying between 2,000 and 3,000
meters above sea level (Figure 1).
Figure 1. Map of Ethiopia.
3.2. Sampling Methods and Sample Size
Considering the homogeneity of the construction sector
from grade one to three in terms of formulation and category,
convenient sampling was adopted for preliminary and final
questionnaire distribution. Convenient sampling was used due
to the fact that the sensitivity of the question types and needs
some follow-up and further push to get reliable response and
to have high number of return of the questioners.
Among the most important element of the research, the
sample size is the one which addresses the characteristics of
the whole file series with confidence. To stick with good
statistical validity, the study made use of a representative
sample size. For this study maximum care is given to get the
highest sample size (OSP, 2005). For the study the numbers of
grade one to three contractors are 499 and accordingly the
sample size determined based on Table 3 and found out the
sample size of 80.
The consultant and contractors who had worked with the
selected contractors were asked to respond to similar
questioners using quota sampling.
According to the formula used to determine the sample size
by Yamane (1967),
( )( )
2
0 2 2
1
1
z p p Nn
z p p Ne
−=
− +
Where:
no = sample size
z = confidence interval corresponding to a level of
confidence
p = population proportion
N = population size
e = precision or error limit
Taking the value of N= 499, which is the total size of the
population (Grade one to three contractor), Z=1.96 (95%
Confidence Interval), p=0.5 and level precession e=10%, the
required sample size found were 80.
Again, taking Yamane (1967) formula for determining the
required response rate for the amount of sample size
determined, the researcher used the below method of
determination.
21
nr
ne=
+
Where:
n = sample size
r= required responses
e2= error limit or the level of precision) 10%
Accordingly, by assuming response rate of 56% the sample
size to be distributed was identified as 130 for the contractors
and finally able to achieve 75.4% of response rate.
Table 3. Sample size determination.
Population1
Sample Size2
Low Medium High
51-90 5 13 20
91-150 8 20 32
151-280 13 32 50
281-500 20 50 80
501-1,200 32 80 125
1,201-3,200 50 125 200
3,201-10,000 80 200 315
10,001-35,000 125 315 500
35,001-150,000 200 500 800
Source: J Carvalho, "Archival application of mathematical sampling
techniques", Records Management Quarterly 18:63 (1984) as cited on OSPO,
2005.
3.3. Validity and Reliability
Reliability and validity in quantitative research reveal two
strands: Firstly with regards to reliability, whether the result is
International Journal of Business and Economics Research 2015; 4(4): 180-191 184
replicable and with regards to validity, whether the means of
measurement are accurate and whether they are actually
measuring what they are intended to measure (Nahid, 2003).
Kirk and Miller (cited in Nahid, 2003) identify three types
of reliability referred to in quantitative research, which relate
to: 1) the degree to which a measurement, given repeatedly,
remains the same, 2) the stability of a measurement over time,
3) the similarity of measurements within a given time period.
The questionnaire was reliable in that it used the same
questions to all respondents and was answered in similar ways.
The questions were adopted from previously done studies
which were subject to critics and the content validity was
addressed in that all questions clearly represented all the
variables intended to measure for the desired objective of
showing the impacts of the independent variables on the
dependent variable.
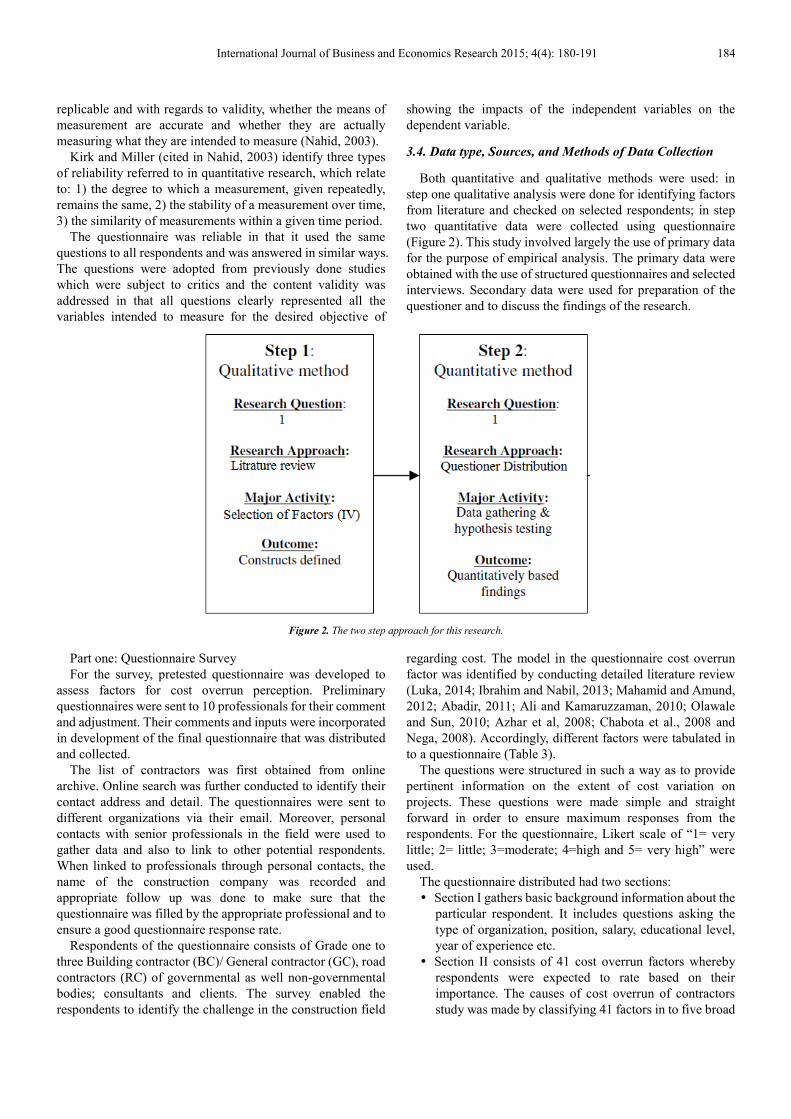
3.4. Data type, Sources, and Methods of Data Collection
Both quantitative and qualitative methods were used: in
step one qualitative analysis were done for identifying factors
from literature and checked on selected respondents; in step
two quantitative data were collected using questionnaire
(Figure 2). This study involved largely the use of primary data
for the purpose of empirical analysis. The primary data were
obtained with the use of structured questionnaires and selected
interviews. Secondary data were used for preparation of the
questioner and to discuss the findings of the research.
Figure 2. The two step approach for this research.
Part one: Questionnaire Survey
For the survey, pretested questionnaire was developed to
assess factors for cost overrun perception. Preliminary
questionnaires were sent to 10 professionals for their comment
and adjustment. Their comments and inputs were incorporated
in development of the final questionnaire that was distributed
and collected.
The list of contractors was first obtained from online
archive. Online search was further conducted to identify their
contact address and detail. The questionnaires were sent to
different organizations via their email. Moreover, personal
contacts with senior professionals in the field were used to
gather data and also to link to other potential respondents.
When linked to professionals through personal contacts, the
name of the construction company was recorded and
appropriate follow up was done to make sure that the
questionnaire was filled by the appropriate professional and to
ensure a good questionnaire response rate.
Respondents of the questionnaire consists of Grade one to
three Building contractor (BC)/ General contractor (GC), road
contractors (RC) of governmental as well non-governmental
bodies; consultants and clients. The survey enabled the
respondents to identify the challenge in the construction field
regarding cost. The model in the questionnaire cost overrun
factor was identified by conducting detailed literature review
(Luka, 2014; Ibrahim and Nabil, 2013; Mahamid and Amund,
2012; Abadir, 2011; Ali and Kamaruzzaman, 2010; Olawale
and Sun, 2010; Azhar et al, 2008; Chabota et al., 2008 and
Nega, 2008). Accordingly, different factors were tabulated in
to a questionnaire (Table 3).
The questions were structured in such a way as to provide
pertinent information on the extent of cost variation on
projects. These questions were made simple and straight
forward in order to ensure maximum responses from the
respondents. For the questionnaire, Likert scale of “1= very
little; 2= little; 3=moderate; 4=high and 5= very high” were
used.
The questionnaire distributed had two sections:
� Section I gathers basic background information about the
particular respondent. It includes questions asking the
type of organization, position, salary, educational level,
year of experience etc.
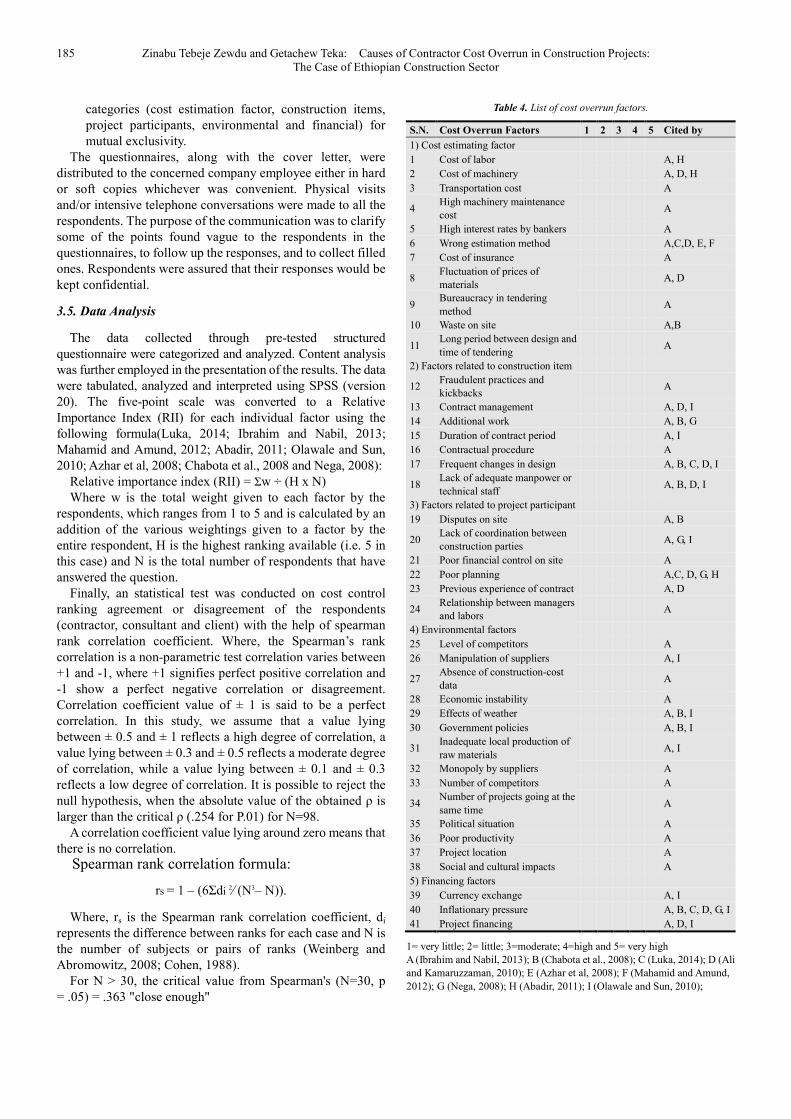
� Section II consists of 41 cost overrun factors whereby
respondents were expected to rate based on their
importance. The causes of cost overrun of contractors
study was made by classifying 41 factors in to five broad
185 Zinabu Tebeje Zewdu and Getachew Teka: Causes of Contractor Cost Overrun in Construction Projects:
The Case of Ethiopian Construction Sector
categories (cost estimation factor, construction items,
project participants, environmental and financial) for
mutual exclusivity.
The questionnaires, along with the cover letter, were
distributed to the concerned company employee either in hard
or soft copies whichever was convenient. Physical visits
and/or intensive telephone conversations were made to all the
respondents. The purpose of the communication was to clarify
some of the points found vague to the respondents in the
questionnaires, to follow up the responses, and to collect filled
ones. Respondents were assured that their responses would be
kept confidential.
3.5. Data Analysis
The data collected through pre-tested structured
questionnaire were categorized and analyzed. Content analysis
was further employed in the presentation of the results. The data
were tabulated, analyzed and interpreted using SPSS (version
20). The five-point scale was converted to a Relative
Importance Index (RII) for each individual factor using the
following formula(Luka, 2014; Ibrahim and Nabil, 2013;
Mahamid and Amund, 2012; Abadir, 2011; Olawale and Sun,
2010; Azhar et al, 2008; Chabota et al., 2008 and Nega, 2008):
Relative importance index (RII) = Σw ÷ (H x N)
Where w is the total weight given to each factor by the
respondents, which ranges from 1 to 5 and is calculated by an
addition of the various weightings given to a factor by the
entire respondent, H is the highest ranking available (i.e. 5 in
this case) and N is the total number of respondents that have
answered the question.
Finally, an statistical test was conducted on cost control
ranking agreement or disagreement of the respondents
(contractor, consultant and client) with the help of spearman
rank correlation coefficient. Where, the Spearman’s rank
correlation is a non-parametric test correlation varies between
+1 and -1, where +1 signifies perfect positive correlation and
-1 show a perfect negative correlation or disagreement.
Correlation coefficient value of ± 1 is said to be a perfect
correlation. In this study, we assume that a value lying
between ± 0.5 and ± 1 reflects a high degree of correlation, a
value lying between ± 0.3 and ± 0.5 reflects a moderate degree
of correlation, while a value lying between ± 0.1 and ± 0.3
reflects a low degree of correlation. It is possible to reject the
null hypothesis, when the absolute value of the obtained ρ is
larger than the critical ρ (.254 for P.01) for N=98.
A correlation coefficient value lying around zero means that
there is no correlation.
Spearman rank correlation formula:
rs = 1 – (6Σdi 2⁄ (N3– N)).
Where, rs is the Spearman rank correlation coefficient, di
represents the difference between ranks for each case and N is
the number of subjects or pairs of ranks (Weinberg and
Abromowitz, 2008; Cohen, 1988).
For N > 30, the critical value from Spearman's (N=30, p
= .05) = .363 "close enough"
Table 4. List of cost overrun factors.
S.N. Cost Overrun Factors 1 2 3 4 5 Cited by
1) Cost estimating factor
1 Cost of labor A, H
2 Cost of machinery A, D, H
3 Transportation cost A
4 High machinery maintenance
cost A
5 High interest rates by bankers A
6 Wrong estimation method A,C,D, E, F
7 Cost of insurance A
8 Fluctuation of prices of
materials A, D
9 Bureaucracy in tendering
method A
10 Waste on site A,B
11 Long period between design and
time of tendering A
2) Factors related to construction item
12 Fraudulent practices and
kickbacks A
13 Contract management A, D, I
14 Additional work A, B, G
15 Duration of contract period A, I
16 Contractual procedure A
17 Frequent changes in design A, B, C, D, I
18 Lack of adequate manpower or
technical staff A, B, D, I
3) Factors related to project participant
19 Disputes on site A, B
20 Lack of coordination between
construction parties A, G, I
21 Poor financial control on site A
22 Poor planning A,C, D, G, H
23 Previous experience of contract A, D
24 Relationship between managers
and labors A
4) Environmental factors
25 Level of competitors A
26 Manipulation of suppliers A, I
27 Absence of construction-cost
data A
28 Economic instability A
29 Effects of weather A, B, I
30 Government policies A, B, I
31 Inadequate local production of
raw materials A, I
32 Monopoly by suppliers A
33 Number of competitors A
34 Number of projects going at the
same time A
35 Political situation A
36 Poor productivity A
37 Project location A
38 Social and cultural impacts A
5) Financing factors
39 Currency exchange A, I
40 Inflationary pressure A, B, C, D, G, I
41 Project financing A, D, I
1= very little; 2= little; 3=moderate; 4=high and 5= very high A (Ibrahim and Nabil, 2013); B (Chabota et al., 2008); C (Luka, 2014); D (Ali
and Kamaruzzaman, 2010); E (Azhar et al, 2008); F (Mahamid and Amund,
2012); G (Nega, 2008); H (Abadir, 2011); I (Olawale and Sun, 2010);
International Journal of Business and Economics Research 2015; 4(4): 180-191 186
4. Result and Discussion
4.1. Demographic
The structured questionnaire survey is designed to
determine the major causes of cost variation in construction
projects in Ethiopia. 140 participants were questioned in the
survey. The respondents are categorized into three groups,
namely contractors, consultants and clients which, of course,
are implementing agencies and financiers. The response rate
for the questionnaire survey for the above mentioned
contractors, consultants and clients are 75.4%, 43.3% and
40.0%, respectively (Table 5). According to Sekaran (2001), a
response rate of 30% is acceptable for most studies; therefore,
as the response rate of this study is more than what is referred
as adequate by Sekaran (2001), the response rate is measured
as adequate for the study.
Table 5. Response Rate for the Structured Questioner.
Group Distributed Returned Valid
Valid among
distributed in
percentage
Contractors 130 104 98 75.4
Consultants 60 33 26 43.3
Clients 40 24 16 40.0
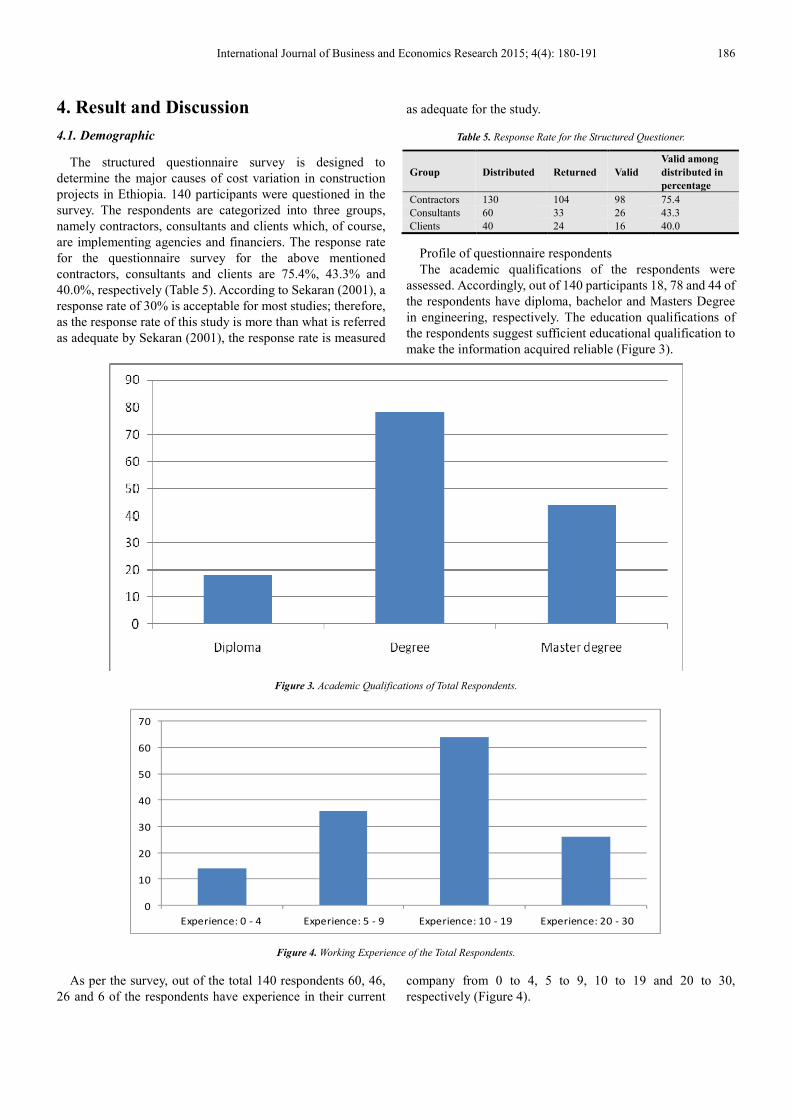
Profile of questionnaire respondents
The academic qualifications of the respondents were
assessed. Accordingly, out of 140 participants 18, 78 and 44 of
the respondents have diploma, bachelor and Masters Degree
in engineering, respectively. The education qualifications of
the respondents suggest sufficient educational qualification to
make the information acquired reliable (Figure 3).
Figure 3. Academic Qualifications of Total Respondents.
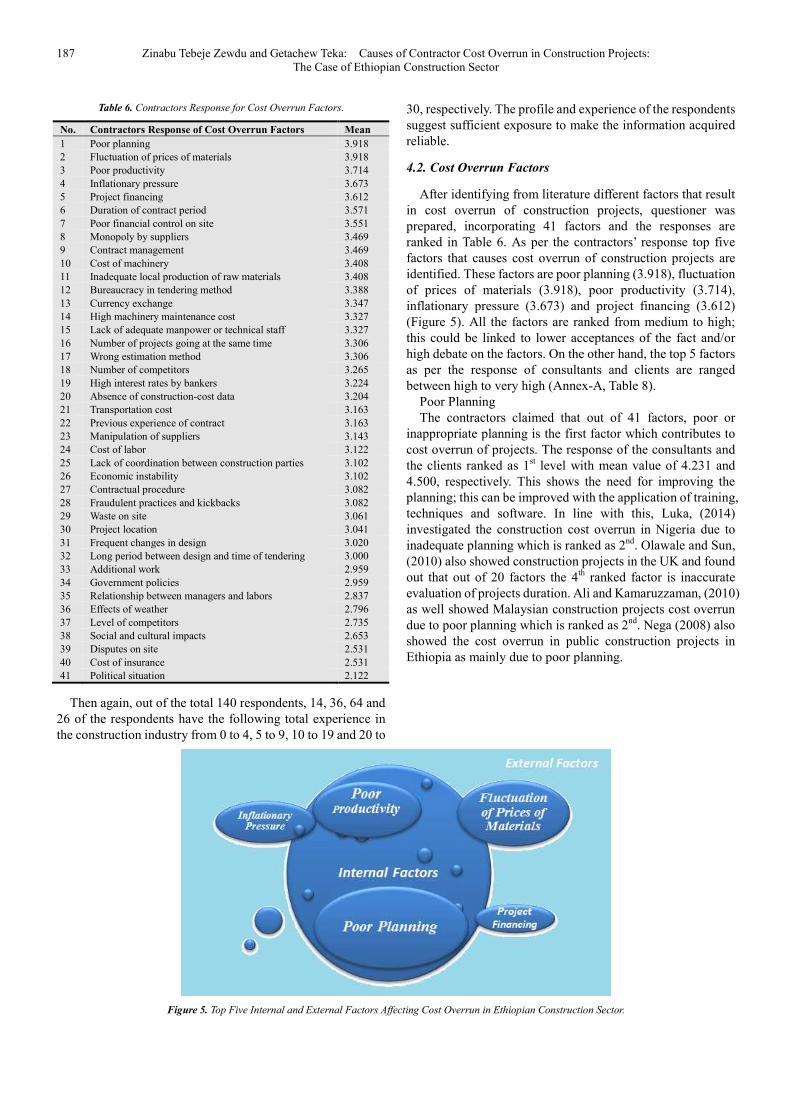
Figure 4. Working Experience of the Total Respondents.
As per the survey, out of the total 140 respondents 60, 46,
26 and 6 of the respondents have experience in their current
company from 0 to 4, 5 to 9, 10 to 19 and 20 to 30,
respectively (Figure 4).
0
10
20
30
40
50
60
70
Experience: 0 - 4 Experience: 5 - 9 Experience: 10 - 19 Experience: 20 - 30
187 Zinabu Tebeje Zewdu and Getachew Teka: Causes of Contractor Cost Overrun in Construction Projects:
The Case of Ethiopian Construction Sector
Table 6. Contractors Response for Cost Overrun Factors.
No. Contractors Response of Cost Overrun Factors Mean
1 Poor planning 3.918
2 Fluctuation of prices of materials 3.918
3 Poor productivity 3.714
4 Inflationary pressure 3.673
5 Project financing 3.612
6 Duration of contract period 3.571
7 Poor financial control on site 3.551
8 Monopoly by suppliers 3.469
9 Contract management 3.469
10 Cost of machinery 3.408
11 Inadequate local production of raw materials 3.408
12 Bureaucracy in tendering method 3.388
13 Currency exchange 3.347
14 High machinery maintenance cost 3.327
15 Lack of adequate manpower or technical staff 3.327
16 Number of projects going at the same time 3.306
17 Wrong estimation method 3.306
18 Number of competitors 3.265
19 High interest rates by bankers 3.224
20 Absence of construction-cost data 3.204
21 Transportation cost 3.163
22 Previous experience of contract 3.163
23 Manipulation of suppliers 3.143
24 Cost of labor 3.122
25 Lack of coordination between construction parties 3.102
26 Economic instability 3.102
27 Contractual procedure 3.082
28 Fraudulent practices and kickbacks 3.082
29 Waste on site 3.061
30 Project location 3.041
31 Frequent changes in design 3.020
32 Long period between design and time of tendering 3.000
33 Additional work 2.959
34 Government policies 2.959
35 Relationship between managers and labors 2.837
36 Effects of weather 2.796
37 Level of competitors 2.735
38 Social and cultural impacts 2.653
39 Disputes on site 2.531
40 Cost of insurance 2.531
41 Political situation 2.122
Then again, out of the total 140 respondents, 14, 36, 64 and
26 of the respondents have the following total experience in
the construction industry from 0 to 4, 5 to 9, 10 to 19 and 20 to
30, respectively. The profile and experience of the respondents
suggest sufficient exposure to make the information acquired
reliable.
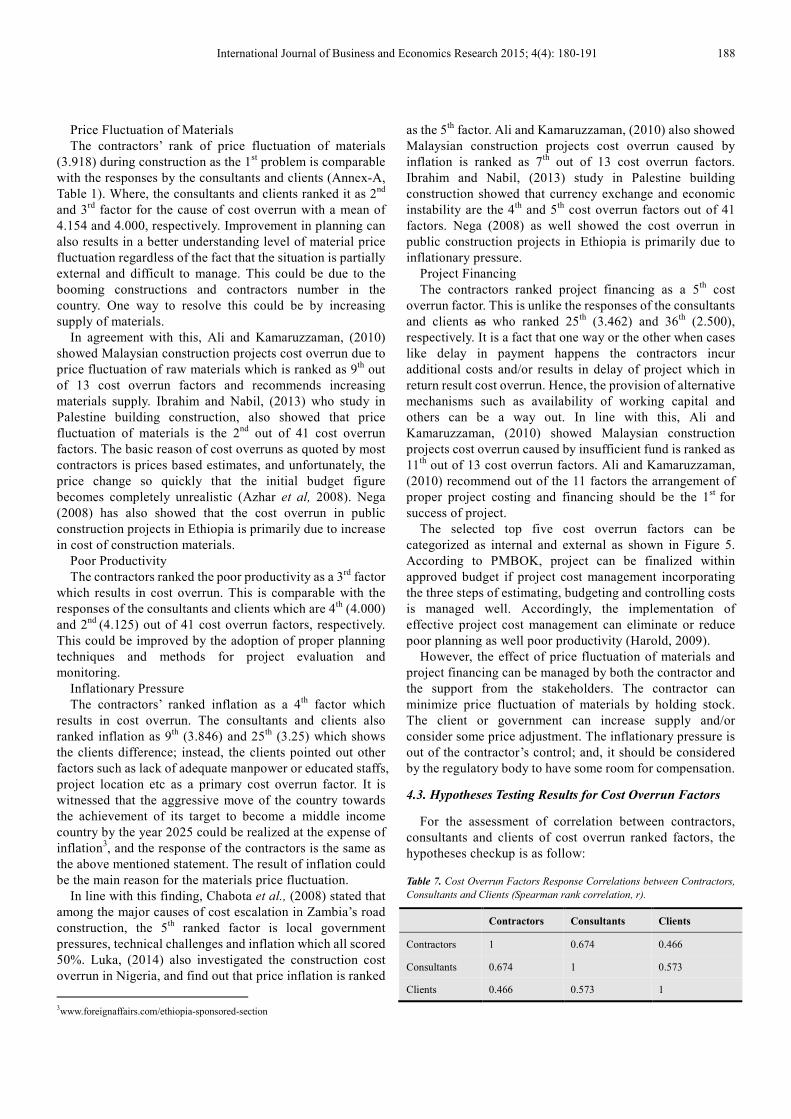
4.2. Cost Overrun Factors
After identifying from literature different factors that result
in cost overrun of construction projects, questioner was
prepared, incorporating 41 factors and the responses are
ranked in Table 6. As per the contractors’ response top five
factors that causes cost overrun of construction projects are
identified. These factors are poor planning (3.918), fluctuation
of prices of materials (3.918), poor productivity (3.714),
inflationary pressure (3.673) and project financing (3.612)
(Figure 5). All the factors are ranked from medium to high;
this could be linked to lower acceptances of the fact and/or
high debate on the factors. On the other hand, the top 5 factors
as per the response of consultants and clients are ranged
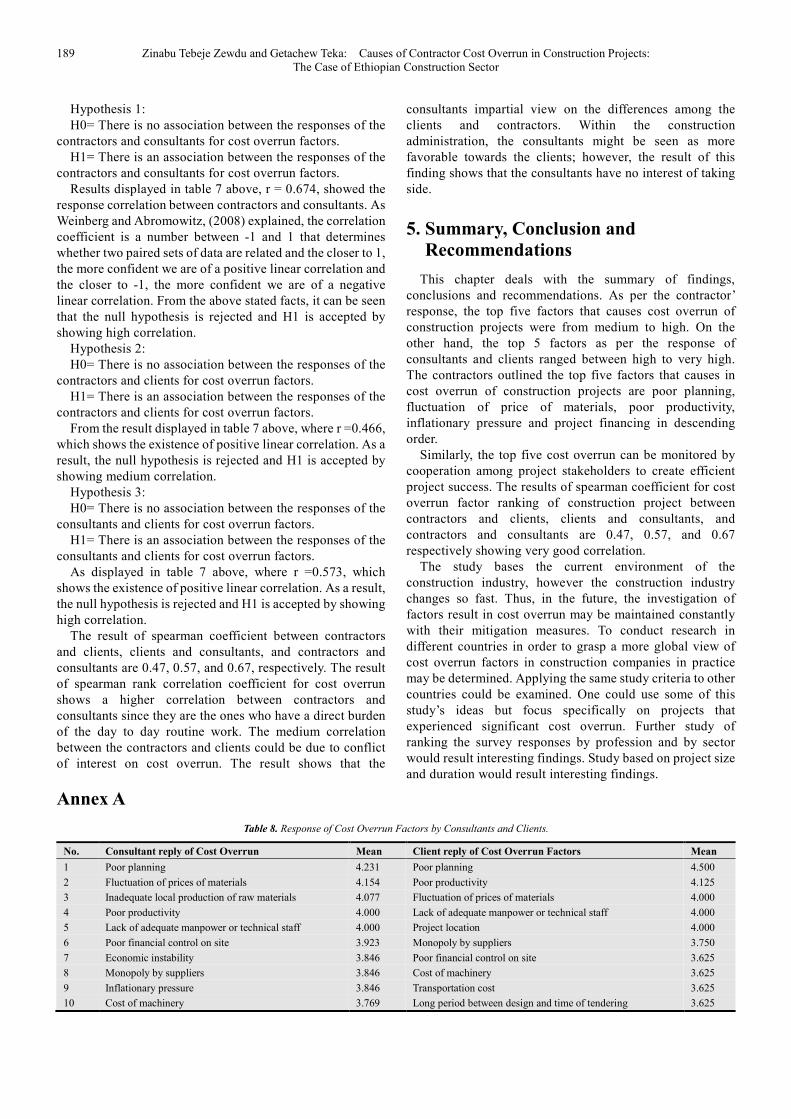
between high to very high (Annex-A, Table 8).
Poor Planning
The contractors claimed that out of 41 factors, poor or
inappropriate planning is the first factor which contributes to
cost overrun of projects. The response of the consultants and
the clients ranked as 1st level with mean value of 4.231 and
4.500, respectively. This shows the need for improving the
planning; this can be improved with the application of training,
techniques and software. In line with this, Luka, (2014)
investigated the construction cost overrun in Nigeria due to
inadequate planning which is ranked as 2nd
. Olawale and Sun,
(2010) also showed construction projects in the UK and found
out that out of 20 factors the 4th
ranked factor is inaccurate
evaluation of projects duration. Ali and Kamaruzzaman, (2010)
as well showed Malaysian construction projects cost overrun
due to poor planning which is ranked as 2nd
. Nega (2008) also
showed the cost overrun in public construction projects in
Ethiopia as mainly due to poor planning.
Figure 5. Top Five Internal and External Factors Affecting Cost Overrun in Ethiopian Construction Sector.
International Journal of Business and Economics Research 2015; 4(4): 180-191 188
Price Fluctuation of Materials
The contractors’ rank of price fluctuation of materials
(3.918) during construction as the 1st problem is comparable
with the responses by the consultants and clients (Annex-A,
Table 1). Where, the consultants and clients ranked it as 2nd
and 3rd
factor for the cause of cost overrun with a mean of
4.154 and 4.000, respectively. Improvement in planning can
also results in a better understanding level of material price
fluctuation regardless of the fact that the situation is partially
external and difficult to manage. This could be due to the
booming constructions and contractors number in the
country. One way to resolve this could be by increasing
supply of materials.
In agreement with this, Ali and Kamaruzzaman, (2010)
showed Malaysian construction projects cost overrun due to
price fluctuation of raw materials which is ranked as 9th
out
of 13 cost overrun factors and recommends increasing
materials supply. Ibrahim and Nabil, (2013) who study in
Palestine building construction, also showed that price
fluctuation of materials is the 2nd
out of 41 cost overrun
factors. The basic reason of cost overruns as quoted by most
contractors is prices based estimates, and unfortunately, the
price change so quickly that the initial budget figure
becomes completely unrealistic (Azhar et al, 2008). Nega
(2008) has also showed that the cost overrun in public
construction projects in Ethiopia is primarily due to increase
in cost of construction materials.
Poor Productivity
The contractors ranked the poor productivity as a 3rd
factor
which results in cost overrun. This is comparable with the
responses of the consultants and clients which are 4th
(4.000)
and 2nd
(4.125) out of 41 cost overrun factors, respectively.
This could be improved by the adoption of proper planning
techniques and methods for project evaluation and
monitoring.
Inflationary Pressure
The contractors’ ranked inflation as a 4th
factor which
results in cost overrun. The consultants and clients also
ranked inflation as 9th
(3.846) and 25th
(3.25) which shows
the clients difference; instead, the clients pointed out other
factors such as lack of adequate manpower or educated staffs,
project location etc as a primary cost overrun factor. It is
witnessed that the aggressive move of the country towards
the achievement of its target to become a middle income
country by the year 2025 could be realized at the expense of
inflation3, and the response of the contractors is the same as
the above mentioned statement. The result of inflation could
be the main reason for the materials price fluctuation.
In line with this finding, Chabota et al., (2008) stated that
among the major causes of cost escalation in Zambia’s road
construction, the 5th
ranked factor is local government
pressures, technical challenges and inflation which all scored
50%. Luka, (2014) also investigated the construction cost
overrun in Nigeria, and find out that price inflation is ranked
3www.foreignaffairs.com/ethiopia-sponsored-section
as the 5th
factor. Ali and Kamaruzzaman, (2010) also showed
Malaysian construction projects cost overrun caused by
inflation is ranked as 7th
out of 13 cost overrun factors.
Ibrahim and Nabil, (2013) study in Palestine building
construction showed that currency exchange and economic
instability are the 4th
and 5th
cost overrun factors out of 41
factors. Nega (2008) as well showed the cost overrun in
public construction projects in Ethiopia is primarily due to
inflationary pressure.
Project Financing
The contractors ranked project financing as a 5th
cost
overrun factor. This is unlike the responses of the consultants
and clients as who ranked 25th
(3.462) and 36th
(2.500),
respectively. It is a fact that one way or the other when cases
like delay in payment happens the contractors incur
additional costs and/or results in delay of project which in
return result cost overrun. Hence, the provision of alternative
mechanisms such as availability of working capital and
others can be a way out. In line with this, Ali and
Kamaruzzaman, (2010) showed Malaysian construction
projects cost overrun caused by insufficient fund is ranked as
11th
out of 13 cost overrun factors. Ali and Kamaruzzaman,
(2010) recommend out of the 11 factors the arrangement of
proper project costing and financing should be the 1st
for
success of project.
The selected top five cost overrun factors can be
categorized as internal and external as shown in Figure 5.
According to PMBOK, project can be finalized within
approved budget if project cost management incorporating
the three steps of estimating, budgeting and controlling costs
is managed well. Accordingly, the implementation of
effective project cost management can eliminate or reduce
poor planning as well poor productivity (Harold, 2009).
However, the effect of price fluctuation of materials and
project financing can be managed by both the contractor and
the support from the stakeholders. The contractor can
minimize price fluctuation of materials by holding stock.
The client or government can increase supply and/or
consider some price adjustment. The inflationary pressure is
out of the contractor’s control; and, it should be considered
by the regulatory body to have some room for compensation.
4.3. Hypotheses Testing Results for Cost Overrun Factors
For the assessment of correlation between contractors,
consultants and clients of cost overrun ranked factors, the
hypotheses checkup is as follow:
Table 7. Cost Overrun Factors Response Correlations between Contractors,
Consultants and Clients (Spearman rank correlation, r).
Contractors Consultants Clients
Contractors 1 0.674 0.466
Consultants 0.674 1 0.573
Clients 0.466 0.573 1
189 Zinabu Tebeje Zewdu and Getachew Teka: Causes of Contractor Cost Overrun in Construction Projects:
The Case of Ethiopian Construction Sector
Hypothesis 1:
H0= There is no association between the responses of the
contractors and consultants for cost overrun factors.
H1= There is an association between the responses of the
contractors and consultants for cost overrun factors.
Results displayed in table 7 above, r = 0.674, showed the
response correlation between contractors and consultants. As
Weinberg and Abromowitz, (2008) explained, the correlation
coefficient is a number between -1 and 1 that determines
whether two paired sets of data are related and the closer to 1,
the more confident we are of a positive linear correlation and
the closer to -1, the more confident we are of a negative
linear correlation. From the above stated facts, it can be seen
that the null hypothesis is rejected and H1 is accepted by
showing high correlation.
Hypothesis 2:
H0= There is no association between the responses of the
contractors and clients for cost overrun factors.
H1= There is an association between the responses of the
contractors and clients for cost overrun factors.
From the result displayed in table 7 above, where r =0.466,
which shows the existence of positive linear correlation. As a
result, the null hypothesis is rejected and H1 is accepted by
showing medium correlation.
Hypothesis 3:
H0= There is no association between the responses of the
consultants and clients for cost overrun factors.
H1= There is an association between the responses of the
consultants and clients for cost overrun factors.
As displayed in table 7 above, where r =0.573, which
shows the existence of positive linear correlation. As a result,
the null hypothesis is rejected and H1 is accepted by showing
high correlation.
The result of spearman coefficient between contractors
and clients, clients and consultants, and contractors and
consultants are 0.47, 0.57, and 0.67, respectively. The result
of spearman rank correlation coefficient for cost overrun
shows a higher correlation between contractors and
consultants since they are the ones who have a direct burden
of the day to day routine work. The medium correlation
between the contractors and clients could be due to conflict
of interest on cost overrun. The result shows that the
consultants impartial view on the differences among the
clients and contractors. Within the construction
administration, the consultants might be seen as more
favorable towards the clients; however, the result of this
finding shows that the consultants have no interest of taking
side.
5. Summary, Conclusion and
Recommendations
This chapter deals with the summary of findings,
conclusions and recommendations. As per the contractor’
response, the top five factors that causes cost overrun of
construction projects were from medium to high. On the
other hand, the top 5 factors as per the response of
consultants and clients ranged between high to very high.
The contractors outlined the top five factors that causes in
cost overrun of construction projects are poor planning,
fluctuation of price of materials, poor productivity,
inflationary pressure and project financing in descending
order.
Similarly, the top five cost overrun can be monitored by
cooperation among project stakeholders to create efficient
project success. The results of spearman coefficient for cost
overrun factor ranking of construction project between
contractors and clients, clients and consultants, and
contractors and consultants are 0.47, 0.57, and 0.67
respectively showing very good correlation.
The study bases the current environment of the
construction industry, however the construction industry
changes so fast. Thus, in the future, the investigation of
factors result in cost overrun may be maintained constantly
with their mitigation measures. To conduct research in
different countries in order to grasp a more global view of
cost overrun factors in construction companies in practice
may be determined. Applying the same study criteria to other
countries could be examined. One could use some of this
study’s ideas but focus specifically on projects that
experienced significant cost overrun. Further study of
ranking the survey responses by profession and by sector
would result interesting findings. Study based on project size
and duration would result interesting findings.
Annex A
Table 8. Response of Cost Overrun Factors by Consultants and Clients.
No. Consultant reply of Cost Overrun Mean Client reply of Cost Overrun Factors Mean
1 Poor planning 4.231 Poor planning 4.500
2 Fluctuation of prices of materials 4.154 Poor productivity 4.125
3 Inadequate local production of raw materials 4.077 Fluctuation of prices of materials 4.000
4 Poor productivity 4.000 Lack of adequate manpower or technical staff 4.000
5 Lack of adequate manpower or technical staff 4.000 Project location 4.000
6 Poor financial control on site 3.923 Monopoly by suppliers 3.750
7 Economic instability 3.846 Poor financial control on site 3.625
8 Monopoly by suppliers 3.846 Cost of machinery 3.625
9 Inflationary pressure 3.846 Transportation cost 3.625
10 Cost of machinery 3.769 Long period between design and time of tendering 3.625
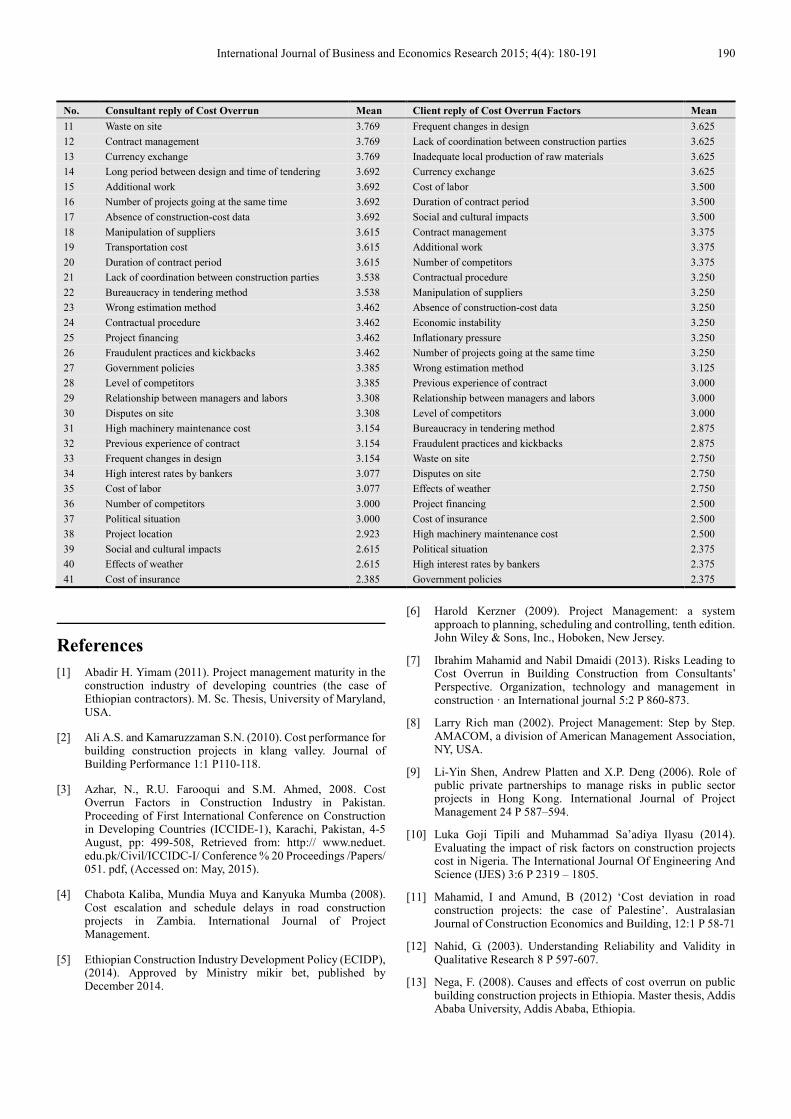
International Journal of Business and Economics Research 2015; 4(4): 180-191 190
No. Consultant reply of Cost Overrun Mean Client reply of Cost Overrun Factors Mean
11 Waste on site 3.769 Frequent changes in design 3.625
12 Contract management 3.769 Lack of coordination between construction parties 3.625
13 Currency exchange 3.769 Inadequate local production of raw materials 3.625
14 Long period between design and time of tendering 3.692 Currency exchange 3.625
15 Additional work 3.692 Cost of labor 3.500
16 Number of projects going at the same time 3.692 Duration of contract period 3.500
17 Absence of construction-cost data 3.692 Social and cultural impacts 3.500
18 Manipulation of suppliers 3.615 Contract management 3.375
19 Transportation cost 3.615 Additional work 3.375
20 Duration of contract period 3.615 Number of competitors 3.375
21 Lack of coordination between construction parties 3.538 Contractual procedure 3.250
22 Bureaucracy in tendering method 3.538 Manipulation of suppliers 3.250
23 Wrong estimation method 3.462 Absence of construction-cost data 3.250
24 Contractual procedure 3.462 Economic instability 3.250
25 Project financing 3.462 Inflationary pressure 3.250
26 Fraudulent practices and kickbacks 3.462 Number of projects going at the same time 3.250
27 Government policies 3.385 Wrong estimation method 3.125
28 Level of competitors 3.385 Previous experience of contract 3.000
29 Relationship between managers and labors 3.308 Relationship between managers and labors 3.000
30 Disputes on site 3.308 Level of competitors 3.000
31 High machinery maintenance cost 3.154 Bureaucracy in tendering method 2.875
32 Previous experience of contract 3.154 Fraudulent practices and kickbacks 2.875
33 Frequent changes in design 3.154 Waste on site 2.750
34 High interest rates by bankers 3.077 Disputes on site 2.750
35 Cost of labor 3.077 Effects of weather 2.750
36 Number of competitors 3.000 Project financing 2.500
37 Political situation 3.000 Cost of insurance 2.500
38 Project location 2.923 High machinery maintenance cost 2.500
39 Social and cultural impacts 2.615 Political situation 2.375
40 Effects of weather 2.615 High interest rates by bankers 2.375
41 Cost of insurance 2.385 Government policies 2.375
References
[1] Abadir H. Yimam (2011). Project management maturity in the construction industry of developing countries (the case of Ethiopian contractors). M. Sc. Thesis, University of Maryland, USA.
[2] Ali A.S. and Kamaruzzaman S.N. (2010). Cost performance for building construction projects in klang valley. Journal of Building Performance 1:1 P110-118.
[3] Azhar, N., R.U. Farooqui and S.M. Ahmed, 2008. Cost Overrun Factors in Construction Industry in Pakistan. Proceeding of First International Conference on Construction in Developing Countries (ICCIDE-1), Karachi, Pakistan, 4-5 August, pp: 499-508, Retrieved from: http:// www.neduet. edu.pk/Civil/ICCIDC-I/ Conference % 20 Proceedings /Papers/ 051. pdf, (Accessed on: May, 2015).
[4] Chabota Kaliba, Mundia Muya and Kanyuka Mumba (2008). Cost escalation and schedule delays in road construction projects in Zambia. International Journal of Project Management.
[5] Ethiopian Construction Industry Development Policy (ECIDP), (2014). Approved by Ministry mikir bet, published by December 2014.
[6] Harold Kerzner (2009). Project Management: a system approach to planning, scheduling and controlling, tenth edition. John Wiley & Sons, Inc., Hoboken, New Jersey.
[7] Ibrahim Mahamid and Nabil Dmaidi (2013). Risks Leading to Cost Overrun in Building Construction from Consultants’ Perspective. Organization, technology and management in construction · an International journal 5:2 P 860-873.
[8] Larry Rich man (2002). Project Management: Step by Step. AMACOM, a division of American Management Association, NY, USA.
[9] Li-Yin Shen, Andrew Platten and X.P. Deng (2006). Role of public private partnerships to manage risks in public sector projects in Hong Kong. International Journal of Project Management 24 P 587–594.
[10] Luka Goji Tipili and Muhammad Sa’adiya Ilyasu (2014). Evaluating the impact of risk factors on construction projects cost in Nigeria. The International Journal Of Engineering And Science (IJES) 3:6 P 2319 – 1805.
[11] Mahamid, I and Amund, B (2012) ‘Cost deviation in road construction projects: the case of Palestine’. Australasian Journal of Construction Economics and Building, 12:1 P 58-71
[12] Nahid, G. (2003). Understanding Reliability and Validity in Qualitative Research 8 P 597-607.
[13] Nega, F. (2008). Causes and effects of cost overrun on public building construction projects in Ethiopia. Master thesis, Addis Ababa University, Addis Ababa, Ethiopia.

191 Zinabu Tebeje Zewdu and Getachew Teka: Causes of Contractor Cost Overrun in Construction Projects:
The Case of Ethiopian Construction Sector
[14] Olawale, Y., and Sun M. (2010). “Cost and time control of construction projects: Inhibiting factors and mitigating measures in practice.” Construction Management and Economics, 28:5 P 509 – 526.
[15] Operational Selection Policy (OSP), (2005). The selection of case files: sampling technique. The National Archives, UK. Accessed on January, 2015 http://webarchive.nationalarchives.gov.uk/20080107210935/http:/www.nationalarchives.gov.uk/documents/osp0.pdf
[16] PMI (1996). Project Management Institute. A Guide to the Project Management Body of Knowledge.
[17] Sekaran, U. (2001). Research methods for business: A skills building approach (2nd Ed.). New York: John Wiley & Sons,
Inc.
[18] UNDP (2014). Ethiopia: quarterly economic brief. Accessed on http://www.et.undp.org/content/dam/ethiopia/docs/Economic%20Brief-%20Third%20Quarter-2014.pdf
[19] UNDP, (2014). Country Economic Brief: Ethiopia. Accessed on http://www.et.undp.org/content/dam/ethiopia/docs/Country%20Economic%20Brief%201%20final%20for%20web.pdf
[20] Weinberg, S. and Abromowitz, S. (2008) Statistics Using SPSS: An Integrative Approach. Cambridge University Press, Cambridge.
[21] Yamane, T. (1967) Statistics: An Introductory Analysis, Harper and Row.