Embed Size (px)
Citation preview

FHWA-NJ-2002-19
Cause and Control of Transverse Cracking in Concrete Bridge Decks
Final Report December 2002
Submitted by
Dr. M Ala Saadeghvaziri Professor
Rambod Hadidi Research Assistant
Department of Civil and Environmental Engineering
New Jersey Institute of Technology Newark, NJ 07102
NJDOT Research Project Manager Mr. Raj Chawla
In cooperation with
New Jersey Department of Transportation
Division of Research and Technology and
U.S. Department of Transportation Federal Highway Administration

DISCLAIMER STATEMENT
“The content of this report reflects the views of the author(s) who is(are) responsible for the facts and accuracy of data
presented herein. The contents do not necessarily reflect the official views or policies of the New Jersey Department of
Transportation of the Federal Highway Administration. This report does not constitute a standard, specification, or
regulation.”

1 . R ep o r t N o . 2. Government Accession No.
TECHNICAL REPORT STANDARD T ITLE PAGE
3. Rec ip ien t ’s Cata log No.
5 . Repor t Date
8. Performing Organization Report No.
6 . Performing Organizat ion Code
4. T i t le and Subt i t le
7. Author (s)
9. Performing Organization Name and Address 10. W ork Unit No.
11. Contract or Grant No.
13. Type of Report and Period Covered
14. Sponsoring Agency Code
12. Sponsoring Agency Name and Address
15. Supplementary Notes
1 6 . Abstract
1 7 . Key W ords
1 9 . Security Class (of this report)
F or m D O T F 17 0 0 .7 ( 8 - 6 9 )
2 0 . Security Classi f. (of this page)
1 8 . Distribution Statement
s 2 2 . Price
December 2002
March 2000 to December 2002
Ne w J e rs e y D ep a r t m en t o f Tr a n sp or t a t i on PO 6 0 0 Tr en t on , NJ 0 8 6 2 5
Fed era l Hi gh wa y Ad mi n i s t ra t i on U.S . D ep a r t m en t o f T ra n sp o r t a t i on Wash i n g t on , D.C .
Ma n y c o nc r e t e b r i d g e d eck s d ev e l o p t r an sv e rs e c r ack i n g a n d m o s t o f t h es e c ra ck s d e ve l o p a t e a r l y a g e s , s om e r i g h t a f t e r co n s t r uc t i o n , a n d s om e a f t e r t h e b r i dg e ha s b e e n o pe n e d t o t r a f f i c f o r a p e r i o d o f t i m e . T r an sv e rs e c r ack s us u a l l y o cc u r w h e n c on c re t e i s s e t a nd w i d e n w i t h t i m e . T h e se c r ack s h av e b e en o bs e rv e d i n m os t g eo g r ap h i c a l l oc a t i o n s , an d on m a n y su p e rs t r u c t u r e t yp e s . I t i s e s t i m a te d t h a t m or e t h an 1 00 , 00 0 b r i d ge s i n t h e U n i t ed S t a t es d e ve l o p ea r l y t r an sv e rs e c r a ck s . T h es e c ra ck s a r e t yp i c a l l y f u l l d e p t h l oc a te d 1 - 3 m ( 4 - 1 2 f t ) a p a r t a l on g t h e l e n g t h o f t h e sp a n a n d a r e us u a l l y o b se r ve d ov e r t r a n sv e rs e r e i n f o r c em e n t . I t h a s b e en r ep o r t e d t h a t p r e dom i n a n t f o rm o f d eck c r ack i n g i s t r an sv e rs e c r ack i n g . T h es e c r a ck s r ed u ce t h e s e rv i c e l i f e o f t h e s t r uc tu r e a n d i n c r ea s e m a i n t en a nc e c o s t s , w h i c h i s o f pa r am ou n t i m p o r t a nc e i n h i g h w a y m a i n t e n an c e ac t i v i t i e s . T r a ns v e r s e c ra ck s a cc e l e r a te re i n f o rc em en t c o r r os i on , e s p ec i a l l y i n r e g i o ns w h e r e d e i c i n g ch em i c a l a r e a p p l i e d . C o r ro s i o n d am a g e h a s b ee n ob s e r v e d e ve n o n ep o x y c o a t e d r e i n fo rc i n g b a rs . F r e e ze - t h a w c yc l e s o f w a t e r i n c r ack s a n d l eak ag e o f w a t e r t o s u p po r t i n g s t r uc t u r es m a y a l s o r e d uc e s e r v i c e l i f e o f s t r uc t u r e . C r a ck s i n c o nc r e t e o cc u r w h e n a r e s t r a i n t m as s o f co n c r e te t e nd s t o c ha n g e v o l u me . V o l um e ch a n ge i n c o nc r e t e d e p e n ds o n t h e p r o p e r t i es o f i t s c o ns t i t u e n t s a n d t he i r p ro p o r t i o n s a s w e l l a s e nv i r o nm en t a l c o nd i t i on s s uc h a s am b i e n t t em p er a t u r e ch a n ge s a n d h um i d i t y . R es t r a i n t , w h i c h i s b as i c a l l y d u e t o com p os i t e a c t i o n o f d e ck a n d g i r de r , d e pe n ds o n d es i g n ch a r ac te r i s t i c s o f t he b r i d g e ( i . e . , s t r uc t u r a l d es i g n f ac t o r s ) . C o n s t r uc t i o n t e c h n i qu e s a l s o c on t r i b u t e t o v o l um e c h a ng e a nd / o r t o de g r ee o f r e s t r a i n t o f c o nc r e te m as s . F ac t o r s a ss oc i a t e d w i t h m i x d es i g n /m a t e r i a l a n d c on s t r uc t i o n p ro c ed u r es ha v e b e en t h e su b j e c t o f a s i g n i f i c an t n um b e r o f r es e a r c h s t u d i es ov e r t he pa s t se v e r a l d ec a de s . S t ru c t u r a l d es i g n f ac t o r s , h o w ev e r , ha v e n o t b e en t h e s u b j ec t o f m uc h r es e a r c h i n t h e p a s t a n d t h e y w e r e t he m a i n t h r u s t o f t h i s r es e a rc h s t u d y . U s i ng 2 -D a n d 3 - D l i n e a r a n d n o n l i n ea r f i n i t e e l em en t m o d e l s m a n y d e s i gn f a c t o rs s u c h as g i rd e r s t i f f n es s , d e ck t h i c k n es s , g i r de r s p ac i n g , re l a t i v e s t i f f n e ss o f d e ck t o g i r de r , am o un t o f r e i n f o rc em e n t s , e t c . w e r e s t u d i e d . T h e re se a rc h s tu d y a l s o i n c l u de d a com p r eh e ns i v e r e v i e w o f t h e e x i s t i ng l i t e ra t u re as w e l l as su r ve y o f 2 4 b r i d g es i n t h e s t a t e o f N e w J e rs e y . R es u l t s o f e a ch re s e a r c h t a sk a re p r e se n t e d a nd d i s c us s ed i n d e ta i l s . F u r t h e rm o r e , b a se d on an a l y t i c a l r es u l t s a n d l i t e r a tu r e r ev i e w e f f ec t o f v a r i o u s f ac to r s a r e q ua n t i f i ed an d s p ec i f i c r e com m en d a t i on s f o r p os s i b l e c on s i d e r a t i on i n d e s i g n a re m ad e . T h es e a r e c l as s i f i ed u nd e r t h e t h r e e m a j o r c a t e go r i e s , nam e l y : 1 ) m a t e r i a l a n d m i x d e s i gn , 2 ) c o ns t r u c t i o n p r a c t i c e a n d am b i en t c on d i t i o n f ac t o r s , a n d 3 ) s t r uc tu r a l de s i g n . A s i m p l e w i n do w a p p l i c a t i o n p r o g r am t o m or e ac cu r a t e l y e s t i m a t e d ec k s t r es se s d u r i n g d es i g n i s a l so d ev e l o pe d un d e r t h i s s t ud y . F u t u r e r es e a rc h n e ed s a r e a l s o i de n t i f i ed .
Concrete , Deck, Cracking, Cracks, Transverse, Bridges, Causes o f Cracking, Contro l o f Cracking
Unclass i fied Unclass i fied
FHWA-NJ-2002-019
M. Ala Saadeghvazir i and Rambod Hadid i
Cause and Control o f Transverse Cracking in Concrete Bridge Decks
Depar tment o f Civi l and Environmenta l Engineer ing New Jersey Inst i tute o f Technology Newark, NJ 07102-1982
21. No of Page
204 21. No. of Pages
203

ACKNOWLEDGEMENT This research study was supported by the New Jersey Department of Transportation/FHWA and the National Center for Transportation and Industrial Productivity (NCTIP) at NJIT. The assistance of NJDOT staff, especially Fred Lovett from the Bureau of Materials, Jose Lopez and Gerry Sellner from the Bureau of Structures & Design, and Raj Chawla the project monitor in conducting the field surveys and/or providing material and design data on bridges is greatly appreciated. The results and conclusions are those of the authors and do not necessarily reflect the views of the sponsors.
iv

TABLE OF CONTENTS
SUMMARY...................................................................................................................... 1
Structural Design Factors ............................................................................................ 1 Mix Design (Material)................................................................................................... 1 Construction Practices................................................................................................. 2 Training and Implementation ....................................................................................... 2 Future Research Needs............................................................................................... 2
INTRODUCTION............................................................................................................. 3 Problem Statement ...................................................................................................... 3 Research Objectives.................................................................................................... 5 Research Approach ..................................................................................................... 5 Report Organization..................................................................................................... 6
LITERATURE REVIEW .................................................................................................. 7
Background ................................................................................................................. 7 Causes of Transverse Deck Cracking ......................................................................... 7 Material and Mix Design Factors ................................................................................. 9 Construction practice and Ambient Condition Factors ............................................... 14 Structural Design Factors .......................................................................................... 17 Research Needs........................................................................................................ 20
FIELD STUDY............................................................................................................... 21
Objectives and Scope................................................................................................ 21 Data Sources............................................................................................................. 23 Database ................................................................................................................... 26 Evaluation of Survey Results..................................................................................... 27 Structural Design Factors .......................................................................................... 27 Material Properties and Mix Design Factors .............................................................. 36 Construction Techniques and Ambient Condition Factors ......................................... 38 Remarks .................................................................................................................... 39
CAUSES OF VOLUME CHANGE IN CONCRETE AND RESTRAINED SHRINKAGE TESTS........................................................................................................................... 43
Volume Change and Cracking in Concrete................................................................ 43 Bridge Deck Cracking ................................................................................................ 49 Restrained Shrinkage Tests ...................................................................................... 49
FINITE ELEMENT ANALYSIS...................................................................................... 56
Two Dimensional Model of Deck and Girder ............................................................. 56 Results of Two Dimensional Analyses....................................................................... 61 Three Dimensional Model of Deck and Girder........................................................... 82 Results of Three Dimensional Analyses .................................................................... 88
v
A SIMPLE METHOD FOR ESTIMATING STRESSES CAUSING TRANSVERSE CRACKING IN CONCRETE BRIDGE DECKS........................................................... 102
Compatibility Equations ........................................................................................... 102 Adequacy of Assumptions ....................................................................................... 106 Results and Comparison to Finite Element Analysis ............................................... 109 Other Boundary Conditions ..................................................................................... 109 Loading definition for simplified procedure .............................................................. 114 Windows Based Application .................................................................................... 117
CONCLUSIONS AND RECOMMENDATIONS........................................................... 118
Structural Design Factors: Recommendations ........................................................ 118 Mix Design: Recommendations ............................................................................... 120 Construction Practices: Recommendations ............................................................. 120 Future Research Needs........................................................................................... 121
REFERENCES............................................................................................................ 124
APPENDIX A: BRIDGE INFORMATION AND SURVEY RESULTS.......................... 127
Organization ............................................................................................................ 127 Bridge Information and Survey Results ................................................................... 128 Structure Number 0206-165 .................................................................................... 129 Structure Number 0713-151 .................................................................................... 131 Structure Number 1013-151 .................................................................................... 137 Structure Number 1103-158 .................................................................................... 140 Structure Number 1130-152 .................................................................................... 142 Structure Number 1130-153 .................................................................................... 146 Structure Number 1130-154 .................................................................................... 149 Structure Number 1130-155 .................................................................................... 151 Structure Number 1130-156 .................................................................................... 153 Structure Number 1136-154 .................................................................................... 155 Structure Number 1143-166 .................................................................................... 157 Structure Number 1143-167 .................................................................................... 160 Structure Number 1143-168 .................................................................................... 162 Structure Number 1143-169 .................................................................................... 165 Structure Number 1143-170 .................................................................................... 167 Structure Number 1143-171 .................................................................................... 170 Structure Number 1143-172 .................................................................................... 173 Structure Number 1143-173 .................................................................................... 175 Structure Number 1143-174 .................................................................................... 177 Structure Number 1143-175 .................................................................................... 179 Structure Number 1143-176 .................................................................................... 181 Structure Number 1143-177 .................................................................................... 184 Structure Number 1149-168 .................................................................................... 186 Structure Number 1312-154 .................................................................................... 188
vi

LIST OF FIGURES Figure 1. Corrosion due to transverse deck cracks in a bridge in New Jersey. ............... 3 Figure 2. Transverse deck cracks on a bridge deck in New Jersey. ............................... 4 Figure 3. Mechanism of transverse cracking. (a) Concrete is poured. (b) Concrete
shrinks, (c) Due to restraint from girder, concrete shrinkage produces downward deflection. (d) Tensile stress is developed in deck, which causes transverse cracks.................................................................................................................................. 8
Figure 4. Effect of source and type of concrete on curing temperature (Babaei and Purvis, 1994). ......................................................................................................... 11
Figure 5. Cracking as a function of bar size, slump and cover (Dakhil et al., 1975). ..... 13 Figure 6. Geographical distribution of bridges surveyed. .............................................. 22 Figure 7. Visual bridge evaluation form. ........................................................................ 24 Figure 8. Typical NJDOT Inspection/Testing datasheet. ............................................... 25 Figure 9. Percent of cracked bridge decks with different end condition......................... 29 Figure 10. Boundary condition: girders are bounded. ................................................... 29 Figure 11. Structural detail of the end condition shown in Figure 10. ............................ 30 Figure 12. Percent of cracked bridge decks with different skewness. ........................... 31 Figure 13. One dimensional finite element model. ........................................................ 33 Figure 14. Modeling of traffic loads for 1D model. ......................................................... 34 Figure 15. A picture of microfilm of design sheets......................................................... 35 Figure 16. Rt. 133 bridge deck crack............................................................................. 40 Figure 17. Watson Creek Bridge (West Bound): Cracked continuity joints (bridge
No.1130-152). ........................................................................................................ 41 Figure 18. Watson Creek Bridge (East Bound): Un-cracked continuity joints (bridge
No.1130-153). ........................................................................................................ 42 Figure 19. Drying shrinkage of concrete........................................................................ 44 Figure 20. Crack in plastic concrete due to uneven settlement. .................................... 45 Figure 21. Effect of w/c and silica fume on tensile stress produced by autogenous
shrinkage of concrete (Paillere et al., 1989). .......................................................... 46 Figure 22. Effect of w/c, cement fineness, silica fume and admixtures on autogenous
shrinkage (Tazawa et al., 1995). ............................................................................ 47 Figure 23. Temperature distribution across the section for hot weather (Emanuel and
Hulsey, 1978). ........................................................................................................ 48 Figure 24. Ring test apparatus used by different researchers (Burrows, 1998). ........... 51 Figure 25. Ring test apparatus used by Krauss and Rogalla (1996). ............................ 52 Figure 26. Cement rating criteria based on Blaine’s work (Burrows, 1998)................... 52 Figure 27. Bar test for studying cracking tendency of concrete (from Burrows, 1998). . 54 Figure 28. Cracking frame developed in Germany (from Burrows, 1998). .................... 55 Figure 29. Typical results of cracking frame test (from Burrows, 1998)......................... 55 Figure 30. Cross-section of typical slab-on-girder bridge superstructure. ..................... 57 Figure 31. Finite element model of deck, girders and diaphragms................................ 57 Figure 32. Lateral nodal forces along the deck assuming uniform displacements. ....... 58 Figure 33. Two-dimensional (2D) finite element model. ................................................ 59 Figure 34. Deck bottom and top stresses caused by 55-microstrain uniform deck
shrinkage for different boundary conditions. .......................................................... 61
vii

Figure 35. Deck bottom stresses caused by 55-microstrain uniform deck shrinkage for different span lengths and boundary conditions. .................................................... 63
Figure 36. Deck top stresses caused by 55-microstrain uniform deck shrinkage for different span lengths and boundary conditions. .................................................... 63
Figure 37. Deck bottom stresses caused by 55-microstrain uniform deck shrinkage for different deck thickness and boundary conditions.................................................. 64
Figure 38. Deck top stresses caused by 55-microstrain uniform deck shrinkage for different deck thickness and boundary conditions.................................................. 65
Figure 39. Deck bottom stresses caused by 55-microstrain uniform deck shrinkage for different girder spacing and boundary conditions................................................... 66
Figure 40. Deck top stresses caused by 55-microstrain uniform deck shrinkage for different girder spacing and boundary conditions................................................... 67
Figure 41. Deck bottom stresses caused by 55-microstrain uniform deck shrinkage for different ratio of girder/deck moment of inertia and boundary conditions. .............. 68
Figure 42. Deck top stresses caused by 55-microstrain uniform deck shrinkage for different ratio of girder/deck moment of inertia and boundary conditions. .............. 69
Figure 43. Deck bottom stresses caused by 55-microstrain uniform deck shrinkage for different composite moment of inertia and boundary conditions. ........................... 70
Figure 44. Deck top stresses caused by 55-microstrain uniform deck shrinkage for different composite moment of inertia and boundary conditions. ........................... 71
Figure 45. Deck bottom stresses caused by 55-microstrain uniform deck shrinkage for different area of longitudinal reinforcement and boundary conditions. ................... 73
Figure 46. Deck top stresses caused by 55-microstrain uniform deck shrinkage for different area of longitudinal reinforcement and boundary conditions. ................... 73
Figure 47. Deck bottom stresses caused by 55-microstrain uniform deck shrinkage for different distribution of longitudinal reinforcement and boundary conditions. ......... 74
Figure 48. Deck top stresses caused by 55-microstrain uniform deck shrinkage for different distribution of longitudinal reinforcement and boundary conditions. ......... 75
Figure 49. Suggested pouring sequence and lengths for different boundary conditions................................................................................................................................ 77
Figure 50. Shrinkage stress profile................................................................................ 80 Figure 51. Deck top and bottom stresses for different boundary conditions and (a)
shrinkage profile 1, (b) shrinkage profile 2, (c) shrinkage profile 3. ........................ 81 Figure 52. 3D finite element model................................................................................ 84 Figure 53. Bond-slip relationship (Houde, 1973). .......................................................... 85 Figure 54. Shear Connector Detail. ............................................................................... 85 Figure 55. Shear Connector load slip behavior (Yam an Chapman, 1968). .................. 86 Figure 56. Concrete material model in tension.............................................................. 87 Figure 57. Measured concrete deck strain and temperature of a simply supported
bridge. .................................................................................................................... 88 Figure 58. Deformed shape of the girder and cracked deck at the end of analysis (pin-
roller boundary condition)....................................................................................... 89 Figure 59. Deck cracks at end of span (bottom) and mid span (top) of the bridge at the
end of analysis(pin-roller case). ............................................................................. 89 Figure 60. Mid span girder deflection vs. shrinkage strain (pin-roller case)................... 90
viii

Figure 61. Deck top and bottom stress over girder at mid span for pin-roller boundary condition................................................................................................................. 90
Figure 62. Deck top stress over the girder at mid span and quarter span for pin-roller boundary condition................................................................................................. 91
Figure 63. Deck top and bottom stress across the slab at mid span for pin-roller boundary condition................................................................................................. 92
Figure 64. Reinforcement stress over girder at mid span and quarter span for pin-roller boundary condition................................................................................................. 93
Figure 65. Deck cracks at end of span (bottom) and mid span (top) of pin-pin bridge at the end of analysis. Circles indicate cracks for each element.(pin-pin case). ........ 94
Figure 66. Mid span girder deflection vs. shrinkage strain for pin-pin boundary condition................................................................................................................................ 94
Figure 67. Deck top and bottom stress over girder at mid span for pin-pin boundary condition................................................................................................................. 95
Figure 68. Deck top stress over the girder at mid span and quarter span for pin-pin boundary condition................................................................................................. 95
Figure 69. Deck top and bottom stress across the slab at mid span for pin-pin boundary condition................................................................................................................. 96
Figure 70. Reinforcement stress over girder at mid span and quarter span for pin-roller boundary condition................................................................................................. 96
Figure 71. Deformed shape of the girder and cracked deck at the end of analysis (fixed-roller boundary condition)....................................................................................... 97
Figure 72. Deck cracks at fixed end of span (bottom left), roller end of span (right end) and mid span (top) of fixed-roller bridge at the end of analysis. ............................. 98
Figure 73. Mid span girder deflection vs. shrinkage strain for pin-pin boundary condition................................................................................................................................ 98
Figure 74. Deck top stress at 1/3, half and 2/3 of span from fixed end for fixed-roller boundary condition................................................................................................. 99
Figure 75. Deck bottom stress at 1/3, half and 2/3 of span from fixed end for fixed-roller boundary condition................................................................................................. 99
Figure 76. Top reinforcement stress at 1/3, half and 2/3 of span from fixed end for fixed-roller boundary condition...................................................................................... 100
Figure 77. Stress of deck elements for fixed-fixed boundary condition. ...................... 101 Figure 78. Temperature profile along the section. ....................................................... 103 Figure 79. Compatibility forces and moments and temperature distribution................ 103 Figure 80. Finite element model of deck and girder (ANSYS V5.5, 1998)................... 107 Figure 81. Distribution of nodal forces in longitudinal direction for pin-roller deck girder
system between deck and girder.......................................................................... 108 Figure 82. Distribution of nodal forces in direction normal to deck for pin-roller deck
girder between deck and girder............................................................................ 108 Figure 83. Superposition principle applied for finding deck stresses in different boundary
conditions. ............................................................................................................ 110 Figure 84. Comparison of deck bottom stresses for different boundary conditions. .... 113 Figure 85. Comparison of deck bottom stresses for different boundary conditions. .... 114 Figure 86. AASHTO temperature gradient profile for steel and concrete girders. ....... 116 Figure 87. Typical input and output window of application. ......................................... 117
ix

Figure 88. Details of controlled composite action connector. ...................................... 123 Figure 89. Stress-strain curve for typical hyperealstic materials ................................. 123 Figure 90. Crack on the deck (Bridge No 0713-151). .................................................. 133 Figure 91. Construction vehicle traffic on the bridge (Bridge No. 0713-151). .............. 134 Figure 92. Crack on the deck (Bridge No. 0713-151). ................................................. 134 Figure 93. Crack extending into the parapet (Bridge No. 0713-151). .......................... 135 Figure 94. Crack on deck and parapet (Bridge No. 0173-151).................................... 136 Figure 95. A view from underneath the bridge (Bridge No. 1013-151). ....................... 138 Figure 96. Girder end condition at the abutment (Bridge No. 1013-151)..................... 139 Figure 97. Cracked continuity joint (Bridge No. 1130-152).......................................... 144 Figure 98. Another cracked continuity joint (Bridge No.1130-152). ............................. 144 Figure 99. End condition in simply supported spans (Bridge No 1130-152)................ 145 Figure 100. Transverse cracks on the deck (Bridge No.1130-153). ............................ 148 Figure 101. Un-cracked continuity joint (Bridge No.1130-153).................................... 148 Figure 102. Deck cracks at the bridge end (Bridge No. 1143-466). ............................ 158 Figure 103. Wide view of deck cracks at the bridge end (Bridge No. 1143-466)......... 159 Figure 104. Close view of a crack (Bridge No. 1143-166). .......................................... 159 Figure 105. Girders embedded in end diaphragm (Bridge No.1143-168).................... 163 Figure 106. Continuity joint (Bridge No. 1143-168). .................................................... 164 Figure 107. Transverse cracks on bridge deck (Bridge No. 1143-169). ...................... 166 Figure 108. Repaired transverse crack (Bridge No. 1143-170). .................................. 168 Figure 109. Close up view of repair patch (Bridge No. 1143-170)............................... 169 Figure 110. Cracks on the deck (Bridge No.1143-171). .............................................. 171 Figure 111. Another marked crack on the deck (Bridge No.1143-171). ...................... 172 Figure 112. Close up view of deck cracks at the ends (Bridge No.1143-172). ............ 174 Figure 113. End diaphragm (Bridge No.1143-176). .................................................... 182 Figure 114. A view from underneath the bridge (Bridge No.1143-176). ...................... 183 Figure 115. Transverse deck cracks on Bridge No.1143-176 (NJ Turnpike in the
background). ........................................................................................................ 183 Figure 116. Transverse (and longitudinal) cracks on deck (Bridge No.1143-177)....... 185 Figure 117. A view of the bridge (Bridge No.1149-168). ............................................. 187
x

LIST OF TABLES Table 1. Construction data for bridges surveyed........................................................... 22 Table 2. Results of 1D FEA........................................................................................... 35 Table 3. Shrinkage correction factors for initial moist curing (AASHTO). ...................... 45 Table 4. Geometric and design information for the bridge modeled (Hackensack Ave
over NJ Route 4). ................................................................................................... 56 Table 5. Deck top and bottom tensile stresses caused by 55-microstrain uniform deck
shrinkage for different boundary conditions. .......................................................... 61 Table 6. Deck top and bottom stresses caused by 55-microstrain uniform deck
shrinkage for different span lengths and boundary conditions. .............................. 62 Table 7. Deck top and bottom stresses caused by 55-microstrain uniform deck
shrinkage for different deck thickness and boundary conditions. ........................... 65 Table 8. Deck top and bottom stresses caused by 55-microstrain uniform deck
shrinkage for different girder spacing and boundary conditions. ............................ 66 Table 9. Deck top and bottom stresses caused by 55-microstrain uniform deck
shrinkage for different ratio of girder/deck moment of inertia and boundary conditions. .............................................................................................................. 68
Table 10. Different ratio of girder/deck moment of inertia used in calculation and corresponding deck and girder dimensions............................................................ 69
Table 11. Different ratio of composite moment of inertia used in calculation and corresponding deck and girder dimensions............................................................ 69
Table 12. Deck top and bottom stresses caused by 55-microstrain uniform deck shrinkage for different composite moment of inertia and boundary conditions....... 70
Table 13. Deck top stresses caused by 55-microstrain uniform deck shrinkage for different area of longitudinal reinforcement and boundary conditions. ................... 72
Table 14. Deck top stresses caused by 55-microstrain uniform deck shrinkage for zero area of longitudinal reinforcement and boundary conditions. ................................. 72
Table 15. Deck top and bottom stresses caused by 55-microstrain uniform deck shrinkage for different distribution of longitudinal reinforcement and boundary conditions. .............................................................................................................. 75
Table 16. Deck top and bottom stresses caused deck dead load. ................................ 76 Table 17. Residual top and bottom deck stresses caused by pouring sequence (a) for
pin-roller boundary condition. ................................................................................. 77 Table 18. Residual top and bottom deck stresses caused by pouring sequence (b) for
pin-pin boundary condition. .................................................................................... 77 Table 19. Residual top and bottom deck stresses caused by pouring sequence (c) for
fixed-roller boundary condition. .............................................................................. 78 Table 20. Residual top and bottom deck stresses caused by pouring sequence (d) for
fixed-pin boundary condition. ................................................................................. 78 Table 21. Residual top and bottom deck stresses caused by pouring sequence (e) for
fixed-fixed boundary condition. .............................................................................. 78 Table 22. Residual bottom deck stresses caused by pouring sequence (f) for two span
continuous girder.................................................................................................... 78 Table 23. Residual top deck stresses caused by pouring sequence (f) for two span
continuous girder.................................................................................................... 79
xi

Table 24. Residual bottom deck stresses caused by pouring sequence (g) for three span continuous girder........................................................................................... 79
Table 25. Residual top deck stresses caused by pouring sequence (g) for three span continuous girder.................................................................................................... 79
Table 26. Deck top and bottom stresses caused by different shrinkage profile in deck for different boundary conditions. ................................................................................ 80
Table 27. Design characteristic of modeled bridge. .................................................... 107 Table 28. Comparison of FEA and compatibility equations results for the pin-roller
supported deck-girder system.............................................................................. 109 Table 29. Comparison of compatibility equations for plane stress and plane strain
assumption........................................................................................................... 109 Table 30. Comparison of FEA and compatibility equations results for the different
boundary conditions. ............................................................................................ 110 Table 31. Basis for temperature gradients (AASHTO LRFD 1998). ............................ 116
xii

LIST OF SYMBOLS
Compositegirder AA , = Cross sectional area of girder and composite section
ElementA = Area of Element
riA = Total cross sectional area of reinforcement layer i
iA = Cross sectional area of section i
bottomtop CC , = Top and bottom reinforcement cover
tid = Distance from centroid to top fiber of section i
bid = Distance from centroid to bottom fiber of section i
tgbg dd , = Distance of top and bottom fiber of girder from centroid
tcbc dd , = Distance of top and bottom fiber of composite section from centroid
rebard = Reinforcement diameter
cE = Modulus of elasticity of concrete
iE = Modulus of elasticity of section i
ElementE = Modulus of elasticity of element
compositegirder EE , = Modulus of elasticity of girder and composite section
iF = Force resultant of stresses at interface section i and i+1
iFr = Force in reinforcement layer i (positive denotes tensile force)
rf = Modulus of rupture of concrete
cf ′ = Compressive strength of concrete
ih = Height of section I
CompositeGirder II , = Girder and transformed composite section moment of Inertia
iI = Moment of inertia of section i
hvs KK , = Size and humidity correction factors
321 ,,, LLLL = Span length
elementl = Element length
21,, MMM = Redundant Moment P = Redundant force
iQ = Moment resultant of stresses at interface section i and i+1
iR = Curvature of section i
tiib SS , = Bottom and top section modulus of section i
irS = Section modulus at level of reinforcement t = Time in days after measured after curing t = Deck thickness ti = Time
8210 ,...,,, TTTT = Girder and deck temperature changes
xiii
iTr = Temperature at reinforcement layer i u = Reinforcement bond stress
sv / = Volume to surface ration w = Reinforcement slip
iα = Coefficient of thermal expansion of section i
riα = Coefficient of thermal expansion of rebar layer i
Bottomiε = Strain at the bottom of section i (Tensile strain is positive)
Topiε = Strain at the top of the section i (Tensile strain is positive)
tsh,ε = Shrinkage strain
ush,ε = Ultimate Shrinkage strain
DeckTopDeckBottom σσ , = Deck bottom and top stresses (Tensile stress is positive)
DeckTopDeckBottom σσ ∆∆ , = Additional deck bottom and top stresses (Tensile stress is positive)
xiv

SUMMARY A significant number of concrete bridge decks develop transverse deck cracking, often at early ages. Cracks in concrete occur when a restraint mass of concrete tends to change volume. Amount of volume change in concrete depends on mix design and construction procedures. Factors associated with mix design/material and construction procedures have been the subject of a significant number of researches over the past several decades. Restraining effect arises from the composite action between the deck and girder, which is mostly controlled by structural design factors although partly dependent on construction practices too. Structural design factors have not been the subject of much research in the past and they were the main thrust of this research study. Using 2-D and 3-D linear and nonlinear finite element models many design factors such as girder stiffness, deck thickness, girder spacing, relative stiffness of deck to girder, amount of reinforcements, etc. were studied. The research study also included a comprehensive review of the existing literature as well as survey of 24 bridges in the state of New Jersey. Based on the results of this research study the following recommendations are made:
Structural Design Factors
• Specify an upper limit on actual concrete strength vs. the design value. • Minimize the ratio of girder to deck stiffness. • Boundary restraints should be consistent with design. • Time-dependent loadings must be considered in design of bridges with integral
abutments. • Employ more flexible superstructures. • Use uniform reinforcement meshes. • Design should consider AASHTO Article 3.12 (a simple design tool has been
developed under this study to facilitate this.)
Mix Design (Material)
• Reduce cement content to 650-660 lb/yd3, and consider using fly ash. • Limit water cement (w/c) ratio to 0.4-0.45. • Use AASHTO specification Type II cement. • Adopt a restraint shrinkage test. • Consider using type K shrinkage compensating concrete when available. • Use aggregate size and shape as discussed in the report.
1

Construction Practices
• As specified in NJDOT Specs, ensure that curing starts immediately after finishing and wet cure for at least seven consecutive days.
• If “early-open” is not an issue consider 14-day wet curing. • Make use of evaporation rate chart proposed by ACI and cast the deck in mild
temperatures. • Record wind speed and humidity during construction for future reference. • Give consideration to pouring sequence as proposed under this report.
Training and Implementation Many of the recommendations are straightforward and can be implemented immediately. However, a couple of these recommendations may have implications and/or may require some training. NJIT will work with NJDOT, specifically Bureaus of Structures & Design and Materials, to coordinate implementation of these recommendations.
Future Research Needs Several areas of future research have been identified that are all very important. For example, the proposed connector called Controlled Composite Action (CCA), as discussed in last chapter, has great potential and should be seriously considered for future investigation. CCA has the high potential to eliminate, as opposed to minimizing, the problem of deck cracking.
2

INTRODUCTION This chapter introduces and explains transverse deck cracking in concrete bridge decks and its effects on the bridge performance. It also discusses the need for further research, such as this study, by presenting and discussing the results of prior research activities on this subject. The objectives and plan for this research study are also discussed in some detail. Finally, the report organization is presented.
Problem Statement New Jersey Department of Transportation’s (NJDOT) Bureau of Construction and Materials has noticed an increase in the number of cracking in concrete bridge decks. Literature indicates that indeed many concrete bridge decks develop transverse cracking and most of these cracks develop at early ages, many, right after construction. These cracks are typically full-depth and spaced 3 to 10 ft apart along the length of the bridge. Transverse cracks can accelerate corrosion of reinforcing steel, deteriorate deck concrete, possibly cause damage to underneath components of the bridge, and damage bridge esthetic. As a result of these adverse effects of transverse cracking, the maintenance costs will increase and ultimately the service life of the bridge system will be shortened. A picture of a full width transverse crack in a bridge deck is shown in figure 1. Although not quite clear, this is shown to emphasize the extent of damage that a crack can cause once it is initiated. The crack has propagated all the way into the monolithic parapet. The arrow shows the location of the crack. As indicated by the dark water trace on the underneath girder, the reinforcements are also corroded. Maintenance and repair costs associated with damage like this to our infrastructure put a significant burden on highway agencies’ resources. Figure 2 shows a picture of another bridge deck crack that is quite wide and extends the full width of the deck.
Figure 1. Corrosion due to transverse deck cracks in a bridge in New Jersey.
3

Figure 2. Transverse deck cracks on a bridge deck in New Jersey.
There have been significant numbers of studies on the cause of transverse deck cracking, as it will be discussed in the next chapter. However, the causes are not yet fully understood and the problem still exists. Previous studies were mostly focused on concrete mix design and improvement through changes to construction practices to alleviate shrinkage problems. In many instances there are major disagreements on the factors affecting transverse cracking indicating the need for further research. For example, Dakhil et al. (1975) report a direct relationship between an increase in cracking and an increase in concrete slump while Cheng and Johnston (1985) have observed a decrease in transverse cracking in concrete bridge decks with increasing slump. Contradiction on the effect of girder type is another important example on the lack of full understanding of the causes of this phenomenon. Meyers (1982) indicates that structures supported on wide flange and composite steel-plate girders exhibited much more cracking than those constructed on other systems. However, the results of our survey showed that the percentage of the cracked decks supported on prestressed concrete girder are higher. Furthermore, the review of the construction and mix design documents for the bridges surveyed and NJDOT 1996 Standard Specifications for Road and Bridge Construction and 1998 Supplemental Specification (hereafter NJDOT Specs) show that most of the important recommendations of previous studies are already included in mix design and construction of bridge decks in New Jersey. However, transverse cracks are still observed on some of the newly constructed bridge
4

decks indicating the contribution of other factors and the need for further study to identify these factors and propose remedies.
Research Objectives The overall objective of this research is to investigate the cause(s) of transverse concrete deck cracking and to develop solutions for possible implementation in design and construction of new concrete bridge decks. Thus, the tasks to achieve these objectives are as follow:
• Literature review and evaluation of previous research recommendations along with review of current design and construction practices in New Jersey.
• Development of a database and statistical analysis based upon survey of bridge decks, and evaluation of results in light of literature review.
• Development of 3-D finite element models and parametric study. • Development of simplified analytical procedures for design purposes. • In-field evaluation and response measurements bridge. • Development and formulation of design recommendations.
This report discusses the results of the study. In the following section the research approach for tasks conducted during this study is briefly discussed.
Research Approach There have been significant numbers of studies on the cause of transverse deck cracking. These studies were reviewed to identify their most important recommendations and findings. These recommendations were compared to NJDOT Specs (1998) to identify any discrepancy and to make recommendation for possible adoption. The literature findings are also critically reviewed to adopt an appropriate research approach and to identify areas for further work. 24 bridges were surveyed in New Jersey. Their conditions were not known a priori. The criteria for selecting these bridges were that 1) they were built after 1994 (5 year old age at the time of this research), and 2) they span more than 75 ft, single or multiple spans. It turned out that most bridges selected were cracked, although there were a few uncracked bridges among those surveyed. During the surveys crack information such as spacing, width and location were qualitatively recorded. The design and construction documents for the bridges surveyed were also reviewed. Based on the information collected a database was developed and it was used in the subsequent statistical analysis. The objective of the statistical analysis was to identify major factors causing transverse deck cracking in New Jersey. Using these results and the knowledge gained through literature survey, a narrower list of factors were selected for a more focused study using finite element analysis.
5

Several Finite Element (FE) models were developed. A comprehensive linear and nonlinear Finite Element Analysis (FEA) were conducted to study crack patterns on bridge deck and quantify the effect of design factors affecting deck transverse cracking. These factors were selected based on the literature review and field surveys conducted within initial phases of this study. Based on the results of the FEA further recommendations are made to reduce crack tendency in bridge decks. To study the effect of ambient and hydration temperature as well as shrinkage on deck strains and stresses, four bridge decks were instrumented. Temperature and strains were monitored and recorded during each test. These data are presented and analyzed to identify the effect of hydration, daily temperature, and shrinkage on transverse deck cracking. Finally, a simplified method to evaluate stresses in concrete bridge deck due to shrinkage, hydration effects and ambient temperature changes was developed. It is proposed that this method be used during design stage to evaluate different superstructure design parameters with respect to transverse deck cracking. To further facilitate use of this method, a user-friendly windows based application is developed, which implements this method.
Report Organization Results of this study are organized in seven chapters and one appendix. Following this introductory chapter on problem statement and research objective, the literature reviews are presented and discussed in chapter 2. Chapter 3 discusses the details of field study, data gathering, database development, and discussion of field study results. Chapter 4 examines the causes of volume change in concrete and relevant test methods. 2D and 3D finite element study results are presented in chapter 5. Details of the simple method developed to estimate deck stresses are discussed in chapter 6. Finally, chapter 7 presents recommendations of this study. There is also an appendix, which contains details of the information collected for each bridge during field surveys.
6
LITERATURE REVIEW This chapter presents the results of a comprehensive literature review on the cause of transverse deck cracking. It includes experimental and analytical research results as well as survey studies on the effects of different factors on concrete deck cracking. Consistent with past work on the subject, causes are classified under three categories, namely: 1) material and mix design, 2) construction practice and ambient condition factors, and 3) structural design. Finally areas for further research are identified.
Background Many concrete bridge decks develop transverse cracking and most of these cracks develop at early ages, some right after construction, and some after the bridge has been opened to traffic for a period of time. Transverse cracks usually occur when concrete is set (Iowa DOT, 1986; Kosel et al., 1985; PCA, 1970) and widen with time (Cady et al., 1971; Horn et al., 1972; Ramey et al., 1997). These cracks have been observed in most geographical locations, and on many superstructure types (Krauss and Rogalla, 1996). It is estimated that more than 100,000 bridges in the United States develop early transverse cracks (Krauss and Rogalla, 1996). These cracks are typically full depth (Krauss and Rogalla, 1996; La Fraugh, 1989; Mc Keel, 1985) located 1-3 m (4-12 ft) apart along the length of the span (Cheng and Johnson, 1985; Kosel et al., 1985; PCA, 1970) and are usually observed over transverse reinforcement (Krauss and Rogalla, 1996; Iowa DOT, 1986; Mc Keel, 1985; PCA, 1970; Ramey et al., 1997). It has been reported that the predominant form of deck cracking is transverse cracking (Cady et al., 1971; Mc Keel, 1985; PCA, 1970; Ramey et al., 1975). These cracks reduce the service life of the structure and increase maintenance costs, which is of paramount importance in highway maintenance activities. Transverse cracks accelerate reinforcement corrosion, especially in regions where deicing chemicals are applied (Mc Keel, 1985; Perfetti et al., 1985). Corrosion damage has been observed even on epoxy coated reinforcing bars (Perfetti et al., 1985). Freeze-thaw cycles of water in cracks and leakage of water to supporting structures may also reduce service life of structures. Although transverse cracking in bridge decks has been one of the main concerns of designers and researchers for decades, effect of contributing factors on transverse cracking is not fully understood yet. This chapter examines the state of knowledge on transverse deck cracking, discusses areas for further research, and presents a set of recommendations for reducing possibility of transverse deck cracking.
Causes of Transverse Deck Cracking Cracks in concrete occur when a restraint mass of concrete tends to change volume. Volume change in concrete depends on the properties of its constituents and their proportions as well as environmental conditions such as ambient temperature changes and humidity. Restraint, which is basically due to composite action of deck and girder,
7

depends on design characteristics of the bridge. Construction techniques also contribute to volume change and/or to degree of restraint of concrete mass. Mechanism of transverse cracking is shown in figure 3.
Figure 3. Mechanism of transverse cracking. (a) Concrete is poured. (b) Concrete shrinks, (c) Due to restraint from girder, concrete shrinkage produces downward
deflection. (d) Tensile stress is developed in deck, which causes transverse cracks.
Volume change in concrete bridge deck, as influenced by the properties of concrete, is caused by drying-shrinkage, autogenous shrinkage, plastic shrinkage, thermal shrinkage, and creep. Drying shrinkage is change in concrete volume due the change in water content during the time after exposure to atmosphere. Autogenous shrinkage is the change in concrete volume without change in its water content and usually occurs in very low w/c ratios. Plastic shrinkage refers to shrinkage caused by excessive evaporation of surface water. Cooling of concrete after initial hydration is the cause of thermal shrinkage. Creep strains, on the other hand, tend to counteract the effect of shrinkage. Although relative importance of these factors is not completely quantified yet, drying shrinkage and thermal shrinkage are considered by many studies to be the major cause of concrete deck cracking (Babaei et al., 1997, 1987; French et al., 1999; Krauss and Rogalla, 1996; La Fraugh et al., 1985; PCA, 1970). Earlier studies reported correlation between deck cracking, drying shrinkage (Babaei and Hawkins, 1987; La Fraugh, 1985; PCA, 1970) and higher placement temperatures (PCA, 1970). Babaei and Purvis (1994) measured thermal and drying shrinkage of different mixes and showed that mixes with higher thermal and drying shrinkage values tend to crack more. Krauss and Rogalla (1996), through analytical study and further instrumentations of bridge decks, showed that drying shrinkage and temperature changes through the
8

section are responsible for deck cracking. In another study, Ducret et al. (1997) have measured that mixes with lower peak hydration temperature produce less residual stress in concrete. In a recent study, Frosch et al. (2002), through field instrumentation and test of constructed deck in laboratory, have conclusively shown that drying shrinkage is the most important cause of transverse cracking. Restraint of deck by girder against its volume change provides the condition for cracking. Ducret et al. (1997) have measured that reducing the ratio of cross sectional area of girder to deck reduces risk of cracking. However, relative effect of different factors on the restraint of the composite system is not fully understood yet. Very little, if any, effort has been done to reduce the restraint of deck girder system by changes in design. Construction practice, such as curing procedures, pouring sequence, and form type can also affect deck cracking. Cady et al. (1971), in their study of 249 bridges in Pennsylvania, have shown that the bridge decks constructed by certain contractors have more transverse deck cracking than other decks in the study and concluded that construction practice plays a major role in cracking of concrete bridge decks. Several researchers (e.g. Horn et al., 1975; Kochanski et al., 1990; PCA, 1970) have emphasized effect of curing and weather. Although construction methods may increase or decrease risk of cracking, cracking have been observed on decks built with different construction techniques. Consequently, transverse deck cracking cannot be solely attributed to a certain type of construction technique. In the following sections, the state-of-the-art on the causes and control of transverse deck cracking are presented under the three main categories of material and mix design, construction practice and ambient conditions, and structural design factors.
Material and Mix Design Factors Aggregate Type, size, volume and properties of aggregate have pronounced effects on concrete properties. Suggestion on aggregate from prior studies include using largest possible size of aggregate (Babaei and Purvis, 1994; Kosel et al., 1985; Krauss and Rogalla, 1996; PCA, 1970), maximizing aggregate volume (French et al., 1999; Kochanski, 1990; Kosel et al., 1985), and using low shrinkage aggregate (Horn et al., 1972; Krauss and Rogalla, 1996; PCA, 1970) to reduce cracking. To identify low shrinkage aggregate Babaei and Purvis (1994) further recommended that coarse aggregate absorption should not be more that 0.5 percent and fine aggregate absorption should not be more that 1.5 percent and that aggregates should have high specific gravity. In general, concrete mixes with good quality, and a clean, low shrinkage aggregate with high aggregate to paste ratio have been observed to perform better.
9

Water Content While Horn et al. (1975) noticed little correlation between cracking and water content, Schmitt and Darwin (1999) found increased cracking with increased water content and recommended reducing water content. Other researchers (Babaei and Hawkins, 1985; Babaei and Purvis, 1994; Issa, 1999) have also made similar recommendations. Schmitt and Darwin (1999) further suggested that volume of water and cement should not exceed 27 percent of total volume of concrete, and Babaei and Purvis (1994) recommended the maximum water content of 192 kg/m3 (323 lb/yd3). Cement Type Several studies have found that cement type has a significant effect on cracking. It is accepted among researchers that use of type II cement reduces cracking and several studies recommended the use of type II cement in bridge deck construction (Horn et al., 1975; Krauss and Rogalla, 1996; Babaei and Purvis, 1994; Kosel et al., 1985; La Fraugh, 1989). The better performance of type II cement is usually attributed to reduced early thermal gradient and shrinkage of type II cement. Figure 4 shows the effect of cement type and source on curing temperature as reported by Babaei and Purvis (1994). Cement Content Many studies have observed more cracking with higher amount of cement in the concrete mix (French et al., 1999; Krauss and Rogalla, 1996; La Fraugh, 1989; Iowa DOT, 1986; Kochanski et al., 1990; Kosel et al., 1985; La Fraugh, 1989; Schmitt and Darwin, 1999). The adverse effect of higher cement content is usually related to higher drying shrinkage, higher temperature rise during hydration and higher early modulus of elasticity of concrete. Different amounts of cement have been recommended as the maximum acceptable cement content in concrete mixes:
• 360 kg/m3 (611 lb/m3) (Iowa DOT, 1986). • 370 kg/ m3 (620 lb/yd3) (La Fraugh, 1989). • 446 kg/ m3 (725 lb/yd3) (Babaei and Purvis, 1994). • 385-390 kg/ m3 (650-660 lb/yd3) (French et al., 1999).
10

Figure 4. Effect of source and type of concrete on curing temperature (Babaei and Purvis, 1994).
Water/Cement Ratio Schmitt and Darwin (1999) noticed reduced cracking with reduction in water cement ratio. Indeed other studies also recommend reduction of water cement ratio in concrete mix to reduce cracking (French et al., 1999; Iowa DOT, 1986; Kochanski et al., 1999; PCA, 1970). Reducing water cement ratio of concrete is believed to reduce shrinkage of concrete. However Stewart and Gunderson (1969) found no relationship between high w/c ratio and cracking. The following maximum water cement ratios have been recommended:
• 0.48 (PCA, 1970). • 0.41 (Iowa DOT, 1986). • 0.40 (Kochanski et al., 1990). • 0.40-0.45 (Ramey et al., 1997).
It is also recommended to reduce water cement ratio using water reducers and pozzolans (La Fraugh, 1989). Concrete Strength There has been significant increase in concrete strength during the past decades. Increased strength, which is usually accompanied by increase in cement content, increase in paste volume and higher hydration temperatures, is blamed to cause more cracking in concrete decks. In fact, Krauss and Rogalla (1996) related the increase in deck cracking since the 1970s to AASHTO’s 1973 increase of minimum strength from
11

3000 psi to 4500 psi and lowering w/c from 0.53 to 0.445. It may seem that high early strength of concrete may reduce cracking but since the strength gain of concrete is usually accompanied by a gain in modulus of elasticity, it can’t be easily said that higher strength reduces cracking. There are no general agreements among studies that considered this factor. Schmitt and Darwin (1999) noticed increased cracking with increased compressive strength. However, Ramey et al. (1997) recommended increasing compressive strength. On the other hand, Krauss and Rogalla (1996) recommended the use of concrete with low early strength (i.e. 60 – 90 day strength should be specified). Slump There are many contradictions in results of the studies performed so far on the effect of slump on deck cracking. Dakhil et al. (1975) in their experimental study reported increased cracking with increasing slump (figure 5). Some studies have recommended reducing the slump (PCA, 1970; Babaei and Hawkins, 1987; Isaa, 1999; Kosel, 1985; Schmitt and Darwin, 1999) and proposed values for maximum slump:
• 50+12 mm (2 + ½ in) (PCA, 1970). • 60+12 mm (2 ½ + ½ in) (Iowa DOT, 1986).
However, Stewart and Gunderson (1969) found no relationship between high slump and cracking, and Krauss and Rogalla (1996) mentioned that there is no relation between slump and cracking tendency. On the other hand, Cheng and Johnson (1985) even noticed a decrease in transverse cracking with an increase in slump. Air Content Air content is usually used to increase freeze thaw durability of concrete. But it may be advantageous to use high values of air content in moderate and warm climates. Cheng and Johnson (1985) observed that increase in air content reduces cracking. Schmitt and Darwin (1999) even noticed significant decreases in cracking with air content more than 6 percent and recommend at least 6 percent air content. French et al. (1999) recommend air content of 5.5 - 6 percent. In contrary, Stewart and Gunderson (1969) found no relationship between air content and cracking.
12
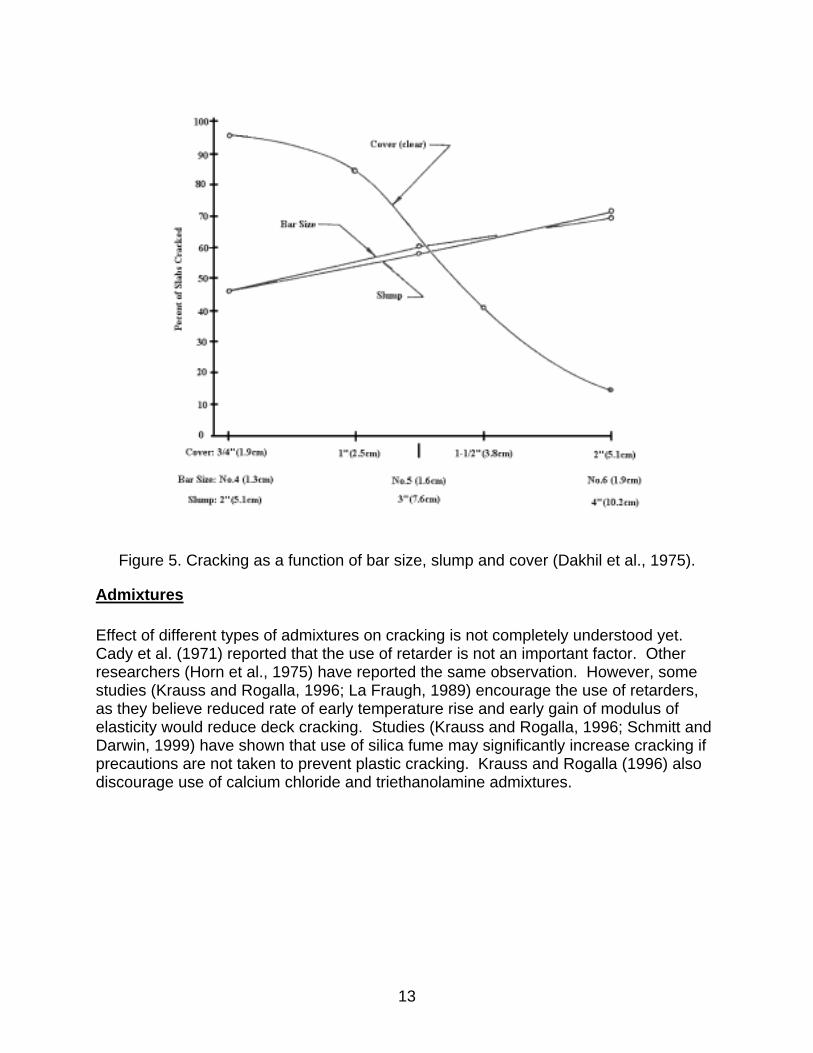
Figure 5. Cracking as a function of bar size, slump and cover (Dakhil et al., 1975).
Admixtures Effect of different types of admixtures on cracking is not completely understood yet. Cady et al. (1971) reported that the use of retarder is not an important factor. Other researchers (Horn et al., 1975) have reported the same observation. However, some studies (Krauss and Rogalla, 1996; La Fraugh, 1989) encourage the use of retarders, as they believe reduced rate of early temperature rise and early gain of modulus of elasticity would reduce deck cracking. Studies (Krauss and Rogalla, 1996; Schmitt and Darwin, 1999) have shown that use of silica fume may significantly increase cracking if precautions are not taken to prevent plastic cracking. Krauss and Rogalla (1996) also discourage use of calcium chloride and triethanolamine admixtures.
13

Construction practice and Ambient Condition Factors Weather Condition and Concrete Temperature Weather condition during placement of concrete and relative concrete temperature can greatly affect deck cracking. While hot and cold weather conditions may result in poor quality concrete, it is also believed that restraint to thermal variations contributes to cracking (PCA, 1970). Thermal stresses developed at early age in concrete deck depend greatly on concrete temperature and weather conditions. Concrete temperature rises as a result of hydration while girder temperature remains relatively unchanged. This temperature change will cause thermal stresses in the section. Weather condition and solar radiation may also increase these stresses resulting in more cracking. Studies (Cheng and Johnson, 1985; Mayers, 1982; Schmitt and Darwin, 1999) have shown that hot and cold weather increases cracking and several values for allowable ambient temperatures, and concrete temperature during placement are proposed such as:
• Maximum concrete placement temperature of 27oC (80oF) (PCA, 1970.) • Minimum ambient temperature of 7.2oC (45oF) (Cheng and Johnson, 1985.) • Minimum and maximum ambient temperature of 4 and 32oC (40 and 90oF) and
reducing temperature difference between deck and girder (French et al., 1999.) • Maximum concrete placement temperatures 27oC (80oF) (Krauss and Rogalla,
1996.) • Concrete temperature of at least 5-10oC (10-20oF) cooler that ambient
temperature (Krauss and Rogalla, 1996.) • Girder temperature of 12-24oC (55-75oF) should be maintained in clod weather
(Babaei and Purvis, 1994.) Some other studies specified the allowable differential temperature of deck and girder, for example:
• Temperature difference of at least 12oC (22oF) for at least 24 hours is recommended by Babaei and Purvis (1994).
Low levels of humidity and high wind speed can also increase cracking. Plastic shrinkage cracks are often attributed to higher evaporation rates than concrete bleeding, where evaporation rates increase with high temperatures, low humidity, and high wind speed. Evaporation rates of concrete under different conditions can be found using the evaporation chart. Krauss and Rogalla (1996) recommended that special consideration should be taken when evaporation rates are more than 1.0 kg/m2/hr (0.2 lb/ft2/hr) for normal concrete and 0.5 kg/m2/hr (0.1 lb/ft2/hr) for low w/c ratio concrete. PCA (1970) recommends testing mixes for bleeding. Kochanski et al. (1990) recommend estimating evaporation rate and reducing it to a maximum of 1.25 kg/m2/hr (0.25 lb/ft2/hr).
14

Curing Curing has a pronounced effect on the properties of hardened concrete such as durability and strength. Adequate and timely curing is a key factor in reducing cracking. Importance of cracking is emphasized by almost all studies. Initial fogging (Horn et al., 1975; Stewart et al., 1969), early curing (Horn et al., 1975; PCA, 1970; Babaei and Hawkins, 1987), sprinkling water on concrete surface (PCA, 1970), applying wet burlaps, and applying curing compounds (Stewart et al., 1969) are among the recommendations proposed in literature. Krauss and Rogalla (1996) recommended the following procedure for curing:
• Use of fog nozzle water spray in hot weather to cool concrete and to cool the steel and forms immediately ahead of placement – ponding of water on the forms or plastic concrete should not be allowed.
• Use of wind breaks and enclosures when the evaporation rates exceed 1 kg/m2/hr (0.2 lb/ft2/hr) for normal concrete or 0.5 kg/m2/hr (0.1 lb/ft2/hr) for low water cement ratio concretes susceptible to plastic cracking.
• Application of water mist or monomolecular film immediately after strike-off or early finishing.
• Application of white-pigmented curing compound as soon as bleed water diminishes.
• Application of prewetted burlap as soon as concrete resists indentation – the burlap must be kept continuously wet by continuous sprinkling or by covering the burlap with plastic sheeting and periodic sprinkling.
• Continuation of wet curing for a minimum of 7 days, preferably 14 days – curing should be extended in cold weather until the concrete has gained adequate strength.
Extended curing time is also suggested by La Fraugh (1989). Kosel and Michols (1985) and Frosh et al. (2002) recommended minimum curing of 7 days for type I and 14 days for type II cement. To reduce temperature, Kochanski et al. (1990) further recommended that decks be covered with permeable membranes rather than impermeable ones. Pour length and Sequence Although earlier studies (Cheng and Johnson, 1985; Perfetti et al., 1985) reported that pour length and sequence do not seem to influence cracking, later studies suggested that pour length, sequence, and rate may have some effects on deck cracking and recommended specifying pouring sequence (Iowa DOT, 1996) and avoiding pouring irregularities (Horn et al., 1975). Kochanski et al. (1990) recommend pouring concrete at a rate faster than 0.6 span lengths per hour. In his analytical study, Issa (1999) attributes cracking to sequence of pour and recommends placing concrete first in positive moment regions. Ramey et al. (1997) recommend a detailed pouring procedure as follows:
15

• Place complete deck at one time when possible. • Place simple span bridges one span per placement or if span is long place divide
deck longitudinally and place each stripe at one time. If this cannot be done too, then place the center of span first and then place other portions.
• If multiple placements should be made on continuous beams, place middle spans first and observe 72 h delay between placements. Use bonding agent to enhance bond at joint.
Time of Casting There is an indication that evening and nighttime casting can reduce the extent of cracking. PCA (1970) recommended nighttime casting. Krauss and Rogalla (1996) also recommended early or mid evening placing. Finishing It has been reported that early finishing reduces cracking (Horn et al., 1975; Krauss and Rogalla, 1996). Horn et al. (1975) noticed that hand finishing increases cracking. However, mechanical grooving is recommended by Krauss and Rogalla (1996). Stewart and Gunderson (1969) also found that applying water or grout to concrete surface during finishing operation has adverse effects on cracking. Revolutions in Concrete Truck Horn et al. (1975) noticed that excess revolution in trucks does not affect cracking. Vibration of Fresh Concrete Sufficient vibration of concrete is essential to good concrete. Issa (1999) considers insufficient vibration of fresh concrete a contributing factor in concrete cracking. Horn et al. (1975) noticed that under-vibrated areas tend to develop more cracks, however, over vibration of concrete doesn’t cause any noticeable effect. Construction Loads Effect of traffic and construction loads on deck cracking is also not completely known. Furr and Fuad (1982) found that no deterioration can be attributed to traffic in adjacent lanes during construction, and Manning (1981) showed that good quality plain and reinforced concrete is not adversely affected by jarring and vibrations of low frequency and amplitude during the period of setting and early strength development. However, Issa (1999) attributes cracking to weight and vibration of machinery. Dead load of structure also affects concrete deck cracking (Krauss and Rogalla, 1996). It has been suggested that shoring girders may reduce deck cracking (Babaei and Hawkins, 1987).
16

Form Type Inconsistent results have been reported on the effect of form type on deck cracking. Issa (1999) attributes cracking to weight of the forms and their deflection. Based on survey results, Cady et al. (1971) reported that Stay-In-Place (SIP) forms perform better than removable forms. Cheng and Johnson (1985) reported that use of SIP or conventional forms have little effect on transverse deck cracking while Krauss and Rogalla (1996) have found that SIP forms sometimes increase cracking. Through an experimental study, Frosh et al. (2002) have concluded that additional restraint from stay-in-place forms contribute to cracking and recommended that some other type of forms be used.
Structural Design Factors It should be noted that research on design factors, in general, is very limited. However there are a few studies which have considered these factors qualitatively. These are discussed in following sections. Girder Type, Boundary Condition, and Spacing Several studies (Krauss and Rogalla, 1996; PCA, 1970; Cheng and Johnson, 1985; Mayers, 1982; Frosh et al., 2002) have found that decks on steel girders tend to crack more when compared to decks on concrete girders. It is believed that since concrete girders conduct heat slower than steel girders (i.e. lower temperature gradients), thermal stresses in concrete girder bridges are lower than steel girder bridges, consequently, less cracking tendency is expected. Krauss and Rogalla (1996) found that cast in place concrete girders and young prestressed girders have the best performance while deep steel beams have performed worse. They also discouraged design of prestressed composite bridges. Girder end condition also has pronounced effect on deck cracking (French et al., 1999). Cracking is more prevalent on continuous spans when compared to simple spans (Krauss and Rogalla, 1996; Mayers, 1982; Cady et al., 1971; Cheng and Johnson, 1985), but cracks are observed on both types of spans. There seems to be no significant difference among transverse crack patterns on different types of structures. A Portland Cement Association study (PCA, 1970) indicated that regardless of type of span the same pattern of uniformly spaced cracks are observed on decks supported on steel girder. Stud Configuration and Properties Composite action of the deck and girder is basically due to response of shear studs. However, there is no significant effort to reduce deck restraint through changes in stud configuration. Although Krauss and Rogalla (1996) have found that girder restraint and
17

studs cause significant cracking, they don’t provide any suggestion on how to reduce girder restraint through change in stud configuration and properties. The only recommendation comes from French et al. (1999) where they have recommended fewer studs with smaller rows and lengths but they don’t specify any practical guidelines. Concrete Cover Based on their experimental study, Dakhil et al. (1975) reported that concrete cover over reinforcement is the most important factor affecting crack formation (see figure 5). Increased cover depth reduces risk of cracking, however, excessive increase in cover depth increases probability of settlement cracks over reinforcement. Different values are proposed as the optimum value of the cover depth over top reinforcing bars:
• Minimum of 38 mm. (1.5 in) (PCA, 1970.) • 88 mm (3.5 in) (Babaei and Hawkins, 1987.) • 50 mm (2 in), where deicing chemicals are used use 64 mm (2 ½ in) and
maintain 76 mm (3 in) limit (Ramey et al., 1997.) • 38 - 76 mm (1.5 - 3 in).
Contrary to these studies, Meyers (1982) found that decks with cover of 76 mm (3 in) or more seem to be more susceptible to cracking. Deck Thickness Increase in deck thickness reduces deck cracking (French et al., 1999; Krauss and Rogalla, 1996; Kochanski et al., 1990; Ramey et al., 1997; Horn et al., 1972; Mayers, 1982). Meyers (1982) observed that bridge decks with deck thickness of 25 cm (10 in) or more are less susceptible to cracking. Kochanski et al. (1990) recommends deck thickness of 8 ½ to 9 in. French et al. (1999) recommended decks with thickness greater than 16 cm (6 ¼ in). Reinforcement Type, Spacing, Size and Distribution Reinforcing detail is of paramount importance in controlling cracks in concrete structures. Bar size, type, spacing, and distribution affects cracking tendency of concrete decks greatly. Dakhil et al. (1975) in their experimental study reported that cracking increases with an increase in bar size (see figure 5). Some other studies (Babaei and Hawkins, 1987; Schmitt and Darwin, 1999) also observed the same behavior and recommended limiting the bar size of decks. Since longitudinal bars control deck stresses and reduce cracking tendency, an increase in the amount of longitudinal reinforcement without increasing bar size is another recommendation proposed in some studies (Krauss and Rogalla, 1996; PCA, 1970; Kochanski et al., 1990; Horn et al., 1972; Frosh et al., 2002). Kochanski et al. (1990) as well as Ramey et al. (1997) recommended the maximum top transverse bar size of No. 5 and an increase in longitudinal reinforcement. Krauss and Rogalla (1996) recommend use of No. 4 bars with maximum spacing of 15 cm (6 in). It is also suspected that due to
18

subsidence of fresh concrete over the reinforcing bars and formation of weak plane, deck tends to crack over transverse reinforcing bars. So, French et al. (1999) also recommended limiting transverse bar size and/or maximize transverse bar spacing. Epoxy coated bars are used to control corrosion of reinforcing bars. Meyers (1982) found that decks with epoxy bars tend to show more cracking. The same finding is reported by Krauss and Rogalla (1996). However, contrary to their findings, a study by Iowa DOT (1986) recommended use of epoxy coated rebars to control cracking. Details of construction are also important. Horn et al. (1975) noticed that tightly tied reinforcements develop more small cracks initially than loosely tied reinforcements but ultimately cracking was the same. Issa (1999) attributed some cracking to insufficient reinforcing detail at joints between new and old decks. Ramey et al. (1997) suggest the following recommendation for reducing deck cracking:
• Limiting the size of deck reinforcement to No. 5. • Reversing lying transverse and longitudinal rebars in the top mat and staggering
top and bottom rebars so as not to create significant plane of weakness and using higher percentage of longitudinal steel.
• Using ρ =0.002 for top mat longitudinal steel and using the same for bottom mat and trying to use No. 4 bars.
• Reducing splices. • Extending deck transverse steel full width.
Section Stiffness Results of the research studies on the effect of section stiffness on deck cracking are a bit confusing. While Babaei and Hawkins (1987) suggested minimizing the flexibility of structure, Ducret et al. (1997) showed in their study that with an increase in the ratio of girder to deck area (which can be related to reducing flexibility) cracking tendency increases. This finding is in agreement with the findings of French et al. (1999) and Krauss and Rogalla (1996) who also reported that reducing deck stiffness reduces cracking. Since restraint volume change of deck is the principal cause of deck cracking, reducing section stiffness seems to decrease deck cracking. However, this statement needs to be verified with further research. Vibration and Impact Characteristics Perfetti et al. (1985) found no relationship between frequency of vibration of superstructure, speed and impact parameters and transverse cracking. However, Babaei and Hawkins (1987) suggested reducing the amplitude and frequency of structure vibration under live load.
19

Traffic Although some studies (Krauss and Rogalla, 1996; Stewart et al., 1969; Cady et al., 1971) reported no relationship between daily traffic of bridges and tendency for deck cracking, others (Mc Keel, 1985) observed that bridges that carry fewer trucks at lower speeds exhibit less cracking than those that carry a large number of trucks at higher speeds.
Research Needs Despite the large number of studies on concrete deck cracking, transverse deck cracking is still a problem faced by many transportation agencies worldwide. There are still areas on cause and control of concrete deck cracking that need to be investigated. Many studies have considered material factors. However, there is no general consensus on the range of different mix design factors (i.e. w/c ratio, cement content, water content, etc.). More research is needed to quantify the acceptable range of different factors. Although research has shown that restraint of decks due to composite action of deck and girder is the main cause of cracking, there is no significant effort to quantify and/or reduce this restraint through design recommendations. Particularly, effect of shear studs characteristics and section stiffness on deck cracking is almost unknown. There seems to be more agreement among different researchers on the effect of construction factors. However, due to constant change in construction techniques and introduction of new concrete products like HPC, research is needed to identify an appropriate construction procedure for these products. Standard repair procedures need to be developed and employed by transportation agencies to repair already cracked decks. These procedures can be incorporated into contract specification (Krauss and Rogalla, 1996). A promising approach to reduce deck cracking is the use of shrinkage compensating cement and/or fiber reinforcement as well as prestressed deck systems (Krauss and Rogalla, 1996). However, more research is required before successful application of them. Design tools for evaluation of deck stresses for various geometries, boundary conditions, concrete mix and ambient condition are required (as specified by AASHTO LRFD (1998) article 3.12.4). Such tools may be based on the earlier work of Krauss and Rogalla (1996). One such tool has been developed in this study and presented in chapter 6.
20

FIELD STUDY This chapter presents scope and objective of the field study and provides the details of data collection, data base development, statistical analysis, and features of the database. In the following sections, field study is discussed and the methods and sources for different types of data in the database are explained. This chapter also presents the results of the field study and the statistical analysis, based on the data which were collected during the field study. Results and their limitations are presented under the three major categories of structural design, material properties and mix design, and construction. In each part, results are compared to similar studies performed by other researchers. These results are followed by discussions of research findings and some interesting observations that were made during the field study.
Objectives and Scope A field study was initiated with the survey of 24 bridges in the state of New Jersey and by collecting design and construction data on these bridges for subsequent statistical analysis (appendix A contains the data collected for all bridges). In the following section the objectives and scope of the field study are discussed. Objective The main objective of these surveys was to identify factors that affect transverse deck cracking in bridges in the state of New Jersey. Another objective of these surveys was the evaluation of current deck mix design and construction practices in the state of New Jersey based on the survey results and the results reported in the literature. Based on this evaluation, recommendations with regard to material and mix design as well as construction practices were made to improve bridge deck performance. Another important objective of this field study was to help focus the efforts of the second part of the research study by narrowing down the list of important factors that need to be investigated in more detail. These are factors that either have not received proper attention during past research, as discussed, or are related to particular design and/or construction practice unique to the state of New Jersey. As it will be discussed, the surveys and subsequent evaluation of the data do indeed support the initial thrust of the research endeavor with regard to more emphasis on design factors. These factors were investigated in detail under this study using analytical and finite element analyses. Scope The field surveys included 24 bridges from central and northern New Jersey. 20 of those bridges surveyed were located in Mercer County while Bergen, Essex, Hunterdon and Monmouth Counties each had one bridge among the bridges surveyed. Figure 6 shows the geographical distribution of the surveyed bridges.
21

The bridge condition, with regard to transverse deck cracking, was not known prior to their selection. The only criteria used for selecting these bridges were span length (longer than 85 ft) and age (built after 1994 and considered new). Both prestressed and steel girder bridges were considered. Results showed that the inventory included both cracked and uncracked bridges. However, a majority of the bridges (18 bridges or 75 percent) were cracked. Table 1 shows the construction year of the bridges included in the survey.
Figure 6. Geographical distribution of bridges surveyed.
Table 1. Construction data for bridges surveyed.
Year Built 1995 1996 1997 1998 1999 2000 No. of Bridges 6 2 0 13 2 1
All bridges considered have composite decks. Eight of them have steel girders while the rest were supported on prestressed concrete girders. The surveyed bridges have various span lengths with the maximum span length of 175 ft. Most of them consisted of 1, 2 or 3 spans (83 percent), but it also included bridges with up to 12 spans. There were different support conditions among the bridges surveyed. There were 8 spans with simply supported steel girders and 17 continuous multiple spans with steel girders. Considering prestressed concrete girders, 11 spans were simply supported
22

and the rest of the spans (i.e., 43 spans) were continuous multiple spans. Note that continuous spans are continuous in interior spans only and the exterior supports are simply supported. Except for one bridge, all of the bridges were open to traffic at the time of the field survey. The field survey included visual walk-by evaluation, mostly of the top of the deck. During the field surveys, bridge decks were visually evaluated and the crack information (crack type, spacing, size and approximate location in the deck) were recorded qualitatively for each bridge. The survey logs also included information regarding bridge location, type, span number, span type, wearing surface and type of bearing. Furthermore, structural plans and construction and mix design information for the bridges were collected from NJDOT and important aspects of design and construction were determined for each bridge. The survey observations and collected data are reported individually for each bridge in appendix A.
Data Sources There were three major sources of data employed in development of the data base that was consequently used for statistical analysis. These are:
• Field survey forms. • Structural plans. • NJDOT Inspection/Testing datasheets.
Field Survey Form Figure 7 shows the visual bridge evaluation form, which was specifically developed for the field survey. Additional information, such as photos of cracks and structural components, was also collected for some of the bridges in conjunction with completing this form, which is all included in appendix A. However, the crack data and general information about the bridge were two main parts of information collected during the field surveys. Structural Plans Structural plans were another source of information. In coordination with NJDOT staff at the Bureau of Bridge Design, structural plans for all bridges were obtained and important design information such as bridge dimensions, deck details, and girder details were extracted.
23

Date of Evaluation: Region: Date Constructed: Number of Spans:
! Single ! Multiple Span
! Simply Supported ! Continuous
Degree of Skewness (quantify if possible):
! None (straight) ! Mild ! Severe
Type of Beam:
! Prestressed ! Steel ! Others
Deck Surface:
! Concrete ! Latex ! Unknown
Deck Surface Texture:
! Sawcut ! Turf Drug ! None – New Construction
Type of Bearings:
! Steel Bearings ! Elastomeric Pads ! Others:
Pictures/Video Available:
! Yes ! No
Additional Note:
Structure Location:
Type of Cracks (use additional forms for > 3 span):
Span 1 Span 2 Span 3
Transverse
Longitudinal
Others
Location of Cracks within the Deck:
Span 1 Span 2 Span 3
Center
End(s)
Others
Spacing of Cracks:
Span 1 Span 2 Span 3
0 – 2’ 3’ – 5’ > 5’
Irregular
Size of Cracks (quantify if possible):
Span 1 Span 2 Span 3
Hair Line
Typical
Wide
Team Members: 1. 2. 3. 4.
Figure 7. Visual bridge evaluation form.
24

NJDOT Inspection/Testing Datasheets These datasheets, which are completed during the construction, contain different data regarding construction and the mix design for each bridge. The results of the strength and slump tests are also reported on these forms. These forms are part of the documents that NJDOT holds for each bridge. Figure 8 shows a typical datasheet. One part of these forms is completed on the day of casting and the other parts are completed after conducting strength tests. Mix design, strength test results and temperature measurements are three important parts of these datasheets that were used in this study.
Figure 8. Typical NJDOT Inspection/Testing datasheet.
25

Database The information in the database (see appendix A) is divided into five major categories for each bridge. These are general information, structural design information, material properties and mix design information, construction information, and crack information. General Information This part of the database contains information regarding bridge location and construction year. This information is derived from the survey forms. Structural Design Information Using the structural plans, detailed information about the bridge design is extracted. These data include:
• Bridge dimensions. • Number of spans. • Traffic direction. • Girder type. • Span type (e.g., if continuous at interior spans or simply supported). • Span length and width. • Framing information (e.g., spacing of girders in each span). • Deck design information (i.e. rebar details, thickness, cover depth and wearing
surface). • Girder properties (e.g., area, depth, and moment of inertia). • Shear studs spacing.
Material Properties and Mix Design Information This information is derived from NJDOT Inspection/Testing datasheets. Important mix design information like water content, cement content, cement type, admixtures and slump are reflected in the database. Note that since during construction the slump is measured several times, the average value of these tests is taken as the representative value of the slump for the deck concrete during casting. Similarly, average compressive strength of all concrete deck specimens is reported as the compressive strength of the deck.
26

Construction Information In this part, based on the NJDOT Inspection/Testing forms, the average air temperature during the casting period and the average value of concrete temperature at the time of casting for all the measurement is reported as the representative values. Crack Information Crack information, which was recorded during the field surveys, is reported in this part. This information includes crack type, approximate crack location on the deck, crack spacing and its size. The database program Microsoft Access (MS Access, 2000) was used to store and organize the data. Microsoft Excel (MS Excel, 2000) program was mostly used for presentation and analysis of the data. These two software packages are also employed for statistical analyses. Charts are extensively used in presenting the result of analyses.
Evaluation of Survey Results Factors identified relevant to deck cracking are evaluated for all bridges surveyed and are compared with the results of other important researches (for an extensive literature review please refer to chapter two). Results of literature review were used in the selection of these factors. Of course, availability of data was another criterion in determining the factors considered. In the following sections these results are discussed and summarized using tables and graphs. However, the raw data for all bridges are reported in appendix A.
Structural Design Factors Design factors included in the survey are detailed in the appendix. These factors are as follows:
• Girder type. • End Condition. • Skewness. • Type of bearing. • Surface texture. • Wearing surface. • Deck thickness. • Bar size and spacing.
27

Girder Type Girder type is considered an important factor by various researchers. Some of the previous works, such as NCHRP Report 380 (Krauss and Rogalla, 1996) and Minnesota DOT’s research (French et al., 1999), show that decks supported on steel girders are more likely to crack than those supported on concrete girders. However, results of this study show that 94 percent of decks supported by prestressed concrete girders were cracked whereas only 38 percent of steel girder bridge decks cracked. The bias in this case is more likely due to the fact that a great number of bridges with prestressed concrete girders had more restraint (fixity) at their supports. This is a very important factor, as it will be discussed throughout this report. Nevertheless, the contradiction highlights the fact that there are other factors that play a significant role that complicate the problem. As it will be discussed, it appears that it is the relative stiffness of the deck with respect to the girder stiffness that is more important than the girder type. End Condition This study shows a good correlation between the end fixity and the cracking tendency of the bridge decks. As it is shown in figure 9, by increasing the fixity of the end supports the percentage of cracked decks increases. Note that with reference to this figure the continuous end condition refers to situations where the girder is continuous over internal supports. Fixed condition is when the abutment end is fixed (i.e., the end of the girder is built into the abutment wall or integral abutment). The term fixed end should be used with some caution here. Within the context of these data, this end condition refers to a situation as shown in figure 10. This type of construction, where the end diaphragm is cast around the girders, is quite rigid. This type of construction is typical construction for bridges built on Route 133. This type of construction is considered simply supported in design stage. As long as the diaphragm is uncracked, i.e., under low level of forces, the connection will act like fixed support. Probably for higher level of forces, such as ultimate, the diaphragm will crack and the girders will behave like simply supported beam as intended. It is difficult to determine the actual rotational stiffness provided by this type of diaphragm. However, under shrinkage stresses, which are much smaller than ultimate stresses, the connection quite likely acts like a fixed support. The effect of end condition will be discussed in more detail later in the report. Nevertheless, widespread cracking of bridges with similar end conditions, which actually prompted this research investigation, supports the pronounced effect of end conditions and rotational rigidity on transverse deck cracking.
28

SimplySupported
Mixed Continuous Fixed
0
10
20
30
40
50
60
70
80
90
100
Perc
ent c
rack
ed
End condition
Figure 9. Percent of cracked bridge decks with different end condition.
Figure 10. Boundary condition: girders are bounded.
29

Figure 11. Structural detail of the end condition shown in Figure 10.
NCHRP report 380 (Krauss and Rogalla, 1996), K-Tran (Schmitt and Darwin, 1999) and Minnesota DOT report (French et al., 1999) are among research studies that report increased cracking for fixed girders compared to those with pin-ended girders. Since the number of bridges surveyed is not enough, the effect of the end condition can’t be evaluated for different girder types but comparing the number of the continuous steel and prestressed concrete girder bridges shows that 100 percent of prestressed concrete girder bridges cracked whereas only 25 percent of those continuous bridges with steel girder cracked. However, this result is not reliable due to small number of bridges in the sample. Skewness There seems to be no direct relationship between the degree of skewness and the potential for transverse deck cracking. Figure 12 shows that the percentage of cracked bridge decks does not follow a consistent trend with respect to skewness. Considering the overall percentage of cracked bridge decks in this study which is equal to 75 percent, it seems that the data on the graph is just some variation with respect to this number which exists in any statistical analysis. Similar result is reported in NCHRP Report 380 (Krauss and Rogalla, 1996).
30

None Mild Severe
0
10
20
30
40
50
60
70
80
90
Perc
ent c
rack
ed
Skewness
Figure 12. Percent of cracked bridge decks with different skewness.
Type of Bearing There were two types of bearings in bridges surveyed, steel bearing and elastomeric pads. Elastomeric pads were only used with girders on Route 133 bridges where, as discussed, the end diaphragms were cast around the girders (see figure 10 and 11). The survey shows that all bridges with elastomeric pads are cracked but for steel bearings the percent of cracked bridge decks is 56. This could be due to the fact that probably steel bearings allow rotation more freely. Thus, it seems that the type of bearing may have an effect on transverse deck cracking. However, the result should be viewed with caution because the elastomeric pads were only used in bridges that also had a different end diaphragm as discussed under end condition. Surface Texture Since the dominant texture for bridges surveyed is saw-cut texture and there is only one bridge deck with another type of surface texture, comparison between different textures is not possible. Wearing Surface 80 percent of the surveyed bridges had concrete wearing surface whereas latex concrete was the wearing surface for the remaining bridge decks. 84 percent of the bridge decks with the concrete wearing surface were cracked while only 20 percent of the bridge decks with the latex concrete surface developed cracks. Thus, there is an indication that latex concrete can reduce the cracking but due to the small number of
31

bridges in the latex sample (five bridges), this result should be treated carefully and one cannot draw a general conclusion. Deck Thickness The average thickness of the cracked decks was about 8.75 in while this average for the uncracked bridge decks is around 9 in. This shows that an increase in the deck thickness reduces cracking. Similar results are also reported by other researchers (e.g., Krauss and Rogalla, 1996). Bar Size and Spacing All of the bridges surveyed use a mesh of #5 or #6 bars spaced 5 to 7 in as the top mesh (except in the negative moment areas). This study can’t identify any significant relationship between the bar size and bar spacing and transverse deck cracking in the range of available data. It is generally accepted that smaller bar size and closer spacing can reduce cracking. One Dimensional Model of Deck and Girder Based on the survey results it appears that the total stiffness of bridge and relative stiffness of deck and girder are important factors in transverse deck cracking. To further investigate the effect of bridge stiffness on transverse cracking, a one-dimensional finite element model is developed. Structural plan and design sheets for surveyed bridges were also reviewed. The results show that increasing the stiffness of bridge increases the possibility of deck cracking. The details of finite element study and its results are presented below. Objective: One-dimensional model is used to evaluate the response of the bridges under service condition. The most important response parameter of interest in this model is the maximum deflection under service condition. A one-dimensional linear model of one girder and effective portion of deck (AASHTO, 1998) is developed with ANSYS (V5.5, 1998) to investigate service response of bridges. Based on the structural plans of the bridge, this model is dimensioned and analyzed. Mesh and Elements: Beam elements are used to model the bridge. The span length is divided into 100 portions and each portion is modeled with beam element. Based on structural plans of bridge, composite moment of inertia of girder and effective portion of deck (AASHTO, 1998) are evaluated and specified through out the span length. Figure 13 shows the model.
32

Figure 13. One dimensional finite element model.
Boundary Condition: Based on the bridge being modeled, pin or roller boundary condition is applied on different nodes (figure 13). Material Properties: The only material property used in the one-dimensional model is elastic modulus. Elastic modulus of steel and concrete are considered to be 29E6 and 3.83E6 psi respectively. Loading: Based on AASHTO (LRFD, 1998) provisions, two types of loading should be considered for calculating maximum service load deflection; moving truckload and 25 percent of moving truckload plus lane load (figure 14). Based on AASHTO code, distribution factors equal to number of lanes divided by number of girders are multiplied to each loading case.
33

Figure 14. Modeling of traffic loads for 1D model.
The values of truck and lane loads used in analysis are based on AASHTO Articles 3.6.1.2.2 and 3.6.1.2.4. The truckload is moved throughout the span, using birth and death option of ANSYS to simulate moving truck. No dynamic effects are included directly. One-Dimensional Model Results The result of the one-dimensional analysis is compared to the AASHTO (LRFD, 1998) optional deflection limit of L/800 to study the effect of bridge stiffness on deck cracking. Thirteen bridges among surveyed bridges are modeled and analyzed in this part of study. Where available, the FEA calculated deflections are also compared to the deflections calculated on design sheets at design time of the bridge. Unfortunately the deflection check for all the bridges could not be retrieved. However, there is a good agreement between FEA results and calculated values where available. Figure 15 shows a microfilm picture of design sheets reviewed in this study to obtain design deflection values.
34

Figure 15. A picture of microfilm of design sheets.
Table 2 shows the summary of the analysis. Based on this table, the average ratio of actual to limit deflections for cracked bridges is 0.09 while this ratio for bridges without cracks is 0.20. This result suggests that as the stiffness of the bridge increases, the possibility of cracking also increases. The deflection L/800 limit can be set as benchmark to compare the stiffness of bridges, however since the study is based on a limited number of bridges, no particular ratio can be proposed for comparison.
Table 2. Results of 1D FEA
Row Bridge Name Description Span Length No. of No. of DF No. (mm) Lanes Girders 1 ST. # 1130-156 Ramp Span 1, Simple, G2 16404.19948 1 5 0.2 2 ST. # 1130-156 Ramp Span 2,3,4, Continuous, G7 46505.91 1 5 0.2 3 ST. #1103-158 Span 1, Simple, G2 31233.60 2 6 0.33 4 ST.#1013-151 Span 1, Simple, S3 40682.4147 2 7 0.29 5 ST.#1136-154 Span 2, Simple, 21S 42322.83465 2 5 0.4 6 ST.#1143-167 &168 Span 1, simple,G2 27279 2 5 0.4 7 ST.#1143-169 &170 Span 1,2,3 Continuous, G2 36576 2 5 0.4 8 ST.#1143-171 &172 Span 1,2 Continuous, G2 32000 3 6 0.5 9 ST#1143-173 Span 1,2 Continuous, G2 24840 2 6 0.33 10 ST#1143-174 &175 Span 1, Simple, G2 27430 2 5 0.4 11 ST#1143-176 & 177 Span 1,2,3, Continuous, G2 40538 2 5 0.4 12 ST#1130-154 Span 1,2 , Continuous, G102 52493.44 3 8 0.37513 ST#0206-165 Span1, Simple, G112 27482.8 3 7 0.43
35

Results of 1D FEA (Continued) Truck 25% Truck + Lane Final
Row Ix (Composite) ∆ ∆ ∆ L/800 Ratio Bridge Status No. (cm4) (mm) (mm) (mm) (mm) (actual/Limit) 1 1029986.27 3.28 1.670 3.28 20.51 0.16 Not Cracked 2 Variable 8.027 5.290 8.03 58.13 0.14 Not Cracked 3 Variable 12.07 8.287 12.07 39.04 0.31 Not Cracked 4 60760442.97 10.64 8.660 10.64 50.85 0.21 Not Cracked 5 Variable 12.3 10.280 12.30 52.90 0.23 Not Cracked 6 3186616.46 2.56 1.480 2.56 34.10 0.08 Cracked 7 6896776.47 5.49 2.910 5.49 45.72 0.12 Cracked 8 5973539.01 4.28 2.260 4.28 40.00 0.11 Cracked 9 3136103.71 2.52 1.170 2.52 31.05 0.08 Cracked 10 4919769.65 1.68 0.980 1.68 34.29 0.05 Cracked 11 7088042.67 4.56 3.880 4.56 50.67 0.09 Cracked 12 Variable 10.96 9.191 10.96 65.62 0.17 Not Cracked 13 Variable 13.66 8.79 13.66 34.35 0.40 Cracked
Material Properties and Mix Design Factors Based on the NJDOT Inspection/Testing datasheets that contain the information about mix design and construction practice, several material properties are extracted and used in the development of the database. The material properties that are recorded in the NJDOT Inspection/Testing datasheets and used in this study are:
• Cement Content. • Water Content. • Water cement ratio. • Air content. • Cement Type. • Slump. • Compressive strength. • Admixture.
Note that the range of data for these factors is quite narrow and this fact should be considered in interpreting the results. However, this may be a good thing and supportive of the research thrust on design factors. That is, the data are within a narrow band and most of them well within the recommended range made by other research. Still, a majority of the bridges have cracked supporting the fact that design factors play a significant role in causing and/or controlling transverse deck cracking. Cement Content The cement content in the deck concrete for bridges surveyed is in the range of 611 to 735 lb/yd3 with most of the bridge decks built with cement content of 700 lb/yd3 (19
36

bridges). This study shows that the cracking occurs on both decks with high cement content and low cement content, albeit within that narrow range. 80 percent of decks with cement content of 700 lb/yd3 or more cracked, whereas 50 percent of decks with lower cement content cracked. As for those 19 bridges with exactly 700 lb/yd3 cement content, 73 percent are cracked. Thus, there is an indication that lower level of cement content reduces cracking but considering the distribution of data (i.e., narrow range and the fact that majority had one cement content) this result cannot be emphasized. Other researchers also reported increased cracking with an increase in cement content, such as Krauss and Rogalla, 1996; French et al., 1999; Babaei and Purvis, 1996; Shmitt and Darwin, 1999. Water Content The water content for the deck concretes is between 31.5 lb/yd3 and 35 lb/yd3, where 19 bridge decks have water content of 31.8 lb/yd3 and water content for 23 decks is in the range of 31.5 lb/yd3 to 32.6 lb/yd3. The ratio of cracked bridges is 77 percent. Previous studies reported that cracking increases with an increase in water content (Krauss and Rogalla, 1996; Shmitt and Darwin, 1999; French et al., 1999; Babaei and Purvis ,1996), but due to the narrow range of data in this part no general conclusion can be made. Water Cement Ratio The w/c ratio for the bridges surveyed is between 0.44 and 0.36, where 19 bridges have w/c of 0.38. Again, due to the narrow range of data and their distribution this part is also inconclusive. But it should be noted that the range of the w/c ration in bridges surveyed more or less is in the range recommended by other researchers. Air Content The average air content for the bridge decks is in the range of 5.1 to 6.7. There is no indication of the effect of higher or lower air content on deck cracking in the bridges surveyed based on the results. Cement Type Type II cement is used in all decks for bridges surveyed. The cement manufacturer is also one company for 92 percent of bridges. Literature also recommends the use of type II cement to minimize transverse deck cracking. Slump The average slump of the concrete used in these bridge decks is in the range of 3 to 4 inches. Cracking is observed in decks with both high slump (4 in) and low slump (3 in). It seems that for the range of slump observed in these bridges, it has no effect on the transverse deck cracking.
37

Compressive Strength The compressive strength of the bridge decks is in the range of 4500 to 6623 psi, which is a broad range. The average compressive strength of un-cracked bridge decks is 5640 psi, whereas this average for cracked bridges is 5730 psi. This shows that cracked bridges have slightly higher compressive strength, which is in agreement with previous studies (e.g., Krauss and Rogalla, 1996). In fact comparing these strengths with the 4500 psi, which is the required strength for design, it is observed that the average compressive strength is about 1200 psi more than that specified in design. Reducing this margin, which partly means reducing cement content, may reduce the potential for deck cracking. Admixture Water reducer and air entraining agent is used in all bridges surveyed. Also, 79 percent of the deck bridges have retarder agent in their mix. There is no indication of increase or decrease in cracking because of the use of these admixtures.
Construction Techniques and Ambient Condition Factors All the data that are available and used in the development of the database are those provided on the Inspection/Testing sheets. Unfortunately, no documented data is available about curing method and time of curing, which are among the most important factors with regard to transverse deck cracking. Therefore, it may be a good practice to include more data on construction methods in the inspection and quality control forms. Among data that may be included are: wind velocity, humidity, curing method, curing period, and placement length. Note that measurement of humidity is required based on the NJDOT Specs (1998).
Thus, based on the available data, in this study the effect of the following factors are considered:
• Air and concrete temperature. • Month of placement.
Air and Concrete Temperature The study shows that the cracked bridge decks were cast in slightly higher temperatures and with slightly higher concrete temperatures. The average air temperature in the time of casting for cracked bridges is 64oF while this number is 60oF for uncracked bridges. Also, the average concrete temperature at the time of casting for uncracked bridges is 76oF, while this number is 73oF for uncracked bridges. Literature indicates (e.g., Babaei and Purvis, 1996) that placement of bridge decks in very hot and
38

very cold weather increases the possibility of cracking. However, the data show that none of the 24 bridges surveyed were cast in very hot or very cold weather. Month of Placement As it was just mentioned, literature indicates that deck placement in very hot and very cold weather increases transverse cracking. The month of placement can be a good indicator of this situation. The decks for none of the bridges surveyed were cast in the winter. Construction season for the bridges surveyed are as follow: 37.5 percent in the spring, 33.3 percent in the summer and 29.2 percent in the fall. 43 percent of bridge decks cast in the fall developed cracking, while this number is 75 and 89 for the bridges cast in the months of summer and spring, respectively. This can indicates that casting the decks in mild weathers can reduce the potential for deck cracking.
Remarks Review of the data collected and comparison with the literature and with the 1998 NJDOT Specs (1998) shows that many material and mix design recommendations are already satisfied. Due to the limitation of the data such a conclusion cannot be made with regard to construction factors. For example, it could not be determined if 7-day wet curing is employed. However, consistent with the literature recommendation, NJDOT Specs (1998) does require 7-day wet curing. This is a very important factor in controlling transverse deck cracking and every effort must be made to adhere to the Specifications. In summary, NJDOT Specs (1998) contains many of the recommendations made as results of prior research. There are also some factors consistent with research recommendation. For example, none of the bridges surveyed were cast in the winter and all surveyed bridge decks had relatively low w/c ratio. With regard to design and material property factors, higher compressive strength of the tested specimens compared to design value shows that the structural design requirement on the compressive strength could have been satisfied by the use of lower cement in the mix. Reducing the cement content in turn can reduce drying shrinkage, thermal shrinkage and temperature differentials during casting, which are believed to be the dominant causes of transverse cracking. Therefore, it is strongly recommended to reduce the cement content. Considering the design compressive strength of 4500 psi for bridge decks, this recommendation can still be satisfied quite easily. If the current guideline provides any incentive for higher than design compressive strength it should be revoked. It is also noticeable that except for high amount of cement content, other parameters included in the study satisfy recommendations made in the literature. Use of type II cement, adequate air content (>5 percent), satisfactory w/c ratio (<4.5 percent) and use of the water reducer and retarder agents are indications of good mix design as required by literature to reduce transverse cracking. Despite significant research work and enhanced knowledge on the effect of mix design and construction practice on concrete deck cracking, the current knowledge on the
39

effects of structural design factors on deck cracking is limited. The design recommendations proposed in the literature are mostly based on engineering judgment and have not been quantified in details through analytical and/or experimental studies. For example, it is accepted that reducing deck restraint or increasing deck thickness can reduce the possibility of deck cracking. However, no specific guidelines and/or values have been recommended. The observations of bridges on Route 133 (see figure 10 and 11), as mentioned in section 3.7, suggest that the design factors can be important in deck cracking. Note that the end diaphragms on all of these bridges are cast around the girders. As shown in figure 3.16, the cracks in these bridges are parallel to the bridge longitudinal axis and become normal to the axis as they propagate towards the center of the span. Considering the not so common design of the end diaphragms and its high rigidity compared to a pinned case, the question arises about the possible contribution of design factors to significantly increase transverse deck cracking. On the other hand, the same factors can be employed in a balanced design to provide remedies.
Figure 16. Rt. 133 bridge deck crack.
The observations made from the field survey of two parallel bridges crossing the Watson Creek (EB and WB) further support the need for more knowledge on the effects of structural design factors. These two bridges are almost identical and built on EB and WB sides of Route I-195. Structural designs as well as the mix designs for these two bridges are very similar to each other (see appendix A). During the surveys transverse cracks were observed on the eastbound side but the westbound side had no transverse deck cracking. Examination of the joint continuity for these two bridges showed that the joints on the westbound side were cracked, while the continuity joints on eastbound side
40

were intact (see figure 17 and 18). That is, the bridge with cracked joint (less rigidity/constraint) did not develop any cracking in the deck, while the one with uncracked joint (more rigid/restraint) did develop transverse deck cracking. These observations point to the role of structural design factors in deck cracking and the need for further research to enhance our knowledge on these factors.
Figure 17. Watson Creek Bridge (West Bound): Cracked continuity joints (bridge No.1130-152).
41

Figure 18. Watson Creek Bridge (East Bound): Un-cracked continuity joints (bridge No.1130-153).
42

CAUSES OF VOLUME CHANGE IN CONCRETE AND RESTRAINED SHRINKAGE TESTS
This chapter presents an overview of the causes of volume change in concrete relevant to bridge deck cracking. Effects of four types of shrinkage, ambient temperature changes, and creep are examined. Laboratory tests currently utilized to measure the cracking tendency of restrained concrete are introduced. The chapter concludes with a summary.
Volume Change and Cracking in Concrete Concrete cracks as a result of restraint volume change of concrete and this section describes the basic mechanisms of the volume change in concrete. There are seven basic causes of volume change in bridge deck concrete relevant to deck cracking; drying shrinkage, autogenous shrinkage, plastic shrinkage, thermal contraction, creep, ambient temperature changes, and solar radiation. Restraint of concrete during volume change causes cracking. Effect of restraint on bridge decks will be discussed comprehensively in the following chapters. As mentioned previously, this project focuses on alleviating the deck-cracking problem by reducing restraint of concrete deck through changes in design. It should be emphasized again that although the authors recognize the key role and importance of reducing volume change in concrete (as described herein) they also believe that, as a safeguard, current design of bridge decks can be improved to accommodate volume change of concrete with less cracking. Drying Shrinkage Drying shrinkage is the result of water loss of hardened concrete. Volume of concrete reduces as water withdraws from concrete. However, only part of (40-70 percent) the shrinkage is recoverable with future wetting cycles. Drying shrinkage depends on concrete properties. It is strongly influenced by w/c ratio, volume to surface ratio and cement content. Both ACI (Committee 209, 1978) and AASHTO (LRFD, 1998) codes provide equations for estimating drying shrinkage values as a function of time. These equations do not consider the effect of cement type and its composition where, as experimental results show, shrinkage strains are significantly influenced by cement properties (Burrows, 1998). Drying shrinkage in a restraint concrete can produce significant tensile stresses, which may result in cracking. Figure 19 shows a graph of drying shrinkage strains vs. time for different volume to surface ratios.
43

Figure 19. Drying shrinkage of concrete.
ACI (Committee 209, 1978) recommends the following equation for predicting drying shrinkage of concrete.
ushtsh titi
,, εα
ε+
= (1)
Where: =α 35 for moist cured concrete and 55 for steam cured concrete Time in days after measured after curing =ti =ush,ε Ultimate shrinkage=780E-6 in/in in standard condition The value of the ush,ε should be multiplied by following factors when other than standard conditions exist: For other than standard humidity a correction factor should be applies to equation.
For 40<H<80 Percent HK H 010.040.1 −= (2)
For 80<H<100 HK H 30.000.3 −= (3)
For curing period other than 7 days for moist cured concrete and 3 days for steam cured concrete multipliers in table 3 should be used. For v/s ratios (Volume to surface) other than 1.5” correction factor should be employed. vsK
)12.0exp(20.1svKvs −= <0.2 (4)
44

Table 3. Shrinkage correction factors for initial moist curing (AASHTO).
Moist Curing Duration (Days) Factor 1 1.2 3 1.1 7 1.0 14 0.93 28 0.86 90 0.75
ACI (Committee 209, 1978) also suggests a second method for computing where: vsK
tKvs 038.023.1 −= t>6” (5)
Where t is deck thickness. This equation is valid only during the first year of curing, which is the concern of this study. There are other factors for Slump, Cement Content, Air Content and Temperature. But ACI (Committee 209, 1978) states that for slump less than 5 in, fine aggregate between 40 to 60 percent, cement content between 470 and 750 lb/yd3, and air content less than 8 percent these factors are approximately equal to unity. Plastic Shrinkage and Plastic Settlement Plastic shrinkage and plastic settlement occur in plastic concrete. Plastic shrinkage is the result of excessive evaporation of water from concrete before hardening. The rapid evaporation of water from surface layer of concrete and the subsequent contraction of this layer causes tensile stress due to restraint from wet concrete layers below. This may result in plastic shrinkage cracks. Plastic settlement is caused by uneven settlement of fresh concrete over the obstructions like reinforcement (figure 20).
Figure 20. Crack in plastic concrete due to uneven settlement.
Prevention of plastic shrinkage and plastic settlement cracks is well understood. Plastic shrinkage is controlled by controlling the rate of evaporation of water from concrete.
45

The rate of water evaporation basically depends on wind velocity, air temperature, relative humidity, concrete temperature, cement content, and aggregate size. ACI monograph (Committee 308, 1986) can be used to estimate the rate of evaporation (figure 24). Special curing procedure should be applied when evaporation rate exceeds certain limits. Plastic settlement cracks can be eliminated by use of smaller reinforcements, and adequate and timely vibration of concrete. It is believed that the plastic settlement in decks produces weak planes over reinforcement, which may later crack by other effects. Autogenous Shrinkage Autogenous shrinkage is the concrete shrinkage without loss of water. This kind of shrinkage occurs at low w/c ratios and significantly increases with use of silica fume, HRWRAs (High Range Water Reducing Admixtures) and finer cement. In the past, this type of shrinkage was insignificant. However, with the downward trend of w/c ratio in concrete mixes, use of silica fume, finer cements, and widespread use of HRWRAs this type of shrinkage came into attention. Stresses produced by this type of shrinkage can add up to locked in stresses due to thermal contraction, drying shrinkage and ambient effects and may cause cracking. Paillere et al. (1989) measured the tensile stress produced in a test specimen as a result of autogenous shrinkage. They observed increasing stresses in concrete mixes with the same amount of cement (716 lb) but different w/c ratios and silica fume. Figure 21 shows their result.
Figure 21. Effect of w/c and silica fume on tensile stress produced by autogenous shrinkage of concrete (Paillere et al., 1989).
46
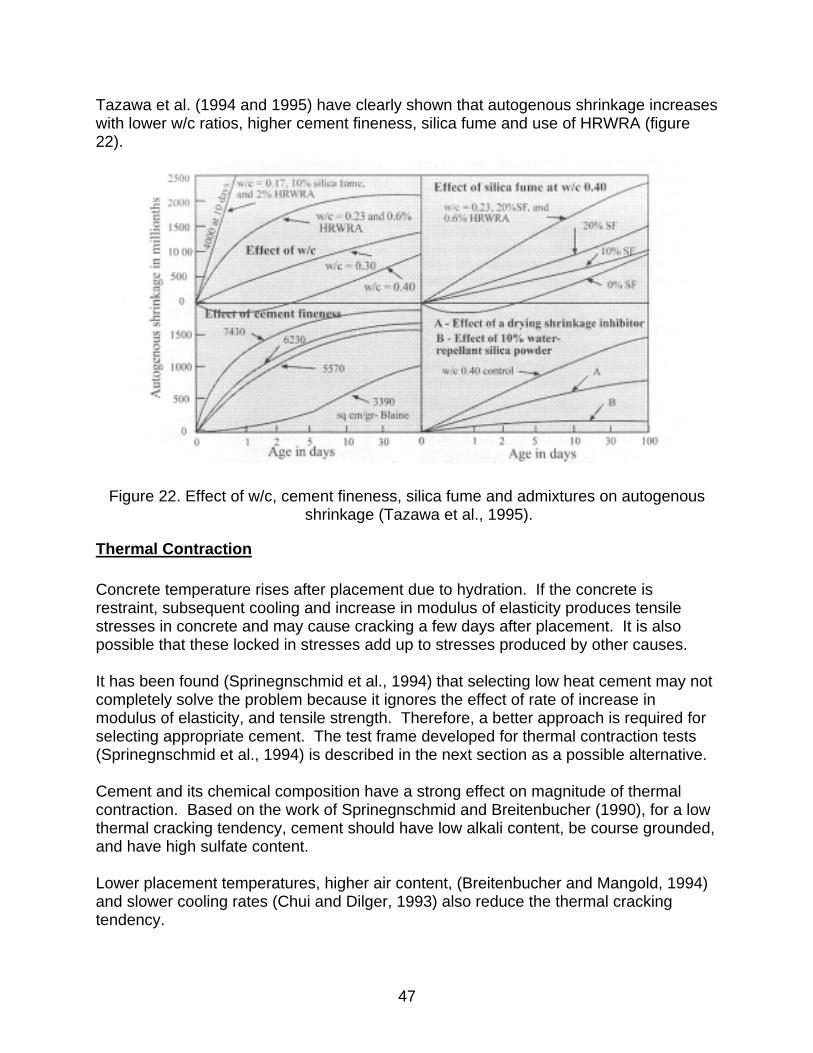
Tazawa et al. (1994 and 1995) have clearly shown that autogenous shrinkage increases with lower w/c ratios, higher cement fineness, silica fume and use of HRWRA (figure 22).
Figure 22. Effect of w/c, cement fineness, silica fume and admixtures on autogenous shrinkage (Tazawa et al., 1995).
Thermal Contraction Concrete temperature rises after placement due to hydration. If the concrete is restraint, subsequent cooling and increase in modulus of elasticity produces tensile stresses in concrete and may cause cracking a few days after placement. It is also possible that these locked in stresses add up to stresses produced by other causes. It has been found (Sprinegnschmid et al., 1994) that selecting low heat cement may not completely solve the problem because it ignores the effect of rate of increase in modulus of elasticity, and tensile strength. Therefore, a better approach is required for selecting appropriate cement. The test frame developed for thermal contraction tests (Sprinegnschmid et al., 1994) is described in the next section as a possible alternative. Cement and its chemical composition have a strong effect on magnitude of thermal contraction. Based on the work of Sprinegnschmid and Breitenbucher (1990), for a low thermal cracking tendency, cement should have low alkali content, be course grounded, and have high sulfate content. Lower placement temperatures, higher air content, (Breitenbucher and Mangold, 1994) and slower cooling rates (Chui and Dilger, 1993) also reduce the thermal cracking tendency.
47

Ambient Temperature Changes and Solar Radiation Daily temperature variations and solar radiation produces temperature differential throughout the section. Stresses produced by this temperature differential add up to the locked in stresses from different types of shrinkage. Similarly, seasonal variation of temperature can produce internal stresses. Figure 23 shows the temperature distribution across the depth of a composite beam obtained using a finite element analysis for hot weather (Emanuel and Hulsey, 1978). Similar results are also available for cold weather. AASHTO (LRFD, 1998) has recommendation for estimating temperature differentials in the deck-girder section for design purposes.
Figure 23. Temperature distribution across the section for hot weather (Emanuel and Hulsey, 1978).
Creep Creep is the property of concrete to deform with time under sustained stresses. Creep reduces stresses from sustained stresses, thus, reduces deck cracking. So, concrete with high creep tendency, especially during the first few months after casting, is desirable. High w/c ratio, low strength, and soft aggregates produce concrete with high creep. ACI (Committee 209, 1978) and AASHTO (LRFD, 1998) have equations for estimating creep strains as a function of time.
48

Bridge Deck Cracking Magnitude and time variation of different factors mentioned above determines the performance of a bridge deck vis-à-vis of cracking. Burrow (1998) describes the causes of 52 cracked bridge decks out of 100 surveyed by Krauss and Rogalla (1996) as follows:
• 22 cracked during first week: The cause must be thermal contraction plus (if w/c is below 0.5) autogenous shrinkage.
• 6 cracked in next six weeks: It is too late for thermal contraction and too early for drying shrinkage. Therefore, it must be autogenous shrinkage adding to the locked in stresses from thermal contraction.
• 8 cracked with in a year: Probably stresses from drying shrinkage adding to the locked in stresses from thermal contraction and autogenous shrinkage that have not been relieved by creep.
• 16 cracked after one year: Drying shrinkage is taking its toll.
Restrained Shrinkage Tests Restraint shrinkage tests evaluate the cracking resistance of cement or concrete. Any cement or concrete can be evaluated by comparing the test values against an established evaluation criterion. These tests have been used in many countries such as France, Canada, Japan, and Germany to control concrete cracking, but very few have been used in the U.S. Several testing devices with different dimensions, configuration, and objectives have been developed so far. However, all of these devices pursue the common goal of classifying cements/concretes based on their cracking tendency. These devices fall into two main categories: Ring Tests Ring test was invented by Roy Carlson (1942) of MIT to measure cracking resistance to shrinkage. In this test cement mortar or concrete is cast around a steel ring and the time to occurrence of first crack is measured. The elapsed time until occurrence of first crack is used as a measure of cracking tendency of cement. Based on the purpose of the test, curing and temperature changes may be introduced. Figure 24 shows different sizes of this device used by different researchers. Figure 25 show a picture of the ring used by Krauss and Rogalla (1996) Different methods are used to record cracking time. Visual inspection is the most basic method. Blaine (1953) applied a conducting paint to the ring and recorded the crack time by measuring the voltage change applied to the paint. Krauss and Rogalla (1996) installed strain gages on the inside of the steel tube and captured cracking time as
49

sudden change in strain readings. Nowadays, different technologies are available for capturing cracking time. Figure 26 shows the recommended criteria based on Blaine’s work for crack resistant cement (Burrows, 1998). Ring tests provide valuable information on cracking tendency. However, there are two drawbacks. Ring tests do not fully restrain the cement mortar or concrete due to friction at the interface of cement and steel. Furthermore, there is no direct method of measuring stresses in concrete.
50

Figure 24. Ring test apparatus used by different researchers (Burrows, 1998).
51
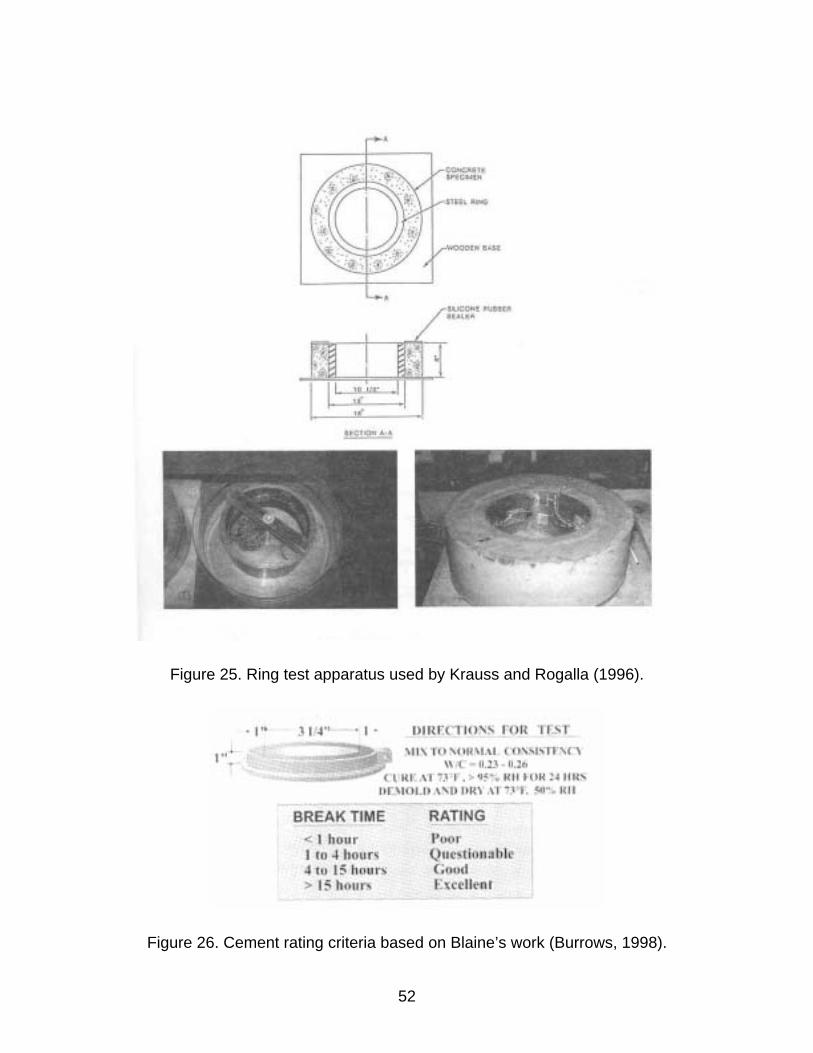
Figure 25. Ring test apparatus used by Krauss and Rogalla (1996).
Figure 26. Cement rating criteria based on Blaine’s work (Burrows, 1998).
52

Bar Tests In this test concrete or cement mortar is cast in the shape of a bar and is held by two grips at both ends to create restrained condition. The cracking tendency is expressed in terms of level of tensile stress in the specimens as a result of shrinkage. Figure 27 shows the apparatus used in these tests. In a new version of this test, which was developed in Germany, two invar bars are used to connect the grips together. In this frame-like apparatus, stress is measured indirectly by measuring stress in the invar bars (figure 28). Using this frame, a test method has been developed in the University of Munich (Sprinegnschmid et al., 1994) to investigate thermal contraction. In this method, without the application of any external heat or cooling, concrete is cooled down to ambient temperature during 4 days. If the concrete has not cracked during 4 days, it is then cooled down artificially at a rate of 1.8 F per hour. The specific temperature at which cracking occurs is defined as cracking temperature. Figure 29 shows typical results of this test. Bar Tests can be used to measure thermal contraction, autogenous shrinkage and drying shrinkage in a more realistic manner than ring tests. Through the use of controlled environment and specimen size, it is also possible to separate different types of shrinkage more easily and measure them independently.
53

Figure 27. Bar test for studying cracking tendency of concrete (from Burrows, 1998).
54

Figure 28. Cracking frame developed in Germany (from Burrows, 1998).
Figure 29. Typical results of cracking frame test (from Burrows, 1998).
55

FINITE ELEMENT ANALYSIS This chapter describes development of several finite element (FE) models to study different aspects of transverse deck cracking and presents results of the analyses. Objectives and details of implementation for each model are presented. Effect of different design factors on stresses causing transverse cracking is studied using a 2D FE model. A nonlinear 3D FE model is used to model cracking and study crack patterns on concrete bridge deck with different boundary conditions.
Two-Dimensional Model of Deck and Girder Two-dimensional finite element model is used to study the effect of several design factors on transverse bridge deck cracking caused mainly by drying shrinkage. A linear plane stress model of a single girder and the tributary deck with its reinforcements is developed using ANSYS (V5.5, 1998). Geometric and design information used in development of the finite element model (table 4) corresponds to one of the bridges surveyed (i.e., Hackensack Ave over NJ Route 4). This bridge was built in 1998 in Bergen County, New Jersey. It is a 2-span simply supported bridge on steel girders. The 2 spans are similar in design. This bridge has shown cracking all over both spans.
Table 4. Geometric and design information for the bridge modeled (Hackensack Ave over NJ Route 4).
Span Length 1082” Span Width 564” Girder Spacing 7 Girders@7’-1” Deck thickness 8.5” Longitudinal Bars #5@6”(B), #5@15”(T) Transverse Bars #6@7”(T&B) Girder Bottom Flange Thickness 2” Girder top Flange Thickness 1.25” Girder Bottom Flange Width 24” Girder Bottom Top Width 20” Girder Web Thickness 1” Girder Web Height 35.25” Shear Stud Spacing 12” (Midspan@71’) 9” (Support@18’)
The choice of plane stress model is made after detailed 3D FE analysis of the same bridge structure. Since it is computationally expensive to model and analyze a complete bridge structure in detail, usually a single girder and the corresponding portion of the deck are modeled and analyzed. As a single girder and its tributary deck are considered separate from the rest of the structure, it is required to somehow take into account the effect of the adjacent portion of the structure. Figure 30 shows typical girder and deck bridge cross sections and highlights the single girder and its deck, which is modeled. To determine the correct type of finite element model that can be used to model the single girder and its deck a detailed 3D FE model was developed and
56

analyzed. Results of this analysis showed that 2D plane stress and 3D stand alone models of single girder and its tributary deck are good approximations.
Portion to be modeled in detail
Figure 30. Cross-section of typical slab-on-girder bridge superstructure.
The 3D model is shown in figure 31, which is the right portion of a bridge with a cross section shown in figure 30. The girders are modeled using elastic shell elements and the deck is modeled with elastic solid elements. Since the overall nature of superstructure response is being investigated the reinforcements are not modeled and full composite action is assumed (i.e., deck and girder nodes are connected). Diaphragms are also modeled using truss elements. Their location and dimensions are chosen based on structural plans. Elastic modulus of steel and concrete are assumed to be equal to: 29E6 psi and 3.83E6 psi, respectively.
Figure 31. Finite element model of deck, girders and diaphragms.
The span modeled is simply supported. So the nodes on the bottom flange of the girders at one end are restrained in three directions and at the other end are only restrained in transverse and vertical directions. It is assumed that due to symmetry of
57

the system, the middle girder will not have displacement in the X direction (transverse direction). Consequently, one end of the diaphragms, which are connected to middle girder, are restrained. Figure 32 shows the graph of required lateral nodal forces to move the edge of the deck in figure 31, 2.5-cm (1-in) toward the center of the bridge. These values are obtained by specifying uniform unit displacement on the edge nodes of the deck and obtaining the restraining forces at each node. It can be said that these forces would be applied on the single girder and its tributary deck model provided that they have the same 2.5 cm (1 in) displacement. If the single girder and its deck were completely restrained by the adjacent structure (figure 31) the required force at each node of figure 31 should be:
KNEAE ElementElement 320056.022.0626 =××= (6)
Where (26E6-KN) is element modulus of elasticity, is element area. 0.22-m (8.5-inch) is deck thickness and 0.56-m (22-inch) is element length. Considering the relative magnitude of actual forces in figure 32 compared to equation 1 result (3200-KN vs. 400KN), it can be concluded that the restraining effect of girders on each other in the lateral direction is negligible. This means that plane stress elements can be used in 2D models and that stand-alone 3D models are good approximations.
ElementE ElementA
0
2000
4000
6000
8000
10000
12000
14000
0 20 40 60 80 1
Length Ratio From One End(Percent)
Forc
e(K
N)
00
Figure 32. Lateral nodal forces along the deck assuming uniform displacements.
Since it is shown that it is justifiable to use plane stress 2D model to study the behavior of a single girder and its corresponding deck, the details of 2D FE model will be presented.
58

2D Model Details Deck and Girder Elements: One girder and tributary deck are modeled using plane stress elements. The span is divided into 50 sections along its length. The deck and girder are modeled with 3 and 5 elements through the depth, respectively. The thickness of plane stress element is varied according to actual thickness of deck and girder flange/web in the transverse direction. Figure 33 shows the FE model a close up view of it. Reinforcement Elements: The two layers of longitudinal reinforcement are modeled with truss elements. These elements are placed along the boundary of the deck plane stress elements at two different depths within the deck and are connected to the same nodes as plane stress deck elements. Based on the design detail for the bridge being modeled, total area of truss elements is chosen equal to total area of longitudinal reinforcements at the corresponding depth.
Figure 33. Two-dimensional (2D) finite element model.
Boundary Conditions: Based on the case being considered, different boundary conditions are applied on different nodes or set of nodes. A roller support is modeled by restraining the bottom node of the girder in a vertical direction. A pin support is modeled by restraining the bottom node of the girder in the vertical and horizontal
59

directions. To model a fixed end, all nodes at the cross section are restrained from moving in all directions. Figure 33 shows a girder with pin and roller supports. Modulus of Elasticity: Elastic modulus of steel and concrete are assumed to be equal to: 29E6 psi and 3.83E6 psi, respectively. Steel and Concrete Coefficient of Thermal Expansion: Winter and Nilson (1986) state that the concrete coefficient of thermal expansion should be in the range of 4E-6 to 7E-6 in/in per degree of Fahrenheit. Khan, Cook, and Mitchell (1998) measure the values of 5.3e-6 to 5.5e-6 in/in per oF for maturing normal weight concrete. In this study the values of 5.5E-6 and 6.25E-6 in/in per oF are assumed for concrete and steel, respectively. Loading: Based on the case under consideration several types of loading are considered for each analysis, which are described in a case-by-case basis.
60

Results of Two Dimensional Analyses Effects of several design factors on stresses causing transverse cracking are studied in this section. The design parameters of the base model (shown in table 4) have been changed to study their effect on the stresses causing transverse cracking (deck longitudinal stress, i.e. Sxx component of stress in figure 31). Effect of Boundary Condition Increasing boundary condition restraint of deck and girder system increases tensile stress produced in the deck, which may ultimately cause cracking. Figure 34 and table 5 show the deck top and bottom stresses caused by 10oF temperature decrease in the deck, while rebar temperature is held constant. This temperature decrease models the effect of uniform shrinkage strain equal to 5.5E-5 or 55 microstrain.
Figure 34. Deck bottom and top stresses caused by 55-microstrain uniform deck shrinkage for different boundary conditions.
Table 5. Deck top and bottom tensile stresses caused by 55-microstrain uniform deck shrinkage for different boundary conditions.
Boundary Condition (Section) Deck Bottom Stress (psi)
Deck Top Stresses (psi)
Pin – Roller (Mid Section) 72.59 36.17 Pin – Pin (Mid Section) 71.86 40.94 Three Span Continuous (Over Support) 121.21 131.25 Two Span Continuous (Over Support) 130.84 155.35 Fixed – Roller (8%L From End Section) 131.40 145.81 Fixed – Pin (8%L From End Section) 182.74 208.80 Fixed – Fixed (8%L From End Section) 210.30 210.30
61
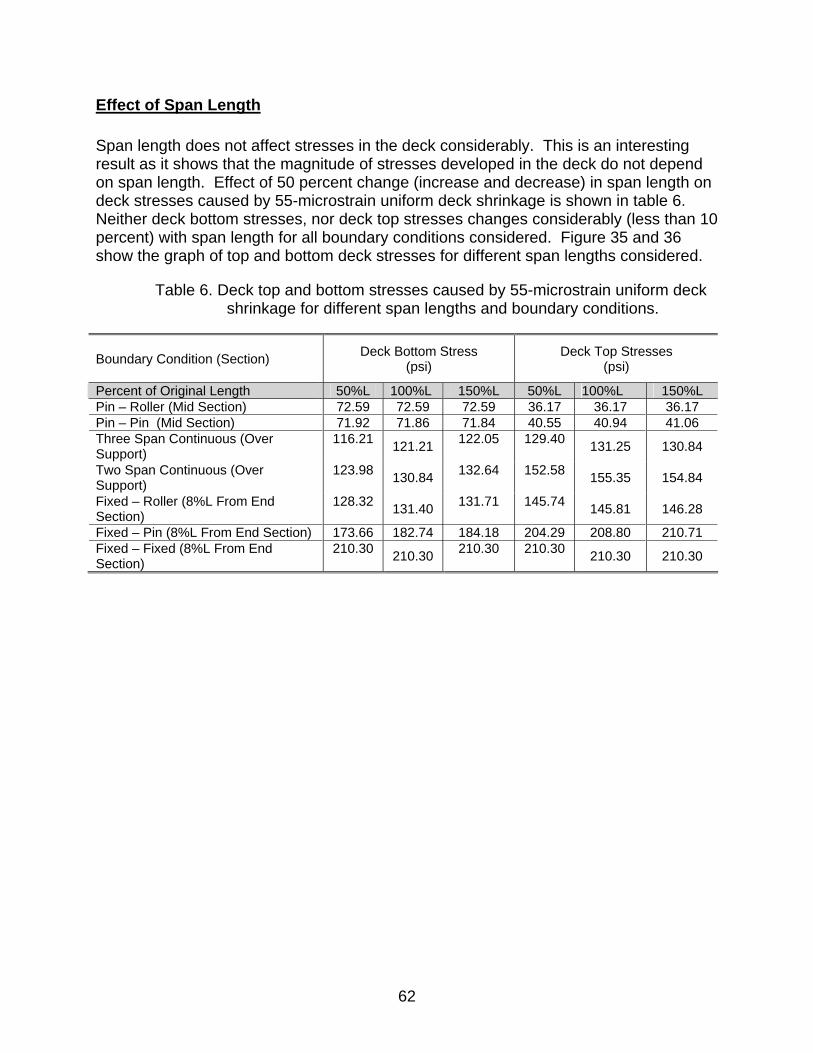
Effect of Span Length Span length does not affect stresses in the deck considerably. This is an interesting result as it shows that the magnitude of stresses developed in the deck do not depend on span length. Effect of 50 percent change (increase and decrease) in span length on deck stresses caused by 55-microstrain uniform deck shrinkage is shown in table 6. Neither deck bottom stresses, nor deck top stresses changes considerably (less than 10 percent) with span length for all boundary conditions considered. Figure 35 and 36 show the graph of top and bottom deck stresses for different span lengths considered.
Table 6. Deck top and bottom stresses caused by 55-microstrain uniform deck shrinkage for different span lengths and boundary conditions.
Boundary Condition (Section) Deck Bottom Stress (psi)
Deck Top Stresses (psi)
Percent of Original Length 50%L 100%L 150%L 50%L 100%L 150%L Pin – Roller (Mid Section) 72.59 72.59 72.59 36.17 36.17 36.17 Pin – Pin (Mid Section) 71.92 71.86 71.84 40.55 40.94 41.06 Three Span Continuous (Over Support)
116.21 121.21 122.05 129.40 131.25 130.84
Two Span Continuous (Over Support)
123.98 130.84 132.64 152.58 155.35 154.84
Fixed – Roller (8%L From End Section)
128.32 131.40 131.71 145.74 145.81 146.28
Fixed – Pin (8%L From End Section) 173.66 182.74 184.18 204.29 208.80 210.71 Fixed – Fixed (8%L From End Section)
210.30 210.30 210.30 210.30 210.30 210.30
62

Figure 35. Deck bottom stresses caused by 55-microstrain uniform deck shrinkage for different span lengths and boundary conditions.
Figure 36. Deck top stresses caused by 55-microstrain uniform deck shrinkage for different span lengths and boundary conditions.
63

Effect of Deck Thickness Increasing deck thickness reduces deck stresses for all except fixed-fixed boundary conditions. Thus, thicker decks are preferred over thinner decks with respect to transverse cracking. However, practical limits of deck thickness should be considered. Table 7 shows effect of thickness on deck stresses due to shrinkage. Concrete cover is held constant while deck thickness is changed. Figure 37 and 38 show graphically the effect of deck thickness on bottom and top stresses for different boundary conditions. These stresses are produced by 55-microstrain uniform concrete deck shrinkage.
Figure 37. Deck bottom stresses caused by 55-microstrain uniform deck shrinkage for different deck thickness and boundary conditions.
64

Figure 38. Deck top stresses caused by 55-microstrain uniform deck shrinkage for different deck thickness and boundary conditions.
Table 7. Deck top and bottom stresses caused by 55-microstrain uniform deck shrinkage for different deck thickness and boundary conditions.
Boundary Condition (Section) Deck Bottom Stress (psi)
Deck Top Stresses (psi)
Deck Thickness 7” 8.5” 10” 7” 8.5” 10” Pin – Roller (Mid Section) 78.25 72.59 69.11 49.66 36.17 24.98 Pin – Pin (Mid Section) 78.17 71.86 67.72 53.88 40.94 30.22 Three Span Continuous (Over Support)
132.38 121.21 111.41 139.96 131.25 123.51
Two Span Continuous (Over Support)
143.60 130.84 119.32 163.06 155.35 148.61
Fixed – Roller (8%L From End Section)
143.17 131.40 120.81 154.41 145.81 138.40
Fixed – Pin (8%L From End Section) 192.30 182.74 173.14 212.01 208.80 205.86 Fixed – Fixed (8%L From End Section)
210.30 210.30 210.30 210.30 210.30 210.30
Effect of Girder Spacing Increasing the girder spacing will reduce deck stresses produced by volume change of concrete in all but fixed-fixed deck girder system.
65

Table 8 shows results of the finite element analysis for the example bridge with 50, 100, and 150 percent of original spacing and different boundary conditions. These stresses are for 55-microstrain uniform concrete shrinkage. Figure 39 and 40 show deck top and bottom stresses for different spacing and boundary conditions.
Table 8. Deck top and bottom stresses caused by 55-microstrain uniform deck shrinkage for different girder spacing and boundary conditions.
Boundary Condition (Section) Deck Bottom Stress (psi)
Deck Top Stresses (psi)
Percent of Original width 50%W 100%W 150%W 50%W 100%W 150%W
Pin – Roller (Mid Section) 100.63 72.59 59.73 71.53 36.17 20.32 Pin – Pin (Mid Section) 100.93 71.86 58.41 76.49 40.94 24.47 Three Span Continuous (Over Support)
156.72 121.21 97.98 163.98 131.25 108.95
Two Span Continuous (Over Support)
168.75 130.84 104.83 187.53 155.35 132.10
Fixed – Roller (8%L From End Section)
167.49 131.40 69.96 179.02 145.81 122.49
Fixed – Pin (8%L From End Section) 206.17 182.74 161.28 224.57 208.80 192.29 Fixed – Fixed (8%L From End Section)
210.30 210.30 210.30 210.30 210.30 210.30
Figure 39. Deck bottom stresses caused by 55-microstrain uniform deck shrinkage for different girder spacing and boundary conditions.
66

Figure 40. Deck top stresses caused by 55-microstrain uniform deck shrinkage for different girder spacing and boundary conditions.
Effect of Relative Flexibility of Girder to Deck Increasing the ratio of girder to deck moment of inertia increases deck stresses for all but fixed-fixed boundary condition. Table 9 shows deck stresses for different boundary conditions and three different ratios of girder to deck moment of inertia, while composite section moment of inertia is held constant. In other words all the sections have the same composite section stiffness, however, contribution of deck and girder is different. Deck thickness and girder height are changed to obtain different relative flexibility but equal composite section inertia. All other aspects of design are held constant. Table 10 shows contribution of deck and girder in each case and the corresponding deck thickness and girder height. Concrete cover is held constant while deck thickness is changed. Figure 41 and 42 show the graph of deck top and bottom stresses for different boundary conditions and various ratios of girder to deck moment of inertia. These results show that for all but fixed-fixed boundary condition, the potential for deck cracking reduces as the ratio of girder to deck moment of inertia decreases. Since composite section moment of inertia is held constant, change in relative stiffness (flexibility) will not affect bridge serviceability requirements while reducing deck-cracking potential. There is no change in stresses for fixed-fixed boundary condition.
67

Table 9. Deck top and bottom stresses caused by 55-microstrain uniform deck shrinkage for different ratio of girder/deck moment of inertia and boundary
conditions.
Boundary Condition (Section) Deck Bottom Stress (psi)
Deck Top Stresses (psi)
Ratio of Girder to Deck Inertia 4.13 6.18 9.66 4.13 6.18 9.66 Pin – Roller (Mid Section) 70.16 72.59 76.19 27.34 36.17 45.97 Pin – Pin (Mid Section) 68.89 71.86 75.99 32.49 40.94 50.33 Three Span Continuous (Over Support)
113.10 121.21 128.25 125.28 131.25 137.15
Two Span Continuous (Over Support)
122.25 130.84 139.91 150.64 155.35 160.52
Fixed – Roller (8%L From End Section)
123.47 131.40 139.80 140.49 145.81 151.70
Fixed – Pin (8%L From End Section) 175.70 182.74 189.61 207.13 208.80 210.67 Fixed – Fixed (8%L From End Section)
210.30 210.30 210.30 210.30 210.30 210.30
Figure 41. Deck bottom stresses caused by 55-microstrain uniform deck shrinkage for different ratio of girder/deck moment of inertia and boundary conditions.
68

Figure 42. Deck top stresses caused by 55-microstrain uniform deck shrinkage for different ratio of girder/deck moment of inertia and boundary conditions.
Table 10. Different ratio of girder/deck moment of inertia used in calculation and corresponding deck and girder dimensions.
Section Number
Deck Thickness
(in)
Web Height(in)
Deck Inertia
(in4)
Girder Inertia
(in4) Composite Inertial (in4)
Girder/Deck Ratio
1 7.5 36.474 2988 28855 64853.1 9.66 2 8.5 35.25 4350 26876 64852.5 6.18 3 9.5 34.1 6073 25089 64852.8 4.13
Effect of Composite Section Moment of Inertia Increasing composite section moment of inertia increases deck stresses slightly for all except fixed-fixed and fixed-pin boundary conditions. Composite section moment of inertia is varied by changes in web height as shown in table 11. The deck top and bottom stresses are shown in table 12 and figure 43 and 44.
Table 11. Different ratio of composite moment of inertia used in calculation and corresponding deck and girder dimensions.
Section Number
Web Height (in)
Composite Inertial (in4) %
1 33.25 58415.8 90 2 35.25 64852.5 100 3 37.25 71666.6 110.5
69

Table 12. Deck top and bottom stresses caused by 55-microstrain uniform deck shrinkage for different composite moment of inertia and boundary conditions.
Boundary Condition (Section) Deck Bottom Stress (psi)
Deck Top Stresses (psi)
Composite Moment of Inertia 90% 100% 110.5% 90% 100% 110.5% Pin – Roller (Mid Section) 72.59 72.66 34.19 72.59 36.17 Pin – Pin (Mid Section) 71.70 71.86 72.08 39.06 40.94 42.70 Three Span Continuous (Over Support)
119.33 121.21 121.38 130.32 131.25 131.52
Two Span Continuous (Over Support)
129.55 130.84 132.07 155.14 155.35 155.58
Fixed – Roller (8%L From End Section)
130.16 131.40 132.59 145.35 145.81 146.30
Fixed – Pin (8%L From End Section) 181.76 182.74 183.64 209.32 208.80 208.35 Fixed – Fixed (8%L From End Section)
210.30 210.30 210.30 210.30 210.30 210.30
38.03
Figure 43. Deck bottom stresses caused by 55-microstrain uniform deck shrinkage for different composite moment of inertia and boundary conditions.
70

Figure 44. Deck top stresses caused by 55-microstrain uniform deck shrinkage for different composite moment of inertia and boundary conditions.
Effect of Amount of Longitudinal Reinforcement Increasing the area of longitudinal reinforcement increases the deck stresses for pin-roller and pin-pin spans. There is no significant change in stress for other boundary conditions. These results show that contrary to what is generally believed, increasing the amount of reinforcement not only will not reduce deck stresses prior to cracking, but also in some cases increases deck stresses. Table 13 shows effect of 50 percent increase and decrease in rebar area on deck stresses from 55-microstrain uniform shrinkage. 50 percent change in rebar area corresponds approximately to increasing rebar number by 1 size (say from #4 to #5). For comparison, a theoretical deck with zero reinforcement is also analyzed. These results are shown in table 14. Figure 45 and 46 show the results in graphical format.
71

Table 13. Deck top stresses caused by 55-microstrain uniform deck shrinkage for different area of longitudinal reinforcement and boundary conditions.
Boundary Condition (Section) Deck Bottom Stress (psi)
Deck Top Stresses (psi)
Percent of Original Reinforcement Area
50%Ar 100%Ar 150%Ar 50%Ar 100%Ar 150%Ar
Pin – Roller (Mid Section) 69.26 72.59 75.52 32.36 36.17 39.82 Pin – Pin (Mid Section) 68.81 71.86 74.79 37.20 40.94 44.51 Three Span Continuous (Over Support)
120.09 121.21 122.30 129.97 131.25 131.85
Two Span Continuous (Over Support)
130.14 130.84 131.53 155.10 155.35 155.61
Fixed – Roller (8%L From End Section)
130.66 131.40 132.14 145.36 145.81 146.26
Fixed – Pin (8%L From End Section) 183.27 182.74 182.25 209.74 208.80 207.91 Fixed – Fixed (8%L From End Section)
210.30 210.30 210.30 210.30 210.30 210.30
Table 14. Deck top stresses caused by 55-microstrain uniform deck shrinkage for zero area of longitudinal reinforcement and boundary conditions.
Boundary Condition (Section) Deck Bottom Stress (psi)
Deck Top Stresses (psi)
Pin – Roller (Mid Section) 66.32 28.37 Pin – Pin (Mid Section) 65.62 33.30 Three Span Continuous (Over Support) 118.95 129.38 Two Span Continuous (Over Support) 129.45 154.88 Fixed – Roller (8%L From End Section) 129.91 144.92 Fixed – Pin (8%L From End Section) 183.85 210.74 Fixed – Fixed (8%L From End Section) 210.30 210.30
72

Figure 45. Deck bottom stresses caused by 55-microstrain uniform deck shrinkage for different area of longitudinal reinforcement and boundary conditions.
Figure 46. Deck top stresses caused by 55-microstrain uniform deck shrinkage for different area of longitudinal reinforcement and boundary conditions.
73

Effect of Distribution of Longitudinal Reinforcement Changing the distribution pattern of total reinforcement area among top and bottom reinforcement does not seem to change the deck stresses. In other words, for the same amount of reinforcement in the section, increasing top or bottom reinforcement does not change the deck stresses. Table 15 shows the effect of longitudinal reinforcement distribution on deck stresses produced by 55-microstrain uniform shrinkage. Keeping the total amount of reinforcement constant, 25 percent of total reinforcement is moved from bottom to top and vice versa. Figure 47 and 48 illustrate the effect of changing the pattern of longitudinal reinforcement distribution on deck stresses.
Figure 47. Deck bottom stresses caused by 55-microstrain uniform deck shrinkage for different distribution of longitudinal reinforcement and boundary conditions.
74

Figure 48. Deck top stresses caused by 55-microstrain uniform deck shrinkage for different distribution of longitudinal reinforcement and boundary conditions.
Table 15. Deck top and bottom stresses caused by 55-microstrain uniform deck shrinkage for different distribution of longitudinal reinforcement and boundary
conditions.
Boundary Condition (Section) Deck Bottom Stress (psi)
Deck Top Stresses (psi)
Location of Reinforcement Increase Bottom None Top Bottom None Top Pin – Roller (Mid Section) 72.26 72.59 72.92 35.66 36.17 36.68 Pin – Pin (Mid Section) 71.55 71.86 72.18 40.54 40.94 41.33 Three Span Continuous (Over Support)
121.28 121.21 121.13 131.38 131.25 131.13
Two Span Continuous (Over Support)
131.02 130.84 130.66 155.66 155.35 155.04
Fixed – Roller (8%L From End Section)
131.53 131.40 131.27 146.01 145.81 145.61
Fixed – Pin (8%L From End Section) 182.84 182.74 182.64 208.96 208.80 208.63 Fixed – Fixed (8%L From End Section)
210.30 210.30 210.30 210.30 210.30 210.30
75

Effect of Girder Shoring During Construction Temporary shoring during construction reduces the stresses in the concrete deck significantly and even induces some compressive stress for pin-roller and pin-pin boundary conditions. However, temporary shoring for other boundary conditions does not have a beneficial effect on deck stresses as the dead load produces additional tensile stresses in the deck upon removal of the shoring. If the girder is shored during deck pouring and curing, the dead load of concrete is carried by composite section after removal of shoring. Table 16 shows the dead load stresses produced in the deck for simply supported girder (tension is positive). Compressive stresses in the deck provide additional safety against deck cracking. In other words, tensile stresses produced by concrete volume change should be much larger for a shored construction compared to an un-shored one in order to crack the concrete deck. However, for other types of boundary conditions, the dead load induces tensile stresses in some regions and may worsen the problem of cracking.
Table 16. Deck top and bottom stresses caused deck dead load.
Boundary Condition (Section) Deck Bottom Stress (psi)
Deck Top Stresses (psi)
Pin – Roller (Mid Section) -175.43 -331.85 Pin – Pin (Mid Section) -185.07 -268.72 Effect of Pouring Sequence Properly selected pouring sequence reduces the possibility of cracking by inducing compressive stress in the deck. As a general rule, positive moment sections should be placed first followed by negative moment sections. Figure 49 shows the recommended pouring sequence for different boundary conditions. In each case, the numbers on the top of the deck show the pouring sequence of deck concrete and the length of pour is indicated at the bottom of girder. As it is illustrated in figure 49, the middle half of each span is placed first and then the remaining portion is placed in the sequence shown. Tables 17 through 25 show the residual stresses in the deck as a result of pouring sequence shown in figure 49. These results show that considerable stress is produced in the deck depending on the sequence of pouring. As a general rule to minimize the tensile stresses and maximize the compressive strength in the deck in single span bridges, positive moment portions should be poured first, followed by negative moment sections. In multi-span bridges, the whole span should be placed in one pour. Since this is not practical in most cases, the pouring sequence as depicted in figure 49 is suggested.
76

12 13 212 3
514 2 36 7
3 1 2 13 24 521
3
3
a) b) c)
d) e) f)
g)
Figure 49. Suggested pouring sequence and lengths for different boundary conditions.
Table 17. Residual top and bottom deck stresses caused by pouring sequence (a) for pin-roller boundary condition.
Pin – Roller Boundary Condition Deck Bottom Stress (psi)
Deck Top Stresses (psi)
After Pouring Section 1 2 3 1 2 3 End Section (8%L From Left Support) 0 0 -2.06 0 0 -3.52
Middle Section 0 -17.12 -32.85 0 -37.17 -70.45 End Section (8%L From Right Support) 0 0 0 0 0 0
Table 18. Residual top and bottom deck stresses caused by pouring sequence (b) for pin-pin boundary condition.
Pin – Pin Boundary Condition Deck Bottom Stress (psi)
Deck Top Stresses (psi)
After Pouring Section 1 2 3 1 2 3 End Section (8%L From Left Support) 0 0 -3.85 0 0 6.59
Middle Section 0 -22.94 -42.18 0 -31.85 -56.62 End Section (8%L From Right Support) 0 0 0 0 0 0
77

Table 19. Residual top and bottom deck stresses caused by pouring sequence (c) for fixed-roller boundary condition.
Fixed - Roller Boundary Condition Deck Bottom Stress (psi)
Deck Top Stresses (psi)
After Pouring Section 1 2 3 1 2 3 End Section (8%L From Left Support) 0 0 0 0 0 0
Middle Section 0 -11.54 -17.02 0 -22.94 -34.09 End Section (8%L From Right Support) 0 0 -1.57 0 0 -0.80
Table 20. Residual top and bottom deck stresses caused by pouring sequence (d) for fixed-pin boundary condition.
Fixed - Pin Boundary Condition Deck Bottom Stress (psi)
Deck Top Stresses (psi)
After Pouring Section 1 2 3 1 2 3 End Section (8%L From Left Support) 0 0 0 0 0 0
Middle Section 0 -19.67 -26.99 0 -25.97 -37.62 End Section (8%L From Right Support) 0 0 -1.43 0 0 0.39
Table 21. Residual top and bottom deck stresses caused by pouring sequence (e) for fixed-fixed boundary condition.
Fixed - Fixed Boundary Condition Deck Bottom Stress (psi)
Deck Top Stresses (psi)
After Pouring Section 1 2 3 1 2 3 End Section (8%L From Left Support) 0 0 0 0 0 0
Middle Section 0 11.80 4.49 0 9.60 -2.63 End Section (8%L From Right Support) 0 0 -3.58 0 0 -11.03
Table 22. Residual bottom deck stresses caused by pouring sequence (f) for two span continuous girder.
Two Span Continuous Condition Deck Bottom Stress
(psi)
After Pouring Section 1 2 3 4 5 Middle of Left Span 0 5.34 -9.70 -9.83 -9.63 Over Interior Support 0 0 0 0 1.80 Middle of Right Span 0 0 4.73 8.34 5.52
78

Table 23. Residual top deck stresses caused by pouring sequence (f) for two span continuous girder.
Two Span Continuous Condition Deck Top Stress
(psi)
After Pouring Section 1 2 3 4 5 Middle of Left Span 0 10.62 -18.59 -18.90 -18.62 Over Interior Support 0 0 0 0 4.83 Middle of Right Span 0 0 9.94 17.74 12.38
Table 24. Residual bottom deck stresses caused by pouring sequence (g) for three span continuous girder.
Three Span Continuous Condition Deck Bottom Stress
(psi)
After Pouring Section 1 2 3 4 5 6 7 Middle of Left Span 0 7.87 6.07 2.66 1.28 1.71 1.40 Over Left Interior Support 0 0 0 0 0 0.65 0.21 Middle of Middle Span 0 0 8.26 8.96 7.97 6.97 8.05 Over right Interior Support 0 0 0 0 0 0 1.97 Middle of Right Span 0 0 0 -0.15 0.12 -1.16 -4.37
Table 25. Residual top deck stresses caused by pouring sequence (g) for three span continuous girder.
Three Span Continuous Condition Deck Top Stress
(psi)
After Pouring Section 1 2 3 4 5 6 7 Middle of Left Span 0 14.47 11.18 5.27 2.80 3.62 3.04 Over Left Interior Support 0 0 0 0 0 1.69 0.48 Middle of Middle Span 0 0 15.35 16.53 14.73 12.99 14.73Over right Interior Support 0 0 0 0 0 0 4.81 Middle of Right Span 0 0 0 -0.26 0.21 -8.01 -8.01 Effect of Shrinkage Profile So far it was assumed that shrinkage is uniform across the deck depth. Shrinkage profile (gradient of shrinkage through the depth of deck) changes stress profile in the deck. Based on actual bridge properties, volume change gradient may increase or decrease stresses in the deck. Table 26 shows deck stresses produced by +2 and -2oF temperature gradients (11-microstrain) through the deck as shown in figure 50. As seen in figure 51, deck stress profile tends to follow the change in shrinkage profile in the deck. In other words, increasing shrinkage in top causes an increase in the top stress. It seems desirable to design the deck and girder to have uniform stress profile for uniform shrinkage profile. This will reduce the adverse effect of shrinkage gradient through the section.
79

Table 26. Deck top and bottom stresses caused by different shrinkage profile in deck for different boundary conditions.
Boundary Condition (Section) Deck Bottom Stress (psi)
Deck Top Stresses (psi)
Volume Change Distribution Number 1 2 3 1 2 3 Pin – Roller (Mid Section) 96.23 72.59 48.95 18.69 36.17 53.64 Pin – Pin (Mid Section) 95.55 71.86 48.18 23.16 40.94 58.70 Three Span Continuous (Over Support)
143.58 121.21 97.98 111.30 131.25 151.21
Two Span Continuous (Over Support)
152.96 130.84 108.72 134.77 155.35 175.92
Fixed – Roller (8%L From End Section)
153.51 131.40 109.29 125.48 145.81 166.13
Fixed – Pin (8%L From End Section) 204.27 182.74 161.21 187.76 208.80 229.84 Fixed – Fixed (8%L From End Section)
231.33 210.30 189.27 189.27 210.30 231.33
Figure 50. Shrinkage stress profile.
80

Figure 51. Deck top and bottom stresses for different boundary conditions and (a) shrinkage profile 1, (b) shrinkage profile 2, (c) shrinkage profile 3.
81
Summary of Results of Two-Dimensional Analysis Effect of several design factors on deck stresses is evaluated and the results are presented in tables and figures. In summary: 1. Increasing boundary condition restraint of deck and girder system increases tensile
stress in the deck. 2. Span length does not affect the deck stresses considerably. 3. Increasing deck thickness reduces deck stresses for all except fixed-fixed boundary
conditions. 4. Increasing girder spacing will reduce deck stresses produced by volume change of
concrete in all but fixed-fixed deck girder system. 5. Increasing the ratio of girder to deck moment of inertia increases deck stresses for
all but fixed-fixed boundary condition. 6. Increasing composite section moment of inertia increases deck stresses slightly for
all except fixed-fixed and fixed-pin boundary conditions. 7. Increasing the area of longitudinal reinforcement increases the deck stresses for pin-
roller and pin-pin spans. There is no significant change in stress for other boundary conditions.
8. Changing the distribution pattern of total reinforcement area among top and bottom reinforcement does not change the deck stresses.
9. Deck stress for fixed-fixed supported deck and girder is only a function of volume change and does not change with other parameters.
10. Temporary shoring during construction reduces tensile stresses in the concrete deck significantly and induces some beneficial compressive stress for pin-roller and pin-pin boundary conditions. However, shoring for other boundary conditions does not have beneficial effect on deck stresses as the dead load produces additional tensile stresses in the deck.
11. Properly selected pouring sequence reduces possibility of cracking by inducing compressive stress in the deck. As a general rule, positive moment sections should be placed first followed by negative moment sections.
12. Volume change gradient through the section changes stress profile in the deck. However, based on actual bridge properties, this change in profile may increase or decrease the stress in the deck.
Three-Dimensional Model of Deck and Girder The three dimensional model is used to investigate crack patterns in concrete bridge deck. The analysis considers the bridge deck at early ages (less than 3 months). To be effective and useful the model must: 1. Capture important design characteristics of the bridge including geometry, boundary
conditions, and sectional properties. 2. Be capable of predicting cracks. 3. Be capable of modeling behavior of bridge after cracking.
82

To achieve these objectives, a non-linear finite element model was developed using ANSYS (V5.5, 1998). Similar to the 2D model, the 3D bridge model uses geometric and design information for one of the bridges surveyed (i.e., Hackensack Ave., over NJ Route 4 SB Bridge, table 4). 3D Model Details Basic Assumptions: The following are the basic assumptions made in building the 3D model: 1. Since the girders on the adjacent sides of the girder under consideration are equally
spaced, relative symmetry is assumed. 2. The middle girder of the bridge as shown in figure 31 is modeled. So the girder web
is a plane of symmetry under uniform shrinkage, thermal load, and uniform gravity load on the deck. In other words, this means that the girder has no displacement in the direction normal to the plane of its web. Similarly, it is argued that the girder has no rotation about its longitudinal axis passing the girder web plate. Due to this symmetry, only half of the girder and deck is modeled as shown in figure 52.
3. As shown earlier in the chapter, the effect of adjacent portion of deck and girders can be ignored.
4. Abutments and supports are considered rigid. Deck and Girder Modeling: One girder of the bridge with the corresponding portion of the deck is modeled in three dimensions. Due to symmetry of model, only half of deck and girder are modeled. The bridge deck is modeled using solid elements capable of cracking, while the girder is modeled using shell elements. The length of the span is divided into 49 strips. In each strip the deck is modeled with 21 elements located in three layers. The girder is modeled using 4 elements in each strip, 2 elements for the top flange, one for the web and one for the bottom flange. Figure 52 shows the model. The deck elements are slightly smaller over the girder. It should be mentioned that there is a lack of compatibility between the quadratic shell elements representing the girder with linear solid elements modeling the deck girder boundary. However, the effect of this issue is not important at all because the fine mesh used is well capable of representing the deformation shape(s) expected under the loadings considered.
83

Figure 52. 3D finite element model.
Reinforcement Elements: Reinforcements are modeled with beam elements. Since the moment of inertia of these elements is very small they basically act as truss elements (truss elements produce analysis instability after cracking due to rotation at ends). These elements are placed in two directions and four layers along the boundary of the solid elements on a separate mesh of nodes. These four layers represent top and bottom mesh of reinforcement in longitudinal and transverse directions. To simplify modeling, spacing of truss elements is chosen to be equal to the spacing of the solid elements. Since the spacing of the rebar elements is not exactly equal to the actual reinforcement spacing per plans, the equivalent area of rebars are used for each layer of rebar element to have the same amount of reinforcement in the section. Furthermore to prevent bending of deck in transverse direction, moment of inertia of the transverse rebars are increased to prevent this bending. Rebar elements are connected to solid element representing the deck with nonlinear springs modeling bond and slip of rebars in order to capture the behavior of the concrete and reinforcement realistically. Modeling bond-slip is essential to capturing post-cracking behavior of the concrete. Bond slip relationship proposed by Houde (1973) is used in this study, which is defined as follows:
432 1533.01239.1935.2696.1 wEwEwEwEu ×−×+×−×= (7)
Where u is bond stress in psi and w is slip in inches. Figure 53 shows a plot of this equation.
84

0
100
200
300
400
500
600
700
800
0 0.0005 0.001 0.0015 0.002
Silp (in)
Bon
d St
ress
(Psi
)
Figure 53. Bond-slip relationship (Houde, 1973).
Since finite element model includes this effect in a discrete manner, equivalent spring constant should be defined as follows:
elementrebar lduk π×= (8)
Where is the bar diameter and l is the element length. rebard element
Shear Stud Elements: Figure 54 shows shear stud details extracted from structural plans for the bridge under consideration. Shear studs are modeled using nonlinear spring elements. These elements connect nodes on the top of the girder to nodes on the bottom of the deck (which are geometrically coincident).
Figure 54. Shear Connector Detail.
85

Behavior of shear studs modeled using these springs with the load slip model (Yam and Chapman, 1968) shown in figure 55. The referenced load slip behavior is obtained by back calculation of the composite section behavior by Yam and Chapman (1968). In the absence of substantial experimental data this relationship will be utilized.
0
1000
2000
3000
4000
5000
6000
7000
0 0.01 0.02 0.03 0.04 0.05
Slip (in)
Load
(lb)
Figure 55. Shear Connector load slip behavior (Yam an Chapman, 1968).
Boundary Condition: The span modeled is simply supported. So the nodes on the bottom flange of the girder at one end are restrained in three directions and those at the other end is only restrained in the transverse and vertical directions. Also symmetric boundary condition is applied on the plane of symmetry (i.e., girder web plane). Additionally longitudinal rebar nodes are constrained to move with deck in Z and X directions (see figure 55 for directions) and transverse rebar nodes is constrained to move with the deck in Z and Y directions. Deck bottom nodes in contact with the girder top nodes are also constrained to move in the Z direction with these nodes. Concrete Compressive Strength: According to NJDOT specifications, a fixed compressive strength of 4500 psi is chosen. This is a good approximation, since the deck is cured at least 7 days and after 7 days the change in compressive strength is not very large. Concrete Modulus of Elasticity and Poisson’s Ratio: ACI specification proposes the following equation for the value of modulus of elasticity (all values in psi):
cc fE ′= 57000 (9)
Poisson’s ratio for concrete at stresses lower than 0.7 falls within limits of 0.15 to 0.2 (Winter and Nilson, 1968). A value of 0.2 is used for the model and it is assumed constant for all ages.
cf ′
86

Concrete Tensile Strength: According to recommendation of ACI the modulus of rupture is assumed equal to:
cr ff ′= 5.7 (10)
Steel Modulus of Elasticity and Poisson’s Ratio: The values of 29E6 psi and 0.3 will be used for steel modulus of elasticity and Poisson’s ratio, respectively. Steel and Concrete Coefficient of Thermal Expansion: Winter and Nilson (1986) state that the concrete coefficient of thermal expansion should be in the range of 4E-6 to 7E-6 in/in per degree of Fahrenheit. Khan, Cook, and Mitchell (1998) measure the values of 5.3e-6 to 5.5e-6 in/in per oF for maturing normal weight concrete. In this study the values of 5.5E-6 and 6.25E-6 in/in per oF are assumed for concrete and steel, respectively. Concrete Stress-Strain Curve: Since the magnitudes of compressive stresses are well within linear portion of the concrete strain stress curve a linear material model would be considered for compression. A linear stress strain curve is also assumed for concrete in tension before cracking. Crack Modeling: Figure 56 shows the concrete material model in tension as defined by ANSYS (V5.5, 1998). It is further assumed that the shear stress transfer coefficient is 0.5 for open and closed cracks. This value basically accounts for the rebar dowel action and aggregate interlocking at crack interface.
Figure 56. Concrete material model in tension.
Loading: The loading consists of three major components: drying shrinkage, thermal shrinkage, and ambient temperature. Note that creep effects are not modeled. However, considering the fact that the analyses are mostly concerned with behavior of
87

the system in early age (less than 3 months), the results are useful and the error is negligible. Results of experiments conducted as a part of this study, as shown in figure 57, show that after the first few days of pouring there is effectively no temperature difference between ambient temperature and the bridge deck in NJ. Also, field measurements show that hydration temperature rise produces no significant locked in residual stresses in the bridge deck after the first few days of pouring. Based on these two results only shrinkage-induced effects are considered in the 3D models and all models are subjected to a uniform shrinkage in the deck.
0
5
10
15
20
25
30
35
9-Nov 11-Nov 13-Nov 15-Nov 17-Nov 19-Nov 21-Nov 23-Nov 25-Nov 27-Nov 29-Nov 1-Dec
Time
Tem
p (C
)
-40
-30
-20
-10
0
10
20
30
40
50
Stra
in (m
icro
stra
in)
ConcreteTemperature
Ambient Temperature
Cocncrete Strain & 2 per. Mov. Avg.
Figure 57. Measured concrete deck strain and temperature of a simply supported bridge.
Results of Three-Dimensional Analyses Crack patterns, stress history, and deflection history have been studied for four different types of boundary conditions. To study bridge response, a uniform shrinkage is applied to the deck and several response parameters are reported. Pin-Roller Boundary Condition Figure 58 shows the deflected shape of the structure at the end of the analysis. The cracks at mid span and at the end of the span are shown in figure 59. Note that the circles in this figure indicate the plane of cracks. It is shown that except for a small portion at the ends, bridge deck develops transverse cracks as a result of applied
88

shrinkage. Deflection at the center of the span vs. the shrinkage strain at mid span is shown in figure 60. Downward deflection is negative. The sudden jump in deflection (bounce back) at a strain around 0.0004 in/in indicates transverse cracking of the bridge deck and stress relief.
Figure 58. Deformed shape of the girder and cracked deck at the end of analysis (pin-roller boundary condition).
Figure 59. Deck cracks at end of span (bottom) and mid span (top) of the bridge at the end of analysis (pin-roller case).
89

-1.4
-1.2
-1
-0.8
-0.6
-0.4
-0.2
00.0001 0.0002 0.0003 0.0004 0.0005 0.0006 0.0007
Shrinkage Strain
Def
lect
ion
(in)
Figure 60. Mid span girder deflection vs. shrinkage strain (pin-roller case).
Figure 61 shows the concrete deck top and bottom stresses at mid span. It is noticeable that the deck top stress is far less than tensile strength of concrete (500 psi). However, it experiences the same jump as the deck bottom stress and the results show that the element at the top has cracked. This indicates that in this particular case cracking has started from the bottom of the deck and propagates almost suddenly through the section. In other words, cracks are full depth.
-100
0
100
200
300
400
500
600
0.0001 0.0002 0.0003 0.0004 0.0005 0.0006 0.0007
Shrinkage Strain
Stre
ss (p
si)
Deck top stress @ mid span Deck bottom stress @ mid span
Figure 61. Deck top and bottom stress over girder at mid span for pin-roller boundary condition.
90

Deck top stresses at mid span and quarter span are compared in figure 62. The sudden decrease of stress around the strain of 0.0004 in/in again shows development of cracking. Results show that both mid span and quarter span cracks develop at the same time. Results show that cracks at mid span stay open after cracking. However, due to stress redistribution cracks at quarter span close and as the graph shows compressive stresses develop at this region due to downward deflection of the bridge.
-150
-100
-50
0
50
100
150
200
250
300
0.0001 0.0002 0.0003 0.0004 0.0005 0.0006 0.0007
Shrinkage Strain
Stre
ss (p
si)
Deck top stress @ mid span Deck top stress @ quarter span
Figure 62. Deck top stress over the girder at mid span and quarter span for pin-roller boundary condition.
It is also observed that cracks are developed almost at the same time. Evaluation of the entire data indicates that, in fact the entire bridge cracks at once (e.g. figure 61, 62 and 63). Figure 63 shows the deck top stress across the deck at mid span at three locations. Location 1 is over girder, location 2 is midway between girder and edge of slab, and location 3 is slab edge. This figure supports the fact that cracks propagate transversely across the whole deck at the same time. This behavior is observed by Krauss and Rogalla (1996) in their experimental study of Portland-Columbia Bridge in Pennsylvania. They did not observe any cracks in their initial survey of the bridge after construction. However, in their next survey after a few days, they noticed that the bridge deck had developed transverse cracks all over.
91

-50
0
50
100
150
200
250
300
0.0001 0.0002 0.0003 0.0004 0.0005 0.0006 0.0007
Shrinkag e St rain
Deck top stress @ mid span locat ion 1 Deck top stress @ mid span location 2Deck top stress @ mid span locat ion 3
Figure 63. Deck top and bottom stress across the slab at mid span for pin-roller boundary condition.
As it can be seen from figure 59 not all elements cracked during the analysis. In mid span, every other row of element developed full depth cracks across the slab. Considering that the length of an element is 22 in and each element has 4 integration points, which capture the cracking, crack spacing is 2.75 ft long. This spacing is the spacing between full depth cracks that run across the slab. This spacing as shown in figure 59 reduces towards the ends of span. Initiation of cracks can also be observed by sudden change in longitudinal reinforcement stress as shown in figure 64. The longitudinal stress in reinforcement at mid span experiences a sudden increase followed by increasingly high stress with increasing shrinkage. In fact, in an experimental study Frosch et al. (2002) have observed yielding of longitudinal reinforcement as a result of cracking. Although the reinforcement stress does not reach yielding in FE analysis, the high stress level suggests that yielding might be possible in some cases.
92

0
5000
10000
15000
20000
25000
30000
0.0001 0.0002 0.0003 0.0004 0.0005 0.0006 0.0007
Shrinkage Strain
Stre
ss (p
si)
Top rebar stress @ mid span Top rebar stress @ quarter span
Figure 64. Reinforcement stress over girder at mid span and quarter span for pin-roller boundary condition.
Pin-Pin Boundary Condition The response of a pin-pin bridge to shrinkage strains is similar to that of a pin-roller case. However, there are some differences that are discussed here. A diagram of cracks at the end of an analysis is shown in figure 65. As it can be seen almost all of the bridge developed full depth transverse cracks. Deflection history is shown in figure 66. The deflection curve is similar to that for a pin-roller case but the maximum deflection is lower indicating the increase in stiffness of the structure due to the change in boundary condition. There in not much difference in the level of strain that causes cracking. Cracks develop around 0.0004 in/in shrinkage strain. This result was expected based on the 2D finite element results.
93

Figure 65. Deck cracks at end of span (bottom) and mid span (top) of pin-pin bridge at the end of analysis. Circles indicate cracks for each element (pin-pin case).
-1.2
-1
-0.8
-0.6
-0.4
-0.2
00.0001 0.0002 0.0003 0.0004 0.0005 0.0006 0.0007
Shrinkage Strain
Def
lect
ion
(in)
Figure 66. Mid span girder deflection vs. shrinkage strain for pin-pin boundary condition.
94

The stress histories at two points through the depth of the deck at mid span are shown in figure 67. Similar to the pin-roller case cracks are full depth and start from the bottom. As it can be seen from figure 68 stress redistribution results in development of compressive stress in the top of the deck.
-300
-200
-100
0
100
200
300
400
500
600
0.0001 0.0002 0.0003 0.0004 0.0005 0.0006 0.0007
Shrinkage Strain
Stre
ss (p
si)
Deck top stress @ mid span Deck bottom stress @ mid span
Figure 67. Deck top and bottom stress over girder at mid span for pin-pin boundary condition.
Figure 68 shows a comparison of the deck top stresses at mid span and quarter span, while figure 69 shows the stress distribution across the deck at mid-span. In this figure location 1 is over girder, location 2 is midway between girder and edge of slab, and location 3 is slab edge.
-300
-200
-100
0
100
200
300
0.0001 0.0002 0.0003 0.0004 0.0005 0.0006 0.0007
Shrinkage Strain
Stre
ss (p
si)
Deck top stress @ mid span Deck top stress @ quarter span
Figure 68. Deck top stress over the girder at mid span and quarter span for pin-pin boundary condition.
95
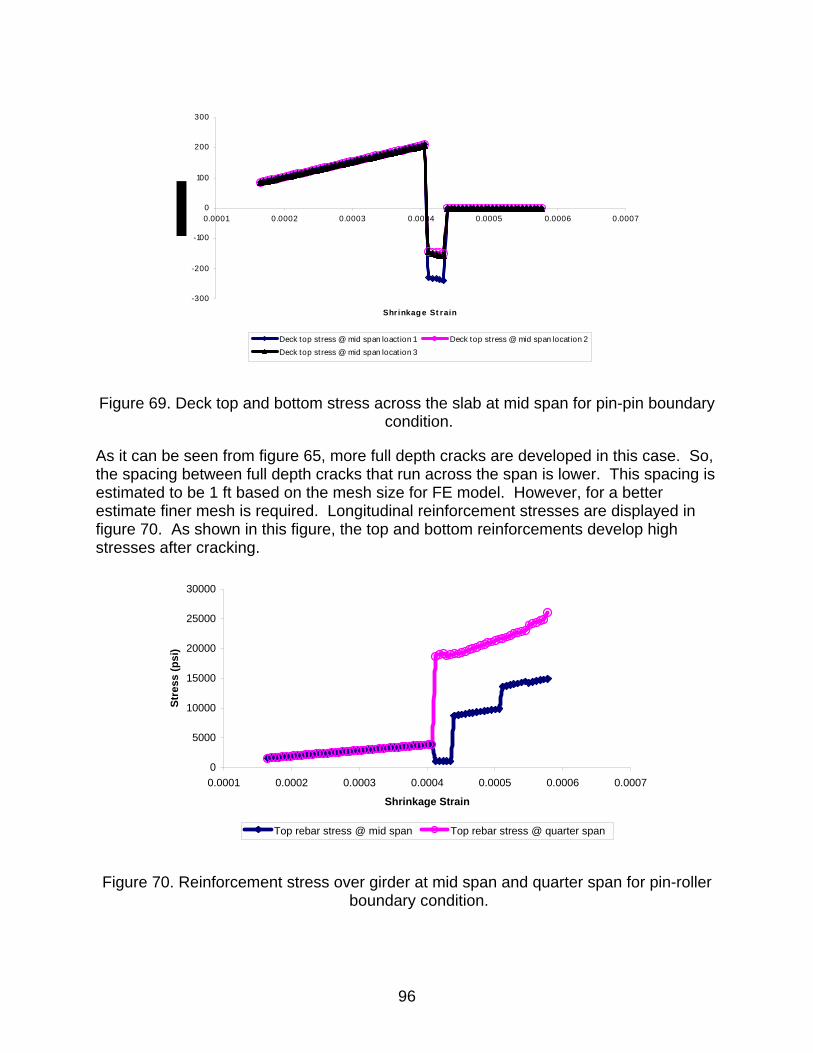
-300
-200
-100
0
100
200
300
0.0001 0.0002 0.0003 0.0004 0.0005 0.0006 0.0007
Shrinkag e St rain
Deck top stress @ mid span loact ion 1 Deck top stress @ mid span locat ion 2Deck top stress @ mid span location 3
Figure 69. Deck top and bottom stress across the slab at mid span for pin-pin boundary condition.
As it can be seen from figure 65, more full depth cracks are developed in this case. So, the spacing between full depth cracks that run across the span is lower. This spacing is estimated to be 1 ft based on the mesh size for FE model. However, for a better estimate finer mesh is required. Longitudinal reinforcement stresses are displayed in figure 70. As shown in this figure, the top and bottom reinforcements develop high stresses after cracking.
0
5000
10000
15000
20000
25000
30000
0.0001 0.0002 0.0003 0.0004 0.0005 0.0006 0.0007
Shrinkage Strain
Stre
ss (p
si)
Top rebar stress @ mid span Top rebar stress @ quarter span
Figure 70. Reinforcement stress over girder at mid span and quarter span for pin-roller boundary condition.
96

Fixed-Roller Boundary Condition The deformed shape of a fixed-roller bridge is shown in figure 71. Figure 72 shows the cracks at the end of the analysis. Circles indicate plane of cracking in figure 73. It is observed that the entire bridge deck is cracked. While cracks are spread right to the fixed end support, they do not appear near the roller end. Deflection history at mid-span is shown in figure 73. Unlike the previous cases there is no sudden jump in the deflection curve but rather deflection re-bounces in several steps suggesting that cracks do not happen all at once. The re-bounce starts around strain of 0.0002 in/in, which is lower than previous cases but expected due to higher stiffness of a fixed-roller beam compared to pin-roller or pin-pin case. Similarly, deflection values are far less than the previous cases.
Figure 71. Deformed shape of the girder and cracked deck at the end of analysis (fixed-roller boundary condition).
Figures 74 and 75 show the deck top and bottom stress at different locations along the span. It is apparent from these graphs that transverse cracks start from the fixed end and as the shrinkage strain increases they spread towards the roller end. These cracks are again full depth and as the results show extend across the slab. It is also noticeable that cracks happen at a stress lower than tensile strength of concrete. This is due to multi-axial nature of stresses at the time of cracking.
97

Figure 72. Deck cracks at fixed end of span (bottom left), roller end of span (right end) and mid span (top) of fixed-roller bridge at the end of analysis.
-5.00E-01
-4.50E-01
-4.00E-01
-3.50E-01
-3.00E-01
-2.50E-01
-2.00E-01
-1.50E-01
-1.00E-01
-5.00E-02
0.00E+000.0001 0.0002 0.0003 0.0004 0.0005 0.0006 0.0007
Shrinkage Strain
Def
lect
ion
(in)
Figure 73. Mid span girder deflection vs. shrinkage strain for pin-pin boundary condition.
98

-200
-100
0
100
200
300
400
0 0.0001 0.0002 0.0003 0.0004 0.0005 0.0006 0.0007
Strain
Stre
ss (p
si)
Deck top stress @ 1/3 span Deck top stress @ mid span Deck top stress @ 2/3 span
Figure 74. Deck top stress at 1/3, half and 2/3 of span from fixed end for fixed-roller boundary condition.
-300
-200
-100
0
100
200
300
400
500
0 0.0001 0.0002 0.0003 0.0004 0.0005 0.0006 0.0007
Strain
Stre
ss (p
si)
Deck bottom stress @ 1/3 span Deck bottom stress @ mid span Deck bottom stress @ 2/3 span
Figure 75. Deck bottom stress at 1/3, half and 2/3 of span from fixed end for fixed-roller boundary condition.
99

Figure 76 shows the reinforcement stress along the span. There is an increase in reinforcement stress after cracking, which were observed in previous cases too.
0
2000
4000
6000
8000
10000
12000
14000
16000
18000
20000
0 0.0001 0.0002 0.0003 0.0004 0.0005 0.0006 0.0007
Strain
Stre
ss (p
si)
Top rebar stress @ 1/3 span Top rebar stress @ mid span Top rebar stress @ 2/3 span
Figure 76. Top reinforcement stress at 1/3, half and 2/3 of span from fixed end for fixed-roller boundary condition.
Fixed-Fixed Boundary Condition The behavior of the structure before cracking in the case of a fixed-fixed bridge is exactly similar to the classical example of two different materials connected together and undergoing temperature difference. Since the deck and girder are fixed at both ends, deflection due to shrinkage is negligible and deck stress is equal to shrinkage strain times the modulus of elasticity for concrete. This stress is the same all over the slab. The moment that the stress level reaches the tensile strength of concrete every element in the deck cracks. Figure 77 shows the stress history of a deck element. The same pattern is observed for all other elements in the deck. It is noticeable that the level of shrinkage strain when cracking occurs is considerably lower for this case. This has also been shown using the 2D models and it is due to higher stiffness of the system.
100

0
100
200
300
400
500
600
0.0001 0.00012 0.00014 0.00016 0.00018 0.0002 0.00022 0.00024
Shrinkage Strain
Stre
ss (p
si)
Figure 77. Stress of deck elements for fixed-fixed boundary condition.
Based on FEA results, a bridge with fixed-fixed boundary condition undergoes the most severe cracking while the level of shrinkage is the lowest. This means that fixed-fixed bridges have higher potential for transverse deck cracking, a point that must be explicitly considered in their design. An easy to use program that can facilitate determination of tensile stresses in bridge decks is developed under this study. This is discussed in chapter 6. Summary of Results of Three Dimensional Analysis 3D analyses of a typical bridge with four different types of boundary conditions were presented and discussed in light of crack pattern, stress and deflection time histories, and distribution of stresses. The results can be summarized as follow: 1. Cracks develop suddenly all over the deck in bridges with pin-roller, pin-pin, and
fixed boundary conditions. However, for fixed roller boundary condition, cracks spread along the span as the shrinkage strain increases.
2. Cracks are full depth and run across the slab. 3. Crack spacing for simply supported bridges in estimated to be 2.75 ft and it reduces
as the rigidity of the boundary condition increases. 4. There is a sudden increase in reinforcement stress after cracking which may cause
rebars to yield. 5. Deflection of the bridge reduces as cracks develop and stresses are relieved.
101

A SIMPLE METHOD FOR ESTIMATING STRESSES CAUSING TRANSVERSE CRACKING IN CONCRETE BRIDGE DECKS
This chapter describes a simple method to estimate stresses causing transverse cracking in concrete bridge decks with full composite action between deck and girder. A system of equations for a pin-roller supported composite girder is developed to estimate the deck stresses due to volume change in concrete caused by shrinkage and/or other effects. These equations are further extended to consider different boundary conditions. The results of this method agree very well with the results of finite element analyses. It is proposed that this practical method be used as a tool during bridge design to examine concrete bridge deck against the possibility of transverse cracking. To facilitate this, a MS Windows application is developed that provides a simple mean for designers to perform AASHTO (3.12) checks on shrinkage and temperature loading. Furthermore, an overview of factors causing the volume change in bridge deck concrete and their magnitude is also presented herein to simplify the use of this method.
Compatibility Equations The basic method of solid mechanics is used to derive a set of equations for computing internal stresses due to an assumed temperature profile. Figure 78 shows a composite girder with bilinear temperature profile in the deck and girder. To compute internal stresses caused by this temperature profile in a pin-roller supported composite deck-girder system, the composite section is divided into four sections, each with linear temperature changes. Sections are numbered from 1 to 4 beginning from the top (figure 79). Section 1 and 2 divide deck and section 3 and 4 divide girder. Internal stresses transferred between the sections and between sections and reinforcements are replaced by their resultant force and moments (figure 79). To calculate internal force and moment resultants, eight compatibility equations should be solved simultaneously. These equations ensure the strain and curvature compatibility among sections and reinforcements. Equations 1, 2, and 3 enforce strain equality at the interface of the separated sections. Equations 4, 5, and 6 ensure curvature equality in all sections and equations 8 and 9 ensure strain equality between reinforcement and surrounding concrete matrix. The current form of the equations, consistent with design practice, assumes that two layers of longitudinal reinforcements exist. The first layer of reinforcement is located in section 1 and the other layer is in section 2 (figure 79). However, the equations can be easily modified for more than two layers of reinforcements.
102

Figure 78. Temperature profile along the section.
Figure 79. Compatibility forces and moments and temperature distribution.
=−
++−++−=11
11
11
11
11
1
11
1
11
10211
)()(
b
Topt
b
b
bBottom SE
CdFrSEdF
AEFr
AEF
SEQTTαε
22
22
22
2122
22
2
22
12
22
120322
)()(
t
Bottomb
t
tb
tTop SE
CdFrSE
dFdFAE
FrAEFF
SEQQ
TT−
−+
+−−
+−
+−=αε
(11)
103

=−
−+
+−−
+−
+−=22
22
22
2122
22
2
22
12
22
120422
)()(
b
Bottomb
b
tb
bBottom SE
CdFrSE
dFdFAE
FrAEFF
SEQQTTαε
33
3233
33
23
33
230533 )(
t
tb
tTop SE
dFdFAEFF
SEQQ
TT+
+−
+−
+−=αε
(12)
=+
+−
+−
+−=33
3233
33
23
33
230633 )(
b
tb
bBottom SE
dFdFAEFF
SEQQ
TTαε
44
43
44
3
44
30744 )(
t
t
tTop SE
dFAE
FSE
QTT +−−−=αε
(13)
=−
+++−
=11
11
11
11
11
1
1
121
1
)()(1IE
CdFrIE
dFIE
Qh
TTR
Toptbα
22
22
22
2221
22
12
2
342
2
)()(1IECdFr
IEdFdF
IEQQ
hTT
RBottombbt −
−+
+−+−
=α
(14)
=−
−+
+−
+−
=22
22
22
2221
22
12
2
342
2
)()(1IECdFr
IEdFdF
IEQQ
hTT
RBottombbtα
33
3332
33
23
3
563
3
)(1IE
dFdFIEQQ
hTT
Rbt +
+−
+−
=α
(15)
=+
+−
+−
=33
3332
33
23
3
563
3
)(1IE
dFdFIEQQ
hTT
Rbtα
44
43
44
3
4
784
4
)(1IEdF
IEQ
hTT
Rt+−
−=
α
(16)
=+−=11
10111Re )(
rrrrbar AE
FrTTαε (17)
104

11
11
11
11
11
1
11
1
11
1011
)()(
r
Topt
r
b
rr SE
CdFrSEdF
AEFr
AEF
SEQTT
−++−++−α
=+−=22
20221Re )(
rrrrbar AE
FrTTαε
22
22
22
2122
22
2
22
12
22
12022
)()(
r
Bottomb
r
tb
rr SE
CdFrSE
dFdFAE
FrAEFF
SEQQTT
−−
++−
−+
−+−α
(18)
In these equations Bottomiε and Topiε are strains at bottom and top of section i. is the curvature of section i, and are the force and moment resultant of stresses at interface of section i and i+1, and
iR
iF iQ,, ii hE ,,,, bitiii SSIA iα are respectively modulus of
elasticity, height, area, moment of inertia, top section modulus, bottom section modulus and coefficient of thermal expansion of section i. and are respectively the distance from centroid to bottom and top of section.
bid tid,iSr ,,, Bottomri CiFr α and C
represent respectively force resultant of stresses in reinforcement layer i, section modulus at level of reinforcement layer i, coefficient of thermal expansion of reinforcement layer i, and bottom reinforcement cover and top reinforcement cover. T and Tr define the temperature distribution in section as shown in figure 79.
Top
i
i
Upon calculating forces and moments required to satisfy compatibility equations, the deck stresses can be obtained by using the following equations:
2
22211222
2
122 )(
b
BottombtbDeckBottom S
CdFrdFQQdFA
FFrF −−+−++
−−=σ (19)
1
11111
1
11 )(
t
ToptbDeckTop S
CdFrQdFA
FrF −+++
−=σ (20)
In these equations DeckBottomσ and DeckTopσ are respectively deck bottom and top stresses. Equations 11 through 20 can be applied to a cantilever system too. Since the same representation of internal forces and the same compatibility equations (equations 11-18) are used, similar system of equations characterizes the behavior of cantilever composite beam. This results in identical stresses from equation 9 and 10 for pin-roller and cantilever systems. However, due to boundary conditions deflection curves would be different for these two cases.
105

Adequacy of Assumptions There are two basic assumptions in deriving compatibility equations; namely (i) the assumption that approximating the internal stresses along the boundary of sections and reinforcements with resultant forces and moments is a good approximation, and (ii) the assumption that the deck is in plane stress condition. Deformations and strains that are computed based on resultant forces and moments do not capture the effect of distributed nature of internal stresses and consequently do not result in exact solution. However, the deviation from exact solution is not significant. In fact the accuracy of equations depends on nature of stress distribution along the boundary of sections and reinforcements, which in turn depends on temperature profile. To evaluate the accuracy of this assumption and for comparison of results, a 2-D Finite Element (FE) model of a pin-roller supported girder and the tributary portion of the deck with top and bottom reinforcements is developed using ANSYS FE package (1998) (described completely in chapter 5). Deck and girder are modeled using plane stress elements with different thickness and reinforcements are modeled using truss elements attached over the boundary of deck elements (figure 80). The FE model is developed using an actual bridge’s dimensions and properties, which developed transverse deck cracks. The bridge data shown in table 27 are used as an example in this paper. Deck and girder model of table 27 are subjected to arbitrary 5.6oC (10oF) uniform temperature decrease in the deck. Figure 81 shows the distribution of nodal forces in longitudinal direction between the deck and the girder. Similarly, figure 82 shows distribution of internal nodal forces in a direction normal to the plane of the deck for the same model. As it can be seen from these figures, internal nodal forces are concentrated at both ends and justify resultant representation between sections 2 and 3 as shown in figure 79. However based on beam theory, resultant representation of internal stresses between sections 3 and 4 ignores the distributed nature of stresses. This introduces deviation from exact solution. However, as results in table 28 show, this deviation is not significant.
106
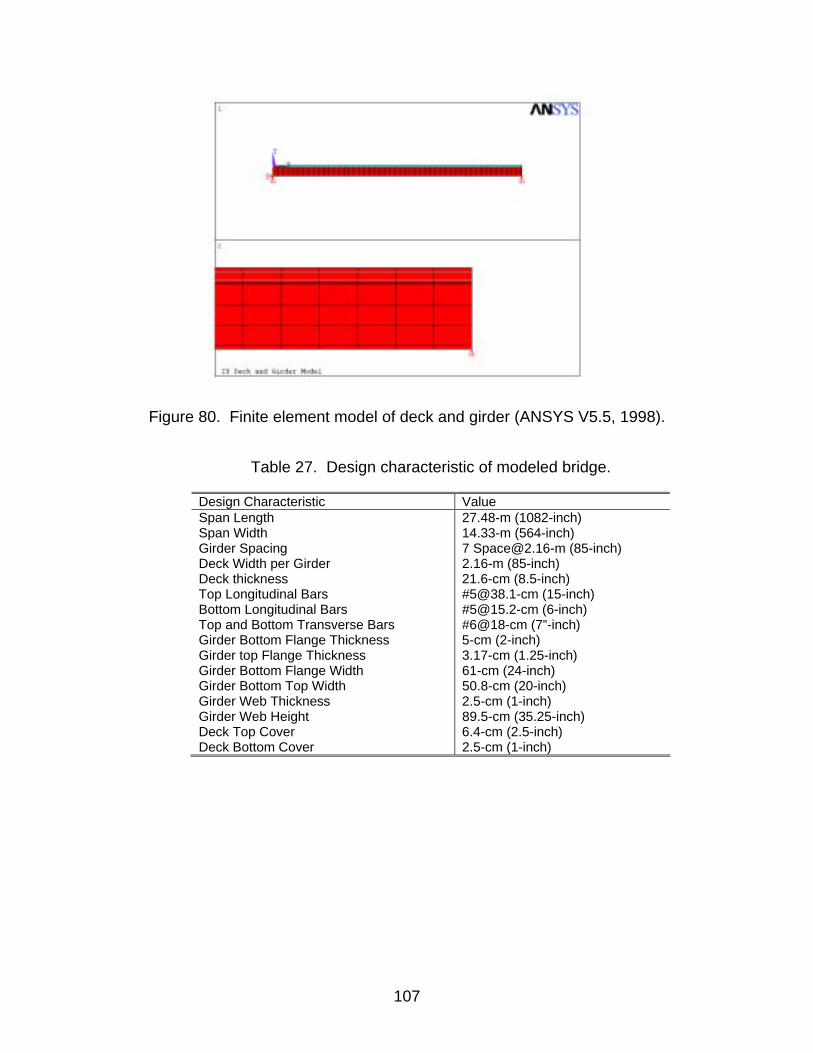
Figure 80. Finite element model of deck and girder (ANSYS V5.5, 1998).
Table 27. Design characteristic of modeled bridge.
Design Characteristic Value Span Length 27.48-m (1082-inch) Span Width 14.33-m (564-inch) Girder Spacing 7 [email protected] (85-inch) Deck Width per Girder 2.16-m (85-inch) Deck thickness 21.6-cm (8.5-inch) Top Longitudinal Bars #[email protected] (15-inch) Bottom Longitudinal Bars #[email protected] (6-inch) Top and Bottom Transverse Bars #6@18-cm (7”-inch) Girder Bottom Flange Thickness 5-cm (2-inch) Girder top Flange Thickness 3.17-cm (1.25-inch) Girder Bottom Flange Width 61-cm (24-inch) Girder Bottom Top Width 50.8-cm (20-inch) Girder Web Thickness 2.5-cm (1-inch) Girder Web Height 89.5-cm (35.25-inch) Deck Top Cover 6.4-cm (2.5-inch) Deck Bottom Cover 2.5-cm (1-inch)
107

-150
-100
-50
0
50
100
150
0 20 40 60 80 100
Length Ratio from One End (Percent)
Forc
e in
Lon
gitu
dina
l Dire
ctio
n(K
N)
Figure 81. Distribution of nodal forces in longitudinal direction for pin-roller deck girder system between deck and girder.
-20
-15
-10
-5
0
5
10
15
20
0 20 40 60 80 10
Length Ratio From One End (Percent)
Forc
e in
Nor
mal
Dire
ctio
n (K
N)
0
Figure 82. Distribution of nodal forces in direction normal to deck for pin-roller deck girder between deck and girder.
108

Table 28. Comparison of FEA and compatibility equations results for the pin-roller supported deck-girder system.
Deck Bottom Stresses KPa (PSI)
Deck Top Stresses KPa (PSI)
Compatibility Equations 434.16 (62.97) 167.06 (24.23) 2D FEA 434.23 (62.98) 167.06 (24.23)
Another assumption in developing the set of equations is that the composite deck is under plane stress condition. Table 29 shows the effect of plane stress vs. plane strain assumption on deck stresses for the example bridge. This table shows that there is a considerable difference between plane stress and plane strain assumptions.
Table 29. Comparison of compatibility equations for plane stress and plane strain assumption.
Deck Bottom Stresses KPa (PSI)
Deck Top Stresses KPa (PSI)
Plane stress 434.16 (62.97) 160.17 (24.23) Plane strain 669.00 (97.03) 213.12 (30.91)
A detailed 3-D FE analysis is performed to verify the plane stress assumption. The results of this analysis support the plane stress case (see chapter 5 for details).
Results and Comparison to Finite Element Analysis To evaluate the results obtained from equations 1-10, a 2-D Finite Element (FE) model of figure 80, as described earlier, is analyzed when subjected to 5.6oC (10oF) uniform temperature drop in the deck. Table 28 presents deck stresses computed using the compatibility equations and those for 2D finite element analysis. The results are almost identical.
Other Boundary Conditions Equations 1 through 10 estimate deck stresses in the case of pin-roller supported or cantilever girder. Computation of stresses for other than pin-roller or cantilever boundary condition utilizes the principle of superposition. Either a pin-roller supported or a cantilever system can be chosen as base case. Any extra boundary conditions will be considered as redundant boundary conditions. The redundant boundary conditions impose additional forces on the system to satisfy deformation compatibility. These forces can be obtained using compatibility requirements. After calculating redundant forces, deck stresses is calculated by addition of stresses estimated by equations 1 through 10 to the stresses caused by redundant forces. Validity of the final results is guaranteed by the principal of superposition for elastic structures.
109

Figure 83 shows the application of the principle of superposition to different boundary conditions. Numerical results of application of this method to the example bridge section, (with different boundary conditions) subjected to a 5.6oC (10oF) uniform temperature decrease in the deck, are shown in table 30. The equations used for obtaining these results are presented in the following sections.
Figure 83. Superposition principle applied for finding deck stresses in different boundary conditions.
Table 30. Comparison of FEA and compatibility equations results for the different boundary conditions.
Deck Bottom Stress Deck Top Stresses
Boundary Condition Equations KPa (PSI)
FEA KPa (PSI)
Error (%)
Equations KPa (PSI)
FEA KPa (PSI)
Error (%)
Pin – Pin 429.06 (62.23)
429.00 (62.22)
0 203.60 (29.53)
201.05 (29.16) 1.2
Fixed – Roller 915.07 (132.72)
874.6 (126.85) 4.6 (152.10) (150.71) 0.9
Fixed – Fixed w/o Axial Restraint
754.70 (109.46)
743.19 (107.79) 1.5 754.56
(109.44) 743.19
(107.79) 1.5
Fixed – Fixed 1449.97 (210.30)
1449.97 (210.30)
0 1449.97 (210.30)
1449.97 (210.30) 0
Two Span Continuous 914.93 (132.7)
867.43 (125.81) 5.4 1048.69
(152.1) 1041.18 (151.01) 0.69
Three Span Continuous 818.96 (118.78)
799.79 (116.00) 2.4 872.32
(126.52) 864.53
(125.39) 0.9
110

Pin-Pin Boundary Condition Figure 83-A shows this case and illustrates the application of superposition principle. The value of the redundant force P, required to satisfy compatibility of deformation is:
12
232 ]1][)(
[ −+−−
−=CompositeComposite
bc
CompositecompositeGirderGirderGirderGirder
bgtg
IEd
EAEAF
IEdQdF
P (21)
In this equation and are respectively area, moment of inertia and modulus of elasticity of girder, and are respectively area, moment of inertia and modulus of elasticity of composite section, and are respectively distance from centroid of the girder to top and bottom fiber of the girder, and and d are respectively distance from centroid of composite section to top and bottom of section. This force, P, produces additional stresses at top and bottom of the deck (
,, GirderGirder IA
DeckBottom
GirderE,Composite ,CompositeIA CompositeE
bgd tgd
bcd tc
DeckTop σσ ∆∆ , ):
]1[Composite
bctc
compositeDeckTop I
ddA
P −=∆σ (22)
])(1[
Composite
bctc
compositeDeckBottom I
dtdA
P−
−=∆σ (23)
where t is the deck thickness. Thus, the deck’s final stress is obtained from addition of these stresses to the results of equations 9 and 10. Fixed-Roller Boundary Condition Figure 83-B shows this case and illustrates the application of the principal of superposition. Force P required to produce zero displacement in horizontal direction at the support is:
LIE
IEQdF
P CompositeComposite
GirderGirder
tg 32
)( 32 ×−
= (24)
where L is the span length. This force, P, produces additional stresses in the deck, where:
Composite
tcDeckTop I
PLd=∆σ (25)
Composite
tcDeckBottom I
tdPL )( −=∆σ (26)
111

Thus, the deck’s final stresses are obtained from addition of these stresses to the results of equations 9 and 10. Fixed-Fixed Boundary Condition With Axial Force Release Figure 83-C shows this case and illustrates the application of superposition principle. Although cantilever system could be chosen as the base case, due to symmetry, it is computationally easier to choose simply supported case as base case. The value of the redundant moment M required to satisfy compatibility conditions is:
GirderGirder
CompositeCompositetg
IEIEQdF
M)( 312 −
= (27)
Moment M produces additional stress in the deck, where:
Composite
tcDeckTop I
Md=∆σ (28)
Composite
tcDeckBottom I
tdM )( −=∆σ (29)
Deck’s final stresses are obtained from addition of these stresses to the results of equations 9 and 10. Fixed-Fixed Boundary Condition For the case of fixed-fixed boundary condition the deck stresses are simply computed from the following equation:
DeckBottomTopDeckBottomkTopDec ET )()( ∆=ασ (30)
where T∆ is the equivalent temperature change in the deck at top and bottom of deck. Two Span Continuous System Figure 83-D shows the application of the superposition method to the continuous beam case. It is assumed here that there is no change in cross section in the two spans. However, the method is general and the reader can apply this concept with necessary modifications when sectional properties are different in each span. Continuity moment M is calculated by:
GirderGirder
CompositeCompositetg
IEIEQdF
M2
)3)(( 32 −= (31)
Moment M produces additional stresses in the deck, which can be calculated using equations 19 and 20.
112

Three Span Continuous System It is assumed here again that there is no change in cross section in the three spans. Continuity moments at two spans can be computed by solving the following equations, which come from compatibility:
CompositeCompositeCompositeCompositeGirderGirder
tg
CompositeCompositeCompositeCompositeGirderGirder
tg
IELM
IELLM
IELLQdF
IELM
IELLM
IELLQdF
63)(
2))((
63)(
2))((
213223232
222112132
++
=+−
++
=+−
(32)
In these equations and are span lengths and and are continuity moment between spans. This gives:
,, 21 LL 3L 1M 2M
)4344(
)2)()((3
)4344(
)2)()((3
322
23121
2312322
322
23121
2132321
LLLLLLLIE
IELLLLQdFM
LLLLLLLIE
IELLLLQdFM
GirderGirder
CompositeCompositetg
GirderGirder
CompositeCompositetg
+++
++−=
+++
++−=
(33)
Based on the bridge data from table 27 and for , and an arbitrary 10
)541(1374321 incmLLL ===oF uniform temperature decrease in the deck the results of compatibility
equations and FE model are compared (table 30). Results show that deck stresses do not depend on length of span. Figure 84 and 85 show comparison of the deck top and bottom stresses for different boundary conditions.
0200400600800
1000120014001600
3 S
pan
2 S
pan
Fixe
d-Fi
xed
Fixe
d-Fi
xed
w/o
Axi
al
Fixe
d-P
in
Pin
-Pin
Pin
-Rol
ler
Stre
ss (K
N)
Bending Compatibility Equations Finite Element Results
Figure 84. Comparison of deck bottom stresses for different boundary conditions.
113

0
200
400
600
800
1000
1200
1400
1600
3 Span 2 Span Fixed-Fixed
Fixed-Fixed
w /o AxialRestraint
Fixed-Pin Pin-Pin Pin-Roller
Stre
ss (K
Ni)
Bending Compatibility Equations Finite Element Results
Figure 85. Comparison of deck bottom stresses for different boundary conditions.
Loading Definition for Simplified Procedure To investigate transverse deck cracking using developed equations, appropriate loading values and distributions should be chosen. These temperature distributions represent the effect of different thermal factors which cause deck cracking. There are four major different causes producing stress and strain in the system. These four causes are autogenous shrinkage, drying shrinkage, hydration temperature rise, and temperature gradient. Creep strains are not included among the causes. Excluding stress relief due to creep strains results in higher stresses in the system. Due to early occurrence of these cracks, creep strains seems to not contribute significantly and it is justifiable to ignore creep strains. However, if long-term performance of bridge deck is being investigated, creep effect should also be included. Temperature profile and values in the section are the key parameters in estimating deck stresses. For modeling purposes and uniformity in the equations, shrinkage strains will be converted to equivalent temperature change (by dividing the strain by the coefficient of thermal expansion) and it will be added to other thermal loadings. Procedures based on design guidelines and literature to obtain reasonable values and profiles for each of the four thermal loadings are presented. Drying and Autogenous Shrinkage Drying shrinkage is the result of water loss of hardened concrete. Volume of concrete reduces as water withdraws from concrete. However, only part of (40-70 percent) the
114

shrinkage is recoverable with future wetting cycles. Both AASHTO (LRFD, 1986) and ACI (Committee 207, 1986) recommend different equations for shrinkage computation. Either of these equations can be used in evaluating shrinkage strains, although AASHTO (LRFD, 1986) equation results in lower shrinkage strains. In absence of any other data, engineering judgment should determine the use of one of these two equations. ACI (Committee 207, 1986) recommends the following equation for predicting drying shrinkage strain of moist cured concrete:
3, 1078.0
35−×
+=
ttKK hvstshε (34)
Whereas AASHTO recommends:
3, 1051.0
35−×
+=
ttKK hvstshε (35)
In this formula tsh,ε is the shrinkage at time t, and are volume to surface coefficient and humidity coefficient and t is the time after curing. Both codes provide guidelines for choosing K values.
,vsK hK
Due to small thickness of the bridge deck, shrinkage strains across the section are considered uniform. This means that a temperature decrease equal to Decktsh αε /, should be applied to deck concrete to model shrinkage. Autogenous shrinkage is the concrete shrinkage without loss of water. This kind of shrinkage occurs at low w/c ratios and significantly increases with use of silica fume, HRWRAs (High Range Water Reducing Admixtures) and finer cement. In the past, this type of shrinkage was insignificant. However, with the downward trend of w/c ratio in concrete mixes, use of silica fume, use of finer cements and widespread use of HRWRAs, this type of shrinkage has come into attention. If there is any indication that this type of shrinkage may be involved, magnitude of this shrinkage should be considered in a similar manner. Temperature Gradients Daily temperature variations and solar radiation produces temperature differential throughout the section. Stresses produced by this temperature differential add up to the locked in stresses from different types of shrinkage. AASHTO (LRFD, 1986) provides guidelines for estimating positive and negative temperature gradients through the depth. The temperature gradient profile suggested by AASHTO (LRFD, 1986) for concrete girder is shown in figure 86, where C shall be taken as:
• 30-cm (12.0-inch) for concrete superstructures that are 16.0” or more in depth. • 10-cm for concrete sections shallower than 40-cm (16.0-inch), (4.0-inch) less
than the actual depth. • 30-cm (12.0-inch) for steel superstructures.
115

Based on the location of the bridge, different values are suggested by AASHTO to define the temperature profile (table 31).
Figure 86. AASHTO temperature gradient profile for steel and concrete girders.
Table 31. Basis for temperature gradients (AASHTO LRFD 1998).
Zone T1 oC (oF) T1 oC (oF) 1 30 (54) 7.8 (14) 2 25.6 (46) 6.7 (12) 3 22.8 (41) 6.1 (11) 4 21.1 (38) 5 (9)
Temperature Rise Due to Hydration Concrete temperature rises after placement due to hydration. If the concrete is restraint, part of temperature rise, subsequent cooling, and increase in modulus of elasticity produces tensile stresses in concrete and may cause cracking a few days after placement. It is also possible that these locked in stresses add up to stresses produced by other causes. To evaluate hydration temperature effects, the maximum temperature rise during hydration should be estimated. After computing the maximum temperature rise the structure should be analyzed under a temperature drop equal to peak temperature minus setting temperature (worst case scenario). Setting temperature of bridge is defined as actual air temperature averaged over 24-hour period immediately preceding setting (AASHTO LRFD, 1986).
116

ACI report 207 (1986) which mainly discusses mass concrete provides a method for estimating the maximum temperature rise during hydration. ACI mentions, “The report can be applied to normal structural concrete; however its application is not usually warranted”. In the absence of any other data, it is suggested that ACI procedure can be applied to estimate the maximum temperature rise.
Windows Based Application A user friendly MS Windows based application is prepared to perform the analysis based on input values from the user. Figure 87 shows typical input and output windows of the program. The program can be downloaded from http://web.njit.edu/~ala.
Figure 87. Typical input and output window of application.
117

CONCLUSIONS AND RECOMMENDATIONS Many concrete bridge decks develop transverse cracking and most of these cracks develop at early ages, right after construction. These cracks are typically full-depth and spaced 1-3 m (3-10 ft) apart along the length of the bridge. Transverse cracks can accelerate corrosion of reinforcing steel, deteriorate deck concrete, possibly cause damage to underneath components of the bridge, and damage bridge esthetic. As a result of these adverse effects of transverse cracking, the maintenance costs will increase and ultimately the service life of the bridge system will be shortened. There have been many studies on the cause of transverse deck cracking over the past several decades. However, the causes of transverse deck cracking are not yet fully understood and the problem still exists. Previous studies were mostly focused on concrete mix design and improvement through changes to construction practice to alleviate shrinkage problems. In many instances there are major disagreements on the factors affecting transverse cracking indicating the need for further research. As a part of this research study 24 bridges were surveyed in the state of New Jersey. Material and mix design values for these bridges were consistent with the recommendations reported in the literature. Despite this fact, the majority of bridges surveyed have developed cracks, highlighting the importance of design factors, which was the main thrust of this study. Cracks in concrete occur when a restraint mass of concrete tends to change volume. Volume change in concrete depends on mix design and construction procedures. Restraint, which is basically due to composite action of deck and girder, depends on design characteristics of the bridge such as continuity, relative deck to girder stiffness, span length, girder spacing, amount of deck reinforcement, etc. To study these factors several 2-D and 3-D linear and nonlinear finite element models were employed. Results along with specific conclusions are presented in detail in chapter 5 and will not be repeated here. However, based on these analytical works, survey of bridges, and literature review, several conclusions can be highlighted. These are presented in the form of specific recommendations for possible implementation, and are grouped under the categories of structural design factors, mix design, and construction practices.
Structural Design Factors: Recommendations Specify an Upper Limit on Concrete Strength Survey results indicate that the actual strength is much higher than the specified design strength. Therefore, it is recommended that an upper limit on concrete strength be required. This should not be viewed upon as discouragement to the use of HSC but rather a requirement on design versus actual concrete strength. Also, when “open-early” is not an issue, design should use low-early strength concrete.
118

Boundary Restraints Should Be Consistent with Design Construction practice should not introduce undue boundary restraint on the girders. For example, for a span designed as simply supported, which is desirable under shrinkage load, the girders should not be embedded in the end diaphragms or they should be debonded. Time-Dependent Loadings Must Be Considered in Design of Bridges with Integral Abutments Integral abutments have many structural and maintenance benefits and are becoming more popular around the nation, including in the state of New Jersey. However, bridges with integral abutments have a much higher tendency for transverse deck cracking. Therefore, time and temperature dependent loadings must be explicitly considered in their design. A simple and effective design tool to facilitate this aspect of design has been developed under this study (see chapter 6). Minimize the Ratio of Girder/Deck Stiffness Try to minimize the ratio of girder to deck stiffness through changes in deck thickness, girder spacing, and girder moment of inertia. As has been shown, larger spacing, flexible girders and thicker decks are preferred. Try to provide the required moment of inertia with more contribution from the deck. Employ More Flexible Superstructures Analyses results indicate that more flexible superstructures have lower tendency for deck cracking. Therefore, the design should employ a more flexible superstructure. This objective can be pursued through two different venues. Under current practice, where there is a deflection limit, the design manual should prevent design of an overly stiff superstructure by putting a limit on the margin by which the deflection requirement is satisfied. Currently, strength requirements usually control the design and deflection is only checked. It is quite common for this requirement to be satisfied by a very large margin (e.g., deflection equal to 1/1500 of span length as oppose to required 1/1000 of span length). A second approach, consistent with AASHTO LRFD, would be to drop deflection requirement under service load or at least to increase the limit. Use Uniform Reinforcement Meshes Uniform reinforcement meshes on top and bottom are recommended to control cracking. Use of empirical design method is encouraged. Increasing the volume of reinforcement above code requirement does not have any effect on cracking and is discouraged.
119

Consider AASHTO Article 3.12 Current designs often do not explicitly consider time-dependent loadings as specified under AASHTO article 3.12. Such a consideration is recommended. A simple windows application tool (StrEstimate) has been developed under this study to facilitate comparison of different designs and estimate deck stresses during the design stage.
Mix Design: Recommendations Adopt a Restraint Shrinkage Test Concrete mix to be used in bridge deck should be tested for cracking using one of cracking tendency tests described in this report. Cements and mixes with poor results should not be used in bridge deck.
Reduce cement content to 650-660 lb/yd3, and consider using fly ash. Use AASHTO specification Type II cement for bridge deck construction. Limit Water Cement Ratio Limit water cement (w/c) ratio to 0.4-0.45. Make use of water reducers to reduce water content. Consider w/c<0.4 with the use of water reducers.
Aggregate Size and Shape
• Use largest possible grain size as specified in ACI –318. • Use crushed stone for coarse aggregate. • Maximize aggregate content.
Consider using type K Shrinkage Compensating Concrete when available
Construction Practices: Recommendations Employ the following pouring sequence
• Pour complete deck at one time whenever feasible within the limitation of the maximum placement length based on drying shrinkage consideration.
• If multiple placements must be made and the bridge is composed of simple spans, then place each span in one placement.
• If bridge is simple span, but cannot be placed in a single placement, divide the deck longitudinally and make two placements.
120

• If the bridge is simple span and single placement cannot be made over full span length, then place the center of span segment first and make this placement as large as possible.
• If multiple placements must be made and the bridge is continuous span, then place concrete in the center of positive moment region first and observe a 72-h delay between placements.
• When deck construction joints are created, require priming existing interfaced surfaces with a Primer/Bonding agent prior to placement of new concrete.
Wind, Weather and Concrete Temperature (Already included in the NJDOT Specs) Follow procedures in sections 501.12 and 501.17 of NJDOT Specs. Make use of evaporation rate chart proposed by ACI. Cast the deck in mild temperatures. It is also recommended that wind and humidity levels be recorded on the Inspection/Testing datasheets.
Protection and curing (Already included in NJDOT Specs) Follow procedures in section 501.17. Start curing immediately after finishing and cure at least seven consecutive calendar days. If “early-open” is not an issue consider 14-day wet curing.
Use temporary shoring for simply supported girders when practical
Future Research Needs In light of the results of this and prior studies and the recommendations made under this study the following areas for possible future research work are identified. Restraint Shrinkage Tests There are two distinct shrinkage tests (bar test and ring test) that can be used in determining shrinkage potential of deck concrete. A study should be conducted to determine the suitability of one of these two tests. More importantly, although several highway agencies are considering the use of these tests, there is still a great need for additional research work to quantify the results of these tests. Impact of Flexible Superstructure One recommendation of this study is to employ a more flexible superstructure. It is prudent to conduct additional research study on the implication of this recommendation on serviceability requirements. Results of such a study will also be beneficial in determining the impact of AASHTO-LRFD provision (or lack of) on deflection.
121

Study on Construction Practices As it was mentioned before, many of the recommendations on mix design and construction practice already exist in the most recent version of NJDOT Standard Specifications for Road and Bridge Construction (NJDOT Specs.). A study to monitor and compare performance of bridges built based on these specifications will be valuable to our understanding of the causes of deck cracking and will help in identifying more specifically the important construction and mix design factors. Controlled Composite Action As discussed before, there is an agreement among researchers that shrinkage (thermal and drying) and a temperature gradient of restraint deck are the main causes of cracking. The restraining effect is basically due to the composite design of the superstructure. Composite construction reduces the size of girders, which means less cost. While an economical design requires composite behavior under ultimate loads, under initial portion of service loads (such as dead load) the girders alone are generally capable of resisting the entire load. Thus, shrinkage cracking can be prevented if a mechanism can be developed to prevent composite action during early ages (i.e., as concrete shrinks), while it is activated for higher service load and under ultimate loading condition. To achieve this objective (i.e., no composite action initially and full composite action ultimately) the shear connectors can be wrapped in hyperelastic material of carefully designed thickness, as shown in figure 88. Design of these materials, i.e., their thickness, modulus of elasticity, etc. should be chosen very carefully to achieve the required controlled composite action (CCA). A typical stress strain curve for hyperelastic materials is shown in figure 89. Under low level of stresses the material does not provide any resistance and it deforms easily. Thus, when the shear connectors are wrapped by such a material the concrete deck can shrink without any restraint. There might be a need for bond breaker between the deck and girder to further reduce bonding. Upon development of shrinkage strains the hyperelastic material will start to develop higher level of resistance and will ultimately provide full composite action. Proper design will require development of a realistic relationship between the shrinkage strain and the wrap thickness. A feasibility study to investigate the viability of such a design is highly recommended since it has the potential to entirely eliminate the problem of transverse cracking in concrete bridge decks.
122

Figure 88. Details of controlled composite action connector.
Figure 89. Stress-strain curve for typical hyperelastic materials
123

REFERENCES 1. American Association of State Highway and Transportation Officials. AASHTO
LRFD Bridge Design Specification, 2nd Edition. Washington D.C., 1998. 2. ACI committee 209. Prediction of Creep, Shrinkage, and Temperature Effects.
Detroit, 1978. 3. ACI Committee 207. Shrinkage and Creep effects in Concrete. Detroit, 1986. 4. ACI committee 308. Standard Practice for Curing Concrete. Detroit, 1986. 5. American Concrete Institute. ACI Manual of Concrete Practice- Part 1:Materials and
general Properties of Concrete, Detroit, 1986. 6. ANSYS. Computer Software, ANSYS Corporation, 1994-1998. 7. K. Babaei and R.L. Purvis. “Premature Cracking of Concrete Bridge Decks: Cause
and Methos of prevention” Proceedings, 4th International Bridge Engineering Conference, 1996.
8. R.L. Blaine, H.T. Arni, D.H. Evans, M.R. Defore, J.R. Clifton and R.G. Methey. “Interrelation between Cement and Concrete Properties” Building Research Division of National Bureau of Standards, 1953.
9. R. Breitenbucher and M. Mangold. “Minimization of Thermal Cracking in Concrete Members at Early Ages” Thermal Cracking in Concrete at Early Ages, E&FN Spon, London, pp.205-212, 1994.
10. Burrows R, Visible and Invisible Cracks. ACI Monograph No. 11, 1999. 11. R.W. Carlson. “Cracking of Concrete” presented at Joint meeting of the Boston
Society of Civil Engineers and The Designers’ Section, BSCE, Jan. 14, 1942. 12. T.T.H. Cheng and D.W. Johnston. Incidence Assessment of Transverse Cracking in
Concrete Bridge Decks: Construction and Materials Considerations. Rep. No. FHWA/NC/85002, 1, Dep. Of Civ. Engrg., North Carolina State University, Raleigh, N.C., 1985.
13. J.J. Chui and W.G. Dilger. “Temperature Stress and Cracking Due to Hydration Heat”, Creep and Shrinkage of Concrete, E&FN Spon, London, pp.271-276, 1993.
14. F.H. Dakhil, P.D. Cady and R.E. Carrier. “Cracking of Fresh Concrete as Related to Reinforcement” ACI Struct. Journal, 72(8), pp. 421-428, 1975.
15. J. Ducret and J. Lebet. “Measurements on a Composite Bridge: Effect of Concrete Hydration” Proceedings of an Engineering Foundation Conference, American Society of Civil Engineers, New York, 1996.
16. J. Emanuel and J. L. Hulsey. “ Temperature distributions in composite bridges” Journal of Structural Division, ASCE, Jan 1978, pp 65-78.
17. C. French, L. Eppers, Q. Le, and J.F. Hajjar. “Transverse cracking in concrete bridge decks” Transportation Research Record. n 1688 Nov 1999. p 21-29.
18. R.J. Frosch, R.D. Radabaugh and D.T. Blackman. “Investigation of Transverse Deck Cracking“ ASCE Structures Congress, Denver, April 2002.
19. G.T. Halverson. “Troubleshooting concrete cracking during construction,” Aberdeen’s Concrete Constr., 36(11), 811-816, 1991.
124

20. J. Houde. Study of force-displacement relationship for the finite element analysis of reinforced concrete. Report No. 72-3, Dept. of Civil Engineering and applied mechanics, McGill University, Montreal, Dec. 1973.
21. M.A. Issa. “Investigation of cracking in concrete bridge decks at early ages” Journal of Bridge Engineering, V 4 n 2 1999, p 116-124.
22. A.A. Khan, W.D. Cook, and D. Mitchell. “Thermal properties and transient thermal analysis of structural members during hydration” ACI Materials Journal, V95 n 3 May-Jun 1998, p 293-303.
23. T. Kochanski, J. Parry, D. Pruess, L. Schuchardt, and J. Ziehr, J. Premature Cracking of Bridge Decks Study. Wisconsin Dept. of Transportation, Madison, Wisconsin, 1990.
24. P.D. Krauss, and E.A. Rogalla. Transverse Cracking in Newly Constructed Bridge Decks. NCHRP Report 380, Transportation Research Board, Washington, DC, 1996.
25. Microsoft Access 2000, Computer Software, Microsoft Corporation, 1992-1999. 26. Microsoft Excel 2000, Computer Software, Microsoft Corporation, 1985-1999. 27. C. Meyers. Survey of Cracking on Underside of Classes B-1 and B-2 Concrete
Bridge Decks in District 4. Investigation 82-2, Division of Material and Research, Missouri Highway and Transportation Department, Jefferson City, Mo., 1982.
28. New Jersey Department of Transportation. 1998 Standard Specification for Road and Bridge Construction and 1998 Supplemental Specification. Trenton, NJ, 1998.
29. Portland Cement Association. Final Report - Durability of Bridge Decks – A cooperative Study. Skokie, Illinois, 1970.
30. H.B. Prenger. Bridge deck crackin, Research report. Rep. No. MD-93-04, Maryland Dept. Of Transp., State Highway Administration, Baltimore, Md.,19., 1992.
31. M. Paillere, M. Buil and J.J. Serrano. “Effect of Fiber Addition on the Autogenous Shrinkage of Silica Fume Concrete” ACI Material Journal, V.86, No.2, Mar.-Apr., pp. 139-144, 1989.
32. G.E. Ramey, A.R. Wolff, R.L. Wright. “Structural design actions to mitigate bridge deck cracking” Practice Periodical on Structural Design & Construction, v 2 n 3 p 118-124, 1997.
33. T.R. Schmitt, D. Darwin. “Effect of material properties on cracking in bridge decks” Journal of Bridge Engineering, v 4 n 1, p 8-13, 1999.
34. E. Tazawa, Y. Matsouka, S. Miyazawa, and S. Okamoto. “Effect of Autogenous Shrinkage on Self Stress in Hardening Concrete” Thermal Cracking in Concrete at Early Ages, E&FN Spon, London, pp.222-228, 1994.
35. E. Tazawa and S. Miyazawa. “Experimental Study on Mechanism of Autogenous Shrinkage of Concrete” Cement and Concrete Research, V.25, No.8, pp. 1633-1638, 1995.
125

36. R. Sprinegnschmid and R. Breitenbucher “Cement with low crack Susceptibility”, Proceedings of Advances in Cementitious Materials Conference, American Ceramic Society, pp. 701-713, 1990.
37. R. Sprinegnschmid, R. Breitenbucher and M. Mangold. “Thermal Cracking in Concrete at Early Ages”, E7FN Spon, London, pp. 137-134, 1994.
38. G.J. Verbeck and G.J. Foster. “Long-term study of cement performance in concrete” ASTM Proceedings, Vol 50, pp 1235-1257, 1950.
39. Winter and Nilson. Design of concrete structures. Mc-Graw Hill, 1986. 40. L.C.P. Yam, and J.C. Chapman. “The inelastic behaviour of simply supported
composite beam of steel and concrete”, Proc. Istin Civ. Engrs, 1968, 41, Dec., 651-683.
41. W. Zuk. “Thermal and Shrinkage Stresses in Composite Beams” Journal of ACI, Vol 58,p327-339, 1961.
126

APPENDIX A: BRIDGE INFORMATION AND SURVEY RESULTS
This appendix contains important structural design, material properties, concrete mix design and some construction information, supplemented by the results of field surveys of several bridges. Data presented here were collected from different sources and were used in various parts of the study (see chapter 3). Following this introduction, section A.2 describes major elements of the data for these bridges and how they are grouped. Definitions of some data entry are also provided when necessary. The final section (section A.3) presents the data for bridges surveyed.
Organization The data presented for each bridge is grouped into six parts. Part one contains general information about the bridge. This information includes geographical location of the bridge (i.e. county, township) and construction year, which are obtained from the original list provided by NJDOT and subsequently entered into the survey forms. Part two summarizes important design characteristics of the bridge. These data are mostly derived from the structural plans of the bridge. Note that spans are numbered in the direction of traffic when it is only in one direction on the bridge, otherwise span number is explicitly identified. This part contains the following structural design related data for each span:
• Number of spans. • Traffic direction. • Girder type. • Span type (i.e., continuous or simply supported at interior spans). • Span length and width. • Framing information (i.e., spacing of girders in each span). • Deck design information (i.e., rebar details, thickness, cover depth, and wearing
surface). • Girder properties (i.e., area, depth, and moment of inertial). • Shear stud spacing.
In some cases where the data item is not constant through the range considered, like span length in curved bridges or the moment of inertia when different girders are used in one span, the range of data for that item is reported. Part three presents material properties and mix design information based on NJDOT inspection/testing datasheets. This information includes cement type, cement content, water content, air content, w/c ratio, compressive strength, slump and admixtures. As
127

explained in chapter 3, these data represents an average value of the data item considered for the bridge. In part four construction related data, such as air temperature, concrete temperature at the time of placement, and the month of casting are reported. These data are also obtained from the NJDOT inspection/testing datasheets. Part five summarizes the survey results, and finally part 6 presents observations and photos during the survey, if any.
Bridge Information and Survey Results Bridges are ordered based on the first four digits of NJDOT structure numbers, from the lowest to the highest.
128

Structure Number 0206-165 1.General Information Bridge Location Hackensack Avenue over NJ RT4 County Bergen County City Hackensack Year Built 1998 2.Structural Design Information
Number of spans: 2 Direction of Traffic: Two ways Girder type: Steel Girder Span type: Simply Supported Type Of Bearing: Steel Bearings Skewness: None
North Bound South Bound Span Number 1 2 1 2 Span Width 47’-0” 47’-0” 47’-0” 47’-0” Span Length 90’-2” 90’-2” 90’-2” 90’-2”
Framing Information: -North Bound (All Spans): 5 Girders@7’-6” + 2 Girders@6’-3” -South Bound (All Spans): 7 Girders@7’-1” Deck Slab Information: Deck Thickness 81/2” Top Cover 21/2” Wearing Surface Concrete, Sawcut Bottom Cover 1” Longitudinal Rebar Information: -North & South Bound (All Spans): #5@6”(B), #5@15”(T) Transverse Rebar Information: -North & South Bound (All Spans): #6@7”(T&B) Girder Information:
North & South Bound Span Number I (in4) A (in2) Depth (in)
1&2 26876.39 15.58 38.5 Shear Stud Information:
North & South Bound Span Number Spacing (in) Number of Studs in Row 1&2(Midspan) 12 4 1&2(Support) 9 4
3.Material Properties & Mix Design Information Cement Type: Blue Circle Atlantic Type II Cement Content: 658 lb/yd3
Water Content: 35 Gal/yd3
W/C Ratio: 0.44 Air Content: 6.6% Compressive Strength: 5174 Psi Slump: 3.5” Admixtures: Water Reducer
129

4.Construction Information Air Temperature: 73 F Concrete Temperature: 83 F Month Of Casting: August-September 5.Survey results Crack Information:
North Bound South Bound Span No. 1 2 1 2
Type Transverse/Other Transverse/Other Transverse/Other Transverse/Other Location Center/End Center/End Center/End Center/End Spacing 0’-2’ 0’-2’ 0’-2’ 0’-2’
Size Typical Typical Typical Typical Survey Team Member: Ala 6. Observations & Photos -None
130

Structure Number 0713-151 1.General Information Bridge Location RT21-I-78, RAMP FROM 21S TO I-78 WEST County Essex Township Newark Year Built 2000 2.Structural Design Information
Number of Spans: 8 Direction of Traffic: One way Girder type: Steel Girder Span type: Mixed (3 Continuous + 1 Simply supported+ 4 Continuous) Type Of Bearing: Steel Bearings Skewness: Mild
Ramp Span Number 1 2 3 Span Width 29’-6”~32’-4” 29’-6” 29’-6”~ 42’-5” Span Length 165’-6” 158’-8” 143’-10”
Span Number 4 5 6 Span Width 42’-9”~82’-1” 38’-6” 38’-6” Span Length 142’-7” 131’-6” 165’-0”
Span Number 7 8 Span Width 38’-6” 36’-`0”~38’-6” Span Length 165’-0” 131’-2”
Framing Information: -Ramp: -Span 1: 4 Girders @8’-2” -Span 2: 4 Girders @8’-2” -Span 3: 4 Girders @8’-2”~12’-6” -Span 4: 3 Girders @8’-2”~12’-9”+4 Girders@ 6’-4”~12’-10” -Span 5: 4 Girders @11’-2” -Span 6: 4 Girders @11’-2” -Span 7: 4 Girders @11’-2” -Span 8: 4 Girders @11’-2” Deck Slab Information: Deck Thickness 91/2”” Top Cover 21/2” Wearing Surface Concrete, Turf Drug Bottom Cover 1” Longitudinal Rebar Information: -All Spans Midspan: #5@8”(B), #5@15”(T) -Continuous Spans Over Pier: #5@8”(B), #5@71/2”(T) Transverse Rebar Information: -All Spans EB: #6@6”(T&B) Girder Information:
Ramp Span Number I (in4) A (in2) Depth (in) 1 (Midspan) 76151~105242 81.5~100.75 78~79 1 (support) 66278~165253 73.75~136.25 78~81
131
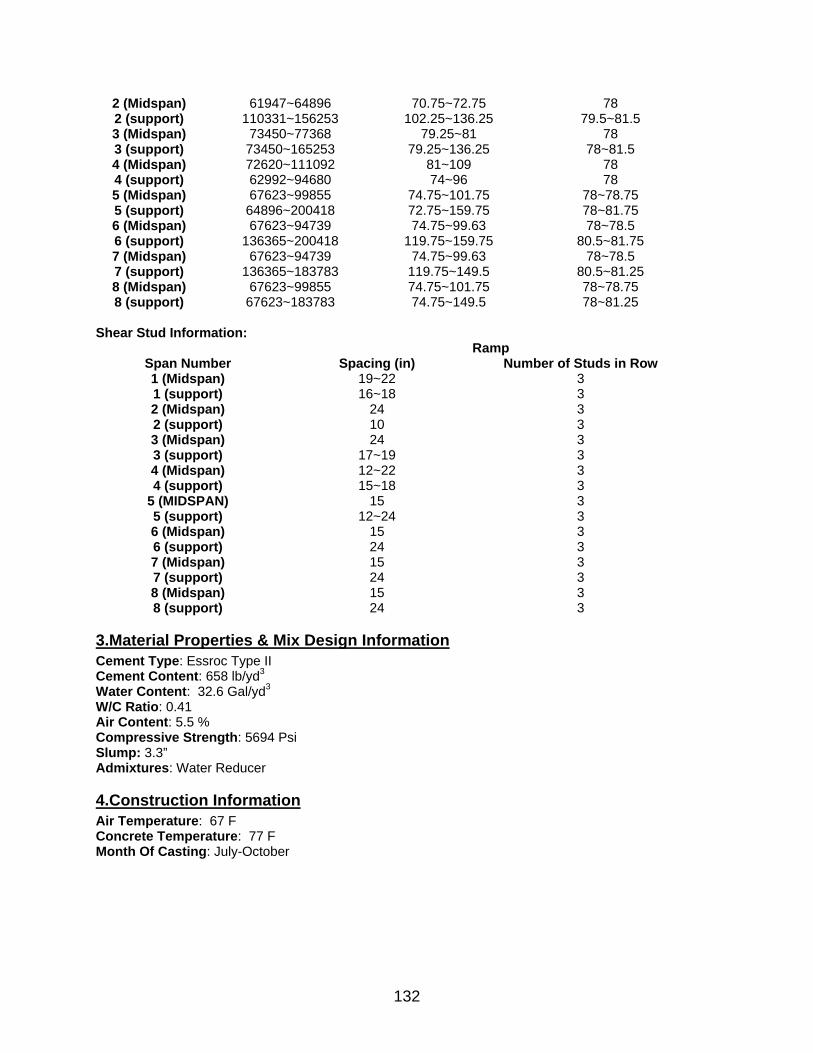
2 (Midspan) 61947~64896 70.75~72.75 78 2 (support) 110331~156253 102.25~136.25 79.5~81.5 3 (Midspan) 73450~77368 79.25~81 78 3 (support) 73450~165253 79.25~136.25 78~81.5 4 (Midspan) 72620~111092 81~109 78 4 (support) 62992~94680 74~96 78 5 (Midspan) 67623~99855 74.75~101.75 78~78.75 5 (support) 64896~200418 72.75~159.75 78~81.75 6 (Midspan) 67623~94739 74.75~99.63 78~78.5 6 (support) 136365~200418 119.75~159.75 80.5~81.75 7 (Midspan) 67623~94739 74.75~99.63 78~78.5 7 (support) 136365~183783 119.75~149.5 80.5~81.25 8 (Midspan) 67623~99855 74.75~101.75 78~78.75 8 (support) 67623~183783 74.75~149.5 78~81.25
Shear Stud Information:
Ramp Span Number Spacing (in) Number of Studs in Row 1 (Midspan) 19~22 3 1 (support) 16~18 3 2 (Midspan) 24 3 2 (support) 10 3 3 (Midspan) 24 3 3 (support) 17~19 3 4 (Midspan) 12~22 3 4 (support) 15~18 3
5 (MIDSPAN) 15 3 5 (support) 12~24 3 6 (Midspan) 15 3 6 (support) 24 3 7 (Midspan) 15 3 7 (support) 24 3 8 (Midspan) 15 3 8 (support) 24 3
3.Material Properties & Mix Design Information Cement Type: Essroc Type II Cement Content: 658 lb/yd3
Water Content: 32.6 Gal/yd3
W/C Ratio: 0.41 Air Content: 5.5 % Compressive Strength: 5694 Psi Slump: 3.3” Admixtures: Water Reducer 4.Construction Information Air Temperature: 67 F Concrete Temperature: 77 F Month Of Casting: July-October
132

5.Survey results Crack Information:
Ramp Span No. All Spans
Type Transverse Location All over Spacing >5’
Size Hair Line Survey Team Member: Ala, Allyn, Ross and Raj 6. Observations & Photos -Not open to traffic at the time of survey but used by construction vehicle -Hairline Cracks Observed.
Figure 90. Crack on the deck (Bridge No 0713-151).
133
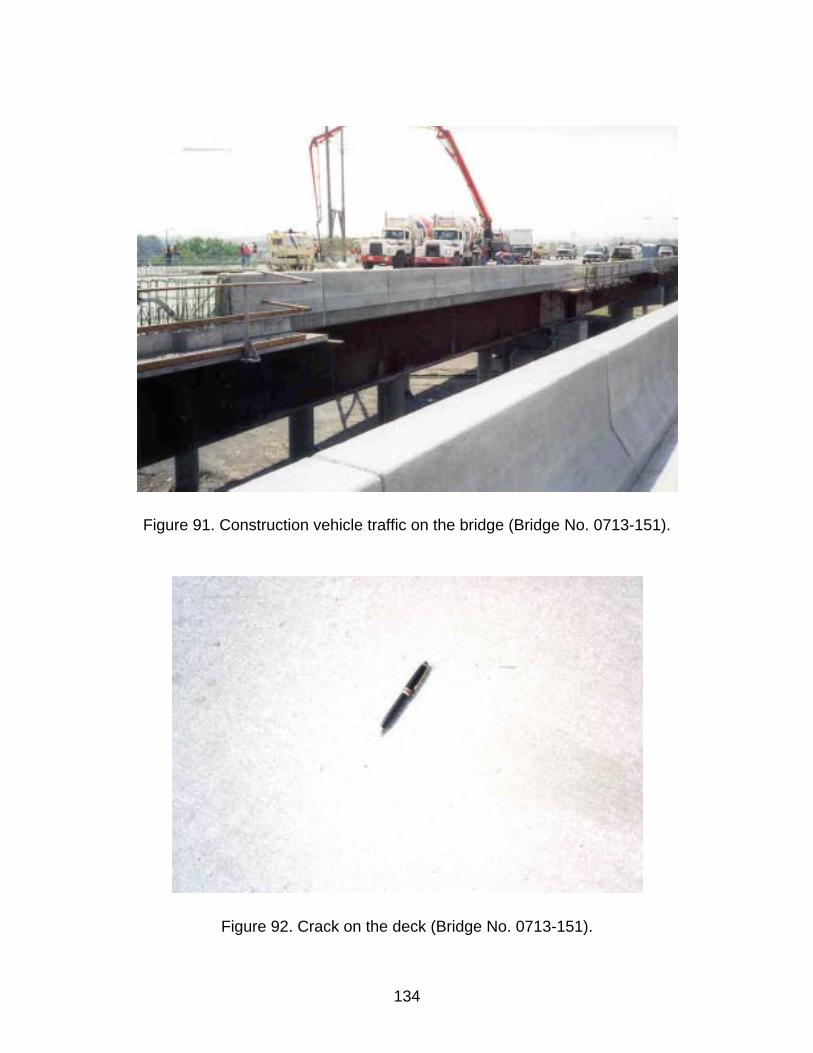
Figure 91. Construction vehicle traffic on the bridge (Bridge No. 0713-151).
Figure 92. Crack on the deck (Bridge No. 0713-151).
134

Figure 93. Crack extending into the parapet (Bridge No. 0713-151).
135

Figure 94. Crack on deck and parapet (Bridge No. 0173-151).
136

Structure Number 1013-151 1.General Information Bridge Location RT31 Over South Branch Raritan River County Hunterdon County Township Clinton Year Built 1996 2.Structural Design Information
Number of spans: 2 Direction of Traffic: Two ways Girder type: Prestressed Concrete Girder Span type: Simply Supported Type Of Bearing: Steel Bearings Skewness: Mild
North Bound South Bound Span Number 1 2 1 2 Span Width 49’-0” 49’-0” 52’-9” 52’-9” Span Length 124’-10”~125’-1” 124’-11”~124’-10” 124’-10”~124’-9” 124’-10”~124’-7”
Framing Information: -North Bound: -Span1: 6Girders@7’-11” + 1 Girder@Varies (7’-10”~6’-9”) -Span2: 6Girders@7’-4” + 1 Girder@Varies (6”-9”~ 6’-1”) -South Bound: -Span1: 6Girders@8’-0” + 1 Girder@Varies (6’-6”~7’-2”) -Span2: 6Girders@7’-10” + 1 Girder@Varies (7”-2”~ 8’-3”) Deck Slab Information: Deck Thickness 73/4+11/4” Latex Concrete Top Cover 21/4” Wearing Surface Latex Concrete, Sawcut Bottom Cover 1” Longitudinal Rebar Information: -North Bound (All Spans): #5@9”(B), #5@15”(T) -South Bound (All Spans): #5@6”(B), #5@15”(T) Transverse Rebar Information: -North Bound (All Spans): #6@8”(T&B) -South Bound (All Spans): #5@6”(T&B) Girder Information:
North & South Bound Span Number I (in4) A (in2) Depth (in)
1&2 761550.4 1125 72 Shear Stud Information:
North & South Bound Span Number Spacing (in) Number of Studs in Row 1&2(Midspan) 12 2 1&2(Support) 6 2
137

3.Material Properties & Mix Design Information Cement Type: Essroc Type II Cement Content: 611 lb/yd3
Water Content: 32.5 Gal/yd3
W/C Ratio: 0.44 Air Content: 5.4% Compressive Strength: 5241 Psi Slump: 3.5” Admixtures: Water Reducer 4.Construction Information Air Temperature: 54 F Concrete Temperature: 65 F Month Of Casting: October 5.Survey results Crack Information:
North Bound South Bound Span No. 1 2 1 2
Type None None None None Location - - - - Spacing - - - -
Size - - - - Survey Team Member: Ala, Rambod 6. Observations & Photos -Cracks on side walk -Crack on North bound Approach slab
Figure 95. A view from underneath the bridge (Bridge No. 1013-151).
138

Figure 96. Girder end condition at the abutment (Bridge No. 1013-151).
139

Structure Number 1103-158 1.General Information Bridge Location Alexander RD Over US 1 County Mercer County Township West Windsor Year Built 1996 2.Structural Design Information
Number of Spans: 2 Direction of Traffic: Two ways Girder type: Steel Girder Span type: Simply Supported Type Of Bearing: Steel Bearings Skewness: None
East Bound West Bound Span Number 1 2 1 2 Span Width 67’-10” 67’-10” 43’-9” 43’-9” Span Length 95’-3” 95’-3” 95’-3” 95’-3”
Framing Information: -East Bound (All Spans): 9 Girders@7’-11” + 1 Girder@5’-3” -West Bound (All Spans): 6 Girders@7’-11” Deck Slab Information: Deck Thickness 83/4” Top Cover 21/2” Wearing Surface Concrete, Sawcut Bottom Cover 1” Longitudinal Rebar Information: -All Spans EB & WB: #5@6”(B), #5@15”(T) Transverse Rebar Information: -All Spans EB & WB: #6@6”(T&B) Girder Information:
East & West Bound Span Number I (in4) A (in2) Depth (in) 1&2 (Midspan) 38457.26 96.375 45.125~45.5 1&2 (Support) 24587.67 68.875 45.125~45.5
Shear Stud Information:
East & West Bound Span Number Spacing (in) Number of Studs in Row 1&2 (Midspan) 14” 4 1&2 (Support) 9” 4
3.Material Properties & Mix Design Information Cement Type: White Hall Type II Cement Content: 678 lb/yd3
Water Content: 32.4 Gal/yd3
W/C Ratio: 0.40 Air Content: 5.4% Compressive Strength: 5076 Psi Slump: 3.1” Admixtures: Water Reducer & Retarder
140
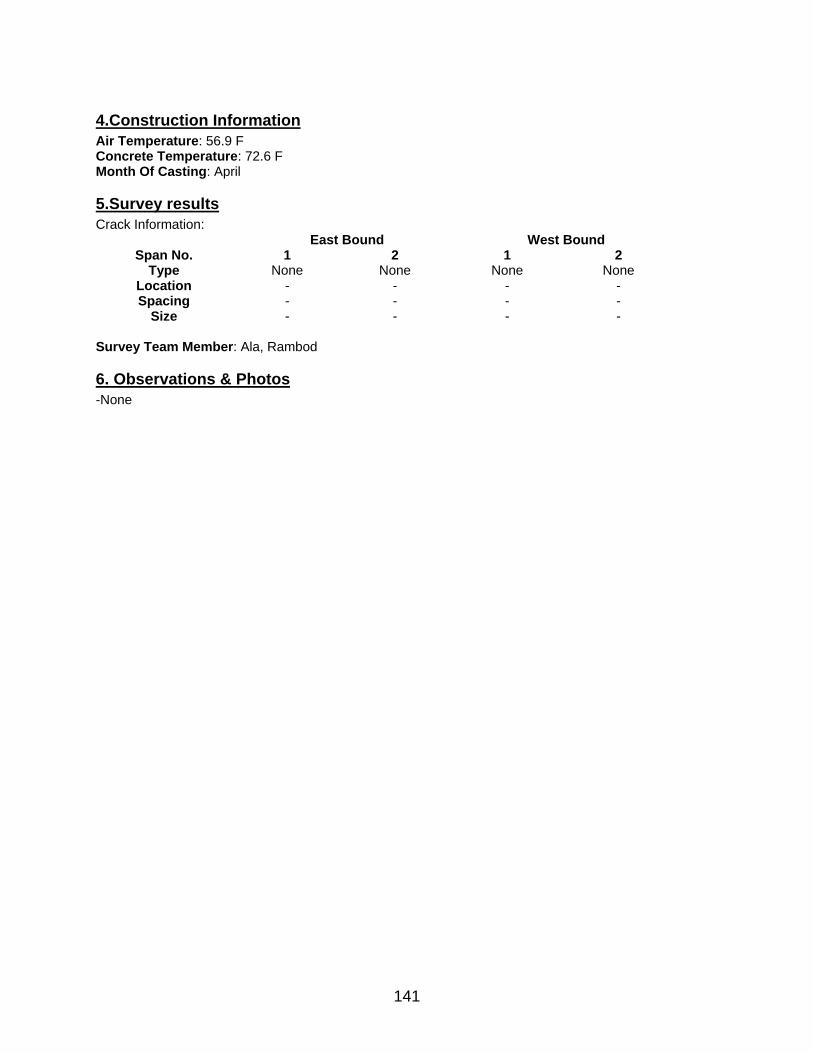
4.Construction Information Air Temperature: 56.9 F Concrete Temperature: 72.6 F Month Of Casting: April 5.Survey results Crack Information:
East Bound West Bound Span No. 1 2 1 2
Type None None None None Location - - - - Spacing - - - -
- Size - - -
6. Observations & Photos -None
Survey Team Member: Ala, Rambod
141

Structure Number 1130-152 1.General Information Bridge Location NJ Route 29 WB Over Watson’s Creek County Mercer Township Hamilton Year Built 1995 2.Structural Design Information
Number of Spans: 12 Direction of Traffic: One way Girder type: Prestressed Concrete Girder Span type: Mixed (1 Simply Supported + 1 Simply Supported+ 1 Simply Supported+ 3 Continuous+ 3 Continuous+ 3 Continuous) Type Of Bearing: Steel Bearings Skewness: None
West Bound Span Number 1 2 3 4 Span Width 59’-1”, 75’-
11”~51’-11” 111’~95’-3” 95’-3”~90’-1” 90’-1”~88’-9”
Span Length 88’-10” 90’ 90’ 90’
West Bound Span Number 5 6 7 8 Span Width 88’-9”~87’-6” 87’-6”~86’-3” 86’-3”~84’-7” 84’-7”~82’-4” Span Length 90’ 90’ 60’ 60’
West Bound
Span Number 9 10 11 12 Span Width 82’-4”~80’-6” 80’-6” 80’-6” 80’-6” Span Length 60’ 90’ 90’ 88’-10”
Framing Information: -West Bound: -Span 1: 8 Girders @7’-9” + 2 Girders @8’-5” + 6 Girders @9’~4’-11” -Span 2: 10 Girders @8’-5” + 3 Girders @9’-8” ~5’-1” -Span 3: 10 Girders @8’-5” + 2 Girders @7’-6” ~4’-9” -Span 4: 10 Girders @8’-5” + 1 Girders @9’-6” ~8’-3” -Span 5: 10 Girders @8’-5” + 1 Girders @8’-2” ~7’-0” -Span 6: 10 Girders @8’-5” + 1 Girders @6’-11” ~5’-8” -Span 7: 8 Girders @8’-5” + 3 Girders @7’-6” ~6’-10” -Span 8: 8 Girders @8’-5” + 3 Girders @6’-10” ~6’-3” -Span 9: 8 Girders @8’-5” + 3 Girders @6’-3” ~5’-7” -Span 10-11-12: 10 Girders @8’-5” Deck Slab Information: Deck Thickness 71/2”+ 11/4” Latex Concrete Top Cover 23/4” Wearing Surface Latex Concrete, Sawcut Bottom Cover 1” Longitudinal Rebar Information: -All Spans WB Midspan: #5@71/2”(B), #5@15”(T) -All Spans WB Pier: #5@71/2”(B), #5@71/2”(T) Transverse Rebar Information: -All Spans WB: #6@6”(T&B)
142

Girder Information:
West Bound Span Number I (in4) A (in2) Depth (in)
1-6 & 10-12 260034 789.0 54 7-8-9 125014 559.5 45
Shear Stud Information:
West Bound Span Number Spacing (in) Number of Studs in Row
1-6 & 10-12 (Midspan) 24” 2 1-6 &10-12(Support) 6” 2
7,8,9 (Midspan) 18” 2 7,8,9 (Support) 12” 2
3.Material Properties & Mix Design Information Cement Type: Essroc type II Cement Content: 700 lb/yd3
Water Content: 31.8 Gal/yd3
W/C Ratio: 0.38 Air Content: 5.5 % Compressive Strength: Psi Slump: 3” Admixtures: Water Reducer & Retarder 4.Construction Information Air Temperature: 51.3 F Concrete Temperature: 72.1 F Month Of Casting: November-December 5.Survey results Crack Information:
West Bound Span No. All Spans
Type None Location - Spacing -
Size - Survey Team Member: Ala, Fred and Tom 6. Observations & Photos -Continuity Joints cracked on this bridge but these joints did not cracked on the eastbound side bridge, which is similar to this bridge. Cracks are observed on eastbound side deck while the westbound side deck was un-cracked.
143

Figure 97. Cracked continuity joint (Bridge No. 1130-152).
Figure 98. Another cracked continuity joint (Bridge No.1130-152).
144

Figure 99. End condition in simply supported spans (Bridge No 1130-152).
145

146
Structure Number 1130-153 1.General Information Bridge Location NJ Route 29 EB Over Watson’s Creek County Mercer Township Hamilton Year Built 1995 2.Structural Design Information
Number of Spans: 11 Direction of Traffic: One way Girder type: Prestressed Concrete Girder Span type: Mixed (2 Continuous + 3 Continuous+ 3 Continuous+ 3 Continuous) Type Of Bearing: Steel Bearings Skewness: None
East Bound Span Number 1 2 3 Span Width 55’-9”, 47’-9”~50’-7” 55’-9”, 50’-7”~52’-11” 55’-9”, 52’-11”~54’-7” Span Length 88’-10” 90’ 90’
East Bound
Span Number 4 5 6-9 Span Width 55’-9”, 54’-7”~55’-6” 55’-9”, 55’-6”~55’-9” 55’-9”, 55’-9” Span Length 90’ 90’ 90’
East Bound
Span Number 10 11 Span Width 55’-9”, 55’-9”~58’-8” 55’-9”, 58’-8”~71’-0” Span Length 90’ 88’-10”
Framing Information: -West Bound: -Span 1: 7 Girders @8’-6”, 4 Girders @8’-6” + 2 Girders @4’-6”~5’-9” -Span 2: 7 Girders @8’-6”, 4 Girders @8’-6” + 2 Girders @5’-9”~7’-1” -Span 3: 7 Girders @8’-6”, 4 Girders @8’-6” + 2 Girders @7’-1”~7’-7” -Span 4: 7 Girders @8’-6”, 4 Girders @8’-6” + 2 Girders @7’-7”~8’-0” -Span 5: 7 Girders @8’-6”, 4 Girders @8’-6” + 2 Girders @8’-0”~8’-6” -Span 6-8: 7 Girders @8’-6”, 6 Girders @8’-6” -Span 9: 7 Girders @8’-6”, 5 Girders @8’-6” + 1 Girders @8’-6”~9’-4” -Span 10: 7 Girders @8’-6”, 5 Girders @8’-6” + 1 Girders @9’-4”~10-2” -Span 11: 7 Girders @8’-6”, 4 Girders @8’-6” + 4 Girders @4’-8”~8’-1” Deck Slab Information: Deck Thickness 73/4+11/4” Latex Concrete Top Cover 23/4” Wearing Surface Latex Concrete, Sawcut Bottom Cover 1” Longitudinal Rebar Information: - All Spans EB Midspan: #5@71/2”(B), #5@15”(T) - All Spans EB Pier: #5@71/2”(B), #5@71/2”(T) Transverse Rebar Information: - All Spans EB: #6@6”(T&B)

Girder Information: East Bound
Span Number I (in4) A (in2) Depth (in) All 260034 789.0 54
Shear Stud Information:
East Bound Span Number Spacing (in) Number of Studs in Row
1-6 & 10-12 (Midspan) 24” 2 1-6 &10-12(Support) 6” 2
3.Material Properties & Mix Design Information Cement Type: Essroc type II Cement Content: 700 lb/yd3
Water Content: 31.8 Gal/yd3
W/C Ratio: 0.38 Air Content: 3.2 % Compressive Strength: 5933 Psi Slump: 5.6” Admixtures: Water Reducer &Retarder 4.Construction Information Air Temperature: 49.5 F Concrete Temperature: 70.3 F Month Of Casting: November-December 5.Survey results Crack Information:
East Bound Span No. All Spans
Type Transverse Location All over Spacing 3-4’
Size Typical Survey Team Member: Ala, Fred and Tom 6. Observations & Photos -Continuity Joints did not cracked but these joints cracked on the westbound side. Cracks are observed on eastbound side.
147

Figure 100. Transverse cracks on the deck (Bridge No.1130-153).
Figure 101. Un-cracked continuity joint (Bridge No.1130-153).
148

149
Support 8~12 4 Midspan 8~23 4
Structure Number 1130-154 1.General Information Bridge Location RT NJ29 Freeway Over Ramps G, H, I, J and Conrail B Town County Mercer County Township Hamilton Year Built 1995 2.Structural Design Information
Number of spans: 2 Direction of Traffic: Two ways Girder type: Steel Girder Span type: Continuous Type Of Bearing: Steel Bearings Skewness: Mild
South Bound North Bound Span Number 1 2 1 2 Span Width 66’ 66’ 70’-5” 70’-5” Span Length 151’ 98’ 98’ 151’
Framing Information: -South Bound (All Spans): 8 Girders@8’-9” -North Bound (All Spans): 8 Girders@9’-3” Deck Slab Information: Deck Thickness 73/4+11/4” Latex Concrete Top Cover 23/4” Wearing Surface Latex Concrete, Sawcut Bottom Cover 1” Longitudinal Rebar Information: -Mid Span: #5@71/2”(B), #5@15”(T) -Over Pier: #5@71/2”(T&B) Transverse Rebar Information: -All Spans: #6@6”(T&B) Girder Information:
North Bound Span Number I (in4) A (in2) Depth (in)
1 (Support) 147906~256541 130.6~198.5 80.75~83 1 (Midspan) 147906~196700 130.6~163.5 80.75~81.75 2 (Support) 162400~256541 137.6~198.5 81~83 2 (Midspan) 159928~208896 137.6~170 81~82
South Bound
Span Number I (in4) A (in2) Depth (in) 1 (Support) 91025~206425 111~165 68.75~82.00 1 (Midspan) 91025~159928 111~137 68.75~81.00 2 (Support) 84317~206425 105~165 68.5~82.00 2 (Midspan) 84317~137106 105~123 68.5~80.5
Shear Stud Information:
North & South Bound Span Number Spacing (in) Number of Studs in Row

3.Material Properties & Mix Design Information Cement Type: Essroc Type II Cement Content: 700 lb/yd3
Water Content: 31.8 Gal/yd3
W/C Ratio: 0.37 Air Content: 5.4% Compressive Strength: 6169 Psi Slump: 3.1” Admixtures: Water Reducer & Retarder 4.Construction Information Air Temperature: 73 F Concrete Temperature: 50 F Month Of Casting: November-December 5.Survey results Crack Information:
North Bound South Bound Span No. 1 2 1 2
Type None None None None Location - - - - Spacing - - - -
Size - - - - Survey Team Member: Ala., Tom and Fred 6. Observations & Photos -Approach slab cracked.
150

151
Slump: 3.4” Admixtures: Water Reducer & Retarder
Structure Number 1130-155 1.General Information Bridge Location RT NJ29 Ramp H Over Ramp G and Conrail B Town County Mercer County Township Hamilton Year Built 1995 2.Structural Design Information
Number of spans: 2 Direction of Traffic: One way Girder type: Steel Girder Span type: Continuous Type Of Bearing: Steel Bearings Skewness: Severe
Ramp Span Number 1 2 Span Width 44’-3” 44’-3” Span Length 162’-0” 159’-9”
Framing Information: -All Spans: 5 Girders@9’-3” Deck Slab Information: Deck Thickness 9” Top Cover 21/2” Wearing Surface Concrete, Sawcut Bottom Cover 1” Longitudinal Rebar Information: -Mid Span: #5@8”(B), #5@15”(T) -Over Pier: #5@8”(B), #5@5”(T) Transverse Rebar Information: -All Spans: #6@6”(T&B) Girder Information:
Ramp Span Number I (in4) A (in2) Depth (in)
1 (Support) 194714~301013 173~220 75~84 1 (Midspan) 116694~301013 117~220 75~84 2 (Support) 194714~301013 173~220 75~84 2 (Midspan) 116694~301013 117~220 75~84
Shear Stud Information:
Ramp Span Number Spacing (in) Number of Studs in Row
All Spans 24 4 3.Material Properties & Mix Design Information Cement Type: Essroc Type II Cement Content: 700 lb/yd3
Water Content: 31.8 Gal/yd3
W/C Ratio: 0.37 Air Content: 5.6% Compressive Strength: 6245 Psi

4.Construction Information Air Temperature: 78 F Concrete Temperature: 81 F Month Of Casting: July 5.Survey results Crack Information:
Ramp Span No. 1 2
Type None None Location - - Spacing - -
Size - - Survey Team Member: Ala., Tom and Fred 6. Observations & Photos -Approach slab cracked.
152

153
3(Support) 18~24 3 4 9~15 3
Structure Number 1130-156 1.General Information Bridge Location RT NJ29 Ramp F Over Ramp G and Conrail B Town County Mercer County Township Hamilton Year Built 1995 2.Structural Design Information
Number of spans: 4 Direction of Traffic: 1 Girder type: Steel Girder Span type: 3 Span Continuous (1,2, &3) + 1 Span Simply Supported (4) Type Of Bearing: Steel Bearings Skewness: Mild
Ramp Span Number 1 2 3 4 Span Width 33’-6” 33’-6” 33’-6” 33’-6” Span Length 124’-11” 147’-11” 139’-11” 49’-11”
Framing Information: -All Spans: 5 Girders@7’-3” Deck Slab Information: Deck Thickness 81/2” Top Cover 21/2”” Wearing Surface Concrete, Sawcut Bottom Cover 1” Longitudinal Rebar Information: -Span 1-3 (Mid Span): #5@9”(B), #5@15”(T) -Span 1-3 (Over Pier): #5@9”(B), #5@5”(T) -Span 4: #5@9”(B), #5@15”(T) Transverse Rebar Information: -Span 1-3: #6@9”(T&B) -Span 4: #6@7”(T&B) Girder Information:
Ramp Span Number I (in4) A (in2) Depth (in)
1 (Support) 73512.66~118564.4 90.5~126.5 70 1 (Midspan) 73512.66 90.5 70 2 (Support) 118564.4 126.5 70 2 (Midspan) 73512.66 90.5 70 3 (Support) 73512.66~118564.4 90.5~126.5 70 3 (Midspan) 73512.66 90.5 70
4 9750~34371 47~52 36~70 Shear Stud Information:
Ramp Span Number Spacing (in) Number of Studs in Row
1(Midspan) 21 3 1(Support) 21~24 3 2(Midspan) 16 3 2(Support) 24 3 3(Midspan) 18 3
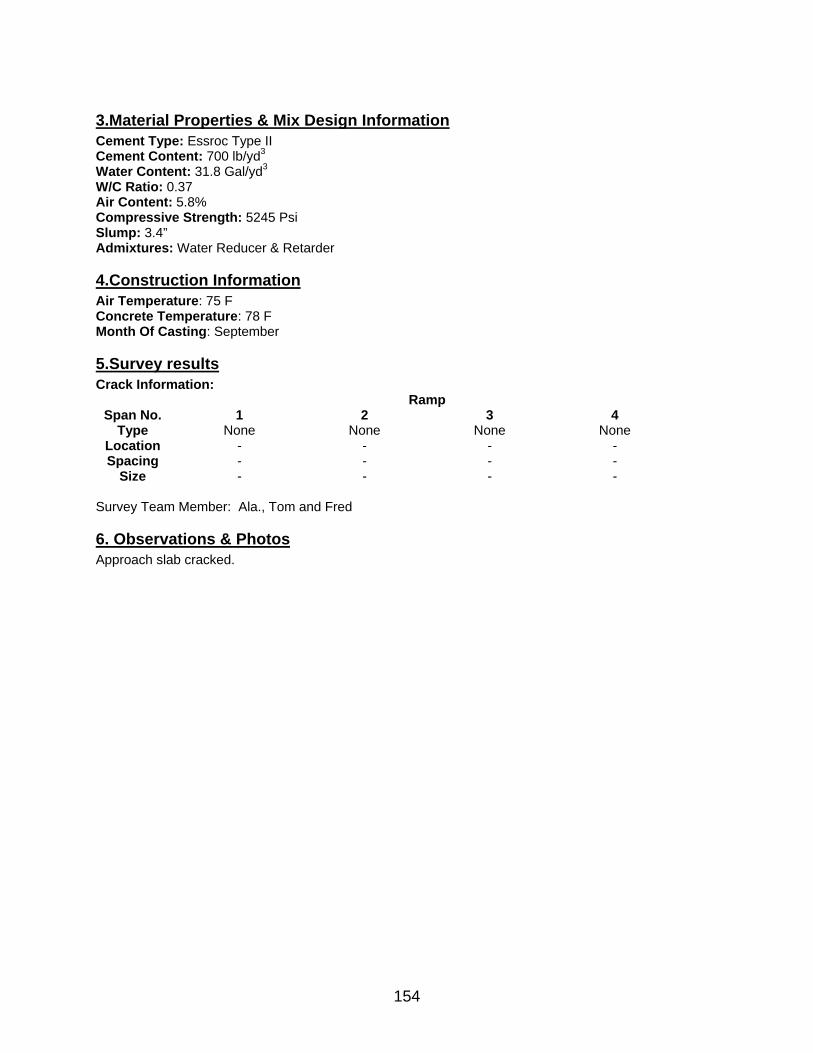
3.Material Properties & Mix Design Information Cement Type: Essroc Type II Cement Content: 700 lb/yd3
Water Content: 31.8 Gal/yd3
W/C Ratio: 0.37 Air Content: 5.8% Compressive Strength: 5245 Psi Slump: 3.4” Admixtures: Water Reducer & Retarder 4.Construction Information Air Temperature: 75 F Concrete Temperature: 78 F Month Of Casting: September 5.Survey results Crack Information:
Ramp Span No. 1 2 3 4
Type None None None None Location - - - - Spacing - - - -
Size - - - - Survey Team Member: Ala., Tom and Fred 6. Observations & Photos Approach slab cracked.
154

155
Slump: 3.1” Admixtures: Water Reducer & Retarder
Structure Number 1136-154 1.General Information Bridge Location Route I-295 South Bound Over RT I-195 County Mercer Township Hamilton Year Built 1995 2.Structural Design Information
Number of spans: 2 Direction of Traffic: One way Girder type: Steel Girder Span type: Simply Supported Type Of Bearing: Steel Bearing Skewness: None
South Bound Span Number 1 2 Span Width 97’-6” 97’-6” Span Length 129’ 97’
Framing Information: -All Spans: 6 Girders@10’-3”+ 1 Girder@5’+ 4 Girder @8’ Deck Slab Information: Deck Thickness 81/2”+ 11/4” Latex Concrete Top Cover 23/4” Wearing Surface Latex concrete, Sawcut Bottom Cover 1” Longitudinal Rebar Information: -All Spans: #5@15” (T), #6@6” (B) Transverse Rebar Information: -All Spans: #6@6”(T&B) Girder Information:
South Bound Span Number I (in4) A (in2) Depth (in)
1 (Support) 55001~62590 65~73.75 79 1 (Midspan) 64196~72198 72~81.75 79 2 (Support) 80990~100124 88.5~100 80 2 (Midspan) 106866~130627 104.5~119.5 81.5
Shear Stud Information:
South Bound Span Number Spacing (in) Number of Studs in Row
All Spans (Midspan) 15~18 4 All Spans (Support) 9~10 4
3.Material Properties & Mix Design Information Cement Type: Essroc Type II Cement Content: 700 lb/yd3
Water Content: 31.8 lb/yd3
W/C Ratio: 0.38 Air Content: 5.6 % Compressive Strength: 5755 Psi

4.Construction Information Air Temperature: 55 F Concrete Temperature: 72 F Month Of Casting: November 5.Survey results Crack Information:
Ramp Span No. 1 2
Type None None Location - - Spacing - -
Size - - Survey Team Member: Fred, Ala 6. Observations & Photos -Approach slab cracked
156

157
Structure Number 1143-166 1.General Information Bridge Location Route 133 EB Over One Mile Road County Mercer County Year Built 1998 2.Structural Design Information
Number of Spans: 1 Direction of Traffic: One way Girder type: Prestressed Concrete Span type: Simply Supported Type Of Bearing: Elastomeric Pad Skewness: None
East Bound Span Number 1 Span Width 42’ Span Length 91’-11”
Framing Information: -East Bound (All Spans): 5 Girders@9’-3” Deck Slab Information: Deck Thickness 8.75” Top Cover 2.5” Wearing Surface Concrete, Saw cut Bottom Cover 1” Longitudinal Rebar Information: -Longitudinal Bars (All Spans): #5@15 (T), #5@9 (B) Transverse Rebar Information: -Transverse Bars (All Spans EB): #6@7 (T&B) Girder Information:
East Bound Span Number I (in4) A (in2) Depth (in)
1 540516 1053 63 Shear Stud Information:
East Bound Span Number Spacing (in) Number of Studs in Row 1 (Midspan) 24 6 1(Support) 12 6
3.Material Properties & Mix Design Information Cement Type: Essroc Type II Cement Content: 700 lb/yd3
Water Content: 31.8 lb/yd3
W/C Ratio: 0.38 Air Content: 5.2 % Compressive Strength: 5800 Psi Slump: 3.5” Admixtures: Water Reducer &Retarder

4.Construction Information Air Temperature: 60F Concrete Temperature: 78F Month Of Casting: June-July 5.Survey results Crack Information:
East Bound Span No. 1
Type Transverse Location All Over Spacing 3’-5’
Size Wide Survey Team Member: Frank, Fred, Ala, and Tom 6. Observations & Photos -Cracks begin parallel to the bridge longitudinal axis at the ends and change direction and become normal to the axis as it goes towards the center of span. -Bridge end diaphragm cast around the girders. -Approach slabs cracked.
Figure 102. Deck cracks at the bridge end (Bridge No. 1143-466).
158

Figure 103. Wide view of deck cracks at the bridge end (Bridge No. 1143-466).
Figure 104. Close view of a crack (Bridge No. 1143-166).
159

160
Structure Number 1143-167 1.General Information Bridge Location Route 133 WB Over One Mile Road County Mercer County Year Built 1998 2.Structural Design Information
Number of Spans: 1 Direction of Traffic: One way Girder type: Prestressed concrete Span type: Simply supported Type Of Bearing: Elastomeric Pads Skewness: None
West Bound Span Number 1 Span Width 42’ Span Length 91’-11”
Framing Information: -West Bound (All Spans): 5 Girders@9’-3” Deck Slab Information: Deck Thickness 8.75” Top Cover 2.5” Wearing Surface Concrete, Saw cut Bottom Cover 1” Longitudinal Rebar Information: All Spans: #5@15 (T), #5@9 (B) Transverse Rebar Information: All Spans EB: #6@7 (T&B) Girder Information:
West Bound Span Number I (in4) A (in2) Depth (in)
1 540516 1053 63 Shear Stud Information:
West Bound Span Number Spacing (in) Number of Studs in Row 1 (Midspan) 24 6 1 (Support) 12 6
3.Material Properties & Mix Design Information Cement Type: Essroc Type II Cement Content: 700 lb/yd3
Water Content: 31.8 lb/yd3
W/C Ratio: 0.38 Air Content: 5 % Compressive Strength: 5815 Psi Slump: 3” Admixtures: Water Reducer & Retarder

4.Construction Information Air Temperature: 80F Concrete Temperature: 70F Month Of Casting: December- November 5.Survey results Crack Information:
West Bound Span No. 1
Type Transverse Location All Over Spacing 3’-5’
Size Wide Survey Team Member: Fred, Ala, Tom, and Frank 6. Observations & Photos -Cracks begin parallel to the bridge longitudinal axis at the ends and change direction and become normal to the axis as it goes towards the center of span. -Bridge end diaphragm cast around the girders. -Approach slabs cracked.
161

162
Slump: 3.5” Admixtures: Water Reducer & Retarder
Structure Number 1143-168 1.General Information Bridge Location Route 133 EB Over Rocky Brook County Mercer County Year Built 1998 2.Structural Design Information
Number of Spans: 2 Direction of Traffic: Two ways Girder type: Prestressed concrete Span type: Continuous Type Of Bearing: Elastomeric Pads Skewness: None
East Bound Span Number 1 2 Span Width 40’-5” 40’-5” Span Length 110’ 110’
Framing Information: -East Bound (All Spans): 5 Girders@8’-10” Deck Slab Information: Deck Thickness 8.5” Top Cover 2.5” Wearing Surface Concrete, Saw cut Bottom Cover 1” Longitudinal Rebar Information: -All Spans EB Midspan: #5@15 (T) #5@9 (B) -All Spans EB Pier: #8@5 (T) #7@9 (B) Transverse Rebar Information: -All Spans EB: #6@7 (T&B) Girder Information:
East Bound Span Number I (in4) A (in2) Depth (in) 1&2 (Midspan) 540516 1053 63 1&2 (Support) 540516 1053 63
Shear Stud Information:
East Bound Span Number Spacing (in) Number of Studs in Row 1&2 (Midspan) 12 6 1&2 (Support) 6 6
3.Material Properties & Mix Design Information Cement Type: Essroc Type II Cement Content: 700 lb/yd3
Water Content: 31.8 lb/yd3
W/C Ratio: 0.38 Air Content: 6.7% Compressive Strength: 6352 Psi

4.Construction Information Air Temperature: 47F Concrete Temperature: 68F Month Of Casting: October 5.Survey results Crack Information:
East Bound Span No. 1 2
Type Transverse Transverse Location All over All over Spacing 0-2’ 0-2’
Size Typical Typical Survey Team Member: Fred, Ala, Tom, and Frank 6. Observations & Photos -Cracks begin parallel to the bridge longitudinal axis at the ends and change direction and become normal to the axis as it goes towards the center of span. -Bridge end diaphragm cast around the girders. -Approach slabs cracked.
Figure 105. Girders embedded in end diaphragm (Bridge No.1143-168).
163

Figure 106. Continuity joint (Bridge No. 1143-168).
164

165
Slump: 3.5” Admixtures: Water Reducer & Retarder
Structure Number 1143-169 1.General Information Bridge Location Route 133 WB Over Rocky Brook County Mercer County Year Built 1998 2.Structural Design Information
Number of Spans: 2 Direction of Traffic: One way Girder type: Prestressed concrete Span type: Continuous Type Of Bearing: Elastomeric Pads Skewness: None
West Bound Span Number 1 2 Span Width 40’-5” 40’-5” Span Length 110’ 110’
Framing Information: -West Bound (All Spans): 5 Girders@8’-10” Deck Slab Information: Deck Thickness 8.5” Top Cover 2.5” Wearing Surface Concrete, Saw cut Bottom Cover 1” Longitudinal Rebar Information: All Spans WB Midspan: #5@15 (T) #5@9 (B) All Spans WB Pier: #8@5 (T) #7@9 (B) Transverse Rebar Information: All Spans WB: #6@7 (T&B) Girder Information:
West Bound Span Number I (in4) A (in2) Depth (in) 1&2 (Midspan) 540516 1053 63 1&2 (Support) 540516 1053 63
Shear Stud Information:
West Bound Span Number Spacing (in) Number of Studs in Row 1&2 (Midspan) 12 6 1&2 (Support) 6 6
3.Material Properties & Mix Design Information Cement Type: Essroc Type II Cement Content: 700 lb/yd3
Water Content: 31.8 lb/yd3
W/C Ratio: 0.38 Air Content: 6% Compressive Strength: 6623 Psi

4.Construction Information Air Temperature: 46F Concrete Temperature: 72F Month Of Casting: November 5.Survey results Crack Information:
West Bound Span No. 1 2
Type Transverse Transverse Location All over All over Spacing 0-2’ 0-2’
Size Typical Typical Survey Team Member: Tom, Fred, Ala, and Frank 6. Observations & Photos -Cracks begin parallel to the bridge longitudinal axis at the ends and change direction and become normal to the axis as it goes towards the center of span. -Bridge end diaphragm cast around the girders. -Approach slabs cracked.
Figure 107. Transverse cracks on bridge deck (Bridge No. 1143-169).
166
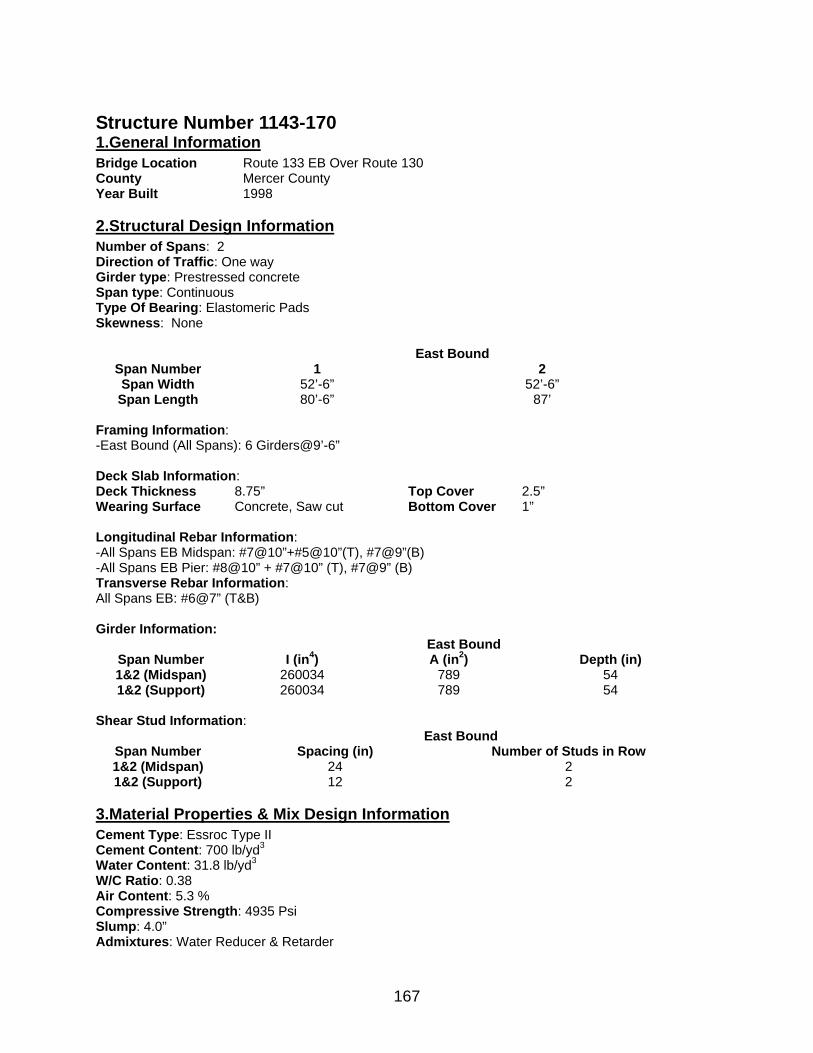
167
Slump: 4.0” Admixtures: Water Reducer & Retarder
Structure Number 1143-170 1.General Information Bridge Location Route 133 EB Over Route 130 County Mercer County Year Built 1998 2.Structural Design Information
Number of Spans: 2 Direction of Traffic: One way Girder type: Prestressed concrete Span type: Continuous Type Of Bearing: Elastomeric Pads Skewness: None
East Bound Span Number 1 2 Span Width 52’-6” 52’-6” Span Length 80’-6” 87’
Framing Information: -East Bound (All Spans): 6 Girders@9’-6” Deck Slab Information: Deck Thickness 8.75” Top Cover 2.5” Wearing Surface Concrete, Saw cut Bottom Cover 1” Longitudinal Rebar Information: -All Spans EB Midspan: #7@10”+#5@10”(T), #7@9”(B) -All Spans EB Pier: #8@10” + #7@10” (T), #7@9” (B) Transverse Rebar Information: All Spans EB: #6@7” (T&B) Girder Information:
East Bound Span Number I (in4) A (in2) Depth (in) 1&2 (Midspan) 260034 789 54 1&2 (Support) 260034 789 54
Shear Stud Information:
East Bound Span Number Spacing (in) Number of Studs in Row 1&2 (Midspan) 24 2 1&2 (Support) 12 2
3.Material Properties & Mix Design Information Cement Type: Essroc Type II Cement Content: 700 lb/yd3
Water Content: 31.8 lb/yd3
W/C Ratio: 0.38 Air Content: 5.3 % Compressive Strength: 4935 Psi

4.Construction Information Air Temperature: 76F Concrete Temperature: 84F Month Of Casting: May 5.Survey results Crack Information:
East Bound Span No. 1 2
Type Transverse Transverse Location All over All over Spacing 3-5” 3-5”
Size Typical Typical Survey Team Member: Fred, Ala, Tom, and Frank 6. Observations & Photos -Cracks begin parallel to the bridge longitudinal axis at the ends and change direction and become normal to the axis as it goes towards the center of span. -Bridge end diaphragm cast around the girders. -Approach slabs cracked.
Figure 108. Repaired transverse crack (Bridge No. 1143-170).
168

Figure 109. Close up view of repair patch (Bridge No. 1143-170).
169

170
Slump: 3.4” Admixtures: Water Reducer & Retarder
Structure Number 1143-171 1.General Information Bridge Location Route 133 WB Over Route 130 County Mercer County Year Built 1998 2.Structural Design Information
Number of Spans: 2 Direction of Traffic: One way Girder type: Prestressed concrete Span type: Continuous Type Of Bearing: Elastomeric Pads Skewness: None
West Bound Span Number 1 2 Span Width 52’-6” 52’-6” Span Length 87’ 80’-6”
Framing Information: -West Bound (All Spans): 6 Girders@9’-6” Deck Slab Information: Deck Thickness 8.75” Top Cover 2.5” Wearing Surface Concrete, Saw cut Bottom Cover 1” Longitudinal Rebar Information: -All Spans WB Midspan: #7@10”+#5@10”(T), #7@9”(B) -All Spans WB Pier: #8@10” + #7@10” (T), #7@9” (B) Transverse Rebar Information: -All Spans WB: #6@7” (T&B) Girder Information:
West Bound Span Number I (in4) A (in2) Depth (in) 1&2 (Midspan) 260034 789 54 1&2 (Support) 260034 789 54
Shear Stud Information:
West Bound Span Number Spacing (in) Number of Studs in Row 1&2 (Midspan) 24 2 1&2 (Support) 12 2
3.Material Properties & Mix Design Information Cement Type: Essroc Type II Cement Content: 700 lb/yd3
Water Content: 31.8 lb/yd3
W/C Ratio: 0.38 Air Content: 5% Compressive Strength: 6192 Psi

4.Construction Information Air Temperature: 72F Concrete Temperature: 62F Month Of Casting: June 5.Survey results Crack Information:
West Bound Span No. 1 2
Type Transverse Transverse Location All over All over Spacing 3-5” 3-5”
Size Typical Typical Survey Team Member: Fred, Ala, Tom, and Frank 6. Observations & Photos -Cracks begin parallel to the bridge longitudinal axis at the ends and change direction and become normal to the axis as it goes towards the center of span. -Bridge end diaphragm cast around the girders. -Approach slabs cracked.
Figure 110. Cracks on the deck (Bridge No.1143-171).
171

Figure 111. Another marked crack on the deck (Bridge No.1143-171).
172

173
Admixtures: Water Reducer & Retarder
Structure Number 1143-172 1.General Information Bridge Location Route 133 EB Over North Main Street County Mercer County Year Built 1998 2.Structural Design Information
Number of Spans: 1 Direction of Traffic: One way Girder type: Prestressed concrete Span type: Simply Supported Type Of Bearing: Elastomeric Pads Skewness: None
East Bound Span Number 1 Span Width 42’ Span Length 76’-6”
Framing Information: -East Bound (All Spans): 5 Girders@ 9’-3” Deck Slab Information: Deck Thickness 9.25” Top Cover 2.5”” Wearing Surface Concrete, Saw cut Bottom Cover 1” Longitudinal Rebar Information: -All Spans EB: #5@15”(T), #5@9”(B) Transverse Rebar Information: -All Spans EB: #6@7 (T&B) Girder Information:
East Bound Span Number I (in4) A (in2) Depth (in) 1 (Midspan) 260034 789 54 1 (Support) 260034 789 54
Shear Stud Information:
East Bound Span Number Spacing (in) Number of Studs in Row 1 (Midspan) 24 2 1 (Support) 12 2
3.Material Properties & Mix Design Information Cement Type: Essroc Type II Cement Content: 700 lb/yd3
Water Content: 31.8 lb/yd3
W/C Ratio: 0.38 Air Content: 6.1 % Compressive Strength: 5266 Psi Slump: 3.4”

4.Construction Information Air Temperature: 63F Concrete Temperature: 53F Month Of Casting: May 5.Survey results Crack Information:
East Bound Span No. 1
Type Transverse Location All over Spacing 3-5’
Size Typical Survey Team Member: Ala, Fred, Tom, and Frank 6. Observations & Photos -Cracks begin parallel to the bridge longitudinal axis at the ends and change direction and become normal to the axis as it goes towards the center of span. -Bridge end diaphragm cast around the girders. -Approach slabs cracked.
Figure 112. Close up view of deck cracks at the ends (Bridge No.1143-172).
174
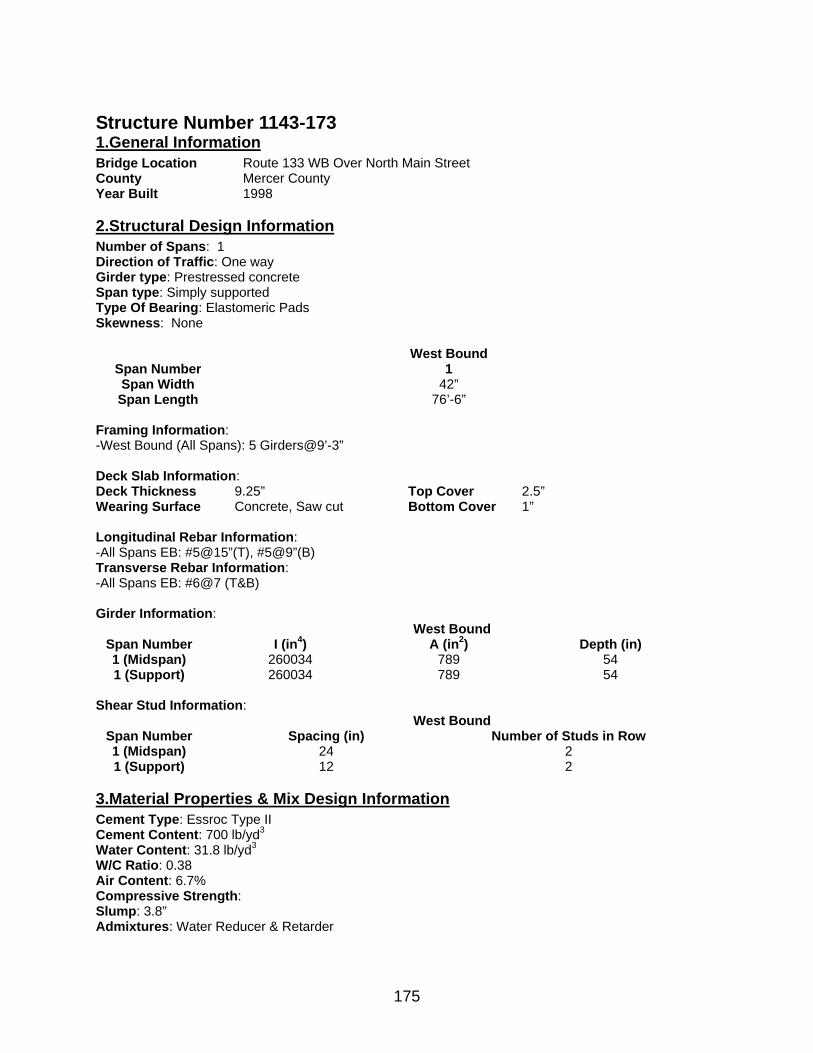
175
Admixtures: Water Reducer & Retarder
Structure Number 1143-173 1.General Information Bridge Location Route 133 WB Over North Main Street County Mercer County Year Built 1998 2.Structural Design Information
Number of Spans: 1 Direction of Traffic: One way Girder type: Prestressed concrete Span type: Simply supported Type Of Bearing: Elastomeric Pads Skewness: None
West Bound Span Number 1 Span Width 42” Span Length 76’-6”
Framing Information: -West Bound (All Spans): 5 Girders@9’-3” Deck Slab Information: Deck Thickness 9.25” Top Cover 2.5” Wearing Surface Concrete, Saw cut Bottom Cover 1” Longitudinal Rebar Information: -All Spans EB: #5@15”(T), #5@9”(B) Transverse Rebar Information: -All Spans EB: #6@7 (T&B) Girder Information:
West Bound Span Number I (in4) A (in2) Depth (in) 1 (Midspan) 260034 789 54 1 (Support) 260034 789 54
Shear Stud Information:
West Bound Span Number Spacing (in) Number of Studs in Row 1 (Midspan) 24 2 1 (Support) 12 2
3.Material Properties & Mix Design Information Cement Type: Essroc Type II Cement Content: 700 lb/yd3
Water Content: 31.8 lb/yd3
W/C Ratio: 0.38 Air Content: 6.7% Compressive Strength: Slump: 3.8”

4.Construction Information Air Temperature: 57F Concrete Temperature: 65F Month Of Casting: May 5.Survey results Crack Information:
West Bound Span No. 1
Type Transverse Location All over Spacing 3-5’
Size Typical Survey Team Member: Ala, Frank, Tom, and Frank 6. Observations & Photos -Cracks begin parallel to the bridge longitudinal axis at the ends and change direction and become normal to the axis as it goes towards the center of span. -Bridge end diaphragm cast around the girders. -Approach slabs cracked.
176

177
Slump: 3.9 Admixtures: Water Reducer & Retarder
Structure Number 1143-174 1.General Information Bridge Location Route 133 EB Over Wyckoff ‘s Mill Road County Mercer County Year Built 1998 2.Structural Design Information
Number of Spans: 1 Direction of Traffic: One way Girder type: Prestressed concrete Span type: Simply supported Type Of Bearing: Elastomeric Pads Skewness: None
East Bound Span Number 1 Span Width 42’ Span Length 78’-9”
Framing Information: -East Bound (All Spans): 5 Girders@9’-3” Deck Slab Information: Deck Thickness : 8.75” Top Cover 2.5” Wearing Surface Concrete, Saw cut Bottom Cover 1” Longitudinal Rebar Information: - All Spans EB: #5@15”(T), #5@9”(B) -All Spans EB: #6@7 (T&B) Transverse Rebar Information: -All Spans EB): #6@7 (T&B) Girder Information:
West Bound Span Number I (in4) A (in2) Depth (in) 1 (Midspan) 260034 789 54 1 (Support) 260034 789 54
Shear Stud Information:
West Bound Span Number Spacing (in) Number of Studs in Row 1 (Midspan) 24 2 1 (Support) 12 2
3.Material Properties & Mix Design Information Cement Type: Essroc Type II Cement Content: 700 lb/yd3
Water Content: 31.8 lb/yd3
W/C Ratio: 0.38 Air Content: 5.1% Compressive Strength: 5928 Psi

4.Construction Information Air Temperature: 74F Concrete Temperature: 78F Month Of Casting: May 5.Survey results Crack Information:
East Bound Span No. 1
Type Transverse Location All over Spacing 3-5’
Size Typical Survey Team Member: Tom, Ala, Fred, and Frank 6. Observations & Photos -Cracks begin parallel to the bridge longitudinal axis at the ends and change direction and become normal to the axis as it goes towards the center of span. -Bridge end diaphragm cast around the girders. -Approach slabs cracked.
178

179
Admixtures: Water Reducer & Retarder
Structure Number 1143-175 1.General Information Bridge Location Route 133 WB Over Wyckoff’s Mill Road County Mercer County Year Built 1998 2.Structural Design Information
Number of Spans: 1 Direction of Traffic: One way Girder type: Prestressed concrete Span type: Simply supported Type Of Bearing: Elastomeric Pads Skewness: None
West Bound Span Number 1 Span Width 42’ Span Length 78’-9”
Framing Information: -West Bound (All Spans): 5 Girders@9’-3” Deck Slab Information: Deck Thickness 8.75” Top Cover 2.5” Wearing Surface Concrete, Saw cut Bottom Cover 1” Longitudinal Rebar Information: -All Spans WB: #5@15”(T), #5@9”(B) Transverse Rebar Information: -All Spans WB: #6@7 (T&B) Girder Information:
West Bound Span Number I (in4) A (in2) Depth (in) 1 (Midspan) 260034 789 54 1 (Support) 260034 789 54
Shear Stud Information:
West Bound Span Number Spacing (in) Number of Studs in Row 1 (Midspan) 24 2 1 (Support) 12 2
3.Material Properties & Mix Design Information Cement Type: Essroc Type II Cement Content: 700 lb/yd3
Water Content: 31.8 lb/yd3
W/C Ratio: 0.38 Air Content: 5.9% Compressive Strength: 4500 Psi Slump: 3.1”

4.Construction Information Air Temperature: 86.5 F Concrete Temperature: 82F Month Of Casting: May 5.Survey results Crack Information:
West Bound Span No. 1
Type Transverse Location All over Spacing 3-5’
Size Typical Survey Team Member: Tom, Ala, Fred, and Frank 6. Observations & Photos -Cracks begin parallel to the bridge longitudinal axis at the ends and change direction and become normal to the axis as it goes towards the center of span. -Bridge end diaphragm cast around the girders. -Approach slabs cracked.
180

181
Slump: 3.4” Admixtures: Retarder & Water Reducer
Structure Number 1143-176 1.General Information Bridge Location Route 133 EB Over One NJ Turnpike County Mercer County Year Built 1998 2.Structural Design Information
Number of Spans: 3 Direction of Traffic: One way Girder type: Prestressed Concrete Span type: Mixed (1 Simply supported +2 Continuous) Type Of Bearing: Elastomeric Pads Skewness: None
East Bound Span Number 1 2 3 Span Width 41’ 41’ 41’ Span Length 94’ 131’-3” 124’
Framing Information: -East Bound (All Spans): 5 Girders@9’ Deck Slab Information: Deck Thickness : 8.5” Top Cover 2.5” Wearing Surface Concrete, Saw cut Bottom Cover 1” Longitudinal Rebar Information: -All Spans EB Midspan: #5@15(T), #5@9(B) -EB Span 2&3 Over Pier: #6@7(T&B) Transverse Rebar Information: -All Spans EB: #6@7 (T&B) Girder Information:
East Bound Span Number I (in4) A (in2) Depth (in) All (Midspan) 540516 1053 63 All (Support) 540516 1053 63
Shear Stud Information:
East Bound Span Number Spacing (in) Number of Studs in Row All (Midspan) 24 6 1 (Support) 12 6
2&3 (Support) 6 6 3.Material Properties & Mix Design Information Cement Type: Essroc Type II Cement Content: 700 lb/yd3
Water Content: 31.8 lb/yd3
W/C Ratio: 0.38 Air Content: 5.9% Compressive Strength: 5670 Psi

4.Construction Information Air Temperature: 79.5F Concrete Temperature: 90F Month Of Casting: August 5.Survey results Crack Information:
East Bound Span No. 1 2 3
Type Transverse Transverse Transverse Location All over All over All over Spacing 3-5’ 3-5’ 3-5’
Size Typical Typical Typical Survey Team Member: Tom, Ala, Fred, and Frank 6. Observations & Photos -Cracks begin parallel to the bridge longitudinal axis at the ends and change direction and become normal to the axis as it goes towards the center of span. -Bridge end diaphragm cast around the girders.
Figure 113. End diaphragm (Bridge No.1143-176).
182

Figure 114. A view from underneath the bridge (Bridge No.1143-176).
Figure 115. Transverse deck cracks on Bridge No.1143-176 (NJ Turnpike in the background).
183
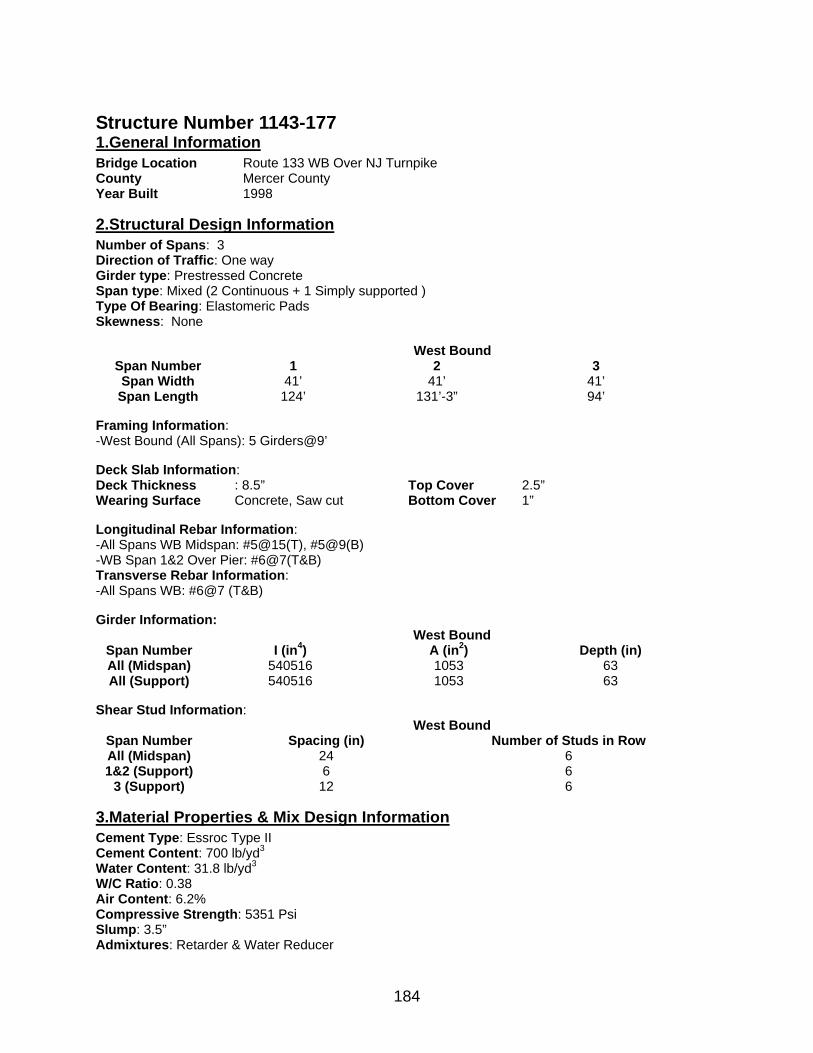
184
Slump: 3.5” Admixtures: Retarder & Water Reducer
Structure Number 1143-177 1.General Information Bridge Location Route 133 WB Over NJ Turnpike County Mercer County Year Built 1998 2.Structural Design Information
Number of Spans: 3 Direction of Traffic: One way Girder type: Prestressed Concrete Span type: Mixed (2 Continuous + 1 Simply supported ) Type Of Bearing: Elastomeric Pads Skewness: None
West Bound Span Number 1 2 3 Span Width 41’ 41’ 41’ Span Length 124’ 131’-3” 94’
Framing Information: -West Bound (All Spans): 5 Girders@9’ Deck Slab Information: Deck Thickness : 8.5” Top Cover 2.5” Wearing Surface Concrete, Saw cut Bottom Cover 1” Longitudinal Rebar Information: -All Spans WB Midspan: #5@15(T), #5@9(B) -WB Span 1&2 Over Pier: #6@7(T&B) Transverse Rebar Information: -All Spans WB: #6@7 (T&B) Girder Information:
West Bound Span Number I (in4) A (in2) Depth (in) All (Midspan) 540516 1053 63 All (Support) 540516 1053 63
Shear Stud Information:
West Bound Span Number Spacing (in) Number of Studs in Row All (Midspan) 24 6 1&2 (Support) 6 6
3 (Support) 12 6 3.Material Properties & Mix Design Information Cement Type: Essroc Type II Cement Content: 700 lb/yd3
Water Content: 31.8 lb/yd3
W/C Ratio: 0.38 Air Content: 6.2% Compressive Strength: 5351 Psi

4.Construction Information Air Temperature: 63F Concrete Temperature: 80F Month Of Casting: August 5.Survey results Crack Information:
West Bound Span No. 1 2 3
Type Transverse Transverse Transverse Location All over All over All over Spacing 3-5’ 3-5’ 3-5’
Size Typical Typical Typical Survey Team Member: Tom, Ala, Fred, and Frank 6. Observations & Photos -Cracks begin parallel to the bridge longitudinal axis at the ends and change direction and become normal to the axis as it goes towards the center of span. -Bridge end diaphragm cast around the girders. -Approach slabs cracked.
Figure 116. Transverse (and longitudinal) cracks on deck (Bridge No.1143-177).
185

186
Slump: 3.4” Admixtures: Water Reducer & Retarder
Structure Number 1149-168 1.General Information Bridge Location Whitehead Road Over AMTRAK County Mercer County Township Hamilton Year Built 1999
2. Structural Design Information
Number of Spans: 3 Direction of Traffic: Two ways Girder type: Steel Girder Span type: Continuous Type Of Bearing: Steel Bearings Skewness: None
East & West Bound Span Number 1 2 3 Span Width 41’-0” 41’-0” 41’-0” Span Length 103’-0” 175’-3” 103’-0”
Framing Information: -East & West Bound (All Spans): 6 Girders@11’-0”
Deck Slab Information: Deck Thickness 81/2” Top Cover 21/2” Wearing Surface Concrete, Sawcut Bottom Cover 1”
Longitudinal Rebar Information: - All Spans EB & WB Midspan: #5@10”(B), #5@15”(T) - All Spans EB & WB Pier: #5@10”(B), #[email protected]”(T) Transverse Rebar Information: - All Spans EB & WB: #5@7”(T&B)
Girder Information: East & West Bound
Span Number I (in4) A (in2) Depth (in) 1&3 (Midspan) 41206 90 50.5 1&3 (Support) 34576~65792 78~126 50~52 2 (Midspan) 41207 90 50.5 2 (Support) 65792 126 52
Shear Stud Information: East & West Bound
Span Number Spacing (in) Number of Studs in Row 1&3 (Midspan) 18” 4 1&3 (Support) 14”~36” 4 2 (Midspan) 18” 4 2 (Support) 36” 4
3. Material Properties & Mix Design Information Cement Type: Essroc Type II Cement Content: 700 lb/yd3
Water Content: 31.8 Gal/yd3
W/C Ratio: 0.37 Air Content: 5.8% Compressive Strength: 5622 Psi

4.Construction Information Air Temperature: 69.3 F Concrete Temperature: 79.0 F Month Of Casting: June 5.Survey results Crack Information:
East & West Bound Span No. 1 2 3
Type None Transverse/Other Transverse/Other Location - All Over All Over Spacing - - -
Size - - - Survey Team Member: Ala, Fred and Tom 6. Observations & Photos -Lots of seals are on the deck.
Figure 117. A view of the bridge (Bridge No.1149-168).
187

188
Admixtures: Water Reducer & Corrosion inhibitor
Structure Number 1312-154 1.General Information Bridge Location RT35 Over NAVESINK River County Monmouth Township Red Bank Year Built 2000 2.Structural Design Information
Number of Spans: 9 Direction of Traffic: Two ways Girder type: Prestressed Concrete Span type: Mixed (3 Continuous + 3 Continuous + 3 Continuous) Type Of Bearing: Steel Bearings Skewness: None
North Bound & South Bound Span Number All Span Width 89’-3” Span Length 113’-5”
Framing Information: - North Bound & South Bound:-All Spans: 10 Girders @7’-10” Deck Slab Information: Deck Thickness 81/2 Top Cover 21/2” Wearing Surface Concrete, Sawcut Bottom Cover 11/2 Longitudinal Rebar Information: -All Spans Midspan: #5@6”(B), #5@15”(T) -Continuous Spans Over Pier: #5@6”(B), #5@15”+#8@15(T) Transverse Rebar Information: -All Spans EB: #6@6”(T&B) Girder Information:
North Bound & South Bound Span Number I (in4) A (in2) Depth (in)
All 761550 1125 72 Shear Stud Information:
Ramp Span Number Spacing (in) Number of Studs in Row All (Midspan) 6 6 All (Support) 23 6
3.Material Properties & Mix Design Information Cement Type: Essroc Type II Cement Content: 707 lb/yd3
Water Content: 32.3 Gal/yd3
W/C Ratio: 0.38 Air Content: 5.3 % Compressive Strength: 6711 Psi Slump: 3.1”

189
4.Construction Information Air Temperature: 56 F Concrete Temperature: 73 F Month Of Casting: March-June 5.Survey results Crack Information:
Ramp Span No. All Spans
Type Transverse Location All over Spacing 3’-5’
Size Hair Line Survey Team Member: Tom, Anthony, and Jennifer 6. Observations & Photos -Most of the cracks are on the northbound side, which has been built earlier


![Transverse-Spin and Transverse-Momentum Effects in High ... · arXiv:1011.0909v1 [hep-ph] 3 Nov 2010 Transverse-Spin and Transverse-Momentum Effects in High-Energy Processes Vincenzo](https://img.pdfslide.us/doc/110x75/5fe72148dd320764757b53e4/transverse-spin-and-transverse-momentum-eiects-in-high-arxiv10110909v1-hep-ph.jpg)