Embed Size (px)
Citation preview
Catrin Lammgård
GIN 2006, Cardiff
The measures and pressures for
reducing environmental effects of shippers’ goods transports
Catrin Lammgård
Logistics and Transport Research Group, School of Business, Economics and Law,
Göteborg University, Sweden
Catrin Lammgård
GIN 2006, Cardiff
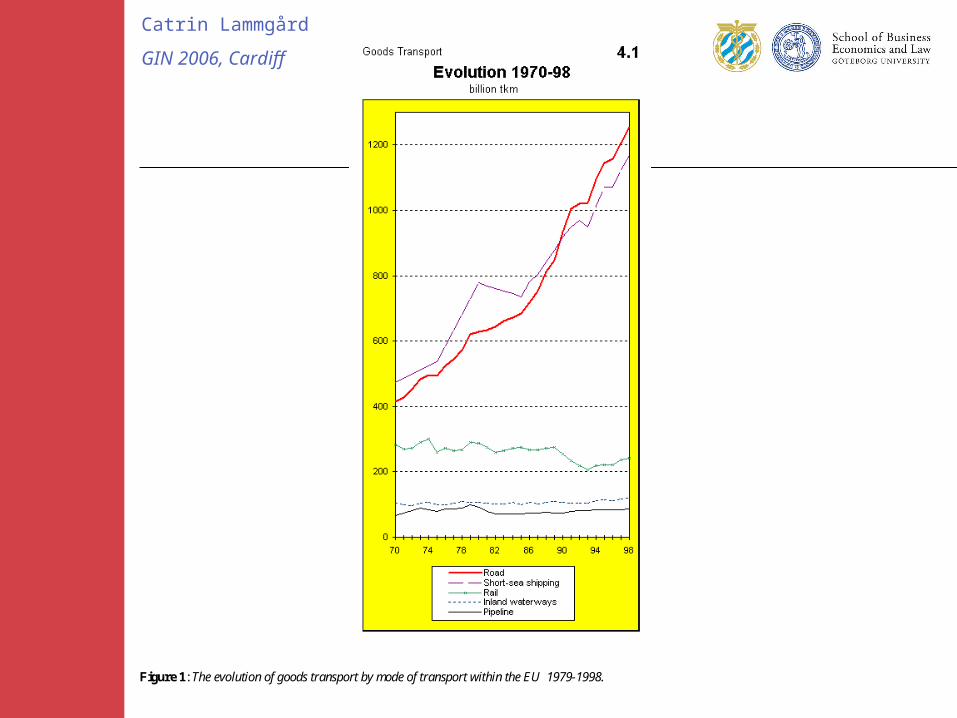
Figure 1: The evolution of goods transport by mode of transport within the EU 1979-1998.
Catrin Lammgård
GIN 2006, Cardiff
• Drivers of environmentalism:
- Stakeholder theory (Freeman 1984)
- Stakeholder theory on environmentalism: e.g. Banerjee et al (2003)
-Sustainable supply chain: Young and Kielkiewicz-Young (2001)
• EMS: e.g. Hibbitt and Kamp-Roelands (2002), Morrow and Rondinelli (2002)
• Logistics and environmentalism: Wu and Dunn (1994)
Theory
Catrin Lammgård
GIN 2006, Cardiff
Purpose
to reveal the progress of environmental measures and pressures for reducing the environmental effects of goods transports
among Swedish manufacturing and wholesale trade companies, the shippers.
Catrin Lammgård
GIN 2006, Cardiff
Environmental Management and Marketing theory
• Environmental differentiation as basis for competitive strategy (Roy and Vézina 2001)
• Green marketing: an umbrella term for a range of concepts e.g. green, ecological, environmental and sustainable marketing. (Crane 2000).
• Sustainable marketing, Sheth and Parvatiyar (1995), Fuller (1999). 4 efforts: 1) promoting re-consumption, 2) redirecting customer needs and wants, 3) reorienting the marketing mix and 4) reorganising organizational efforts
• Reinhardt 1999: e.g. product differentiation.
Catrin Lammgård
GIN 2006, Cardiff
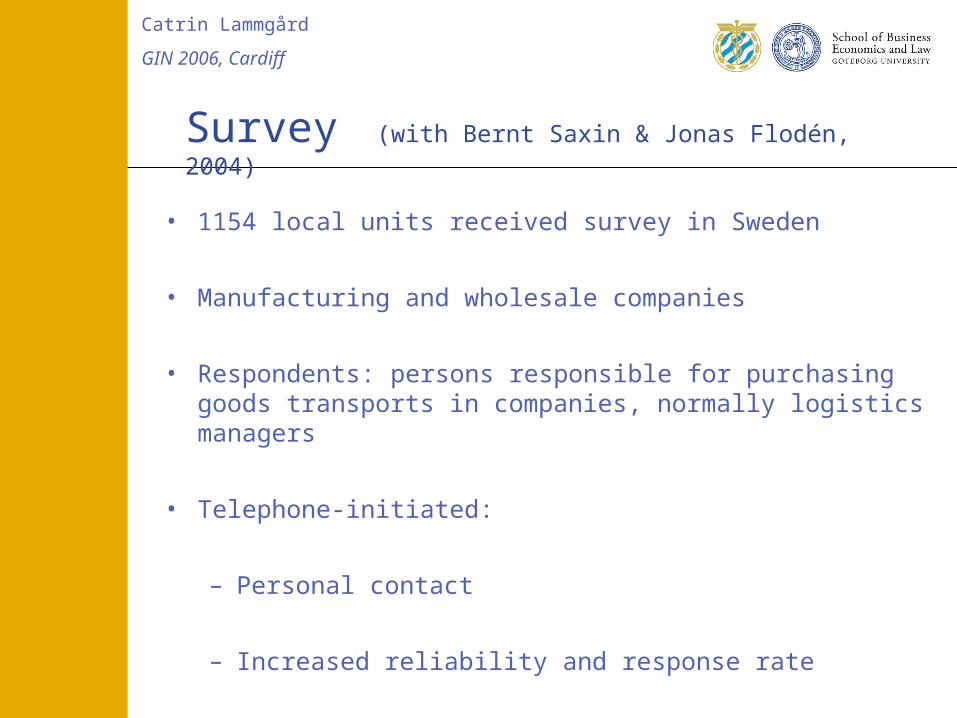
Survey (with Bernt Saxin & Jonas Flodén, 2004)
• 1154 local units received survey in Sweden
• Manufacturing and wholesale companies
• Respondents: persons responsible for purchasing goods transports in companies, normally logistics managers
• Telephone-initiated:
– Personal contact
– Increased reliability and response rate
Catrin Lammgård
GIN 2006, Cardiff
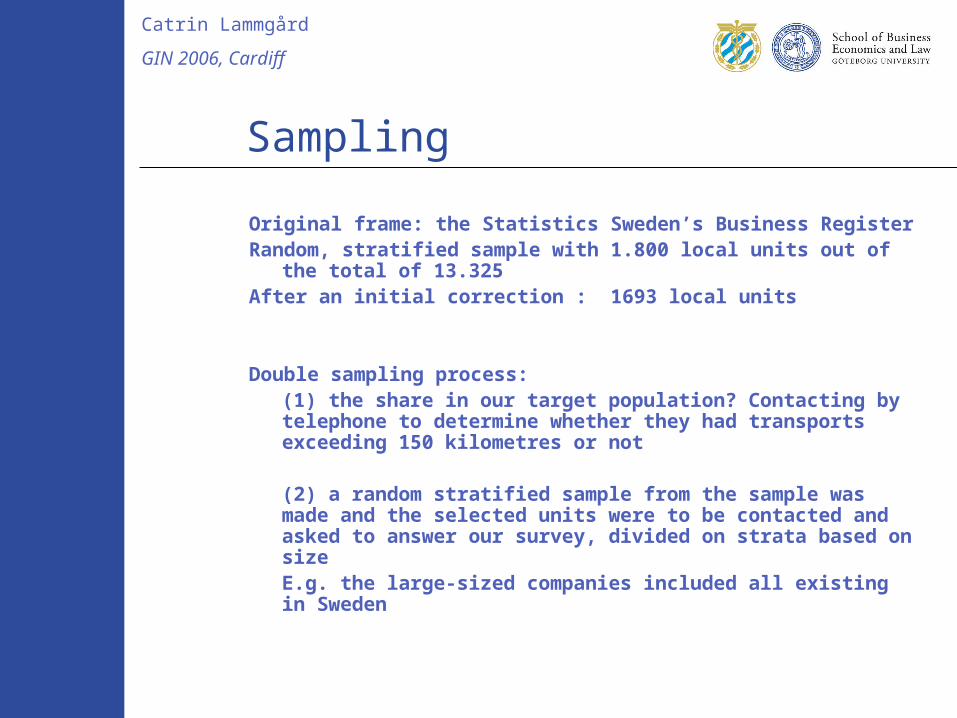
Sampling
Original frame: the Statistics Sweden’s Business Register Random, stratified sample with 1.800 local units out of the total of
13.325 After an initial correction : 1693 local units
Double sampling process:(1) the share in our target population? Contacting by telephone to determine whether they had transports exceeding 150 kilometres or not
(2) a random stratified sample from the sample was made and the selected units were to be contacted and asked to answer our survey, divided on strata based on size E.g. the large-sized companies included all existing in Sweden
Catrin Lammgård
GIN 2006, Cardiff
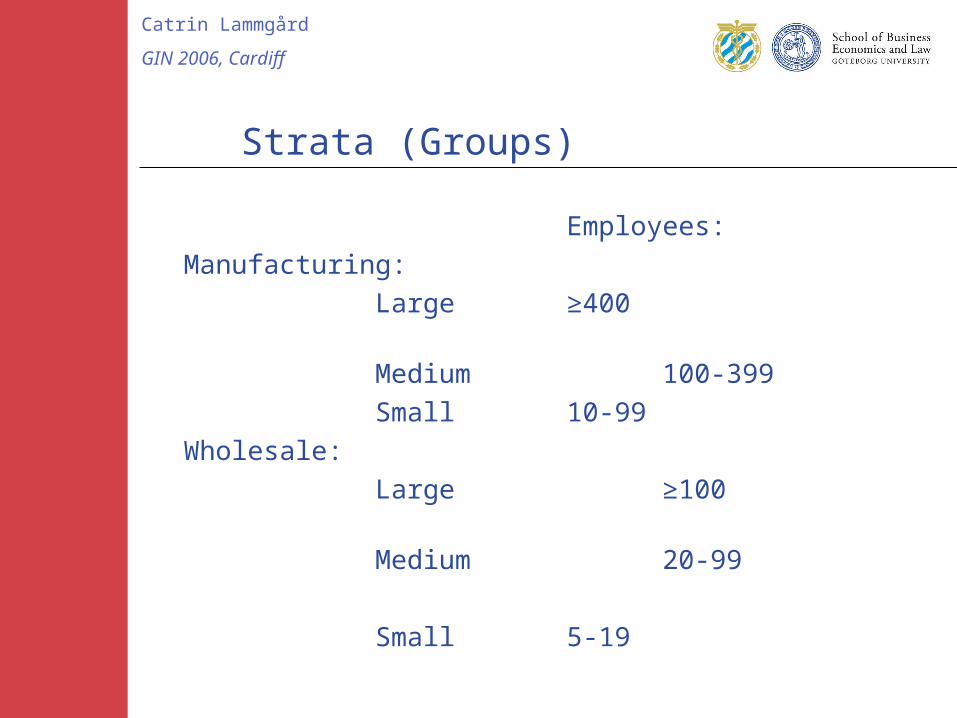
Strata (Groups)
Employees:
Manufacturing:
Large ≥400
Medium 100-399
Small 10-99
Wholesale:
Large ≥100
Medium 20-99
Small 5-19
Catrin Lammgård
GIN 2006, Cardiff
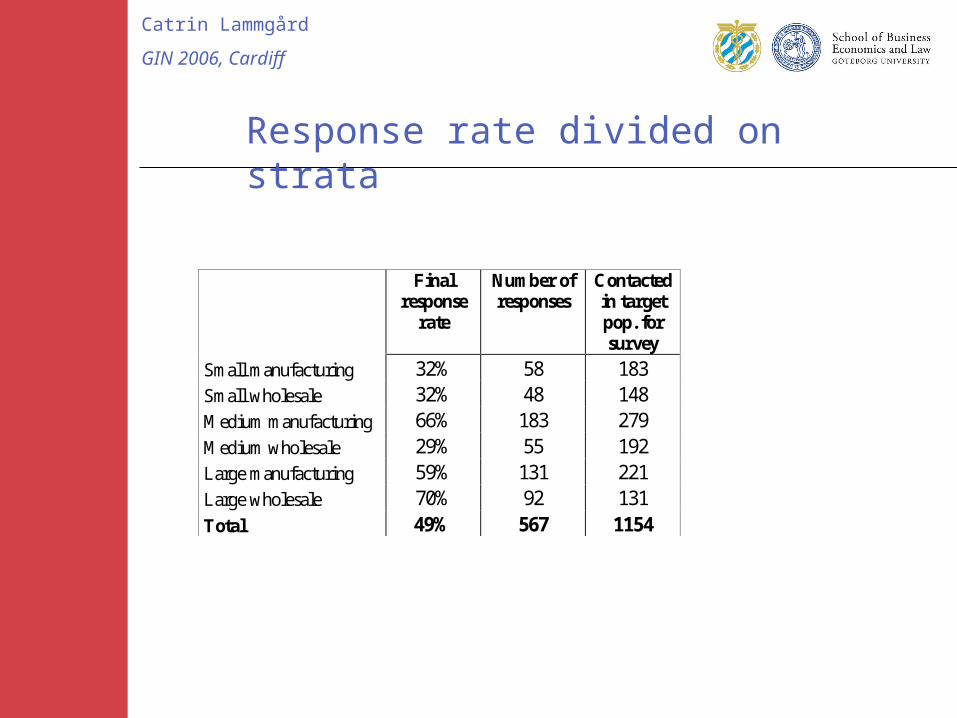
Response rate divided on strata
Final response
rate
Number of responses
Contacted in target pop. for survey
Small manufacturing 32% 58 183 Small wholesale 32% 48 148 Medium manufacturing 66% 183 279 Medium wholesale 29% 55 192 Large manufacturing 59% 131 221 Large wholesale 70% 92 131 Total 49% 567 1154
Catrin Lammgård
GIN 2006, Cardiff
Outline results
• Implemented measures
•Internal pressures
•Effects of CEP on transports
•Importance and possibilities to implement measures
•Internal and external pressures affecting choice of transport mode
Catrin Lammgård
GIN 2006, Cardiff
Background - results
-goods volumes sent: total 40.9 million tonne equivalent weight
-97 % of the tonnage was attributable to local units with at least 100 employees (the large companies along with the medium-sized manufacturing companies).
- half of these transport flows were within Sweden.
Catrin Lammgård
GIN 2006, Cardiff
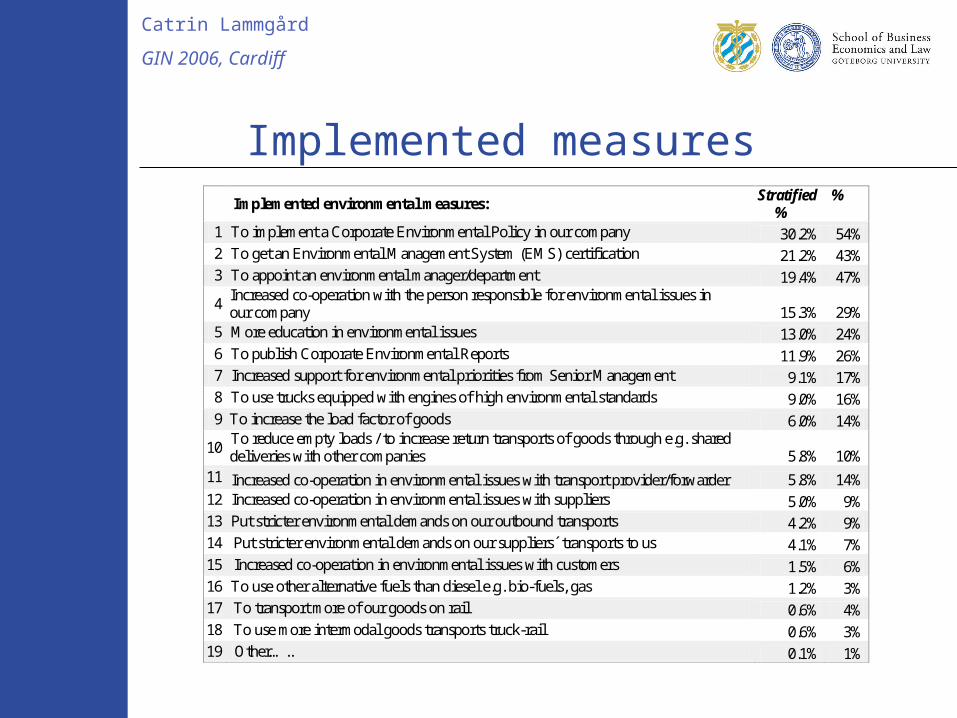
Implemented measures
I Implemented environmental measures:
Stratified %
%
1 To implement a Corporate Environmental Policy in our company 30.2% 54% 2 To get an Environmental Management System (EMS) certification 21.2% 43% 3 To appoint an environmental manager/department 19.4% 47%
4 Increased co-operation with the person responsible for environmental issues in o our company 15.3% 29% 5 More education in environmental issues 13.0% 24% 6 To publish Corporate Environmental Reports 11.9% 26% 7 Increased support for environmental priorities from Senior Management 9.1% 17% 8 To use trucks equipped with engines of high environmental standards 9.0% 16% 9 To increase the load factor of goods 6.0% 14%
10 To reduce empty loads / to increase return transports of goods through e.g. shared
d deliveries with other companies 5.8% 10% 11 Increased co-operation in environmental issues with transport provider/forwarder 5.8% 14% 12 Increased co-operation in environmental issues with suppliers 5.0% 9% 13 Put stricter environmental demands on our outbound transports 4.2% 9% 14 Put stricter environmental demands on our suppliers´ transports to us 4.1% 7% 15 Increased co-operation in environmental issues with customers 1.5% 6% 16 To use other alternative fuels than diesel e.g. bio-fuels, gas 1.2% 3% 17 To transport more of our goods on rail 0.6% 4% 18 To use more intermodal goods transports truck-rail 0.6% 3% 19 Other….. 0.1% 1%
Catrin Lammgård
GIN 2006, Cardiff
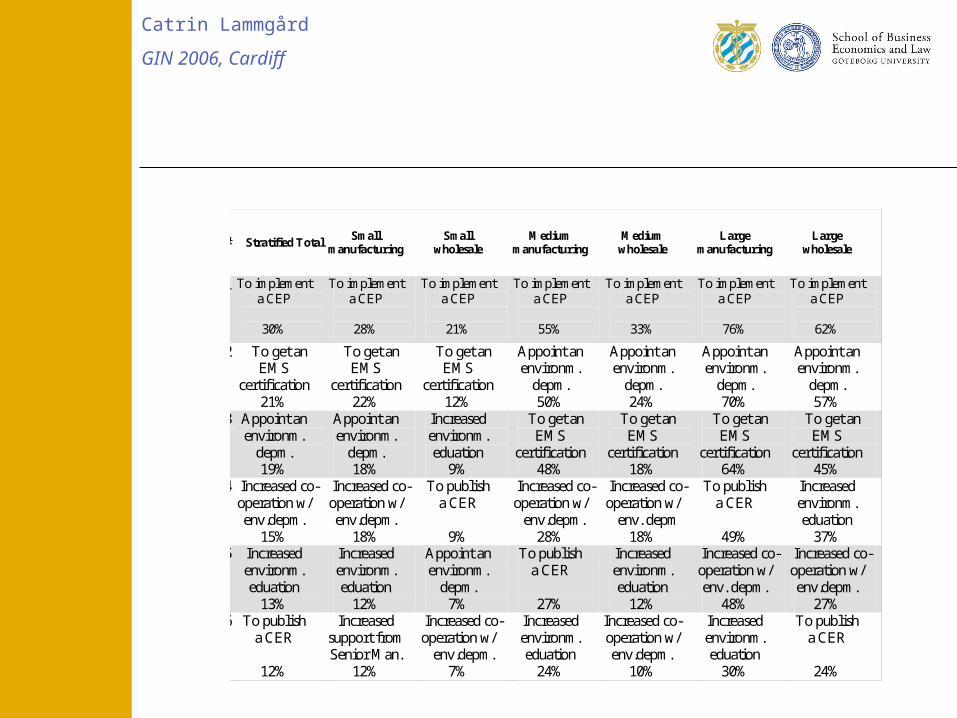
# Stratified Total Small
manufacturing Small
wholesale Medium
manufacturing Medium
wholesale Large
manufacturing Large
wholesale
1 To implement a CEP
30%
To implement a CEP
28%
To implement a CEP
21%
To implement a CEP
55%
To implement a CEP
33%
To implement a CEP
76%
To implement a CEP
62%
2 To get an EMS
certification 21%
To get an EMS
certification 22%
To get an EMS
certification 12%
Appoint an environm.
depm. 50%
Appoint an environm.
depm. 24%
Appoint an environm.
depm. 70%
Appoint an environm.
depm. 57%
3 Appoint an environm.
depm. 19%
Appoint an environm.
depm. 18%
Increased environm. eduation
9%
To get an EMS
certification 48%
To get an EMS
certification 18%
To get an EMS
certification 64%
To get an EMS
certification 45%
4 Increased co-operation w/ env.depm.
15%
Increased co-operation w/ env.depm.
18%
To publish a CER
9%
Increased co-operation w/ env.depm.
28%
Increased co-operation w/ env. depm
18%
To publish a CER
49%
Increased environm. eduation
37% 5 Increased
environm. eduation
13%
Increased environm. eduation
12%
Appoint an environm.
depm. 7%
To publish a CER
27%
Increased environm. eduation
12%
Increased co-operation w/ env. depm.
48%
Increased co-operation w/ env.depm.
27% 6 To publish
a CER
12%
Increased support from Senior Man.
12%
Increased co-operation w/ env.depm.
7%
Increased environm. eduation
24%
Increased co-operation w/
env.depm. 10%
Increased environm. eduation
30%
To publish a CER
24%
Catrin Lammgård
GIN 2006, Cardiff
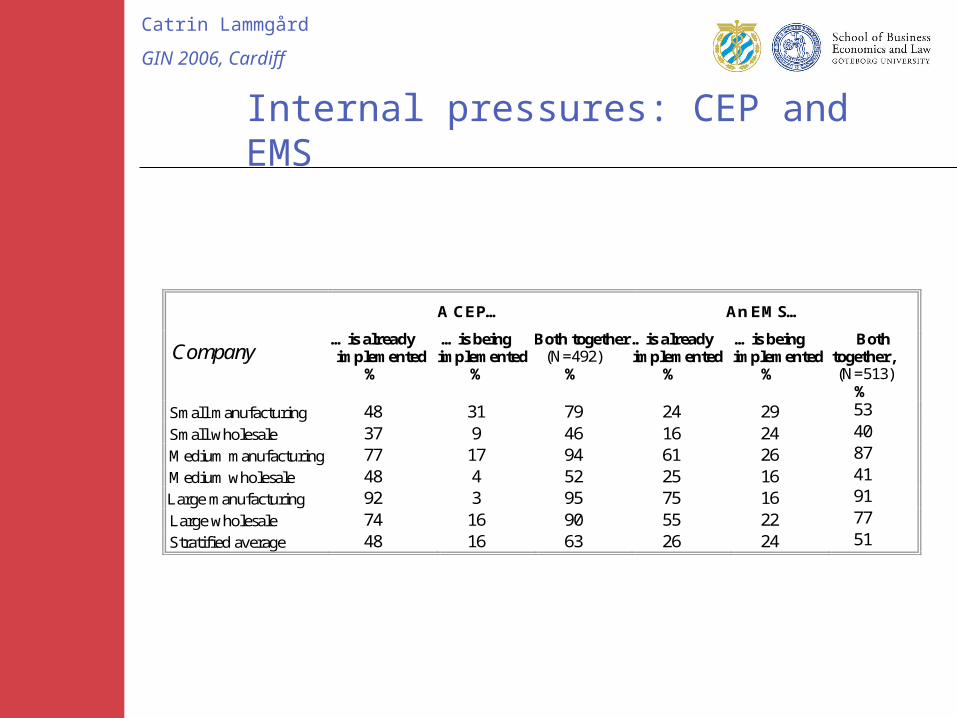
Internal pressures: CEP and EMS
A CEP… An EMS…
Company …is already
implemented %
…is being implemented
%
Both together (N=492)
%
…is already implemented
%
…is being implemented
%
Both together, (N=513)
% Small manufacturing 48 31 79 24 29 53
Small wholesale 37 9 46 16 24 40
Medium manufacturing 77 17 94 61 26 87
Medium wholesale 48 4 52 25 16 41
L Large manufacturing 92 3 95 75 16 91
Large wholesale 74 16 90 55 22 77
Stratified average 48 16 63 26 24 51
Catrin Lammgård
GIN 2006, Cardiff
Environmental policy
Some examples:
-90-95% of the largest companies along & the middle-sized manufacturing companies have introduced or are in the process of introducing an environmental policy.
-Less than half of the small- and middle-sized wholesale companies have and environmental policy
-About half of the smaller manufacturing companies has one, but many more are in the process of introducing one (another 30%)
Catrin Lammgård
GIN 2006, Cardiff
Environmental Mangement Systems (EMS)
Some exemples:
-ISO14001 is the most common
-87-91% of the large and middle-sized manufacturing companies have / or in the process of introducing one: a lower share for the large wholesale companies (77%)
-About 40% of the small and middle-sized whollsale companies have one / or in the process of introducing one
-About half of the small manufacturing companies (53%) have one/ or in the process of introducing one
Catrin Lammgård
GIN 2006, Cardiff
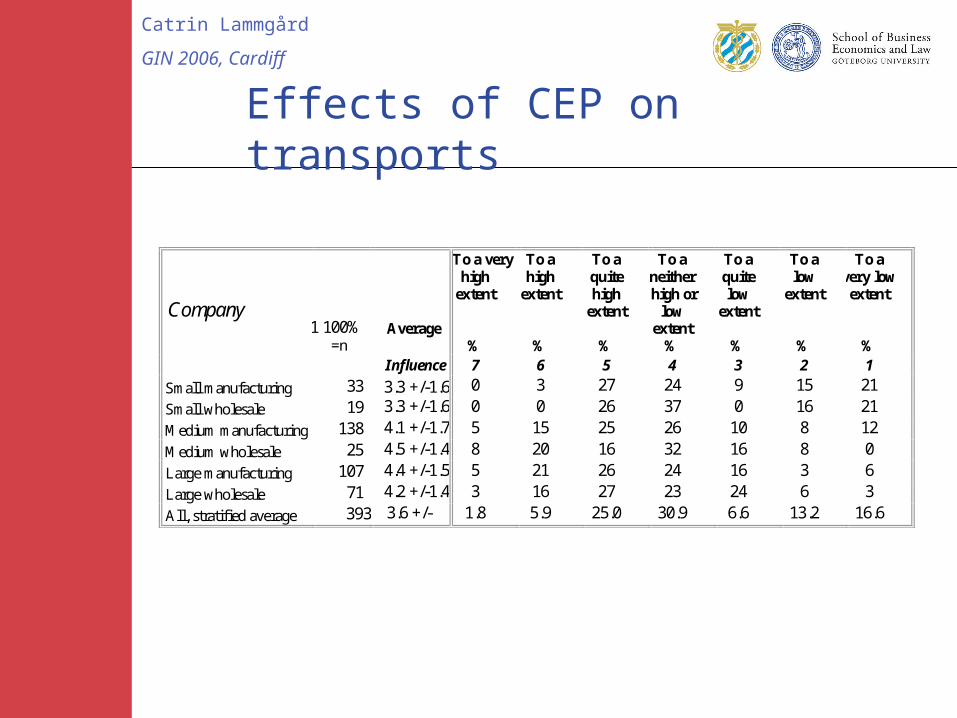
Effects of CEP on transports
Company 1 100% =n
Average
To a very high
extent
%
To a high
extent
%
To a quite high
extent
%
To a neither high or
low extent
%
To a quite low
extent
%
To a low
extent
%
To a very low
extent
%
Influence 7 6 5 4 3 2 1 Small manufacturing 33 3.3 +/-1.6 0 3 27 24 9 15 21 Small wholesale 19 3.3 +/-1.6 0 0 26 37 0 16 21 Medium manufacturing 138 4.1 +/-1.7 5 15 25 26 10 8 12 Medium wholesale 25 4.5 +/-1.4 8 20 16 32 16 8 0 Large manufacturing 107 4.4 +/-1.5 5 21 26 24 16 3 6 Large wholesale 71 4.2 +/-1.4 3 16 27 23 24 6 3 All, stratified average 393 3.6 +/- 1.8 5.9 25.0 30.9 6.6 13.2 16.6
Catrin Lammgård
GIN 2006, Cardiff
Importance and possibilities to implement measures
1) to rank the importance of different items related to different measures to diminish the environmental impact of the goods transports
2) to rank the possibilities of implementation of the different items related to these measures
On a seven-degree semantic differential scale (1-7) where:
1 = very low importance / possibilities for implementation and
7= equalled very high importance / possibilities for implementation
Catrin Lammgård
GIN 2006, Cardiff
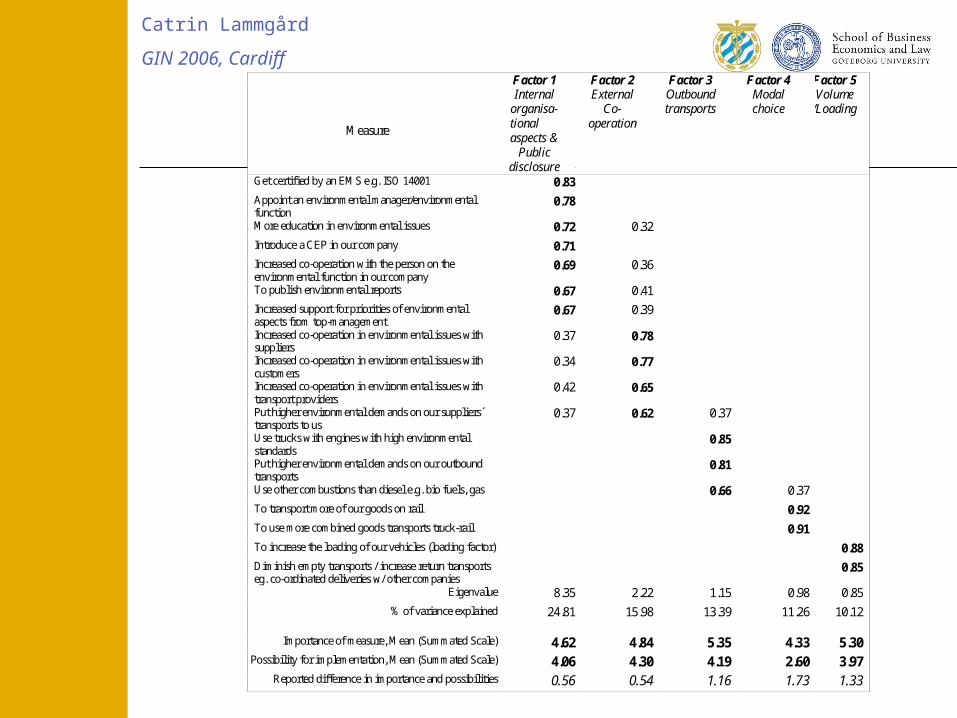
Factor 1 Factor 2 Factor 3 Factor 4 Factor 5
Measure
Internal organisa- tional aspects &
Public disclosure
External Co-
operation
Outbound transports
Modal choice
Volume /Loading
Get certified by an EMS e.g. ISO 14001 0.83
Appoint an environmental manager/environmental function
0.78
More education in environmental issues 0.72 0.32
Introduce a CEP in our company 0.71
Increased co-operation with the person on the environmental function in our company
0.69 0.36
To publish environmental reports 0.67 0.41
Increased support for priorities of environmental aspects from top-management
0.67 0.39
Increased co-operation in environmental issues with suppliers
0.37 0.78
Increased co-operation in environmental issues with customers
0.34 0.77
Increased co-operation in environmental issues with transport providers
0.42 0.65
Put higher environmental demands on our suppliers´ transports to us
0.37 0.62 0.37
Use trucks with engines with high environmental standards
0.85
Put higher environmental demands on our outbound transports
0.81
Use other combustions than diesel e.g. bio fuels, gas 0.66 0.37
To transport more of our goods on rail 0.92
To use more combined goods transports truck-rail 0.91
To increase the loading of our vehicles (loading factor) 0.88
Diminish empty transports / increase return transports eg. co-ordinated deliveries w/ other companies
0.85
Eigenvalue 8.35 2.22 1.15 0.98 0.85
% of variance explained 24.81 15.98 13.39 11.26 10.12
Importance of measure, Mean (Summated Scale) 4.62 4.84 5.35 4.33 5.30 Possibility for implementation, Mean (Summated Scale) 4.06 4.30 4.19 2.60 3.97
Reported difference in importance and possibilities 0.56 0.54 1.16 1.73 1.33
Catrin Lammgård
GIN 2006, Cardiff
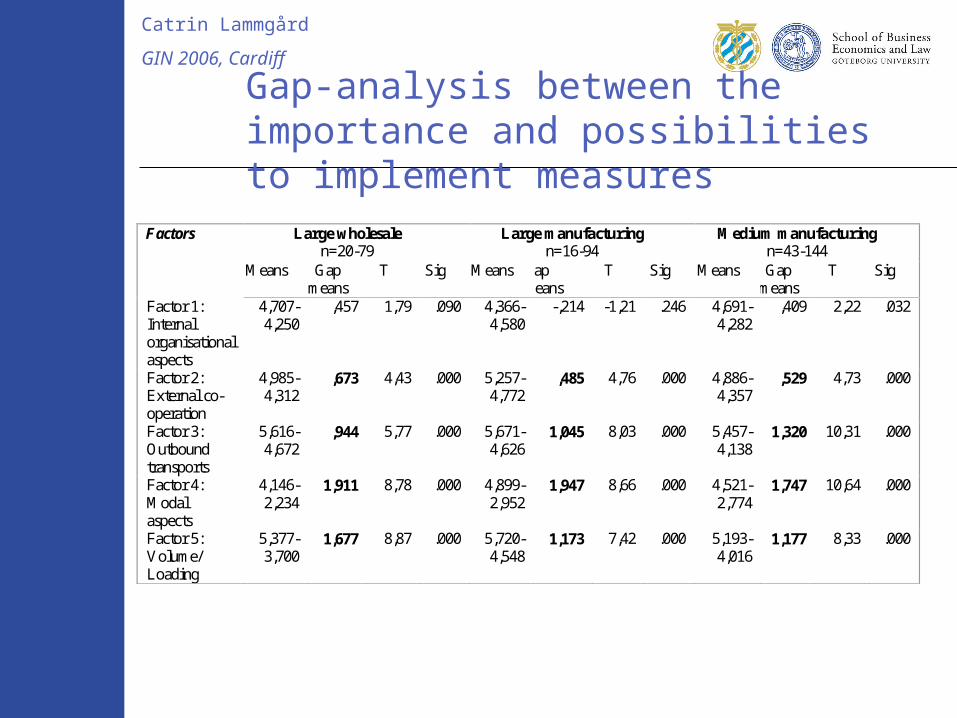
Gap-analysis between the importance and possibilities to implement measures
Large wholesale n=20-79
Large manufacturing n=16-94
Medium manufacturing n=43-144
Factors
Means Gap means
T Sig Means Gap means
T Sig Means Gap means
T Sig
Factor 1: Internal organisational aspects
4,707- 4,250
,457
1,79
.090 4,366- 4,580
-,214
-1,21
.246 4,691- 4,282
,409
2,22
.032
Factor 2: External co-operation
4,985- 4,312
,673
4,43
.000 5,257- 4,772
,485
4,76
.000 4,886- 4,357
,529
4,73
.000
Factor 3: Outbound transports
5,616- 4,672
,944
5,77
.000 5,671- 4,626
1,045
8,03
.000 5,457- 4,138
1,320
10,31
.000
Factor 4: Modal aspects
4,146- 2,234
1,911
8,78
.000 4,899- 2,952
1,947
8,66
.000 4,521- 2,774
1,747
10,64
.000
Factor 5: Volume/ Loading
5,377- 3,700
1,677 8,87 .000 5,720- 4,548
1,173 7,42 .000 5,193- 4,016
1,177 8,33 .000
Catrin Lammgård
GIN 2006, Cardiff
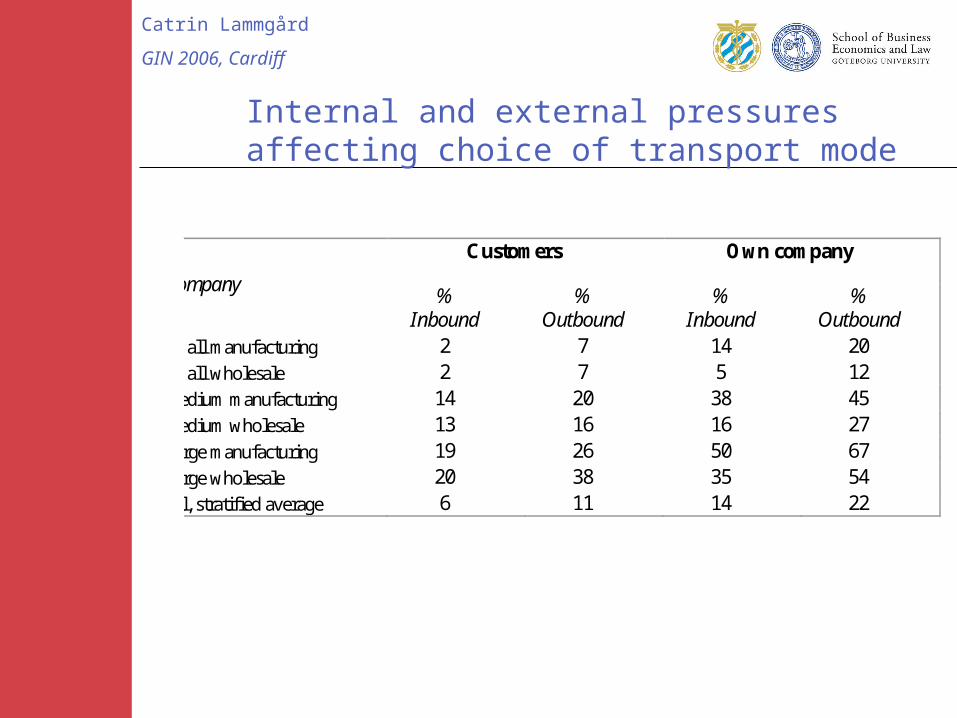
Internal and external pressures affecting choice of transport mode
Customers Own company
Company %
Inbound %
Outbound %
Inbound %
Outbound Small manufacturing 2 7 14 20 Small wholesale 2 7 5 12 Medium manufacturing 14 20 38 45 Medium wholesale 13 16 16 27 Large manufacturing 19 26 50 67 Large wholesale 20 38 35 54 All, stratified average 6 11 14 22
Catrin Lammgård
GIN 2006, Cardiff
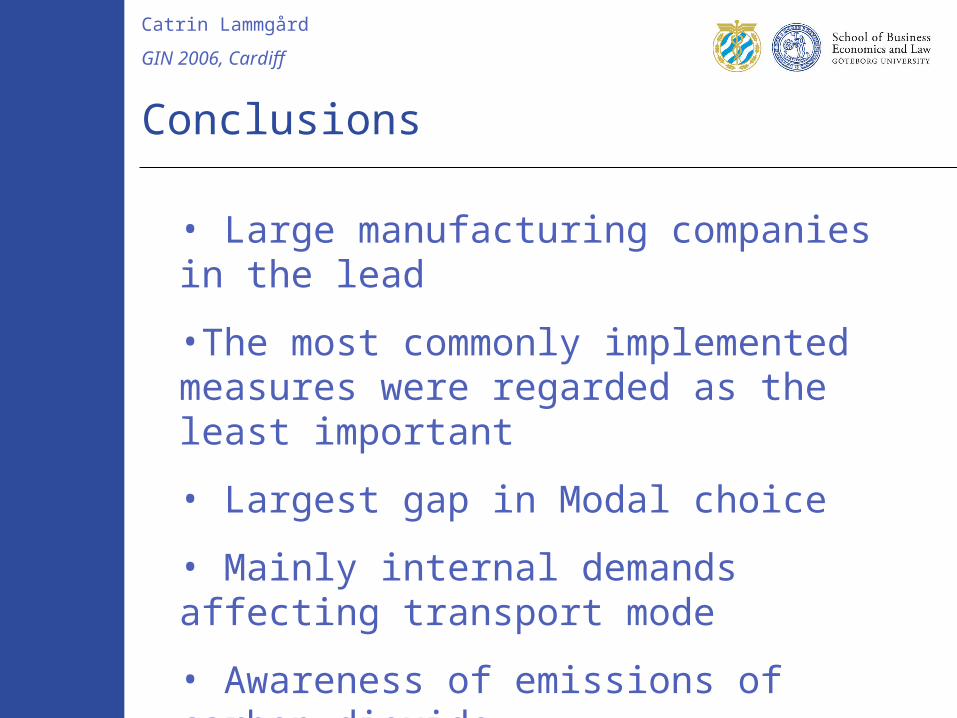
Conclusions
• Large manufacturing companies in the lead
•The most commonly implemented measures were regarded as the least important
• Largest gap in Modal choice
• Mainly internal demands affecting transport mode
• Awareness of emissions of carbon dioxide
Catrin Lammgård
GIN 2006, Cardiff
Banerjee, Subhabrata Bobby, Easwar S Iyer, and Rajiv K Kashyap (2003), "Corporate environmentalism: antecedents and influence of industry type," Journal of Marketing, 67 (April).
Freeman, R Edward (1984), Strategic management: a stakeholder approach. Boston; London: Pitman.
Hibbitt, Chris and Nancy Kamp-Roelands (2002), "Europe´s (mild) greening of corporate environmental management," Corporate Environmental Strategy, 9 (2).
Morrow, David and Dennis Rondinelli (2002), "Adopting Corporate Environmental Management Systems:: Motivations and Results of ISO 14001 and EMAS Certification," European Management Journal, 20 (2), 159-71.
Wu, Haw-Jan and Steven C. Dunn (1995), "Environmentally responsible logistics systems," International Journal of Physical Distribution & Logistics Management, 25 (2), 20-38.
Young, Alex and Aleksandra Kielkiewicz-Young (2001), "Sustainable Supply Network Management," Corporate Environmental Strategy, 8 (3).
References
Catrin Lammgård
GIN 2006, Cardiff
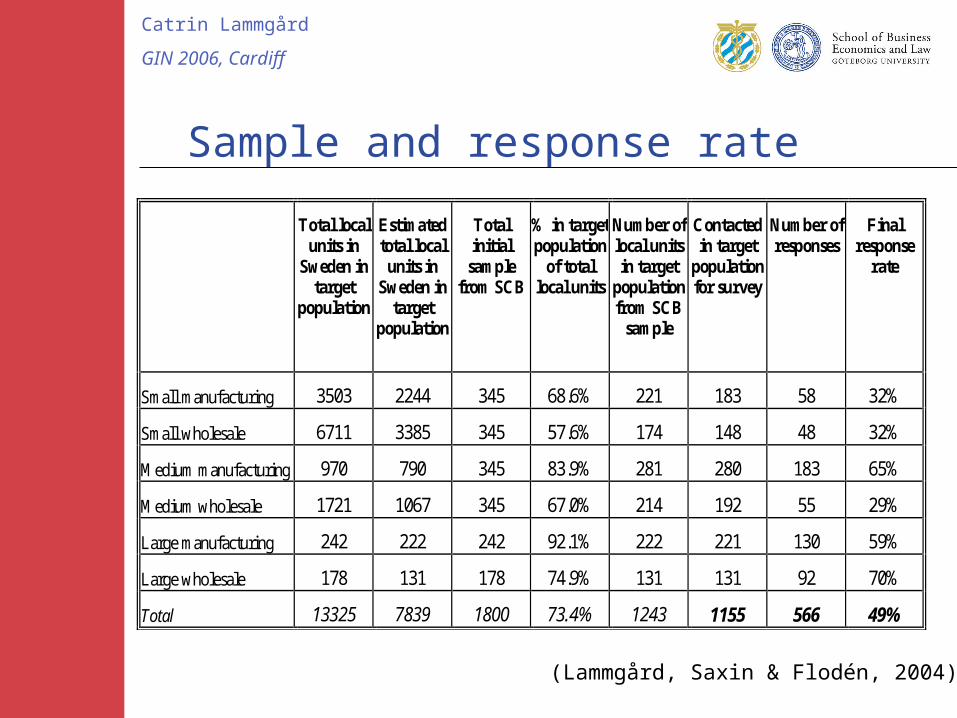
Sample and response rate
Total local units in
Sweden in target
population
Estimated total local
units in Sweden in
target population
Total initial
sample from SCB
% in target population
of total local units
Number of local units in target
population from SCB
sample
Contacted in target
population for survey
Number of responses
Final response
rate
Small manufacturing 3503 2244 345 68.6% 221 183 58 32%
Small wholesale 6711 3385 345 57.6% 174 148 48 32%
Medium manufacturing 970 790 345 83.9% 281 280 183 65%
Medium wholesale 1721 1067 345 67.0% 214 192 55 29%
Large manufacturing 242 222 242 92.1% 222 221 130 59%
Large wholesale 178 131 178 74.9% 131 131 92 70%
Total 13325 7839 1800 73.4% 1243 1155 566 49%
(Lammgård, Saxin & Flodén, 2004)