Embed Size (px)
Citation preview

This artwork was created using Nielsen data.
Copyright © 2018 The Nielsen Company (US), LLC. Confidential and proprietary. Do not distribute.
Understanding what is driving trends in the category
CATEGORY TRENDS:VITAMINS, MINERALS AND SUPPLEMENTS
July 2019

2Cop
yri
gh
t ©
20
18
Th
e N
iels
en
Com
pa
ny (
US
), L
LC
. C
on
fid
en
tia
l a
nd
pro
pri
eta
ry. D
o n
ot d
istr
ibu
te.
OVER 70% OF CONSUMERS ARE TAKING
THEIR VITAMINS
Source: Nielsen two week online survey (April 2017) of 1113 respondents - US
Vitamins/
Minerals
% of respondents that use
Herbal
SupplementsPain Relief
Medications
85% 67%83%

3Cop
yri
gh
t ©
20
18
Th
e N
iels
en
Com
pa
ny (
US
), L
LC
. C
on
fid
en
tia
l a
nd
pro
pri
eta
ry. D
o n
ot d
istr
ibu
te.
HEALTH IN A BOTTLE% who use supplements or vitamins for specified reason
Source: Nielsen two week online survey (April 2017) of 1113 respondents - US
55% to complement their diet
as a way to prevent health concerns57%
to treat an ailment46%

4Cop
yri
gh
t ©
20
18
Th
e N
iels
en
Com
pa
ny (
US
), L
LC
. C
on
fid
en
tia
l a
nd
pro
pri
eta
ry. D
o n
ot d
istr
ibu
te.
‘NATURAL’ TREND IS TRANSLATING TO
SUPPLEMENTS AS WELL
Source: Nielsen two week online survey (April 2017) of 1113 respondents - US
Rather than
prescription drugs
Rather than over-the-
counter medications
PREFER TO USE NATURAL HEALTH SUPPLEMENTS
46% 46%

5Cop
yri
gh
t ©
20
18
Th
e N
iels
en
Com
pa
ny (
US
), L
LC
. C
on
fid
en
tia
l a
nd
pro
pri
eta
ry. D
o n
ot d
istr
ibu
te.
OVER 60% OF CONSUMERS MAKE THEIR
OWN DECISIONS ON SUPPLEMENTS
Source: Nielsen two week online survey (April 2017) of 1113 respondents - US
41%
Prefer to use
home remedies
over products
purchased at the
store
40%
Check with
healthcare
provider before
using herbal
supplements
42%
Only take over-
the-counter
medications
when
recommended by
healthcare
provider
63%
Prefer to make
their own
decisions
regarding health
supplements

6Cop
yri
gh
t ©
20
18
Th
e N
iels
en
Com
pa
ny (
US
), L
LC
. C
on
fid
en
tia
l a
nd
pro
pri
eta
ry. D
o n
ot d
istr
ibu
te.
Cop
yri
gh
t ©
20
18
Th
e N
iels
en
Com
pa
ny (
US
), L
LC
. C
on
fid
en
tia
l a
nd
pro
pri
eta
ry. D
o n
ot d
istr
ibu
te.
6
So what does that
mean for the
Vitamins/Minerals/
Supplements
category?
7Cop
yri
gh
t ©
20
18
Th
e N
iels
en
Com
pa
ny (
US
), L
LC
. C
on
fid
en
tia
l a
nd
pro
pri
eta
ry. D
o n
ot d
istr
ibu
te.
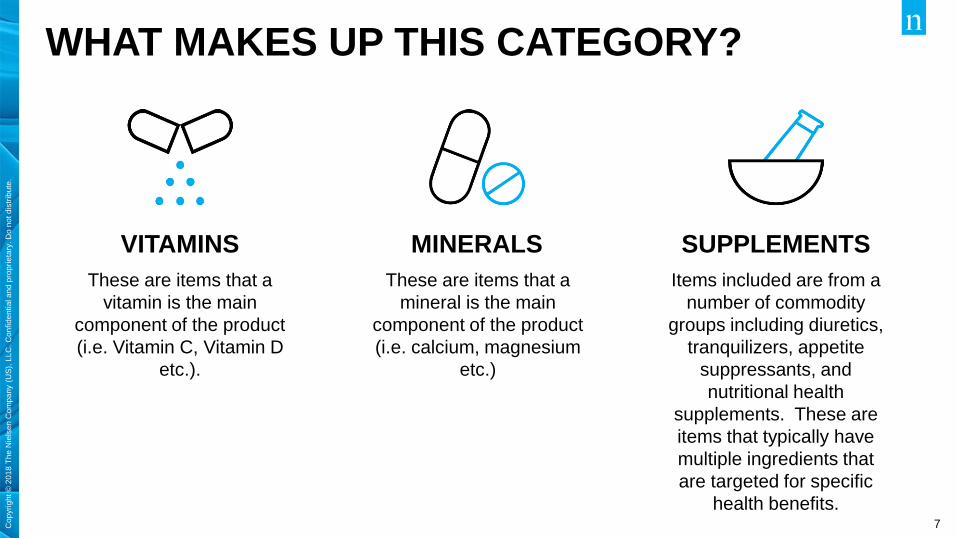
WHAT MAKES UP THIS CATEGORY?
SUPPLEMENTS
Items included are from a
number of commodity
groups including diuretics,
tranquilizers, appetite
suppressants, and
nutritional health
supplements. These are
items that typically have
multiple ingredients that
are targeted for specific
health benefits.
MINERALS
These are items that a
mineral is the main
component of the product
(i.e. calcium, magnesium
etc.)
VITAMINS
These are items that a
vitamin is the main
component of the product
(i.e. Vitamin C, Vitamin D
etc.).

8Cop
yri
gh
t ©
20
18
Th
e N
iels
en
Com
pa
ny (
US
), L
LC
. C
on
fid
en
tia
l a
nd
pro
pri
eta
ry. D
o n
ot d
istr
ibu
te.
VITAMINS/MINERALS/SUPPLEMENTS
CONTINUE TO SHOW STRONG GROWTH
Source: Nielsen Retail Measurement Data, Total U.S. xAOC, 5 Years Ending 06/29/19
$7.4B
$7.6B
$7.8B
$8.1B
$8.5B
3.8
2.4
3.94.2
52 Wks 4YA 52 Wks 3YA 52 Wks 2YA 52 Wks YA Latest 52 Wks
$ Sales $ % Chg
AVERAGE
RETAIL PRICE
AVERAGE
NUMBER OF ITEMS
Recent 52 Weeks: $9.96
52 Weeks 4YA: $9.12
4 Year Change: +$0.84
Recent 52 Weeks: 271
52 Weeks 4YA: 243
4 Year Change: +28
VITAMINS/MINERALS/SUPPLEMENTS 5 YEAR TREND

9Cop
yri
gh
t ©
20
18
Th
e N
iels
en
Com
pa
ny (
US
), L
LC
. C
on
fid
en
tia
l a
nd
pro
pri
eta
ry. D
o n
ot d
istr
ibu
te.
GROWTH AND CONSUMER INTEREST IS
FOUND ACROSS THE UNITED STATES
Source: Nielsen Retail Measurement Services Data & Homescan Panel Data, Total U.S. xAOC, Calendar Year 2018 vs. Calendar Year 2017
Top Sales Ratio
to Total Store
Top $ Growth
Markets
NEW YORK
1.3% of Sales
120 Index
MIAMI
1.2% of Sales
115 IndexHOUSTON
1.2% of Sales
113 Index
SLC/BOISE
+7.4% Growth
ATLANTA
+7.7% Growth
NASHVILLE
+6.7% Growth
PHOENIX
+6.1% GrowthDALLAS
+5.8% Growth
Grocery22%
Mass + Supers
27%
Warehouse Club21%
Drug Stores16%
Health Food3%
Online7%
All Other4%
CATEGORY SALES BY CHANNEL

10Cop
yri
gh
t ©
20
18
Th
e N
iels
en
Com
pa
ny (
US
), L
LC
. C
on
fid
en
tia
l a
nd
pro
pri
eta
ry. D
o n
ot d
istr
ibu
te.
SHOPPERS ARE ACCLIMATING TO
THE EASE OF ONLINE PURCHASING
Source: Nielsen Consumer Confidence Survey Q2 2017
1 in 4 Americans said that they are
more likely to purchase
Medicine & Health Care
products online than in-store
38%
26% 24%21% 20%
15% 14%
11Cop
yri
gh
t ©
20
18
Th
e N
iels
en
Com
pa
ny (
US
), L
LC
. C
on
fid
en
tia
l a
nd
pro
pri
eta
ry. D
o n
ot d
istr
ibu
te.
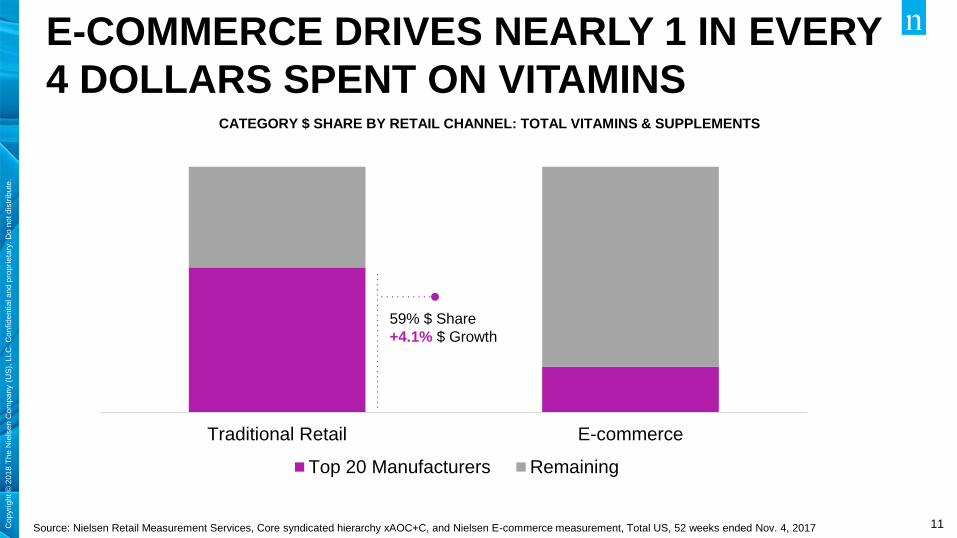
E-COMMERCE DRIVES NEARLY 1 IN EVERY
4 DOLLARS SPENT ON VITAMINS
Source: Nielsen Retail Measurement Services, Core syndicated hierarchy xAOC+C, and Nielsen E-commerce measurement, Total US, 52 weeks ended Nov. 4, 2017
CATEGORY $ SHARE BY RETAIL CHANNEL: TOTAL VITAMINS & SUPPLEMENTS
Traditional Retail E-commerce
Top 20 Manufacturers Remaining
59% $ Share
+4.1% $ Growth

12Cop
yri
gh
t ©
20
18
Th
e N
iels
en
Com
pa
ny (
US
), L
LC
. C
on
fid
en
tia
l a
nd
pro
pri
eta
ry. D
o n
ot d
istr
ibu
te.
CONSUMERS LOOK TO AMAZON FOR
VITAMIN PURCHASES ACROSS CATEGORY
Source: Nielsen Amazon Top Movers Report, June 2019
PreserVision
AREDS2
Supplement,120 ct
1. 2. 3. 4. 5.
6. 7. 8. 9. 10.
NatureWise
Vitamin D3 5,000 IU,
360 ct
Sports Research
Biotin 5,000mcg and
10,000 mcg, 120 ct
SmartyPants
Kids Complete Daily
Gummy Vitamins,
120 ct
Vitafusion
Women's Gummy
Vitamins, 150 ct
Jarrow Formulas
Methylcobalamin
(Methyl B12), 60 ct
SugarBearHair
Vitamins, 60 ct
Vitafusion
MultiVites Gummy
Vitamins, 150ct
Nature Made
Vitamin D3 5,000 IU,
180 ct
SmartyPants
Prenatal Complete
Daily Gummy
Vitamins, 180 ct
AMAZON TOP MOVERS IN THE VITAMINS CATEGORY

13Cop
yri
gh
t ©
20
18
Th
e N
iels
en
Com
pa
ny (
US
), L
LC
. C
on
fid
en
tia
l a
nd
pro
pri
eta
ry. D
o n
ot d
istr
ibu
te.
THE MULTIVITAMIN/SUPPLEMENT “PACK”
PERFECT FOR EACH INDIVIDUALA personalized vitamin regimen
allows you to specify what kinds
of nutrients you need based on
age, lifestyle, and medical history.
So instead of purchasing a
generic, one-size-fits-all vitamin
you only you get the nutrients
your body actually needs.

14Cop
yri
gh
t ©
20
18
Th
e N
iels
en
Com
pa
ny (
US
), L
LC
. C
on
fid
en
tia
l a
nd
pro
pri
eta
ry. D
o n
ot d
istr
ibu
te.
TRANSPARENCY WAVE EXPANDS PAST FOOD
AND BEVERAGE
Source: Nielsen Retail Measurement Services, Health and Wellness Characteristics, Total U.S. xAOC, Calendar Year 2018 vs. 2017
VITAMINS
MINERALS
SUPPLEMENTS
% OF SALES AND DOLLAR GROWTH FOR PRODUCTS WITH THESE CRITERIA COMPARED TO YAGO
No Artificial
Colors or Flavors
24% of Sales, +6.1%
Probiotic
11% of Sales, +0.7%
Natural
10% of Sales, +17.5%
GMO Free
8% of Sales, +31.7%
Organic
3% of Sales, +29.2%
Antioxidants
1% of Sales, +9.3%

15Cop
yri
gh
t ©
20
18
Th
e N
iels
en
Com
pa
ny (
US
), L
LC
. C
on
fid
en
tia
l a
nd
pro
pri
eta
ry. D
o n
ot d
istr
ibu
te.
TRADITIONAL MEDICINAL INGREDIENTS
GROWING IN VITAMINS/SUPPLEMENTSDOLLAR GROWTH FOR INGREDIENTS IN VITAMINS AND SUPPLEMENTS
Source: Nielsen Product Insider, powered by Label Insight, Total US xAOC, 52 weeks ending 12/30/2017
VITAMINS &
SUPPLEMENTS COLLAGEN GINGER TUMERICTOTAL
VMS
+5.3% +5.5%
GINKGO
+23.7%+12.5% +16.9%

This artwork was created using Nielsen data.
Copyright © 2018 The Nielsen Company (US), LLC. Confidential and proprietary. Do not distribute.
VITAMINS

17Cop
yri
gh
t ©
20
18
Th
e N
iels
en
Com
pa
ny (
US
), L
LC
. C
on
fid
en
tia
l a
nd
pro
pri
eta
ry. D
o n
ot d
istr
ibu
te.
VITAMIN GROWTH AMONGST AMERICANSVitamin Category
65.6
12.2 9.9 9.0 3.3
MULTIVITAMIN VITAMIN B VITAMIN D VITAMIN C ALL OTHER
Share of Top Sub-Categories
Category $ % Chg Vs YAG Unit % Chg vs YAG
Vitamins +2.4 (0.2) MULTIVITAMIN
+1.1% +4.1%
VITAMIN B
VITAMIN C VITAMIN D
+5.3% +8.5
Sub-Category $ % Chg vs. YAG
Source: Nielsen Retail Measurement Data, Total US xAOC Incl Conv, Calendar Year 2018 vs 2017

18Cop
yri
gh
t ©
20
18
Th
e N
iels
en
Com
pa
ny (
US
), L
LC
. C
on
fid
en
tia
l a
nd
pro
pri
eta
ry. D
o n
ot d
istr
ibu
te.
VITAMIN D3 GROWTH OUTPACES OTHER
TOP VITAMIN TYPES IN THE TOTAL US XAOC
Vitamin D3 has seen a 10.9% dollar growth within the latest 52 weeks
• Vitamin C provides $242 million in
$ sales, while growing at a pace of
5.5% vs YAG
• Traditional Vitamins, including C,
D3 and B12 are all outperforming
its counterparts
1.0
5.5
10.9
6.3
(8.9)
(4.7)
1.3
2.3
(2.5)
0.6
MULTIPLE
VITAMIN C
VITAMIN D3
VITAMIN B12
VITAMIN D
BIOTIN
MULTIPLE VITAMIN D
MULTIPLE VITAMIN TYPE
VITAMIN E
B VITAMINS MULTIPLE A C D E
Top 10 Vitamin Types
Source: Nielsen Retail Measurement Data, Total US xAOC Incl Conv, Calendar Year 2018 vs 2017

19Cop
yri
gh
t ©
20
18
Th
e N
iels
en
Com
pa
ny (
US
), L
LC
. C
on
fid
en
tia
l a
nd
pro
pri
eta
ry. D
o n
ot d
istr
ibu
te.
PRIVATE LABEL DOMINATES VITAMIN
SALES WITHIN TOTAL U.S. XAOC
$7.35
$10.17 $10.82 $11.07
$8.21
PRIVATELABEL
NATUREMADE
CENTRUM ONE ADAY
NATURE'SBOUNTY
$457,274,443 Sold TY
+1.7% Chg vs YAG
$789,016,351 Sold TY
+5.9% Chg vs YAG
$266,705,898 Sold TY
(1.7%) Chg vs YAG
$254,812,747 Sold TY
(2.0%) Chg vs YAG
$202,326,776 Sold TY
(0.9%) Chg vs YAG
Top 5 Brands Average Unit Price
Source: Nielsen Retail Measurement Data, Total US xAOC Incl Conv, Calendar Year 2018 vs 2017

20Cop
yri
gh
t ©
20
18
Th
e N
iels
en
Com
pa
ny (
US
), L
LC
. C
on
fid
en
tia
l a
nd
pro
pri
eta
ry. D
o n
ot d
istr
ibu
te.
SUPERCENTERS HAVE LARGEST
VITAMINS SHARE OF WALLETSupercenters, online and club stealing vitamins share from grocery and drug
Source: Nielsen Homescan Panel Data CY 2018, Nielsen Syndicated Hierarchy

21Cop
yri
gh
t ©
20
18
Th
e N
iels
en
Com
pa
ny (
US
), L
LC
. C
on
fid
en
tia
l a
nd
pro
pri
eta
ry. D
o n
ot d
istr
ibu
te.
VITAMINS REACH LARGE PORTION OF HH
Source: Nielsen Homescan Panel Data CY 2018, Nielsen Syndicated Hierarchy
Vitamin buying households are more likely to be high-earning, empty nest, and senior couples who
reside in the suburbs
Vitamin Buyers spent $11.46 per trip
on Vitamins in 2018, up 1.8% from 2017
6 out of 10 American Households
Bought Vitamins in 2018 Demographic $ / Index
Senior Couples 155
Empty Nest Couples 126
Household Size Two Members 119
HH Income $100,000+ 117
Affluent Suburb Spreads 112

22Cop
yri
gh
t ©
20
18
Th
e N
iels
en
Com
pa
ny (
US
), L
LC
. C
on
fid
en
tia
l a
nd
pro
pri
eta
ry. D
o n
ot d
istr
ibu
te.
VITAMINS BUYERS MEDIA PREFERENCES
Spectra Data, June 2019 Targeting National Behaviors Report
Vitamin buyers are more likely than the average consumer to consume the following:
Cable TV
MagazineInternet
Lifestyle Leisure, Travel, and Organizations Channels & Programming
Frequently Visited Websites Subscriptions

This artwork was created using Nielsen data.
Copyright © 2018 The Nielsen Company (US), LLC. Confidential and proprietary. Do not distribute.
MINERALS
24Cop
yri
gh
t ©
20
18
Th
e N
iels
en
Com
pa
ny (
US
), L
LC
. C
on
fid
en
tia
l a
nd
pro
pri
eta
ry. D
o n
ot d
istr
ibu
te.
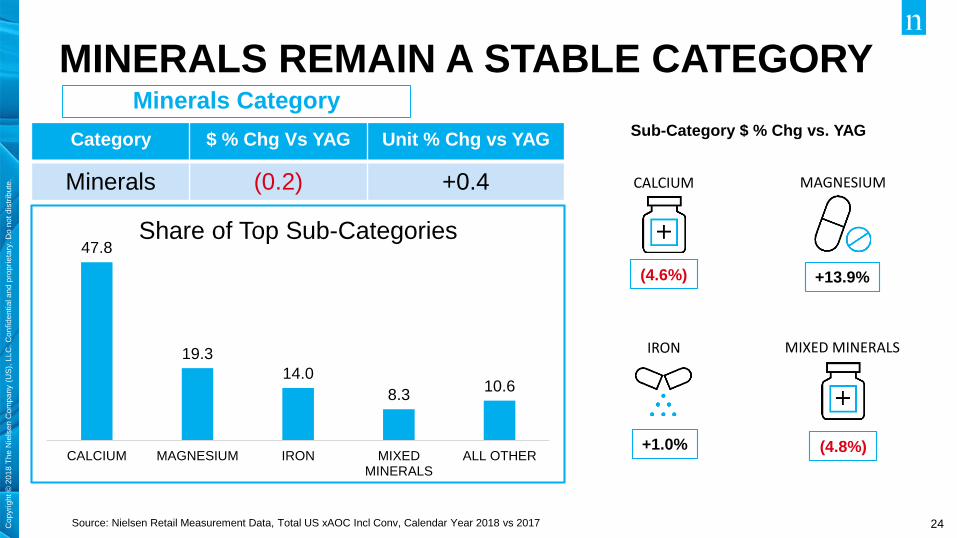
MINERALS REMAIN A STABLE CATEGORYMinerals Category
47.8
19.3
14.0
8.3 10.6
CALCIUM MAGNESIUM IRON MIXEDMINERALS
ALL OTHER
Share of Top Sub-Categories
Category $ % Chg Vs YAG Unit % Chg vs YAG
Minerals (0.2) +0.4 CALCIUM
(4.6%) +13.9%
MAGNESIUM
IRON MIXED MINERALS
+1.0% (4.8%)
Sub-Category $ % Chg vs. YAG
Source: Nielsen Retail Measurement Data, Total US xAOC Incl Conv, Calendar Year 2018 vs 2017

25Cop
yri
gh
t ©
20
18
Th
e N
iels
en
Com
pa
ny (
US
), L
LC
. C
on
fid
en
tia
l a
nd
pro
pri
eta
ry. D
o n
ot d
istr
ibu
te.
MAGNESIUM HEAVILY CONTRIBUTES TO
MINERAL CATEGORY GROWTH IN 2018
Magnesium sold $86.1 million in $ sales while growing 11.7% versus year ago
• Magnesium Citrate is on the rise in
popularity among U.S. consumers
• Magnesium citrate has grown
31.7% in the last year and sold
$11.7 million in sales
Source: Nielsen Retail Measurement Data, Total US xAOC Incl Conv, Calendar Year 2018 vs 2017
(4.9)
11.7
4.3
(2.6)
4.1
2.1
10.9
31.7
(18.8)
(17.8)
CALCIUM
MAGNESIUM
IRON
CALCIUM CITRATE
CALCIUM MAGNESIUM ZINC
ZINC
POTASSIUM
MAGNESIUM CITRATE
FERROUS SULFATE IRON
CALCIUM MINERAL
Top 10 Mineral Types

26Cop
yri
gh
t ©
20
18
Th
e N
iels
en
Com
pa
ny (
US
), L
LC
. C
on
fid
en
tia
l a
nd
pro
pri
eta
ry. D
o n
ot d
istr
ibu
te.
PRIVATE LABEL OUTPERFORMS IN $
SALES WITHIN THE MINERAL CATEGORY
$7.02 $6.70
$13.11
$10.62
$5.69
PRIVATELABEL
NATUREMADE
CALTRATE CITRACAL NATURE'SBOUNTY
Top 5 Brands Average Unit Price
$197,715,049 Sold TY
+2.2% Chg vs YAG
$94,094,755 Sold TY
+0.7% Chg vs YAG
$42,957,007 Sold TY
(16.3%) Chg vs YAG
$41,650,685 Sold TY
(2.3%) Chg vs YAG
$40,827,692 Sold TY
+6.1% Chg vs YAG
Source: Nielsen Retail Measurement Data, Total US xAOC Incl Conv, Calendar Year 2018 vs 2017

27Cop
yri
gh
t ©
20
18
Th
e N
iels
en
Com
pa
ny (
US
), L
LC
. C
on
fid
en
tia
l a
nd
pro
pri
eta
ry. D
o n
ot d
istr
ibu
te.
SUPERCENTERS, GROCERY, AND DRUG
HAVE HIGHEST MINERAL SHAREGrocery, club, and online gaining share from supercenters, drug, and health
Source: Nielsen Homescan Panel Data CY 2018, Nielsen Syndicated Hierarchy

28Cop
yri
gh
t ©
20
18
Th
e N
iels
en
Com
pa
ny (
US
), L
LC
. C
on
fid
en
tia
l a
nd
pro
pri
eta
ry. D
o n
ot d
istr
ibu
te.
MINERALS REACH LESS HH, HAVE LESS
SPEND PER TRIP
Source: Nielsen Homescan Panel Data CY 2018, Nielsen Syndicated Hierarchy
Senior, empty nest couples with no children are more likely to purchase minerals than the average
consumer
Minerals Buyers spent $9.40 per trip on
Vitamins in 2018, down .05% from 2017
2 out of 10 American Households
Bought Minerals in 2018Demographic $ / Index
Senior Couples 229
Empty Nest Couples 138
Household Size Two Members 137
No Children 122
Comfortable Country Living 112

29Cop
yri
gh
t ©
20
18
Th
e N
iels
en
Com
pa
ny (
US
), L
LC
. C
on
fid
en
tia
l a
nd
pro
pri
eta
ry. D
o n
ot d
istr
ibu
te.
MINERAL BUYERS MEDIA PREFERENCES
Spectra Data, June 2019 Targeting National Behaviors Report
Minerals Buyers are more likely than the average consumer to consume the following:
Cable TV
MagazineInternet
Lifestyle Leisure, Travel, and Organizations Channels & Programming
Frequently Visited Websites Subscriptions

This artwork was created using Nielsen data.
Copyright © 2018 The Nielsen Company (US), LLC. Confidential and proprietary. Do not distribute.
SUPPLEMENTS

31Cop
yri
gh
t ©
20
18
Th
e N
iels
en
Com
pa
ny (
US
), L
LC
. C
on
fid
en
tia
l a
nd
pro
pri
eta
ry. D
o n
ot d
istr
ibu
te.
SUPPLEMENT GROWTH OUTPACES
MINERAL AND VITAMIN CATEGORIESSupplement Category
18.5 17.4
12.8 8.4
42.9
DIGESTIVE GENERALHEALTH
HEARTHEALTH
SLEEP AID ALL OTHER
Share of Top Sub-Categories
Category $ % Chg Vs YAG Unit % Chg vs YAG
Supplement +6.3% +5.1% DIGESTIVE
+2.5% +7.5%
GENERAL HEALTH
HEART HEALTH SLEEP AID
(4.8%) +29.6
Sub-Category $ % Chg vs. YAG
Source: Nielsen Retail Measurement Data, Total US xAOC Incl Conv, Calendar Year 2018 vs 2017

32Cop
yri
gh
t ©
20
18
Th
e N
iels
en
Com
pa
ny (
US
), L
LC
. C
on
fid
en
tia
l a
nd
pro
pri
eta
ry. D
o n
ot d
istr
ibu
te.
PROBIOTICS AND MELATONIN LEAD THE
SUPPLEMENT CATEGORY IN $ SALESProbiotics leads in comparison to its mineral type counterparts with $370.2
million in sales in 2018
• Melatonin continues to grow at a
fast pace (+29.4% vs YAG)
• Vitamin Mineral Combo packs,
Nutrition Drink Mix and
Glucosamine Chonroitin all
contribute to the categories growth
1.1
29.4
(9.5)
11.8
8.2
8.0
1.8
(17.4)
(10.4)
4.1
PROBIOTIC
MELATONIN
CO Q10
VITA MIN COMBO
NUTRI DRINK MIX
GLUCO CHOND
IMMUNE SUPPORT
CHONDR GLUCOS
MULTI SUP TYPE
HERB VITAMIN COMBINATION
Top 10 Vitamin Types
Source: Nielsen Retail Measurement Data, Total US xAOC Incl Conv, Calendar Year 2018 vs 2017

33Cop
yri
gh
t ©
20
18
Th
e N
iels
en
Com
pa
ny (
US
), L
LC
. C
on
fid
en
tia
l a
nd
pro
pri
eta
ry. D
o n
ot d
istr
ibu
te.
EMER’GEN-C IS A LOW PRICED SUPPLEMENT
BRAND SHOWING CONTINUED GROWTH
$10.87 $12.22
$7.93
$17.42
$11.24
NATURE'SBOUNTY
NATUREMADE
EMER'GEN-C BAUSCH +LOMB
AIRBORNE
$330,562,760 Sold TY
+0.0% Chg vs YAG
$290,565,108 Sold TY
+1.2% Chg vs YAG
$232,474,033 Sold TY
+15.8% Chg vs YAG
$227,152,598 Sold TY
+10.8% Chg vs YAG
$186,783,150 Sold TY
+12.4% Chg vs YAG
Top 5 Brands Average Unit Price
Source: Nielsen Retail Measurement Data, Total US xAOC Incl Conv, Calendar Year 2018 vs 2017

34Cop
yri
gh
t ©
20
18
Th
e N
iels
en
Com
pa
ny (
US
), L
LC
. C
on
fid
en
tia
l a
nd
pro
pri
eta
ry. D
o n
ot d
istr
ibu
te.
CLUB HAS LARGEST SUPPLEMENTS SHAREGrocery, supercenters, and online gaining from club, drug, and health stores
Source: Nielsen Homescan Panel Data CY 2018, Nielsen Syndicated Hierarchy

35Cop
yri
gh
t ©
20
18
Th
e N
iels
en
Com
pa
ny (
US
), L
LC
. C
on
fid
en
tia
l a
nd
pro
pri
eta
ry. D
o n
ot d
istr
ibu
te.
SUPPLEMENTS HAVE HIGH REACH AND
SPEND PER TRIP
Source: Nielsen Homescan Panel Data CY 2018, Nielsen Syndicated Hierarchy
Supplement buying households are more likely to contain two members, senior couples or singles,
and high earners
Supplement Buyers spent $18.13 per trip on Vitamins in 2018, down
.02% from 2017
6 out of 10 American Households
Bought Supplements in 2018 Demographic $ / Index
Senior Couples 187
Household Size Two Members 129
HH Income $100,000+ 123
Senior Singles 121
Cosmopolitan Centers 113

36Cop
yri
gh
t ©
20
18
Th
e N
iels
en
Com
pa
ny (
US
), L
LC
. C
on
fid
en
tia
l a
nd
pro
pri
eta
ry. D
o n
ot d
istr
ibu
te.
SUPPLEMENT BUYERS MEDIA PREFERENCE
Spectra Data, June 2019 Targeting National Behaviors Report
Supplement buyers are more likely than the average consumer to consume the following:
Cable TV
MagazineInternet
Lifestyle Leisure, Travel, and Organizations Channels & Programming
Frequently Visited Websites Subscriptions

37Cop
yri
gh
t ©
20
18
Th
e N
iels
en
Com
pa
ny (
US
), L
LC
. C
on
fid
en
tia
l a
nd
pro
pri
eta
ry. D
o n
ot d
istr
ibu
te.
IN SUMMARY
Vitamins, Minerals and Supplements continue to grow
across the U.S. Retail landscape with over 70% of
Americans taking them
Wellness Claims and Transparency may have started in
Health Care and moved into the rest of the store but it is
now table stakes across all products in the Health Care
space consumers
While the Vitamins category continues to over-index with
older generations, companies are already working to find
ways to attract younger generations into the category

38
This artwork was created using Nielsen data.
Copyright © 2018 The Nielsen Company (US), LLC. Confidential and proprietary. Do not distribute.
QUESTIONS?

This artwork was created using Nielsen data.
Copyright © 2018 The Nielsen Company (US), LLC. Confidential and proprietary. Do not distribute.